 Deutsch
 English
 Español
 Français
 Italiano
 Nederlands
 Polski
 Português
 Русский
 Türkçe
 Svenska
 Chinese
 Magyar
Dell XPS 13 9300 Core i7 Laptop im Test: Das neue Gehäuse ist spannender als die neue CPU
Mit dem XPS 13 7390 2-in-1 hat Dell im Jahr 2019 den ersten Ice-Lake-Laptop auf den Markt gebracht. In der Zwischenzeit hat das XPS 13 7390 im Muschelschalen-Design Comet-Lake-U-Optionen erhalten, die das neue XPS-13-Convertible gut abrunden. Erst seit kurzem bietet Dell jedoch auch die gleichen Ice-Lake-CPUs innerhalb der Muschelschalen-XPS-13-Reihe an, die in der XPS-13-Convertible-Reihe schon seit letztem Jahr zum Einsatz kommen.
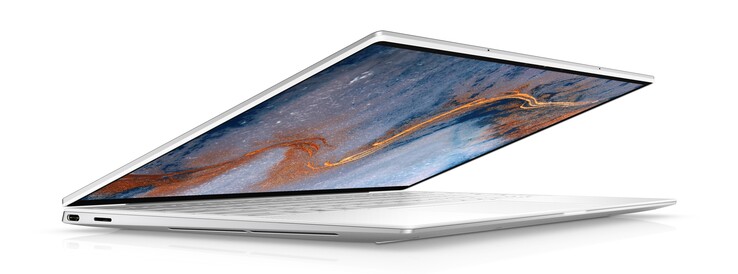
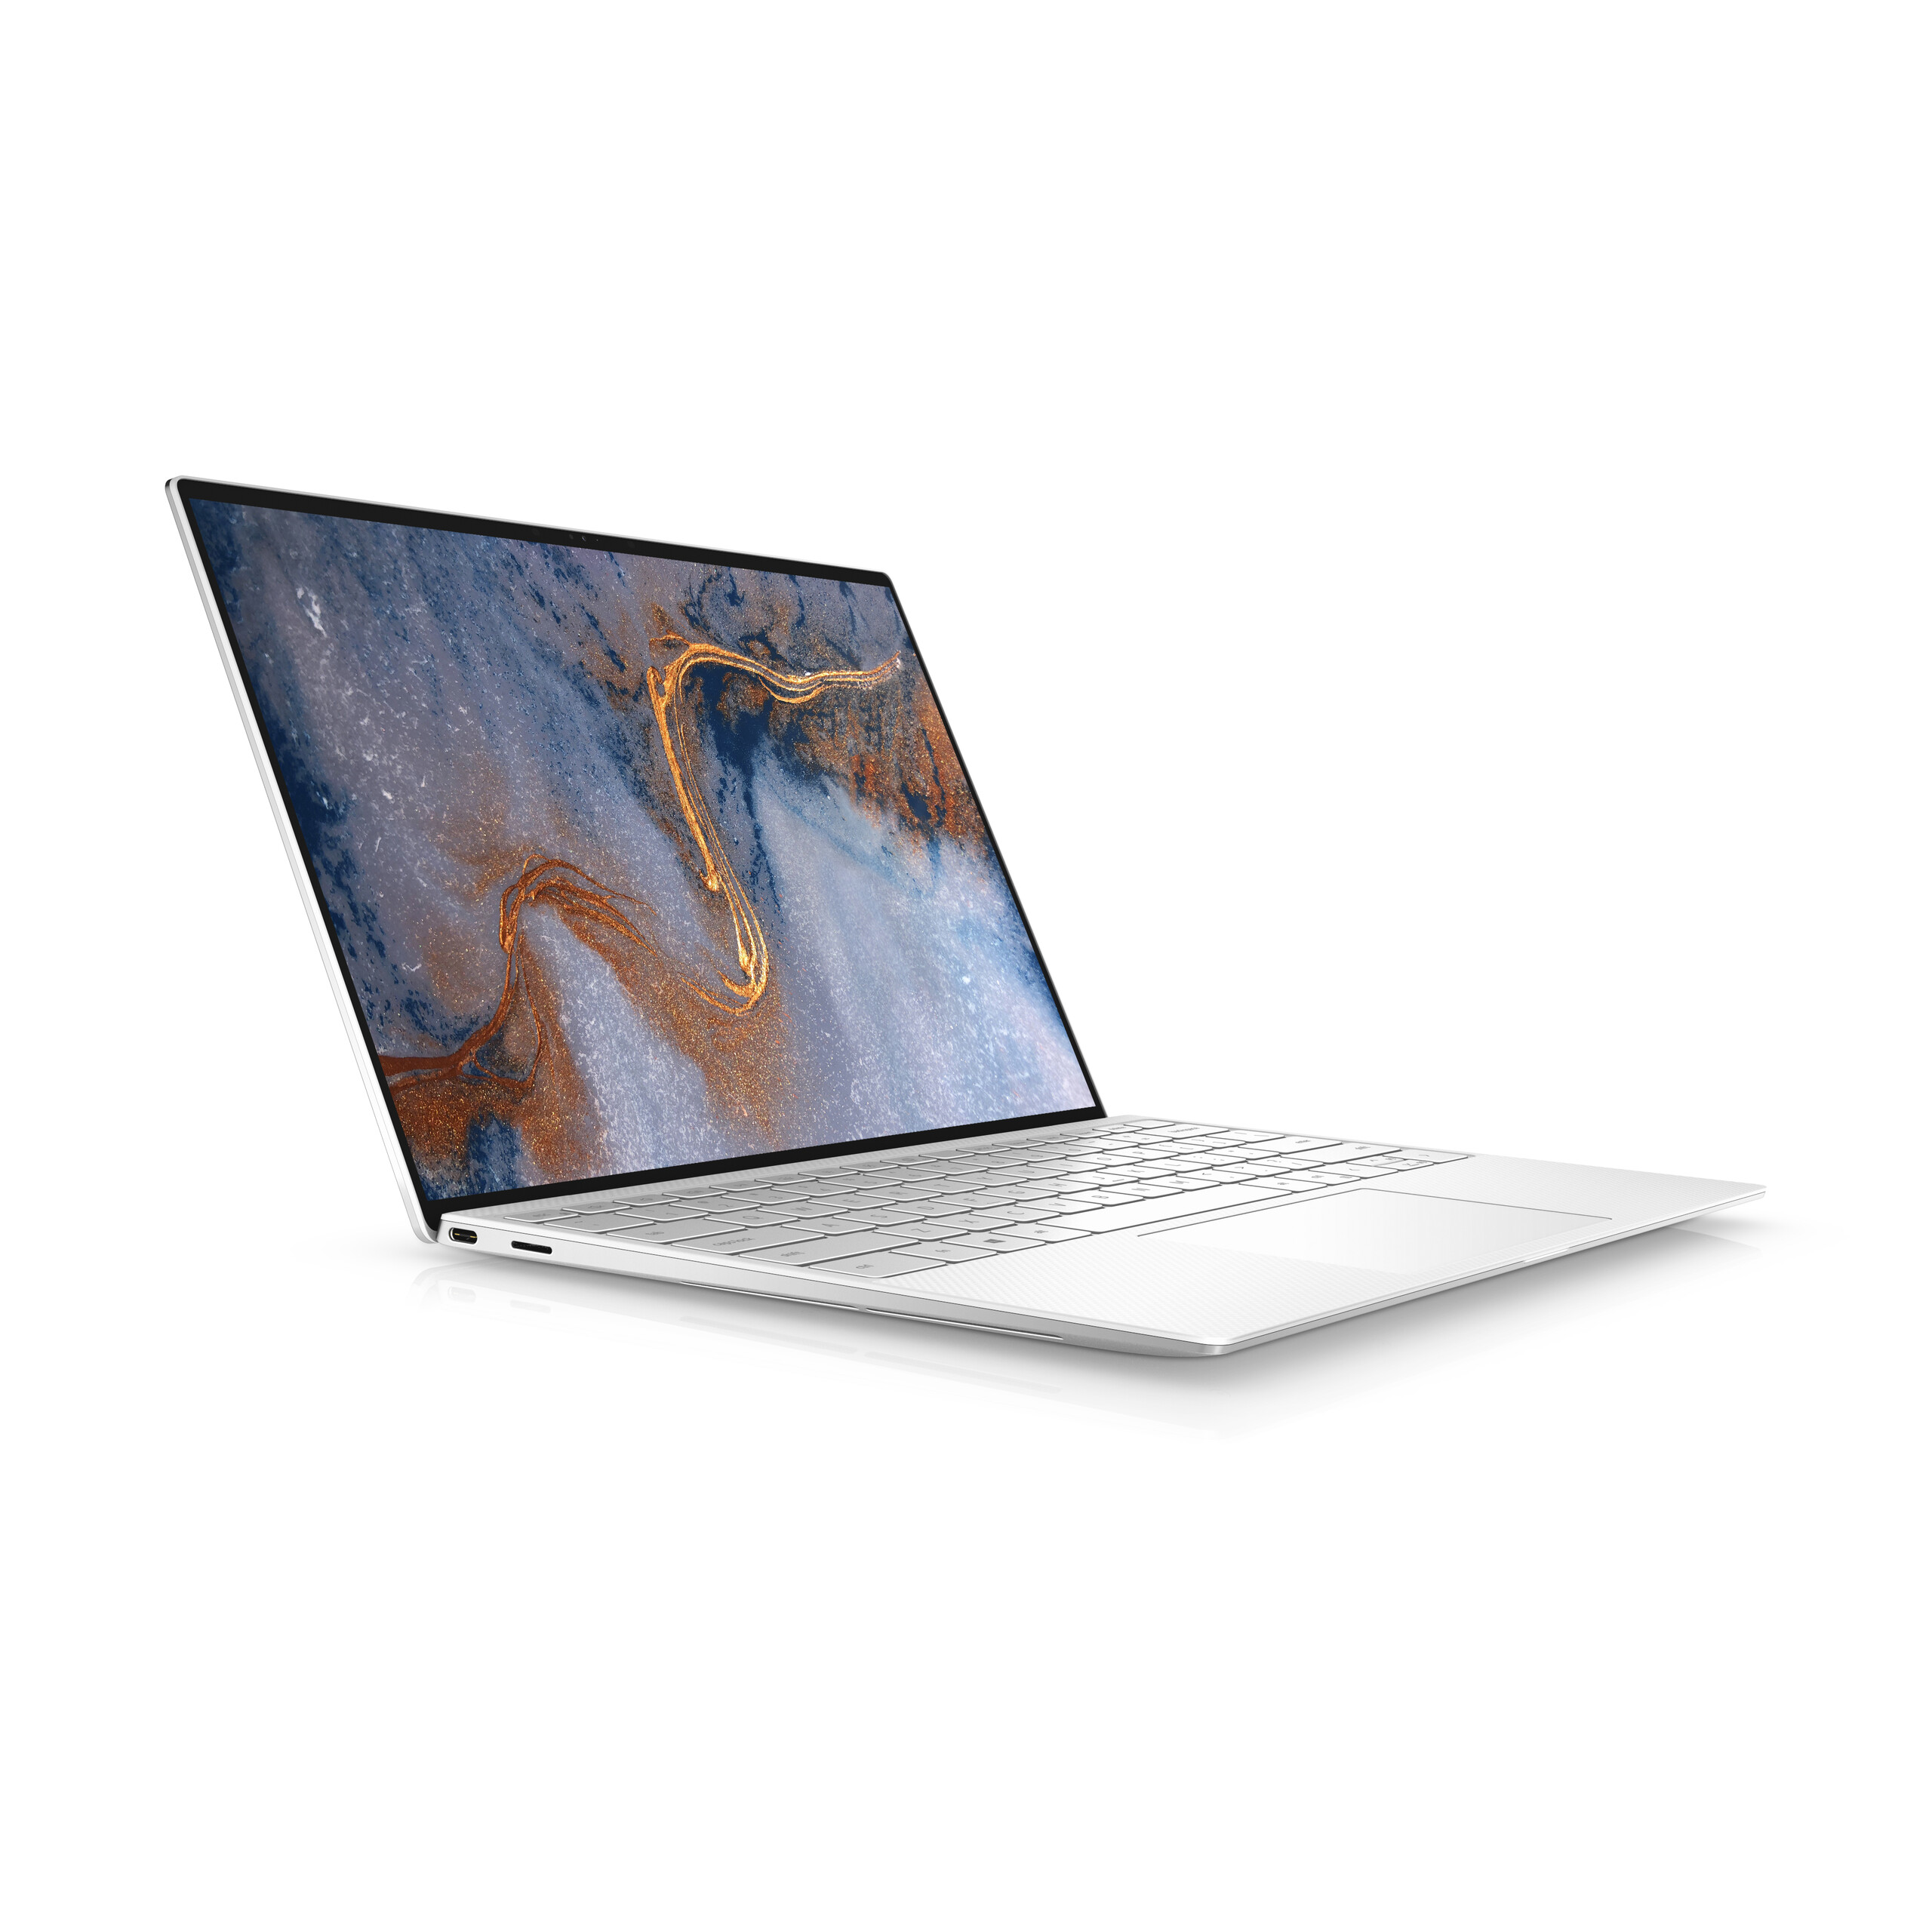
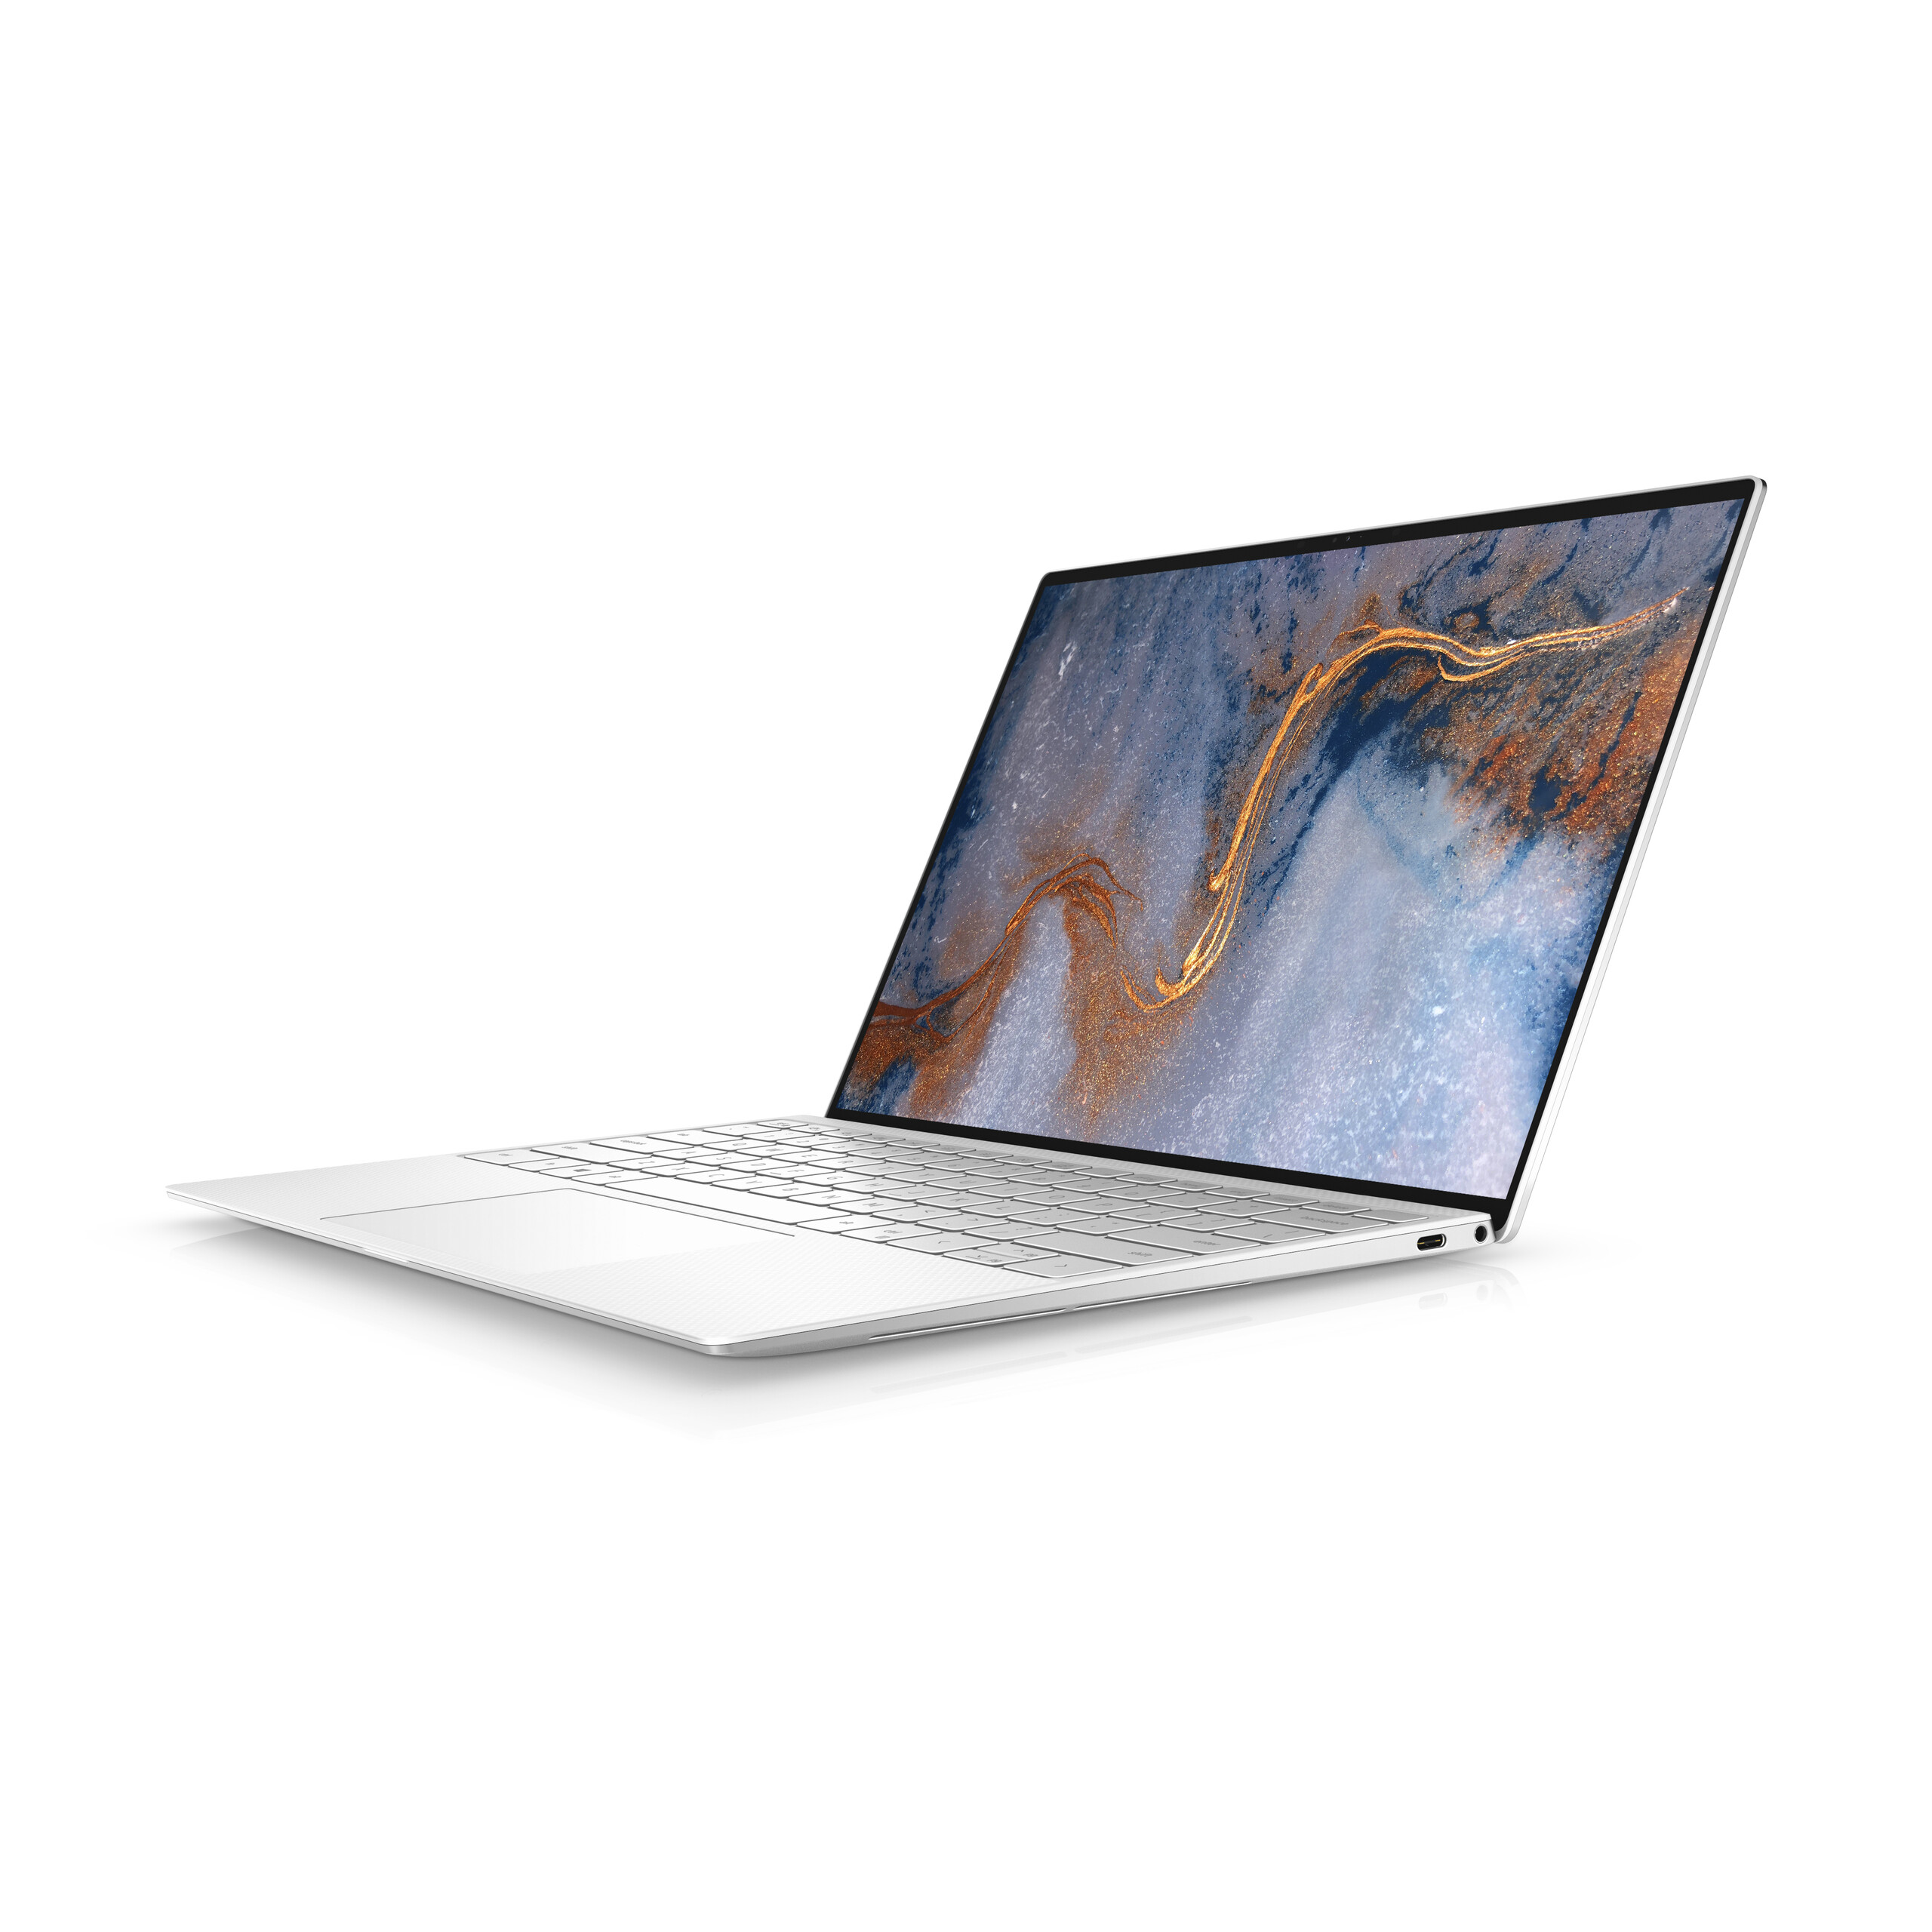
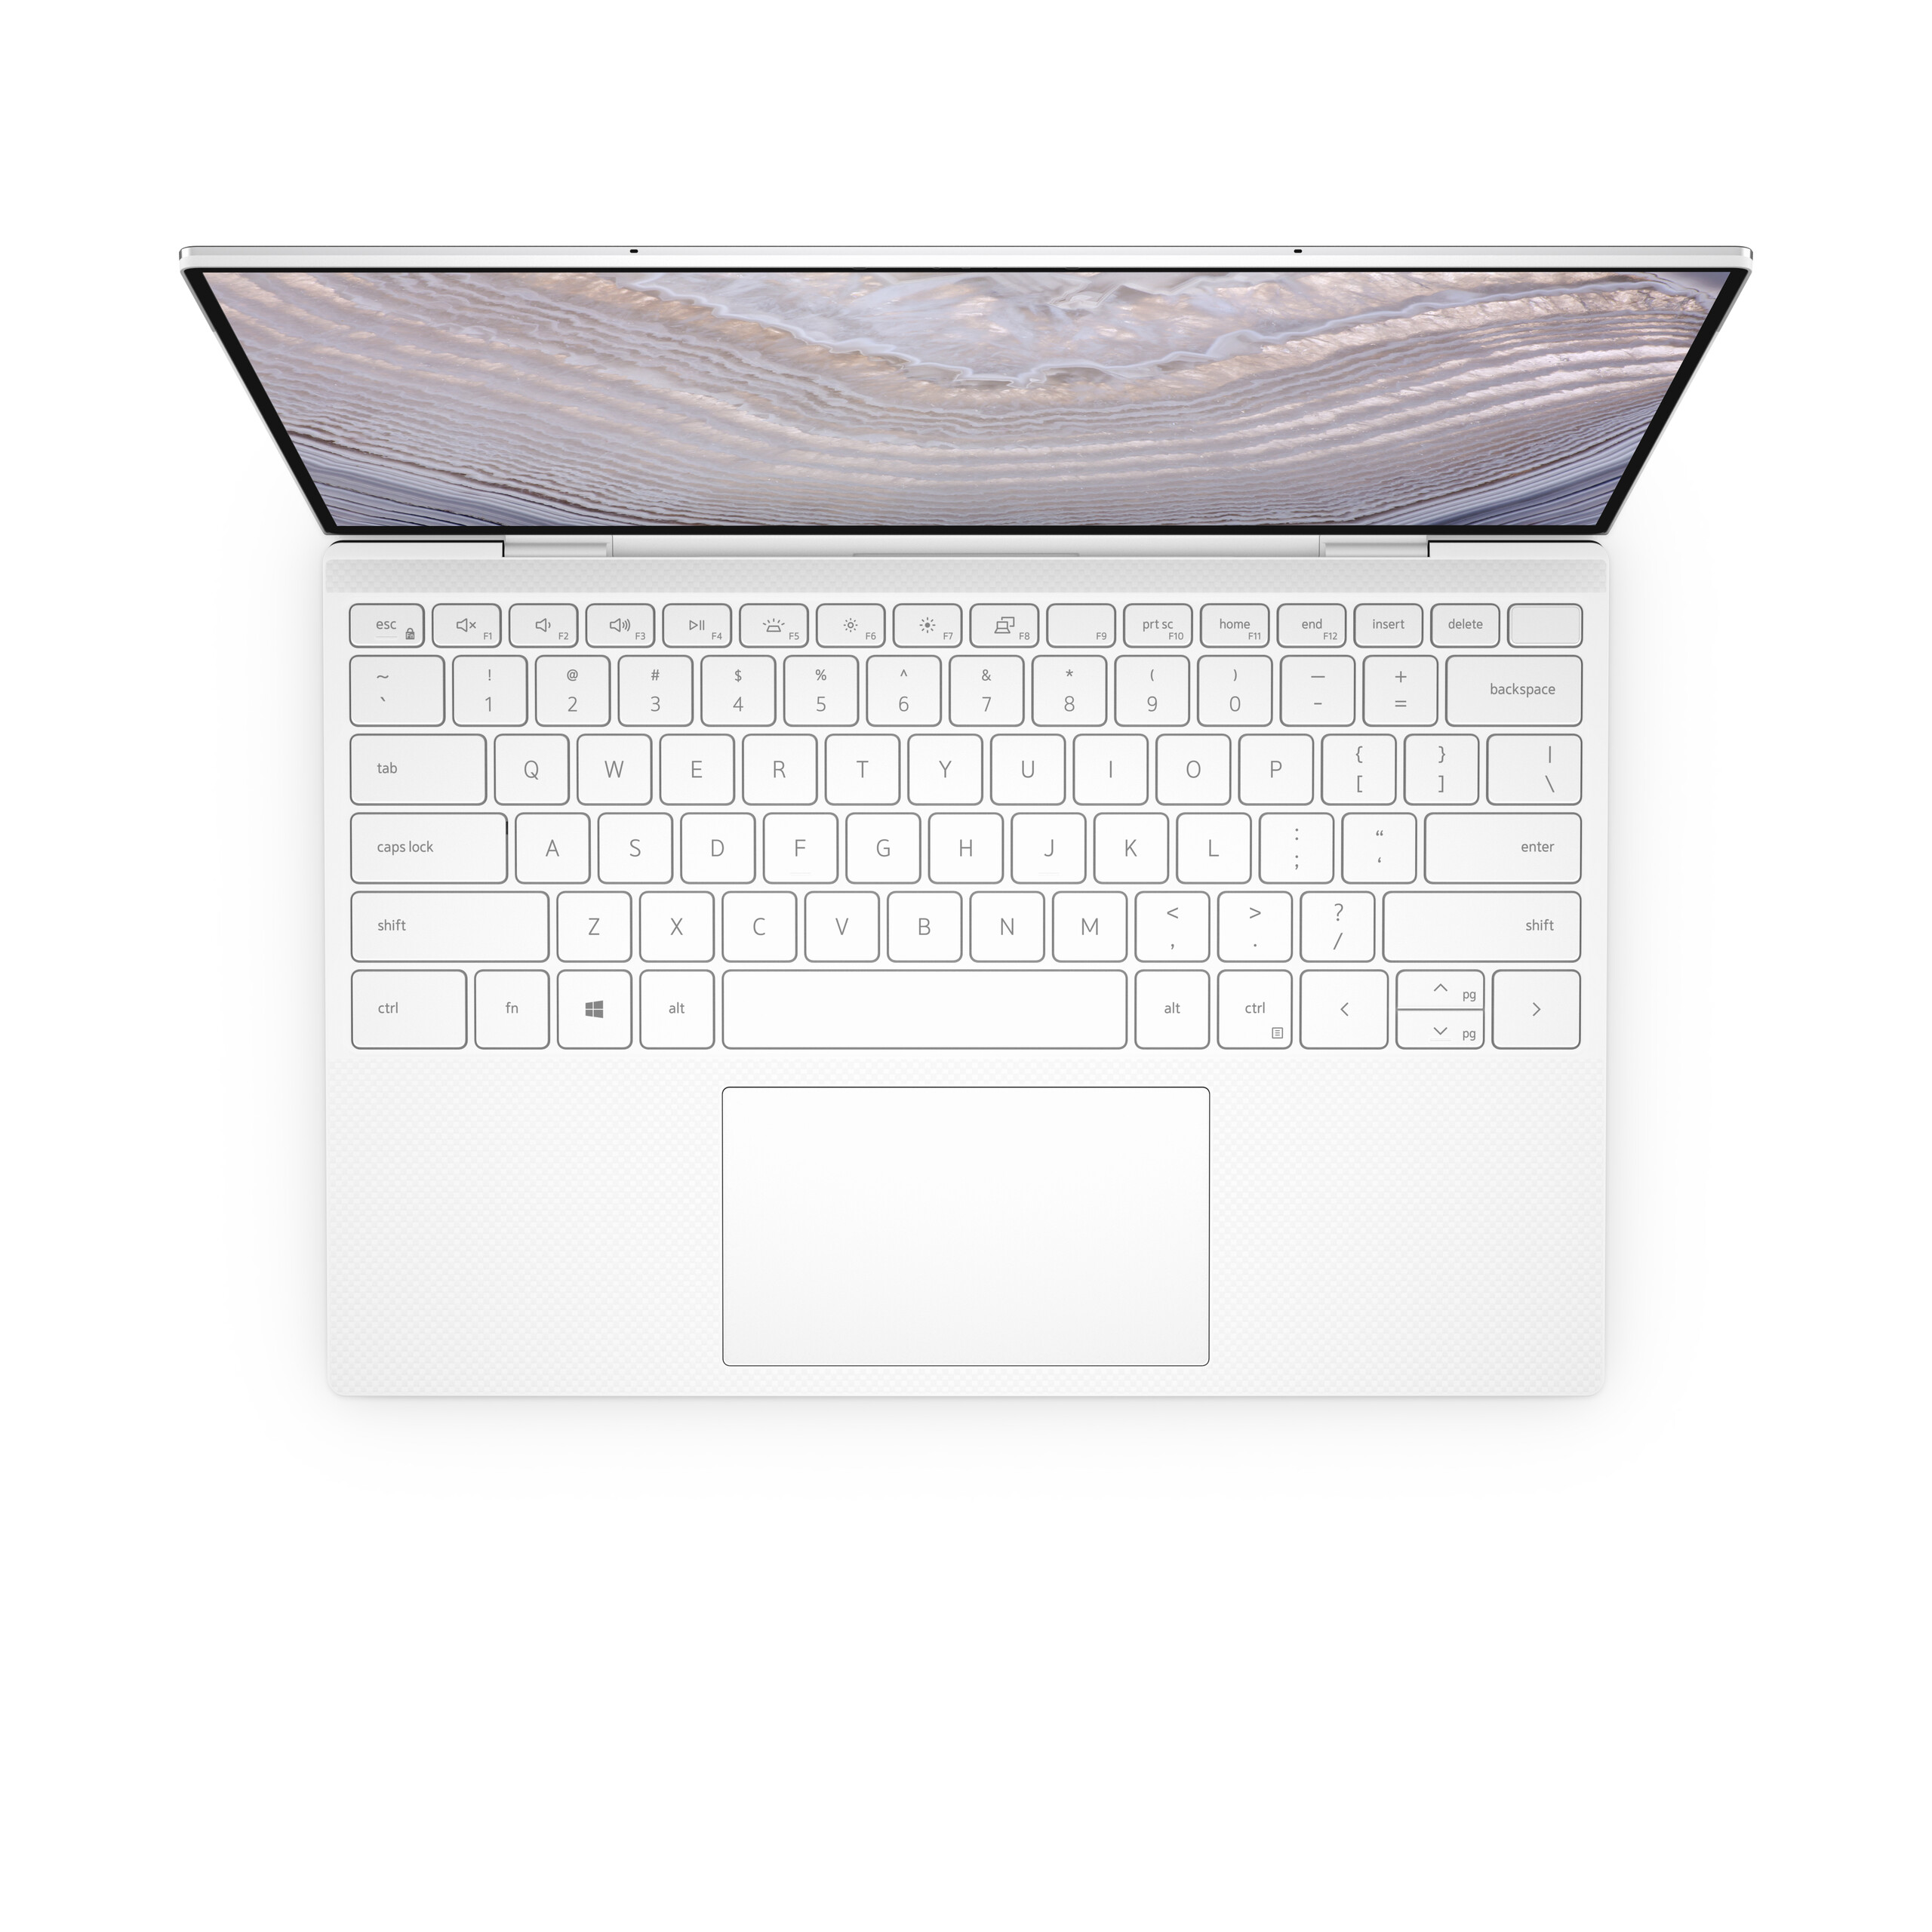
Das neueste XPS 13 9300, der Nachfolger des XPS 13 7390 aus dem letzten Jahr, verfügt über ein aktualisiertes Muschelschalen-Design, das nun noch kompakter ist und gleichzeitig mit einem größeren Bildschirm und ClickPad ausgestattet ist. Weitere Details zum Gehäuse und dessen physikalischen Merkmalen können Sie unserem bestehenden Test zum XPS 13 9300 Core i5 entnehmen. Unser heutiges Testgerät ist die Core-i7-Version des XPS 13 9300, die wir im Folgenden mit dem leistungsschwächeren Core-i5-Modell vergleichen möchten, um festzustellen, worin die Vor- und Nachteile liegen.
Weitere Dell-Tests:
Bew. | Datum | Modell | Gewicht | Dicke | Größe | Auflösung | Preis ab |
|---|---|---|---|---|---|---|---|
| 88.9 % | 03.2020 | Dell XPS 13 9300 Core i7-1065G7 i7-1065G7, Iris Plus Graphics G7 (Ice Lake 64 EU) | 1.2 kg | 14.8 mm | 13.40" | 1920x1200 | |
| 85.9 % | 11.2019 | Dell XPS 13 7390 Core i7-10710U i7-10710U, UHD Graphics 620 | 1.2 kg | 11.6 mm | 13.30" | 3840x2160 | |
| 86.3 % | 10.2019 | Dell XPS 13 7390 2-in-1 Core i7 i7-1065G7, Iris Plus Graphics G7 (Ice Lake 64 EU) | 1.3 kg | 13 mm | 13.40" | 1920x1200 | |
| 86.6 % | 05.2019 | Asus ZenBook S13 UX392FN i7-8565U, GeForce MX150 | 1.1 kg | 12.9 mm | 13.90" | 1920x1080 | |
| 84 % | 02.2020 | Microsoft Surface Laptop 3 13 Core i5-1035G7 i5-1035G7, Iris Plus Graphics G7 (Ice Lake 64 EU) | 1.3 kg | 14.5 mm | 13.50" | 2256x1504 |
Gehäuse
Ausstattung
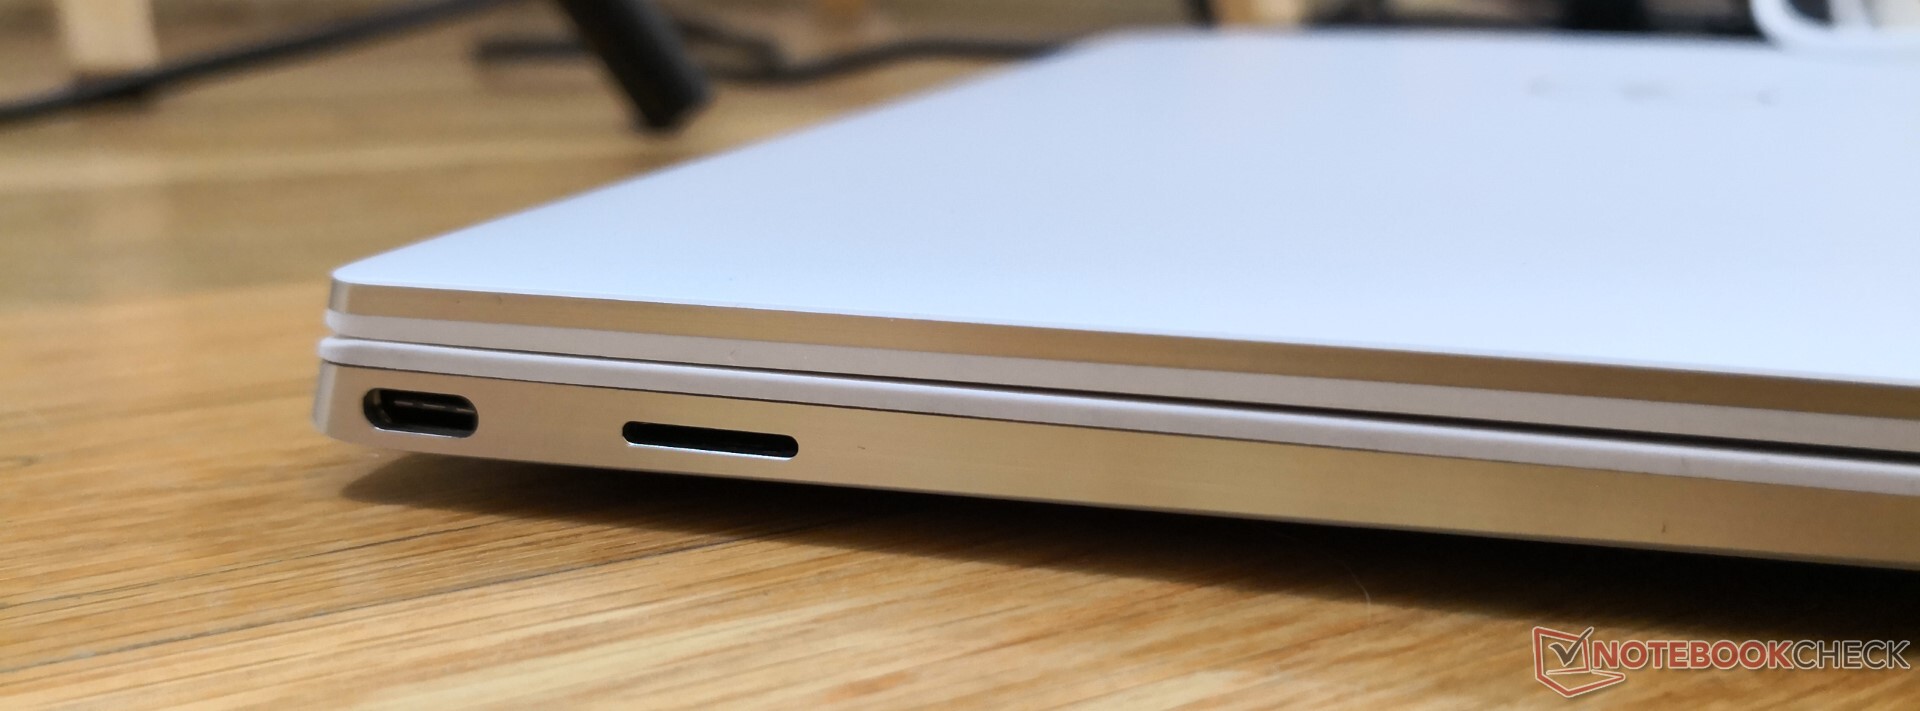
SD-Kartenleser
| SD Card Reader | |
| average JPG Copy Test (av. of 3 runs) | |
| Dell XPS 13 7390 Core i7-10710U (Toshiba Exceria Pro M501 64 GB UHS-II) | |
| Dell XPS 13 9300 Core i7-1065G7 (Toshiba Exceria Pro M501 64 GB UHS-II) | |
| Dell XPS 13 7390 2-in-1 Core i7 (Toshiba Exceria Pro M501 64 GB UHS-II) | |
| Asus ZenBook S13 UX392FN (Toshiba Exceria Pro M501 64 GB UHS-II) | |
| maximum AS SSD Seq Read Test (1GB) | |
| Dell XPS 13 7390 Core i7-10710U (Toshiba Exceria Pro M501 64 GB UHS-II) | |
| Dell XPS 13 7390 2-in-1 Core i7 (Toshiba Exceria Pro M501 64 GB UHS-II) | |
| Dell XPS 13 9300 Core i7-1065G7 (Toshiba Exceria Pro M501 64 GB UHS-II) | |
| Asus ZenBook S13 UX392FN (Toshiba Exceria Pro M501 64 GB UHS-II) | |
Kommunikation
WLAN bietet das Intel-Killer-Modul 1650x; hierbei handelt es sich im Prinzip um ein Intel-AX200- bzw. AX201-Modul mit zusätzlichen Killer-spezifischen Softwarefunktionen. Für ein XPS-System wäre das nicht unbedingt nötig gewesen, da Killers Zielgruppe eigentlich eher aus fortgeschritteneren Nutzern wie zum Beispiel Gamern besteht, für die sich eher Dells G- und Alienware-Reihen eignen. In einer Entfernung von einem Meter zu unserem WLAN-6-fähigen Netgear-RAX200-Router konnten wir durchschnittliche Übertragungsraten von 800 MBit/s bis 1.400 MBit/s messen. Die Übertragungsraten könnten etwas stabiler ausfallen, da sie auch im Wiederholungstest auf bis zu 232 MBit/s eingebrochen sind.
Webcam
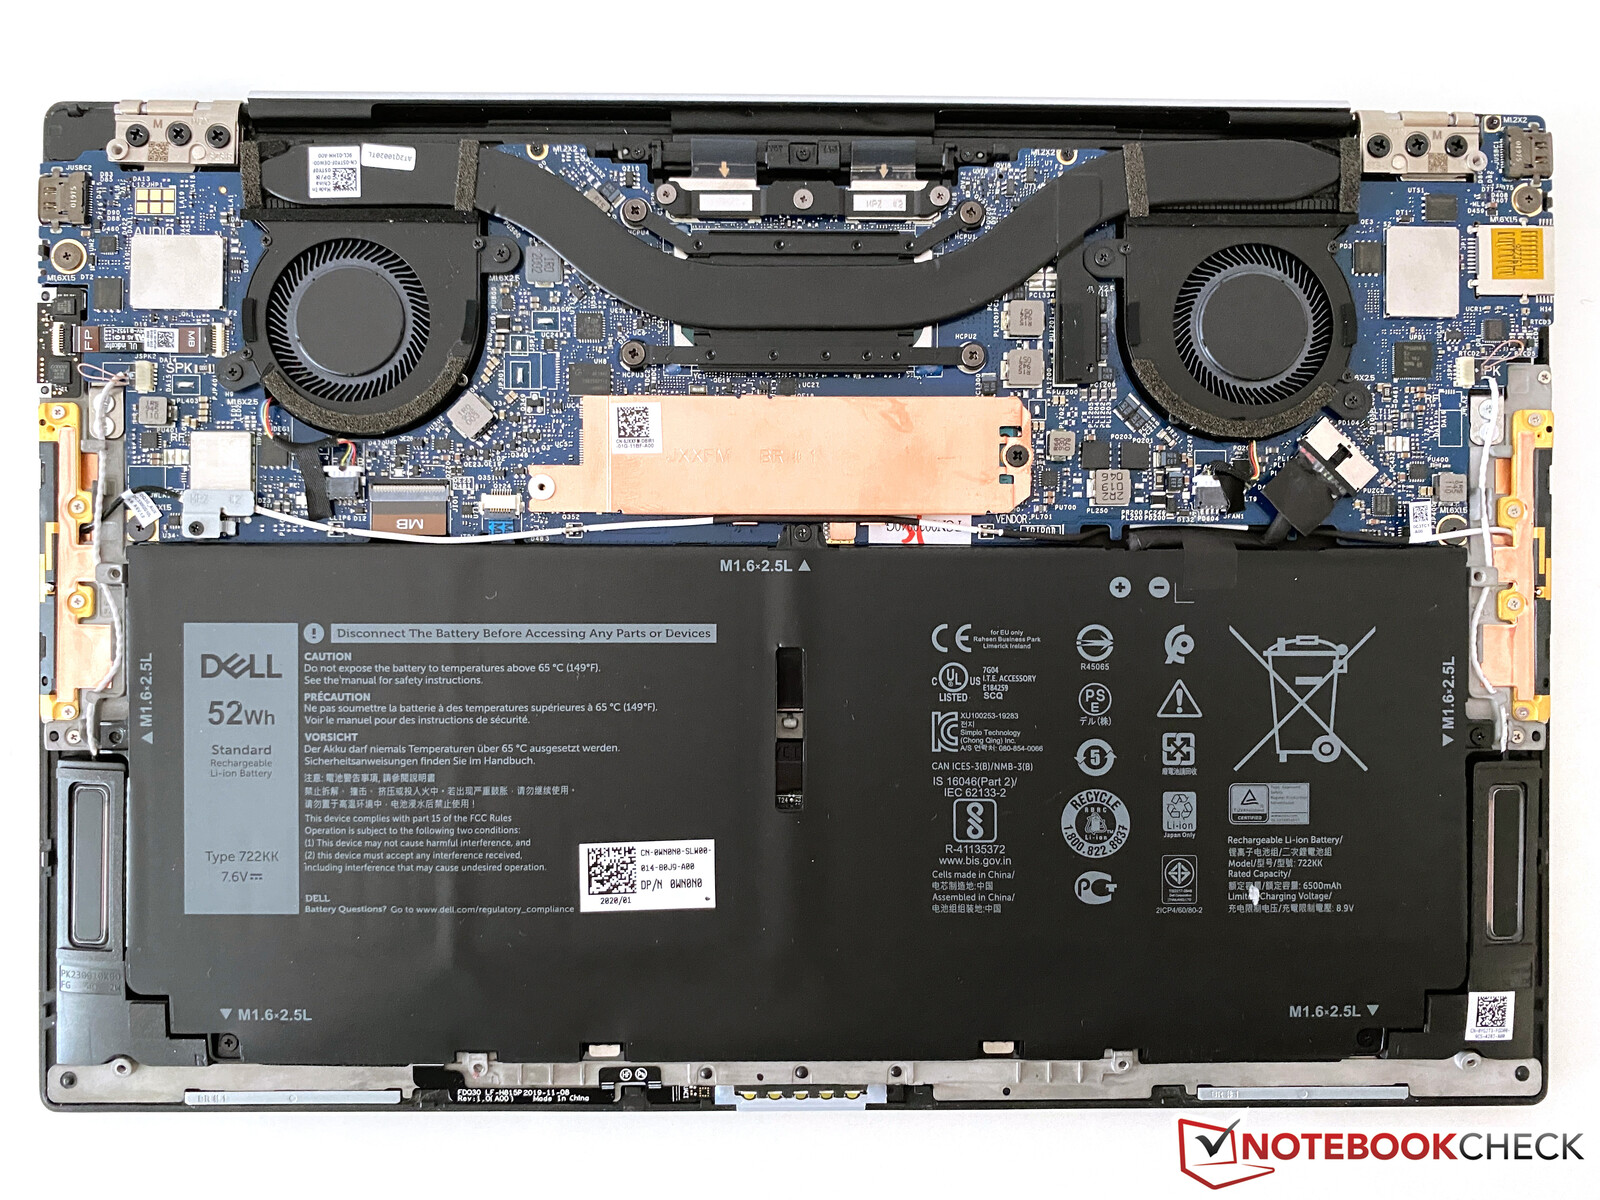
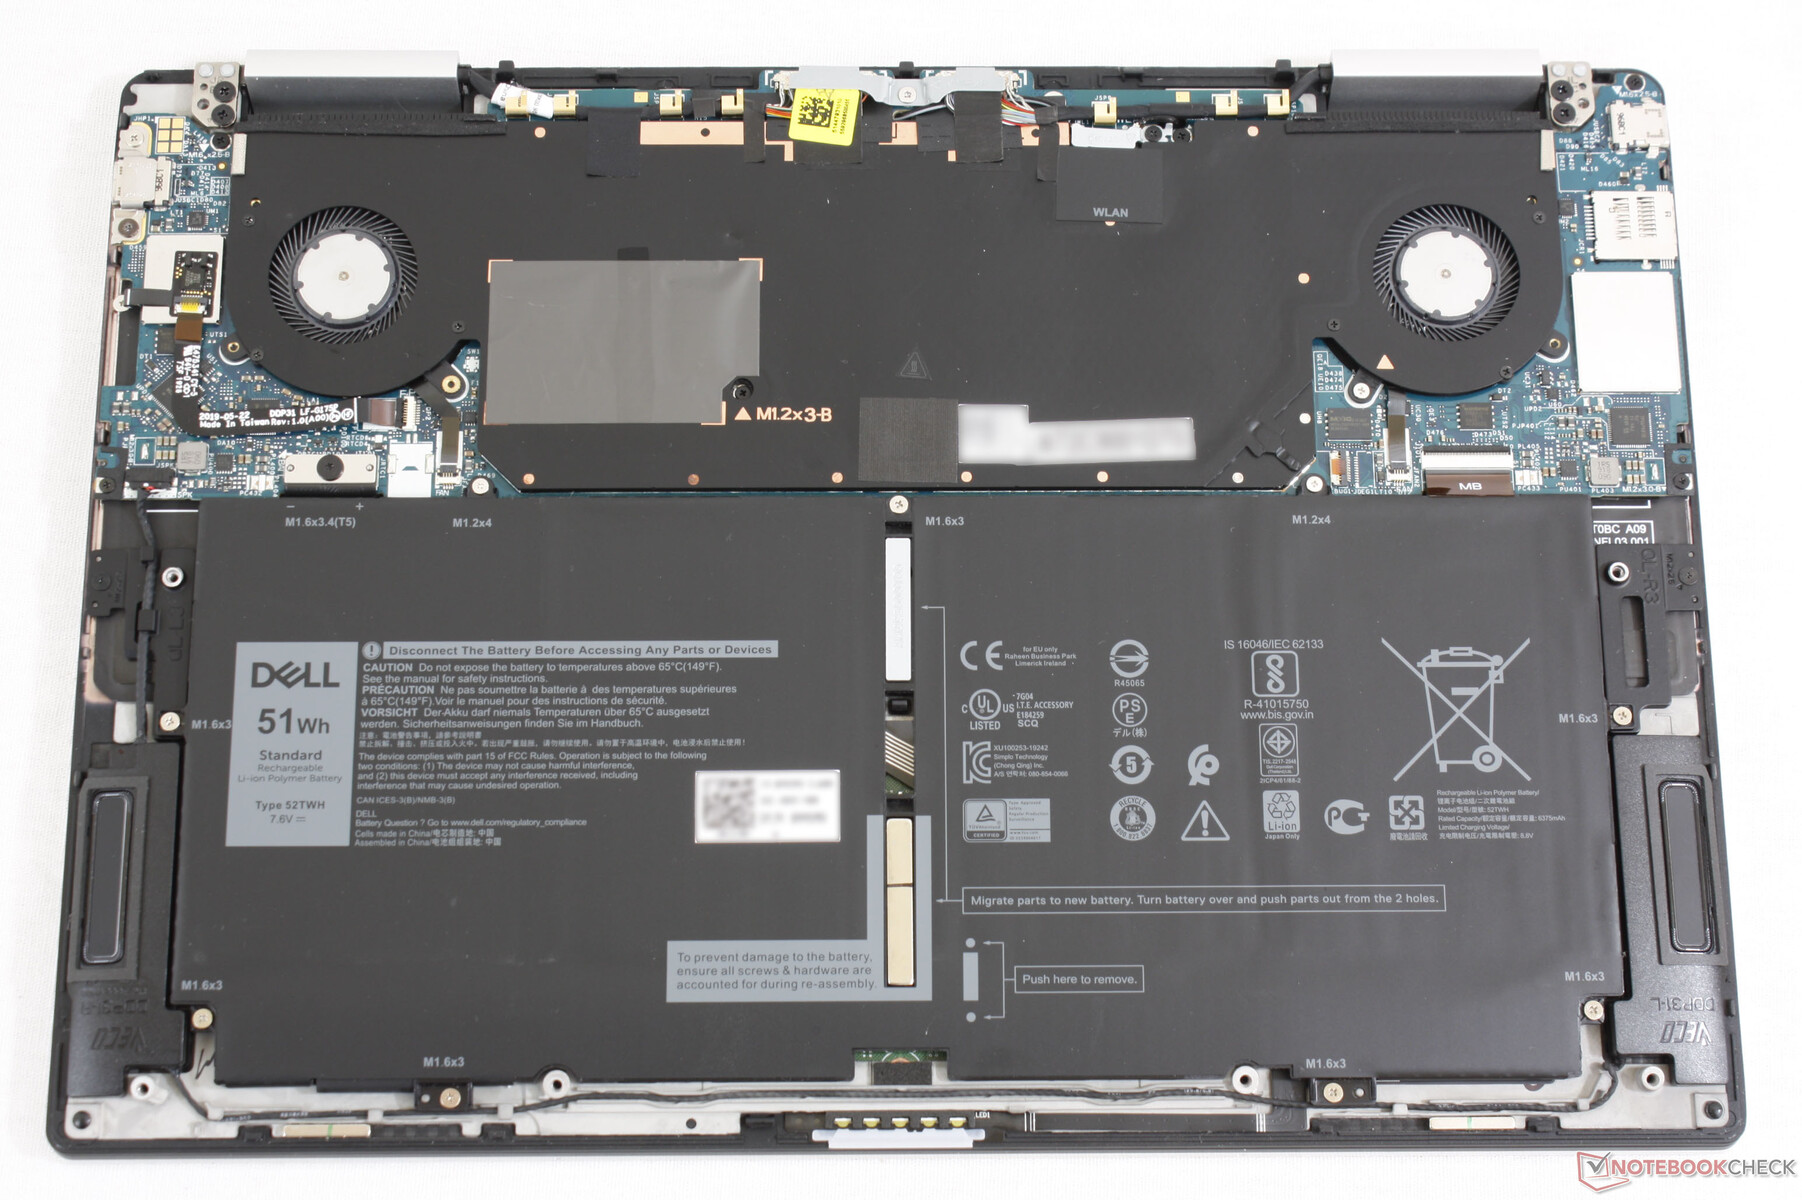
Wartung
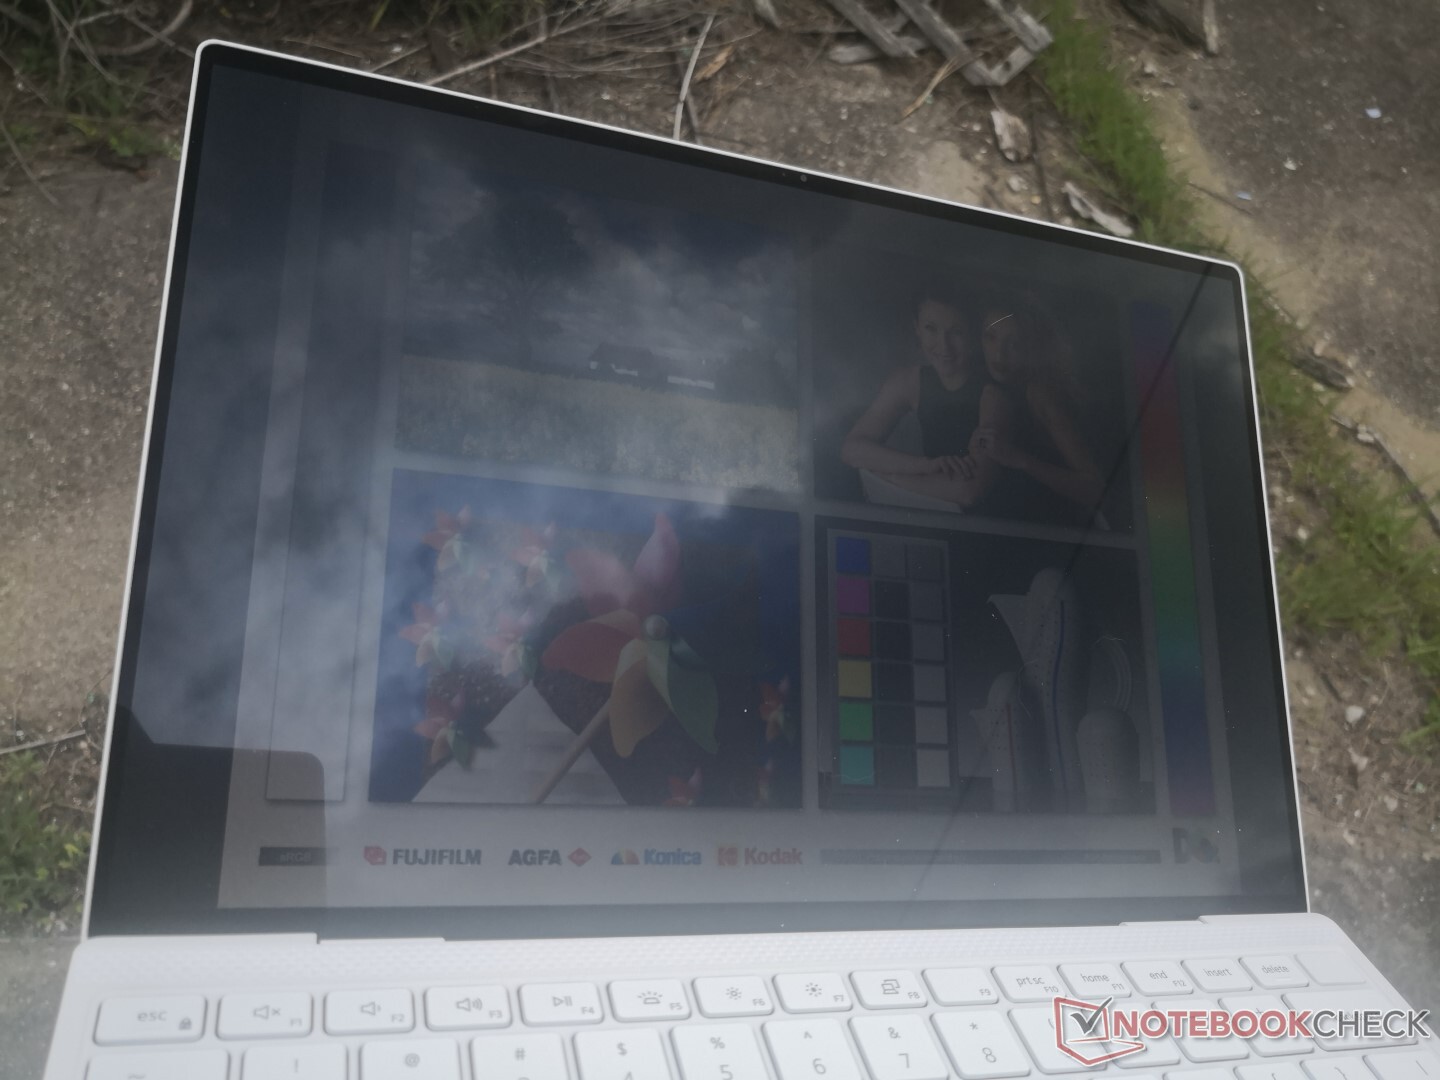
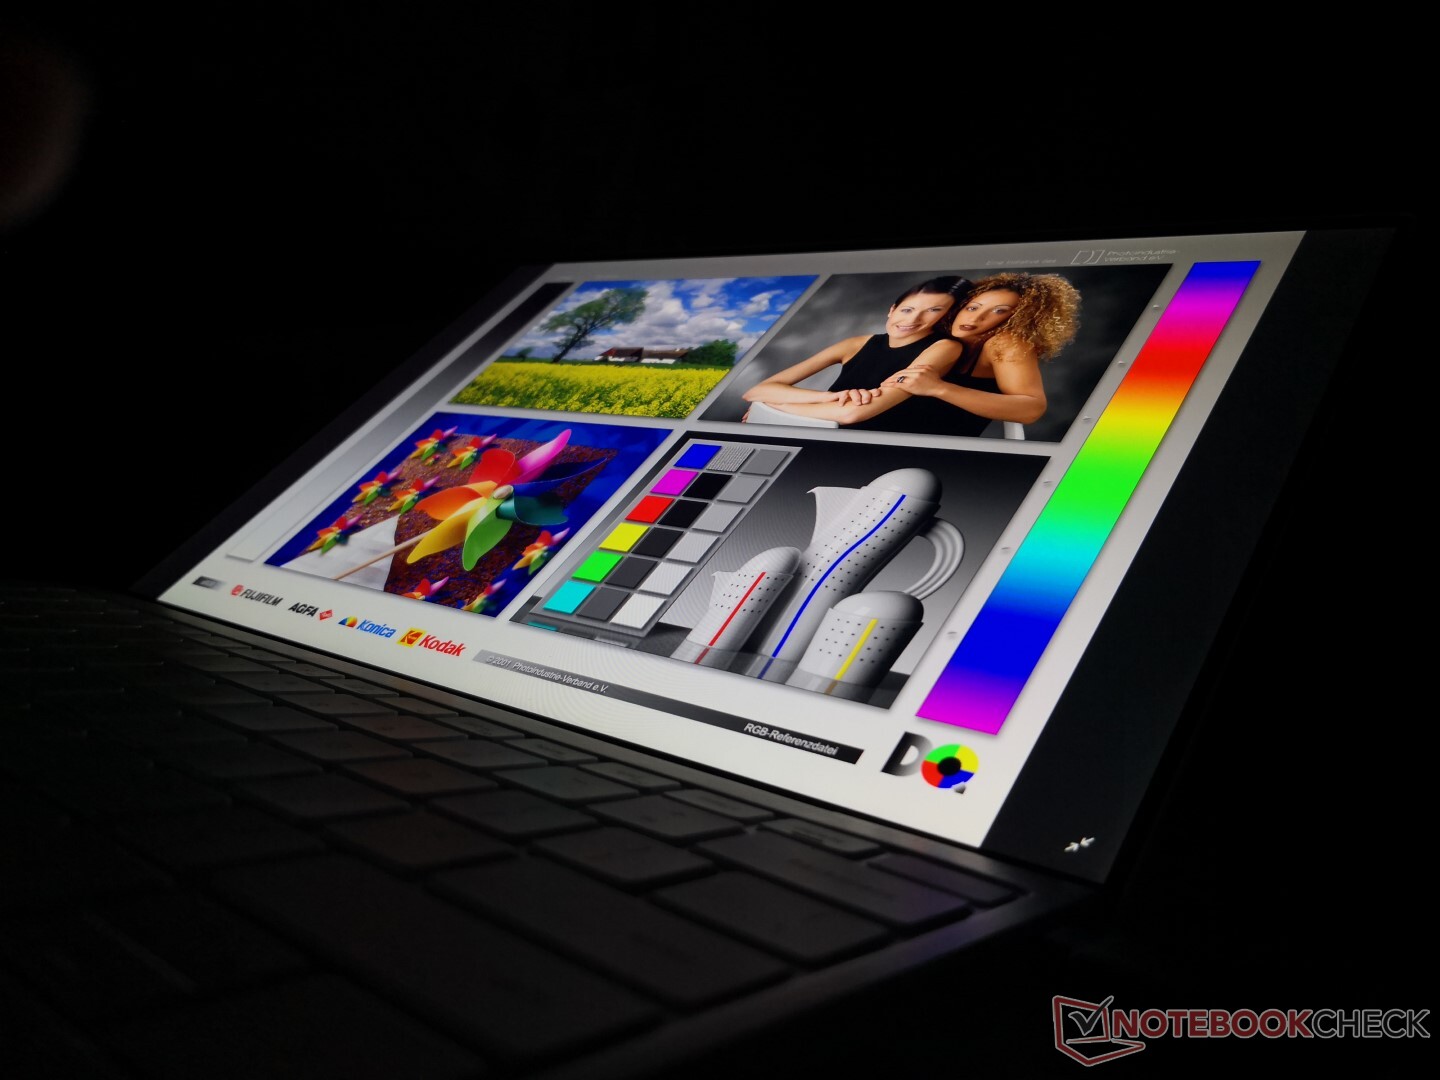
Display
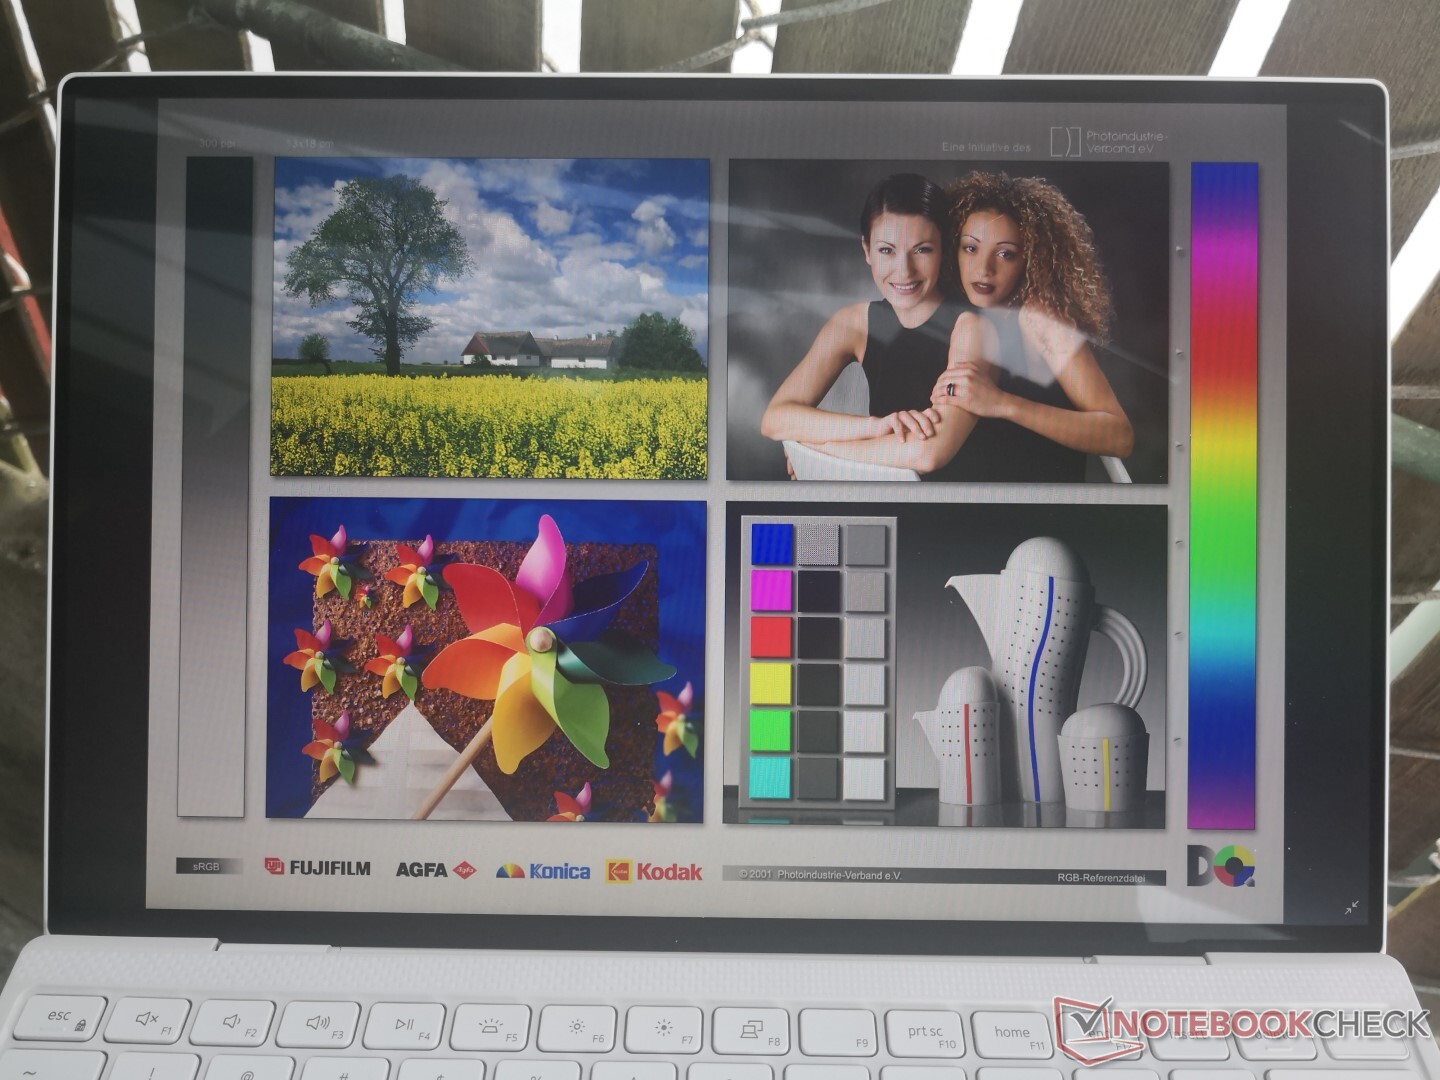
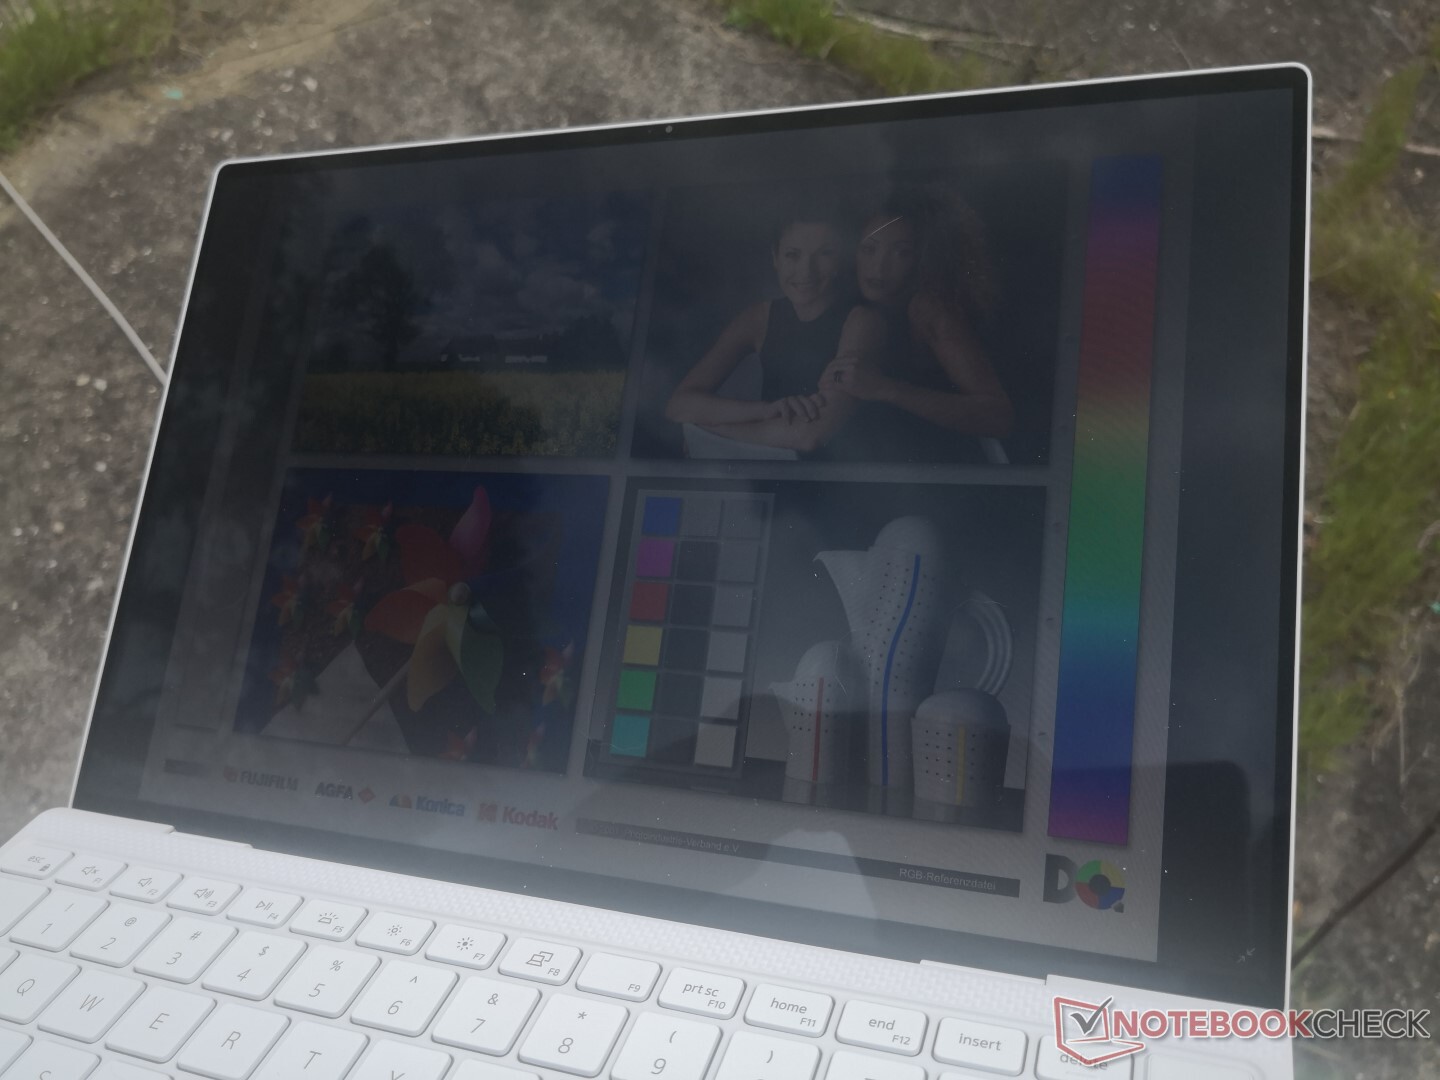
Dell wirbt mit einer Helligkeit von 500 cd/m² für die XPS-13-9300-FHD-Modelle. Interessanterweise konnten wir bei zwei verschiedenen FHD-Modellen eine maximale Helligkeit von 600 cd/m² messen, womit der Laptop heller ist als von Dell angegeben. Wir haben außerdem festgestellt, dass das Display automatisch auf maximal 500 cd/m² heruntergeregelt wird, sobald der Laptop von der Steckdose getrennt und im Akkumodus betrieben wird.
Zum Glück kann man die vollen 600 cd/m² mit ein paar Klicks, wie hier beschrieben, auch für den Batteriebetrieb freischalten. Dazu muss die automatische Helligkeit zuerst in Windows und dann nochmals in Intels Graphics-Control-Center-Software deaktiviert, die Display-Energiesparoptionen aktiviert und die erweiterte Energiesparoption deaktiviert werden und zwar in genau dieser Reihenfolge. Das ist ein umständlicher Prozess, der mehrere Kästchen involviert anstatt in maximal ein bis zwei Schritten erledigt zu sein.
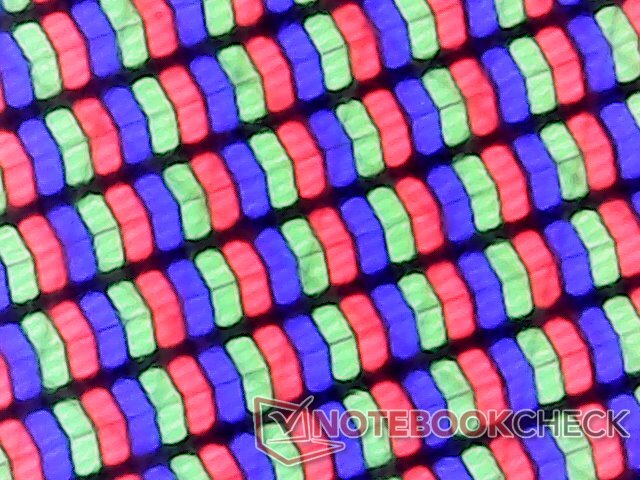
Erwähnenswert ist auch, dass beim XPS 13 9300 das gleiche 13,4-Zoll-IPS-Panel Sharp LQ134N1 mit 16:10-Seitenverhältnis zum Einsatz kommt wie beim XPS 13 7390 2-in-1, weshalb sich die Bildschirmeigenschaften der beiden Systeme sehr ähnlich sind. Mit 2.500 Hz ist auch die Frequenz der Pulsweitenmodulation identisch, was darauf hindeutet, dass noch weitere ähnliche Komponenten verbaut sind.

| |||||||||||||||||||||||||
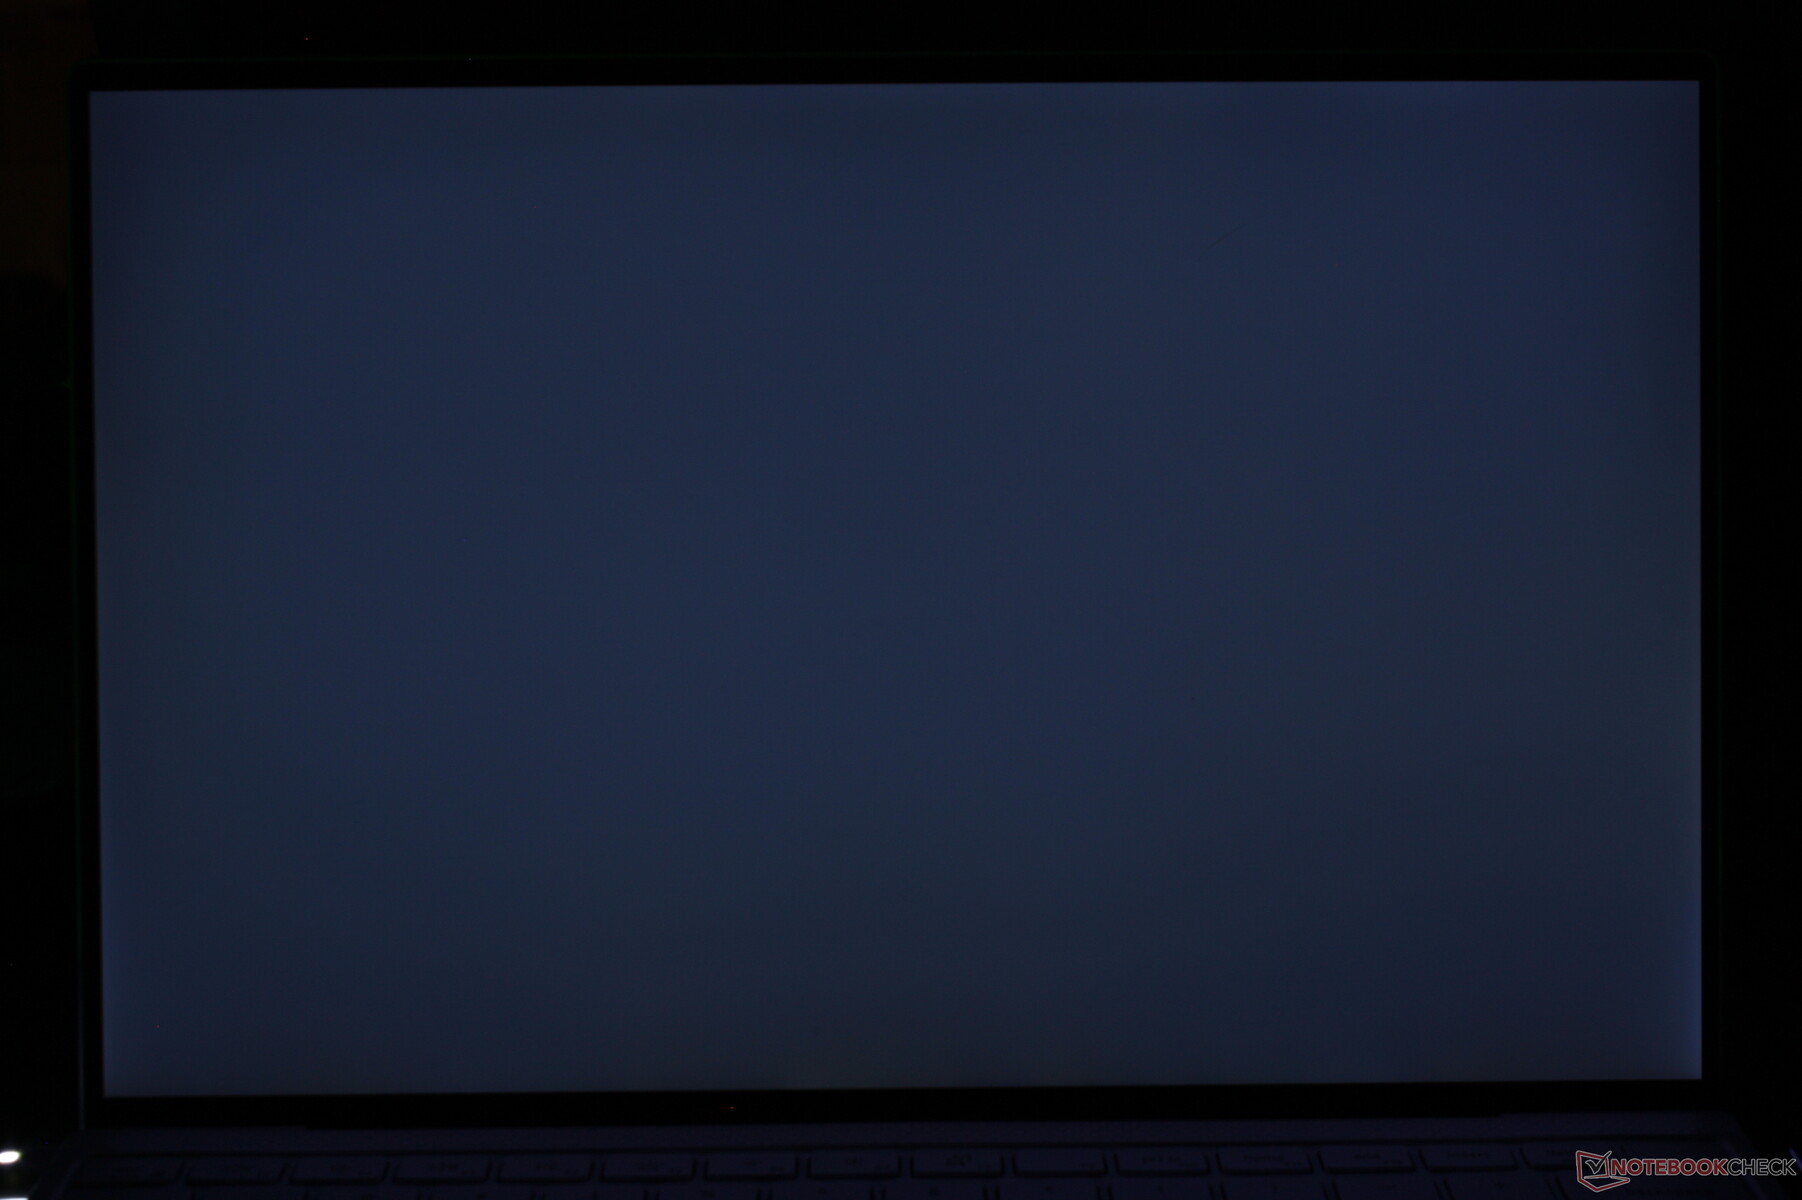
Ausleuchtung: 96 %
Helligkeit Akku: 607.6 cd/m²
Kontrast: 1519:1 (Schwarzwert: 0.4 cd/m²)
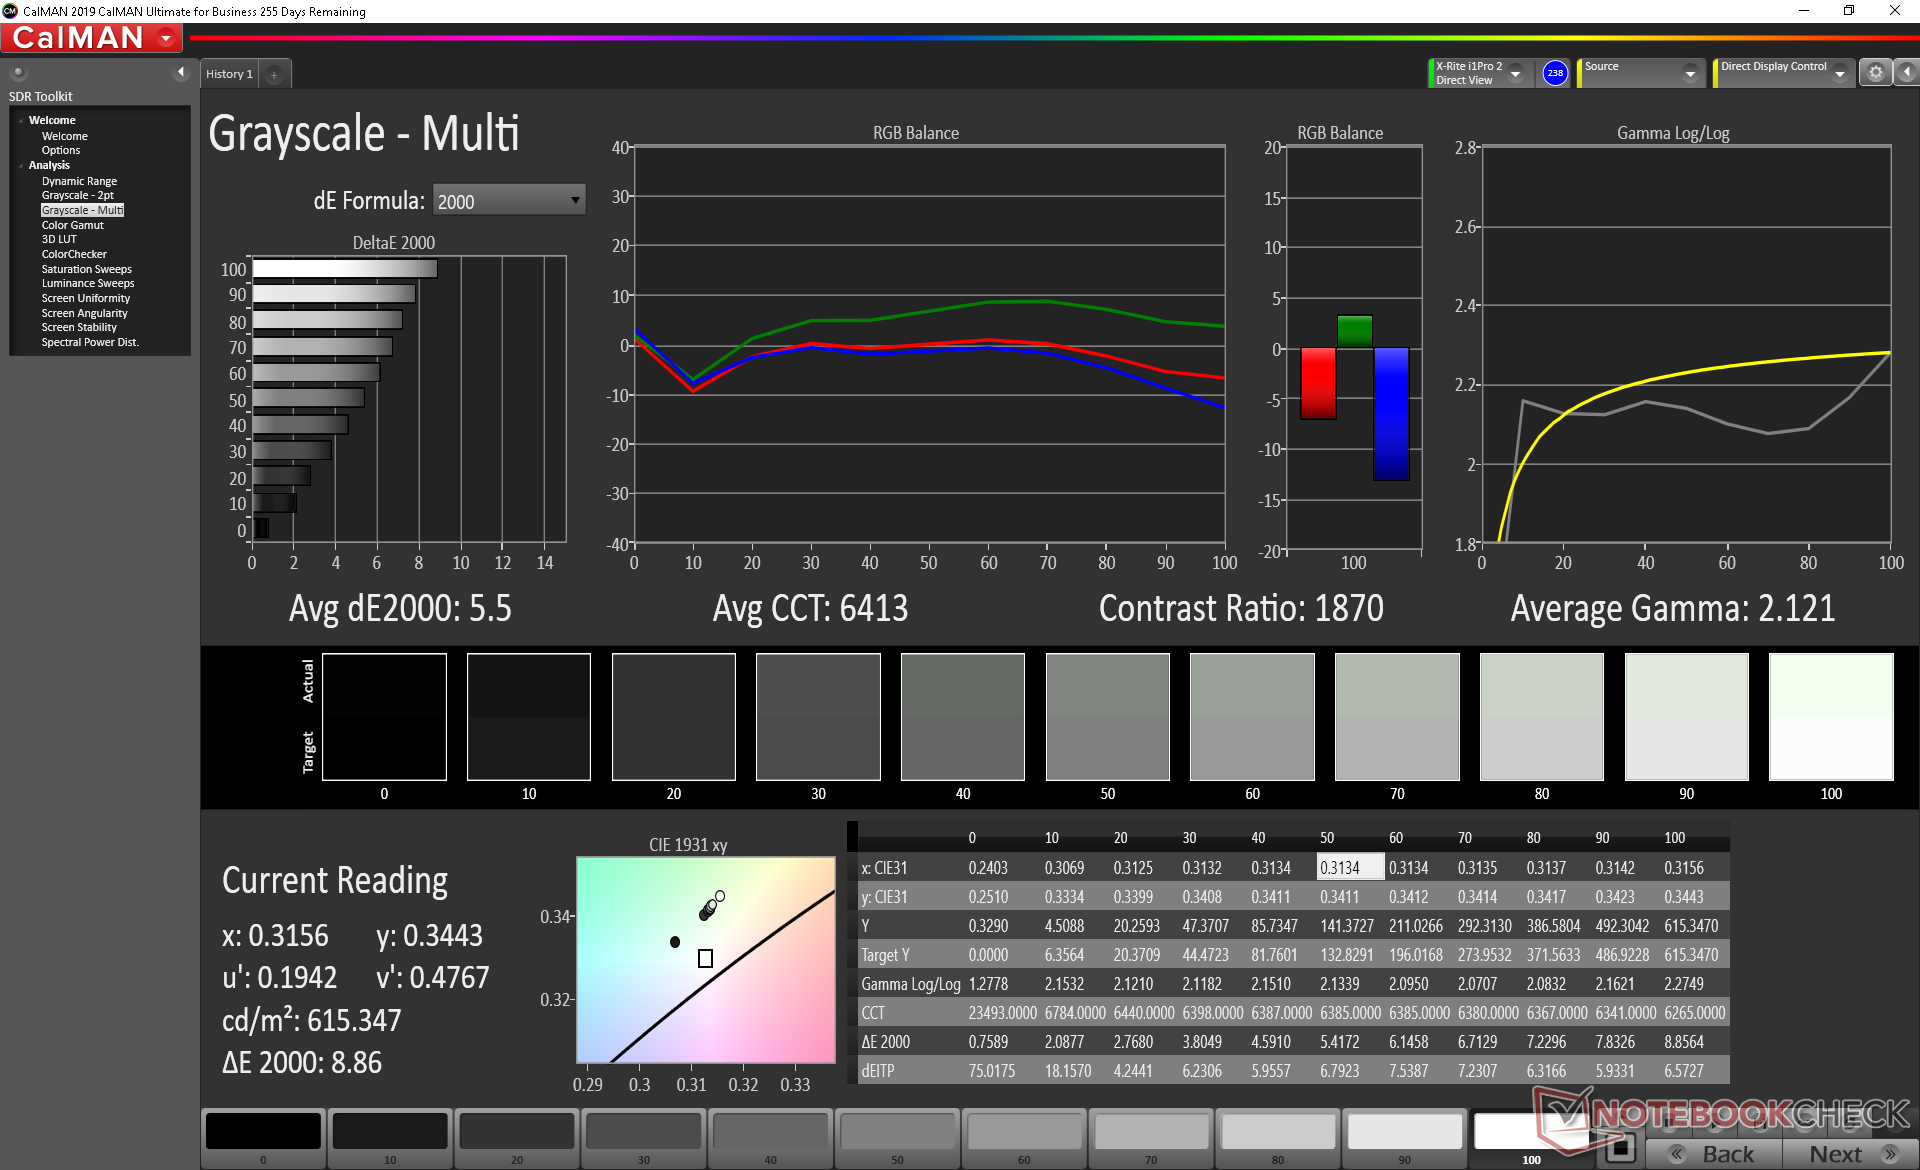
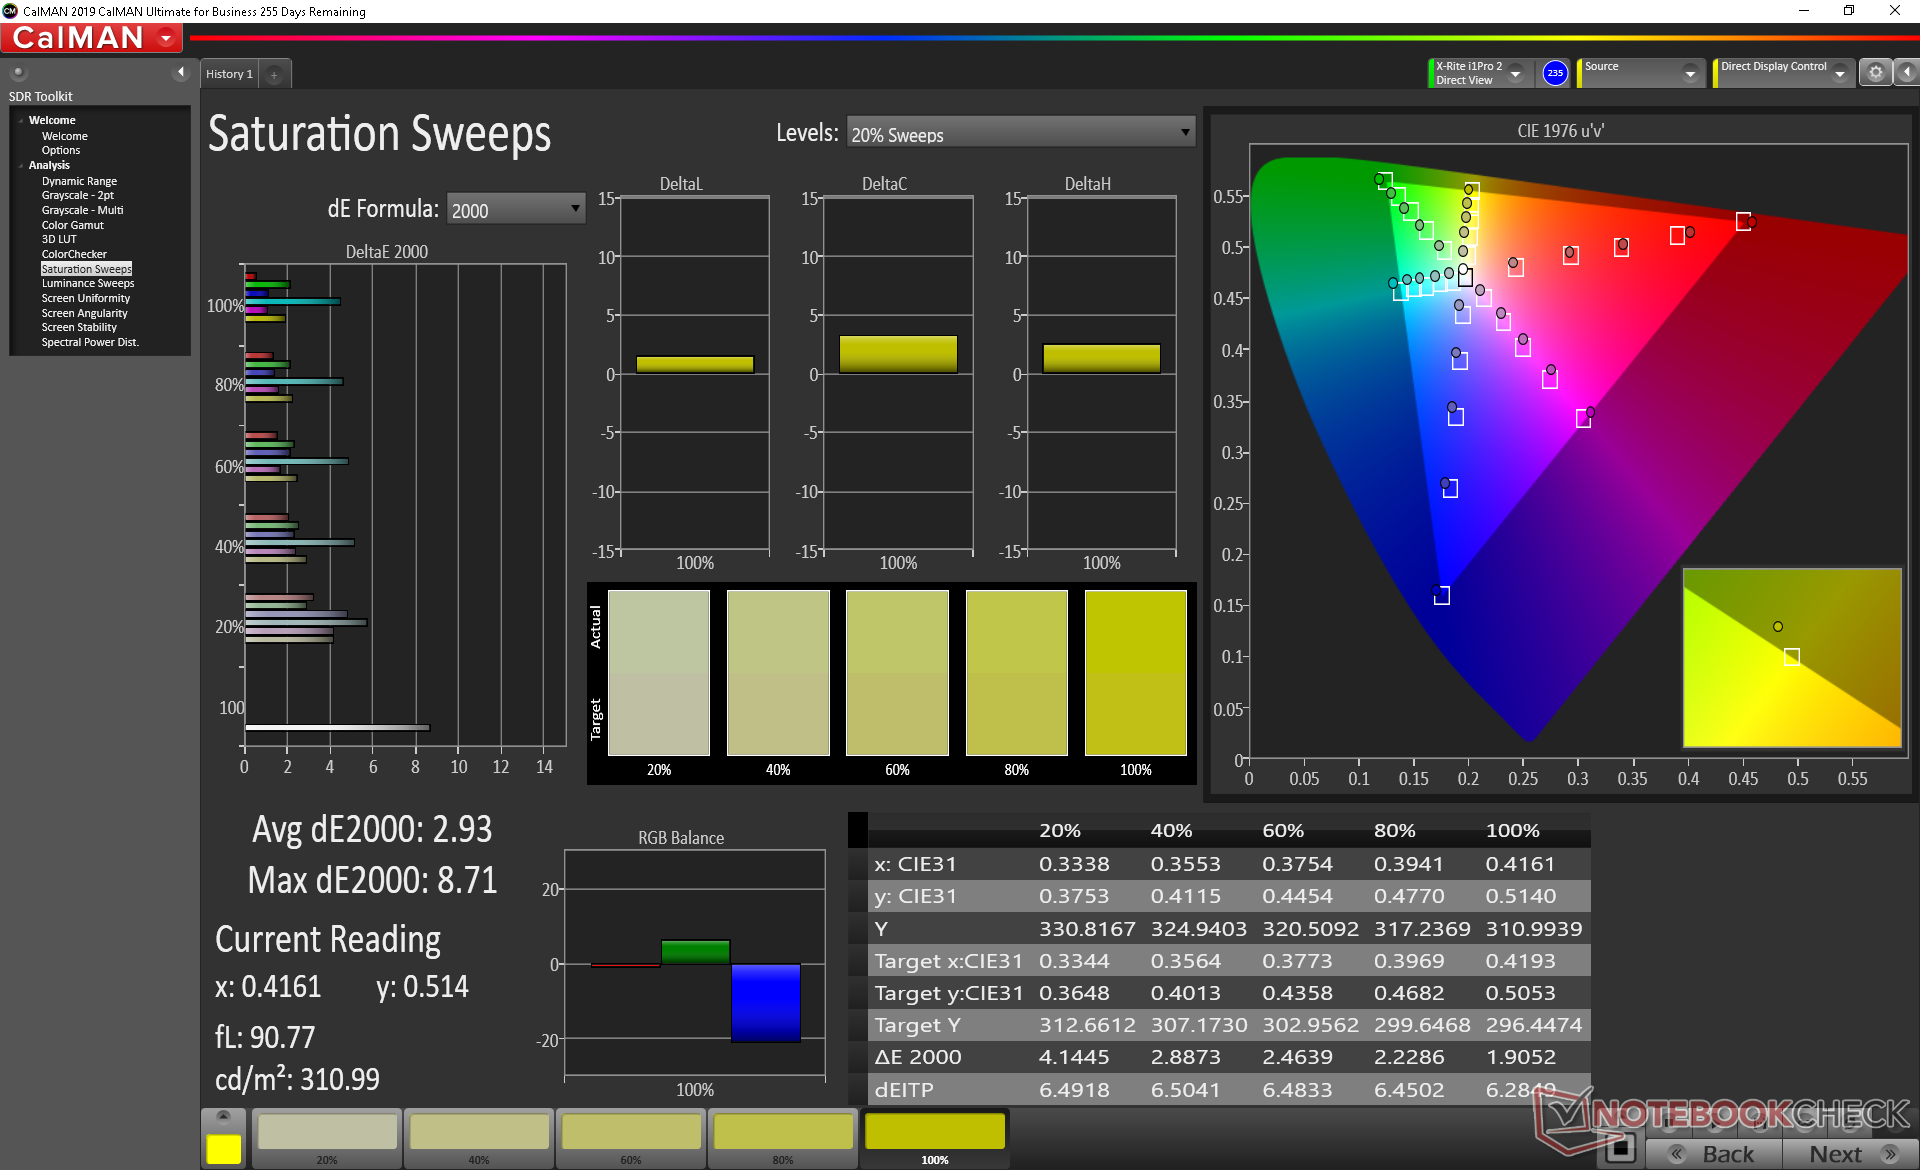
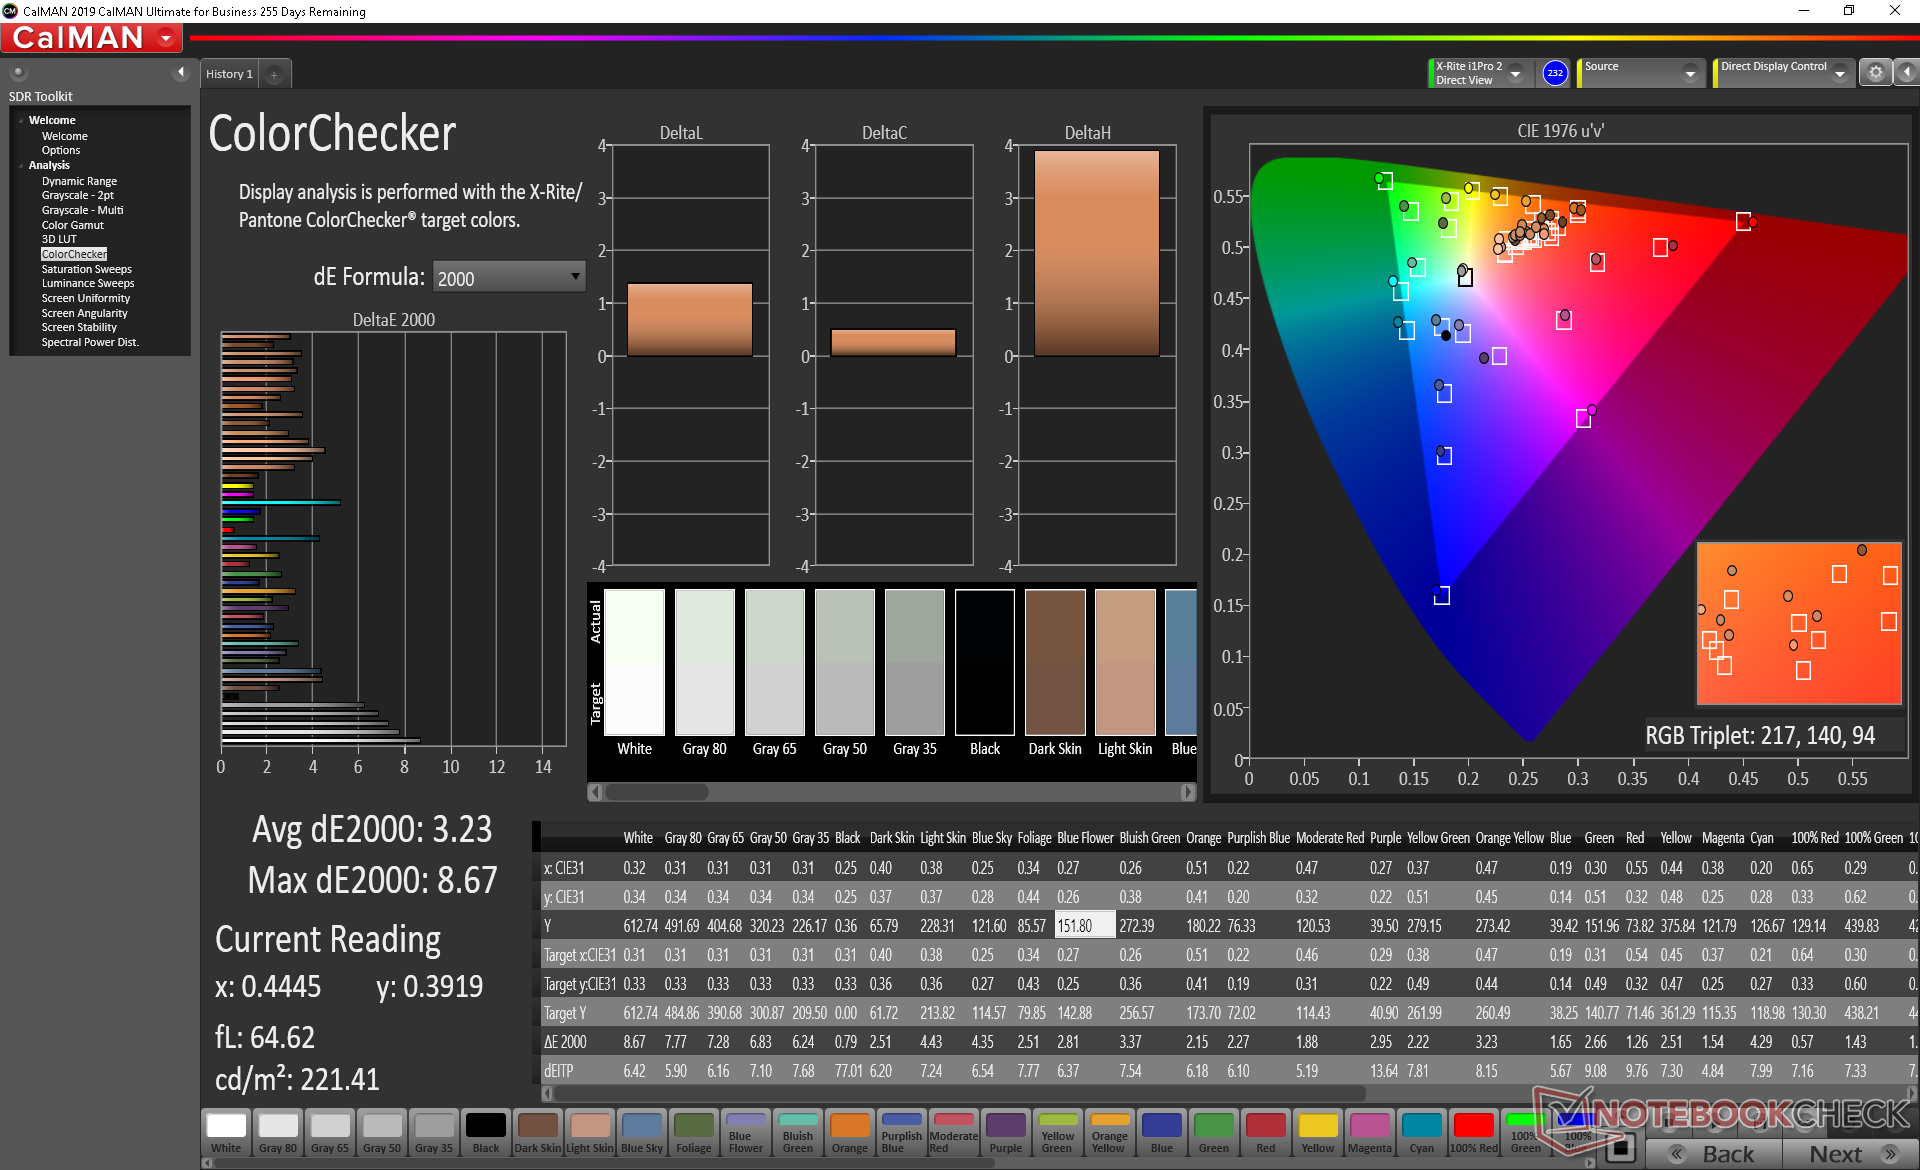
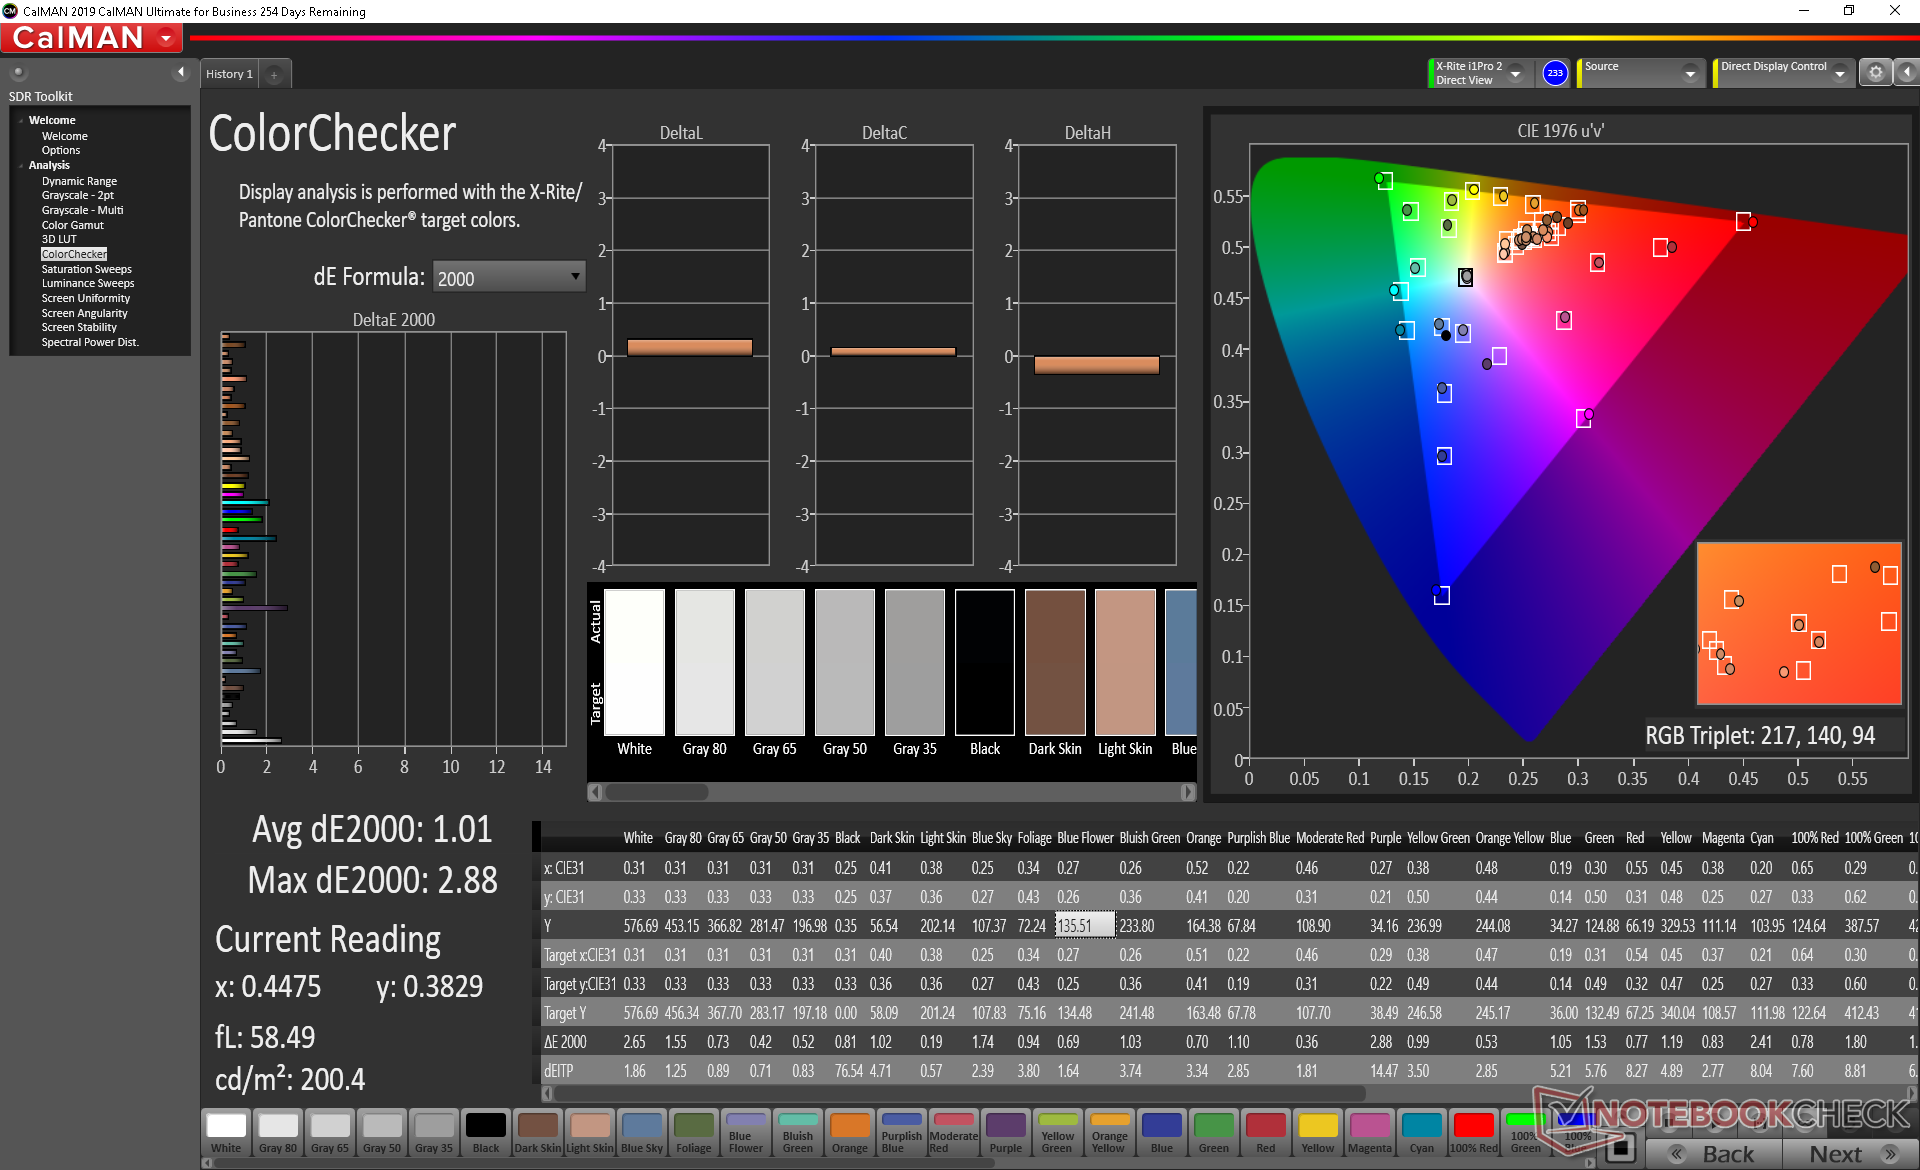
ΔE Color 3.23 | 0.5-29.43 Ø5, calibrated: 1.01
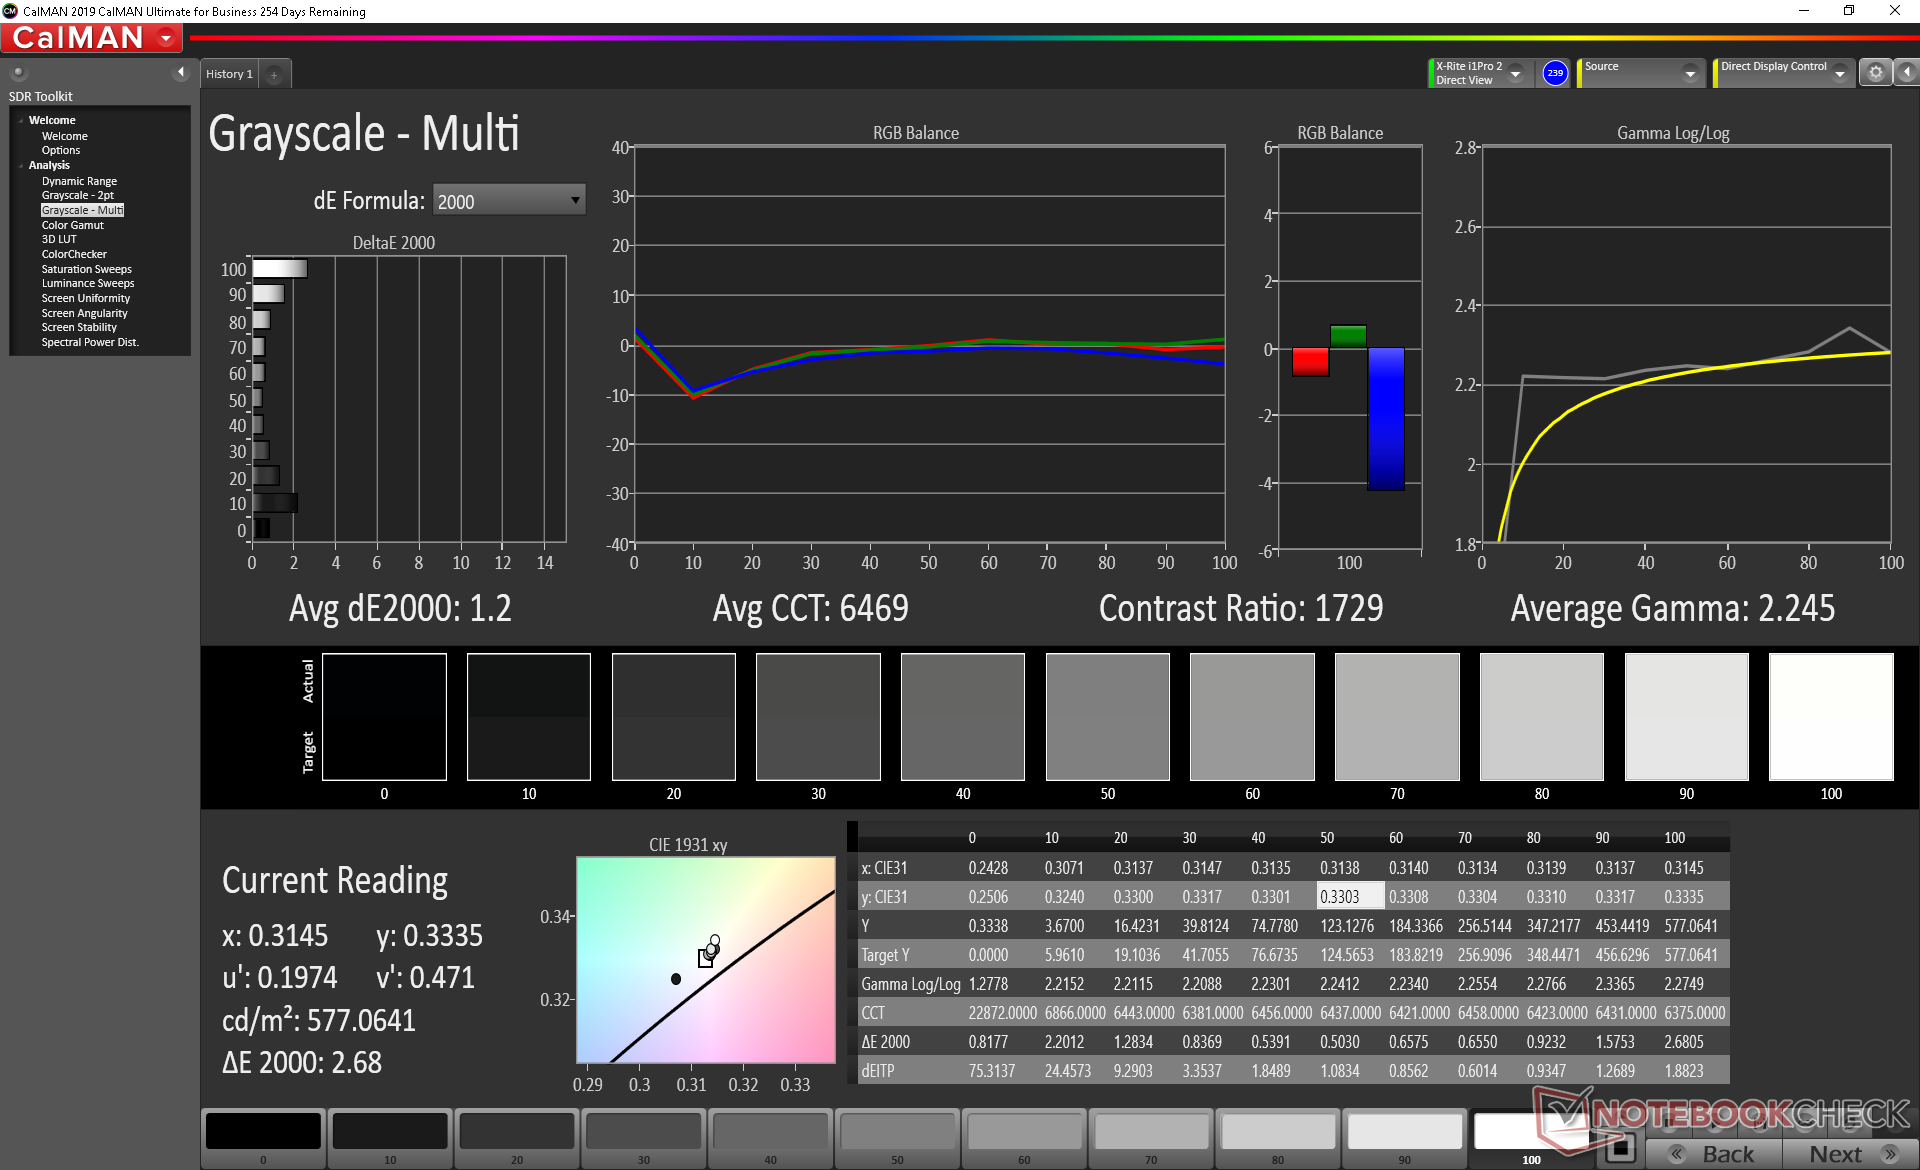
ΔE Greyscale 5.5 | 0.57-98 Ø5.3
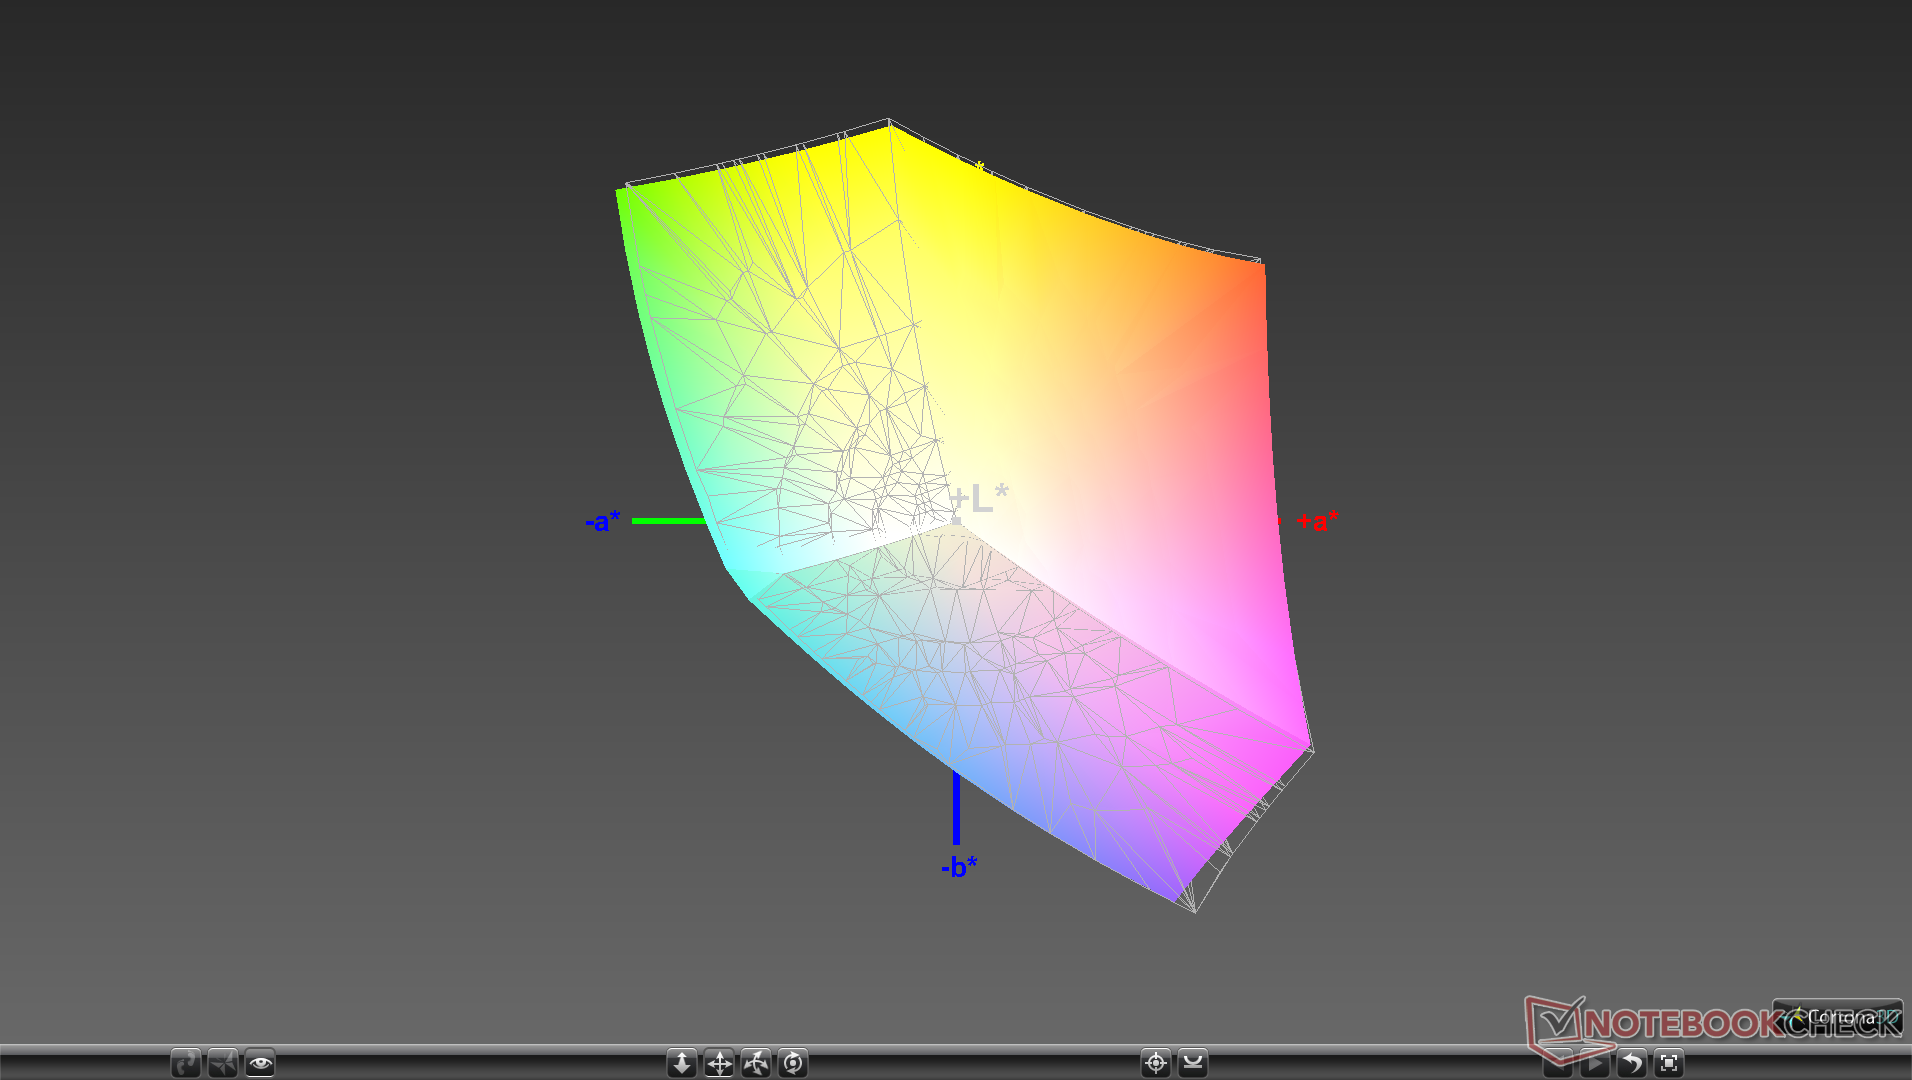
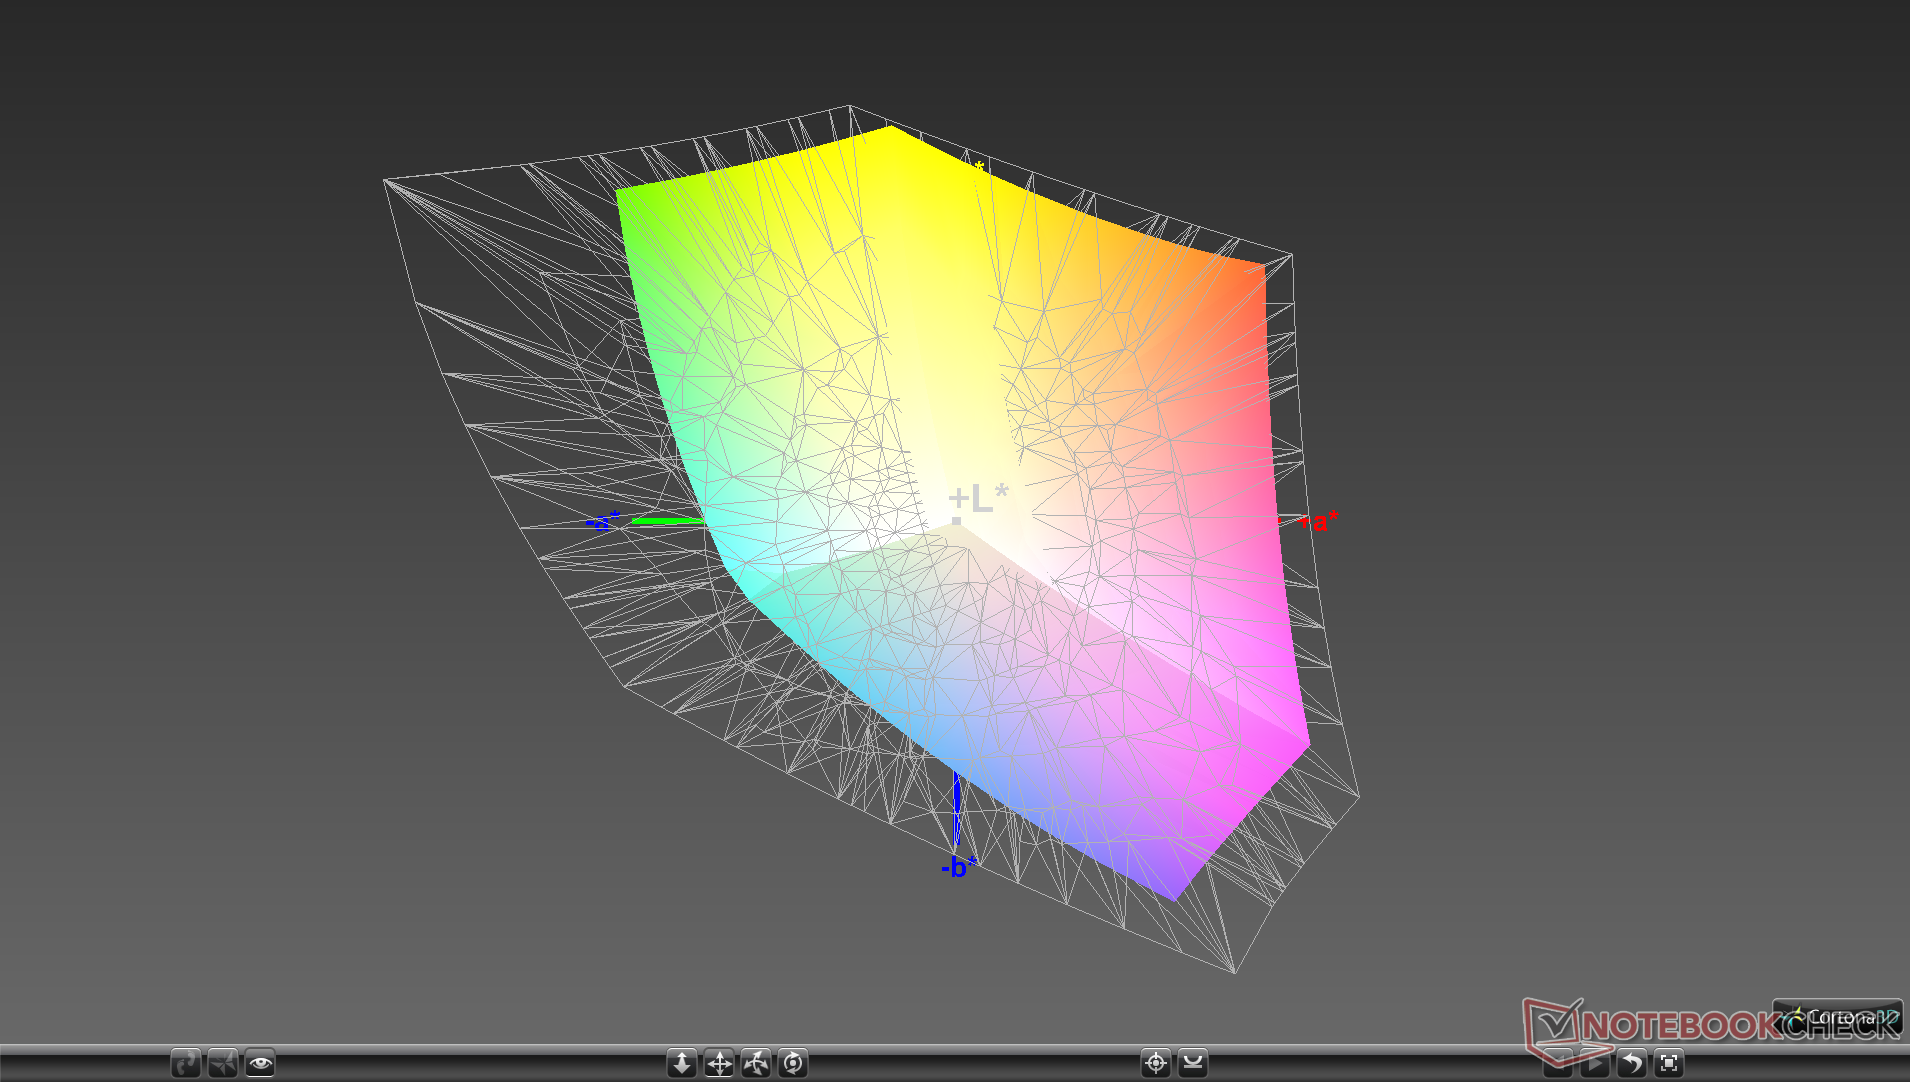
97.5% sRGB (Argyll 1.6.3 3D)
63% AdobeRGB 1998 (Argyll 1.6.3 3D)
68.5% AdobeRGB 1998 (Argyll 2.2.0 3D)
97.3% sRGB (Argyll 2.2.0 3D)
66.3% Display P3 (Argyll 2.2.0 3D)
Gamma: 2.12
| Dell XPS 13 9300 Core i7-1065G7 Sharp LQ134N1, IPS, 13.40, 1920x1200 | Dell XPS 13 7390 Core i7-10710U AU Optronics B133ZAN, Dell P/N: 90NTH, IPS, 13.30, 3840x2160 | Dell XPS 13 7390 2-in-1 Core i7 Sharp LQ134N1, IPS, 13.40, 1920x1200 | Huawei Matebook X Pro i5 Tianma XM, IPS, 13.90, 3000x2000 | Asus ZenBook S13 UX392FN Tianma XM, IPS, 13.90, 1920x1080 | Microsoft Surface Laptop 3 13 Core i5-1035G7 Sharp LQ135P1JX51, IPS, 13.50, 2256x1504 | |
|---|---|---|---|---|---|---|
| Display | -5% | 4% | -1% | 0% | -0% | |
| Display P3 Coverage | 66.3 | 63.4 -4% | 69.9 5% | 65.9 -1% | 67.5 2% | 65.7 -1% |
| sRGB Coverage | 97.3 | 93.7 -4% | 99.2 2% | 95.2 -2% | 95.8 -2% | 98.6 1% |
| AdobeRGB 1998 Coverage | 68.5 | 64.3 -6% | 71.5 4% | 67.6 -1% | 69 1% | 67.8 -1% |
| Response Times | -2% | 6% | 21% | 16% | 242% | |
| Response Time Grey 50% / Grey 80% * | 50 ? | 51.6 ? -3% | 47.6 ? 5% | 40.4 ? 19% | 47.2 ? 6% | 59.2 ? -18% |
| Response Time Black / White * | 33.2 ? | 33.6 ? -1% | 29.2 ? 12% | 25.6 ? 23% | 24.8 ? 25% | 41.6 ? -25% |
| PWM Frequency | 2500 ? | 2500 ? 0% | 21740 ? 770% | |||
| Bildschirm | -30% | 7% | -9% | 2% | 13% | |
| Helligkeit Bildmitte | 607.6 | 408.2 -33% | 549.8 -10% | 442.7 -27% | 466 -23% | 403.4 -34% |
| Brightness | 595 | 399 -33% | 520 -13% | 428 -28% | 462 -22% | 397 -33% |
| Brightness Distribution | 96 | 89 -7% | 86 -10% | 84 -12% | 90 -6% | 89 -7% |
| Schwarzwert * | 0.4 | 0.39 2% | 0.39 2% | 0.31 22% | 0.33 17% | 0.34 15% |
| Kontrast | 1519 | 1047 -31% | 1410 -7% | 1428 -6% | 1412 -7% | 1186 -22% |
| Delta E Colorchecker * | 3.23 | 4.6 -42% | 2.12 34% | 2.24 31% | 1.93 40% | 0.94 71% |
| Colorchecker dE 2000 max. * | 8.67 | 11.84 -37% | 3.66 58% | 7.19 17% | 4.26 51% | 2.92 66% |
| Colorchecker dE 2000 calibrated * | 1.01 | 2.03 -101% | 1.37 -36% | 1.11 -10% | 1.99 -97% | 0.99 2% |
| Delta E Graustufen * | 5.5 | 7.5 -36% | 2.6 53% | 9.7 -76% | 1.7 69% | 0.9 84% |
| Gamma | 2.12 104% | 2.12 104% | 2.3 96% | 1.42 155% | 2.15 102% | 2.13 103% |
| CCT | 6413 101% | 7966 82% | 6884 94% | 6227 104% | 6382 102% | 6620 98% |
| Farbraum (Prozent von AdobeRGB 1998) | 63 | 59.5 -6% | 65.4 4% | 61.6 -2% | 62.2 -1% | 62.3 -1% |
| Color Space (Percent of sRGB) | 97.5 | 93.5 -4% | 99.7 2% | 95 -3% | 95.7 -2% | 98.7 1% |
| Durchschnitt gesamt (Programm / Settings) | -12% /
-22% | 6% /
6% | 4% /
-4% | 6% /
3% | 85% /
51% |
* ... kleinere Werte sind besser
Reaktionszeiten (Response Times) des Displays
| ↔ Reaktionszeiten Schwarz zu Weiß | ||
|---|---|---|
| 33.2 ms ... steigend ↗ und fallend ↘ kombiniert | ↗ 16 ms steigend | 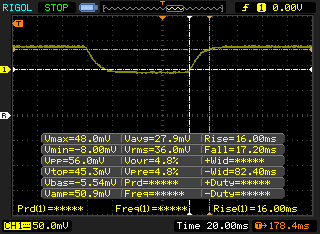 |
| ↘ 17.2 ms fallend | ||
| Die gemessenen Reaktionszeiten sind langsam und dadurch für viele Spieler wahrscheinlich zu langsam. Im Vergleich rangierten die bei uns getesteten Geräte von 0.1 (Minimum) zu 240 (Maximum) ms. » 88 % aller Screens waren schneller als der getestete. Daher sind die gemessenen Reaktionszeiten schlechter als der Durchschnitt aller vermessenen Geräte (21.5 ms). | ||
| ↔ Reaktionszeiten 50% Grau zu 80% Grau | ||
| 50 ms ... steigend ↗ und fallend ↘ kombiniert | ↗ 22 ms steigend | 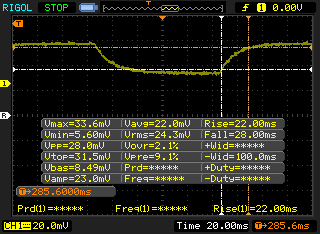 |
| ↘ 28 ms fallend | ||
| Die gemessenen Reaktionszeiten sind langsam und dadurch für viele Spieler wahrscheinlich zu langsam. Im Vergleich rangierten die bei uns getesteten Geräte von 0.2 (Minimum) zu 636 (Maximum) ms. » 84 % aller Screens waren schneller als der getestete. Daher sind die gemessenen Reaktionszeiten schlechter als der Durchschnitt aller vermessenen Geräte (33.7 ms). | ||
Bildschirm-Flackern / PWM (Pulse-Width Modulation)
| Flackern / PWM festgestellt | 2500 Hz | ≤ 25 % Helligkeit | 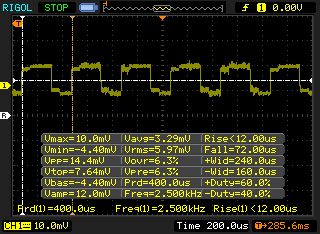 |
Das Display flackert mit 2500 Hz (im schlimmsten Fall, eventuell durch Pulsweitenmodulation PWM) bei einer eingestellten Helligkeit von 25 % und darunter. Darüber sollte es zu keinem Flackern kommen. Die Frequenz von 2500 Hz ist sehr hoch und sollte daher auch bei empfindlichen Personen zu keinen Problemen führen. Im Vergleich: 53 % aller getesteten Geräte nutzten kein PWM um die Helligkeit zu reduzieren. Wenn PWM eingesetzt wurde, dann bei einer Frequenz von durchschnittlich 17900 (Minimum 5, Maximum 3846000) Hz. | |||
Leistung
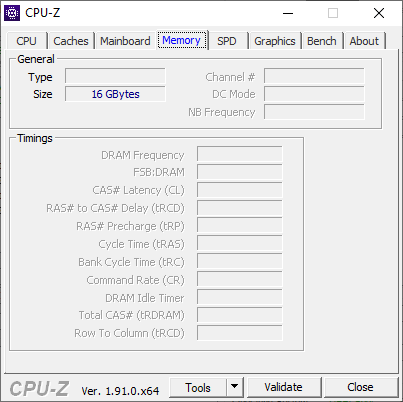
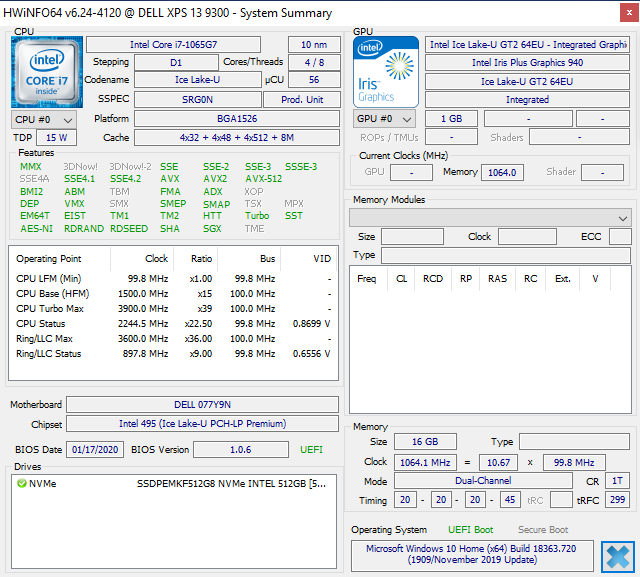
Derzeit ist das XPS 13 9300 entweder mit dem Core i5-1035G1 oder dem Core i7-1065G7 erhältlich, Core-i3- oder Comet-Lake-U-Optionen gibt es nicht. Abwesend sind außerdem auch dedizierte GPU-Optionen, weshalb sich Nutzer zwischen der UHD Graphics G1 und der Iris Plus G7 entscheiden müssen. Beim Arbeitsspeicher hat man die Wahl zwischen 8 und 16 GB verlötetem 3.733-MHz-LPDDR4x-RAM.
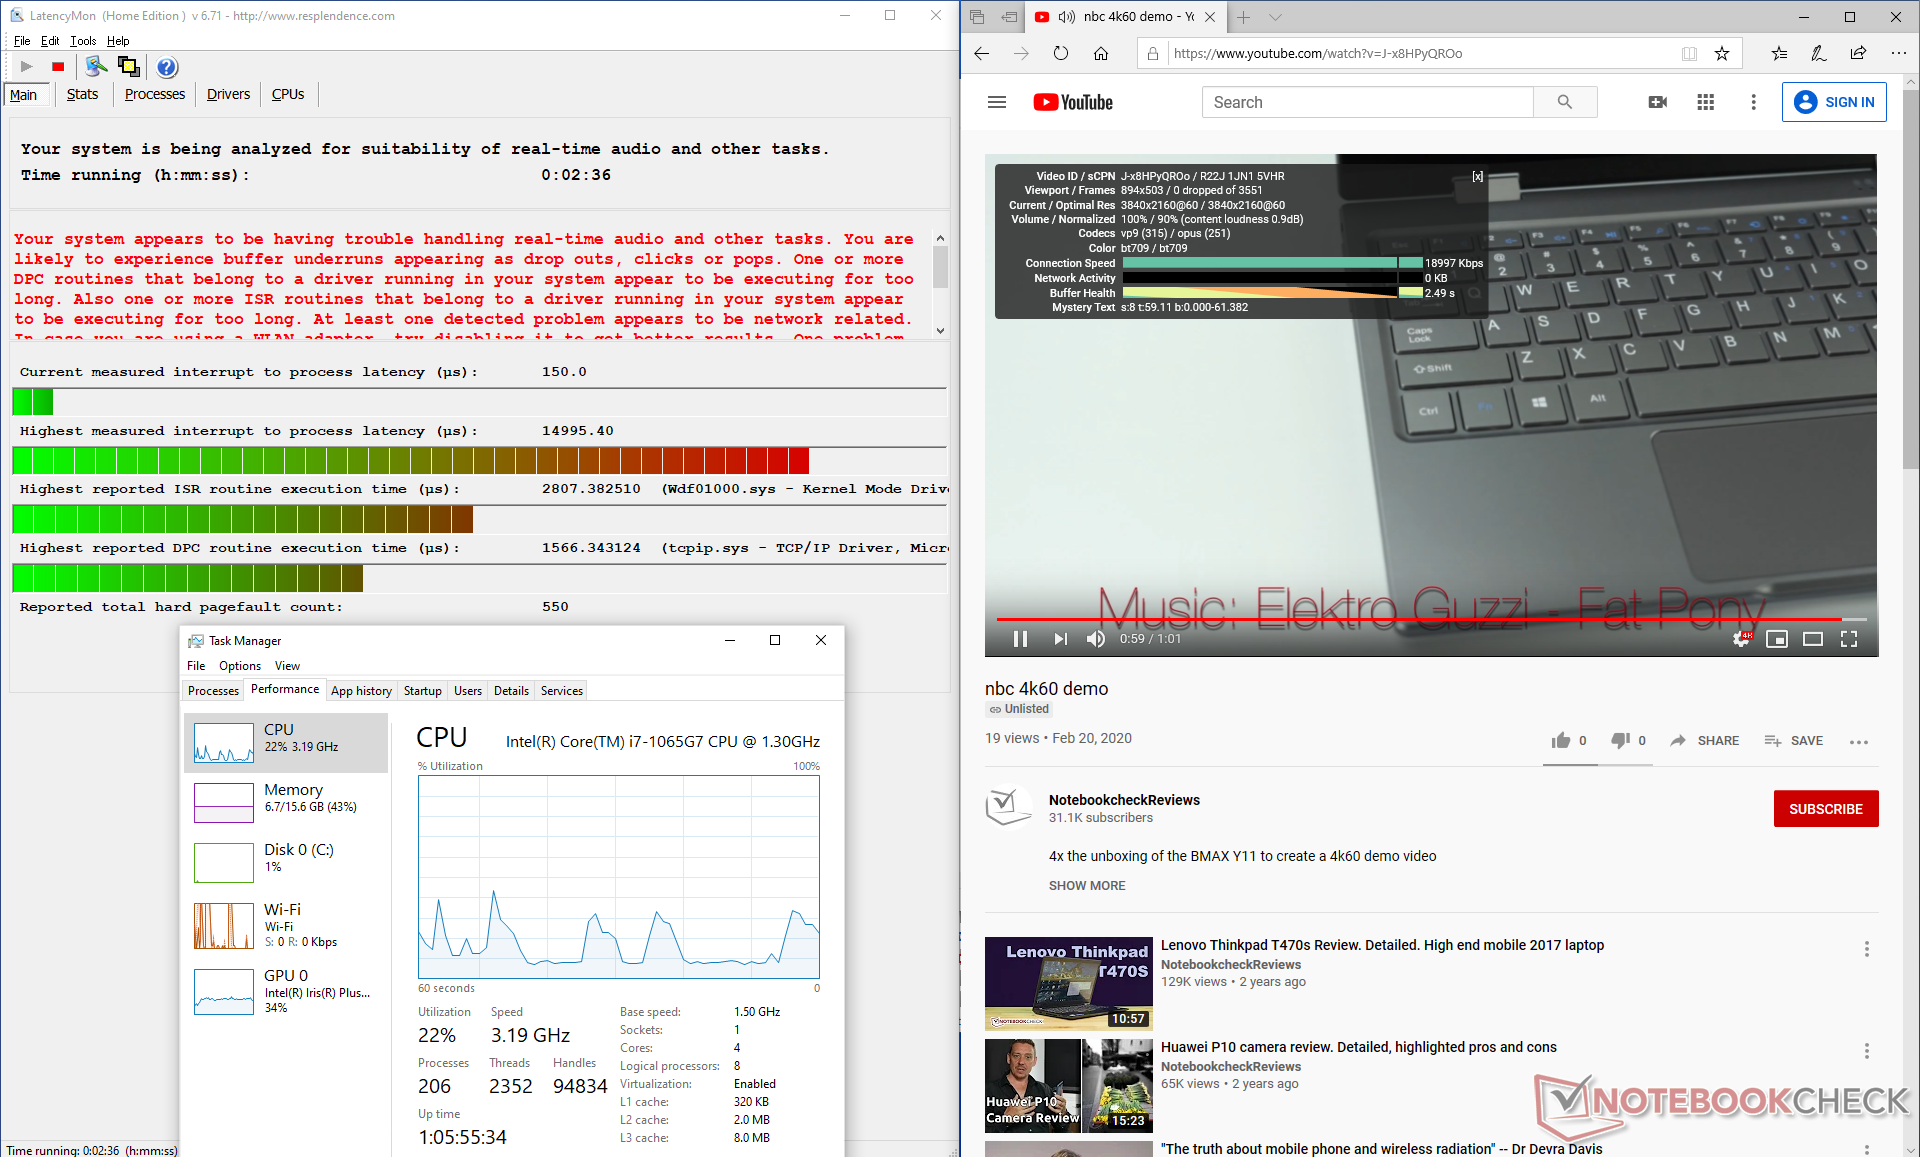
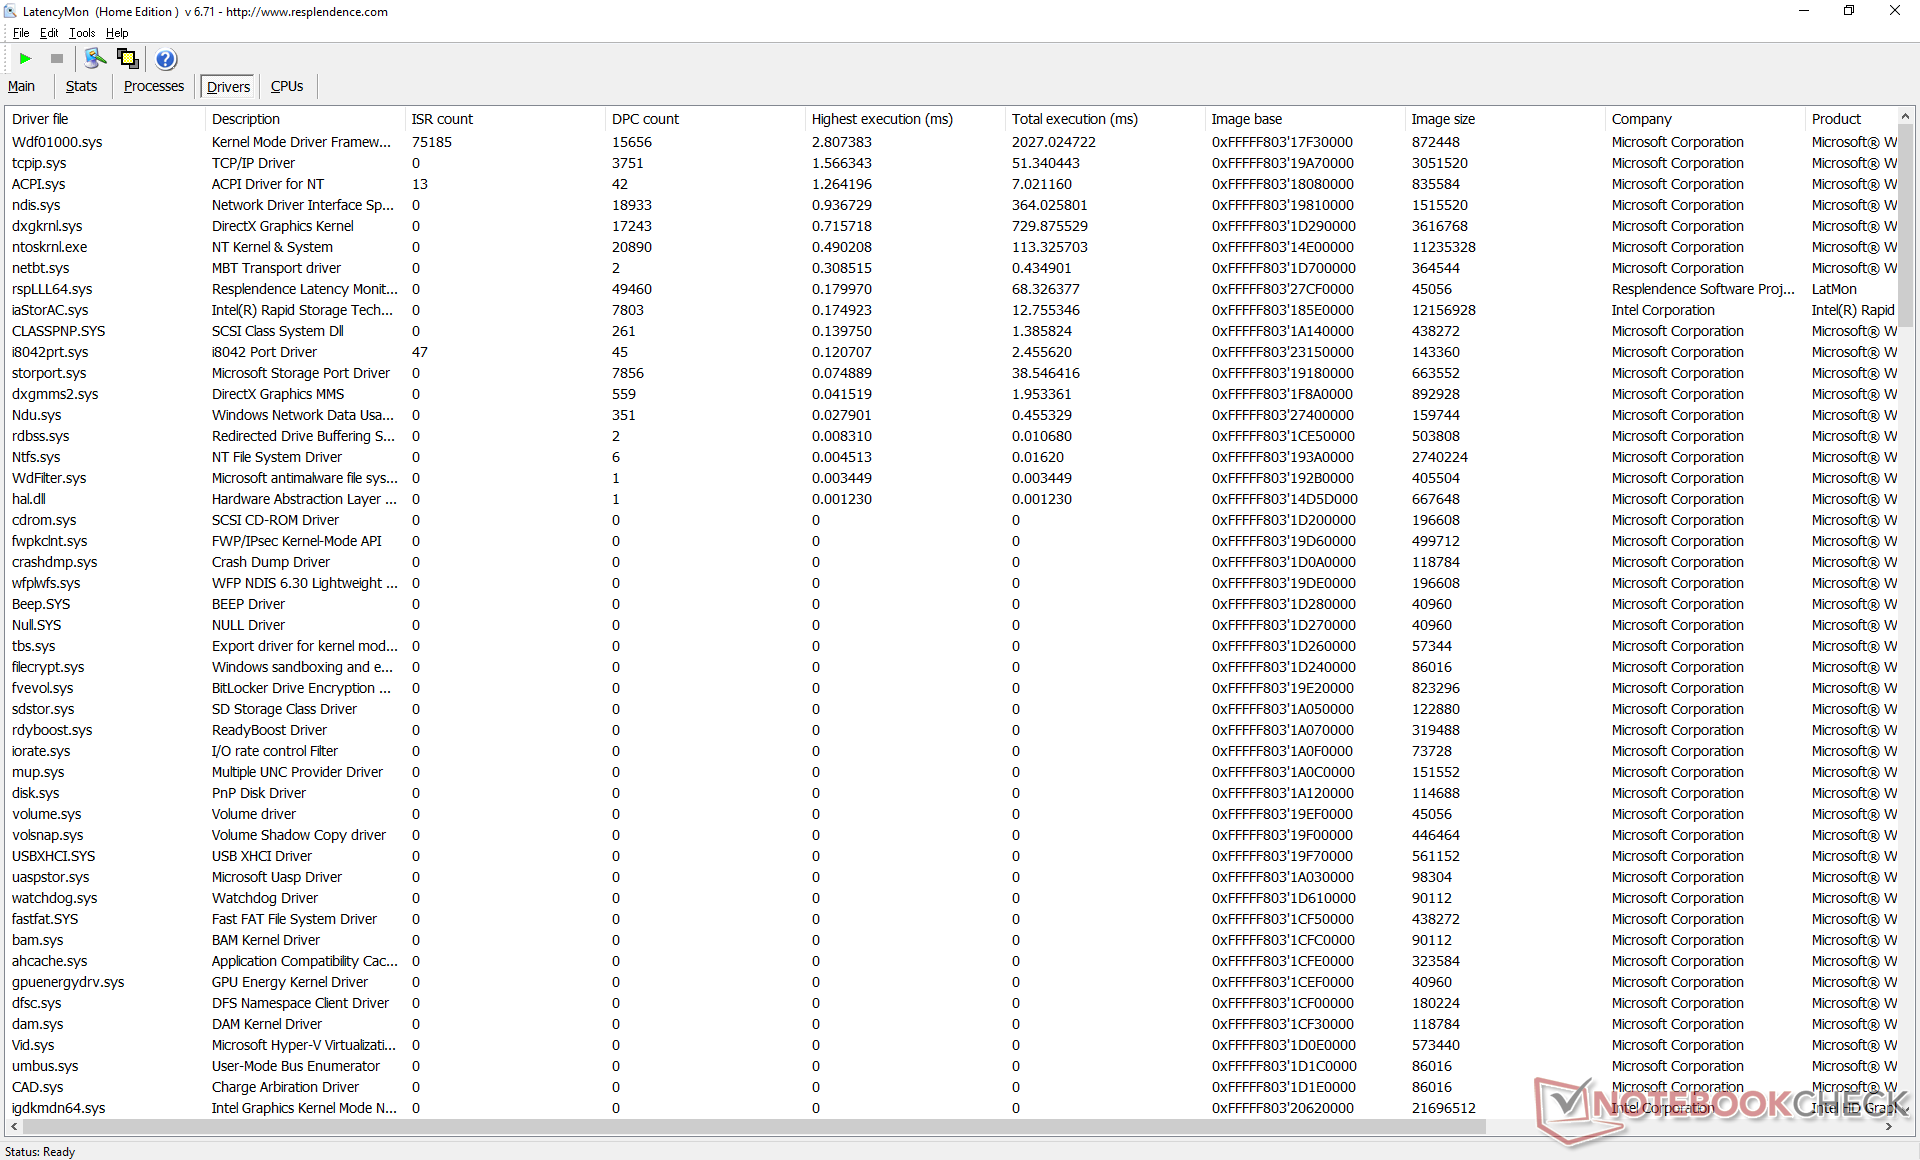
Die DPC-Latenzen unseres Testgeräts werden problematisch, wenn man nacheinander im Browser mehrere Tabs öffnet, ein 4K60-YouTube-Video abspielt und anschließend Prime95 ausführt.
Prozessor
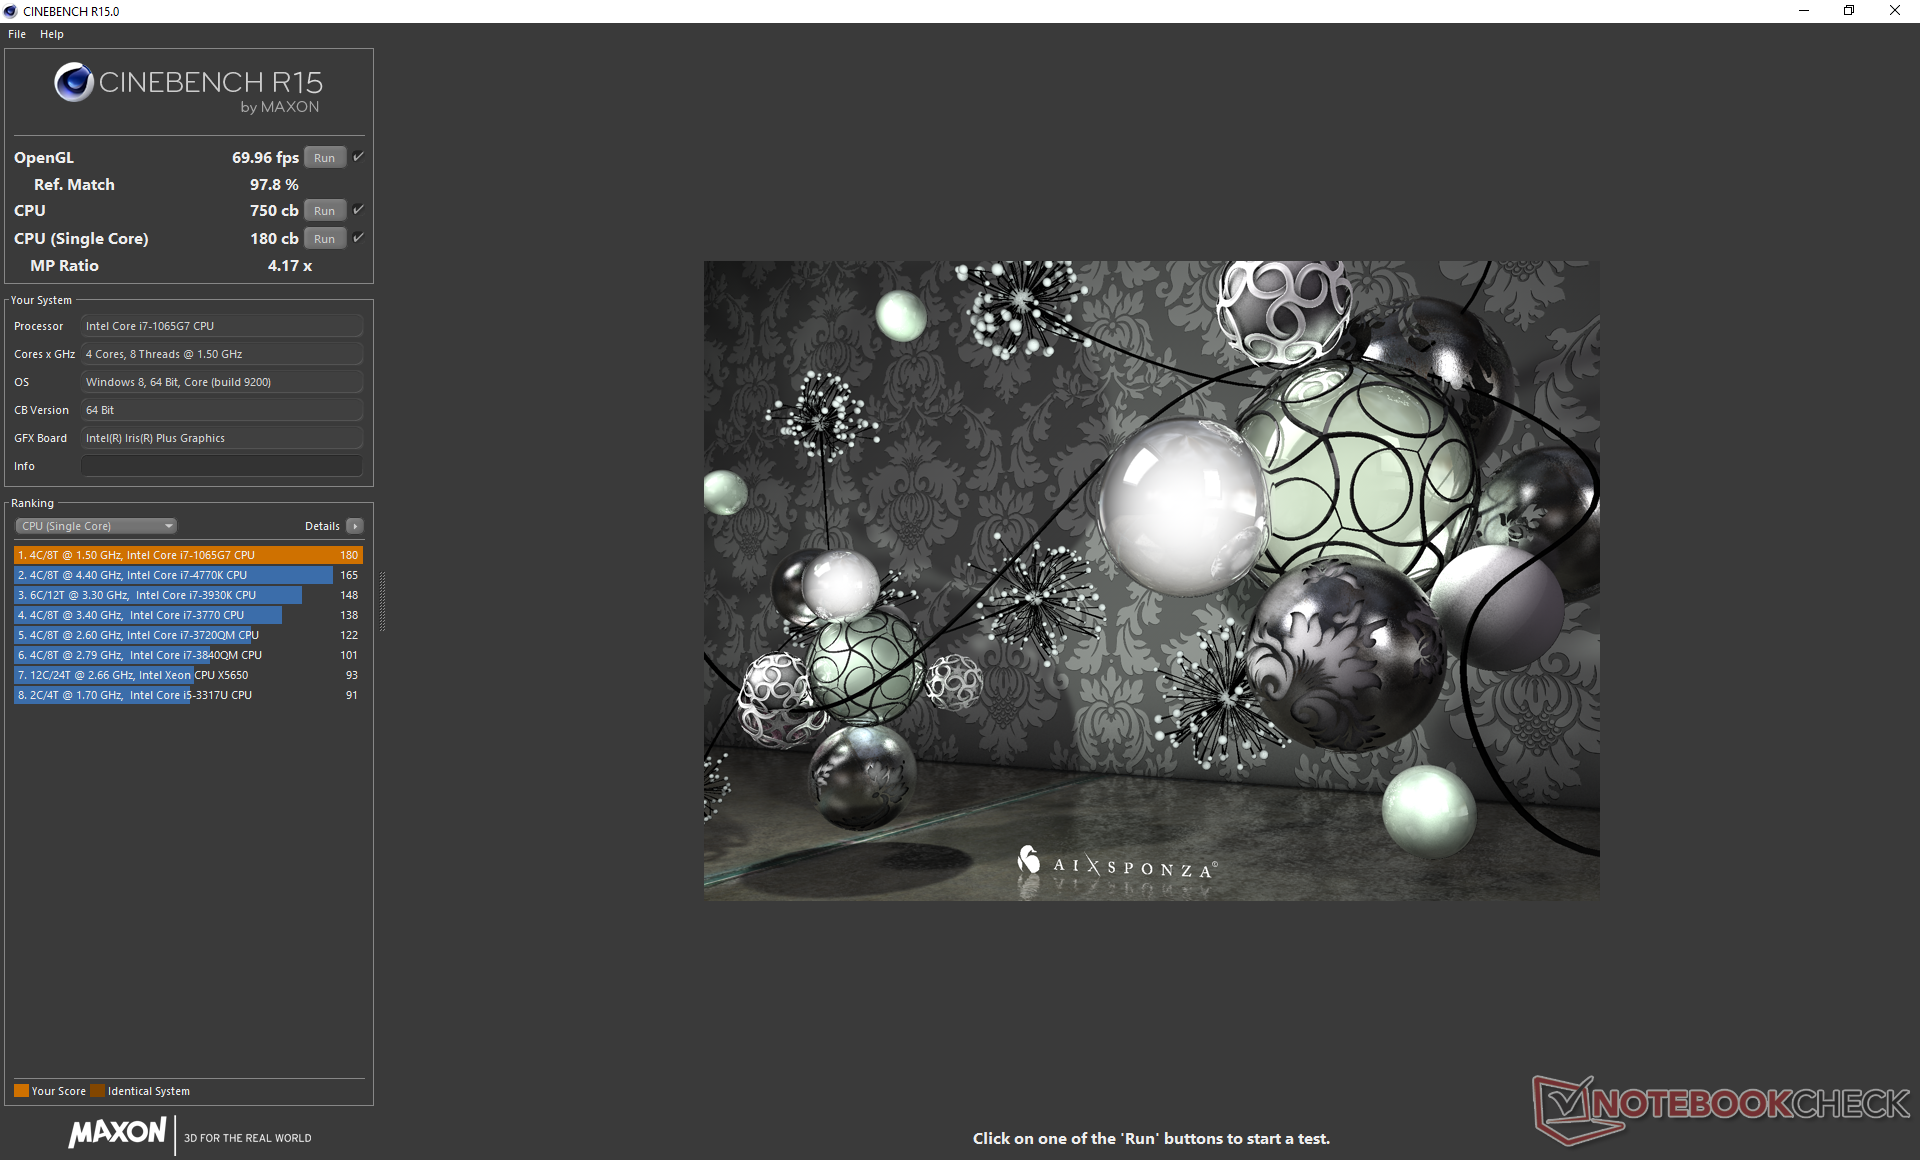
Um sicherzustellen, dass unser Testgerät sein maximales Potenzial entfalten kann, haben wir das System über die vorinstallierte Dell-Power-Manager-Software vor dem Durchführen der unten beschriebenen Tests in den Ultra-Performance-Modus versetzt. Die Cinebench-Ergebnisse sind um ca. 9 bis 17 Prozent besser als bei einem durchschnittlichen Core i7-1065G7 in unserer Datenbank, die noch mindestens 13 Vergleichslaptops beinhaltet. Da Ultrabooks unter Dauerlast im Laufe der Zeit oft ihre Leistung drosseln, benötigt dieses Ergebnis zusätzlichen Kontext. Um eine aussagekräftigere Situation zu simulieren, haben wir den Multi-Thread-Test von Cinebench R15 in einer Schleife laufen lassen, wie das Diagramm unten zeigt. Dabei fällt die ursprüngliche Punktzahl von 811 Punkten im Laufe der Zeit auf ungefähr 610 Punkte ab, was einem 25-prozentigen Leistungsabfall entspricht. Interessant ist auch, dass die Punktzahlen zwischen ~560 und ~660 Punkten schwanken, was auf instabile CPU-Taktfrequenzen in extremen Lastsituationen hindeutet.
Vor allem dann, wenn der Prozessor kalt ist, ist die CPU-Leistung aufgrund der höheren Turbo-Boost-Frequenzen insgesamt besser als beim Core i7-8565U. Dieser Vorsprung relativiert sich jedoch, sobald die CPU einen bestimmten Temperaturbereich erreicht, in dem die Taktfrequenz zu schwanken beginnt.
Weitere technische Informationen und Benchmarkvergleiche finden Sie auf unserer Seite zum Core i7-1065G7. Der Sechskernprozessor Core i7-10710U bietet eine höhere Multi-Thread-Leistung, allerdings steht dieser aktuell nur beim XPS 13 7390 zur Auswahl.
| wPrime 2.10 - 1024m | |
| Dell XPS 13 7390 2-in-1 Core i3 | |
| Microsoft Surface Pro 7 Core i5-1035G4 | |
| Durchschnittliche Intel Core i7-1065G7 (233 - 354, n=3) | |
| Dell XPS 13 7390 Core i7-10710U | |
* ... kleinere Werte sind besser
System Performance
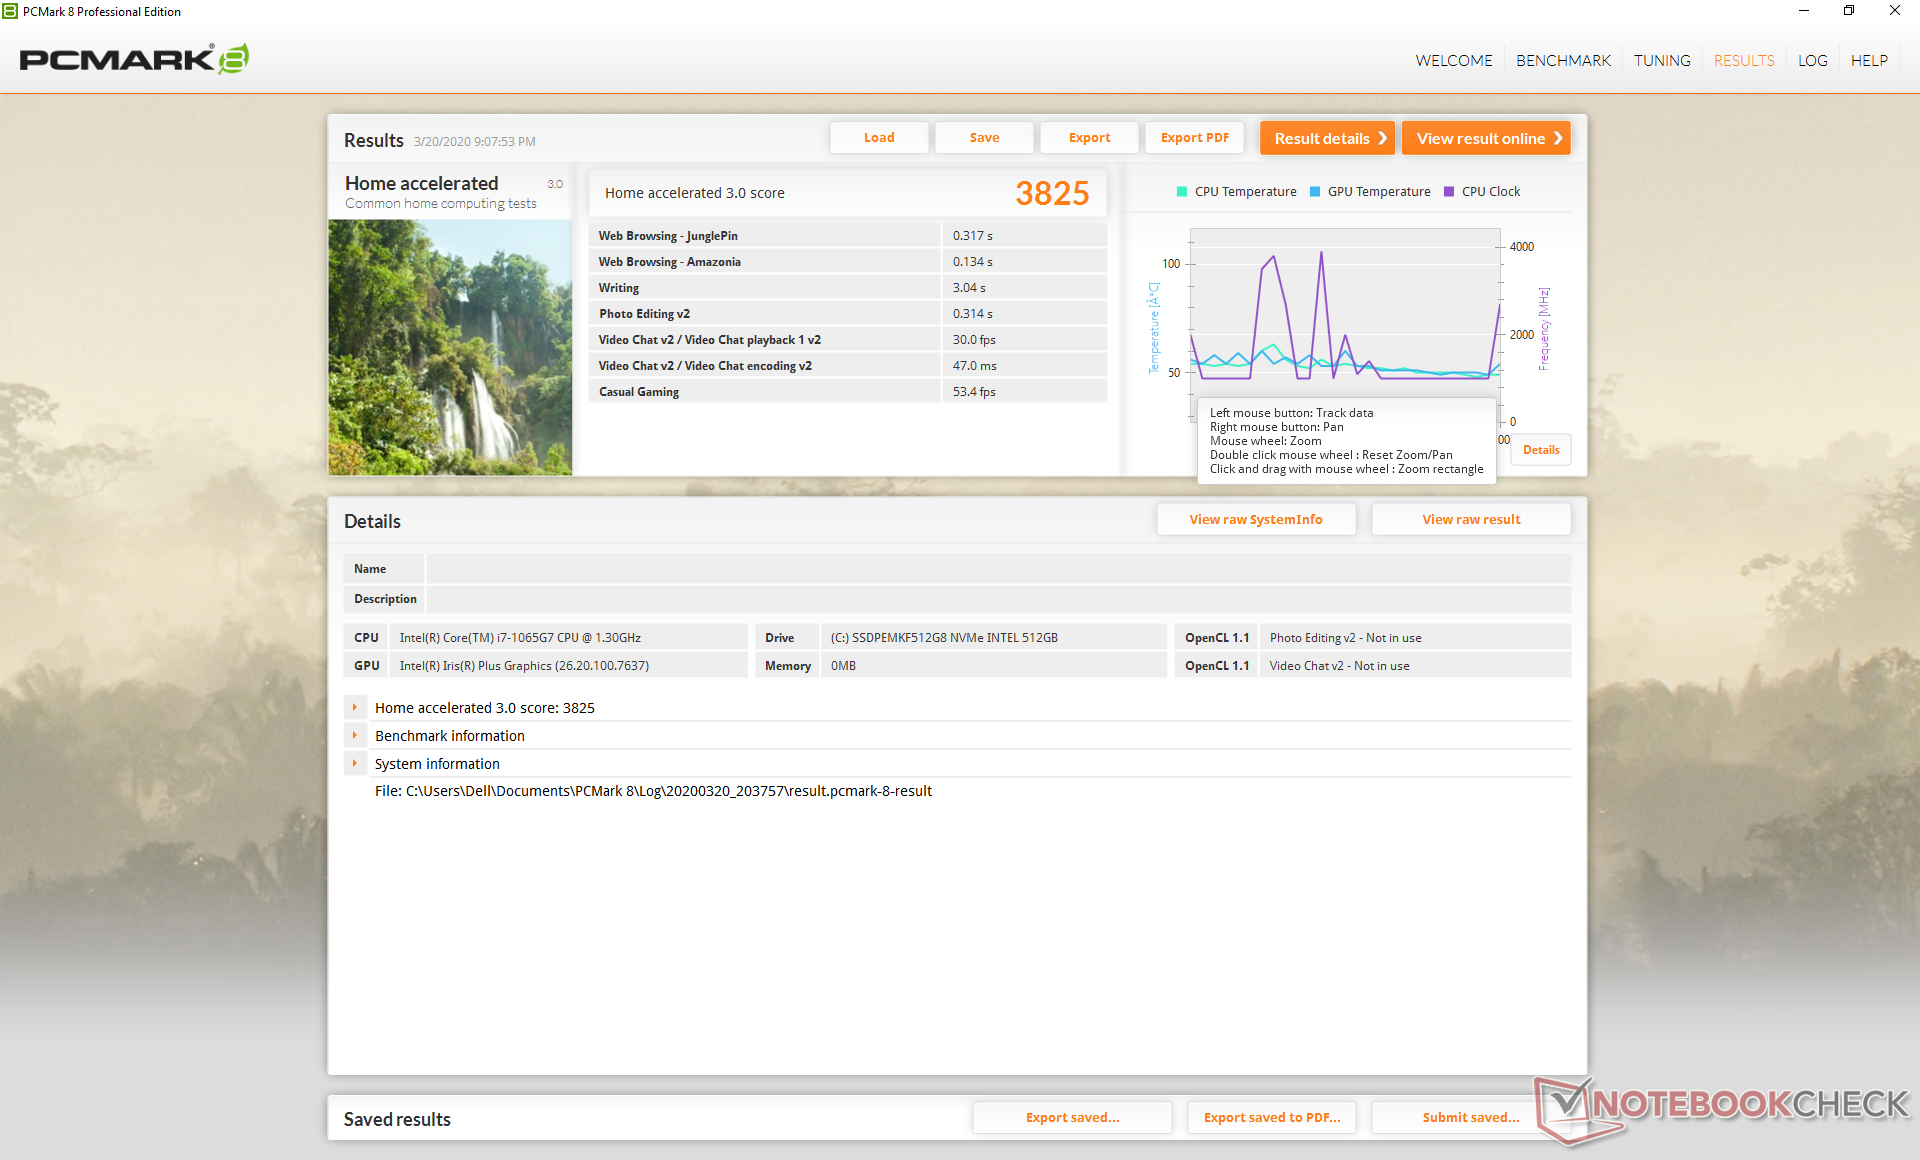
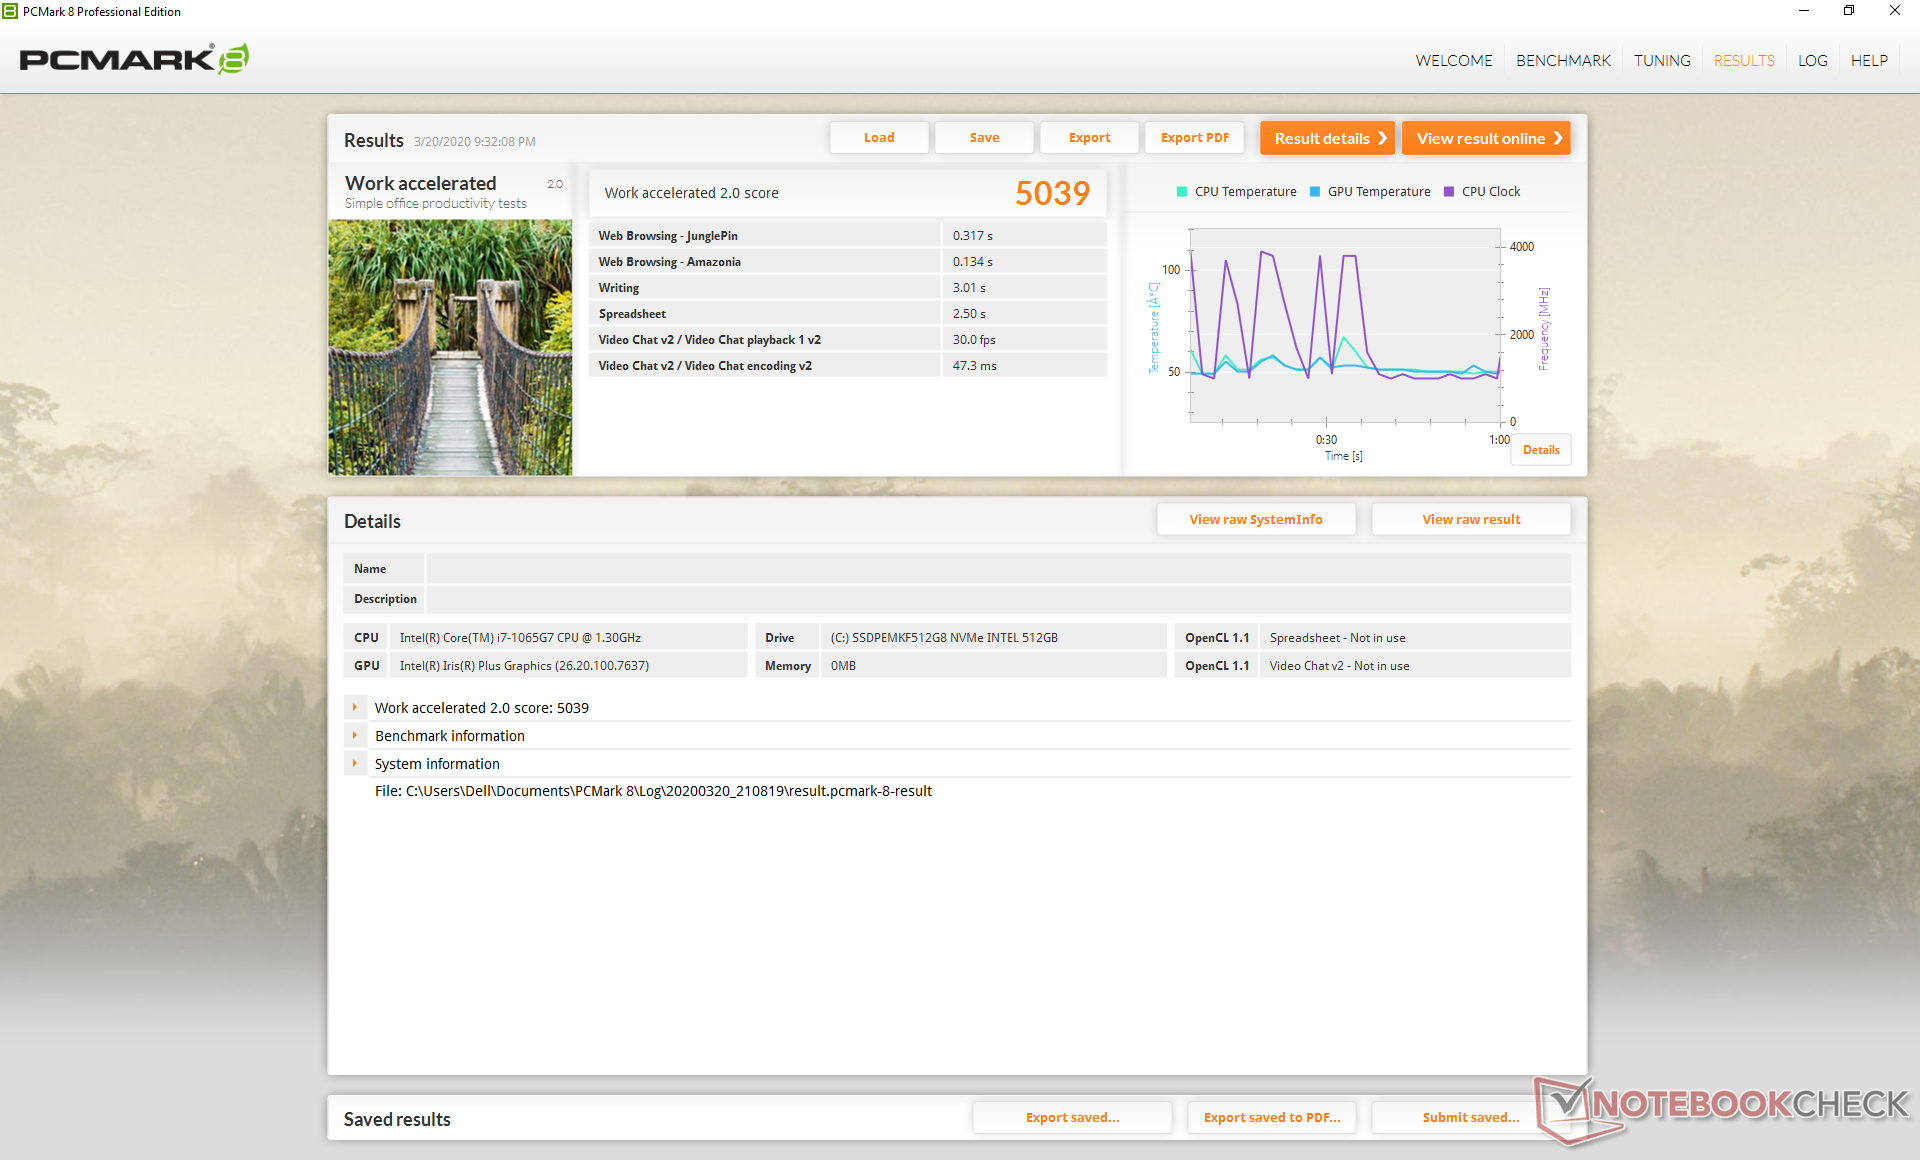
| PCMark 8 Home Score Accelerated v2 | 3825 Punkte | |
| PCMark 8 Work Score Accelerated v2 | 5039 Punkte | |
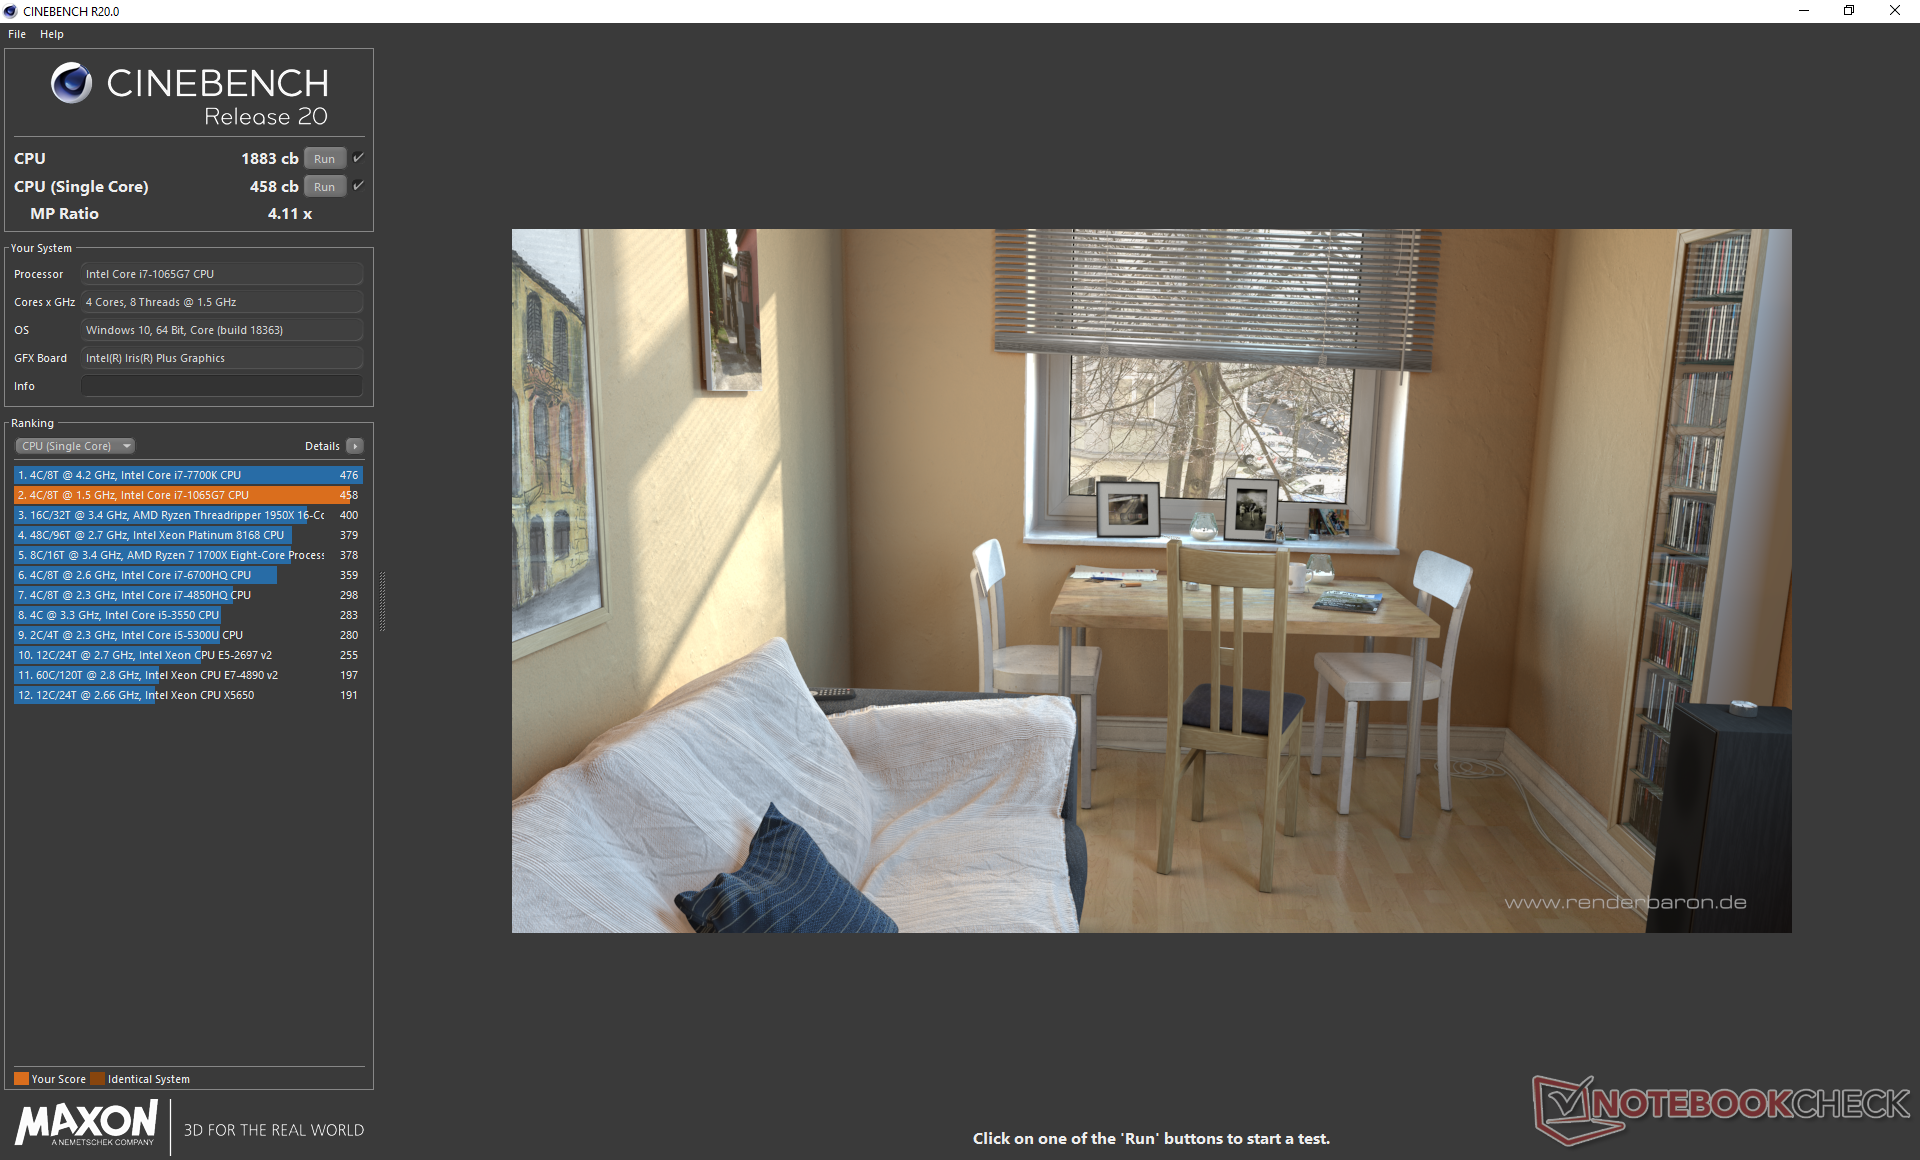
| PCMark 10 Score | 4154 Punkte | |
Hilfe | ||
Massenspeicher
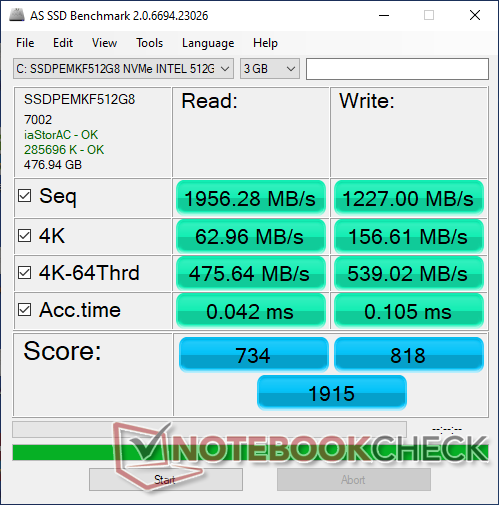
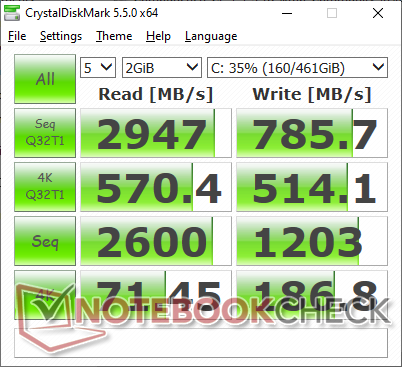
Im Gegensatz zu unserem ersten XPS 13 9300 Core i5, das mit einer 512-GB-Toshiba-SSD ausgestattet war, verfügt dieses XPS 13 9300 Core i7 über eine 512-GB-SSD von Intel. Laut CrystalDiskMark und AS SSD sind die sequenziellen Lese- und Schreibraten der zwei Modelle ähnlich, allerdings ist die Toshiba-SSD beim Zugriff auf höhere Warteschlangentiefen deutlich schneller.
Weitere Benchmarkvergleiche finden Sie in unserer Festplatten- und SSD-Tabelle.
| Dell XPS 13 9300 Core i7-1065G7 Intel SSDPEMKF512G8 NVMe SSD | Dell XPS 13 7390 Core i7-10710U SK Hynix PC601 NVMe 512 GB | Dell XPS 13 7390 2-in-1 Core i7 Toshiba BG4 KBG40ZPZ512G | Microsoft Surface Laptop 3 13 Core i5-1035G7 SK hynix BC501 HFM256GDGTNG | Asus ZenBook S13 UX392FN WDC PC SN520 SDAPNUW-512G | |
|---|---|---|---|---|---|
| AS SSD | 30% | -20% | -23% | 39% | |
| Seq Read | 1956 | 1804 -8% | 1801 -8% | 1387 -29% | 1224 -37% |
| Seq Write | 1227 | 1000 -19% | 1125 -8% | 504 -59% | 907 -26% |
| 4K Read | 63 | 45.1 -28% | 39.7 -37% | 42.35 -33% | 41.46 -34% |
| 4K Write | 156.6 | 115 -27% | 67 -57% | 120 -23% | 126.2 -19% |
| 4K-64 Read | 475.6 | 893 88% | 1253 163% | 497.4 5% | 1021 115% |
| 4K-64 Write | 539 | 732 36% | 209 -61% | 354.9 -34% | 1251 132% |
| Access Time Read * | 0.042 | 0.044 -5% | 0.069 -64% | 0.055 -31% | 0.053 -26% |
| Access Time Write * | 0.105 | 0.095 10% | 0.625 -495% | 0.093 11% | 0.027 74% |
| Score Read | 734 | 1119 52% | 1472 101% | 678 -8% | 1185 61% |
| Score Write | 818 | 947 16% | 388 -53% | 525 -36% | 1468 79% |
| Score Total | 1915 | 2608 36% | 2583 35% | 1520 -21% | 3250 70% |
| Copy ISO MB/s | 1022 | 1515 48% | 1293 27% | 764 -25% | 1404 37% |
| Copy Program MB/s | 302.8 | 535 77% | 560 85% | 256.1 -15% | 402.4 33% |
| Copy Game MB/s | 491.4 | 1211 146% | 927 89% | 368.4 -25% | 902 84% |
| CrystalDiskMark 5.2 / 6 | 12% | -13% | -35% | -9% | |
| Write 4K | 186.8 | 134 -28% | 106.7 -43% | 112.3 -40% | 149.2 -20% |
| Read 4K | 71.4 | 42.91 -40% | 49.94 -30% | 42.13 -41% | 47.18 -34% |
| Write Seq | 1203 | 1841 53% | 1223 2% | 630 -48% | 750 -38% |
| Read Seq | 2600 | 1707 -34% | 1801 -31% | 1023 -61% | 1137 -56% |
| Write 4K Q32T1 | 514 | 394.7 -23% | 325.3 -37% | 336.6 -35% | 749 46% |
| Read 4K Q32T1 | 570 | 398.5 -30% | 551 -3% | 399.6 -30% | 478.7 -16% |
| Write Seq Q32T1 | 786 | 2250 186% | 1224 56% | 821 4% | 1453 85% |
| Read Seq Q32T1 | 2947 | 3265 11% | 2350 -20% | 2030 -31% | 1713 -42% |
| Durchschnitt gesamt (Programm / Settings) | 21% /
24% | -17% /
-18% | -29% /
-28% | 15% /
21% |
* ... kleinere Werte sind besser

Grafikkarte
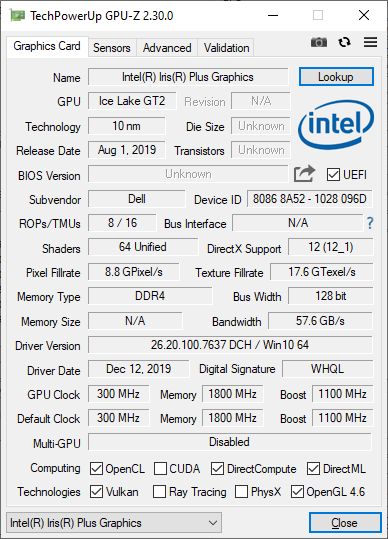
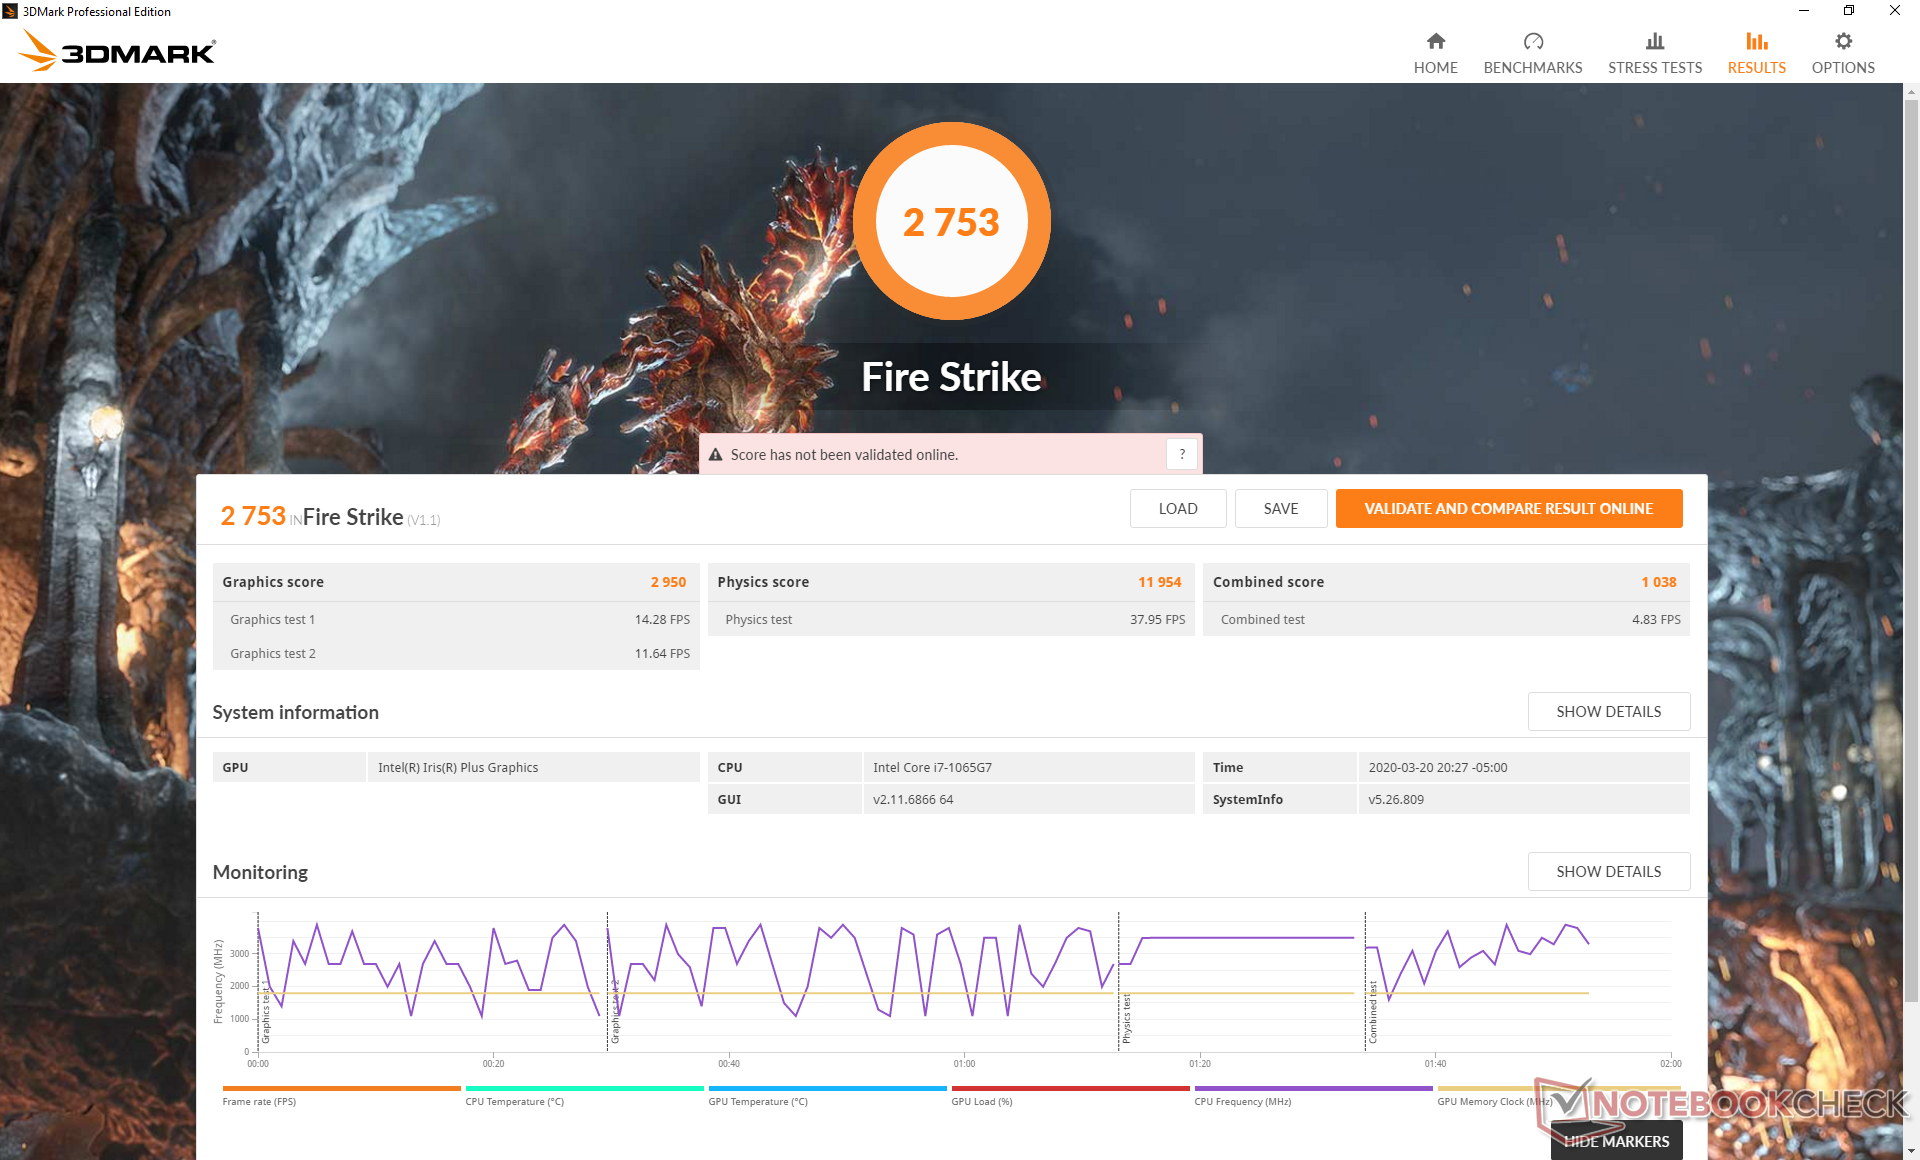
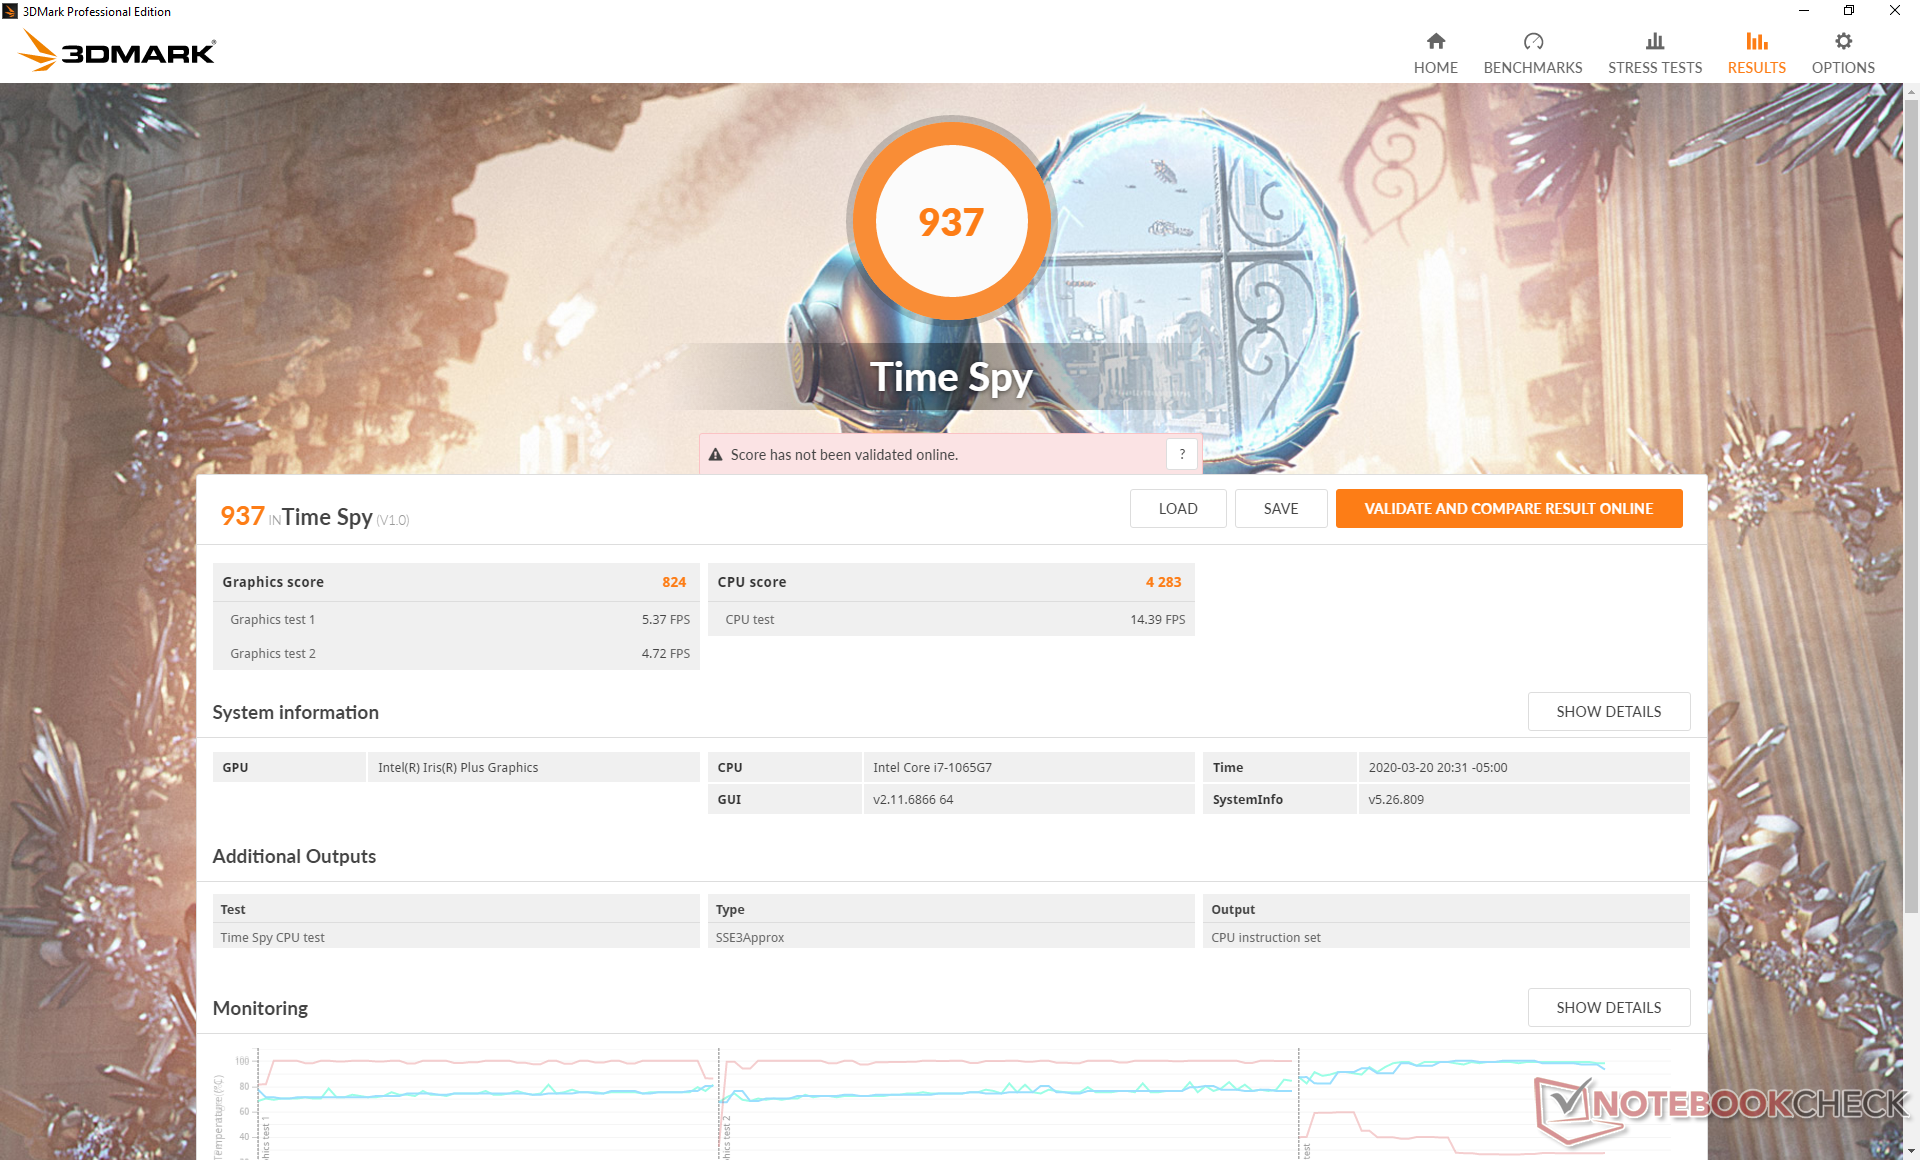
Obwohl die Spieleleistung deutlich besser ausfällt als mit der veralteten UHD-Graphics 620, ist sie im Vergleich zur konkurrierenden RX-Vega-8- und Vega-10- Reihe trotzdem enttäuschend. In synthetischen Benchmarks wie 3DMark liegt die Iris Plus G7 zwar scheinbar gleichauf mit der RX Vega 10, praktische Gaming-Benchmarks zeigen jedoch, dass die AMD-Lösung die neuere Intel-Lösung in bestimmten Spielen schlägt.
Möglicherweise bedeutender ist der große Sprung in Sachen Grafikleistung, der beim Core-i7-1065G7-Modell gegenüber dem XPS 13 Core i5-1035G1 ca. 70 Prozent beträgt und das Core-i7-Modell für diejenigen, die die maximale Leistung aus Intel-Ice-Lake herausholen möchten, durchaus interessant macht.
Weitere Benchmarkvergleiche finden Sie auf unserer Seite zur Iris Plus G7.
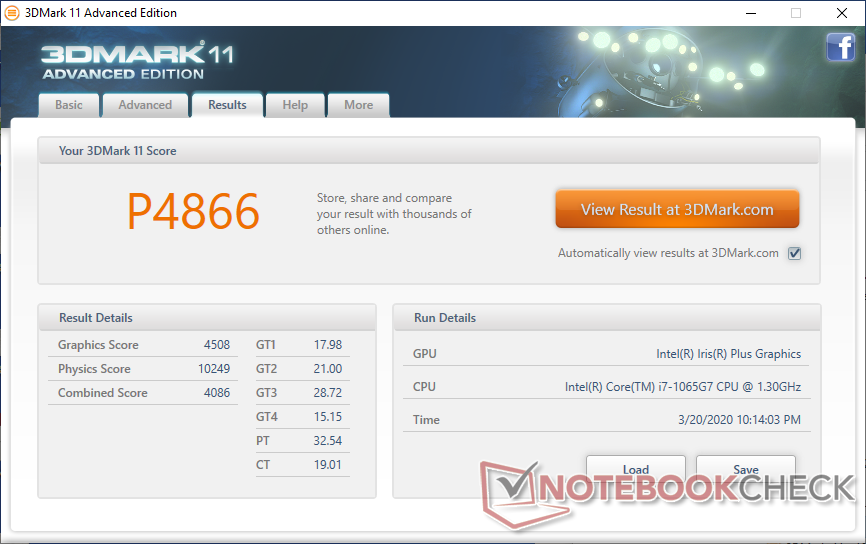
| 3DMark 11 Performance | 4866 Punkte | |
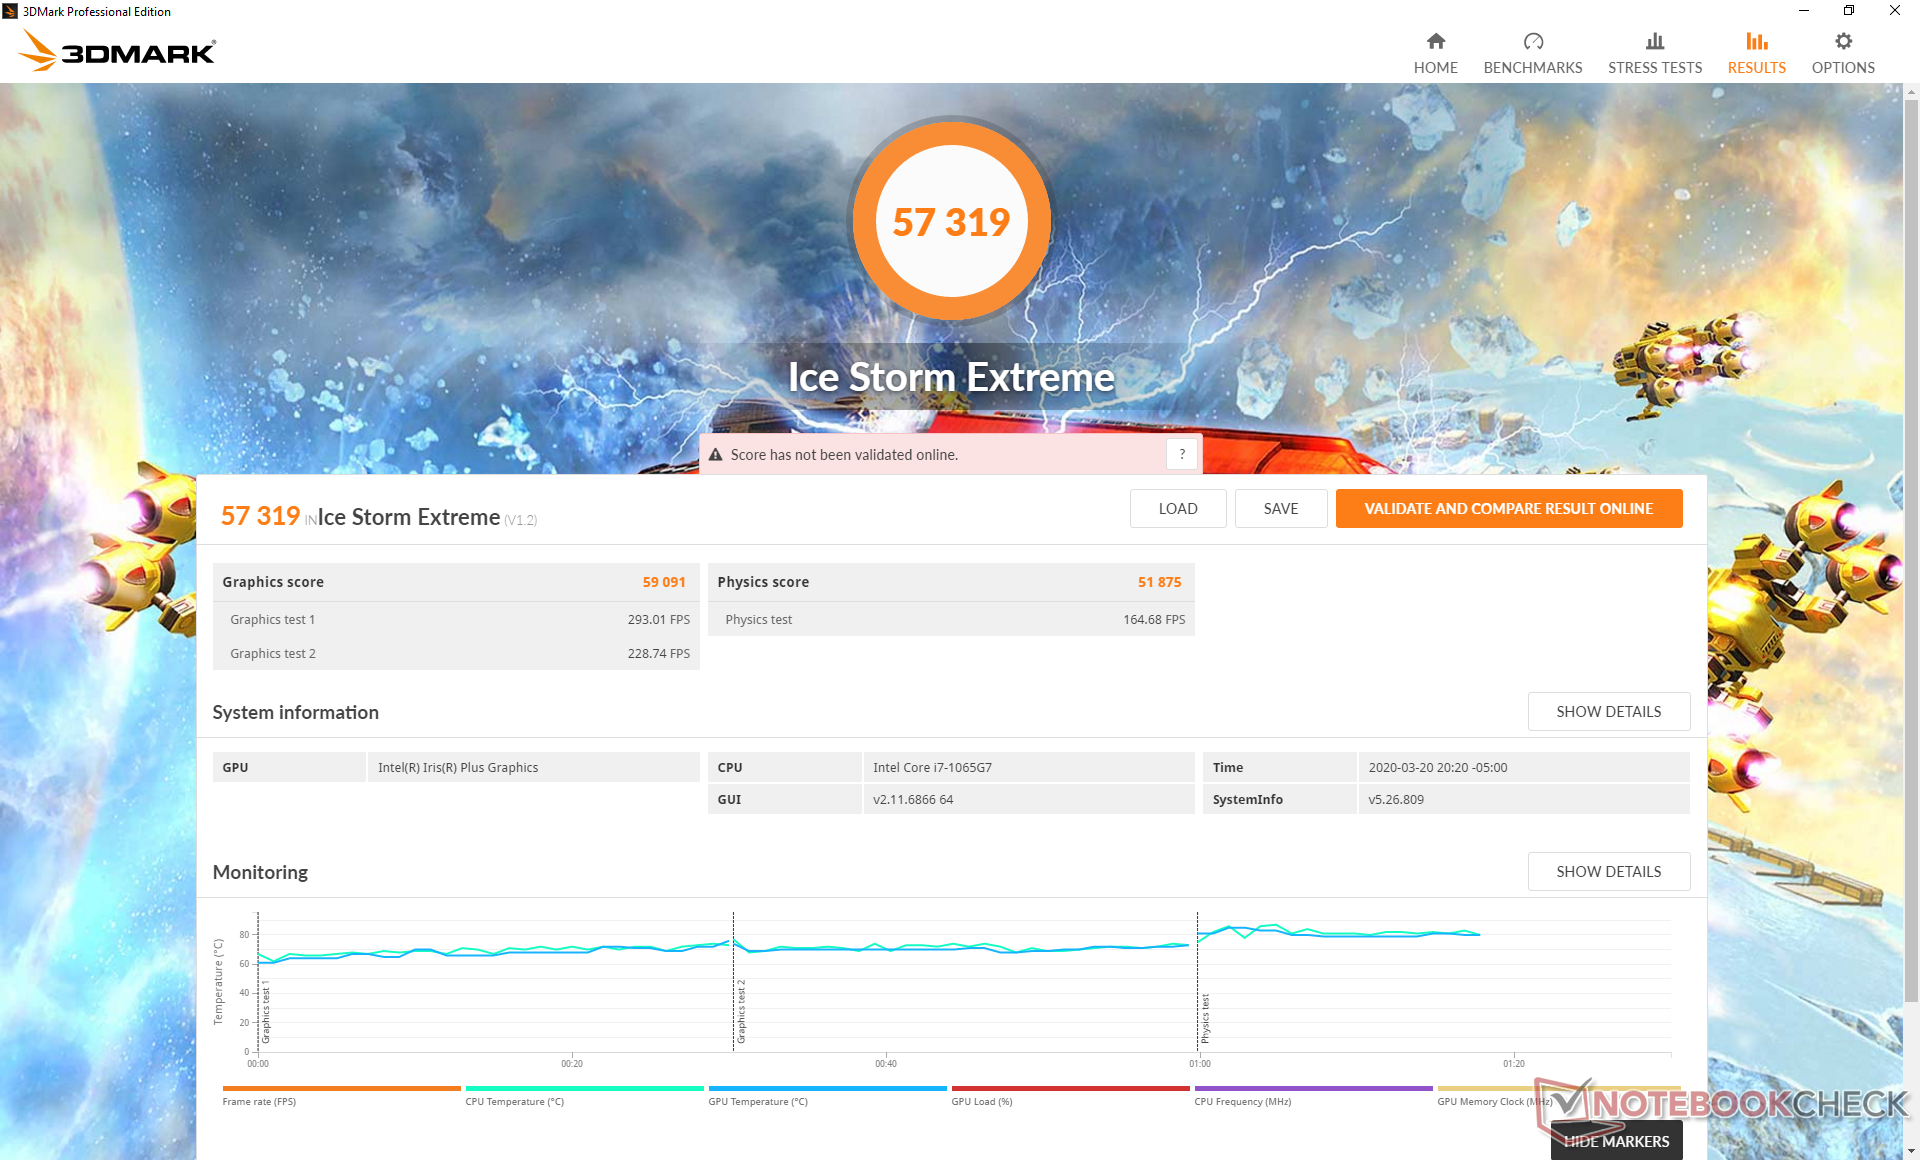
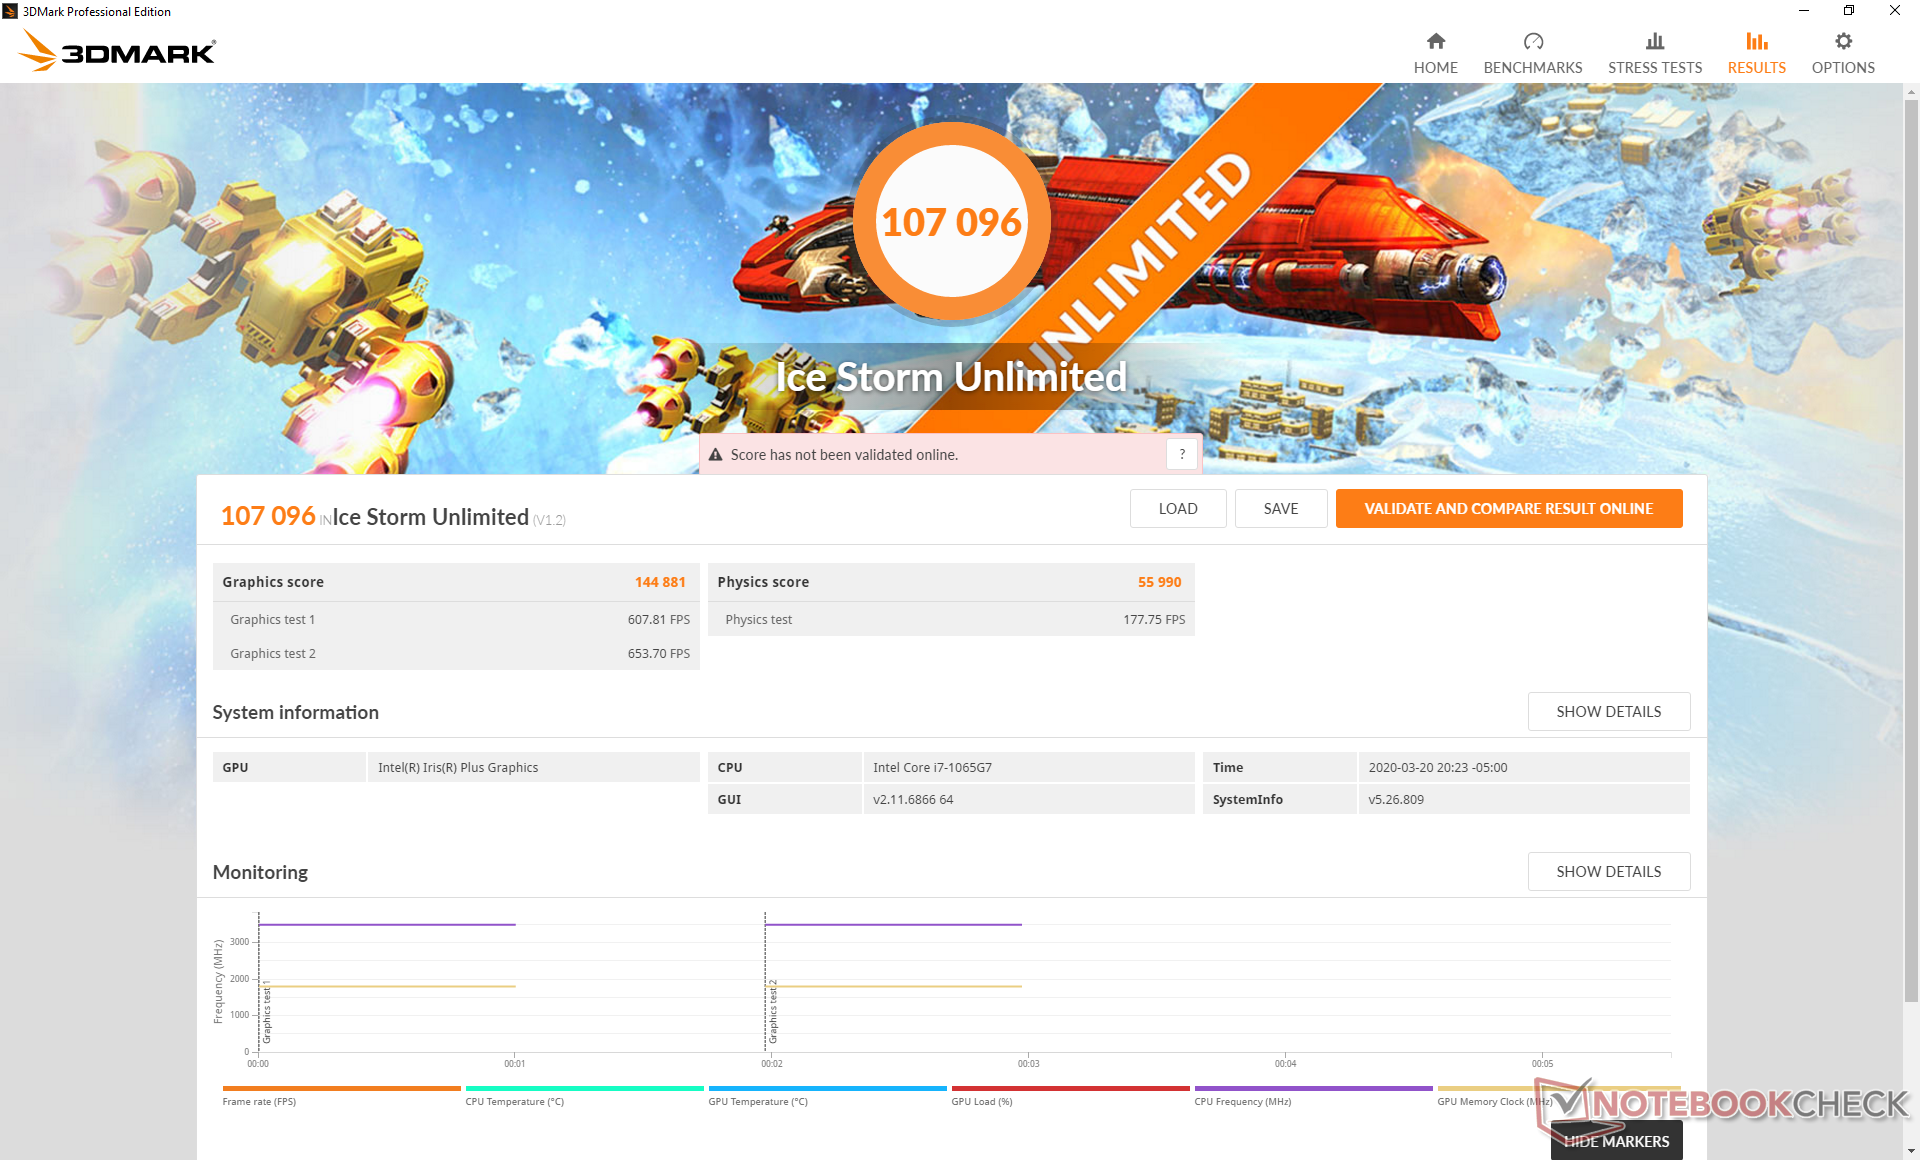
| 3DMark Ice Storm Standard Score | 67829 Punkte | |
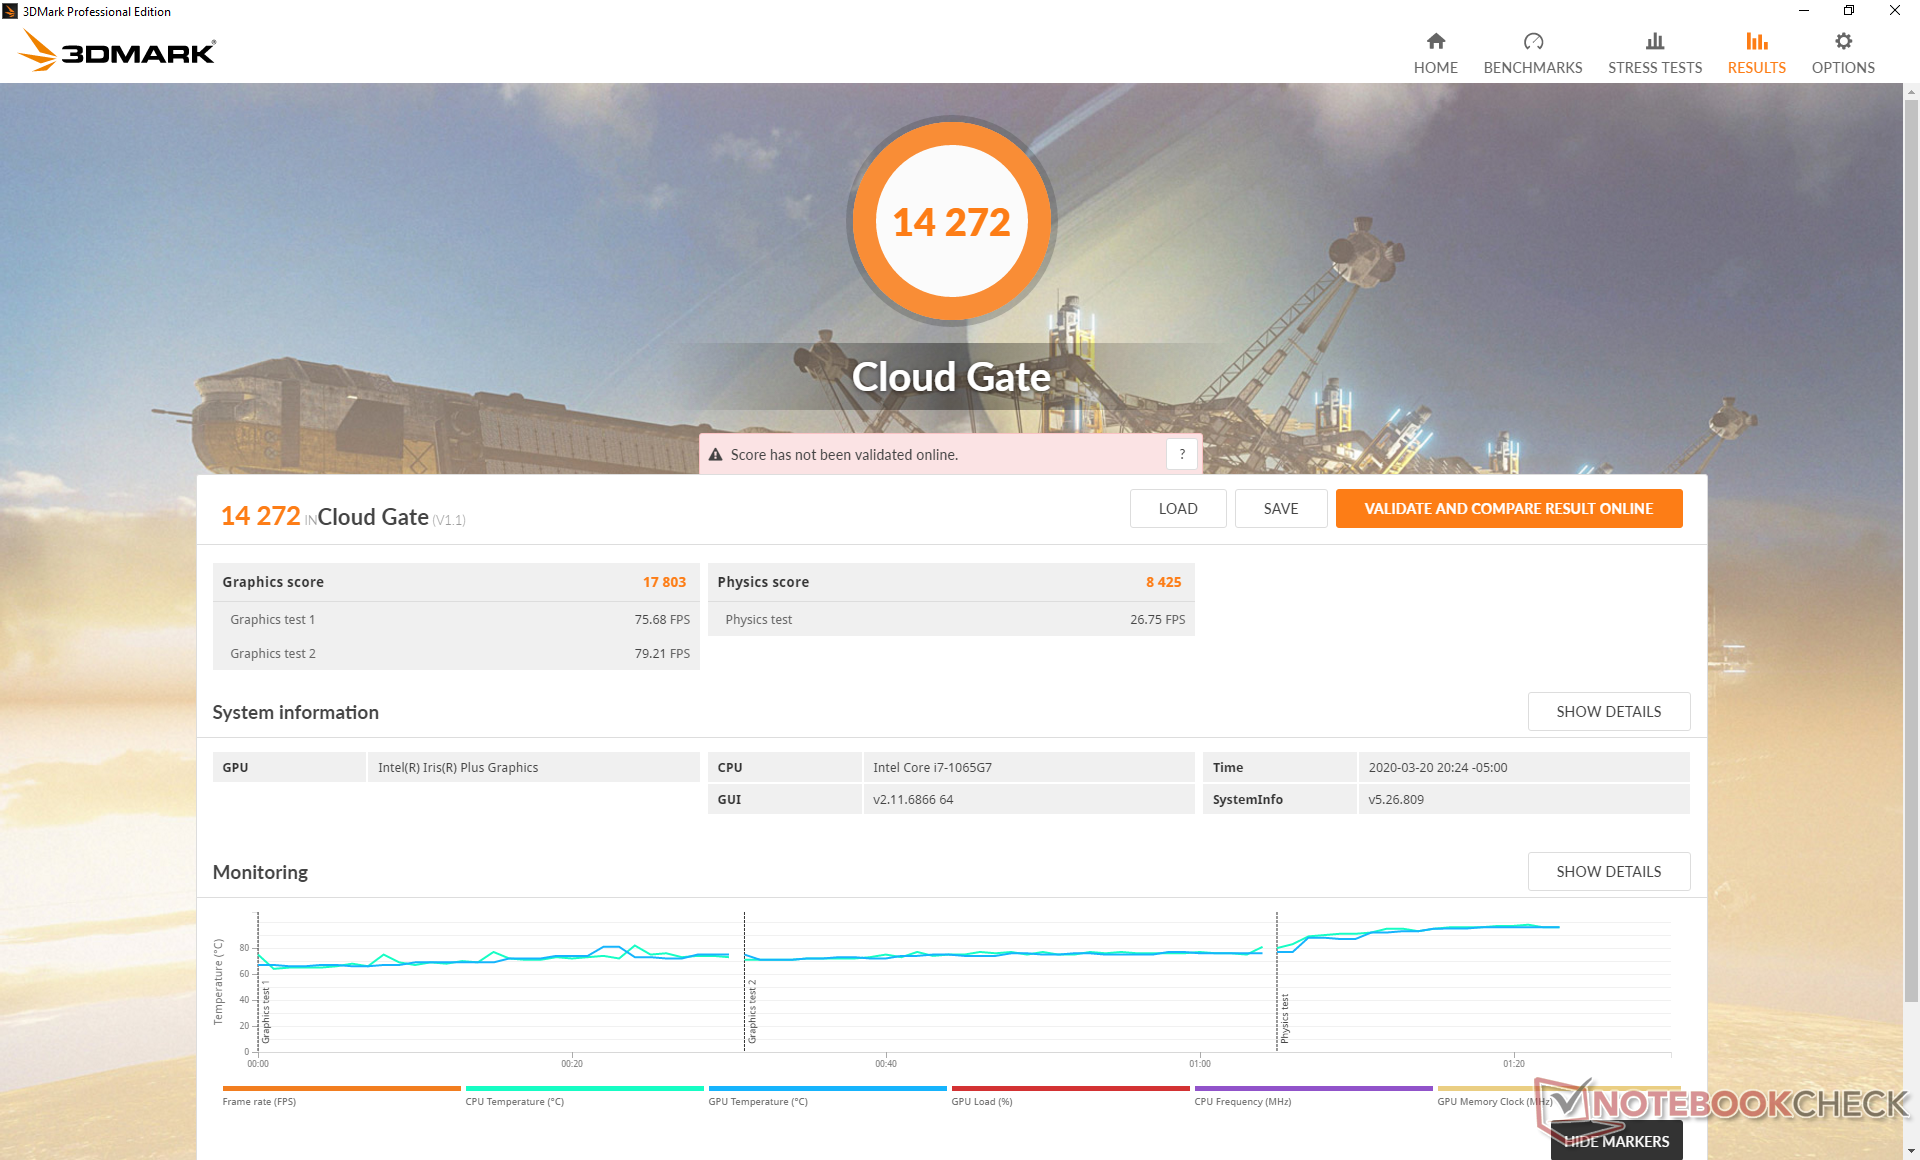
| 3DMark Cloud Gate Standard Score | 14272 Punkte | |
| 3DMark Fire Strike Score | 2753 Punkte | |
| 3DMark Time Spy Score | 937 Punkte | |
Hilfe | ||
| Shadow of the Tomb Raider - 1280x720 Lowest Preset | |
| Desktop PC | |
| MSI Modern 15 A10RB | |
| Dell Inspiron 15 5000 5585 | |
| Dell XPS 13 9300 Core i7-1065G7 | |
| Durchschnittliche Intel Iris Plus Graphics G7 (Ice Lake 64 EU) (15.6 - 33, n=13) | |
| Dell XPS 13 7390 Core i7-10710U | |
| The Witcher 3 | |
| 1024x768 Low Graphics & Postprocessing | |
| Huawei MateBook 13 i7 | |
| MSI Modern 15 A10RB | |
| Dell Inspiron 15 5000 5585 | |
| Dell XPS 13 9300 Core i7-1065G7 | |
| Durchschnittliche Intel Iris Plus Graphics G7 (Ice Lake 64 EU) (28.2 - 58, n=20) | |
| Dell XPS 13 7390 Core i7-10710U | |
| HP Pavilion x360 15-dq0065cl | |
| 1366x768 Medium Graphics & Postprocessing | |
| MSI Modern 15 A10RB | |
| Huawei MateBook 13 i7 | |
| Dell XPS 13 9300 Core i7-1065G7 | |
| Durchschnittliche Intel Iris Plus Graphics G7 (Ice Lake 64 EU) (20.8 - 36.8, n=18) | |
| HP Pavilion x360 15-dq0065cl | |
| 1920x1080 High Graphics & Postprocessing (Nvidia HairWorks Off) | |
| HP Pavilion Gaming 15t-cx0000 | |
| MSI Modern 15 A10RB | |
| Huawei MateBook 13 i7 | |
| Dell Inspiron 15 5000 5585 | |
| Dell XPS 13 9300 Core i7-1065G7 | |
| Durchschnittliche Intel Iris Plus Graphics G7 (Ice Lake 64 EU) (10.9 - 20.1, n=18) | |
The Witcher 3 im Leerlauf für eine Stunde laufen zu lassen zeigt, dass der Laptop Schwierigkeiten dabei hat, die Bildwiederholraten konstant zu halten. Wie das Diagramm unten veranschaulicht, liegen die Bildwiederholraten in den ersten 15 Minuten konstant bei ungefähr 50 fps und beginnen dann, zwischen 40 fps und 60 fps zu schwanken. Dagegen ist die Bildwiederholrate der meisten anderen Laptops hier vom Anfang bis zum Ende stabiler. Die im Stresstest-Abschnitt erwähnte schwankende GPU-Taktfrequenz stellt vermutlich einen entscheidenden Faktor für dieses unerwünschte Verhalten im Gamingbetrieb dar.
| min. | mittel | hoch | max. | |
| BioShock Infinite (2013) | 104.2 | 66.8 | 56.7 | 21.1 |
| The Witcher 3 (2015) | 50.7 | 33.5 | 18.4 | 9.1 |
| Rocket League (2017) | 85.5 | 53.6 | 38.3 | |
| Shadow of the Tomb Raider (2018) | 28 |
Emissionen
Geräuschemissionen
Im Alltag sind die Lüfter beim normalen Surfen oder Videostreaming fast nie aktiv. Sogar in der ersten Benchmarkszene von 3DMark 06 bleibt der Laptop fast bis zum Ende leise. Schlimmstenfalls muss man bei einem Hintergrundgeräuschpegel von 28,3 dB(A) und längerem Multi-Tasking mit einer Lautstärke von nur 32,5 dB(A) rechnen.
Unter hoher Last wie beispielsweise im Gamingbetrieb erreichen die Lüfter schnell 39,3 dB(A) und verbleiben dann auf diesem Niveau. Da 40 dB(A) unter Hochlast für Ultrabooks üblich sind, ist das keine große Überraschung. Durch die hohe Frequenz treten die Lüfter des XPS 13 9300 jedoch unnötig stark in den Vordergrund.
Wenn wir ein Ohr in der Nähe der Tastatur anlegen, können wir leises Spulenfiepen bzw. elektronische Geräusche hören. Befindet man sich in einer üblichen Entfernung zum Laptop, so fällt dies jedoch nicht auf.
| Dell XPS 13 9300 Core i7-1065G7 Iris Plus Graphics G7 (Ice Lake 64 EU), i7-1065G7, Intel SSDPEMKF512G8 NVMe SSD | Dell XPS 13 7390 Core i7-10710U UHD Graphics 620, i7-10710U, SK Hynix PC601 NVMe 512 GB | Dell XPS 13 7390 2-in-1 Core i7 Iris Plus Graphics G7 (Ice Lake 64 EU), i7-1065G7, Toshiba BG4 KBG40ZPZ512G | Huawei Matebook X Pro i5 GeForce MX150, i5-8250U, Samsung PM961 MZVLW256HEHP | Microsoft Surface Laptop 3 13 Core i5-1035G7 Iris Plus Graphics G7 (Ice Lake 64 EU), i5-1035G7, SK hynix BC501 HFM256GDGTNG | Dell XPS 13 9300 i5 FHD UHD Graphics G1 (Ice Lake 32 EU), i5-1035G1, Toshiba XG6 KXG60ZNV512G | |
|---|---|---|---|---|---|---|
| Geräuschentwicklung | -3% | -2% | -5% | 0% | 2% | |
| aus / Umgebung * | 28.3 | 28 1% | 28.1 1% | 27.9 1% | 28.5 -1% | 29.3 -4% |
| Idle min * | 28.3 | 28 1% | 28.1 1% | 27.9 1% | 28.5 -1% | 29.3 -4% |
| Idle avg * | 28.3 | 28 1% | 28.1 1% | 27.9 1% | 28.5 -1% | 29.3 -4% |
| Idle max * | 28.3 | 28 1% | 28.1 1% | 27.9 1% | 28.5 -1% | 29.3 -4% |
| Last avg * | 32.5 | 33.7 -4% | 31.7 2% | 36.2 -11% | 28.5 12% | 30 8% |
| Witcher 3 ultra * | 39.3 | 43.4 -10% | 45 -15% | 40.4 -3% | ||
| Last max * | 39.3 | 46.5 -18% | 43.4 -10% | 45.2 -15% | 40.4 -3% | 32.4 18% |
* ... kleinere Werte sind besser
Lautstärkediagramm
| Idle |
| 28.3 / 28.3 / 28.3 dB(A) |
| Last |
| 32.5 / 39.3 dB(A) |
 | ||
30 dB leise 40 dB(A) deutlich hörbar 50 dB(A) störend |
||
min: | ||
Temperatur
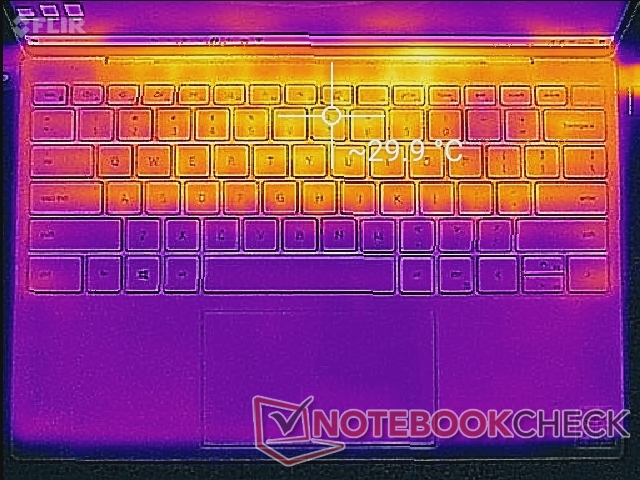
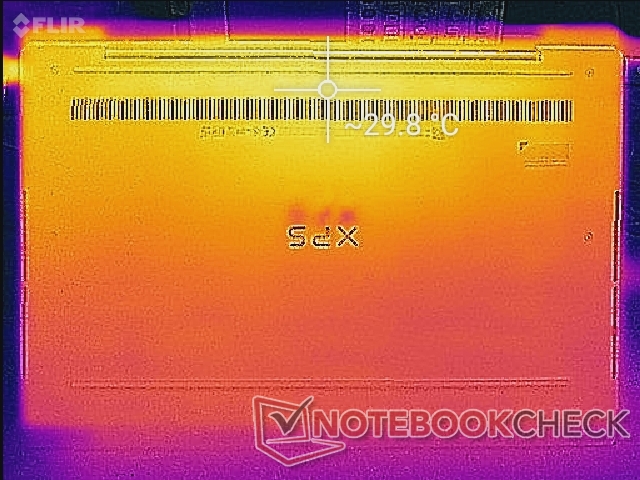
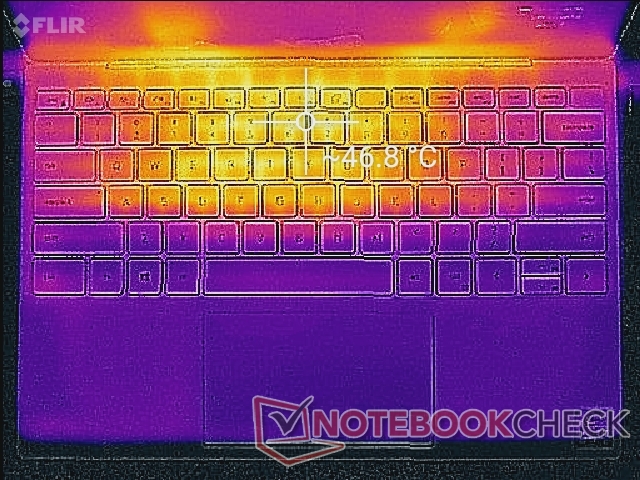
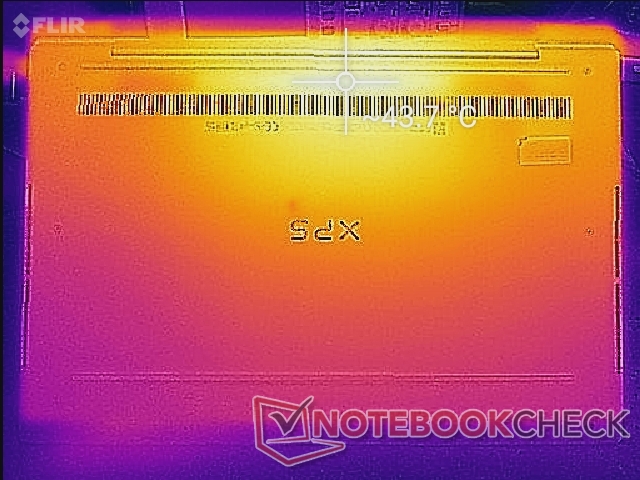
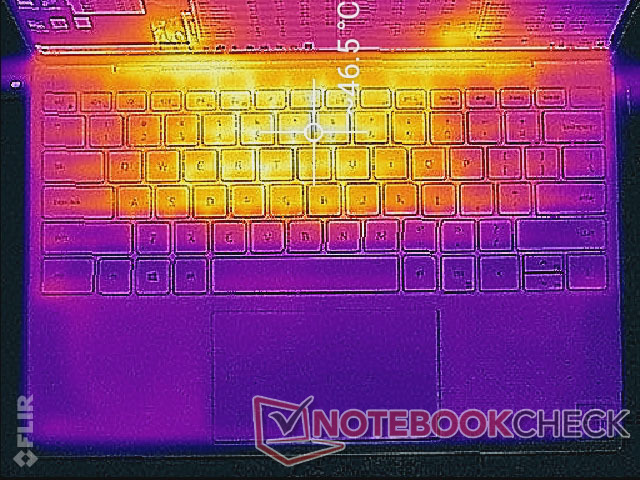
Die Oberflächentemperaturen der Handballenauflagen und der heißen Stellen im hinteren Bereich liegen im Leerlauf zwischen 26 und 30 °C. Unter höherer Last können letztere bis zu 47 °C und damit ähnliche Werte wie das XPS 13 2-in-1, das mit der gleichen CPU ausgestattet ist, erreichen.
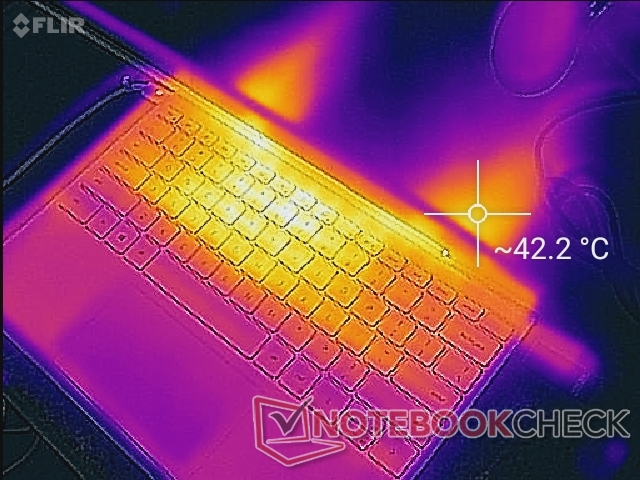
(-) Die maximale Temperatur auf der Oberseite ist 46.6 °C. Im Vergleich liegt der Klassendurchschnitt bei 35.9 °C (von 21.4 bis 59 °C für die Klasse Subnotebook v7).
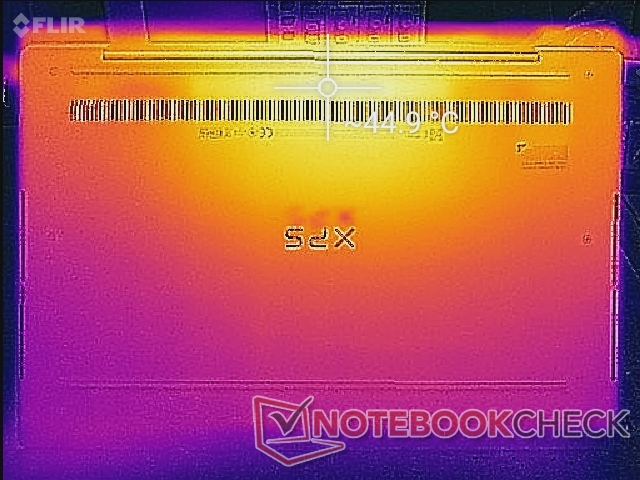
(±) Auf der Unterseite messen wir eine maximalen Wert von 44.8 °C (im Vergleich zum Durchschnitt von 39.4 °C).
(+) Ohne Last messen wir eine durchschnittliche Temperatur von 27.4 °C auf der Oberseite. Der Klassendurchschnitt erreicht 30.7 °C.
(±) Beim längeren Spielen von The Witcher 3 erhitzt sich das Gerät durchschnittlich auf 33.9 °C. Der Durchschnitt der Klasse ist derzeit 30.7 °C.
(+) Die Handballen und der Touchpad-Bereich sind mit gemessenen 29.8 °C kühler als die typische Hauttemperatur und fühlen sich dadurch kühl an.
(±) Die durchschnittliche Handballen-Temperatur anderer getesteter Geräte war 28.3 °C (-1.5 °C).
Stresstest
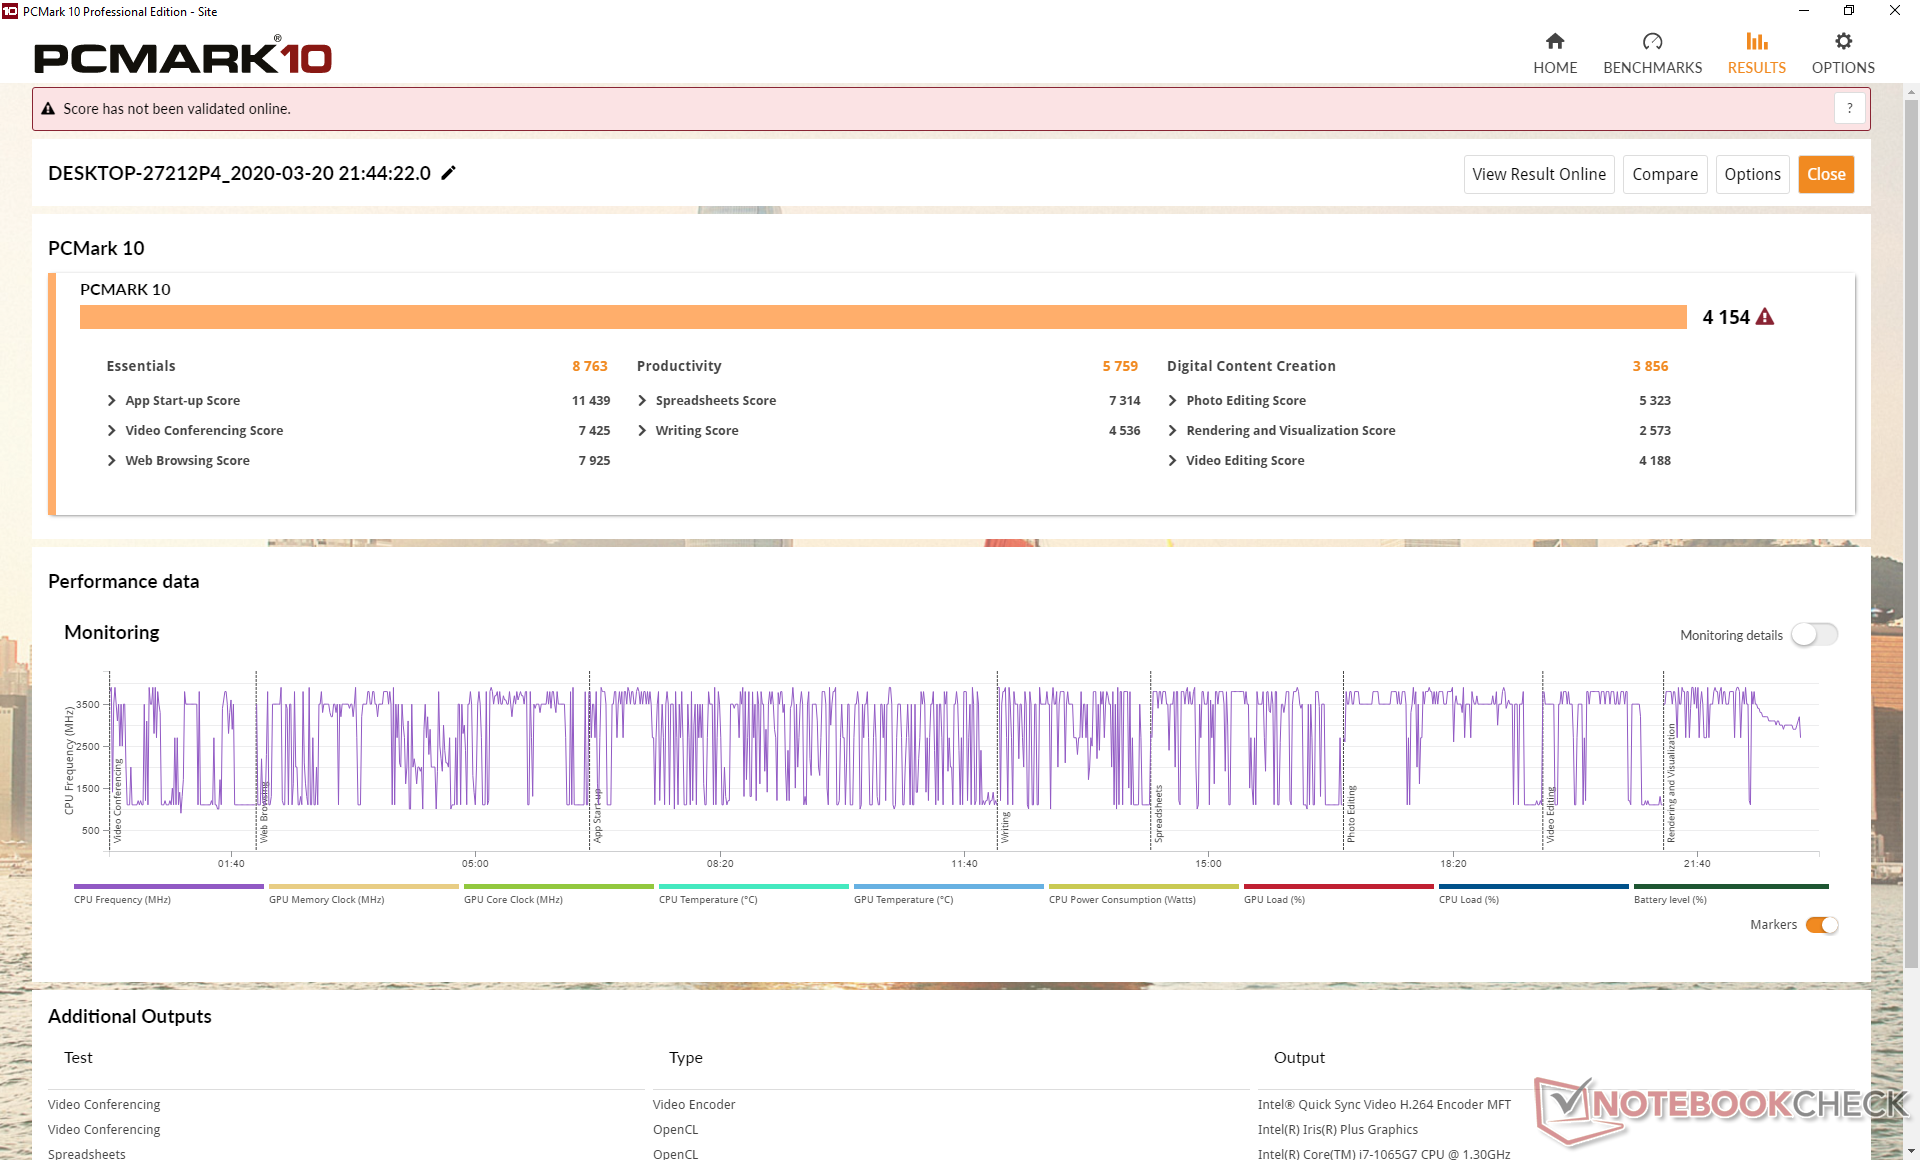
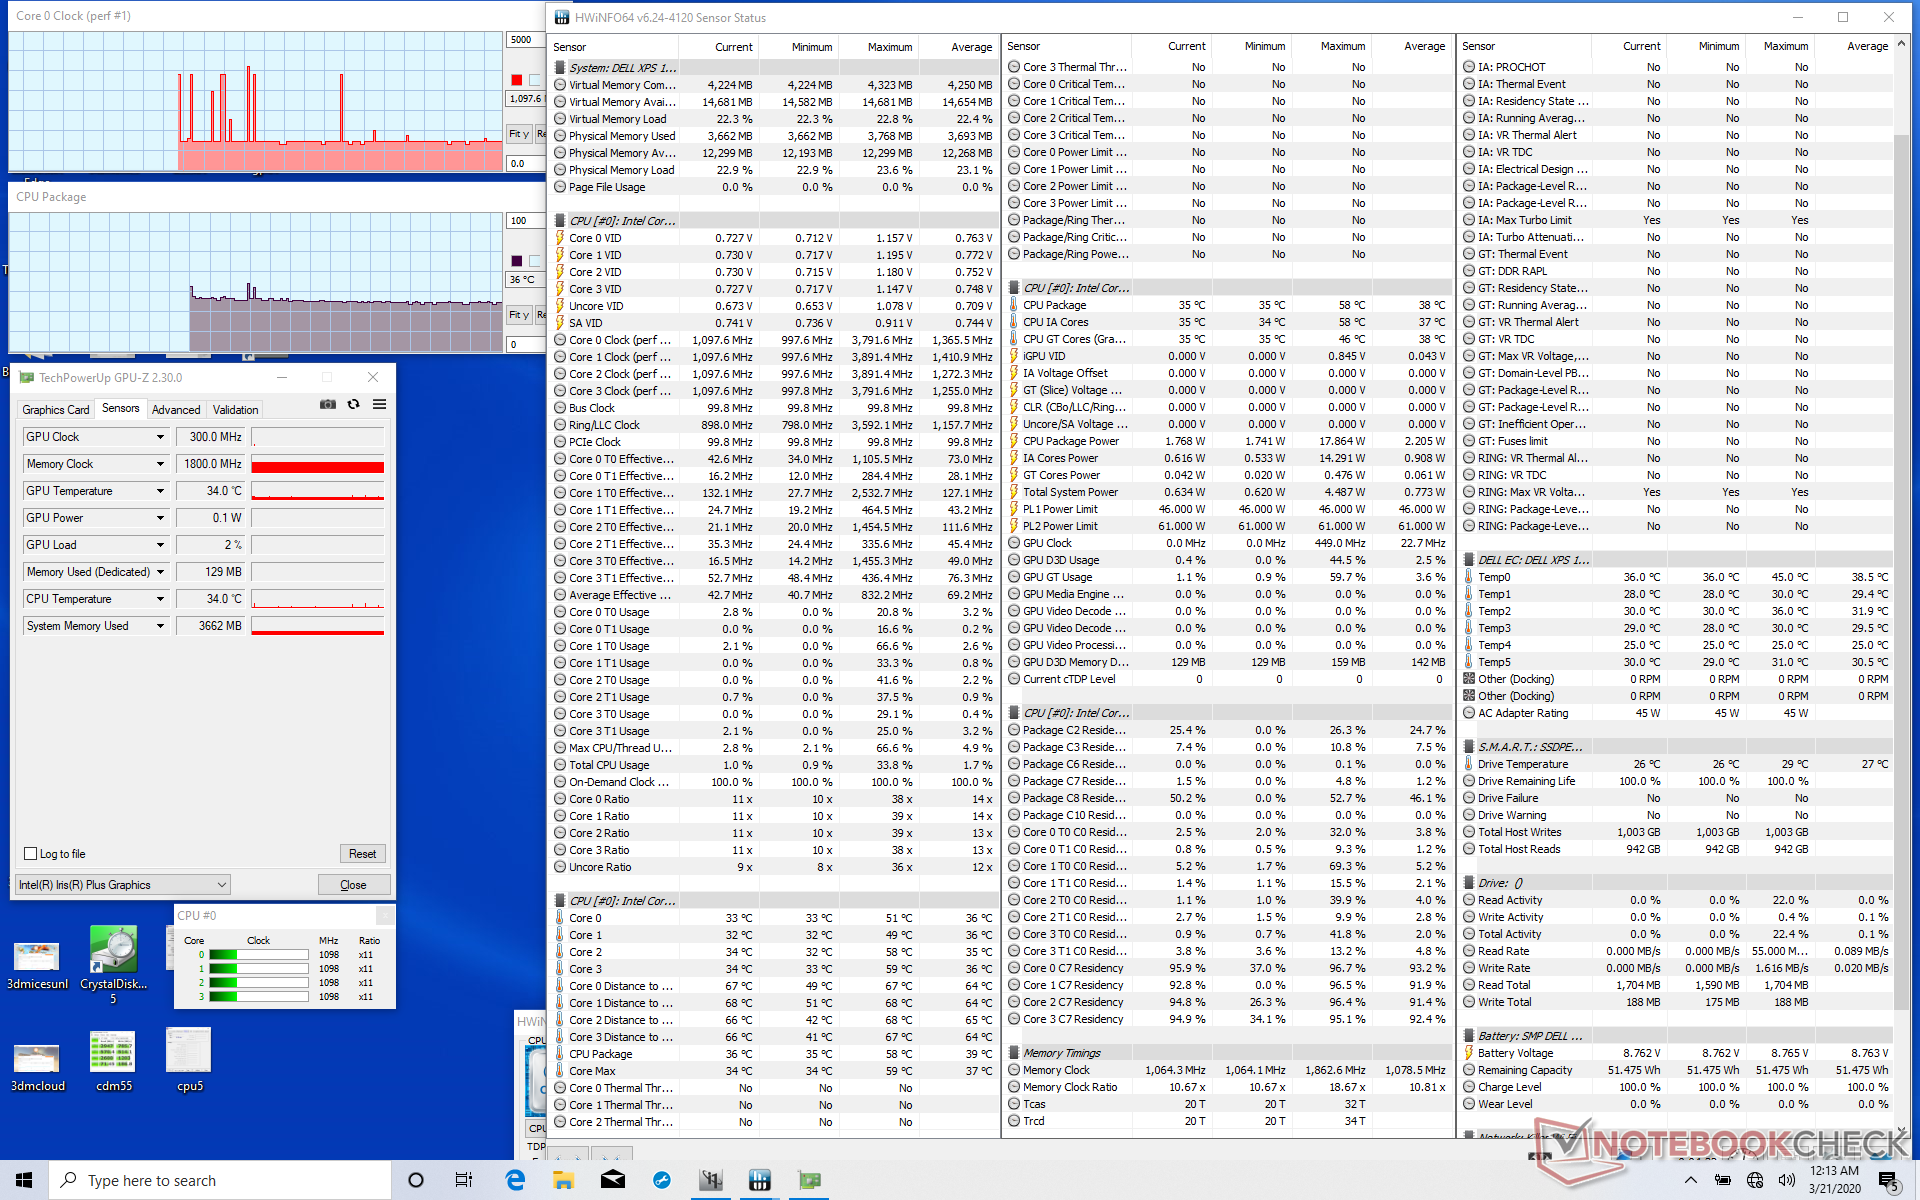
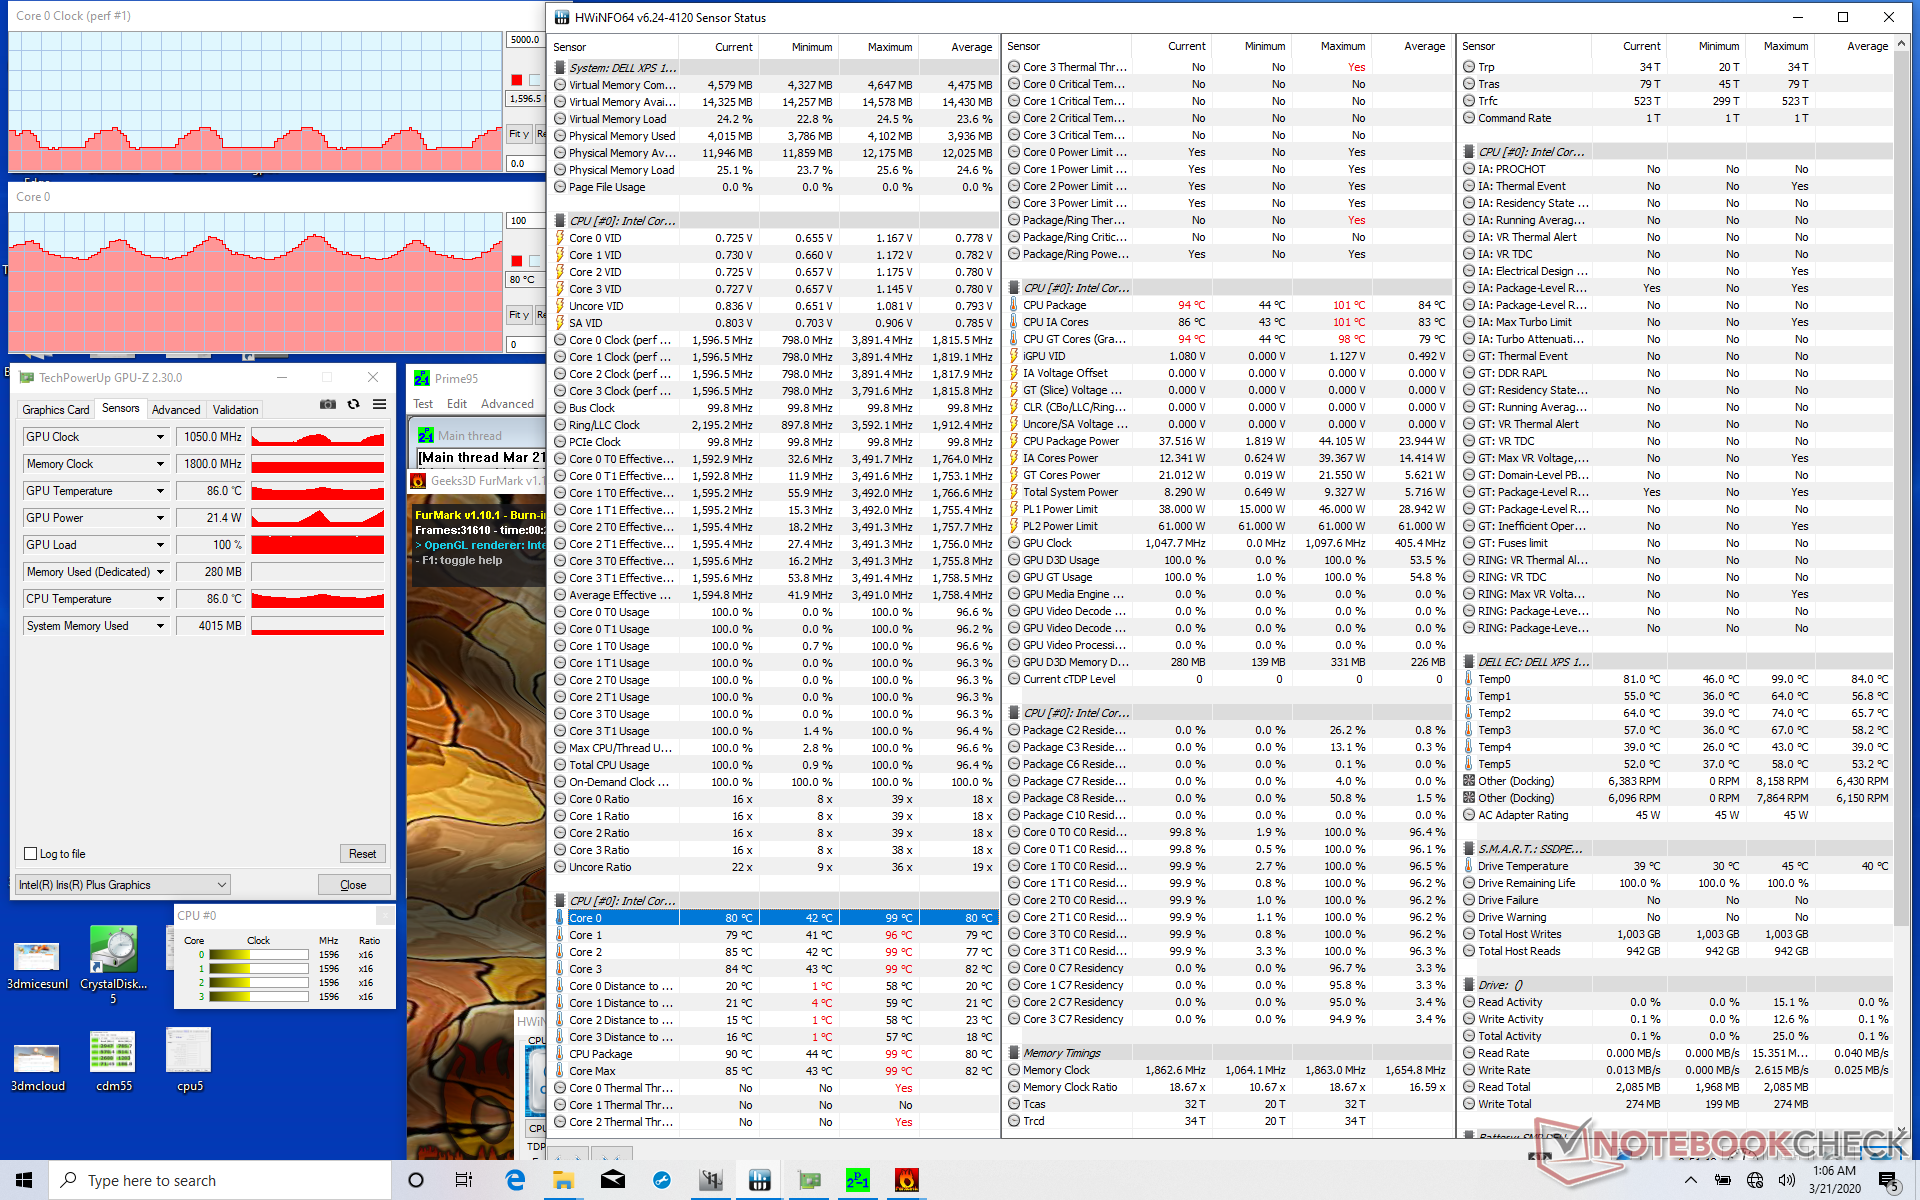
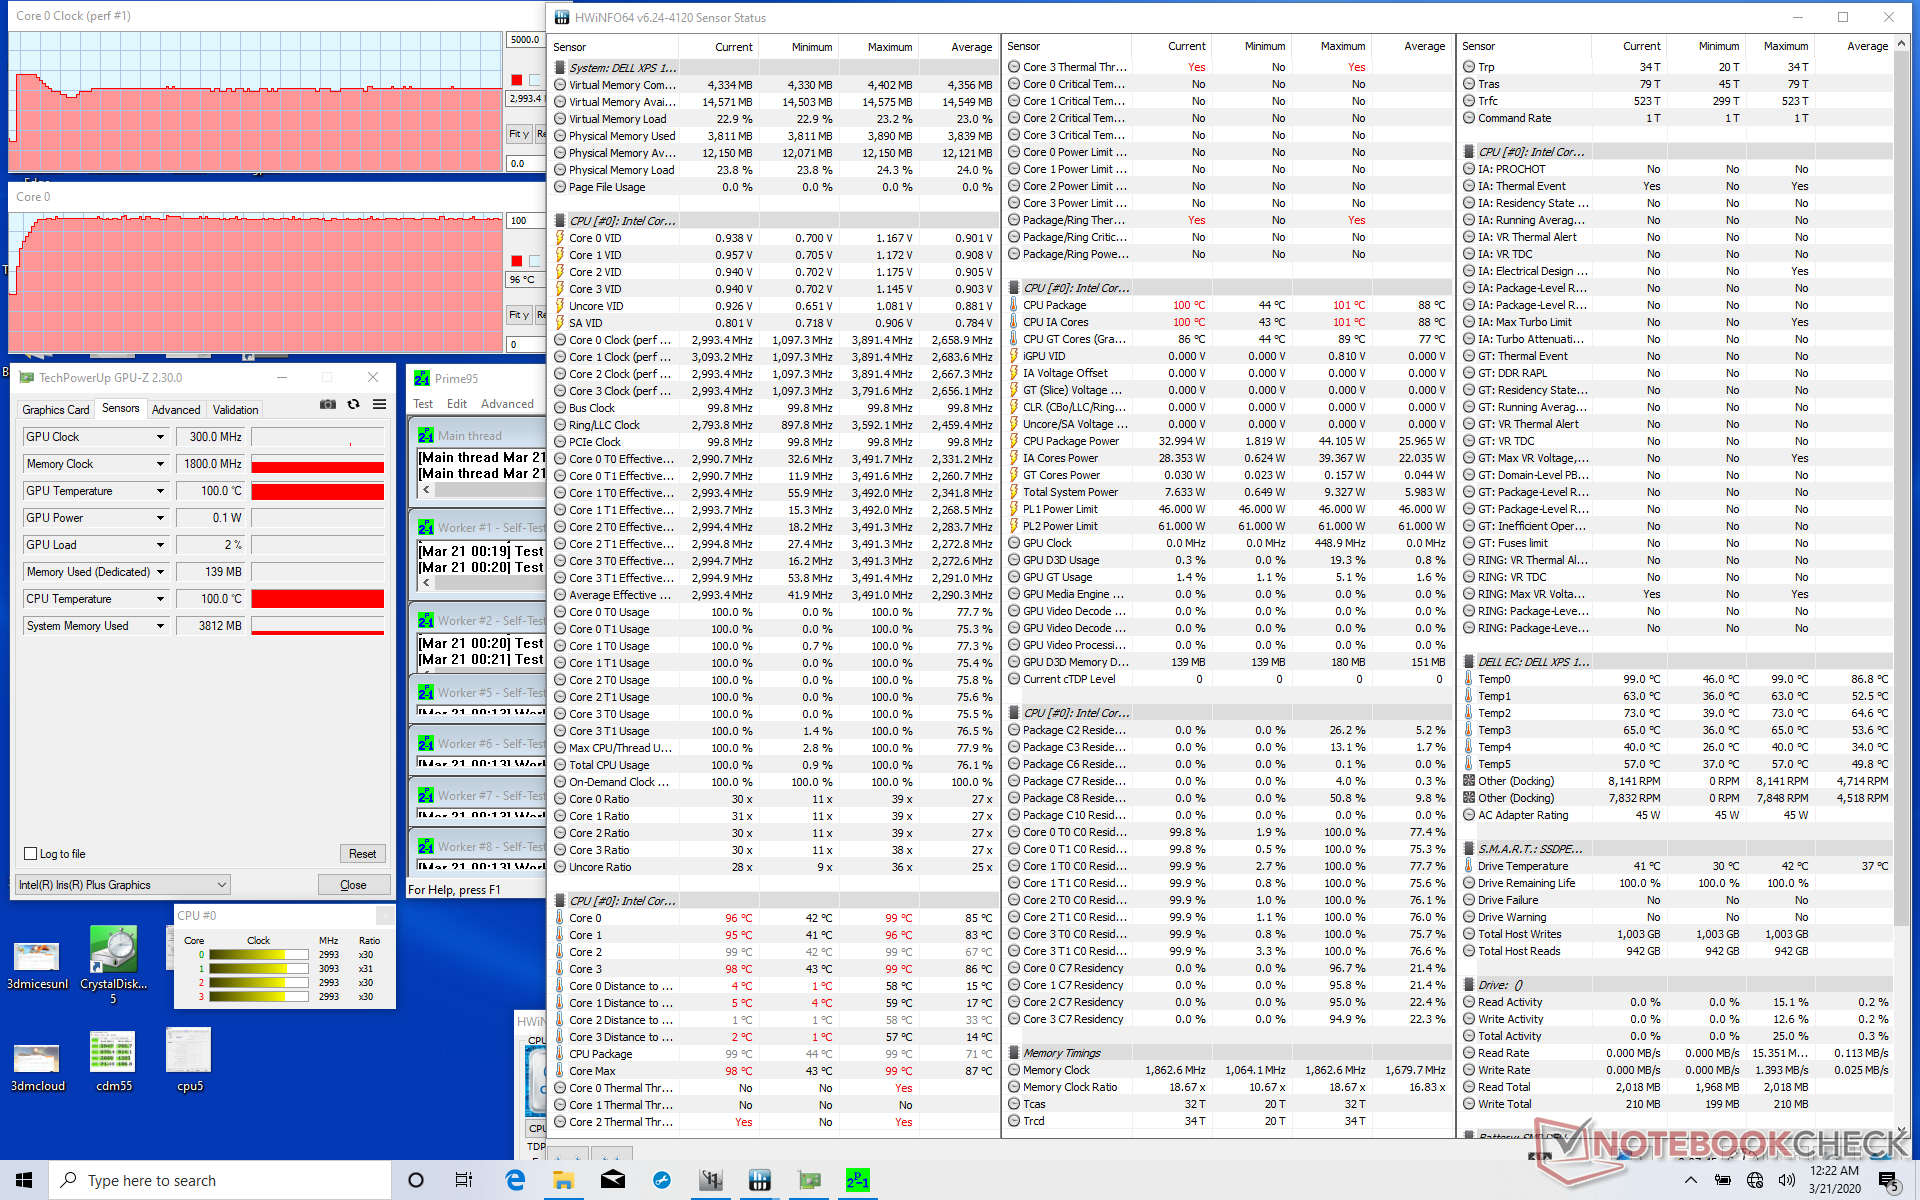
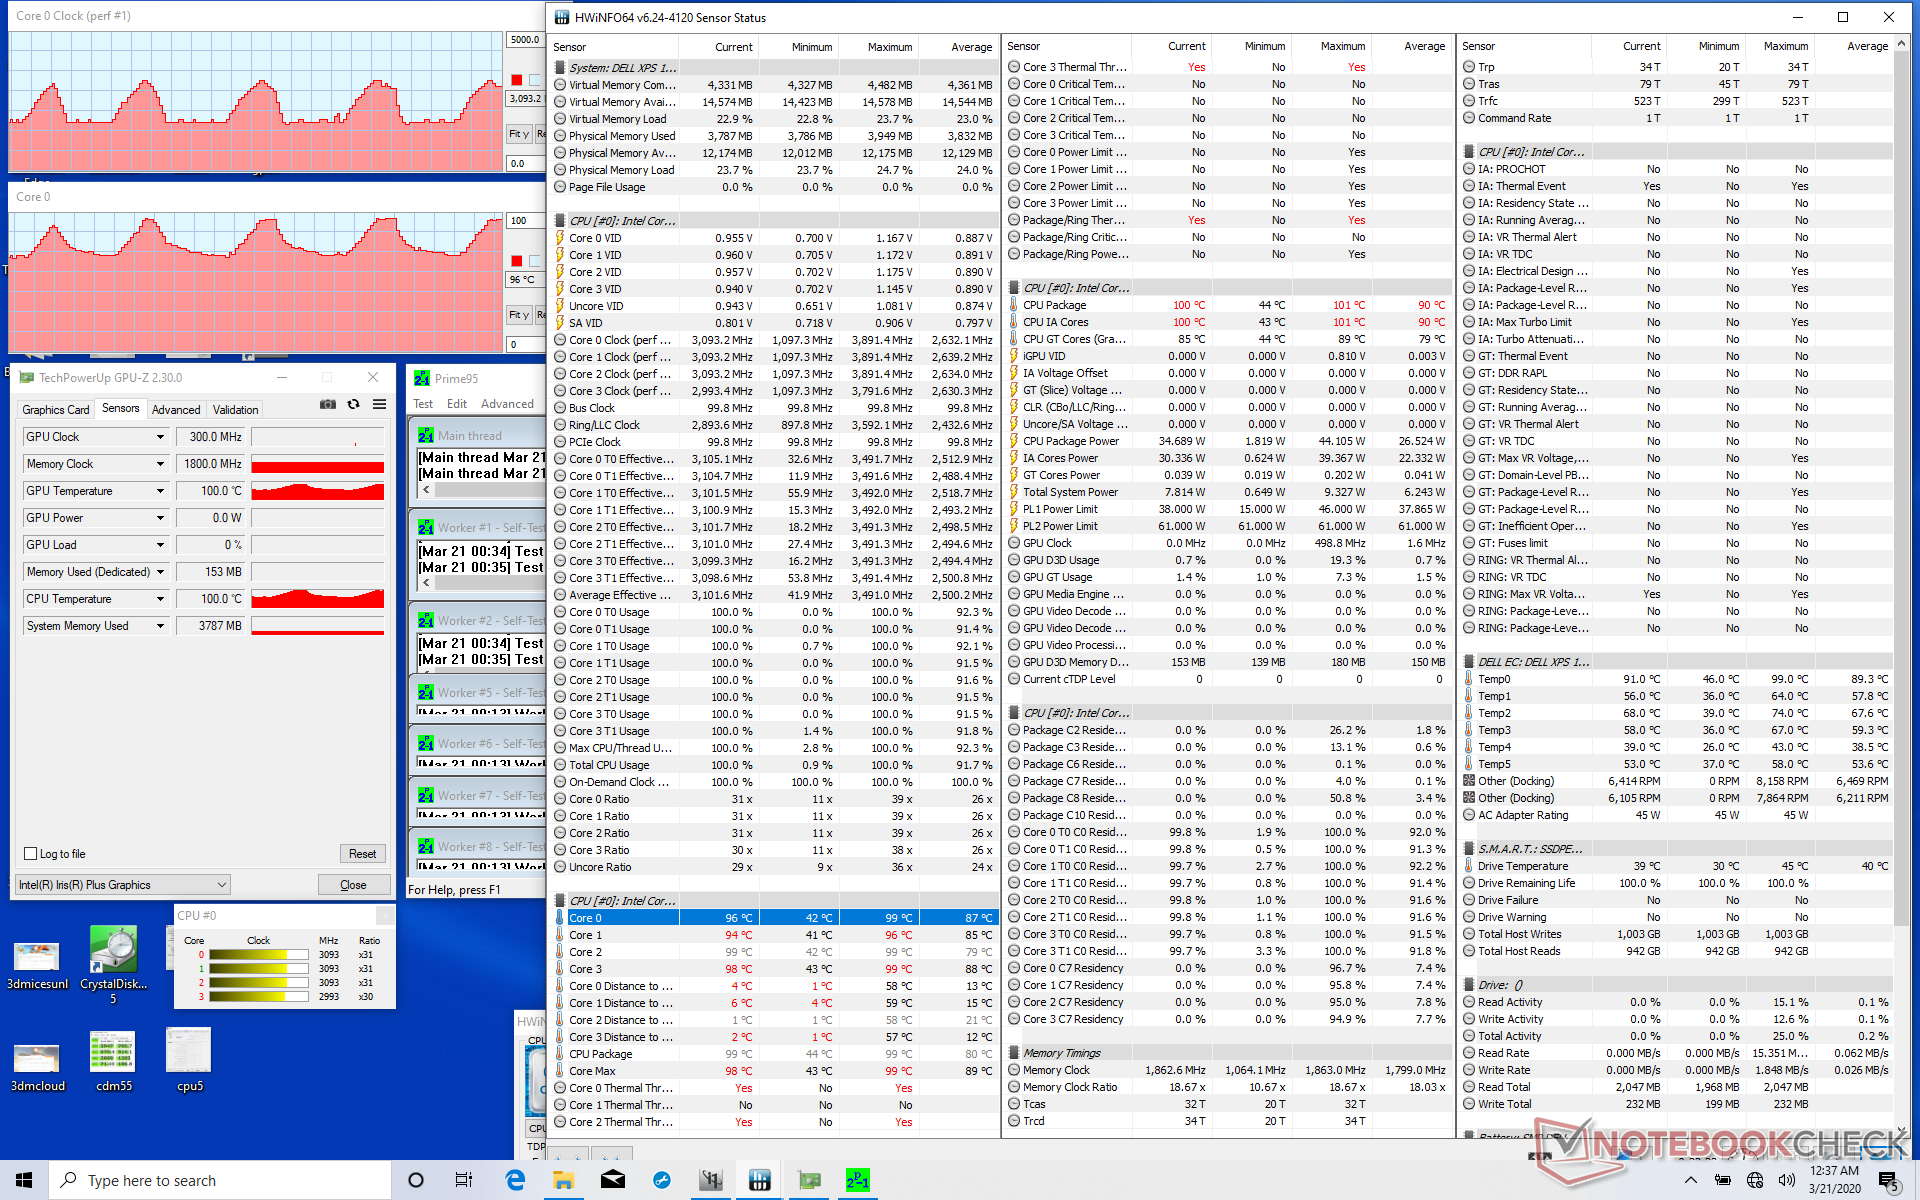
Um es auf potenzielles Drosseln und mögliche Stabilitätsprobleme zu prüfen, setzen wir das System künstlichen Lasten aus. Beim Ausführen von Prime95 steigt der CPU-Takt für die ersten 10 Sekunden auf 3,5 GHz, worauf die CPU eine Temperatur von 99 °C erreicht. Darauf fallen Taktfrequenz und Temperatur sofort ab und pendeln sich bei 3,0 GHz bzw. ~96 °C ein. Allerdings schwanken die Taktfrequenz und die Kerntemperatur nach wenigen Minuten zwischen 1,8 GHz und 3,3 GHz bzw. 70 °C und 97 °C, wie unsere Screenshots unten zeigen. Dieses Verhalten garantiert auf Kosten einer stabilen Taktfrequenz, dass die CPU-Temperatur nicht dauerhaft bei >95 °C liegt. Obwohl der Prozessor seinen Basistakt während der Ausführung von Prime95 nicht unterschreitet, gelingt es ihm auf Dauer auch nicht, eine konstante Turbo-Boost-Frequenz aufrechtzuerhalten.
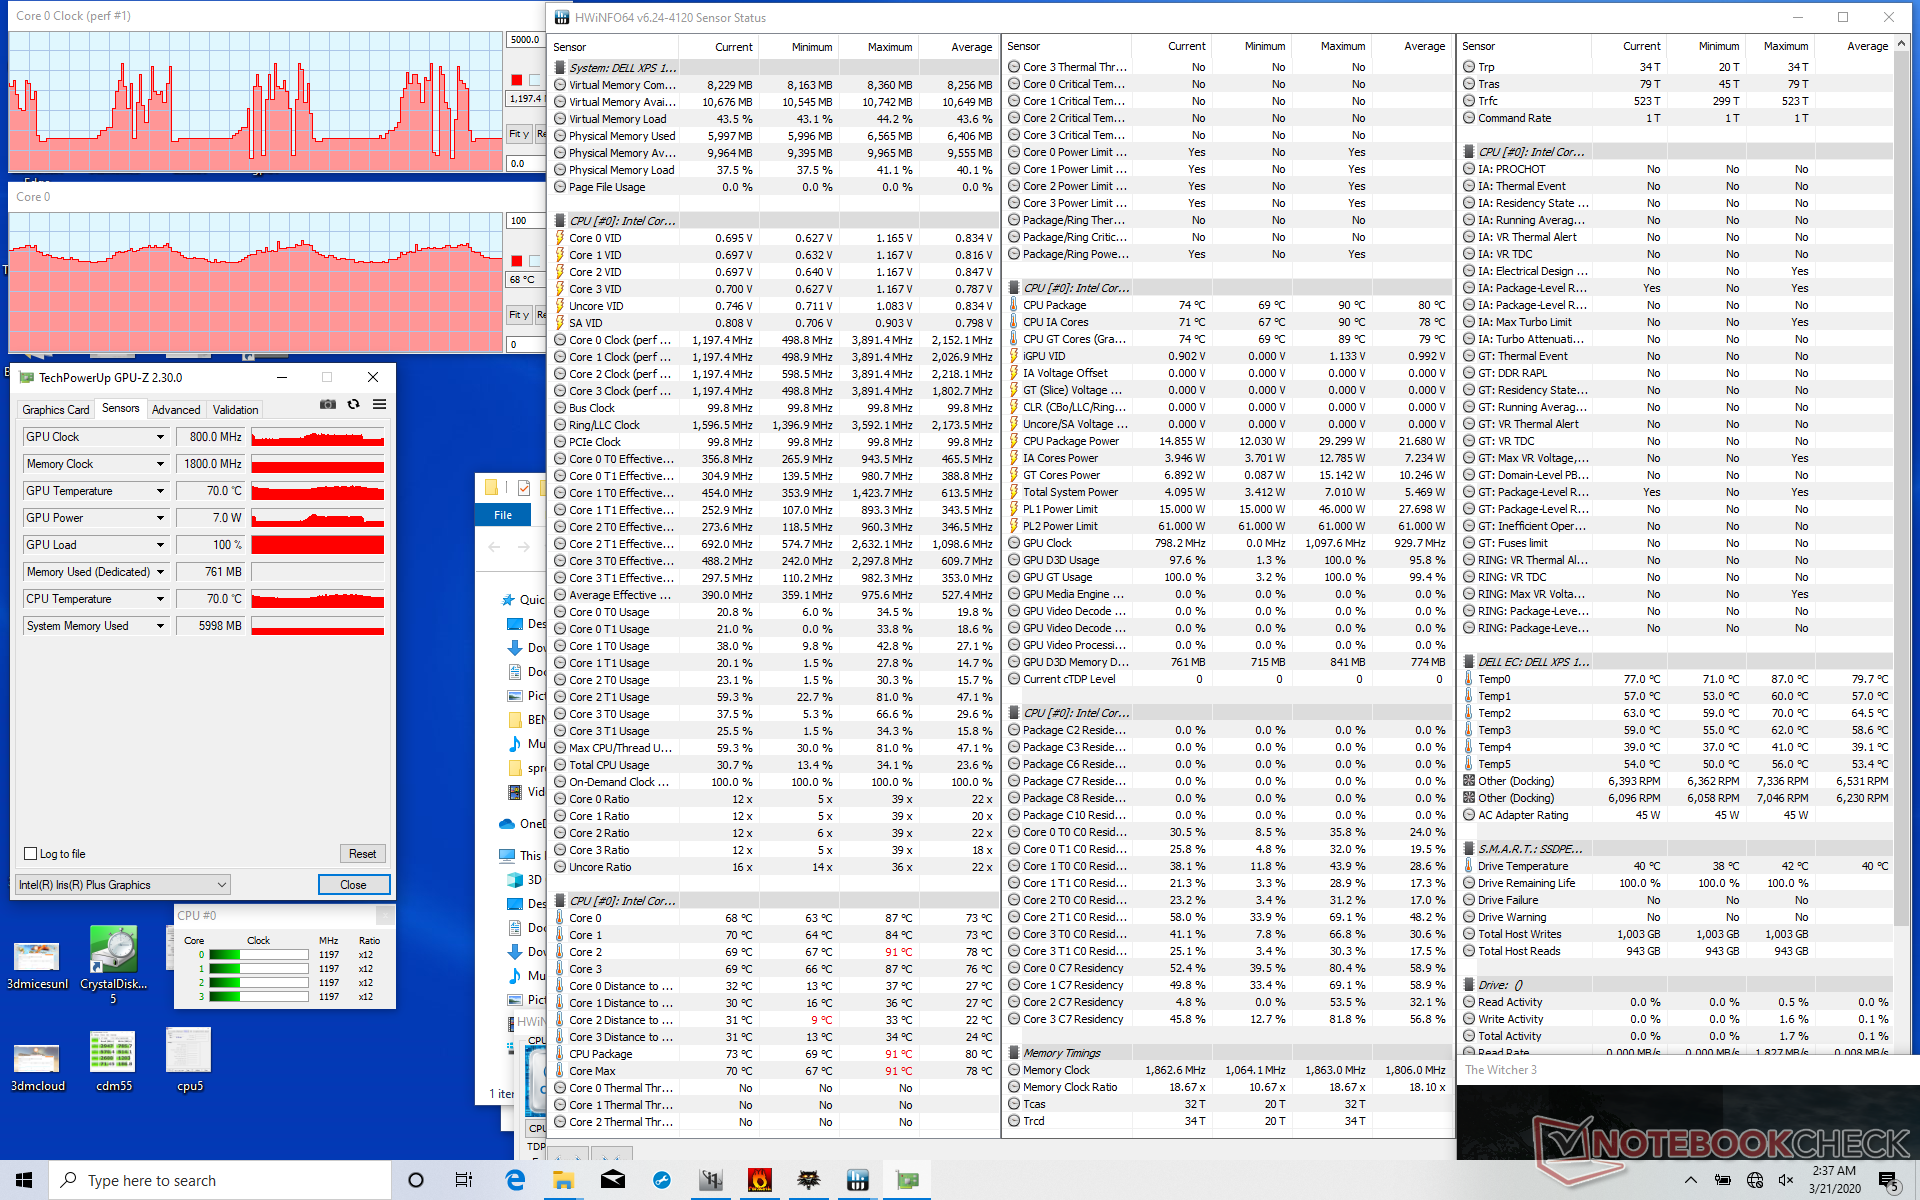
The Witcher 3 zu spielen repräsentiert praktische Lasten besser. Hier schwankt die GPU-Taktfrequenz zwischen 750 MHz und 1.000 MHz, was bedauerlicherweise zu den oben beschriebenen, schwankenden Bildwiederholraten führt.
Der Batteriebetrieb wirkt sich auf die Leistung aus. Ein 3DMark-11-Test liefert im Akkumodus Physik- und Grafikpunktzahlen von 4.680 bzw. 1.675 Punkten, während im Netzbetrieb 10.249 bzw. 4.508 Punkte erreicht werden.
| CPU Clock (GHz) | GPU Clock (MHz) | Average CPU Temperature (°C) | |
| System Idle | -- | -- | 35 |
| Prime95 Stress | 1.8 - 3.3 | -- | 70 - 97 |
| Prime95 + FurMark Stress | 0.9 - 1.6 | 550 - 1050 | 67 - 81 |
| Witcher 3 Stress | 1.2 - 3.8 | 750 - 1000 | 65 - 77 |
Energieverwaltung
Energieaufnahme
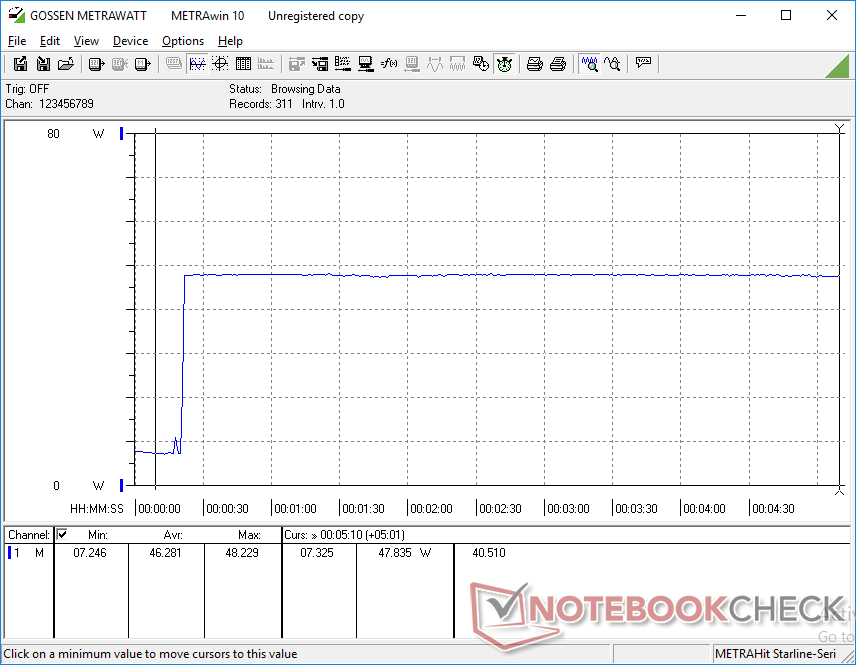
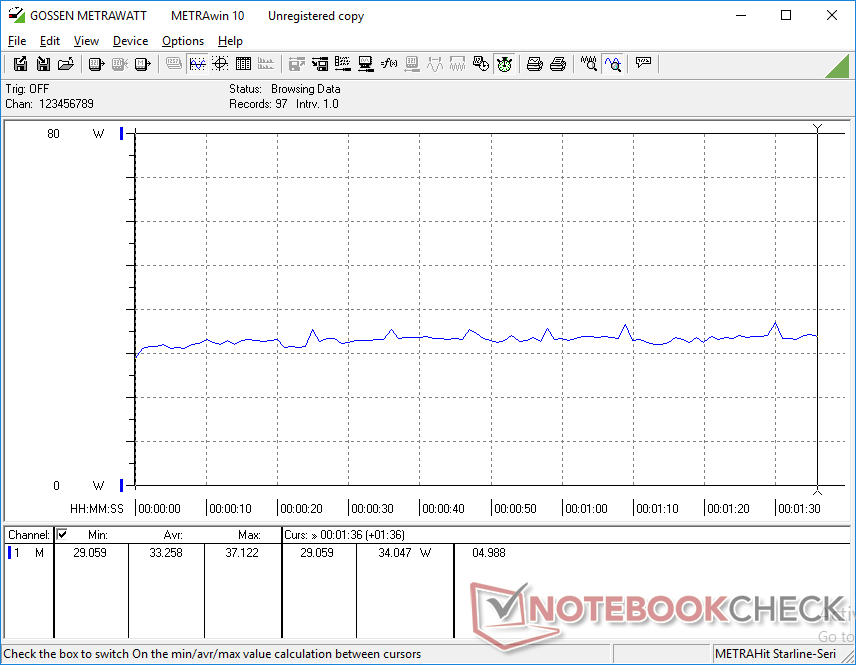
Je nach Helligkeitsstufe und Leistungsprofil verbraucht der Laptop im Leerlauf zwischen 4 und 8 W. Unter höherer Last wie zum Beispiel im Gamingbetrieb steigt der Verbrauch auf 33 bis 37 W und damit trotz der deutlichen Unterschiede bei der GPU-Leistung auf ein ähnliches Niveau wie beim leistungsschwächeren XPS 13 Core i5. Der Core i7-1065G7 bietet also eine viel höhere Grafikleistung als das Core-i5-Modell, ohne dabei mehr Strom zu verbrauchen.
Ultrabooks, die mit der GeForce MX150 bzw. MX250 ausgestattet sind, verbrauchen im Gamingbetrieb jeweils ein paar Watt mehr als unser Ice-Lake-Testgerät. Da die MX150/MX250 der Iris Plus G7 im Gamingbetrieb um Längen voraus ist, ist die Leistung-pro-Watt bei Nvidias Lösungen immer noch deutlich höher.
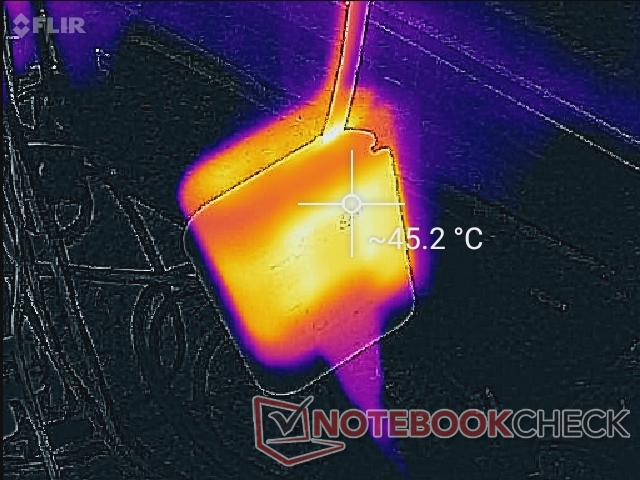
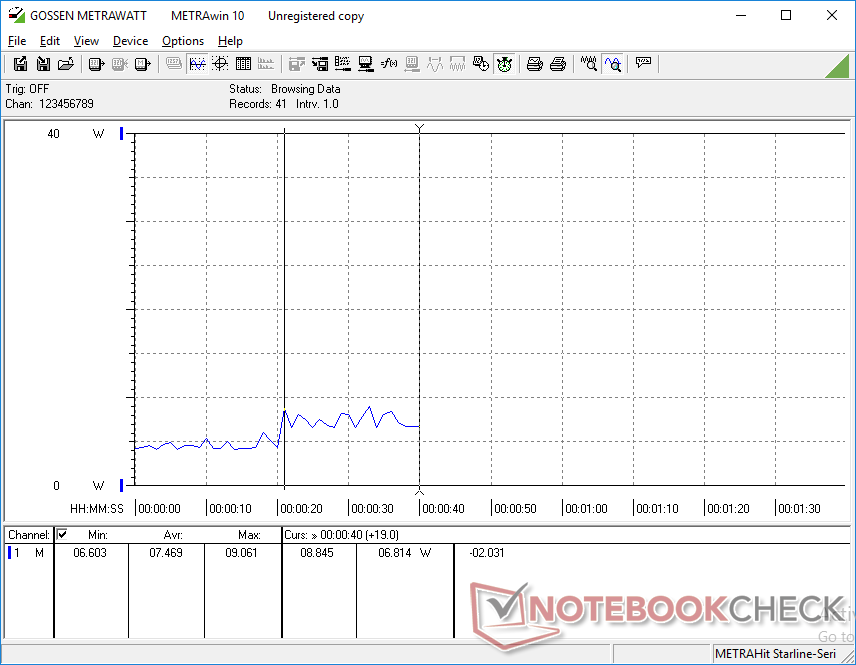
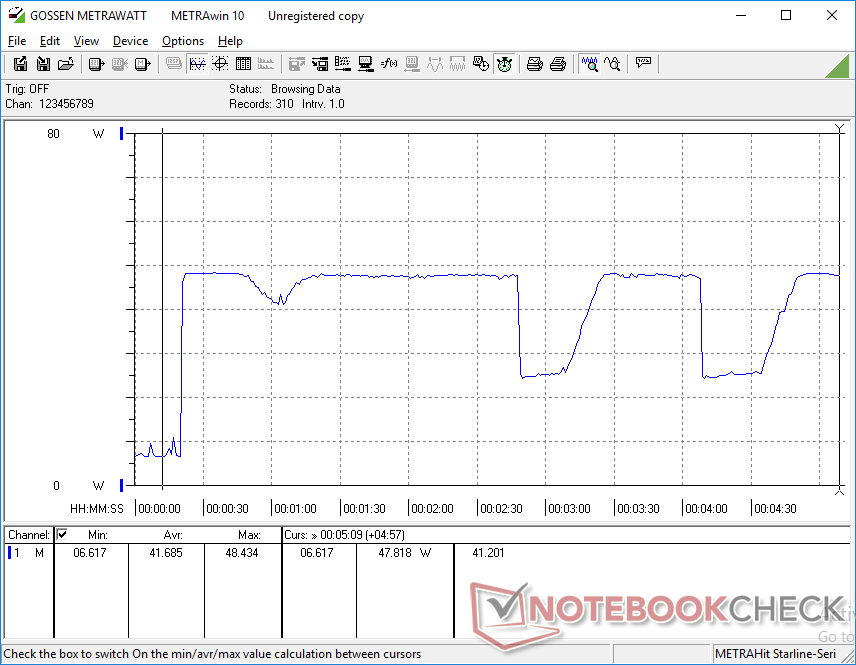
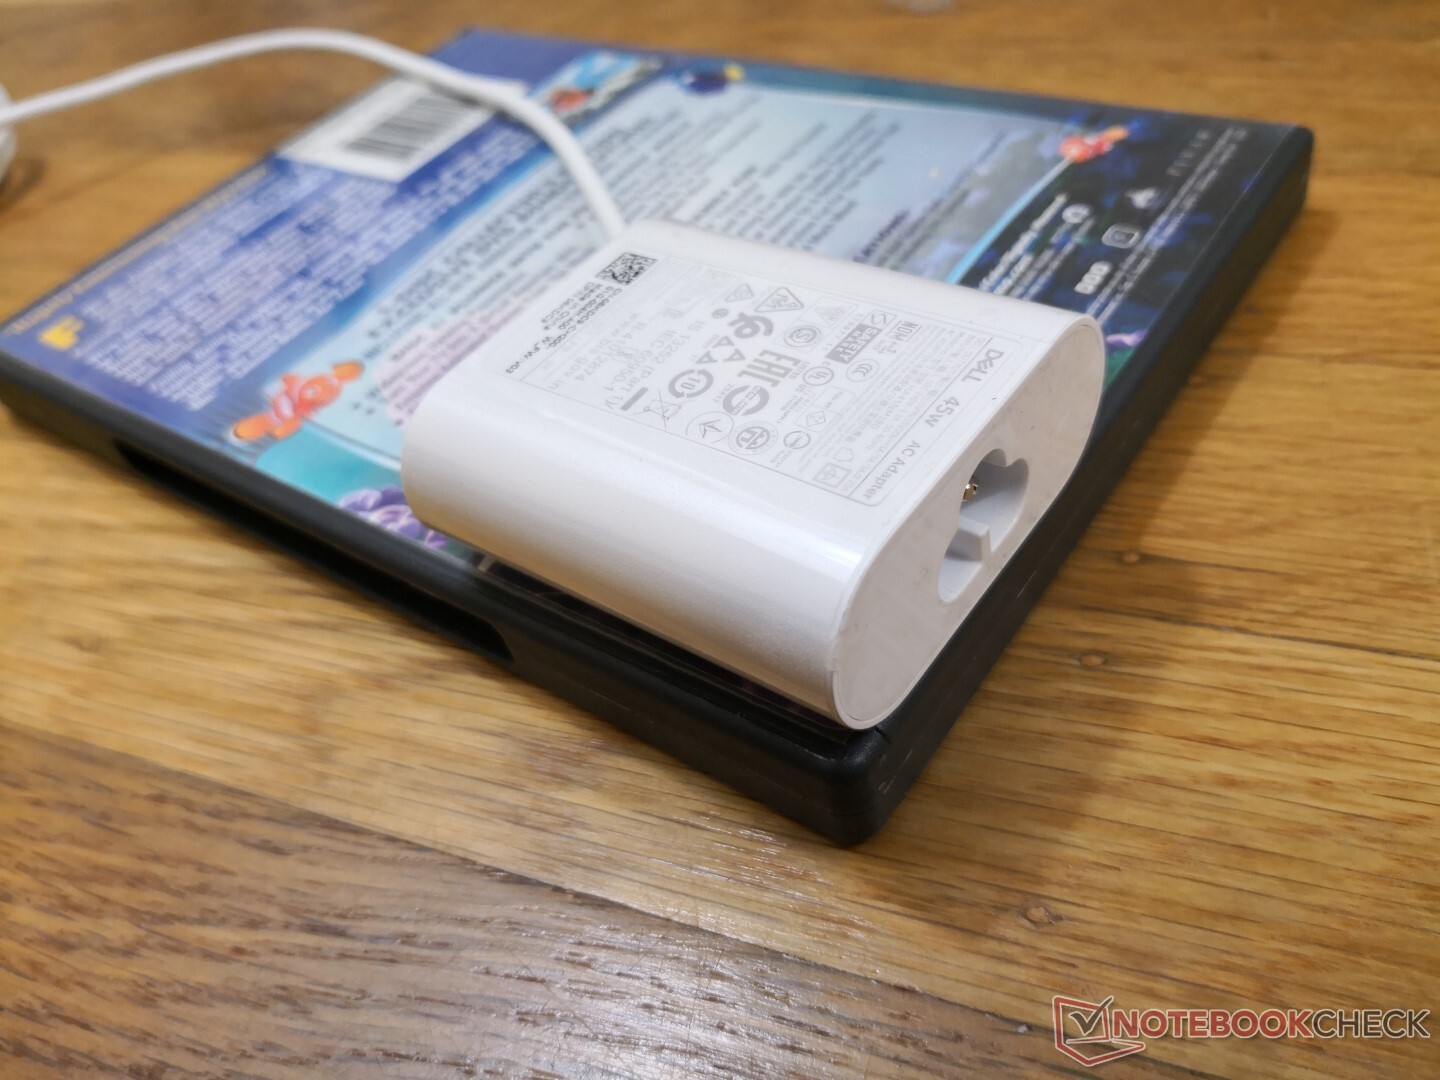
Wir konnten an dem kleinen (~6 x 5,5 x 3,2 cm) 45-W-Netzteil einen maximalen Verbrauch von 48,4 W messen. Wie das Diagramm unten zeigt, kann die Energieaufnahme unter extrem hoher Last stark schwanken, was sich mit den oben aufgezeichneten, schwankenden Taktfrequenzen und den Ergebnissen unseres Cinebench-Schleifentests deckt.
| Aus / Standby | |
| Idle | |
| Last |
|
Legende:
min: Derzeit nutzen wir das Metrahit Energy, ein professionelles TRMS Leistungs-Multimeter und PQ Analysator, für unsere Messungen. Mehr Details zu dem Messgerät finden Sie hier. Alle unsere Testmethoden beschreiben wir in diesem Artikel. | |
| Dell XPS 13 9300 Core i7-1065G7 i7-1065G7, Iris Plus Graphics G7 (Ice Lake 64 EU), Intel SSDPEMKF512G8 NVMe SSD, IPS, 1920x1200, 13.40 | Dell XPS 13 7390 Core i7-10710U i7-10710U, UHD Graphics 620, SK Hynix PC601 NVMe 512 GB, IPS, 3840x2160, 13.30 | Dell XPS 13 7390 2-in-1 Core i7 i7-1065G7, Iris Plus Graphics G7 (Ice Lake 64 EU), Toshiba BG4 KBG40ZPZ512G, IPS, 1920x1200, 13.40 | Huawei Matebook X Pro i5 i5-8250U, GeForce MX150, Samsung PM961 MZVLW256HEHP, IPS, 3000x2000, 13.90 | Asus ZenBook S13 UX392FN i7-8565U, GeForce MX150, WDC PC SN520 SDAPNUW-512G, IPS, 1920x1080, 13.90 | Microsoft Surface Laptop 3 13 Core i5-1035G7 i5-1035G7, Iris Plus Graphics G7 (Ice Lake 64 EU), SK hynix BC501 HFM256GDGTNG, IPS, 2256x1504, 13.50 | Dell XPS 13 9300 i5 FHD i5-1035G1, UHD Graphics G1 (Ice Lake 32 EU), Toshiba XG6 KXG60ZNV512G, IPS, 1920x1200, 13.40 | |
|---|---|---|---|---|---|---|---|
| Stromverbrauch | -16% | 4% | -27% | -17% | -14% | -3% | |
| Idle min * | 4.2 | 4.7 -12% | 2.6 38% | 3.5 17% | 3.4 19% | 4.4 -5% | 3.4 19% |
| Idle avg * | 6.9 | 8.3 -20% | 5.3 23% | 8.9 -29% | 6.3 9% | 7.5 -9% | 6 13% |
| Idle max * | 7.5 | 9 -20% | 7 7% | 12.3 -64% | 10.4 -39% | 7.8 -4% | 10.2 -36% |
| Last avg * | 33.3 | 42 -26% | 43.1 -29% | 54.2 -63% | 51 -53% | 41.9 -26% | 36.6 -10% |
| Witcher 3 ultra * | 37.1 | 43.1 -16% | 42.4 -14% | 39 -5% | 40.8 -10% | ||
| Last max * | 48.4 | 49 -1% | 49 -1% | 52.1 -8% | 62.7 -30% | 63.9 -32% | 49.3 -2% |
* ... kleinere Werte sind besser
Akkulaufzeit
Mit 12 bis 13 Stunden praxisnaher WLAN-Laufzeit liegt die Akkulaufzeit auf einem ähnlichen Niveau wie beim XPS 13 9300 Core i5. Sie ist außerdem länger als bei konkurrierenden Ultrabooks wie dem HP Spectre x360 13, welches mit der gleichen Ice-Lake-CPU und einem größeren 60-Wh-Akku ausgerüstet ist.
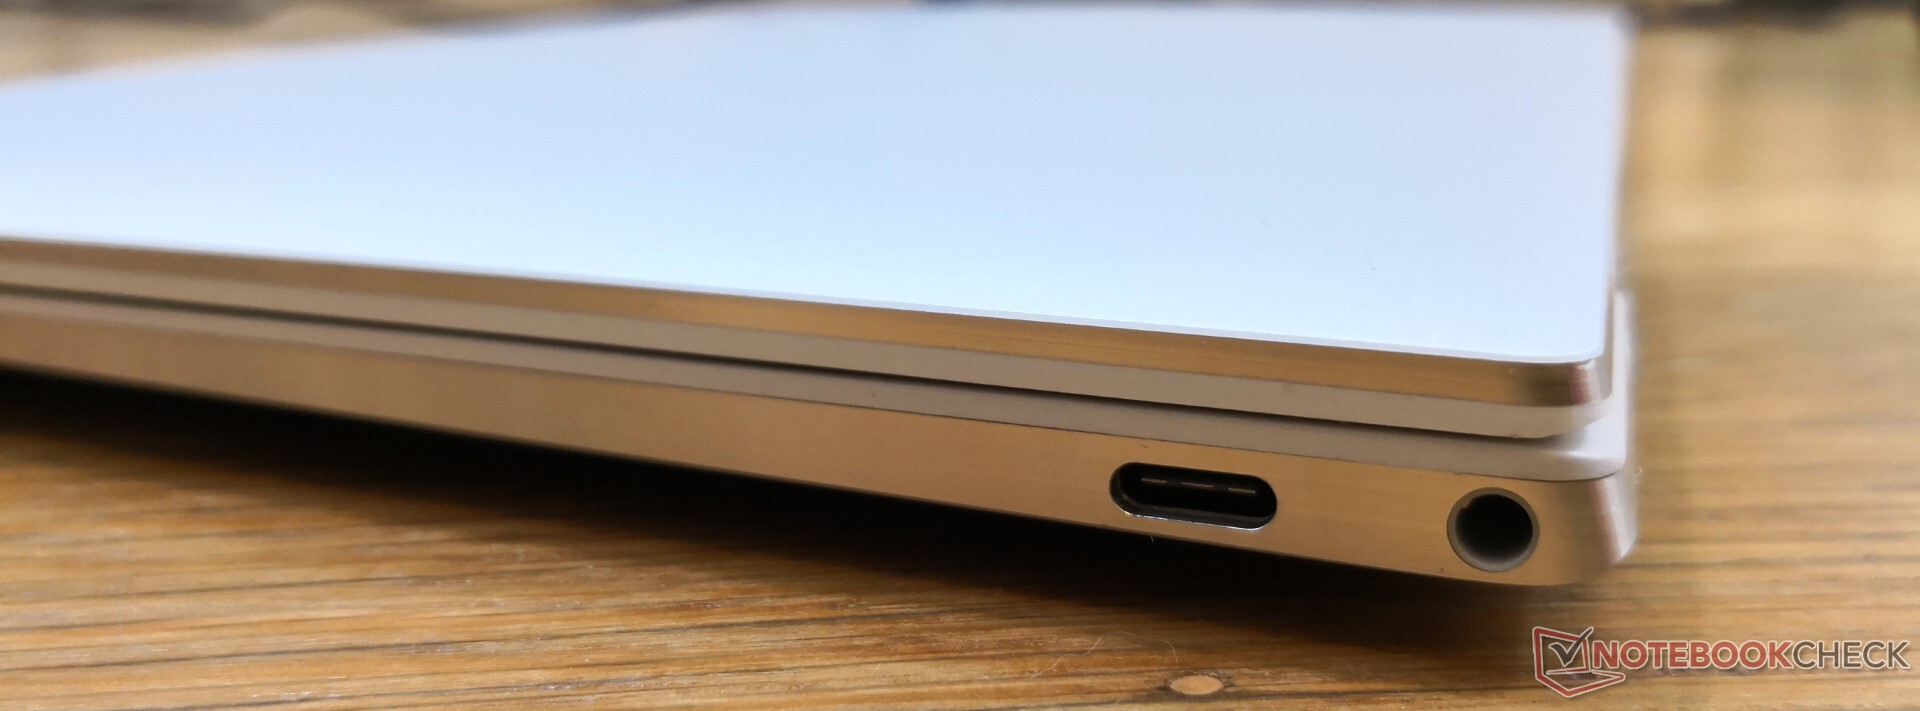
Den leeren Akku vollständig aufzuladen dauert ca. zwei Stunden. Mit dem Netzteil können auch andere USB-C-Geräte wie Smartphones, Tablets und die Nintendo Switch geladen werden.
| Dell XPS 13 9300 Core i7-1065G7 i7-1065G7, Iris Plus Graphics G7 (Ice Lake 64 EU), 52 Wh | Dell XPS 13 7390 Core i7-10710U i7-10710U, UHD Graphics 620, 52 Wh | Dell XPS 13 7390 2-in-1 Core i7 i7-1065G7, Iris Plus Graphics G7 (Ice Lake 64 EU), 51 Wh | Huawei Matebook X Pro i5 i5-8250U, GeForce MX150, 57.4 Wh | Asus ZenBook S13 UX392FN i7-8565U, GeForce MX150, 50 Wh | Microsoft Surface Laptop 3 13 Core i5-1035G7 i5-1035G7, Iris Plus Graphics G7 (Ice Lake 64 EU), 45 Wh | Dell XPS 13 9300 i5 FHD i5-1035G1, UHD Graphics G1 (Ice Lake 32 EU), 52 Wh | |
|---|---|---|---|---|---|---|---|
| Akkulaufzeit | -34% | -30% | -27% | -34% | -35% | -8% | |
| WLAN | 763 | 501 -34% | 537 -30% | 557 -27% | 506 -34% | 495 -35% | 703 -8% |
| Idle | 1243 | 1710 | 2064 | ||||
| Last | 133 | 99 | 112 | 205 |
Pro
Contra
Fazit
Beim Sprung von einem Core-i5-1035G1- zum Core-i7-1065G7-Modell bekommt man trotz gleicher Leistungsaufnahme eine um ca. 23 Prozent höhere CPU-Leistung und eine um ca. 70 Prozent höhere GPU-Leistung. Daher ist der Grafikvorsprung bei einfachen Bildbearbeitungsaufgaben und in Gelegentlichen Rocket-League- oder LoL-Runden das Hauptargument für das Core-i7-Modell. Allerdings ist die Core-i5-Konfiguration mehr als ausreichend, wenn man den Laptop hauptsächlich für die Textverarbeitung oder zum Surfen bzw. Videostreaming verwendet. In diesem Fall sollte man sogar ein Modell mit dem älteren Core i5-8265 oder Core i7-8565U aus der Whiskey-Lake-U-Generation in Erwägung ziehen, da die Leistung des Core i5-1035G1 der seiner Vorgänger sehr ähnlich ist.
Unter extrem hoher Last bricht die CPU-Leistung auf Dauer ein. Für die Zielgruppe des Subnotebooks ist das jedoch vermutlich nicht relevant, da für anspruchsvolle Anwender eher leistungsfähigere Laptops wie das XPS 15 oder das Asus ZenBook Pro infrage kommen.
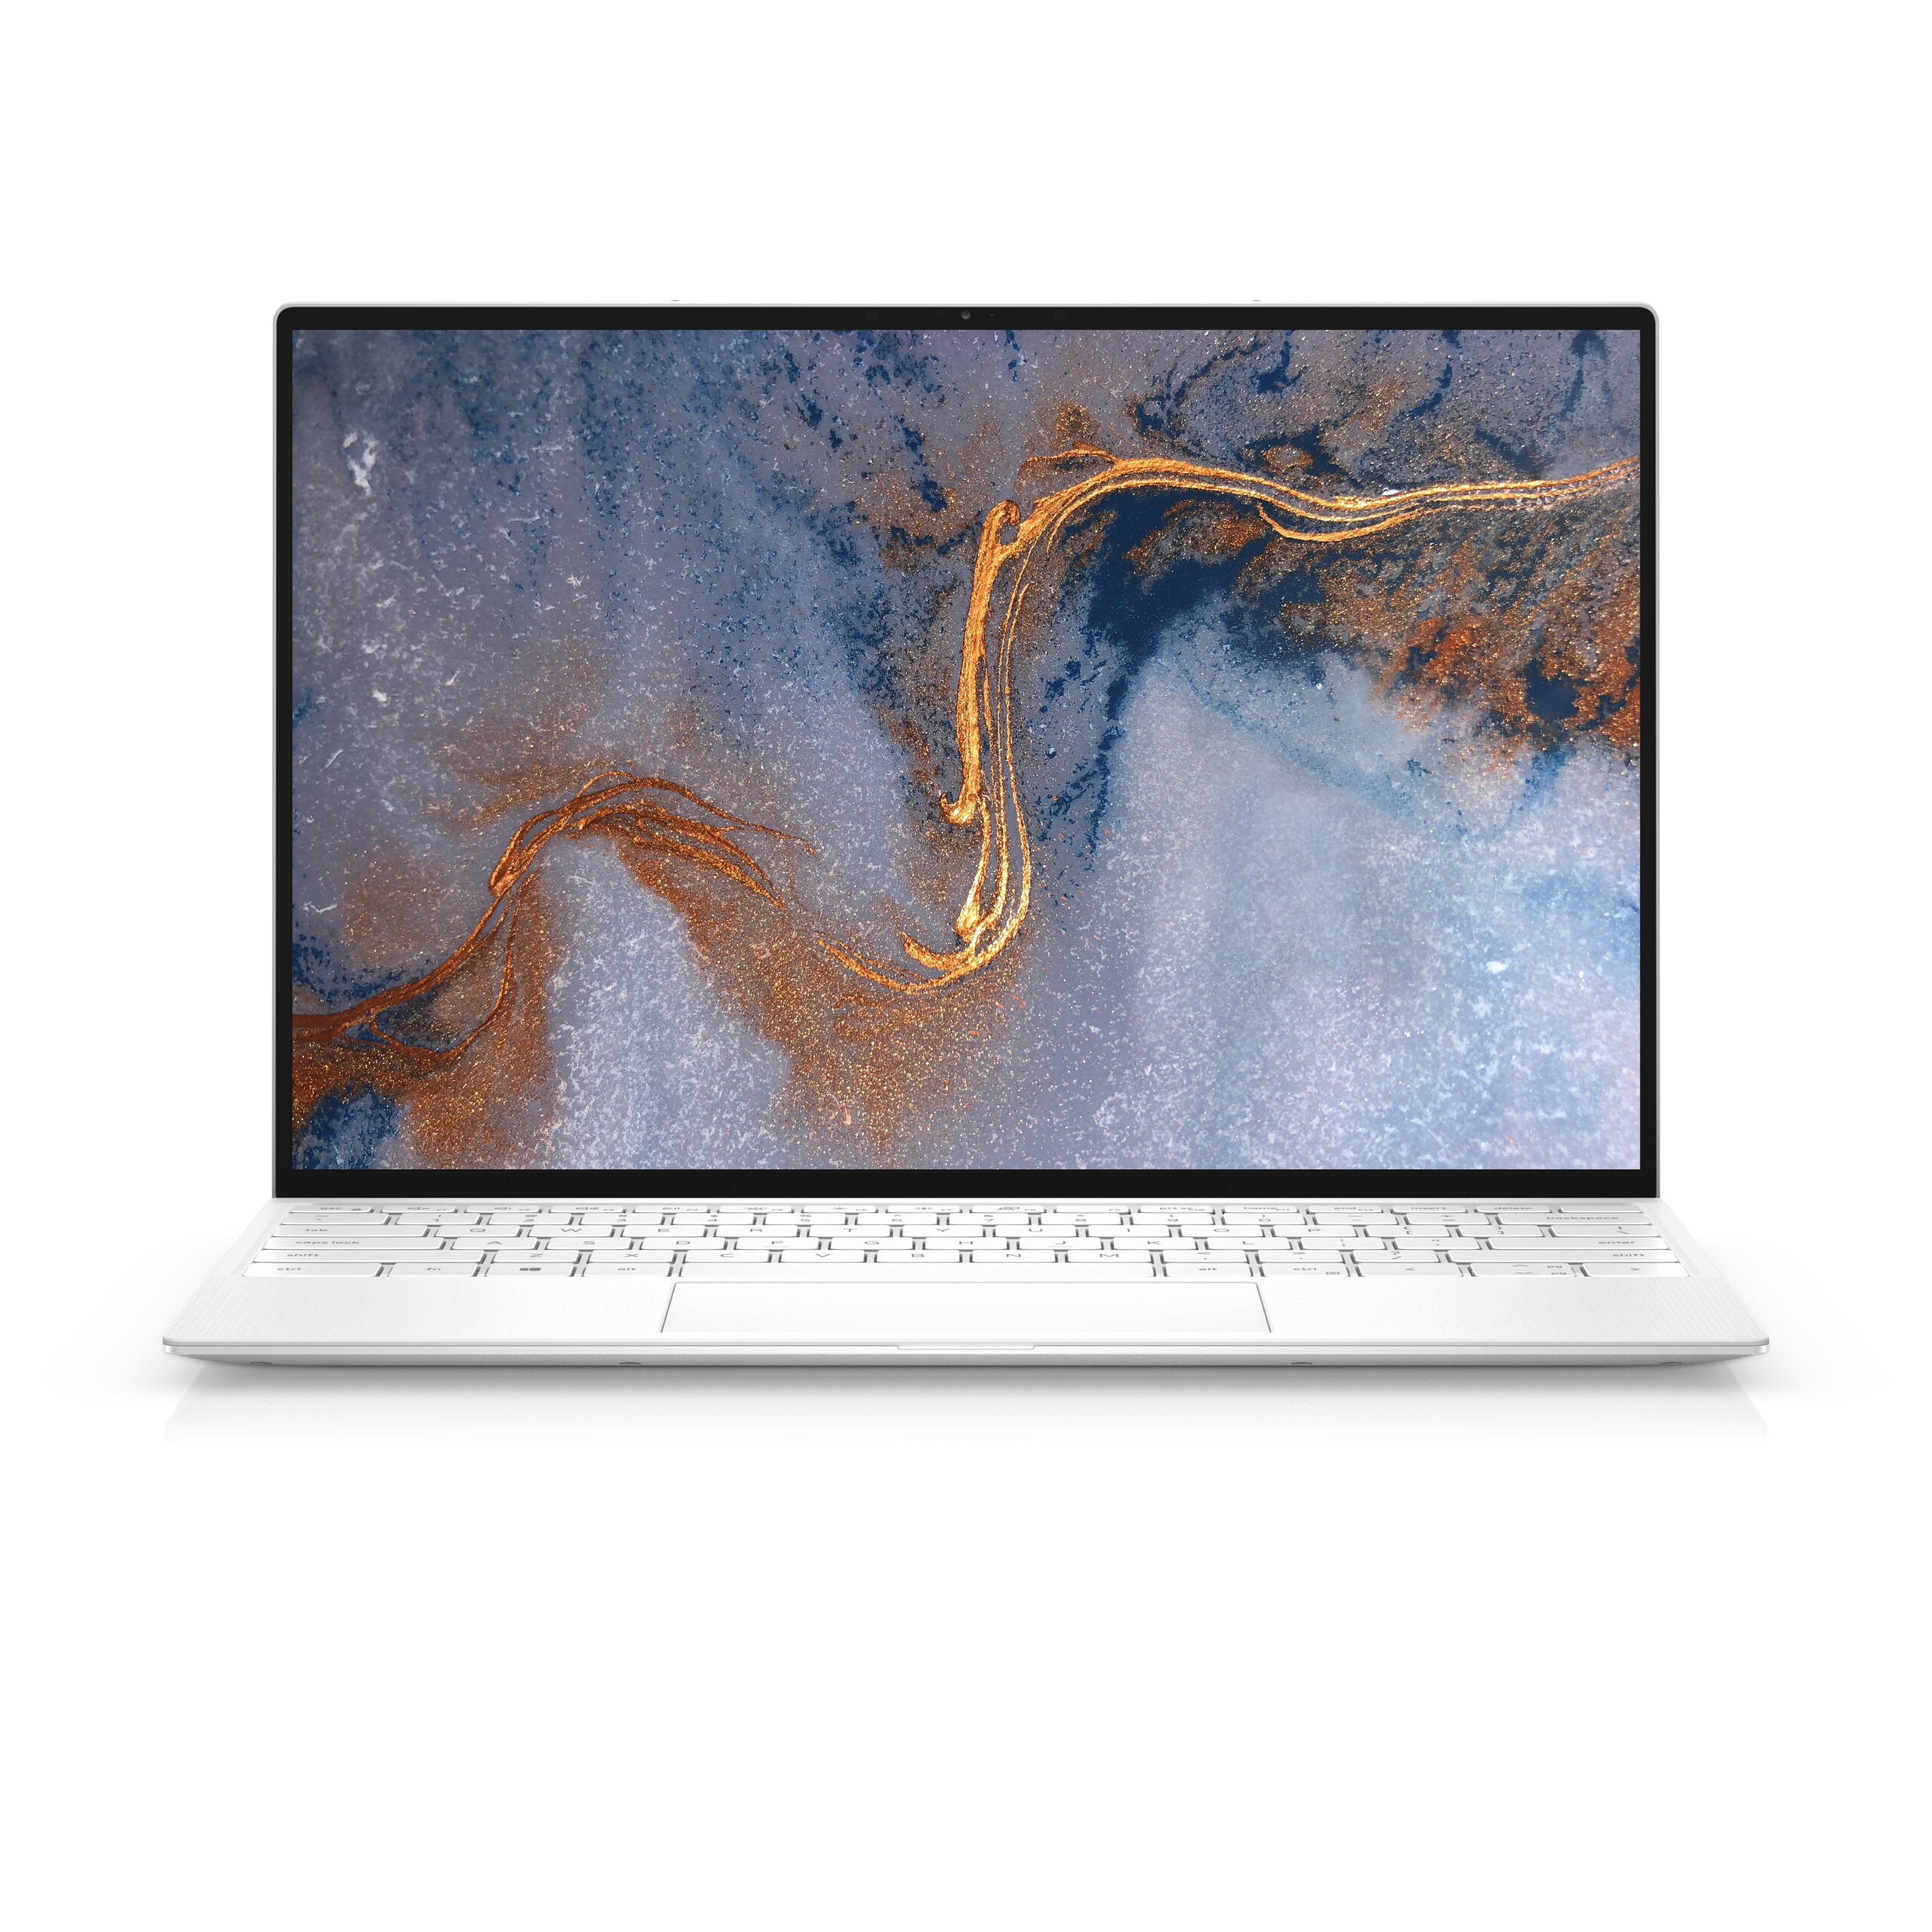
Ein besseres Verkaufsargument für das XPS 13 9300 ist das größere 16:10-Display, dessen Vorteile offensichtlicher sind als das minimal höhere Leistungsniveau. Hierbei handelt es sich um einen klugen Schachzug von Dell, mit dem der Hersteller möglicherweise versucht, MacBook-Air- und MacBook-Pro-13-Nutzer anzulocken, die die Vorzüge von 16:10-Displays schon seit Jahren genießen. Unserer Ansicht nach ist dieses Seitenverhältnis ein guter Kompromiss zwischen den klassischen 16:9-Laptops und reinrassigen 3:2-Bürolaptops wie dem Huawei MateBook X Pro bzw. Geräten aus der Microsoft-Surface-Reihe.
Das XPS 13 wird als Alternative zum MacBook jedes Jahr attraktiver. Das neueste Design hat ein größeres 16:10-Display und ein größeres ClickPad spendiert bekommen, ohne dafür wichtige Funktionsmerkmale des Vorgängers opfern zu müssen.
Dell XPS 13 9300 Core i7-1065G7
-
25.03.2020 v7
Allen Ngo


Preisvergleich

