Notebookcheck Logo

Intel NUC 11 Beast Canyon mit Core i9 und RTX 3060 im Test

Kompakter Kraftprotz! Intel schraubt mit dem Intel NUC 11 Extreme Compute Element die Leistung noch einmal nach oben. In dem Beast Canyon kommt das neue Compute Element zum Einsatz in sorgt zusammen mit einer dedizierten Nvidia GPU für ein potentes und kompaktes Gaming-System. Wie gut das System gegen vergleichbare Desktop-Systeme abscheidet, erfahren Sie in diesem Review.

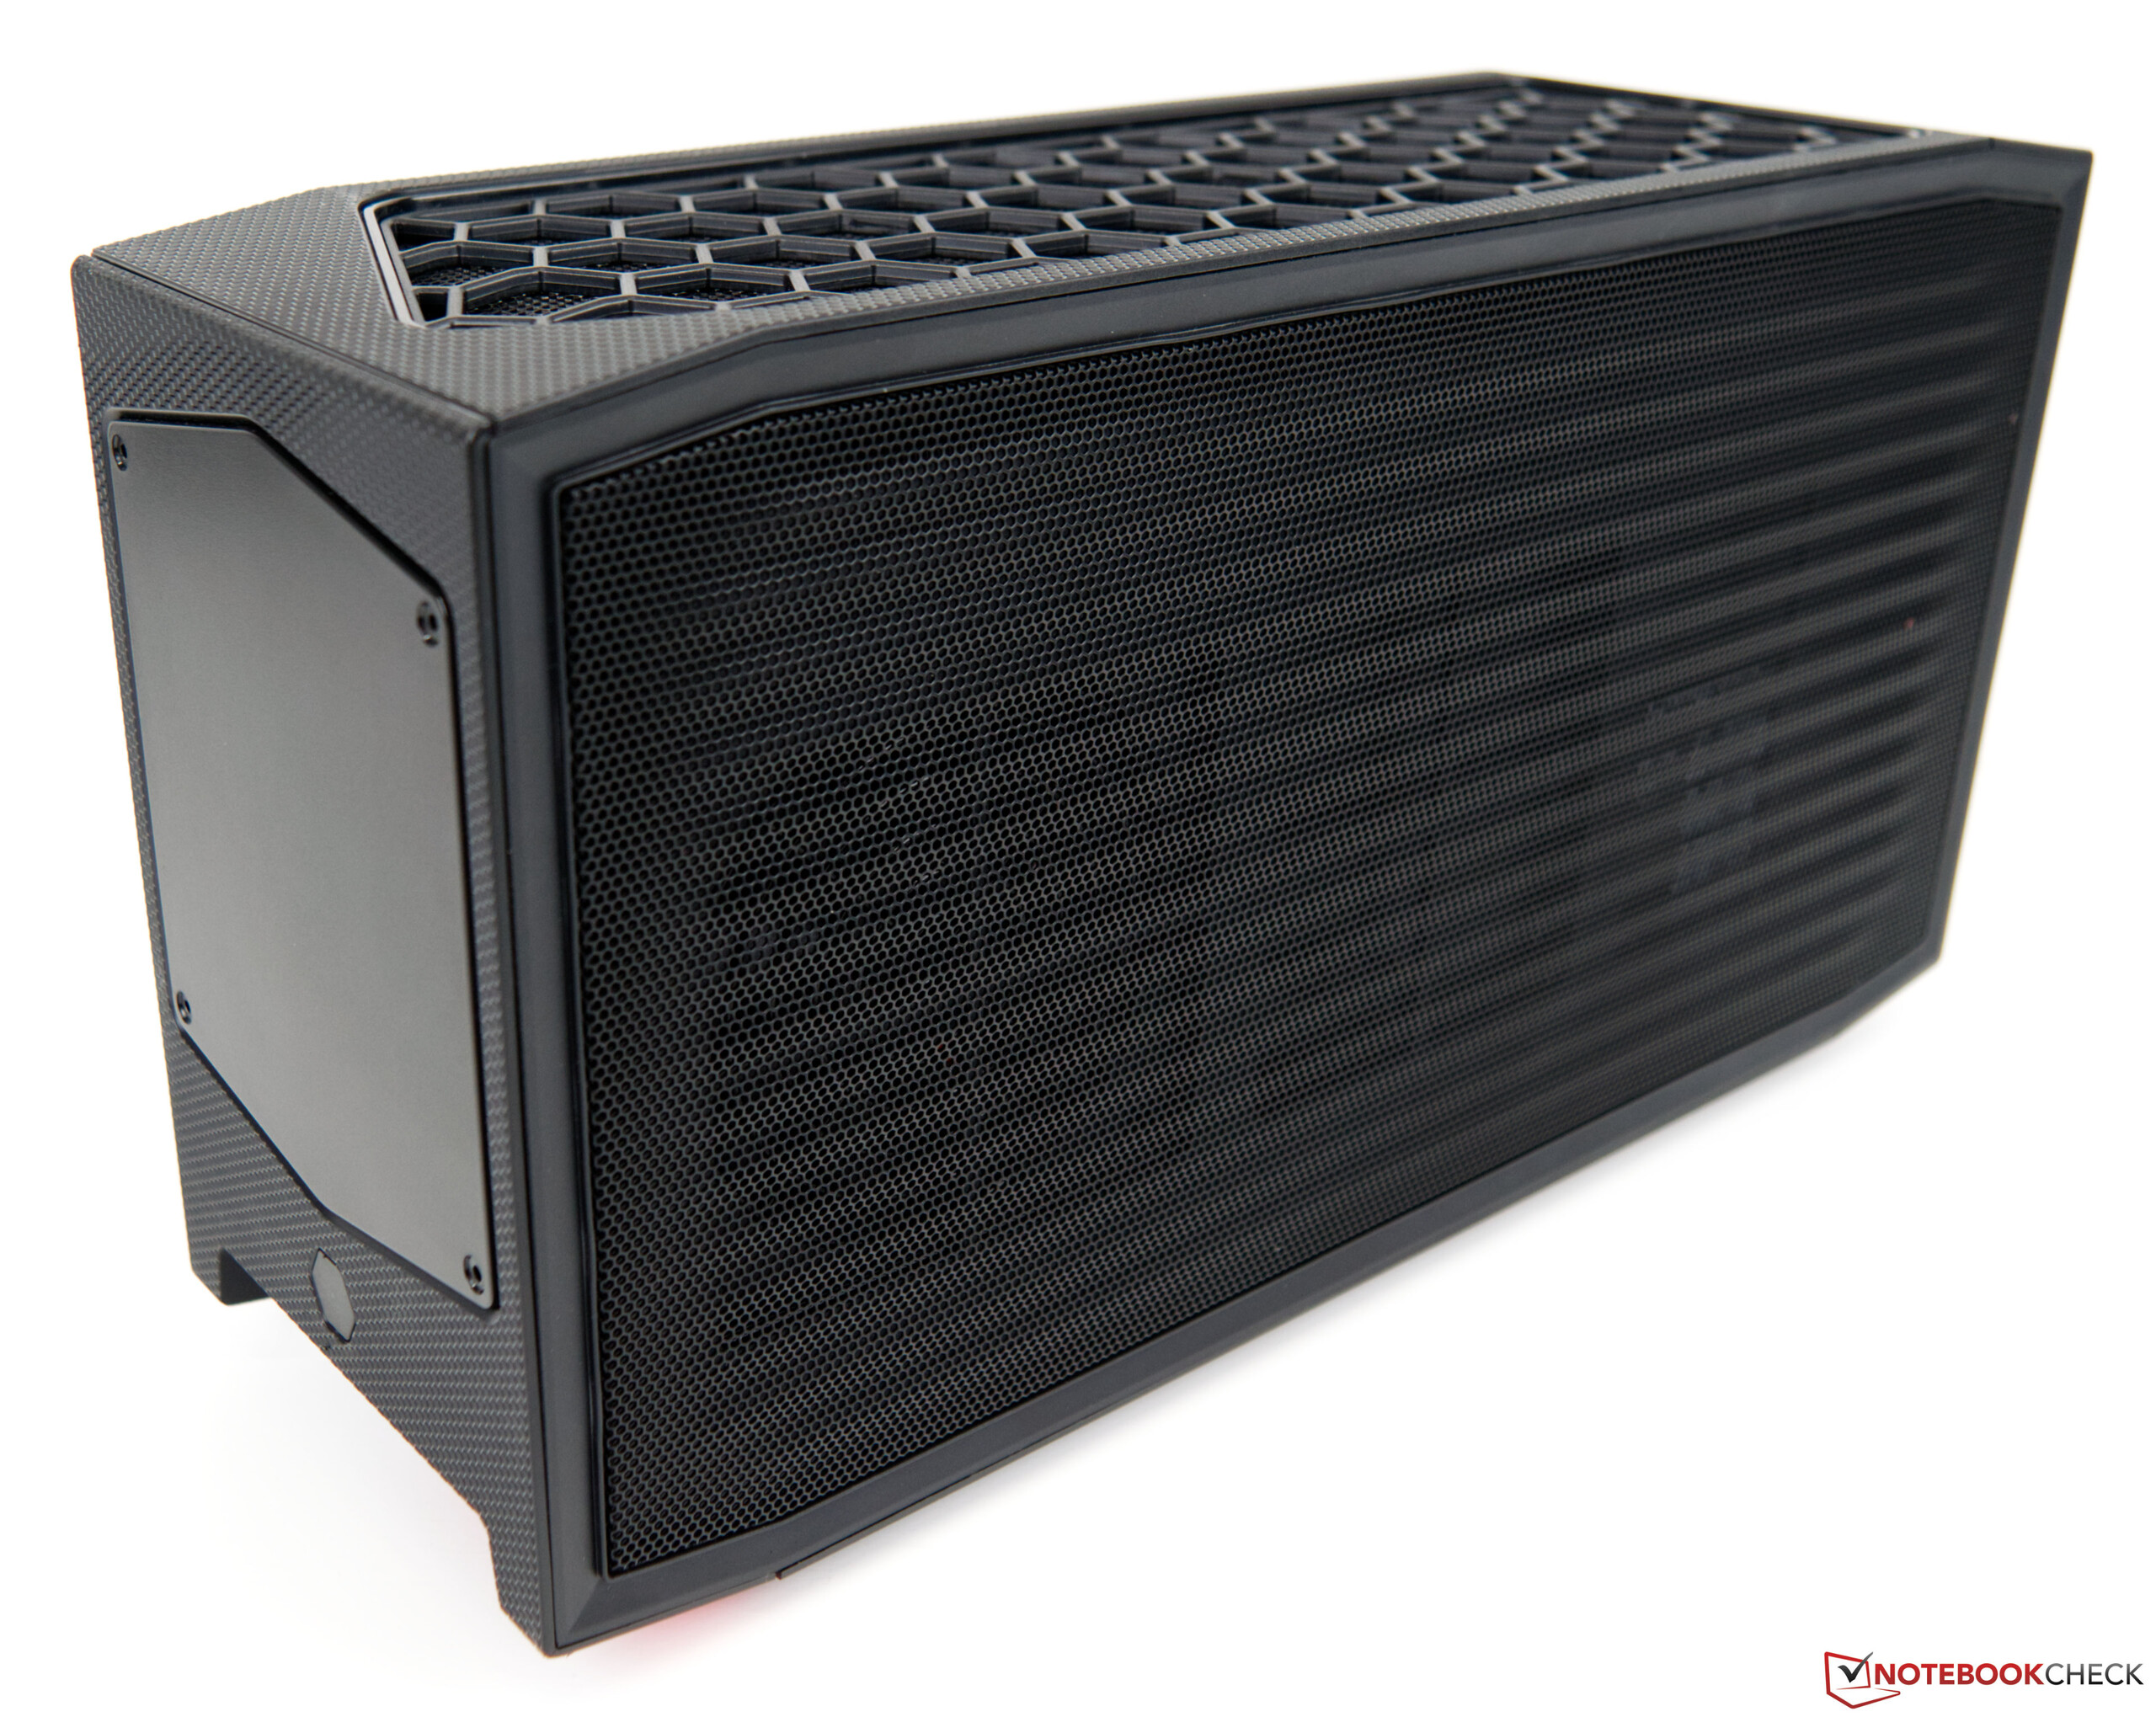
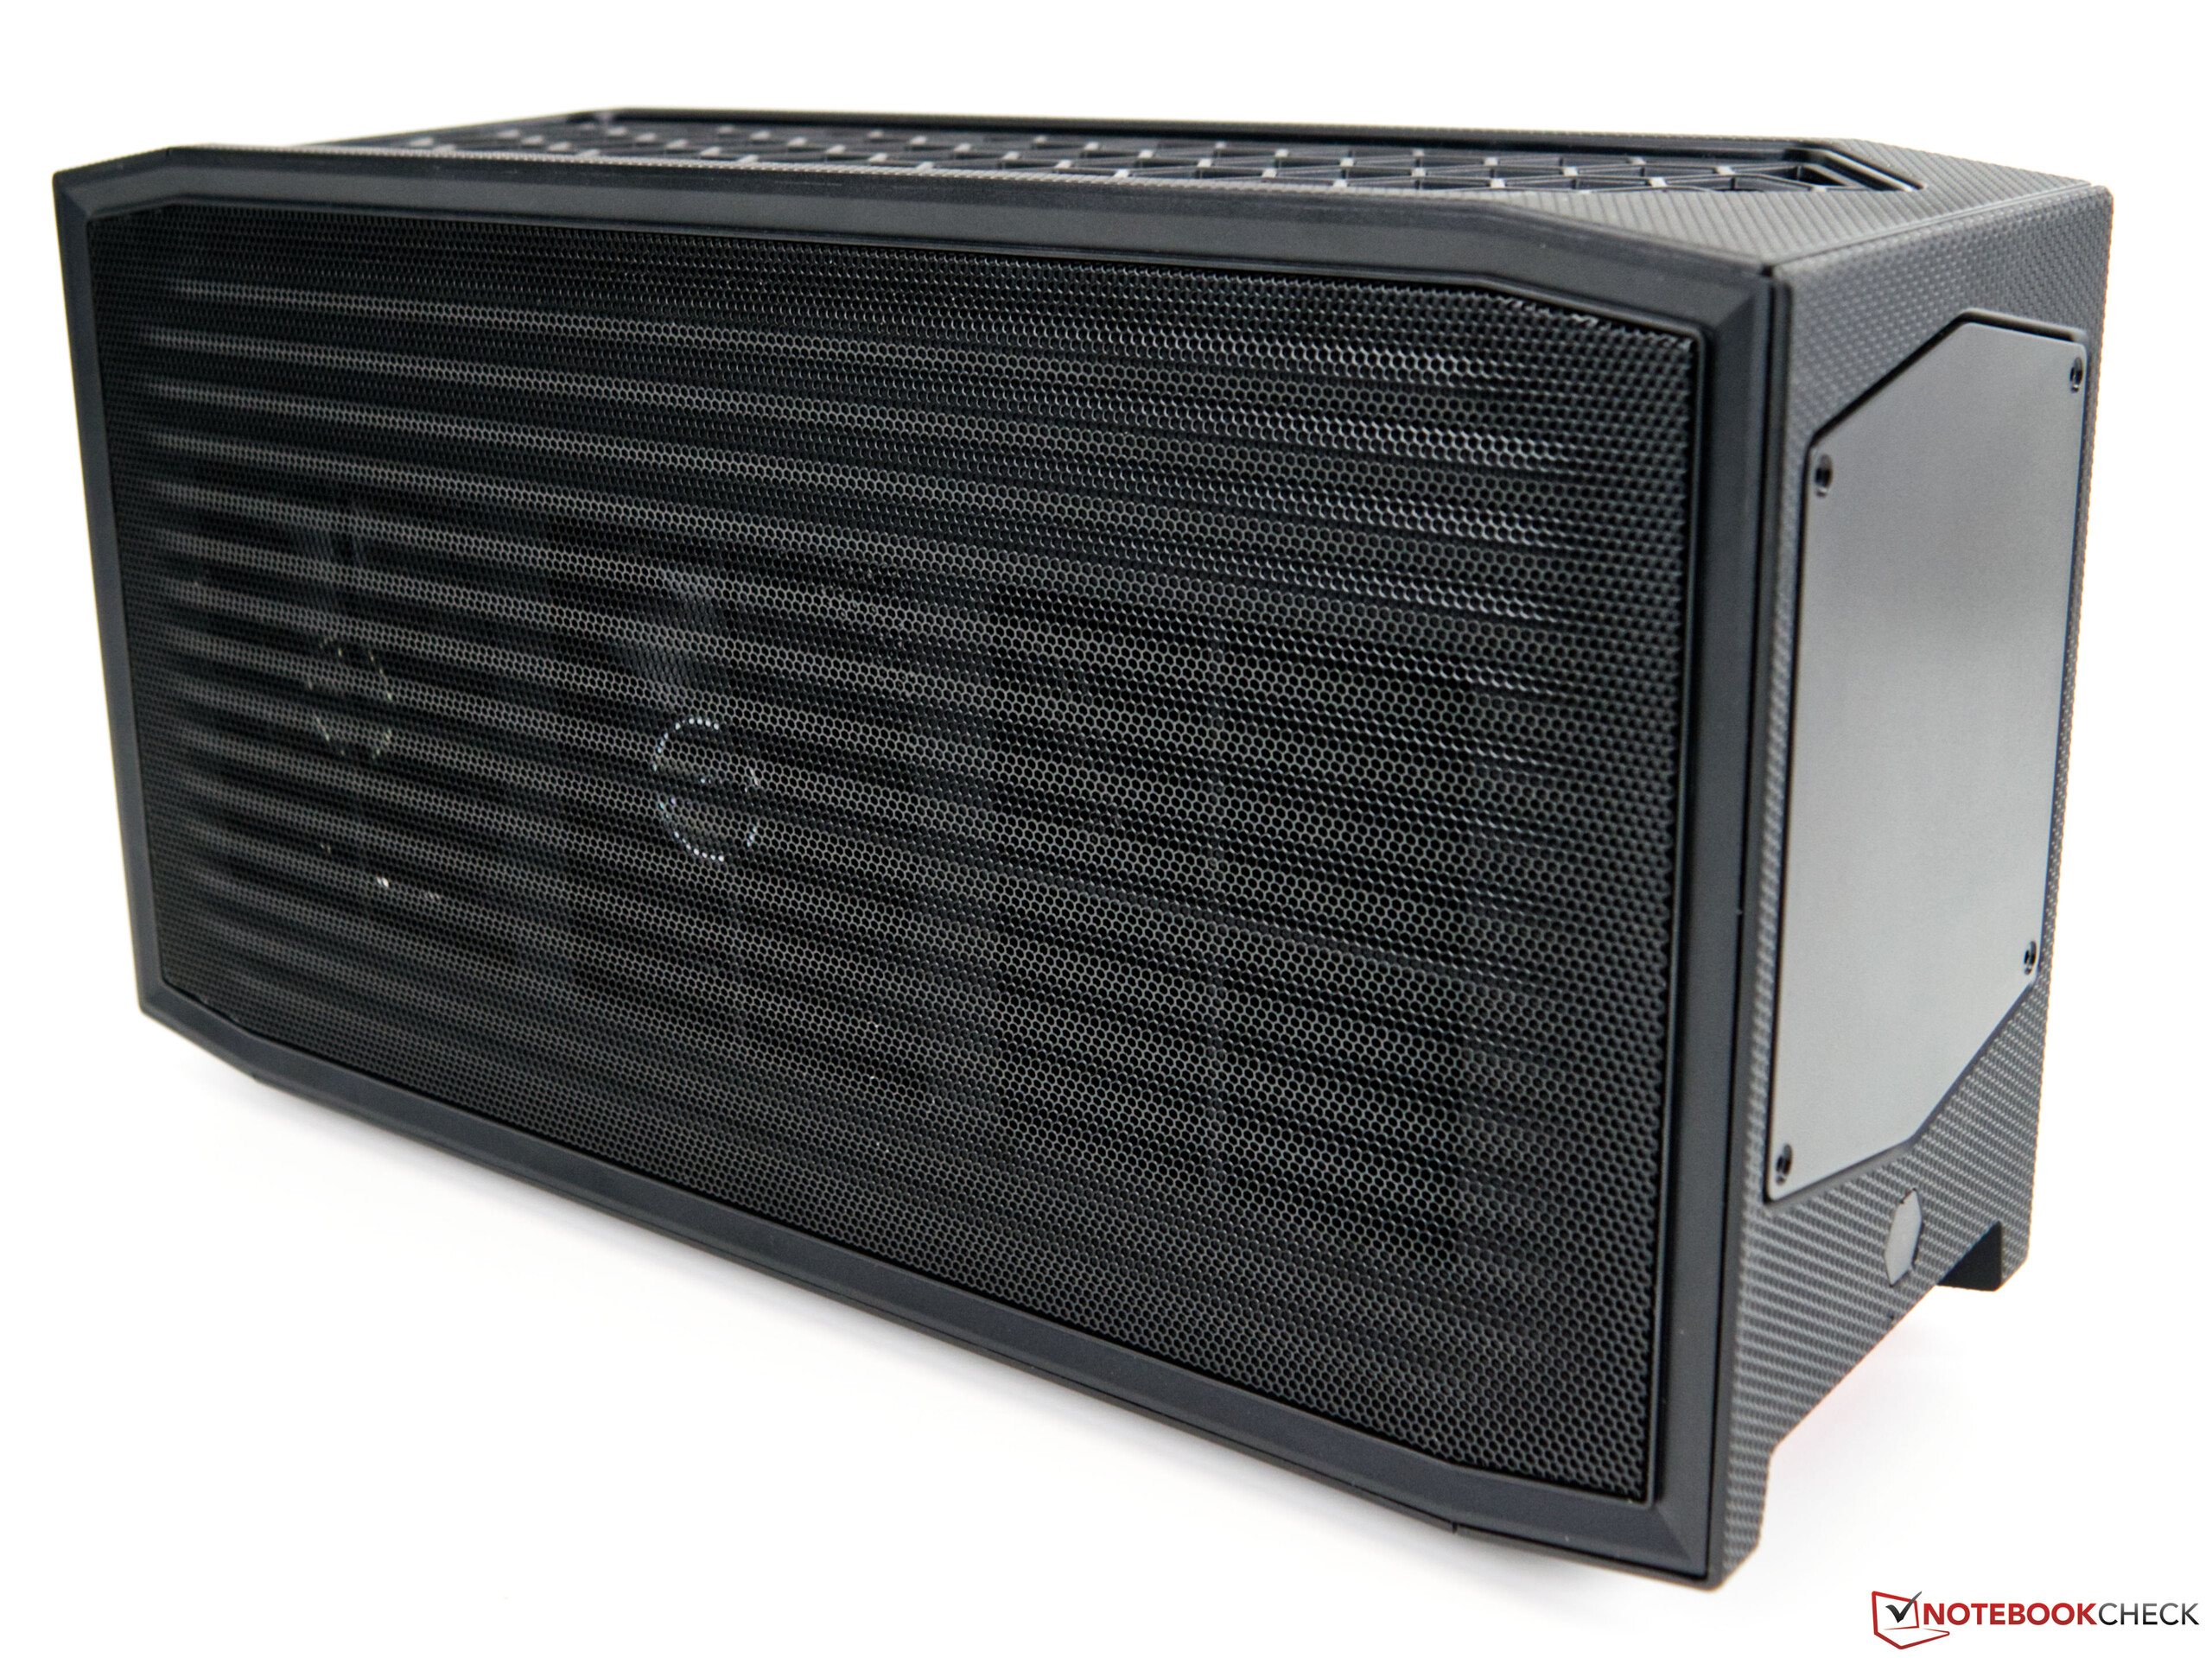
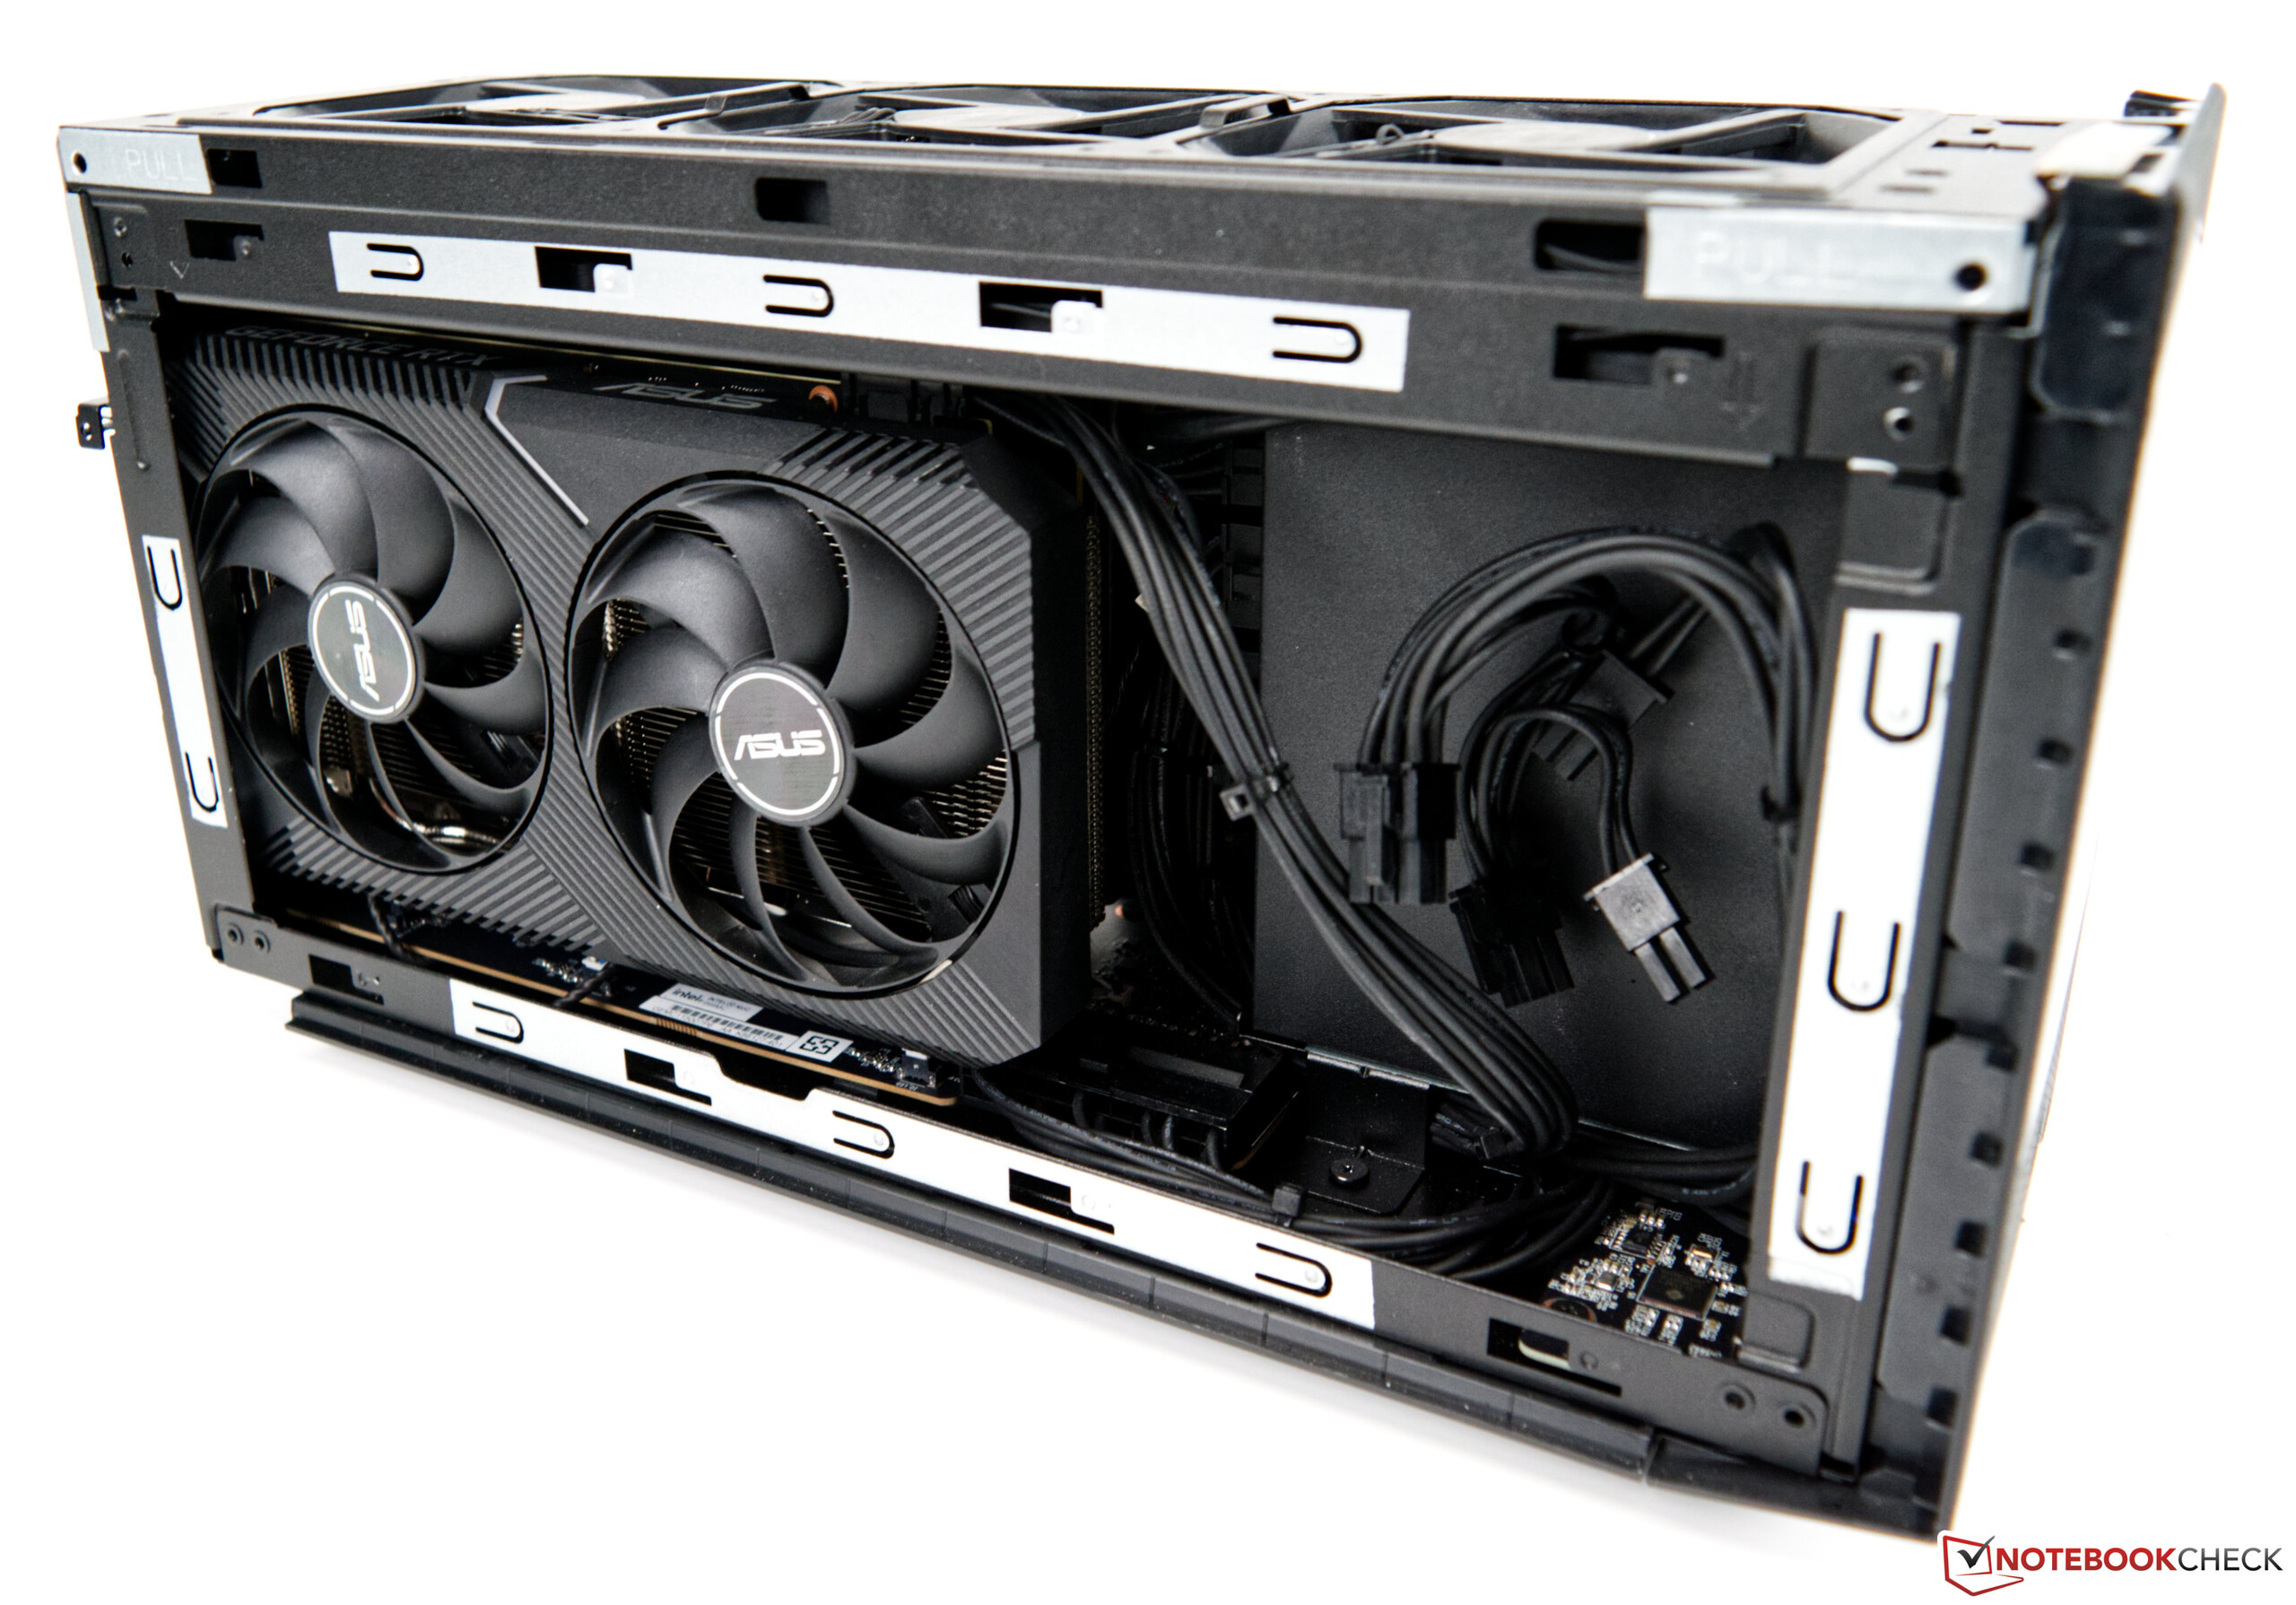
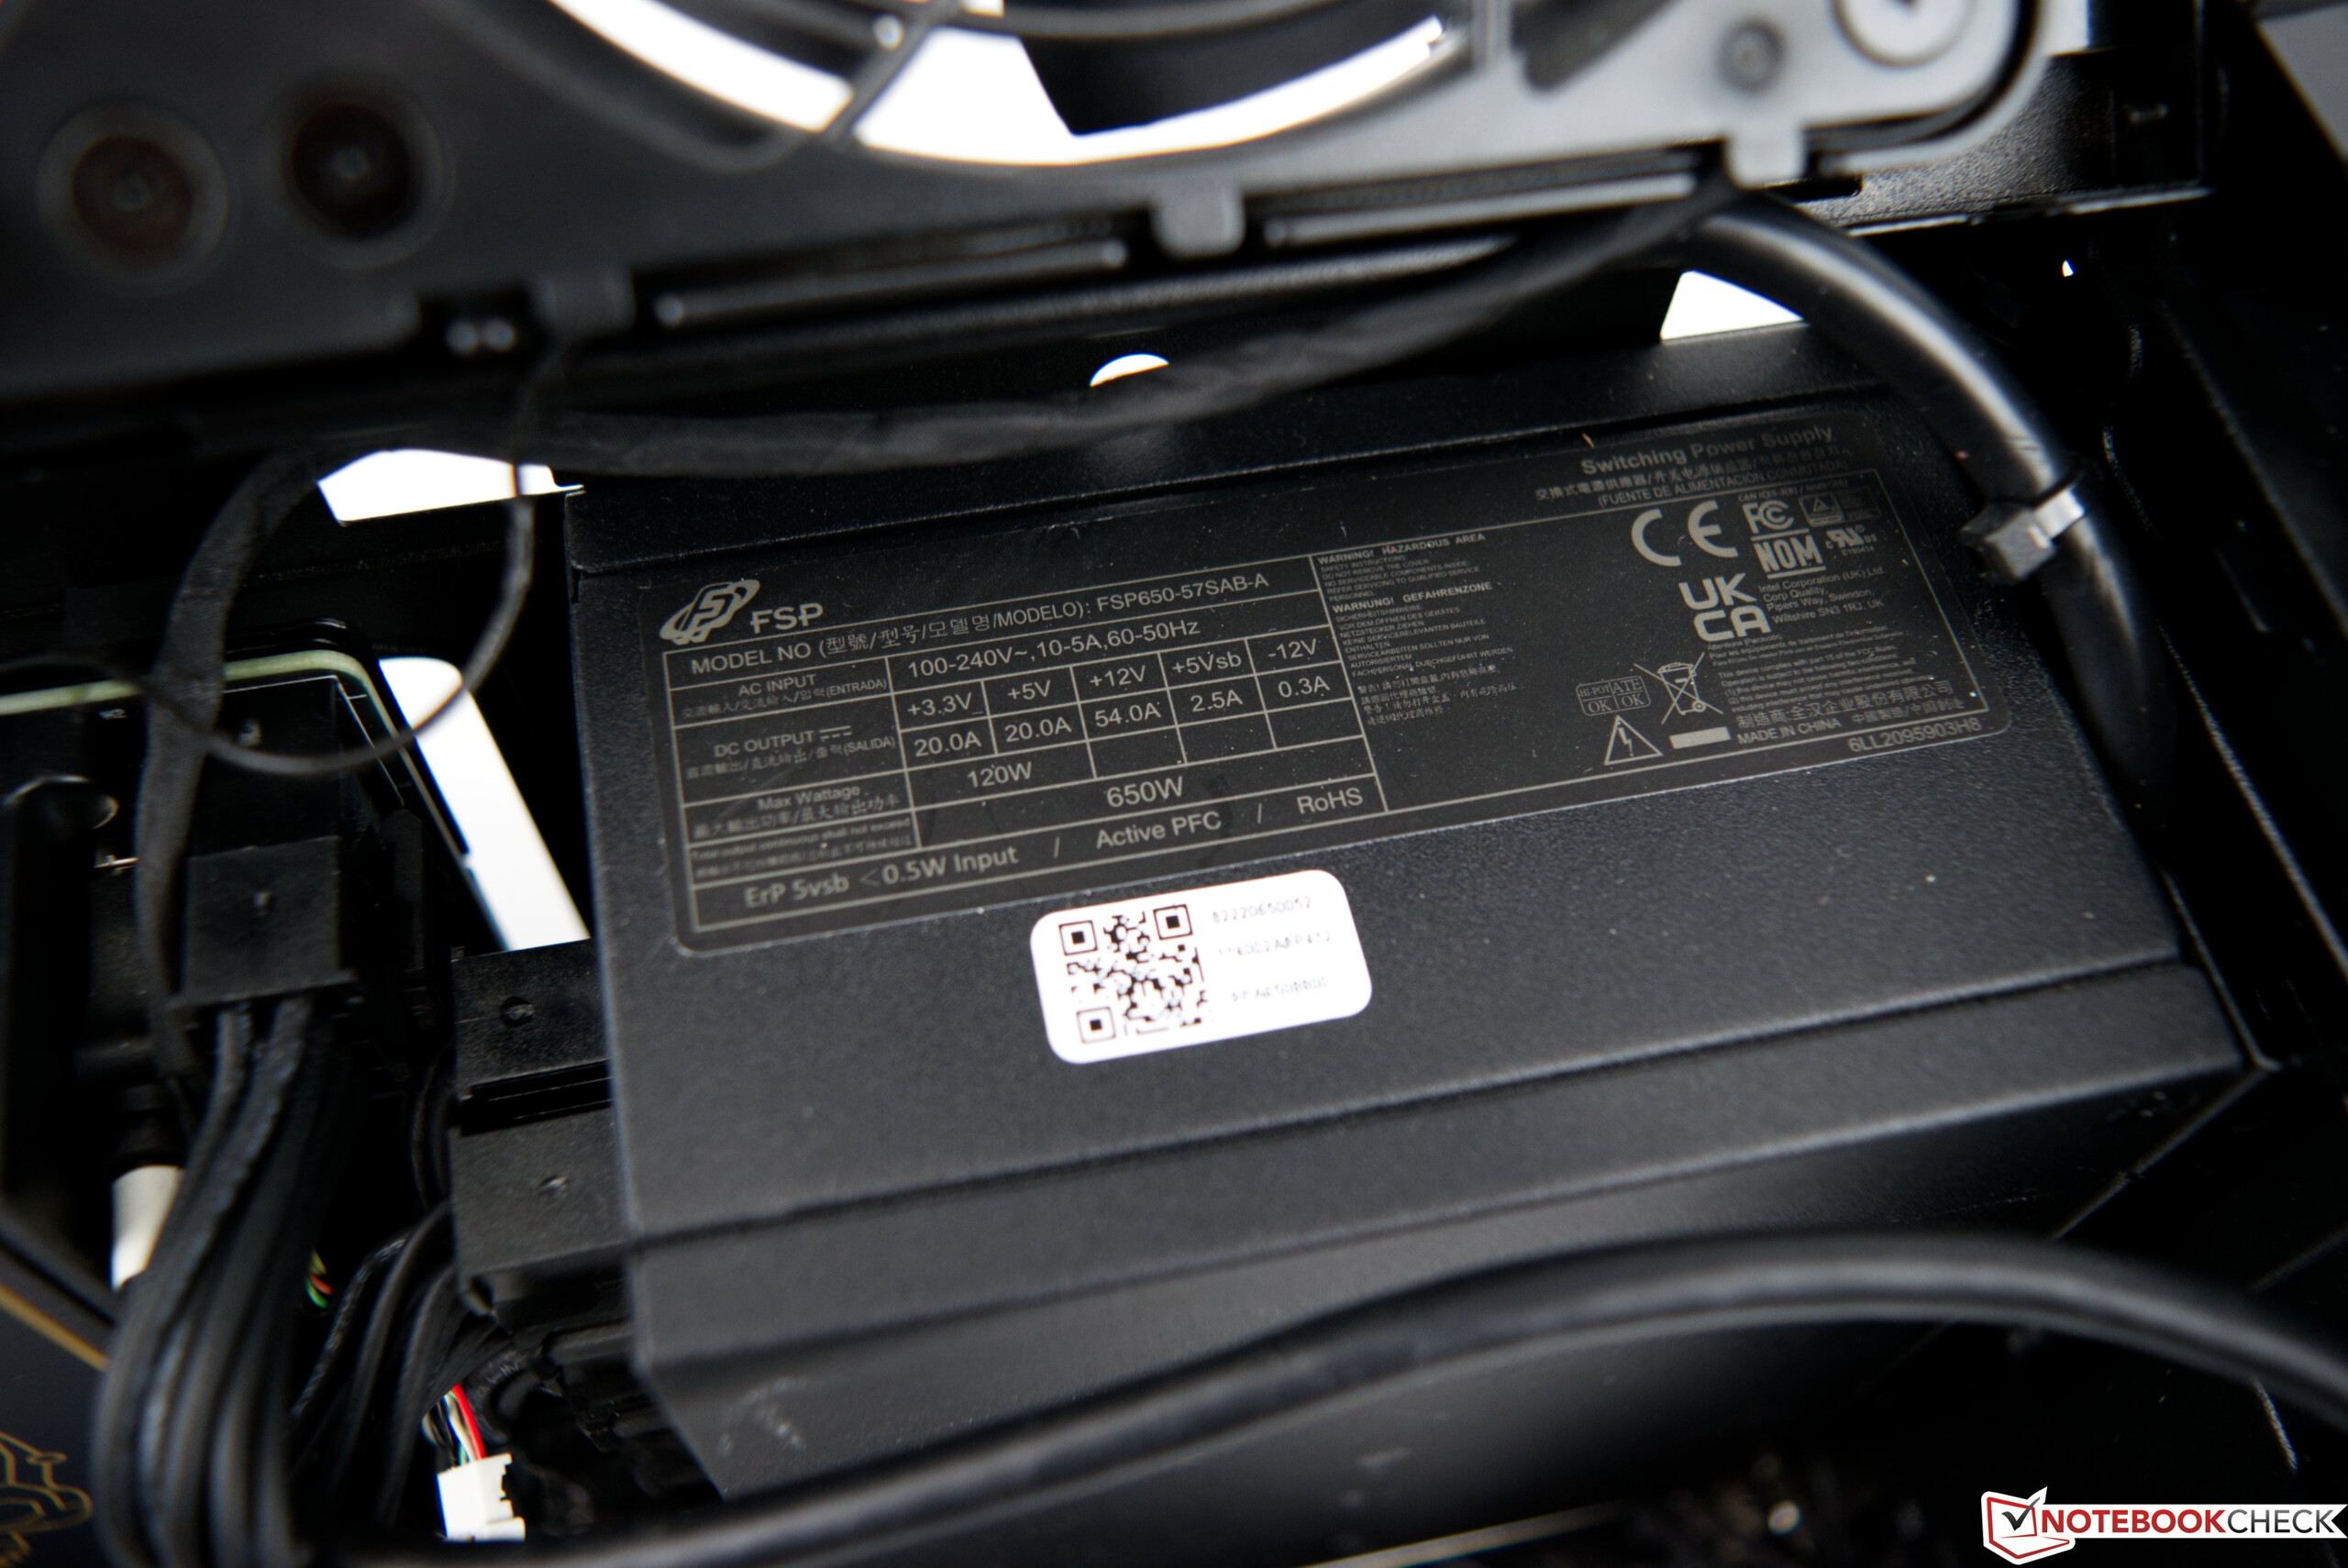
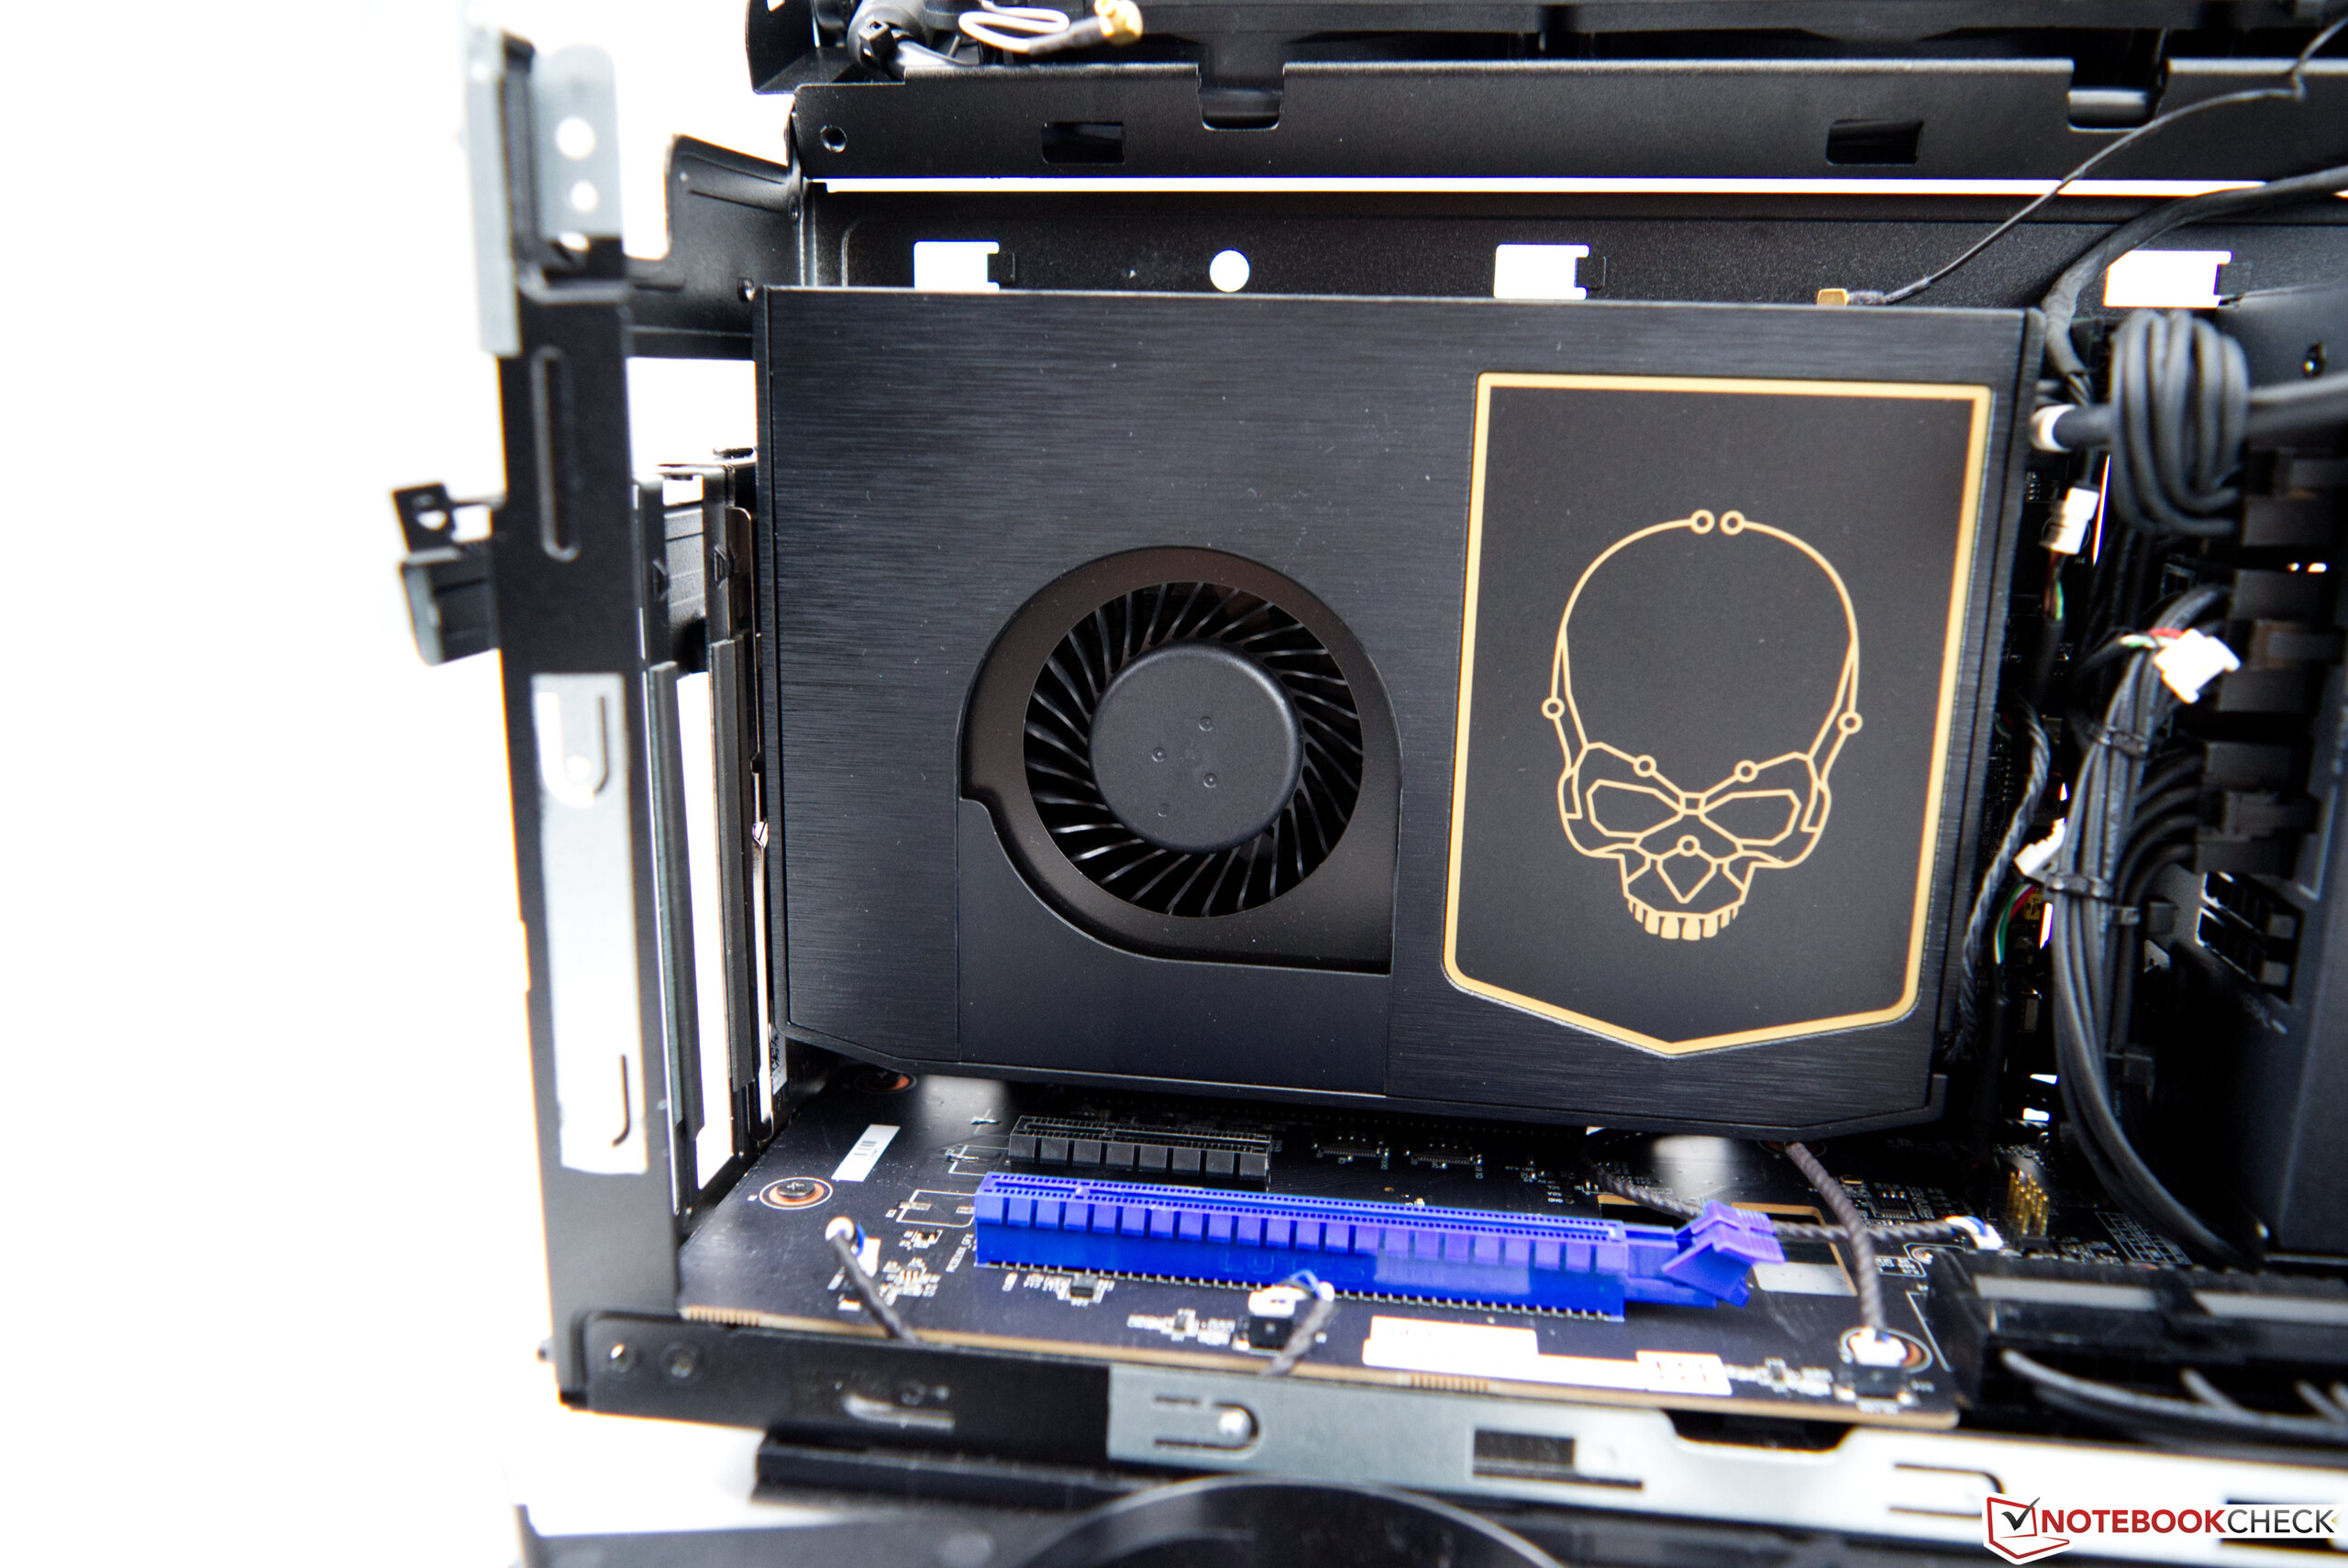
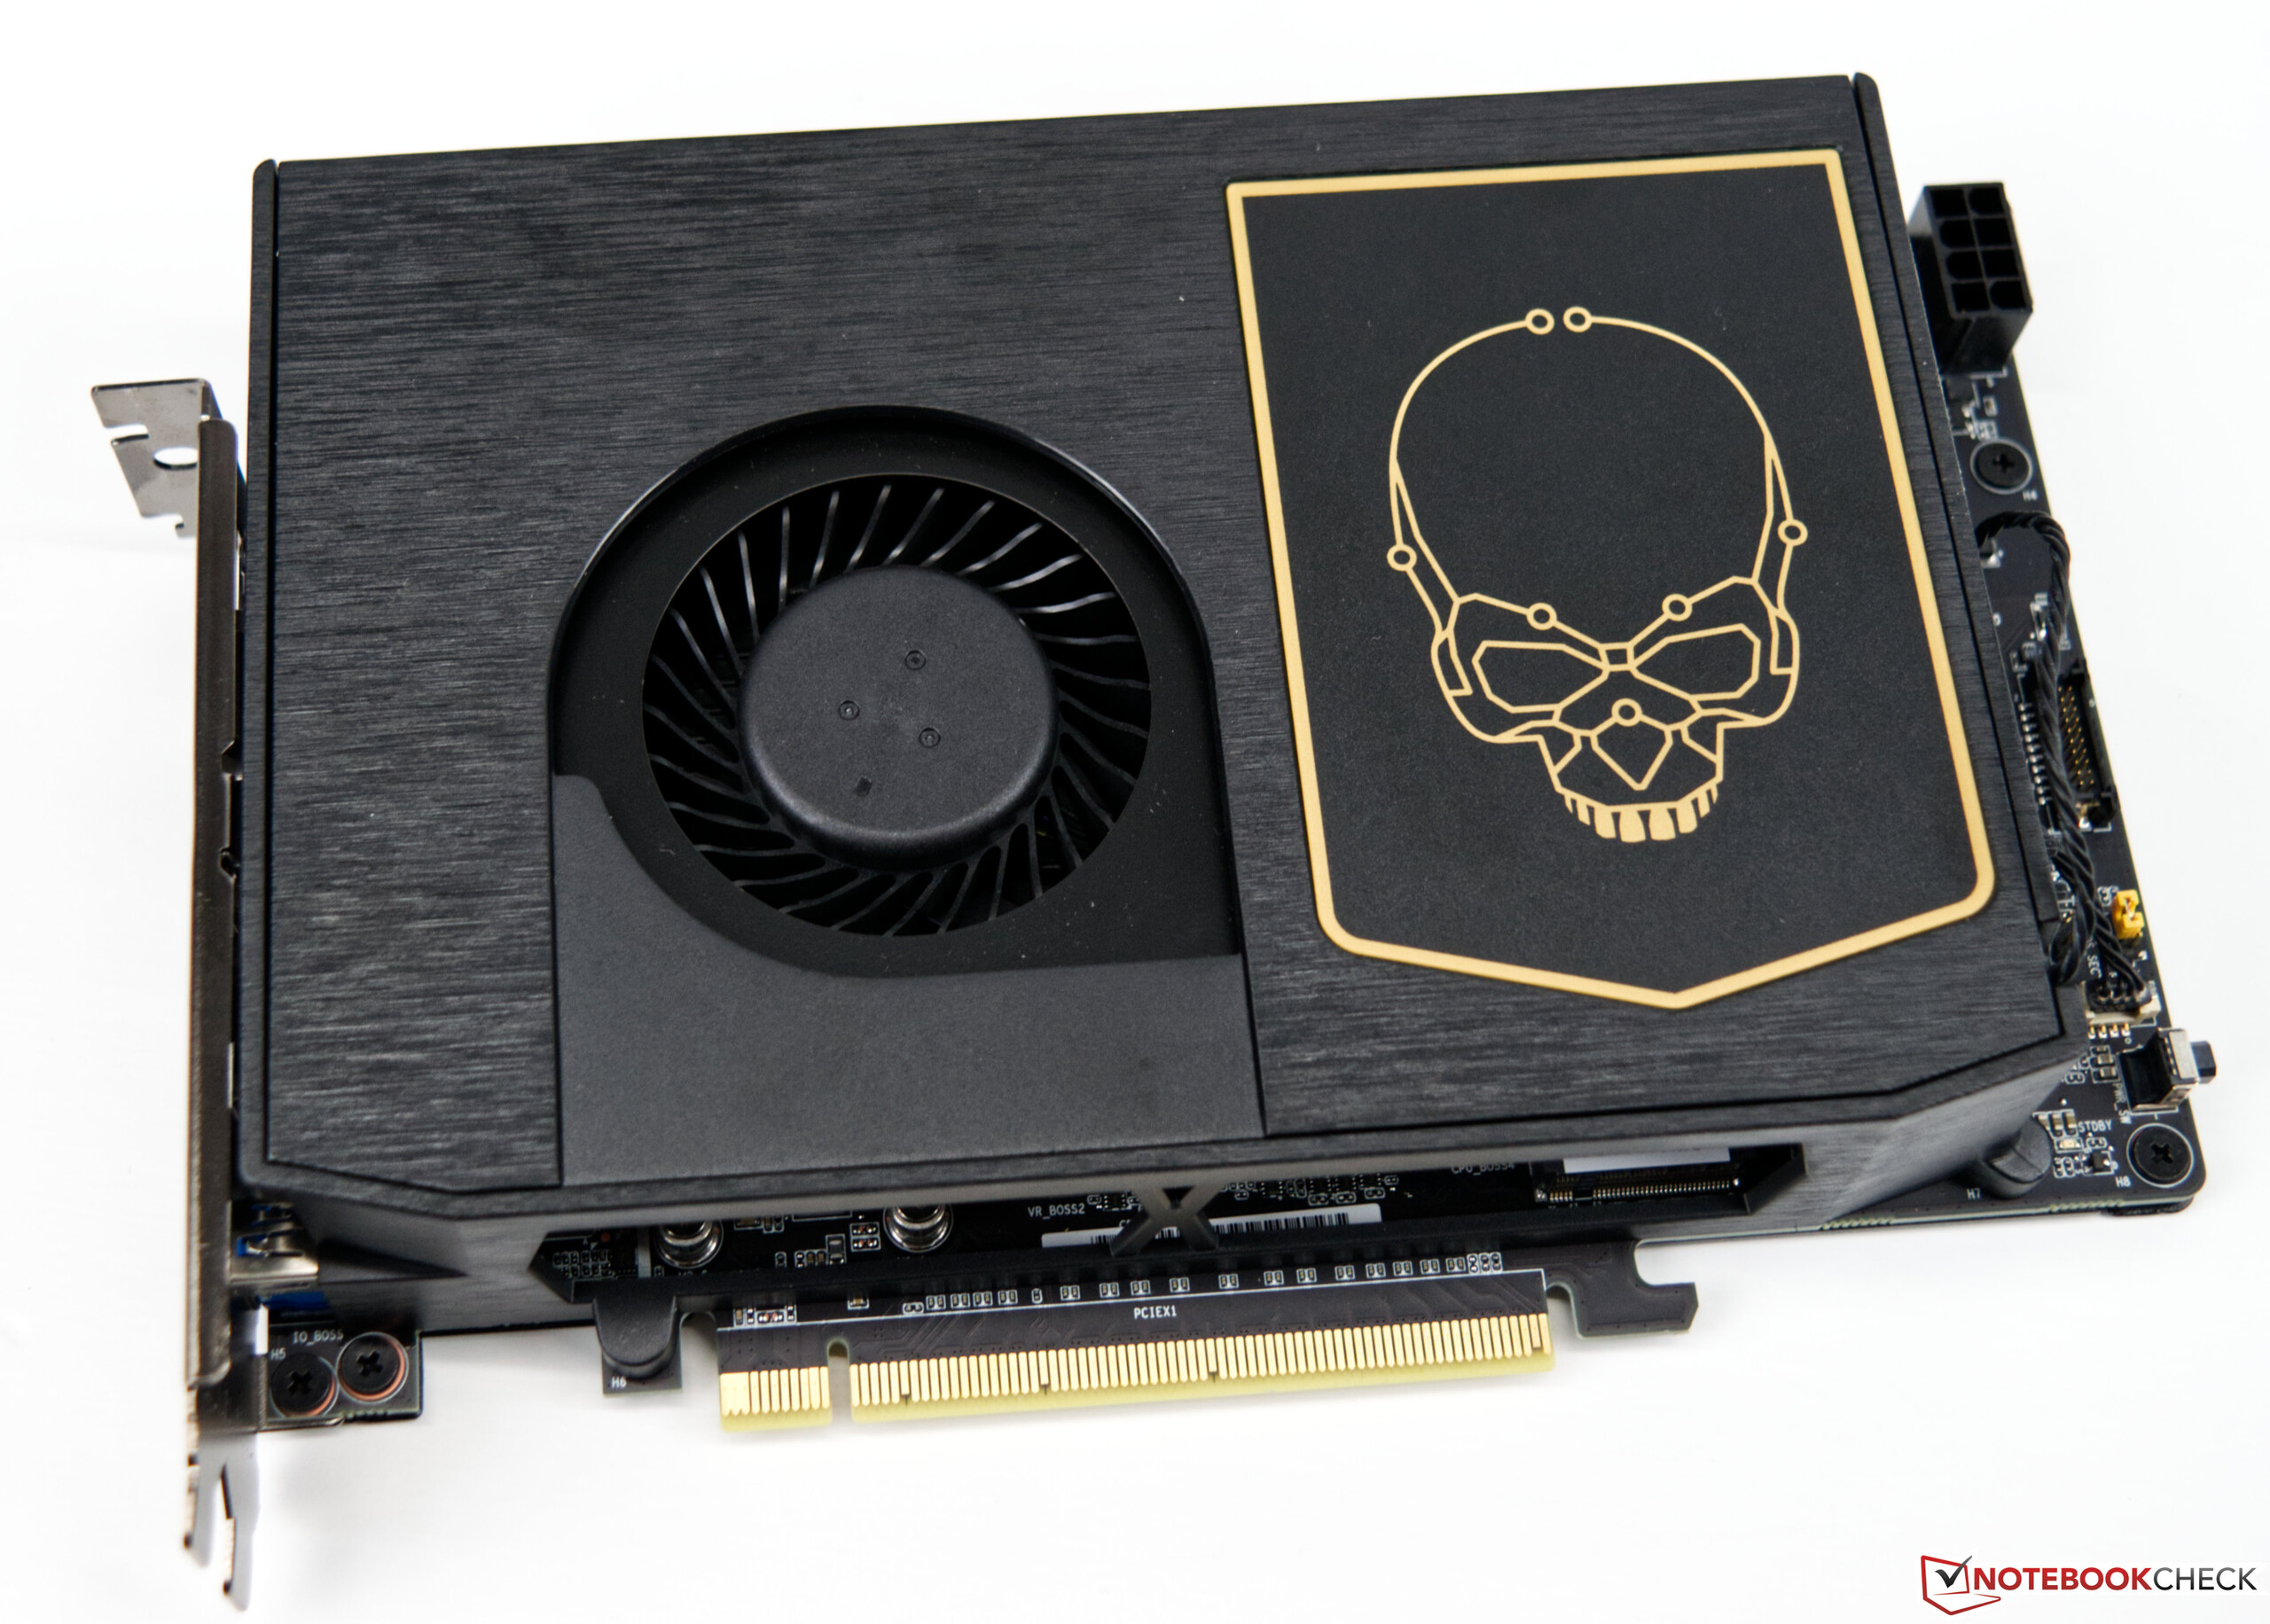
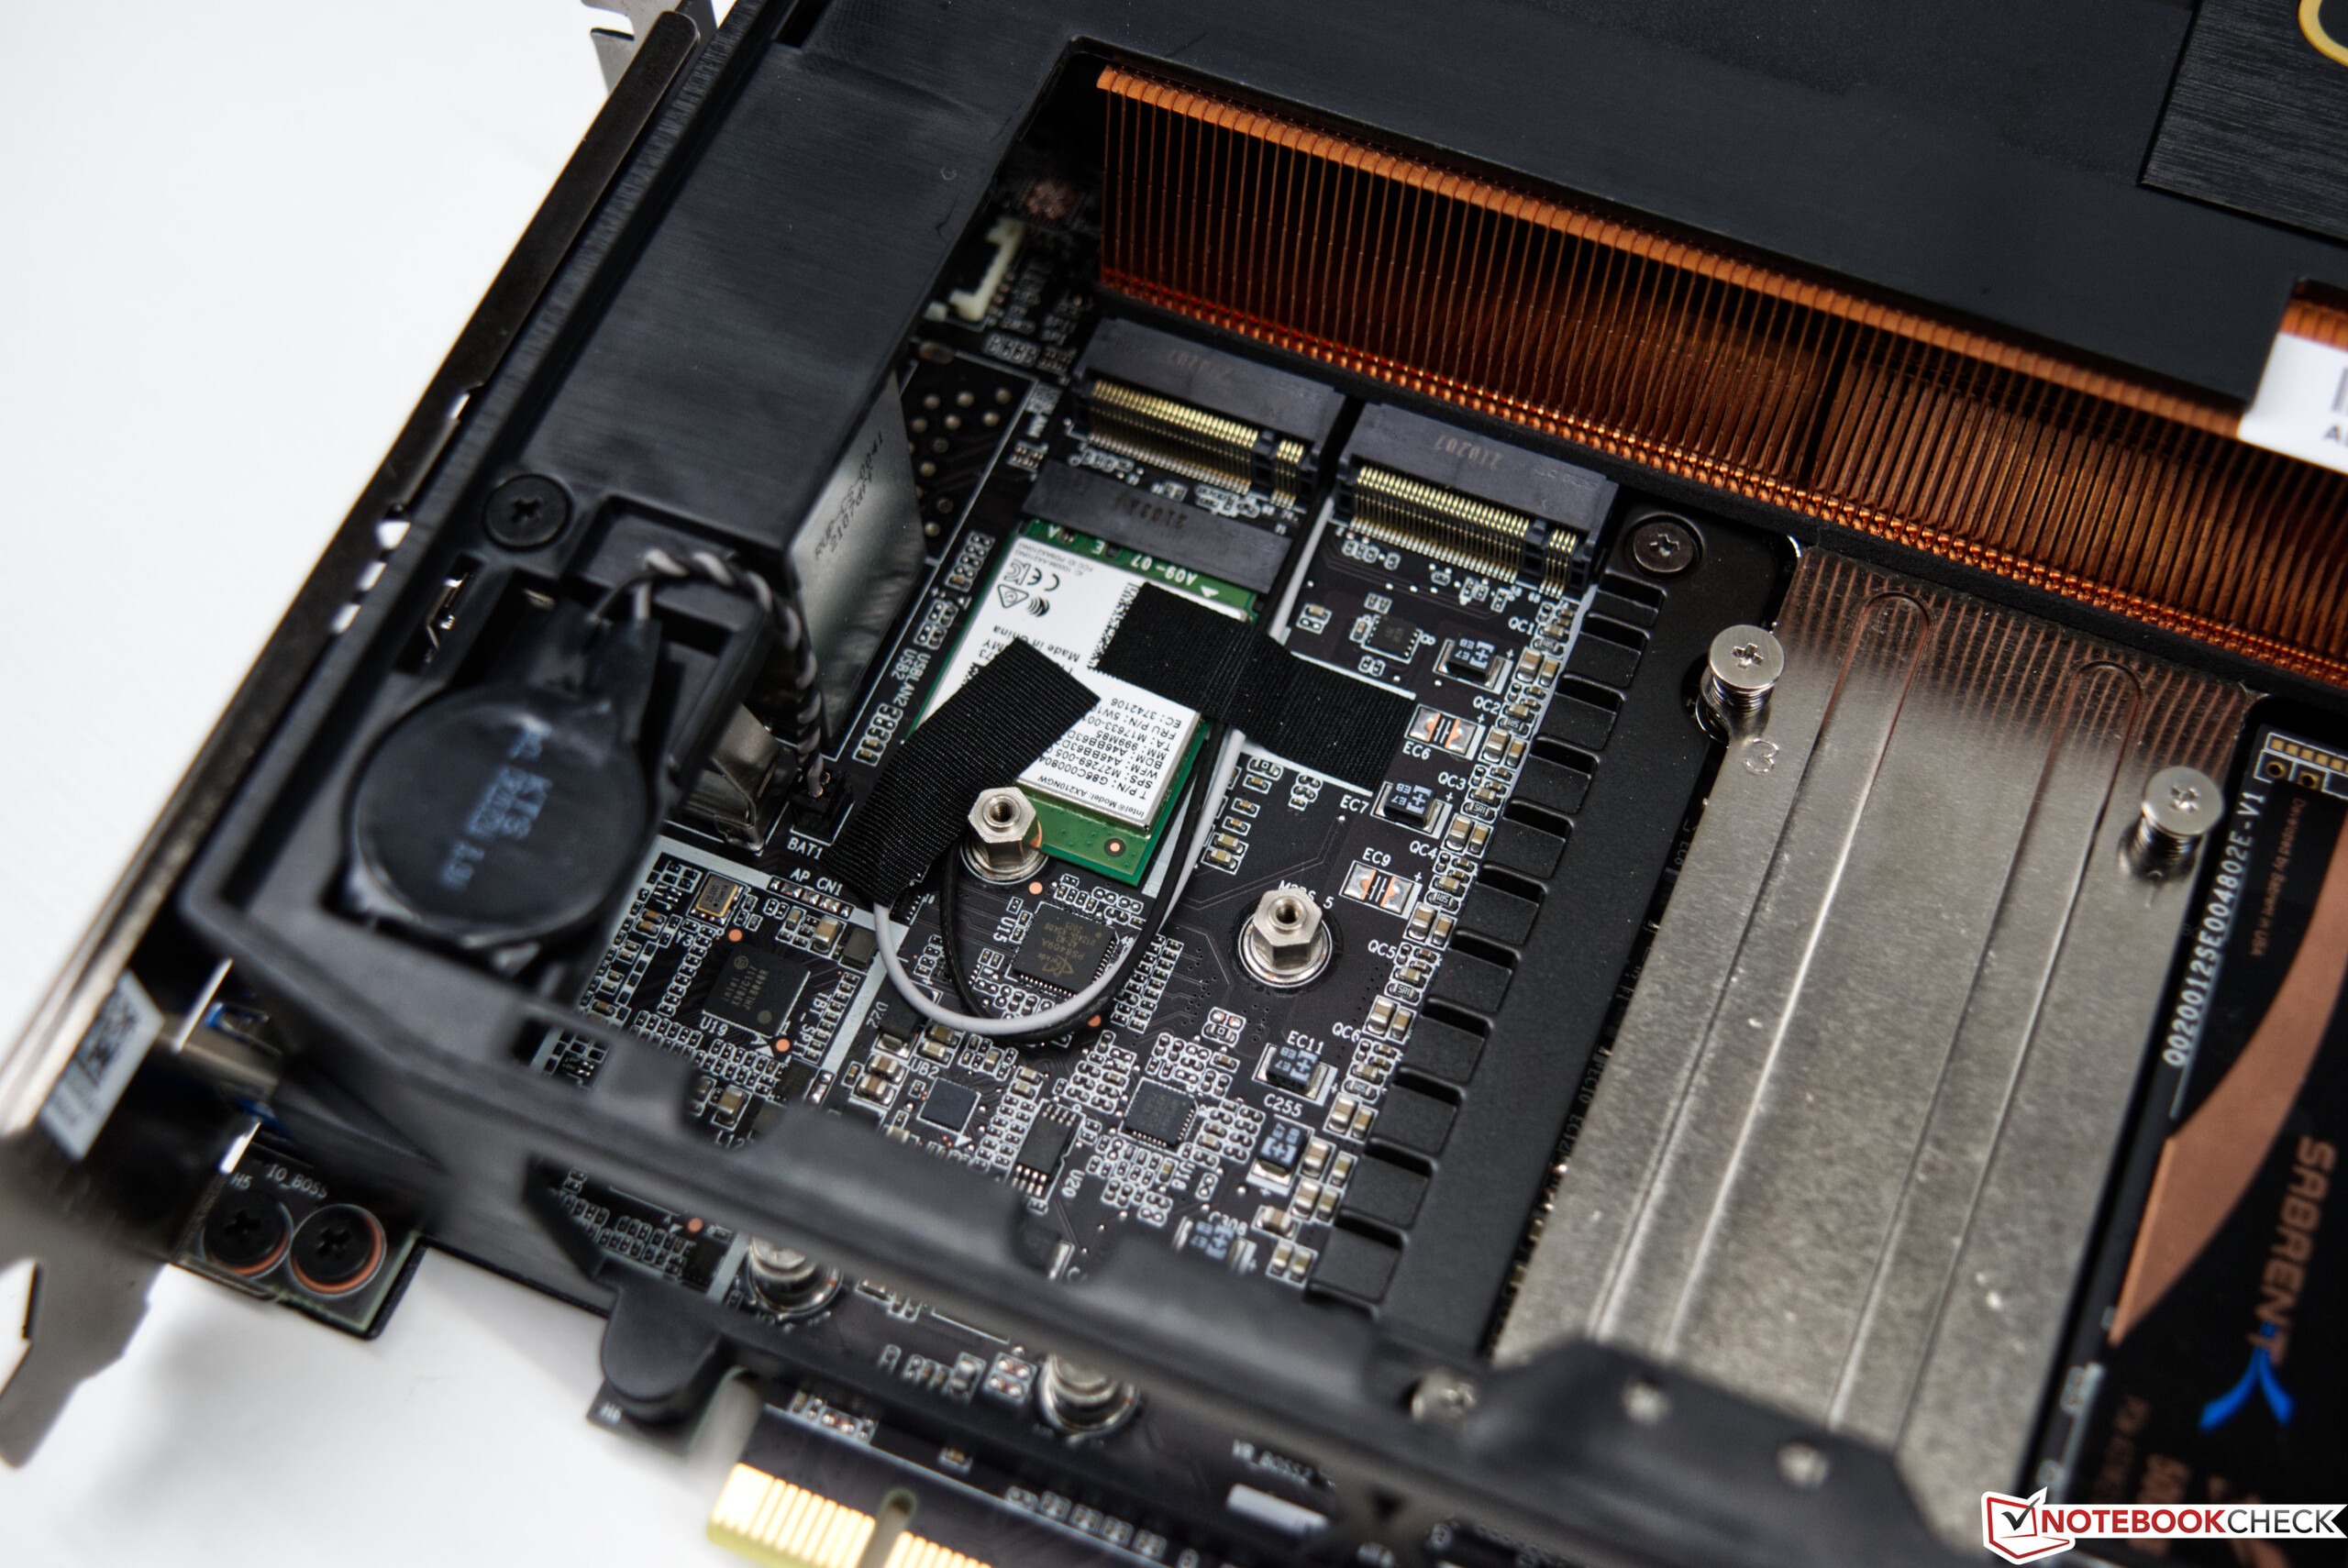
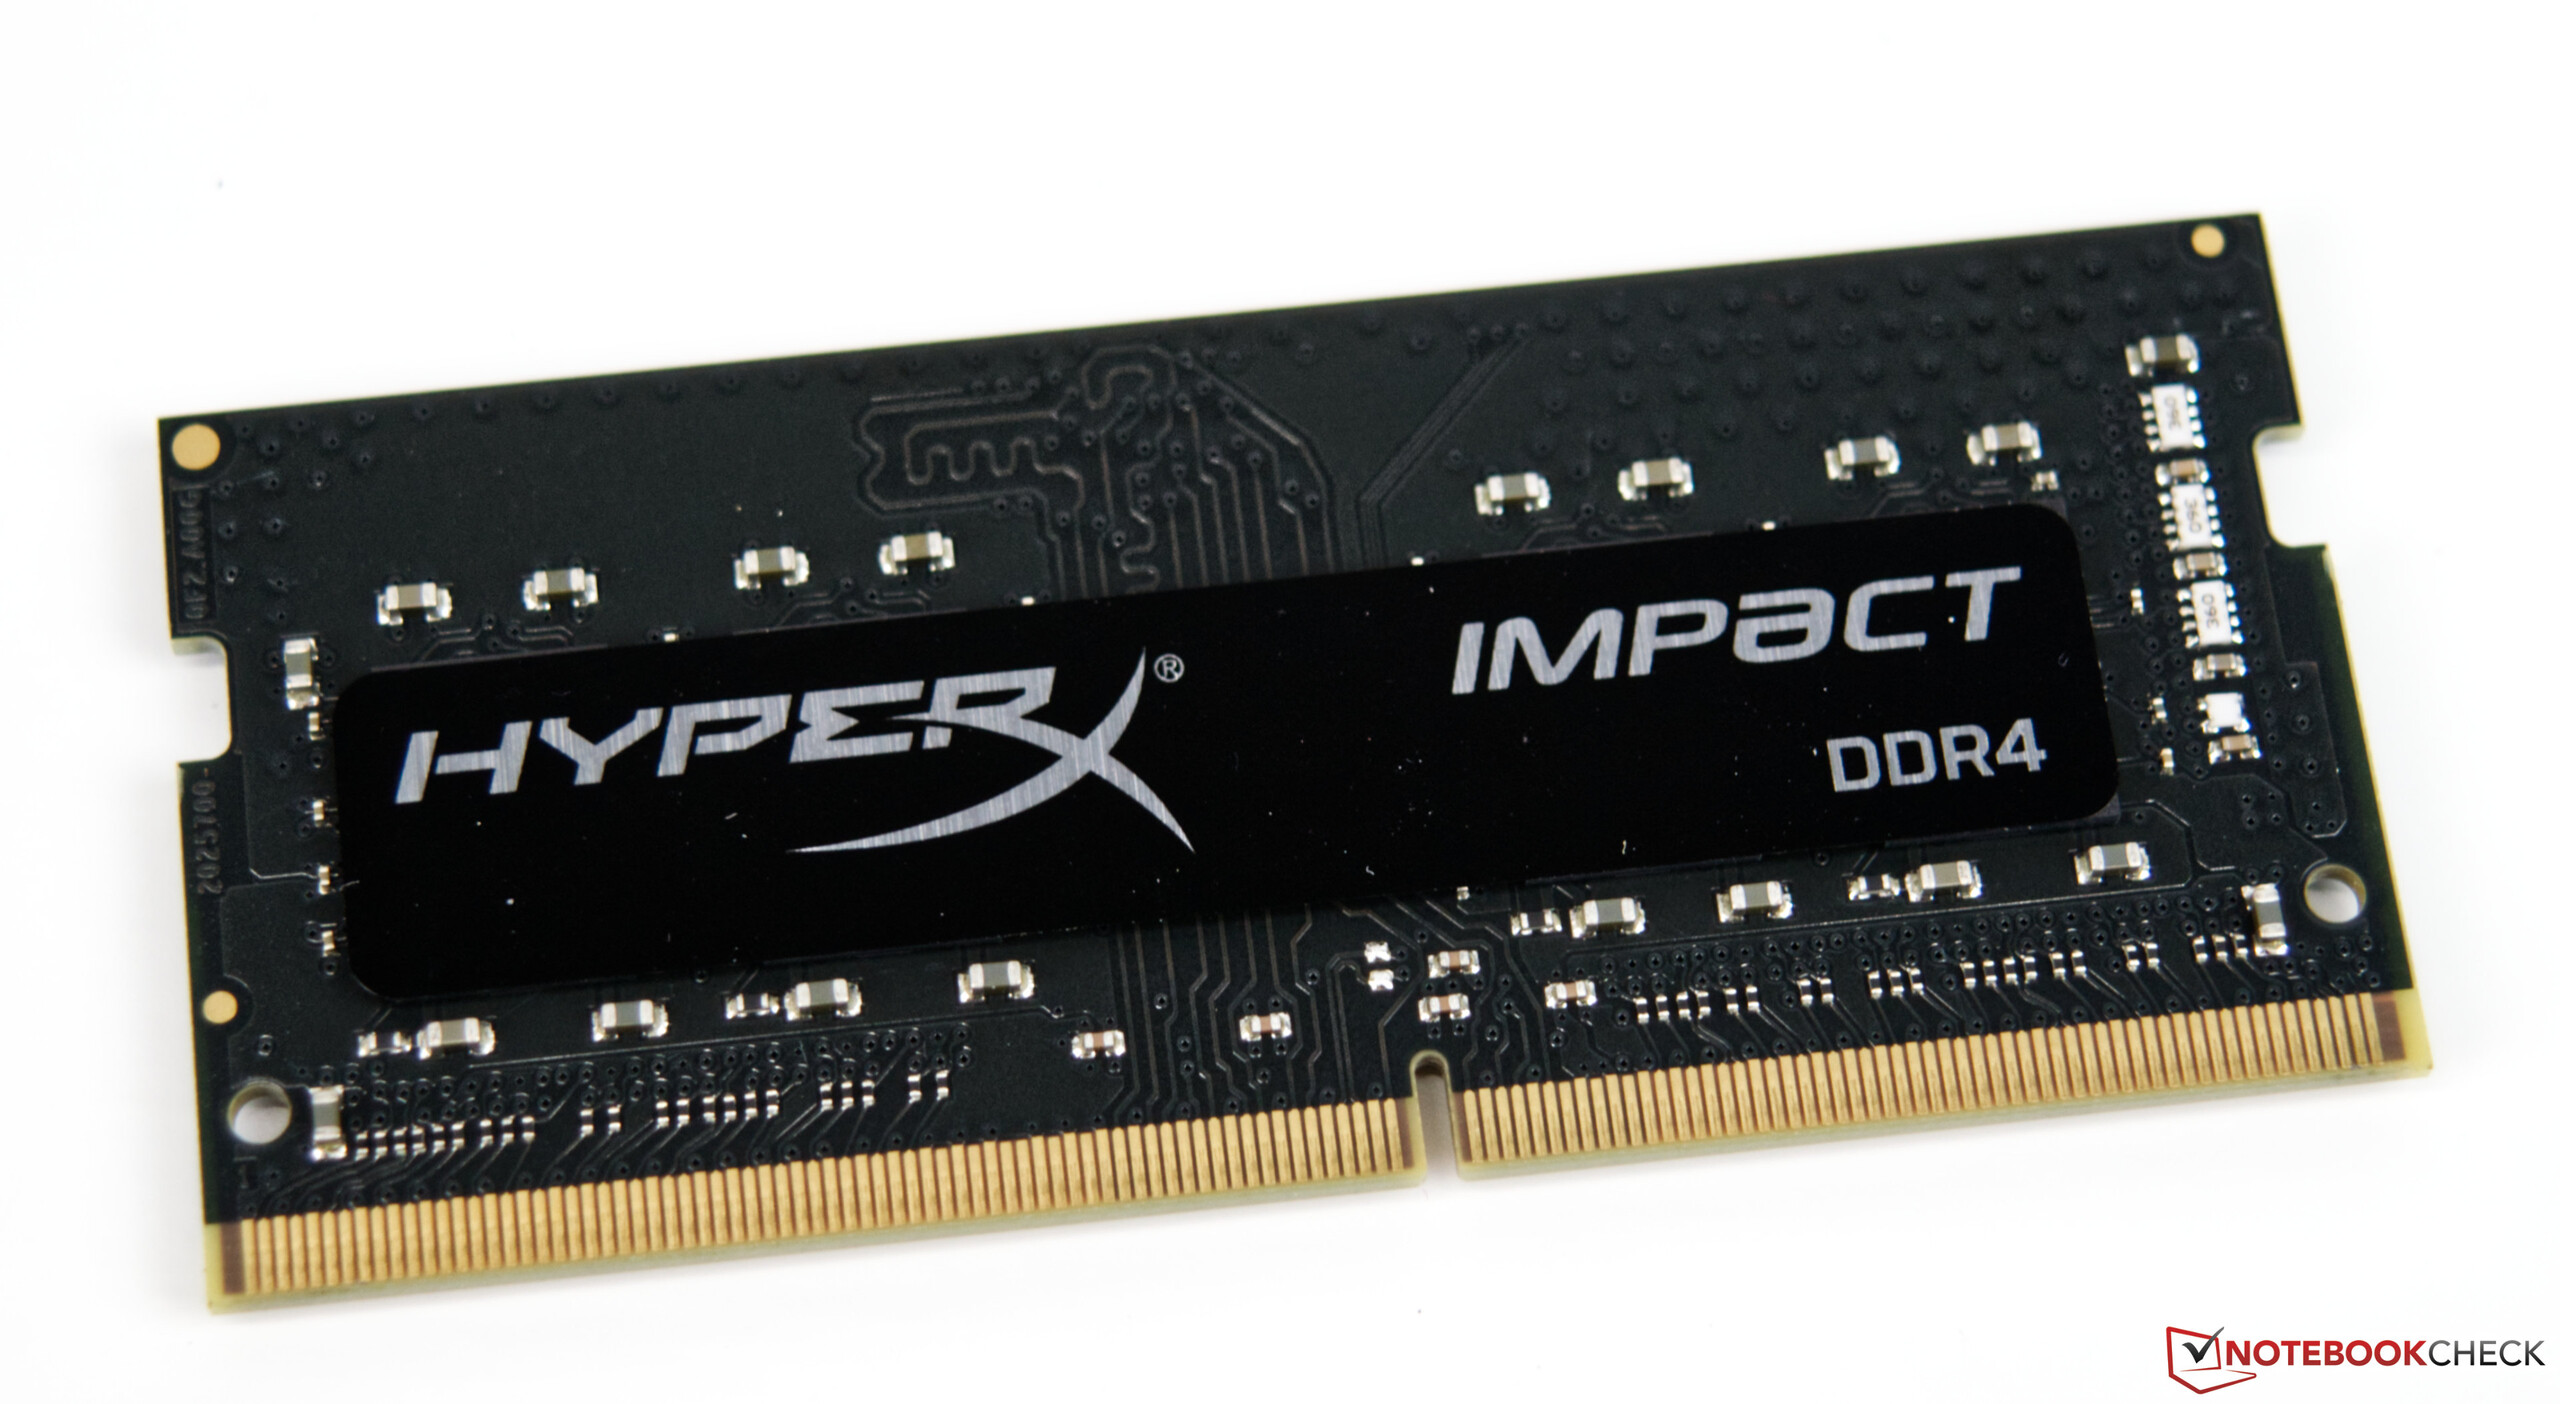
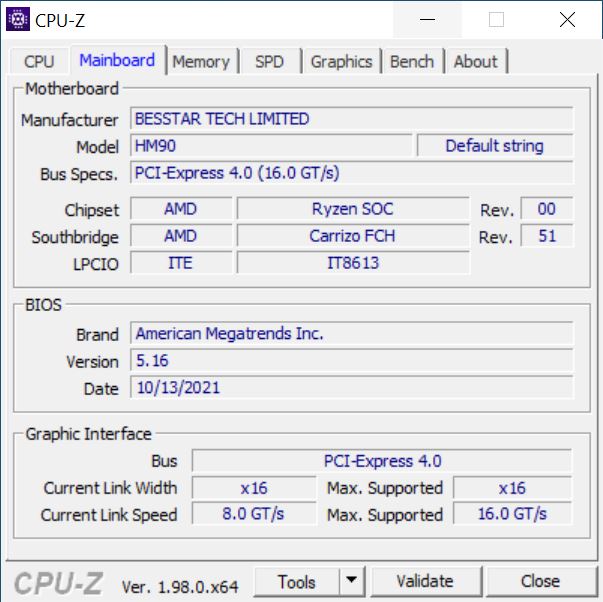
Intel hat unter dem Pseudonym NUC überwiegend kompakte Office-Systeme im Portfolio. Dennoch gibt es seitens Intel immer mal wieder Gaming-Systeme, die ebenfalls das Kürzel NUC in ihrer Bezeichnung tragen. So haben wir uns letztes Jahr schon von der Leistung des Intel Ghost Canyon NUC eindrucksvoll überzeugen können. Dieses Jahr hat Intel mit dem Beat Canyon NUC ein weiteres Gaming-System auf Basis des eigens entwickelten Compute-Element vorgestellt und geht dabei einen etwas anderen Weg. Optisch unterscheiden sich die beiden Systeme stark, wenngleich der grobe interne Aufbau nur in der Anordnung der Komponenten variiert. Noch wird das Netzteil im Gehäuse verstaut und nutzt diesmal den SFX-Formfaktor, was den Austausch bei einem etwaigen Defekt nun erleichtert. Das neue Compute-Element wird weiterhin als Steckkarte in einem PCI-Express-Slot verstaut und beinhaltet mit dem Intel Core i9-11900KB ein sehr schnelles SoC mit 8 Kernen und 16 Threads. Weiterhin bietet das NUC 11 Extreme Compute-Element Platz für zwei SO-DIMM-Module und verstaut neben dem WLAN-Modul noch bis zu drei M.2-SSD2.

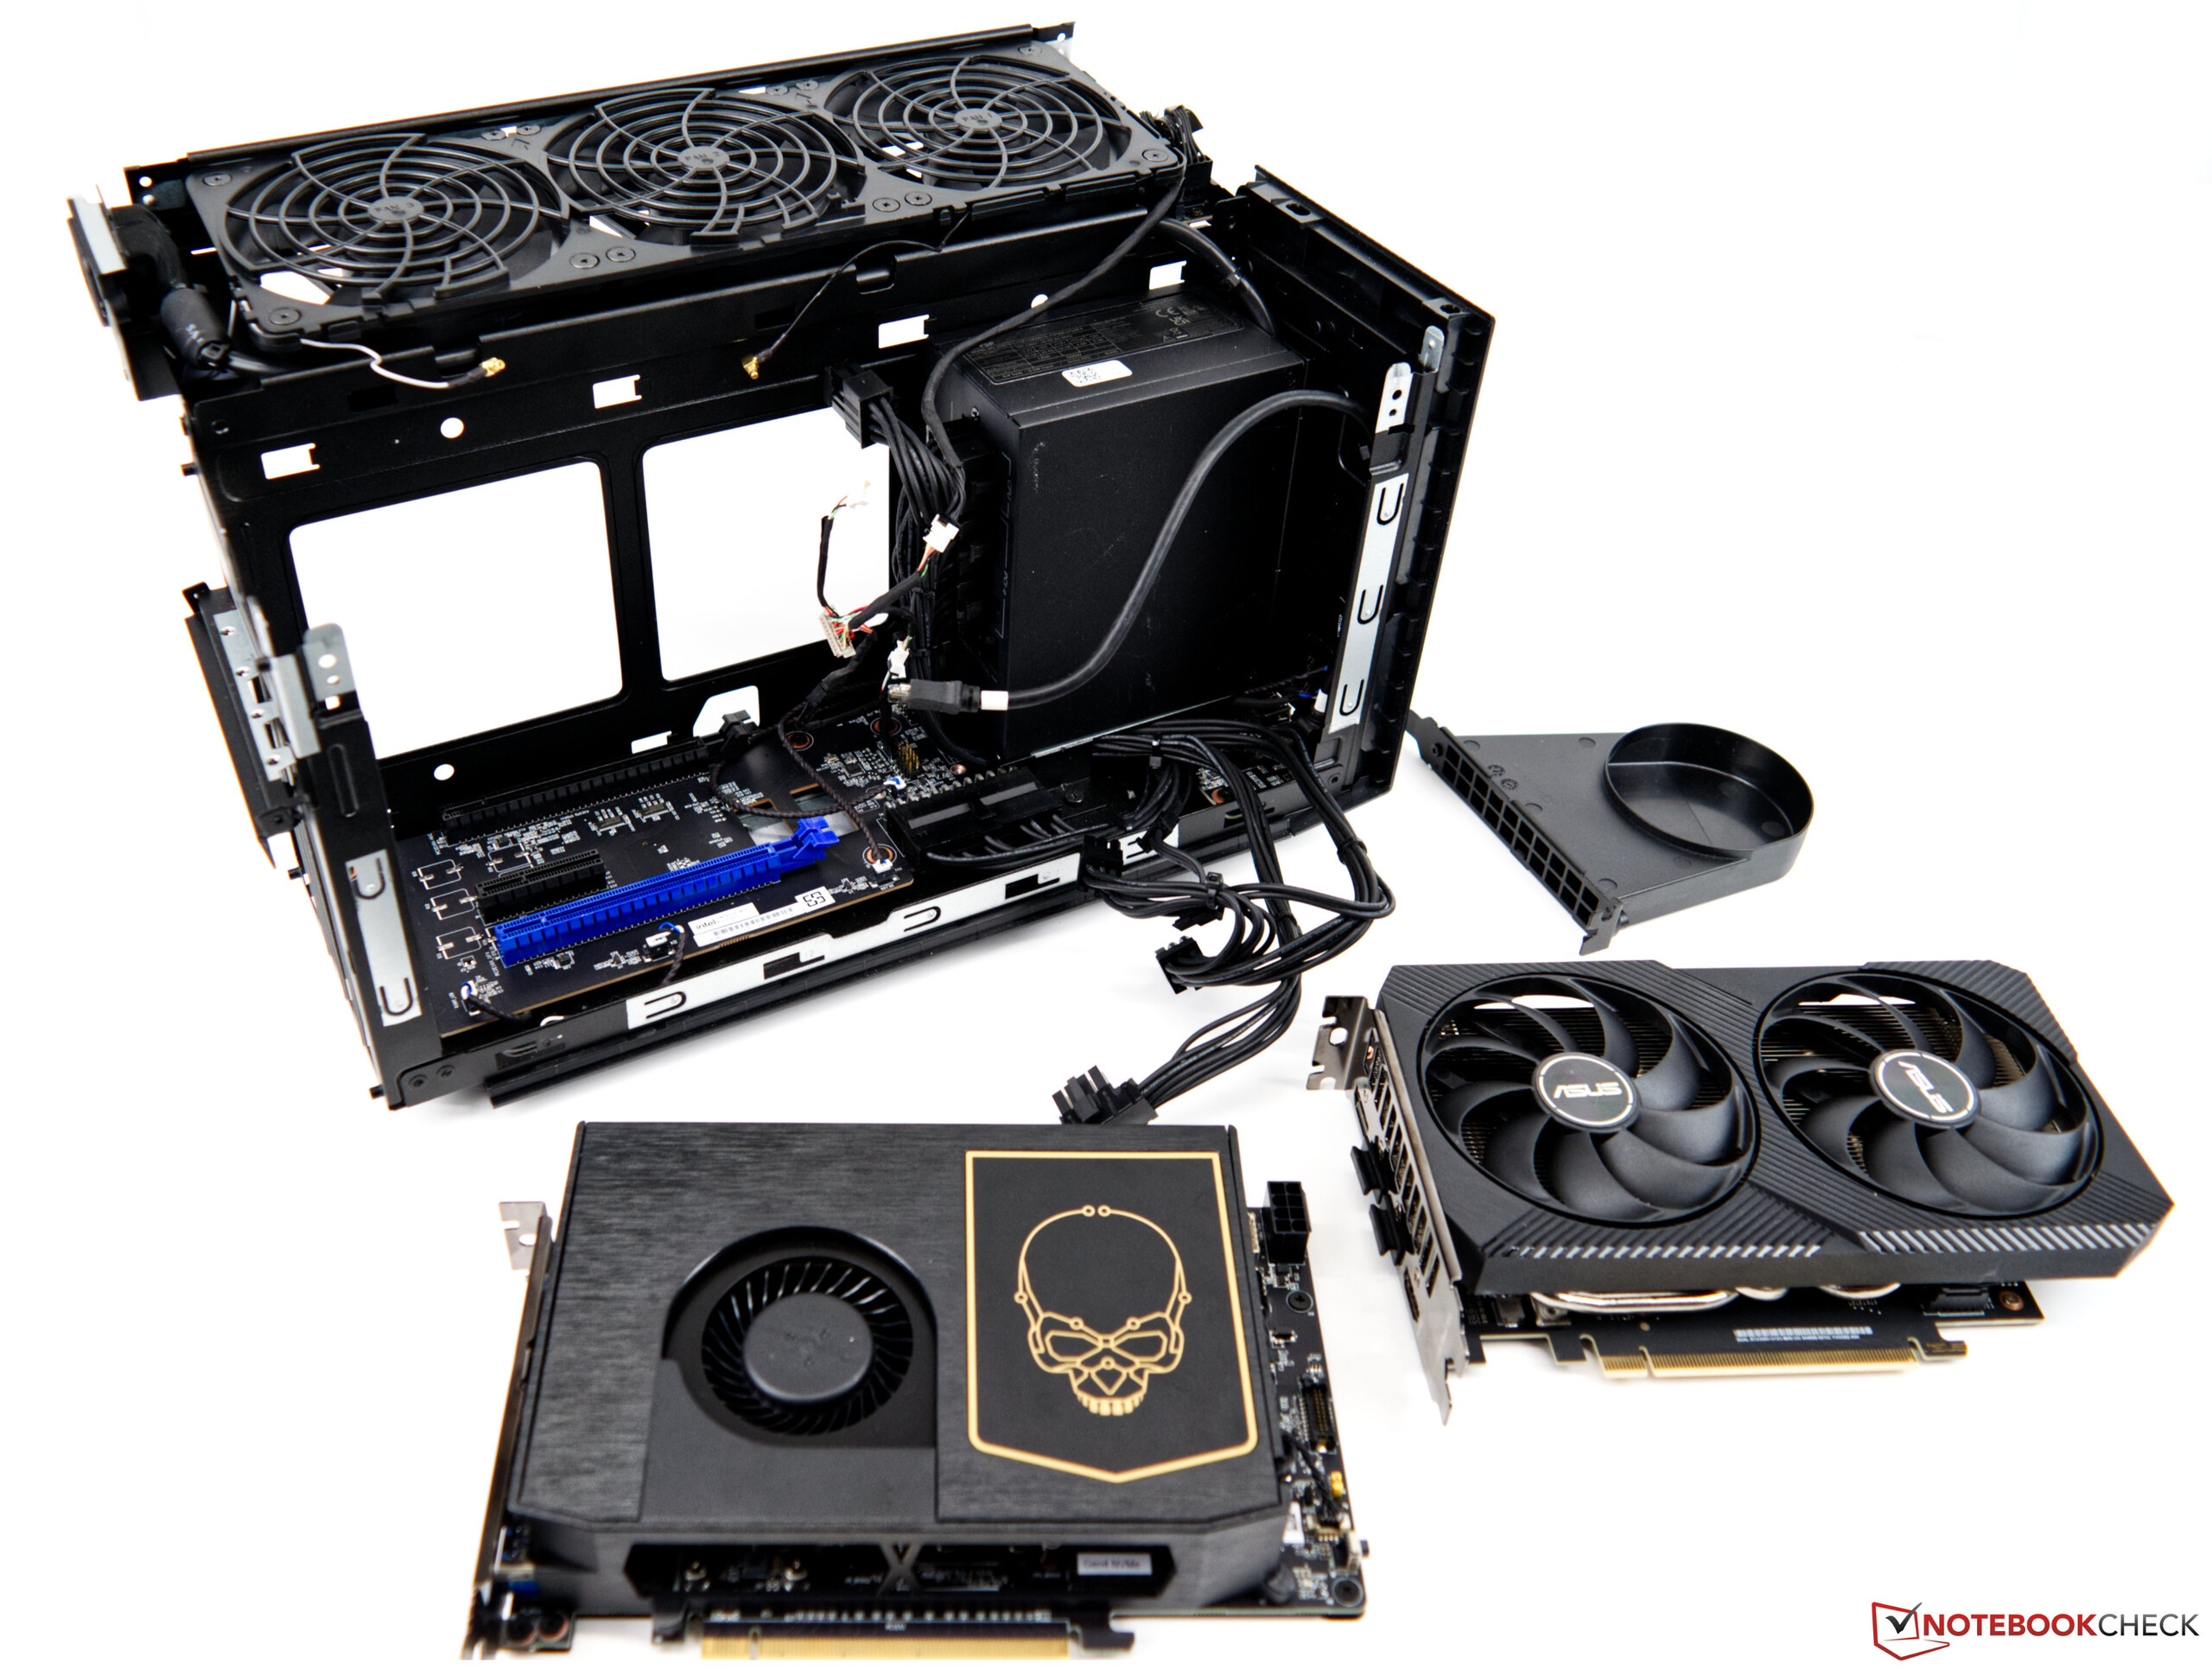
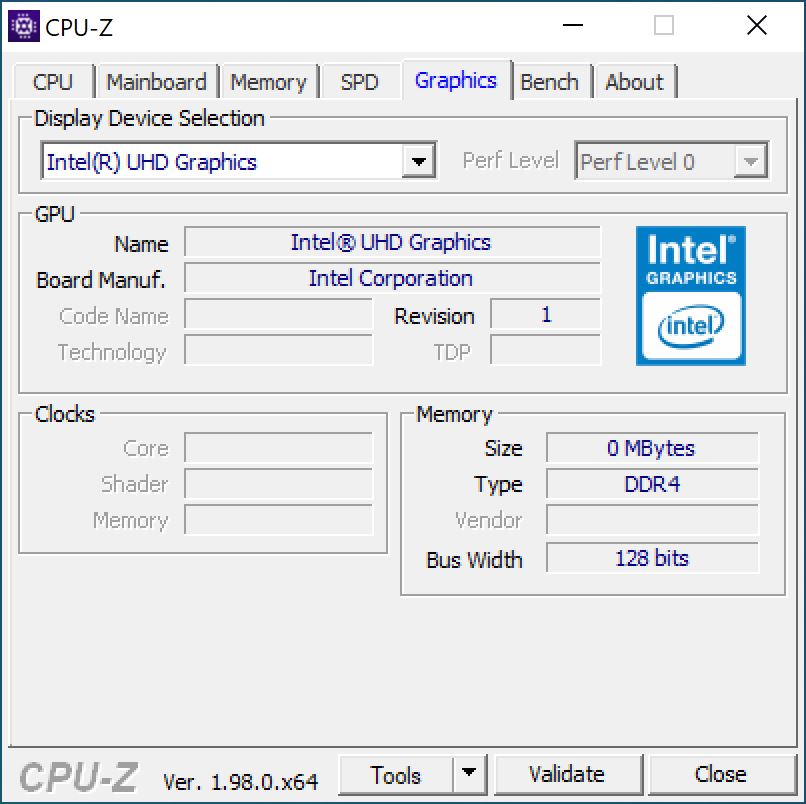
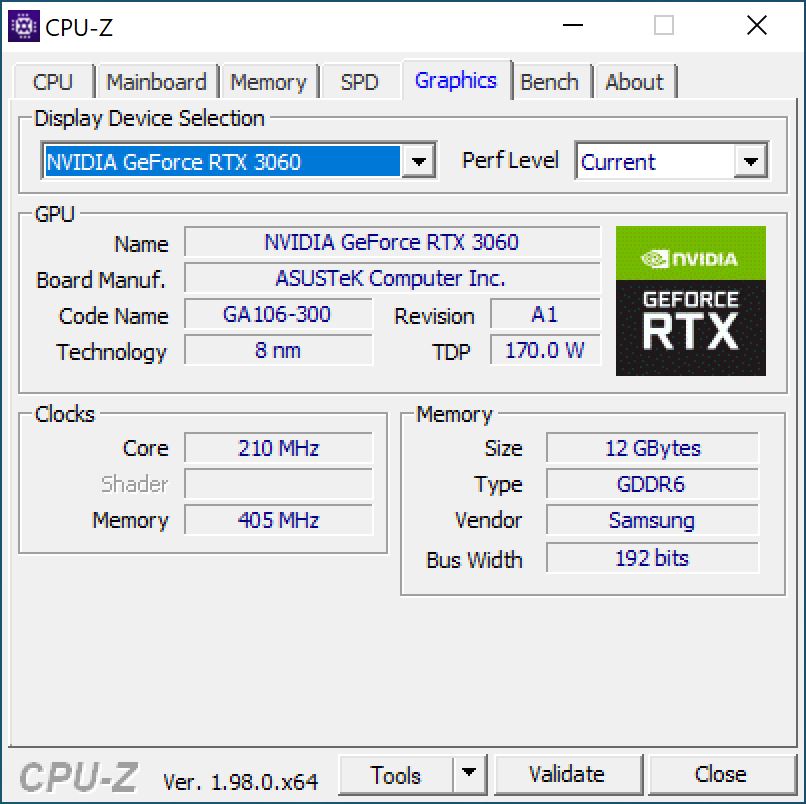
Das SoC bietet ein eigene iGPU welche aber nur eingeschränkt Spieletauglich ist. Vielmehr sorgt die im Beast Canyon verbaute Nvidia GeForce RTX 3060 für eine ordentliche Spieleleistung, die im Zusammenspiel mit dem schnellen SoC eine gute Leistung abliefert.

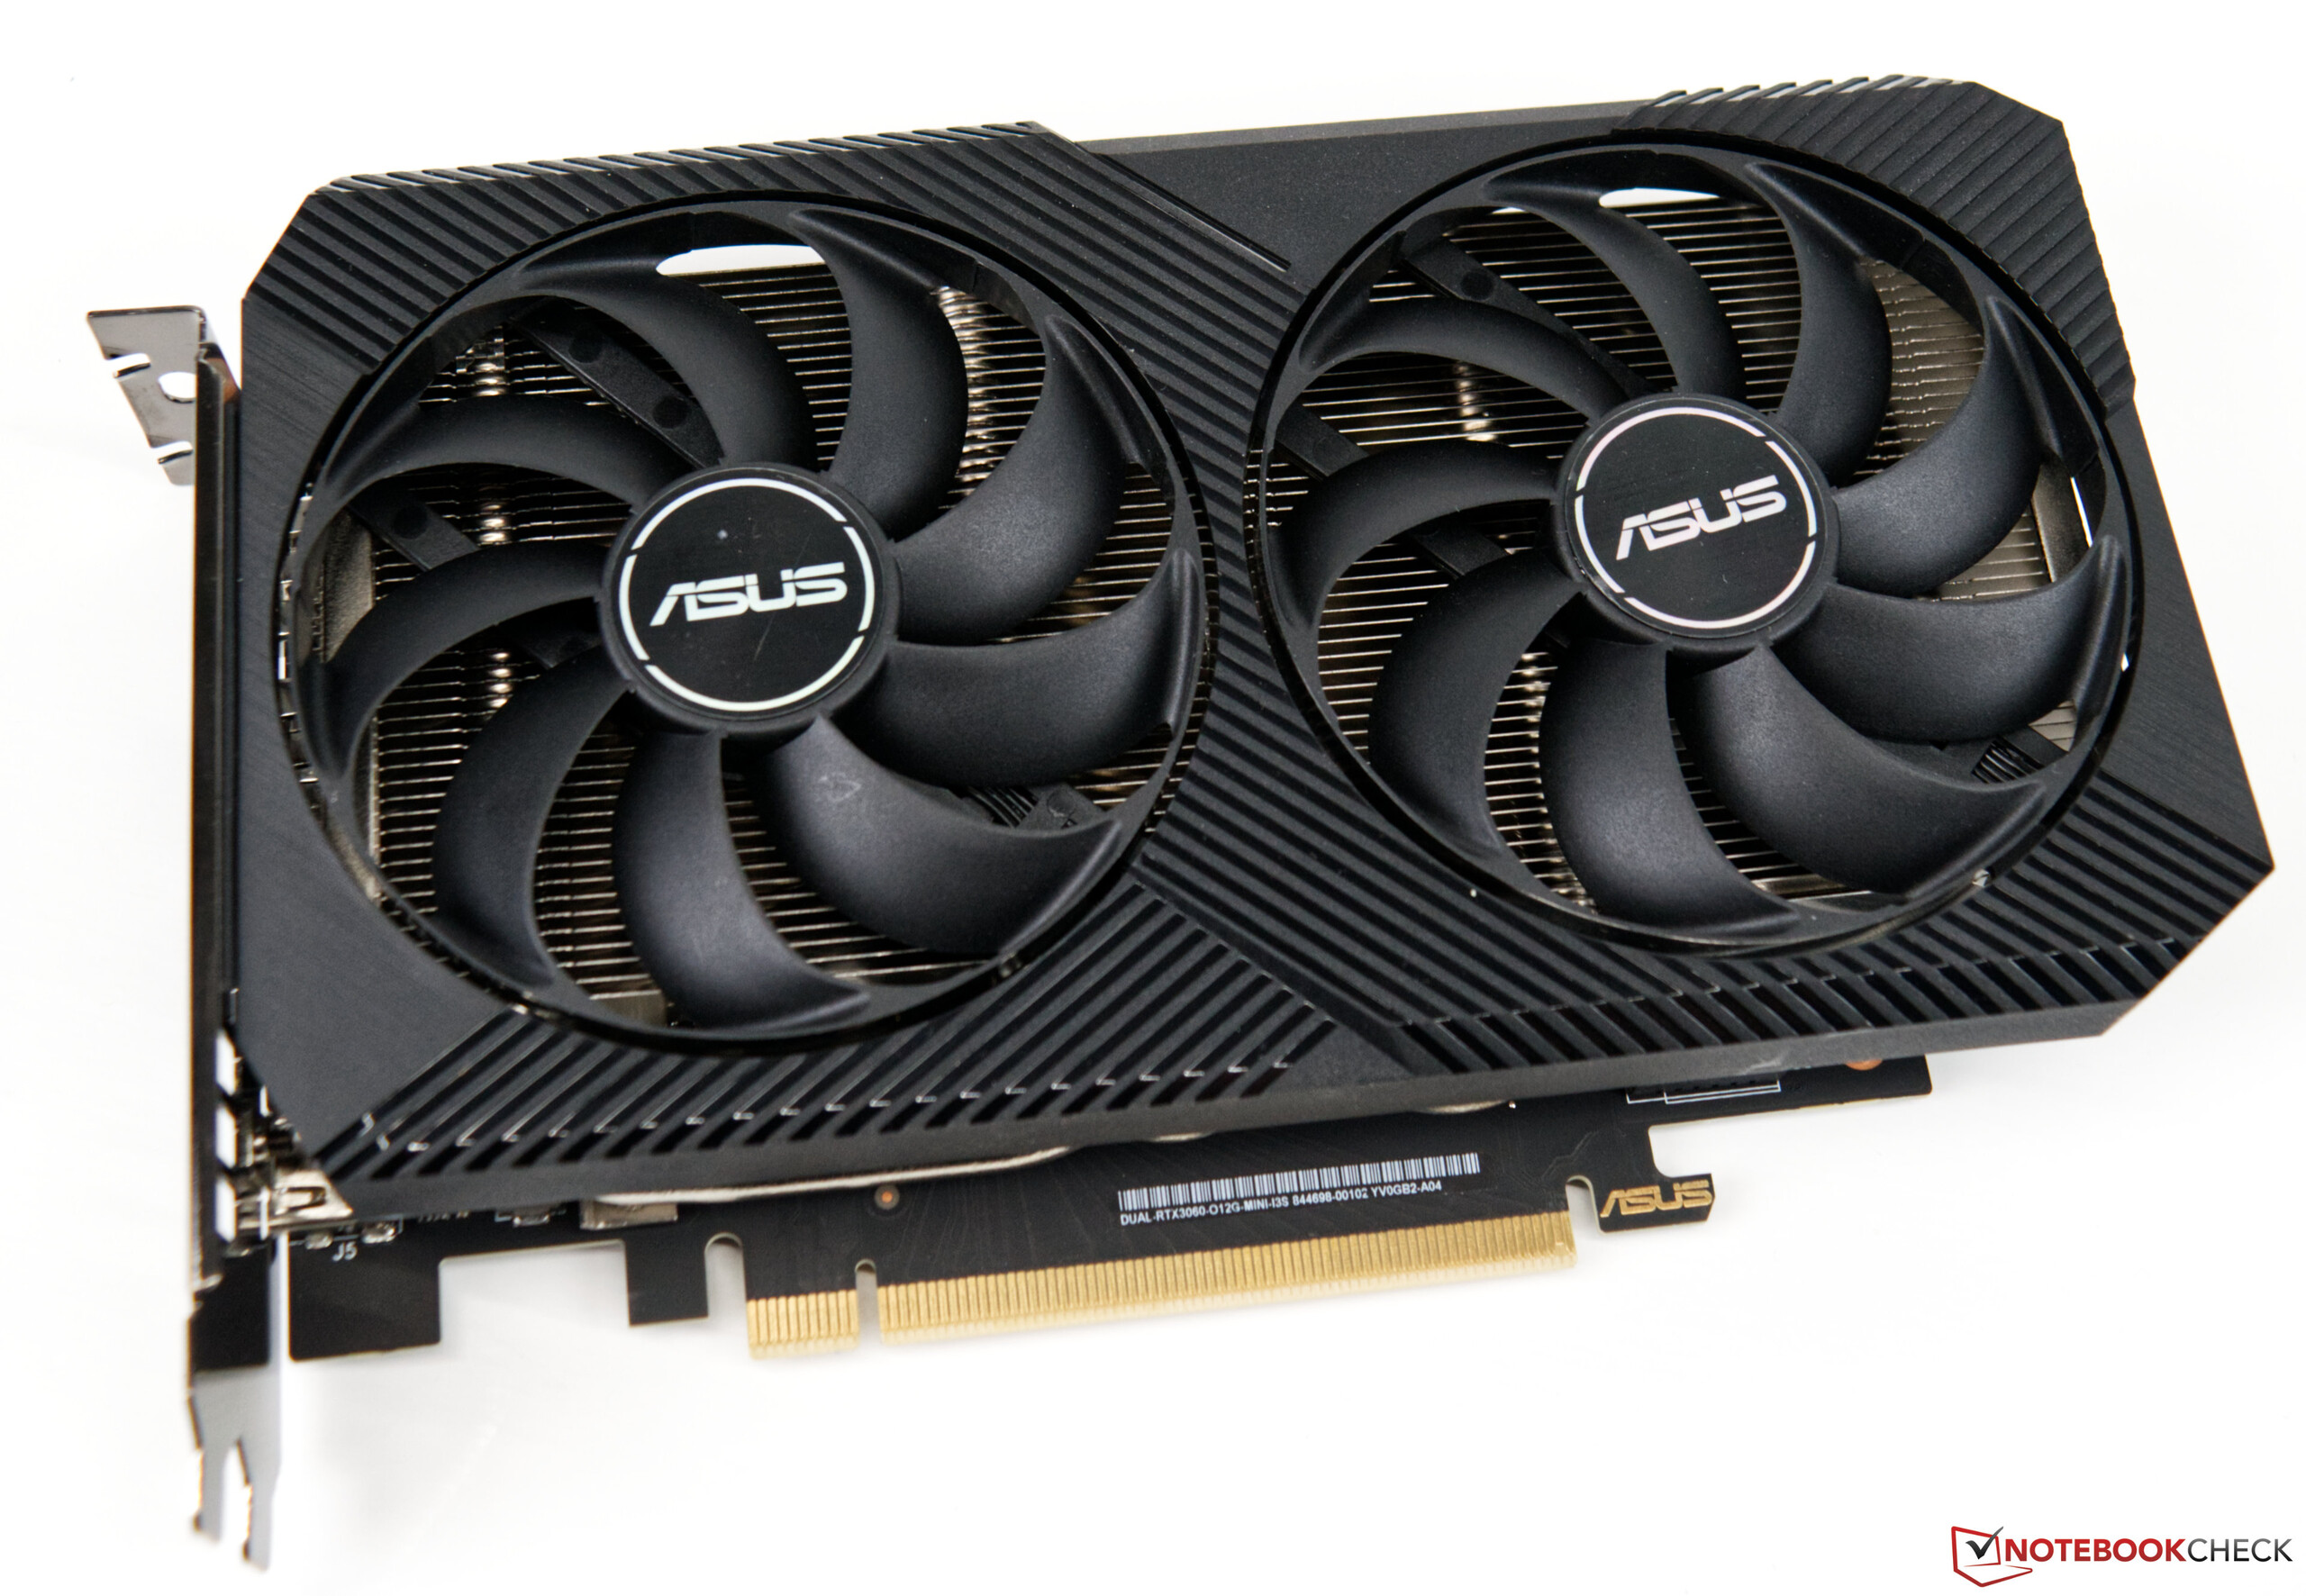
Preislich ist die Einordnung des Beat Canyon nicht ganz einfach. Intel selbst gibt einen UVP von knapp 1.200 US-Dollar für das Core i9-Modell an, welches wir auch hier im Test haben. Das Core i7-Modell (Intel Core i9-11700B) wird mit etwa 1.000 US-Dollar beziffert. Dabei sei zu beachten, dass es sich um die Preise des Barebone-Systems handelt, was im Umkehrschluss bedeutet, dass zusätzlich Kosten für RAM, SSD und GPU entstehen. Wenn wir nun einmal überschlagen und unser Textsystem zugrunde legen, kommen wir schnell und ohne Probleme auf einen Preis von über 2.000 Euro. Die aktuelle Lage bei den Grafikkarten sorgt dabei für den größten Faktor der Zusatzkosten. Die verbaute GeForce RTX 3060 aus dem Hause Asus schlägt momentan mit 900 Euro zu Buche. Wer hier eine preiswertere Alternative wählt, oder sogar noch ein passendes Modell als sein Eigen nennen kann, kann hier die Kosten etwas drücken.

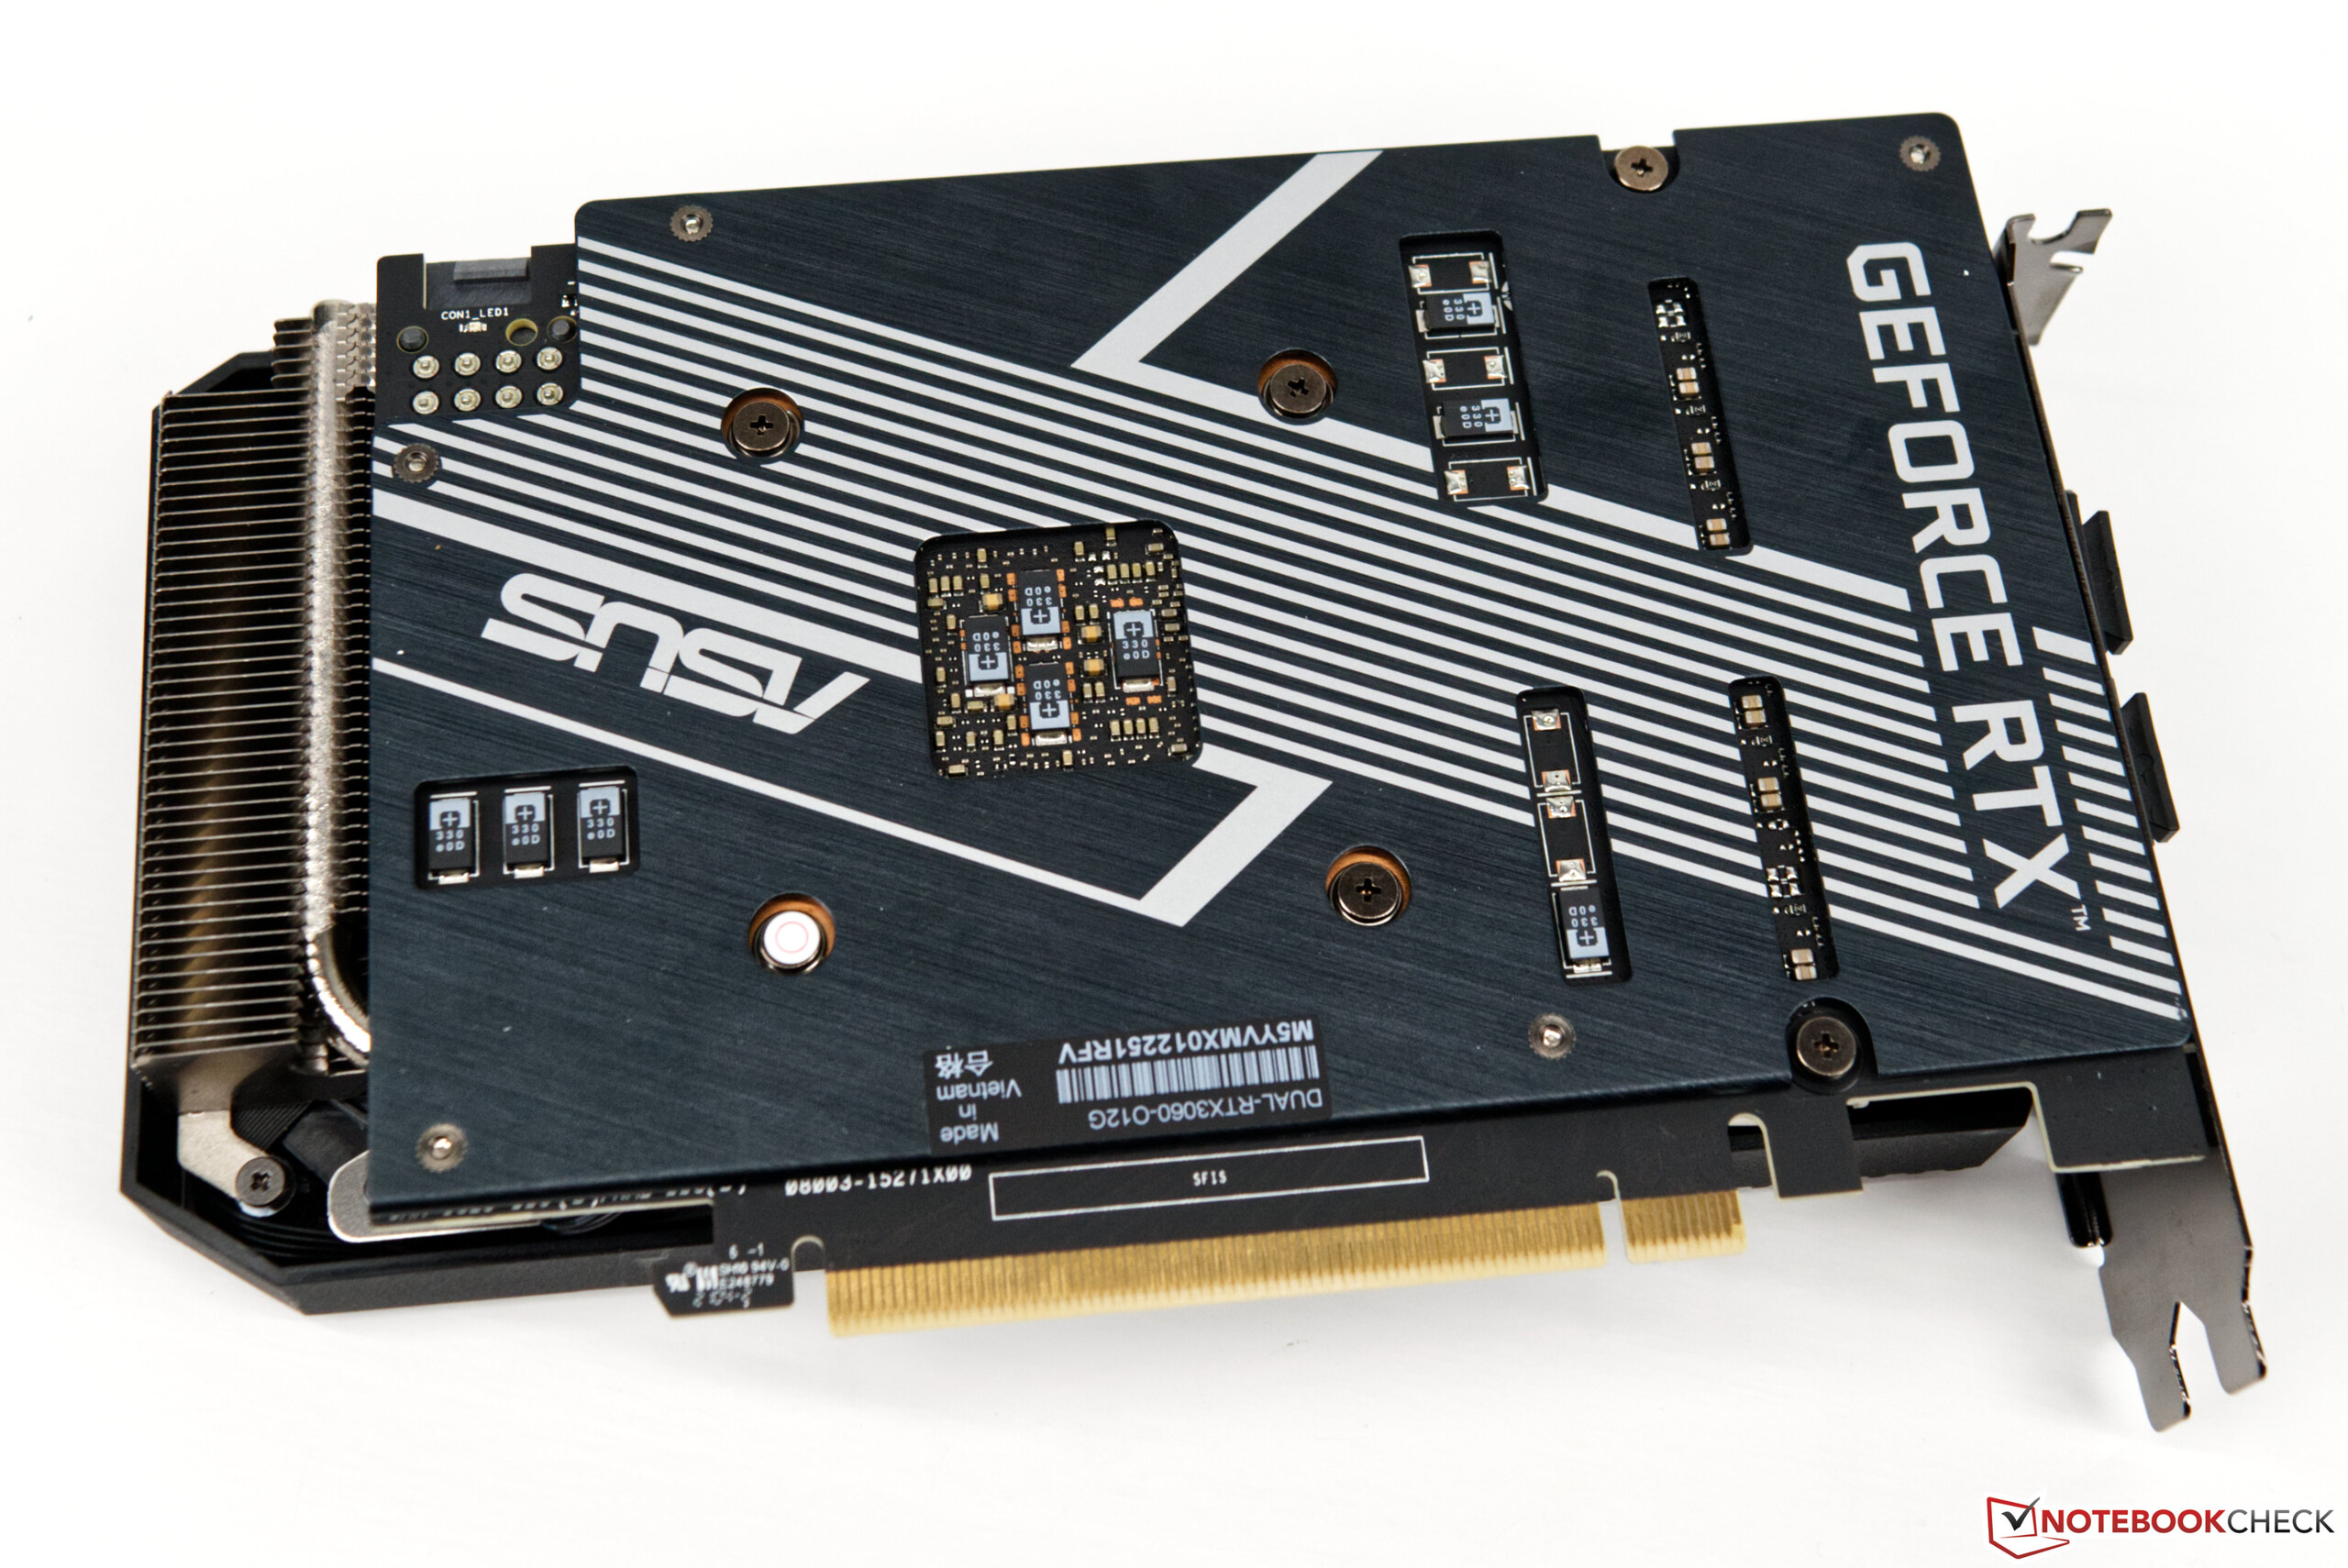
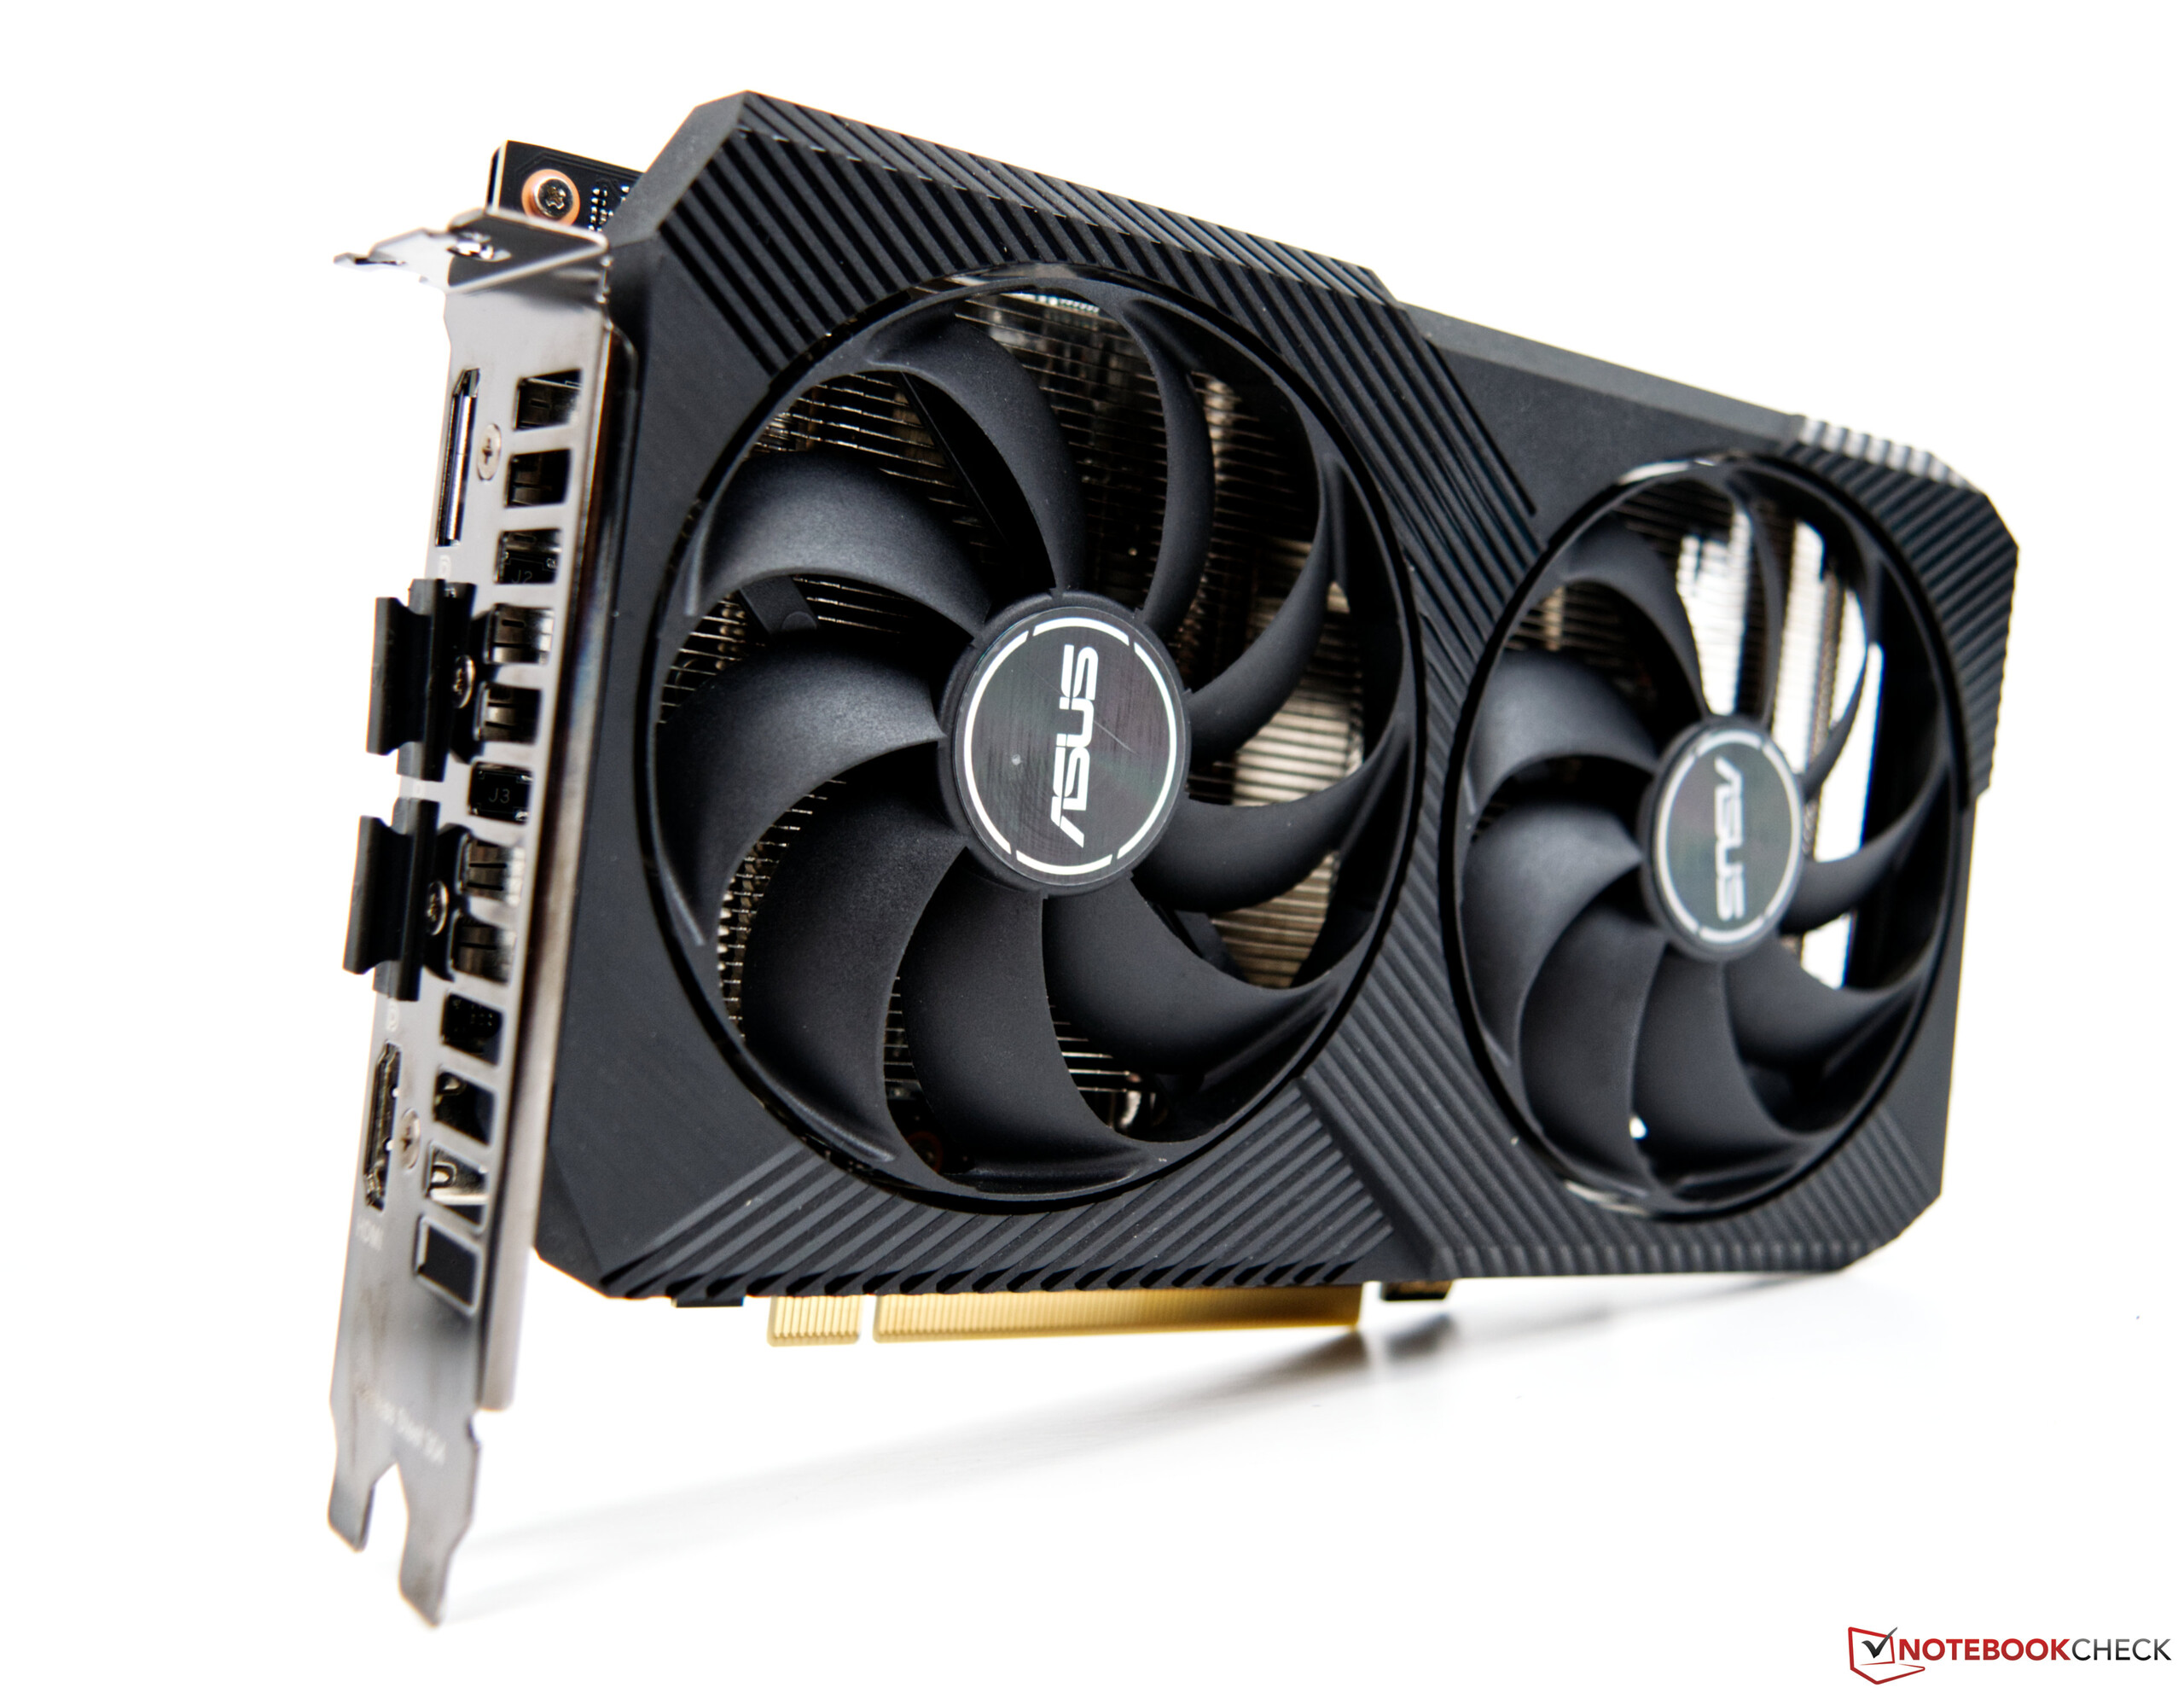
Wer das Intel NUC 11 Extreme Kit mit einer dedizierten Grafikkarte betreiben möchte, sollte aber auf die Dimensionen des Pixelbeschleunigers achten. Mehr als zwei Slots darf die Kühleinheit nicht einnehmen. Bei der Länge der Grafikkarte ist man auf maximal 30,5 Zentimetern beschränkt.

Intel NUC 11 Extreme Kit – Beast Canyon
Prozessor
Intel Core i9-11900KB 8 x 3.3 - 5.3 GHz, 90 W PL2 / Short Burst, 65 W PL1 / Sustained, Tiger Lake-H
Grafikkarte
NVIDIA GeForce RTX 3060 - 12 GB VRAM, Kerntakt: 1837 MHz, Speichertakt: 15000 MHz, 170 W TDP, Nvidia 471.41
Hauptspeicher
16 GB 
Mainboard
Intel WM590 (Tiger Lake PCH-H)
Massenspeicher
Sabrent Rocket 4.0 500GB, 500 GB 
, M.2 2280 NVMe
Anschlüsse
12 USB 3.1 Gen2, 2 USB 4.0 40 Gbps, 2 Thunderbolt, 1 HDMI, 1 Kensington Lock, Audio Anschlüsse: 7.1 digital, Card Reader: SDXC with UHS-II support
Netzwerk
Intel I225-LM Ethernet Controller (10/100/1000/2500MBit/s), Intel Wi-Fi 6E AX210 (a/b/g/h/n = Wi-Fi 4/ac = Wi-Fi 5/ax = Wi-Fi 6/), Bluetooth 5.2
Abmessungen
Höhe x Breite x Tiefe (in mm): 189 x 120 x 357
Sonstiges
36 Monate Garantie
Hinweis: Der Hersteller kann abweichende Bauteile wie Bildschirme, Laufwerke und Speicherriegel mit ähnlichen Spezifikationen unter dem gleichen Modellnamen einsetzen.


Intel NUC 11 Beast Canyon
Intel NUC 11 Beast Canyon - Compute Element
Intel NUC 11 Beast Canyon
Intel NUC 11 Beast Canyon - RAM
Intel NUC 11 Beast Canyon
Intel NUC 11 Beast Canyon - GeForce RTX 3060

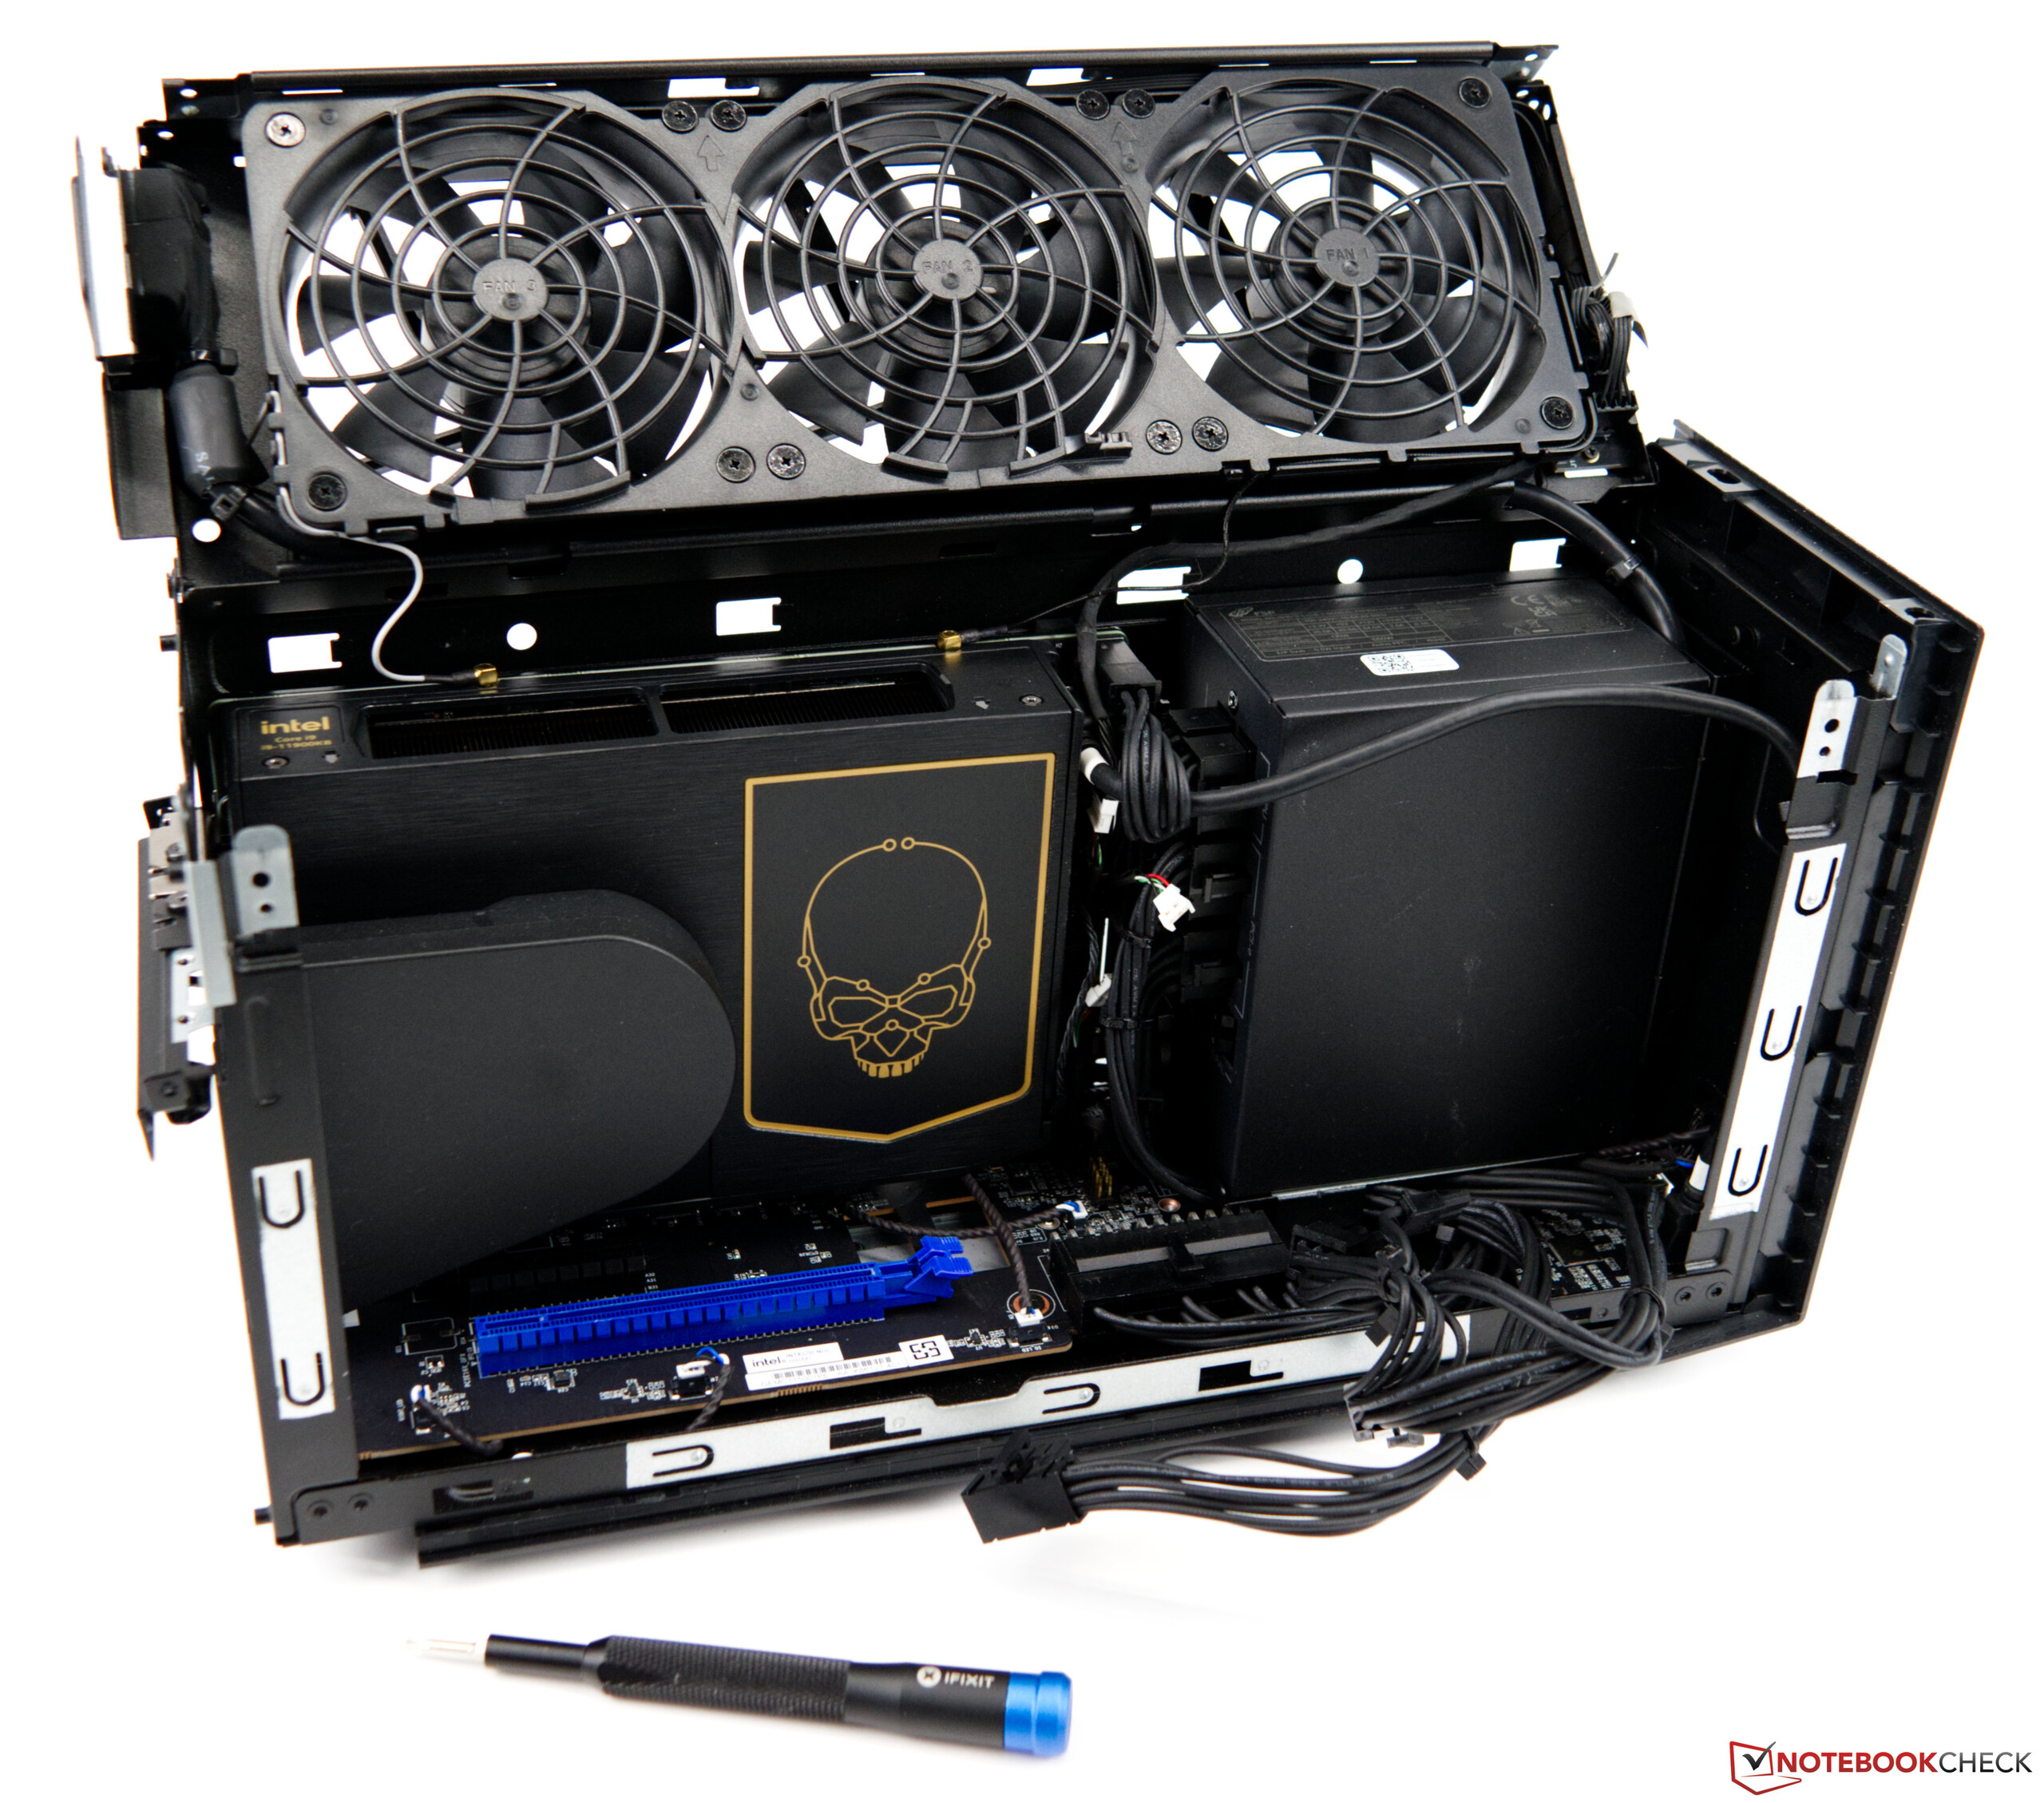
Intel NUC 11 Extreme Compute-Element im Detail

Intel NUC 11 Extreme Kit Compute Element

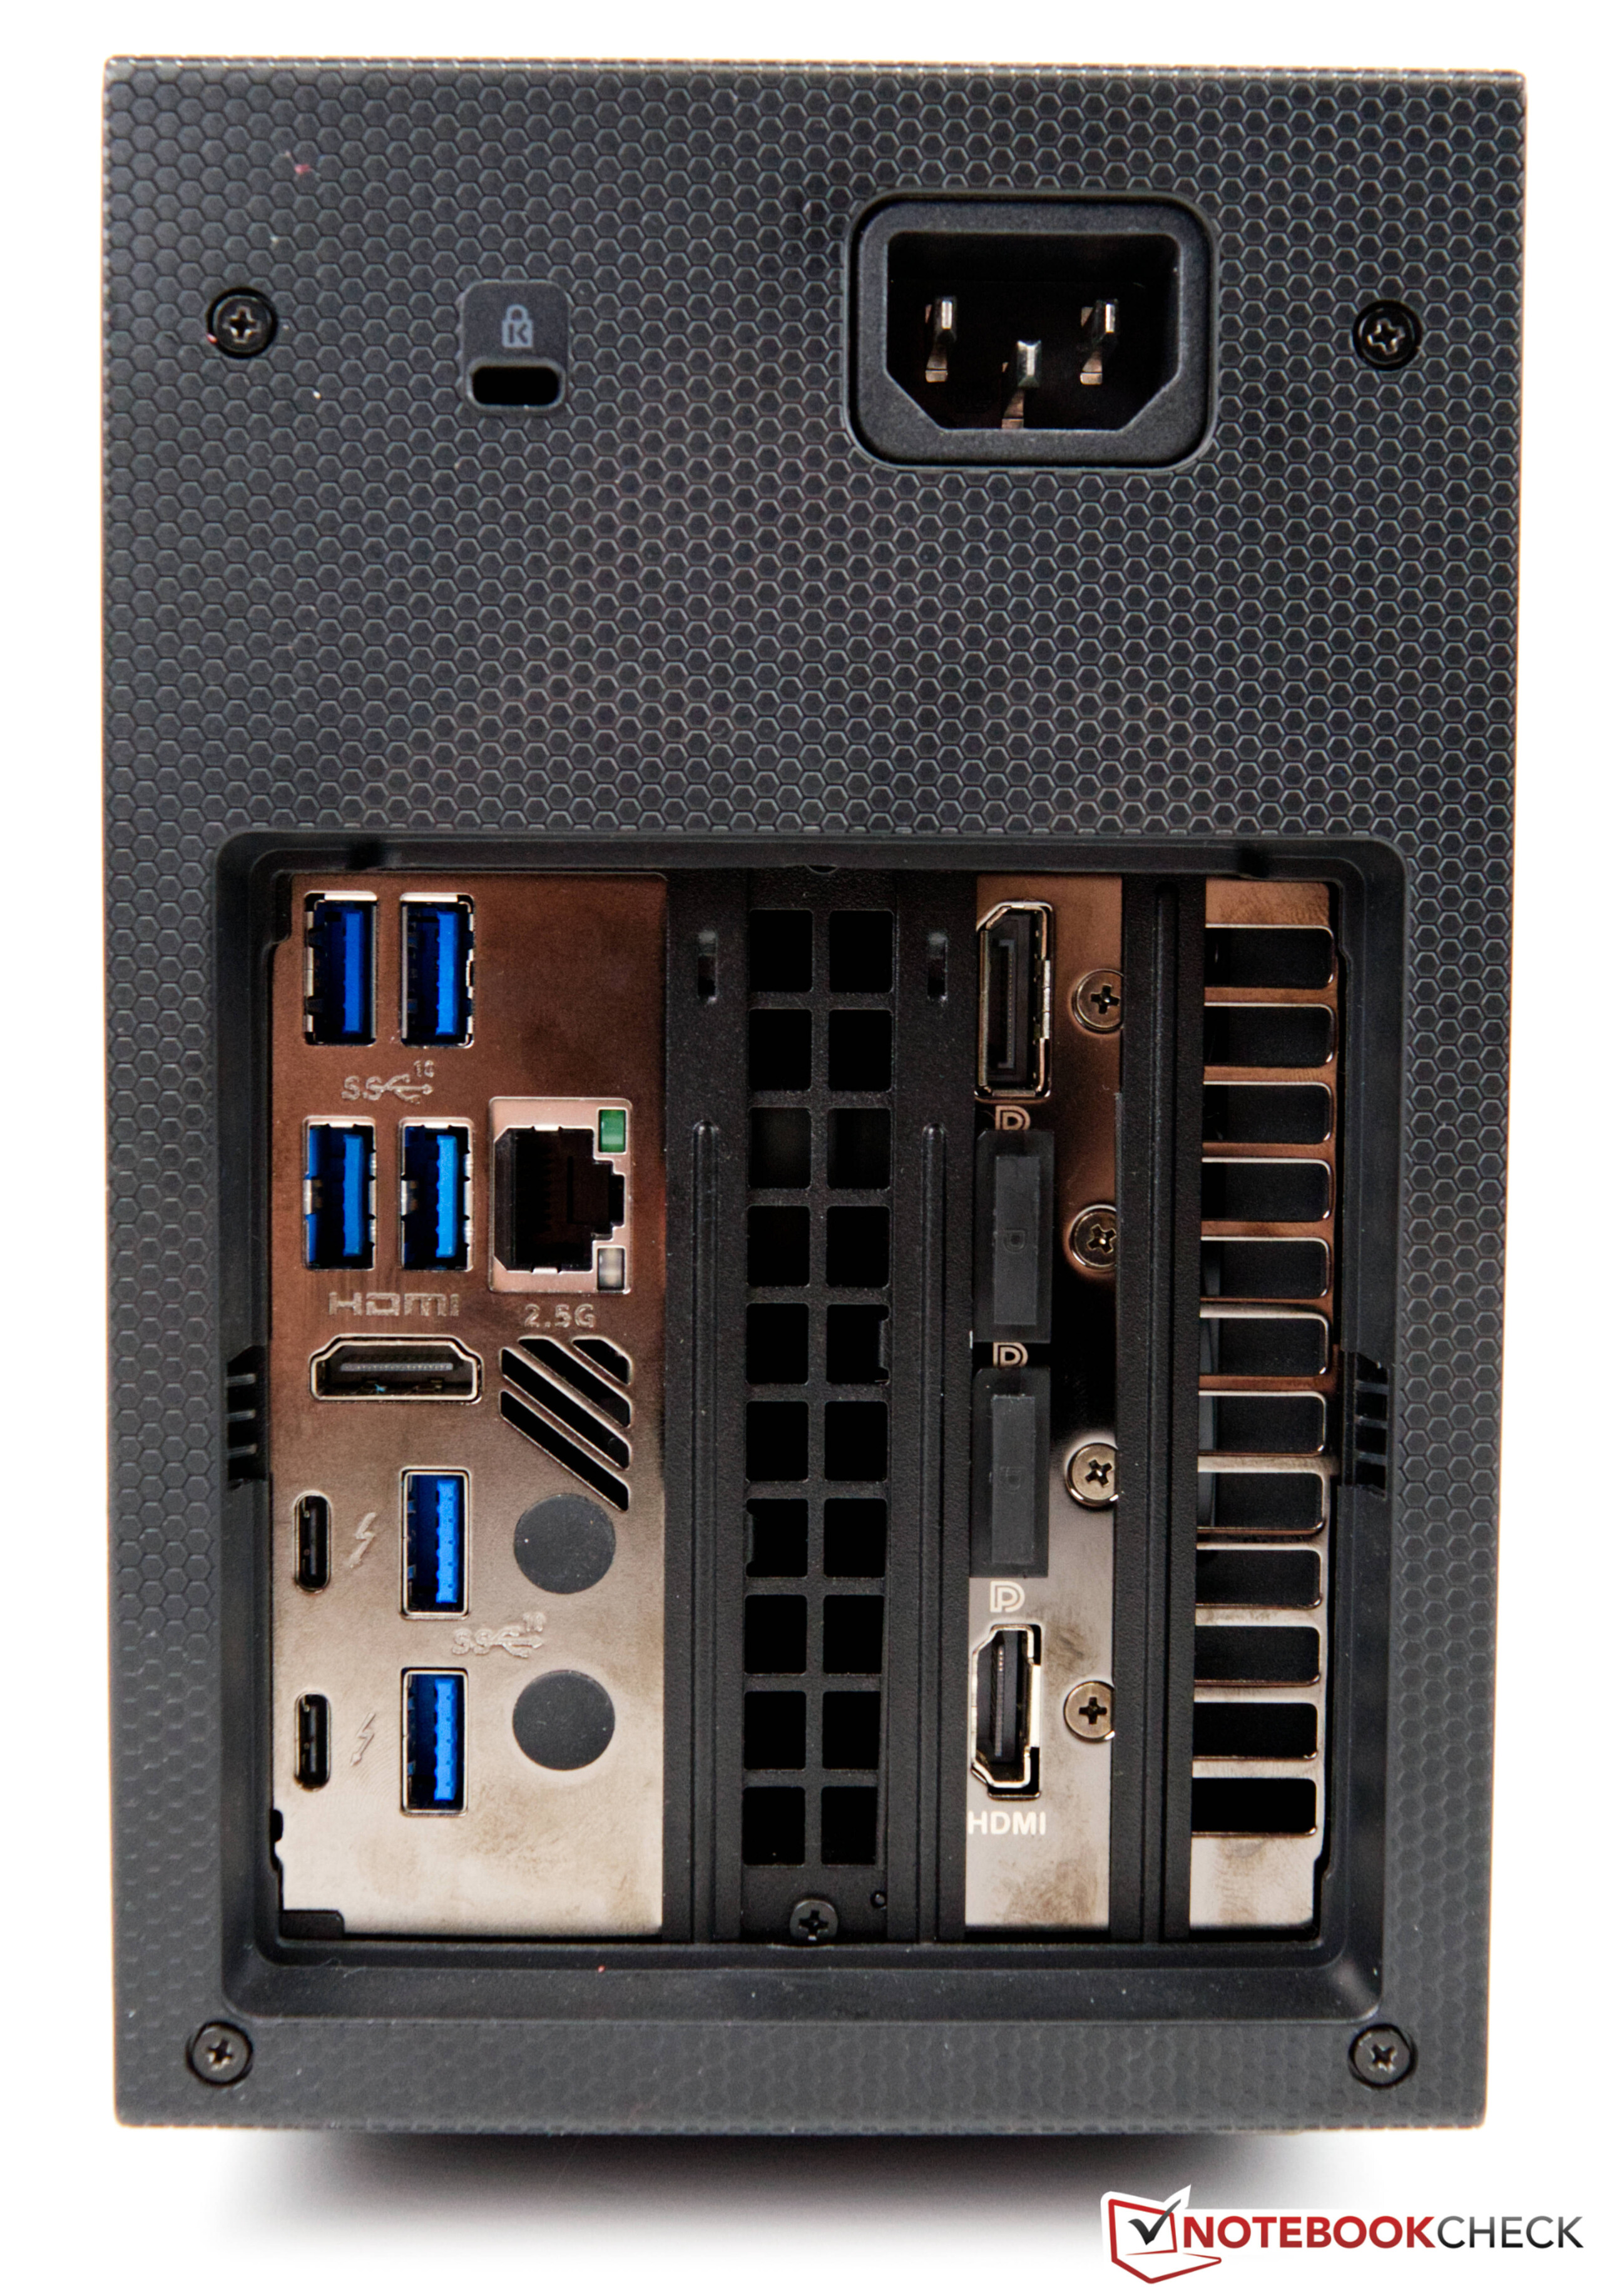
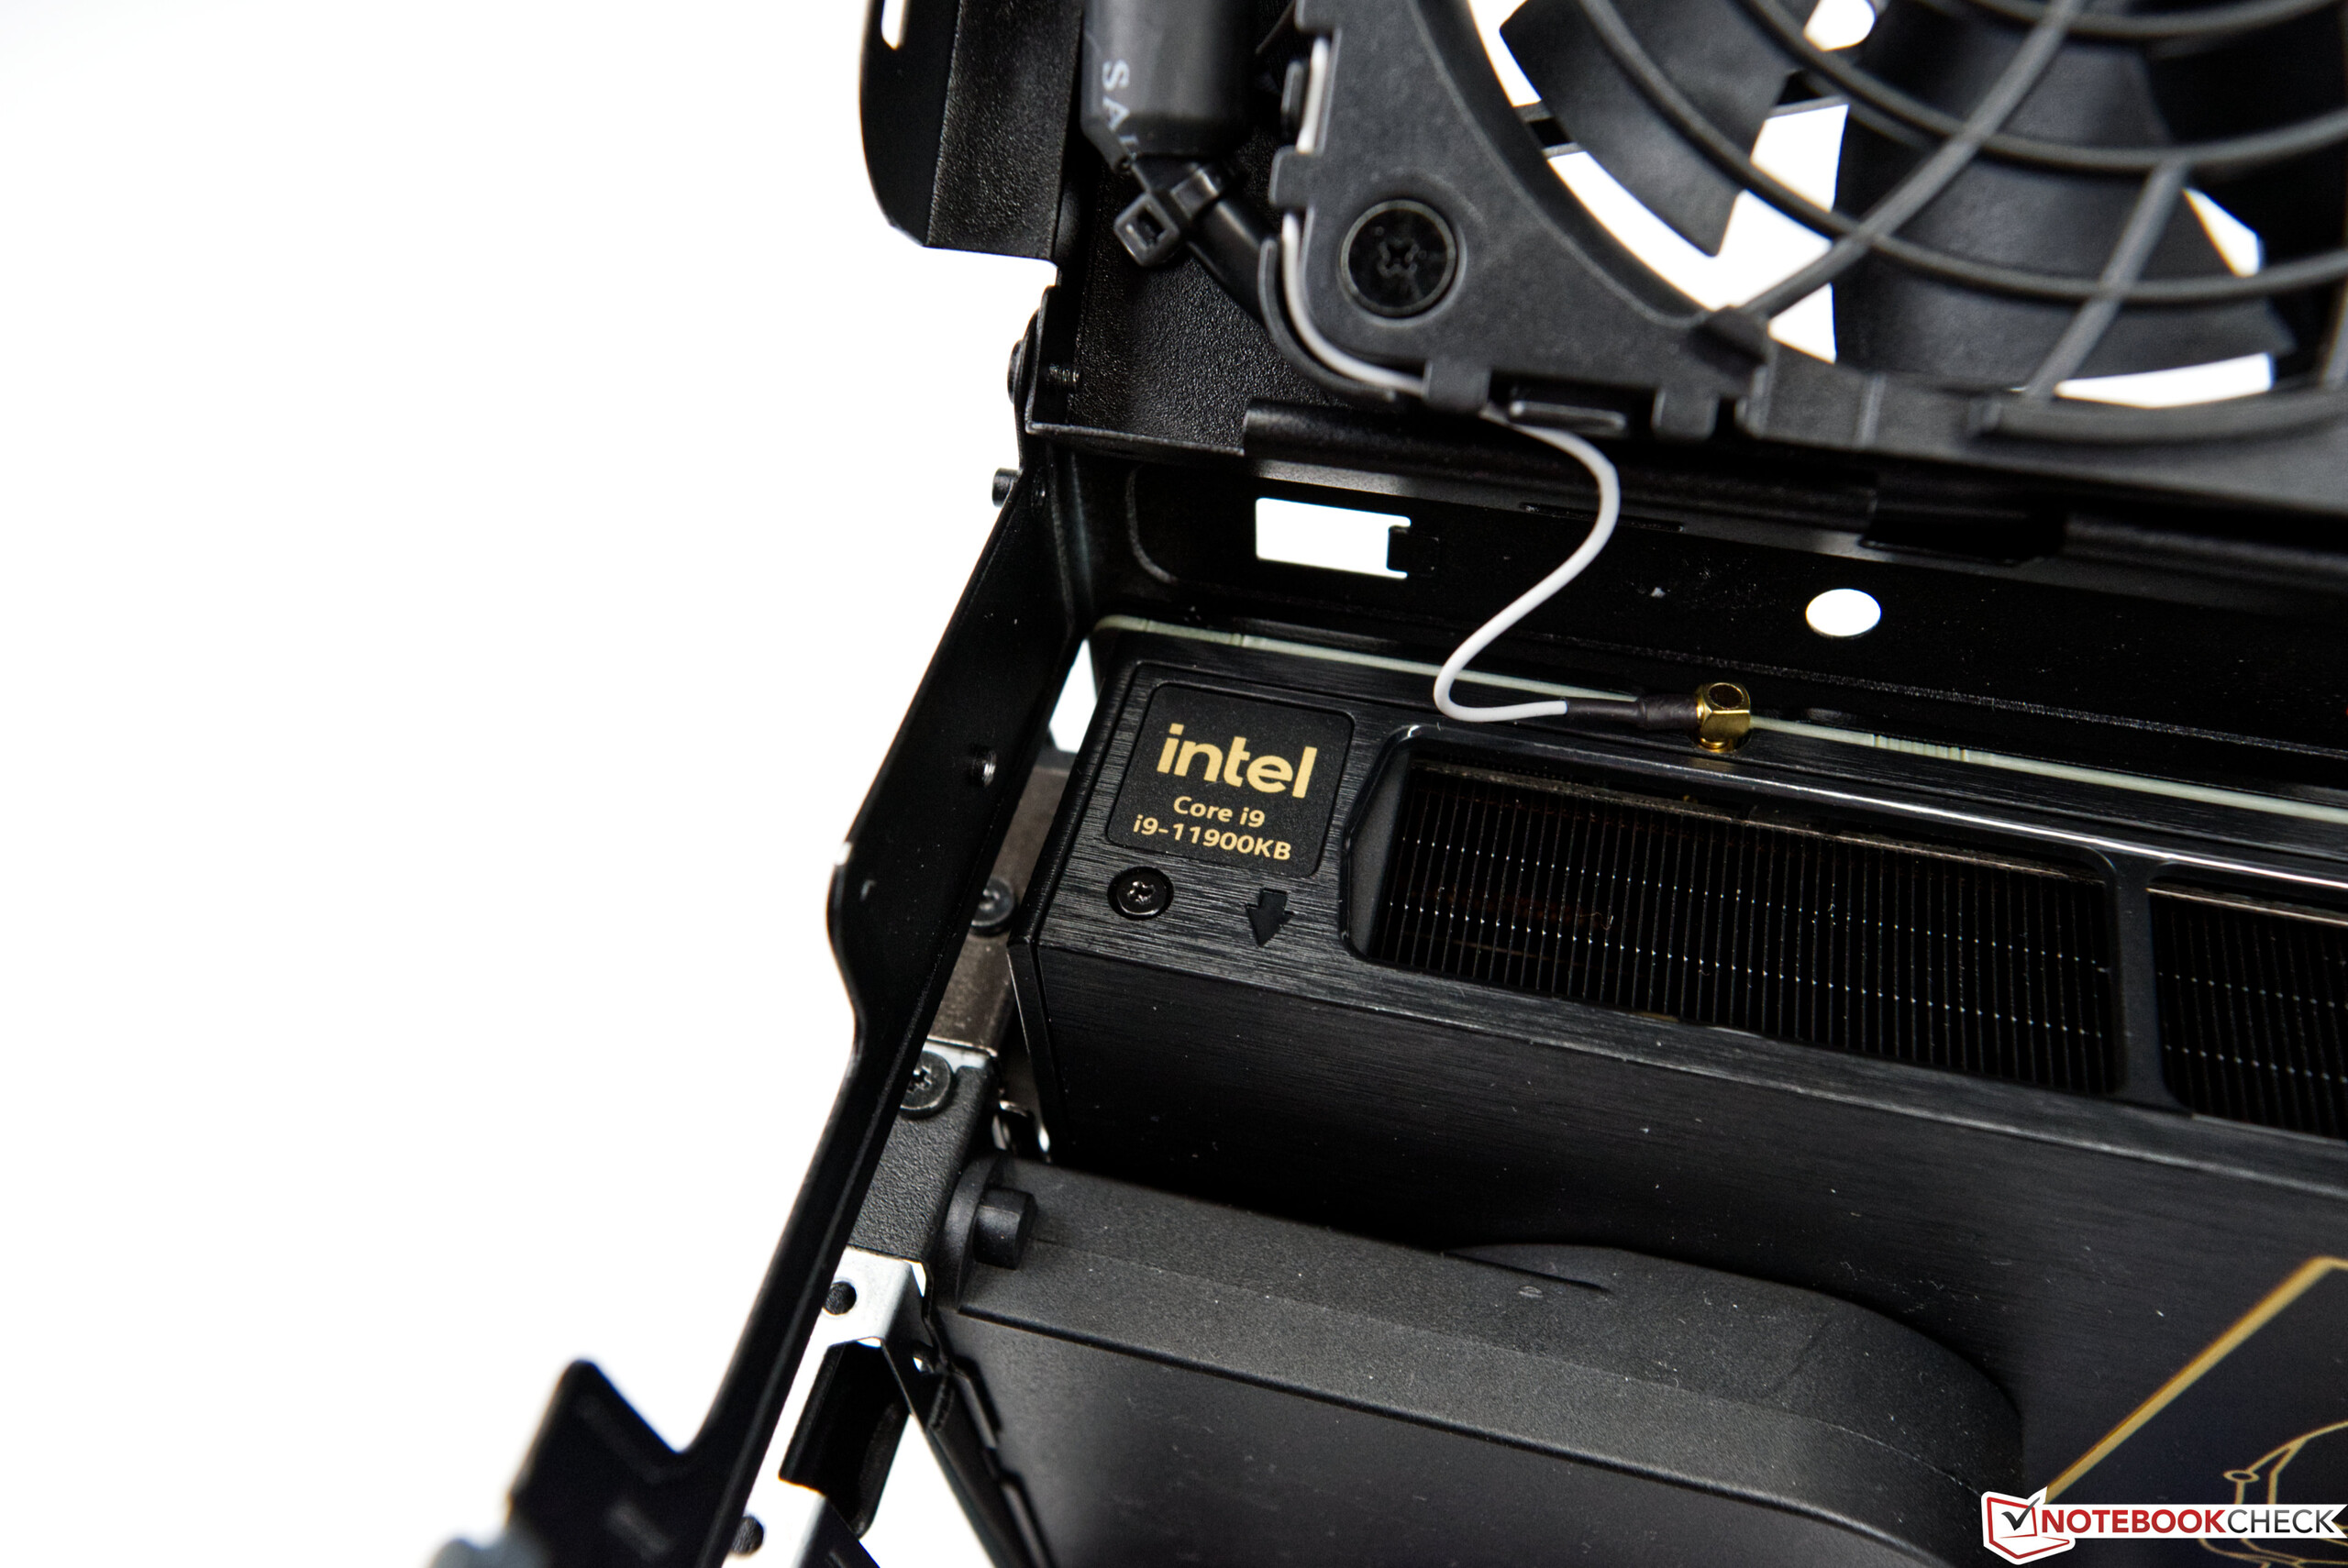
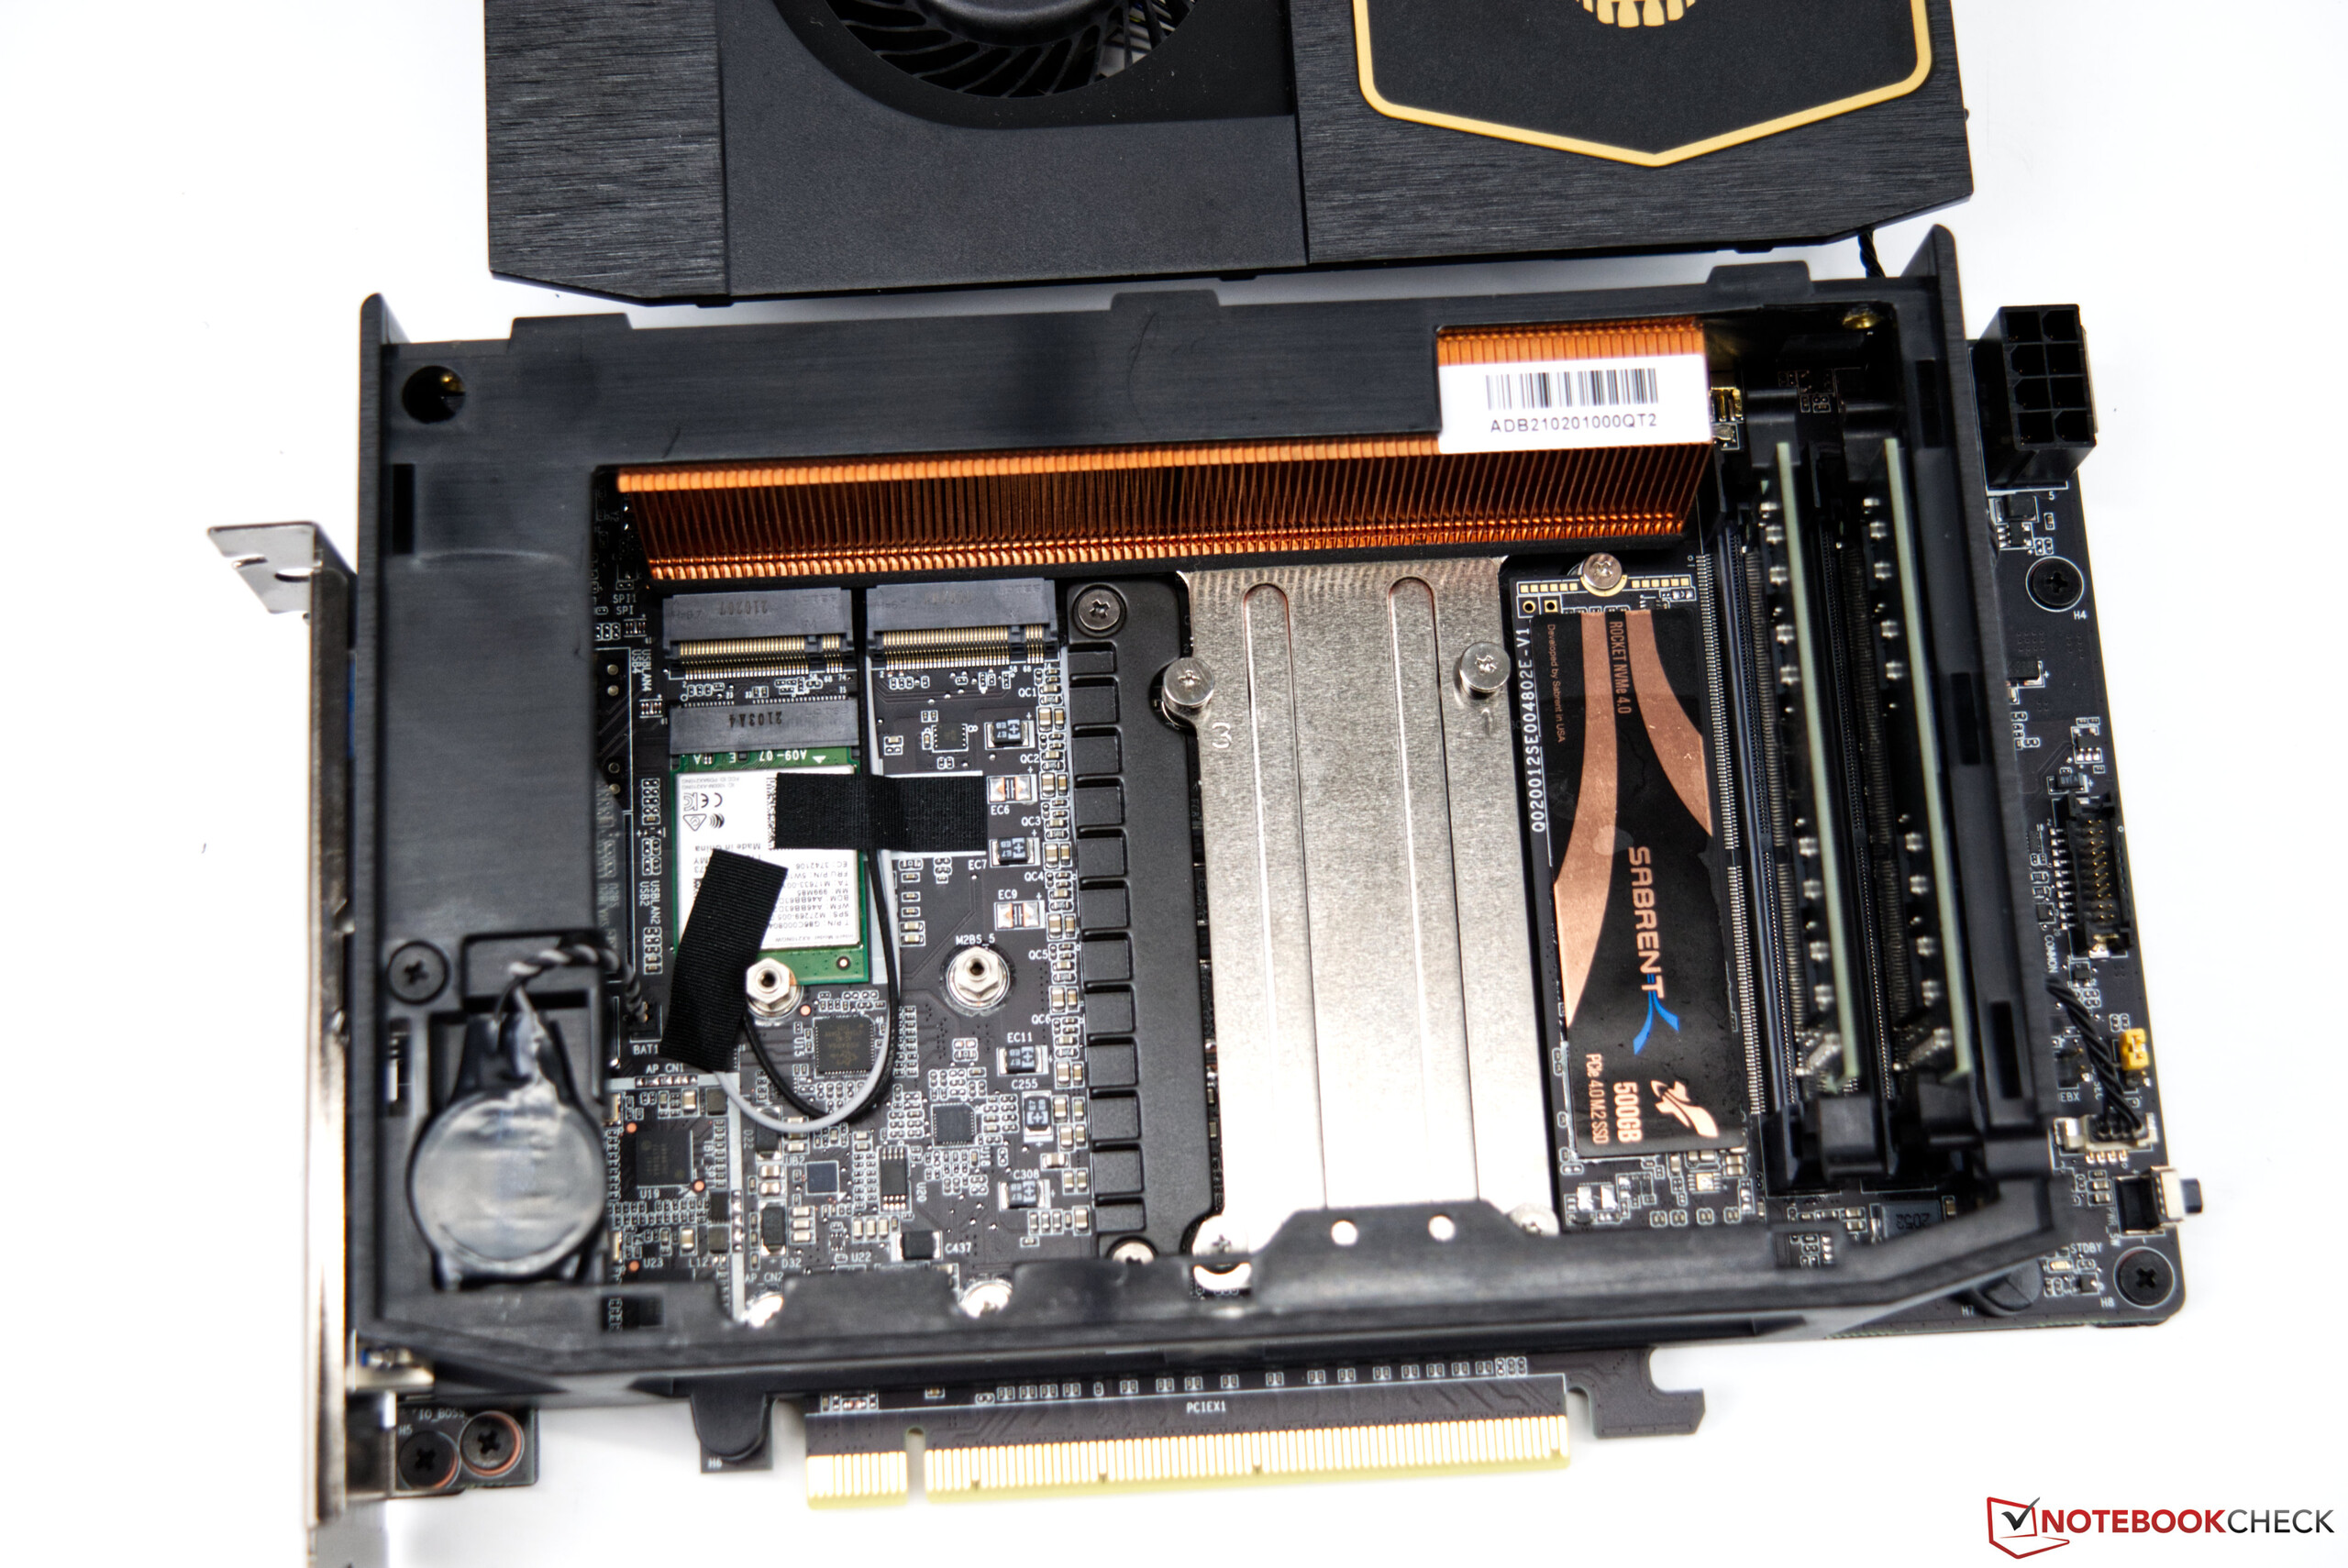
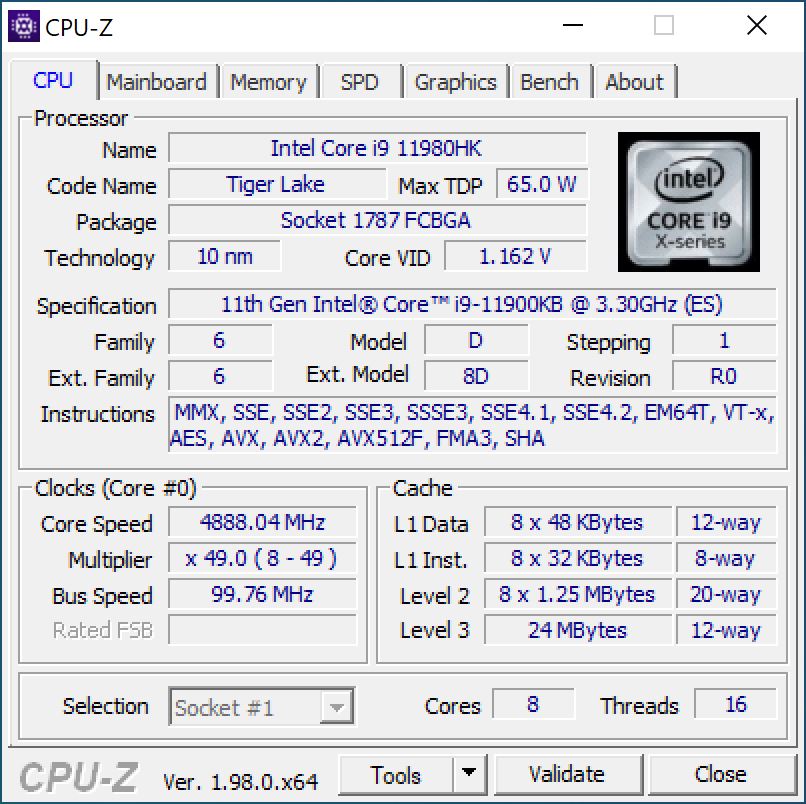
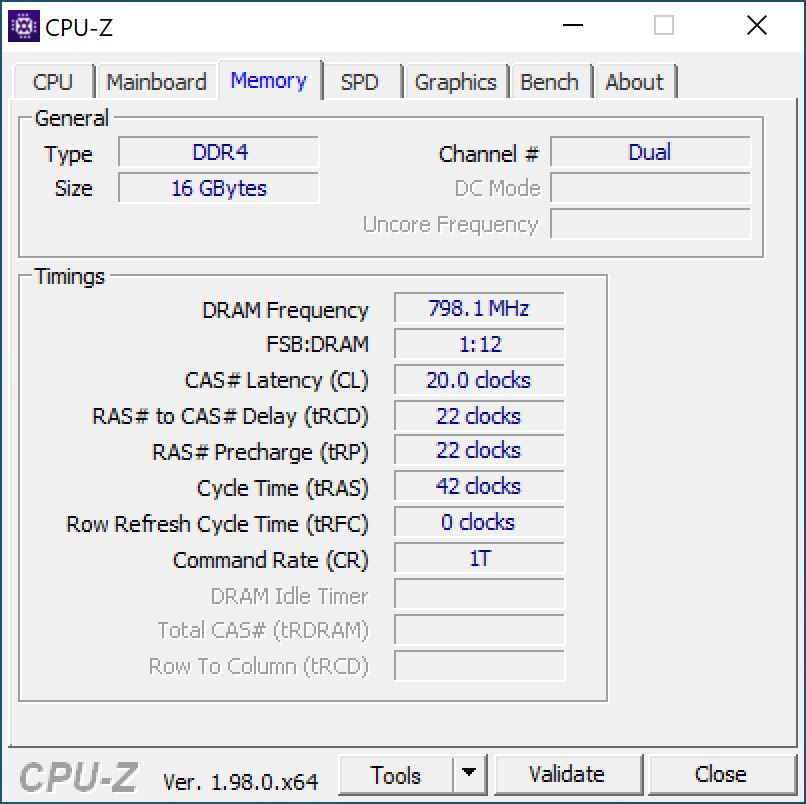
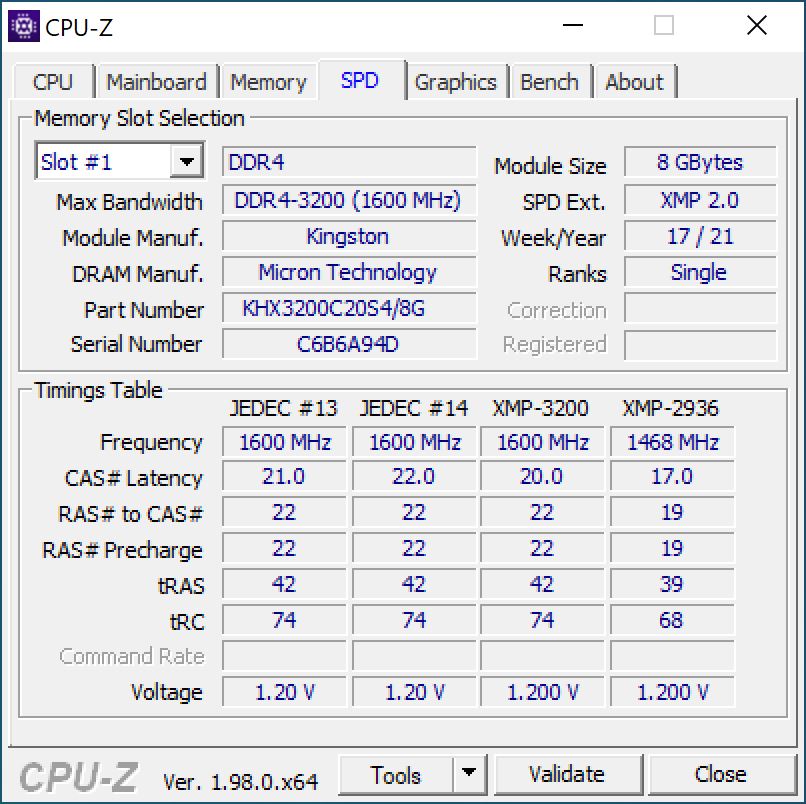
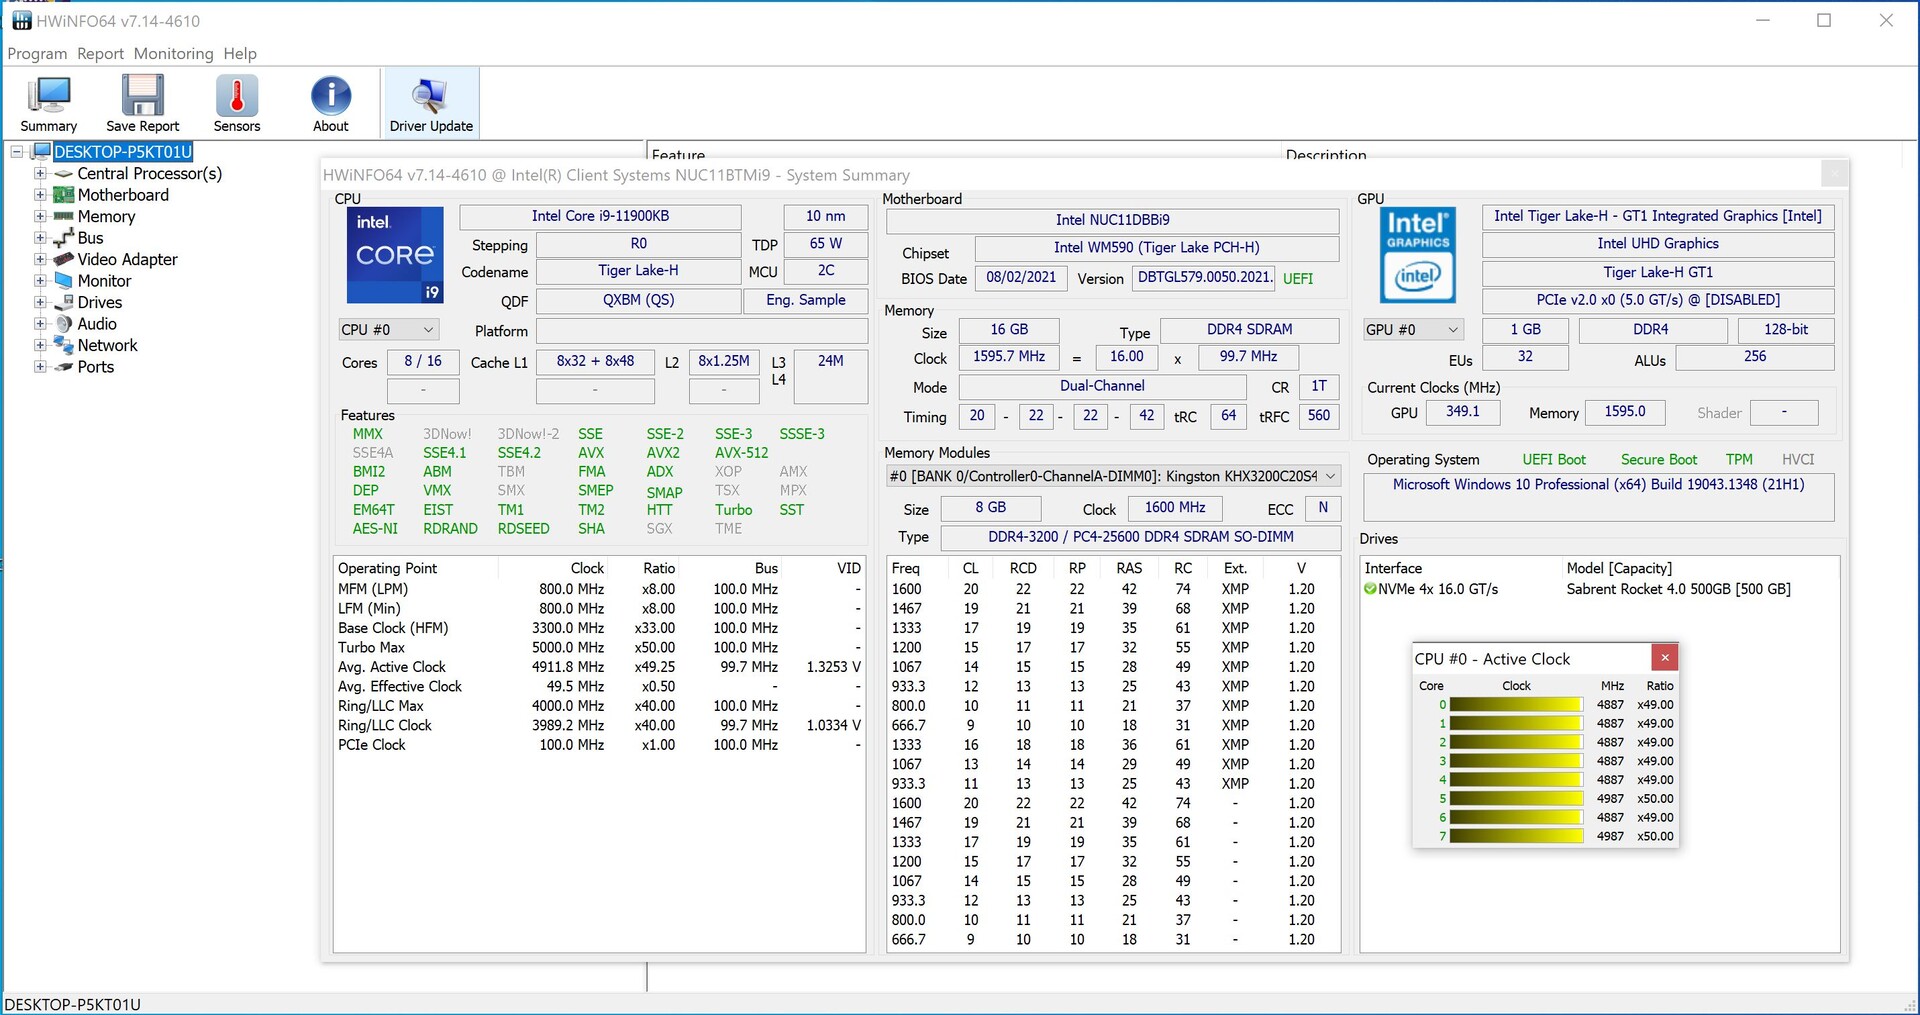
Der Intel NUC 11 Extreme bietet mit dem Intel Core i9-11900KB einen 8-Kern-SoC mit 16 Threads auf Basis der Tiger-Lake-Serie. Aus dem Mobilsektor stammt das SoC und ist aufgrund der geringen Leistungsaufnahme eine gute Option für kleine und kompakte Systeme. Außerdem befinden sich alle externen Schnittstellen an dem Compute-Element, welches in Form einer PCI-Express-Steckkarte im System steckt. Alles Wichtige ist an Bord und es muss auf nichts verzichtet werden. Auf der Rückseite gibt es 6x USB 3.1 Gen2 Typ-A und zwei USB-C-Anschlüsse inklusive Thunderbolt 4. Über HDMI oder auch USB-C lassen sich bis zu drei Displays gleichzeitig betreiben und mittels WiFi 6E oder 2,5 GBit LAN gibt es zwei verschiedene Möglichkeiten das System mit dem Netzwerk zu verbinden. Im Compute-Element selbst lassen sich zwei SO-DIMM-RAM-Module mit jeweils maximal 32 GB verbauen. Überdies finden hier noch drei M.2 SSDs Platz.

Prozessor Benchmarks

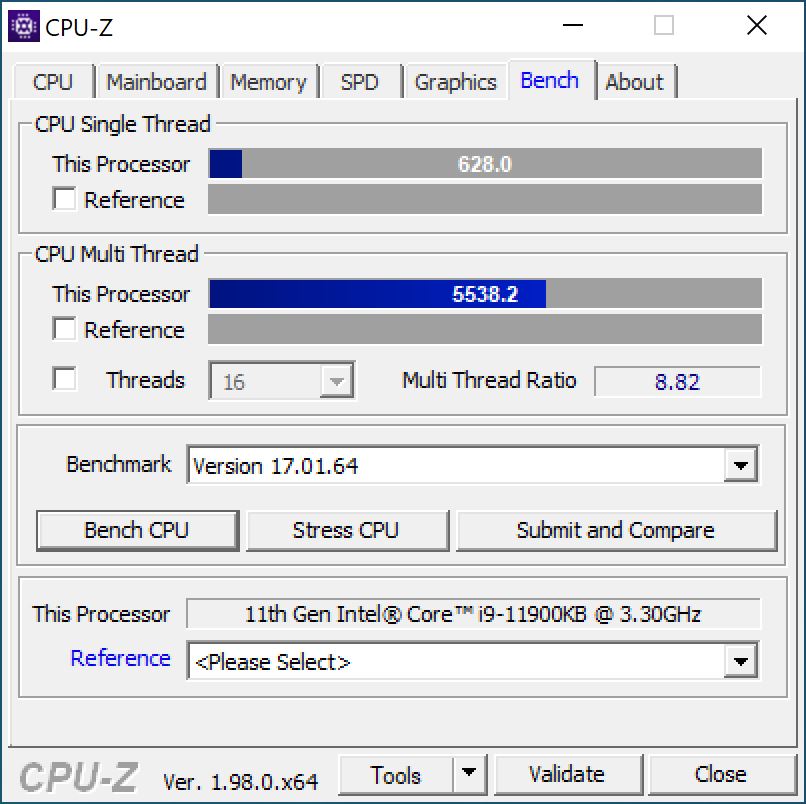
Bei dem Intel Core i9-11900KB handelt es sich um ein SoC, was aus dem Laptop-Sektor den Weg in den Desktop-Bereich gefunden hat. Intel verbaut das SoC in dem schon beschriebenen Compute-Element und profitiert dabei von der geringen Leistungsaufnahme, die bei 65 Watt liegt. Die maximale CPU-Package-Power ist aber kurzfristig bei 90 Watt begrenzt.

Im Test zeigt das SoC eine solide Leistung und rechnet dabei etwas gleichschnell wie der Intel Core i5-11600K. Bei Multi-Thread-Anwendungen ist der Intel Core i9-11900KB dem Core i5-11600K aufgrund der zwei zusätzlichen Recheneinheiten überlegen. Vergleichen wir einmal zwei 8-Kerner, so muss sich unser Testsample im Vergleich mit dem Intel Core i9-11900K geschlagen geben. Dennoch ist der Rückstand überschaubar, wenn man einmal den Energieverbrauch der CPUs dazu betrachtet.

Für weitere Vergleiche und Benchmarks verweisen wir hier auf unsere CPU-Vergleichstabelle.

CPU-Z
CPU-Z
CPU-Z
CPU-Z
CPU-Z
CPU-Z
CPU-Z
HWiNFO
Performance Rating - Percent
AMD Ryzen 7 5800X, NVIDIA Titan RTX
R7 5800X, 3800 MHz
54.2 pt
Intel Core i9-11900K, NVIDIA Titan RTX
i9-11900K, 3500 MHz
52.4 pt
AMD Ryzen 9 3950X, NVIDIA Titan RTX
R9 3950X, 3500 MHz
51.4 pt
Intel Core i9-10900K, NVIDIA Titan RTX
i9-10900K, 3700 MHz
50.9 pt
Intel Core i9-11900KB, NVIDIA GeForce RTX 3060
i9-11900KB, 3300 MHz
48.1 pt
Intel Core i5-11600K, NVIDIA Titan RTX
i5-11600K, 3900 MHz
47.7 pt
AMD Ryzen 7 3800XT, NVIDIA Titan RTX
R7 3800XT, 3900 MHz
46.9 pt
Intel Core i9-9980HK, NVIDIA GeForce RTX 2070 (Desktop)
i9-9980HK, 2400 MHz
43.7 pt
Intel Core i5-10600K, NVIDIA Titan RTX
i5-10600K, 4100 MHz
42.2 pt
Cinebench R15
CPU Single 64Bit
AMD Ryzen 7 5800X, NVIDIA Titan RTX
R7 5800X, 3800 MHz
266 Points +8%
Intel Core i9-11900K, NVIDIA Titan RTX
i9-11900K, 3500 MHz
262 Points +6%
Intel Core i9-11900KB, NVIDIA GeForce RTX 3060
i9-11900KB, 3300 MHz
247 Points
Intel Core i5-11600K, NVIDIA Titan RTX
i5-11600K, 3900 MHz
242 Points -2%
Intel Core i9-10900K, NVIDIA Titan RTX
i9-10900K, 3700 MHz
224 Points -9%
AMD Ryzen 7 3800XT, NVIDIA Titan RTX
R7 3800XT, 3900 MHz
219 Points -11%
Intel Core i9-9980HK, NVIDIA GeForce RTX 2070 (Desktop)
i9-9980HK, 2400 MHz
215 Points -13%
AMD Ryzen 9 3950X, NVIDIA Titan RTX
R9 3950X, 3500 MHz
209 Points -15%
Intel Core i5-10600K, NVIDIA Titan RTX
i5-10600K, 4100 MHz
205 Points -17%
CPU Multi 64Bit
AMD Ryzen 9 3950X, NVIDIA Titan RTX
R9 3950X, 3500 MHz
4002 Points +97%
Intel Core i9-10900K, NVIDIA Titan RTX
i9-10900K, 3700 MHz
2620 Points +29%
AMD Ryzen 7 5800X, NVIDIA Titan RTX
R7 5800X, 3800 MHz
2616 Points +29%
Intel Core i9-11900K, NVIDIA Titan RTX
i9-11900K, 3500 MHz
2436 Points +20%
AMD Ryzen 7 3800XT, NVIDIA Titan RTX
R7 3800XT, 3900 MHz
2230 Points +10%
Intel Core i9-11900KB, NVIDIA GeForce RTX 3060
i9-11900KB, 3300 MHz
2027 Points
Intel Core i5-11600K, NVIDIA Titan RTX
i5-11600K, 3900 MHz
1738 Points -14%
Intel Core i9-9980HK, NVIDIA GeForce RTX 2070 (Desktop)
i9-9980HK, 2400 MHz
1607 Points -21%
Intel Core i5-10600K, NVIDIA Titan RTX
i5-10600K, 4100 MHz
1452 Points -28%
Cinebench R20
CPU (Single Core)
Intel Core i9-11900K, NVIDIA Titan RTX
i9-11900K, 3500 MHz
647 Points +3%
Intel Core i9-11900KB, NVIDIA GeForce RTX 3060
i9-11900KB, 3300 MHz
629 Points
AMD Ryzen 7 5800X, NVIDIA Titan RTX
R7 5800X, 3800 MHz
625 Points -1%
Intel Core i5-11600K, NVIDIA Titan RTX
i5-11600K, 3900 MHz
595 Points -5%
AMD Ryzen 7 3800XT, NVIDIA Titan RTX
R7 3800XT, 3900 MHz
544 Points -14%
Intel Core i9-10900K, NVIDIA Titan RTX
i9-10900K, 3700 MHz
532 Points -15%
AMD Ryzen 9 3950X, NVIDIA Titan RTX
R9 3950X, 3500 MHz
520 Points -17%
Intel Core i9-9980HK, NVIDIA GeForce RTX 2070 (Desktop)
i9-9980HK, 2400 MHz
504 Points -20%
Intel Core i5-10600K, NVIDIA Titan RTX
i5-10600K, 4100 MHz
464 Points -26%
CPU (Multi Core)
AMD Ryzen 9 3950X, NVIDIA Titan RTX
R9 3950X, 3500 MHz
9075 Points +95%
Intel Core i9-10900K, NVIDIA Titan RTX
i9-10900K, 3700 MHz
6381 Points +37%
AMD Ryzen 7 5800X, NVIDIA Titan RTX
R7 5800X, 3800 MHz
6068 Points +31%
Intel Core i9-11900K, NVIDIA Titan RTX
i9-11900K, 3500 MHz
5997 Points +29%
AMD Ryzen 7 3800XT, NVIDIA Titan RTX
R7 3800XT, 3900 MHz
5120 Points +10%
Intel Core i9-11900KB, NVIDIA GeForce RTX 3060
i9-11900KB, 3300 MHz
4644 Points
Intel Core i5-11600K, NVIDIA Titan RTX
i5-11600K, 3900 MHz
4349 Points -6%
Intel Core i5-10600K, NVIDIA Titan RTX
i5-10600K, 4100 MHz
3443 Points -26%
Intel Core i9-9980HK, NVIDIA GeForce RTX 2070 (Desktop)
i9-9980HK, 2400 MHz
3357 Points -28%
Cinebench R11.5
CPU Single 64Bit
Intel Core i9-11900K, NVIDIA Titan RTX
i9-11900K, 3500 MHz
3.1 Points +9%
AMD Ryzen 7 5800X, NVIDIA Titan RTX
R7 5800X, 3800 MHz
3.09 Points +9%
Intel Core i5-11600K, NVIDIA Titan RTX
i5-11600K, 3900 MHz
2.87 Points +1%
Intel Core i9-11900KB, NVIDIA GeForce RTX 3060
i9-11900KB, 3300 MHz
2.84 Points
Intel Core i9-10900K, NVIDIA Titan RTX
i9-10900K, 3700 MHz
2.56 Points -10%
Intel Core i9-9980HK, NVIDIA GeForce RTX 2070 (Desktop)
i9-9980HK, 2400 MHz
2.4 Points -15%
AMD Ryzen 9 3950X, NVIDIA Titan RTX
R9 3950X, 3500 MHz
2.37 Points -17%
AMD Ryzen 7 3800XT, NVIDIA Titan RTX
R7 3800XT, 3900 MHz
2.36 Points -17%
Intel Core i5-10600K, NVIDIA Titan RTX
i5-10600K, 4100 MHz
2.19 Points -23%
CPU Multi 64Bit
AMD Ryzen 9 3950X, NVIDIA Titan RTX
R9 3950X, 3500 MHz
43.68 Points +98%
AMD Ryzen 7 5800X, NVIDIA Titan RTX
R7 5800X, 3800 MHz
29.31 Points +33%
Intel Core i9-10900K, NVIDIA Titan RTX
i9-10900K, 3700 MHz
29.03 Points +32%
Intel Core i9-11900K, NVIDIA Titan RTX
i9-11900K, 3500 MHz
26.76 Points +21%
AMD Ryzen 7 3800XT, NVIDIA Titan RTX
R7 3800XT, 3900 MHz
24.18 Points +10%
Intel Core i9-11900KB, NVIDIA GeForce RTX 3060
i9-11900KB, 3300 MHz
22.07 Points
Intel Core i5-11600K, NVIDIA Titan RTX
i5-11600K, 3900 MHz
19.32 Points -12%
Intel Core i9-9980HK, NVIDIA GeForce RTX 2070 (Desktop)
i9-9980HK, 2400 MHz
18.04 Points -18%
Intel Core i5-10600K, NVIDIA Titan RTX
i5-10600K, 4100 MHz
15.76 Points -29%
Cinebench R10
Rendering Single CPUs 64Bit
Intel Core i9-11900K, NVIDIA Titan RTX
i9-11900K, 3500 MHz
14149 Points +13%
AMD Ryzen 7 5800X, NVIDIA Titan RTX
R7 5800X, 3800 MHz
13039 Points +4%
Intel Core i5-11600K, NVIDIA Titan RTX
i5-11600K, 3900 MHz
12957 Points +4%
Intel Core i9-11900KB, NVIDIA GeForce RTX 3060
i9-11900KB, 3300 MHz
12508 Points
Intel Core i9-10900K, NVIDIA Titan RTX
i9-10900K, 3700 MHz
10625 Points -15%
AMD Ryzen 9 3950X, NVIDIA Titan RTX
R9 3950X, 3500 MHz
10580 Points -15%
AMD Ryzen 7 3800XT, NVIDIA Titan RTX
R7 3800XT, 3900 MHz
10497 Points -16%
Intel Core i9-9980HK, NVIDIA GeForce RTX 2070 (Desktop)
i9-9980HK, 2400 MHz
10359 Points -17%
Intel Core i5-10600K, NVIDIA Titan RTX
i5-10600K, 4100 MHz
9594 Points -23%
Rendering Multiple CPUs 64Bit
AMD Ryzen 9 3950X, NVIDIA Titan RTX
R9 3950X, 3500 MHz
86232 Points +28%
AMD Ryzen 7 5800X, NVIDIA Titan RTX
R7 5800X, 3800 MHz
83426 Points +24%
Intel Core i9-11900K, NVIDIA Titan RTX
i9-11900K, 3500 MHz
80613 Points +20%
Intel Core i9-10900K, NVIDIA Titan RTX
i9-10900K, 3700 MHz
80495 Points +20%
AMD Ryzen 7 3800XT, NVIDIA Titan RTX
R7 3800XT, 3900 MHz
68388 Points +2%
Intel Core i9-11900KB, NVIDIA GeForce RTX 3060
i9-11900KB, 3300 MHz
67183 Points
Intel Core i5-11600K, NVIDIA Titan RTX
i5-11600K, 3900 MHz
64663 Points -4%
Intel Core i9-9980HK, NVIDIA GeForce RTX 2070 (Desktop)
i9-9980HK, 2400 MHz
55742 Points -17%
Intel Core i5-10600K, NVIDIA Titan RTX
i5-10600K, 4100 MHz
51816 Points -23%
Blender - v2.79 BMW27 CPU
Intel Core i9-9980HK, NVIDIA GeForce RTX 2070 (Desktop)
i9-9980HK, 2400 MHz
317.4 Seconds * -21%
Intel Core i5-10600K, NVIDIA Titan RTX
i5-10600K, 4100 MHz
302.4 Seconds * -15%
Intel Core i5-11600K, NVIDIA Titan RTX
i5-11600K, 3900 MHz
264.5 Seconds * -1%
Intel Core i9-11900KB, NVIDIA GeForce RTX 3060
i9-11900KB, 3300 MHz
262.7 Seconds *
AMD Ryzen 7 3800XT, NVIDIA Titan RTX
R7 3800XT, 3900 MHz
222.7 Seconds * +15%
AMD Ryzen 7 5800X, NVIDIA Titan RTX
R7 5800X, 3800 MHz
196.8 Seconds * +25%
Intel Core i9-11900K, NVIDIA Titan RTX
i9-11900K, 3500 MHz
190.3 Seconds * +28%
Intel Core i9-10900K, NVIDIA Titan RTX
i9-10900K, 3700 MHz
167.3 Seconds * +36%
AMD Ryzen 9 3950X, NVIDIA Titan RTX
R9 3950X, 3500 MHz
125.8 Seconds * +52%
wPrime 2.10
32m
Intel Core i5-11600K, NVIDIA Titan RTX
i5-11600K, 3900 MHz
4.919 s * -44%
Intel Core i5-10600K, NVIDIA Titan RTX
i5-10600K, 4100 MHz
4.648 s * -36%
AMD Ryzen 9 3950X, NVIDIA Titan RTX
R9 3950X, 3500 MHz
4.112 s * -20%
Intel Core i9-11900K, NVIDIA Titan RTX
i9-11900K, 3500 MHz
3.982 s * -17%
Intel Core i9-9980HK, NVIDIA GeForce RTX 2070 (Desktop)
i9-9980HK, 2400 MHz
3.788 s * -11%
AMD Ryzen 7 3800XT, NVIDIA Titan RTX
R7 3800XT, 3900 MHz
3.74 s * -9%
Intel Core i9-10900K, NVIDIA Titan RTX
i9-10900K, 3700 MHz
3.582 s * -5%
Intel Core i9-11900KB, NVIDIA GeForce RTX 3060
i9-11900KB, 3300 MHz
3.416 s *
AMD Ryzen 7 5800X, NVIDIA Titan RTX
R7 5800X, 3800 MHz
3.037 s * +11%
1024m
Intel Core i9-9980HK, NVIDIA GeForce RTX 2070 (Desktop)
i9-9980HK, 2400 MHz
120.2 s * -18%
Intel Core i5-10600K, NVIDIA Titan RTX
i5-10600K, 4100 MHz
113.2 s * -11%
Intel Core i5-11600K, NVIDIA Titan RTX
i5-11600K, 3900 MHz
107.6 s * -5%
Intel Core i9-11900KB, NVIDIA GeForce RTX 3060
i9-11900KB, 3300 MHz
102.2 s *
AMD Ryzen 7 5800X, NVIDIA Titan RTX
R7 5800X, 3800 MHz
86.1 s * +16%
AMD Ryzen 7 3800XT, NVIDIA Titan RTX
R7 3800XT, 3900 MHz
81.4 s * +20%
Intel Core i9-11900K, NVIDIA Titan RTX
i9-11900K, 3500 MHz
77.9 s * +24%
Intel Core i9-10900K, NVIDIA Titan RTX
i9-10900K, 3700 MHz
66.3 s * +35%
AMD Ryzen 9 3950X, NVIDIA Titan RTX
R9 3950X, 3500 MHz
44.86 s * +56%
X264 HD Benchmark 4.0
Pass 1
AMD Ryzen 7 5800X, NVIDIA Titan RTX
R7 5800X, 3800 MHz
339 (338min - 341max) fps +24%
Intel Core i9-11900K, NVIDIA Titan RTX
i9-11900K, 3500 MHz
309.5 (308min - 311max) fps +14%
Intel Core i5-11600K, NVIDIA Titan RTX
i5-11600K, 3900 MHz
299 (294min - 299max) fps +10%
Intel Core i9-10900K, NVIDIA Titan RTX
i9-10900K, 3700 MHz
289.5 (289min - 291max) fps +6%
Intel Core i9-11900KB, NVIDIA GeForce RTX 3060
i9-11900KB, 3300 MHz
272.5 (271min - 279max) fps
AMD Ryzen 7 3800XT, NVIDIA Titan RTX
R7 3800XT, 3900 MHz
271 (270min - 273max) fps -1%
AMD Ryzen 9 3950X, NVIDIA Titan RTX
R9 3950X, 3500 MHz
265 (265min - 266max) fps -3%
Intel Core i5-10600K, NVIDIA Titan RTX
i5-10600K, 4100 MHz
251.5 (250min - 253max) fps -8%
Intel Core i9-9980HK, NVIDIA GeForce RTX 2070 (Desktop)
i9-9980HK, 2400 MHz
237.5 (236min - 239max) fps -13%
Pass 2
AMD Ryzen 9 3950X, NVIDIA Titan RTX
R9 3950X, 3500 MHz
168 (168min - 169max) fps +58%
AMD Ryzen 7 5800X, NVIDIA Titan RTX
R7 5800X, 3800 MHz
152 (151min - 152max) fps +43%
Intel Core i9-10900K, NVIDIA Titan RTX
i9-10900K, 3700 MHz
149 (149min - 149max) fps +41%
Intel Core i9-11900K, NVIDIA Titan RTX
i9-11900K, 3500 MHz
137 (137min - 137max) fps +29%
AMD Ryzen 7 3800XT, NVIDIA Titan RTX
R7 3800XT, 3900 MHz
119 (118min - 119max) fps +12%
Intel Core i9-11900KB, NVIDIA GeForce RTX 3060
i9-11900KB, 3300 MHz
106 (101min - 108max) fps
Intel Core i5-11600K, NVIDIA Titan RTX
i5-11600K, 3900 MHz
101 (101min - 101max) fps -5%
Intel Core i9-9980HK, NVIDIA GeForce RTX 2070 (Desktop)
i9-9980HK, 2400 MHz
92.8 (89.1min - 100max) fps -12%
Intel Core i5-10600K, NVIDIA Titan RTX
i5-10600K, 4100 MHz
88.2 (88min - 88.2max) fps -17%
WinRAR - Result
AMD Ryzen 7 5800X, NVIDIA Titan RTX
R7 5800X, 3800 MHz
15604 KB/s +63%
Intel Core i9-10900K, NVIDIA Titan RTX
i9-10900K, 3700 MHz
9739 KB/s +2%
Intel Core i9-11900KB, NVIDIA GeForce RTX 3060
i9-11900KB, 3300 MHz
9584 KB/s
Intel Core i9-11900K, NVIDIA Titan RTX
i9-11900K, 3500 MHz
9030 KB/s -6%
Intel Core i5-11600K, NVIDIA Titan RTX
i5-11600K, 3900 MHz
7850 KB/s -18%
AMD Ryzen 7 3800XT, NVIDIA Titan RTX
R7 3800XT, 3900 MHz
7467 KB/s -22%
AMD Ryzen 9 3950X, NVIDIA Titan RTX
R9 3950X, 3500 MHz
7409 KB/s -23%
Intel Core i9-9980HK, NVIDIA GeForce RTX 2070 (Desktop)
i9-9980HK, 2400 MHz
7266 KB/s -24%
Intel Core i5-10600K, NVIDIA Titan RTX
i5-10600K, 4100 MHz
6536 KB/s -32%
TrueCrypt
AES Mean 100MB
AMD Ryzen 7 5800X, NVIDIA Titan RTX
R7 5800X, 3800 MHz
15 GB/s +29%
Intel Core i9-10900K, NVIDIA Titan RTX
i9-10900K, 3700 MHz
14.6 GB/s +26%
Intel Core i9-11900K, NVIDIA Titan RTX
i9-11900K, 3500 MHz
13 GB/s +12%
Intel Core i9-11900KB, NVIDIA GeForce RTX 3060
i9-11900KB, 3300 MHz
11.6 GB/s
AMD Ryzen 7 3800XT, NVIDIA Titan RTX
R7 3800XT, 3900 MHz
11.4 GB/s -2%
AMD Ryzen 9 3950X, NVIDIA Titan RTX
R9 3950X, 3500 MHz
10.8 GB/s -7%
Intel Core i9-9980HK, NVIDIA GeForce RTX 2070 (Desktop)
i9-9980HK, 2400 MHz
10.1 GB/s -13%
Intel Core i5-11600K, NVIDIA Titan RTX
i5-11600K, 3900 MHz
9.7 GB/s -16%
Intel Core i5-10600K, NVIDIA Titan RTX
i5-10600K, 4100 MHz
8 GB/s -31%
Twofish Mean 100MB
AMD Ryzen 9 3950X, NVIDIA Titan RTX
R9 3950X, 3500 MHz
3.6 GB/s +112%
Intel Core i9-10900K, NVIDIA Titan RTX
i9-10900K, 3700 MHz
2.6 GB/s +53%
AMD Ryzen 7 3800XT, NVIDIA Titan RTX
R7 3800XT, 3900 MHz
2 GB/s +18%
AMD Ryzen 7 5800X, NVIDIA Titan RTX
R7 5800X, 3800 MHz
2 GB/s +18%
Intel Core i9-11900K, NVIDIA Titan RTX
i9-11900K, 3500 MHz
1.9 GB/s +12%
Intel Core i9-9980HK, NVIDIA GeForce RTX 2070 (Desktop)
i9-9980HK, 2400 MHz
1.7 GB/s 0%
Intel Core i9-11900KB, NVIDIA GeForce RTX 3060
i9-11900KB, 3300 MHz
1.7 GB/s
Intel Core i5-11600K, NVIDIA Titan RTX
i5-11600K, 3900 MHz
1.5 GB/s -12%
Intel Core i5-10600K, NVIDIA Titan RTX
i5-10600K, 4100 MHz
1.4 GB/s -18%
Serpent Mean 100MB
AMD Ryzen 9 3950X, NVIDIA Titan RTX
R9 3950X, 3500 MHz
2.3 GB/s +109%
Intel Core i9-10900K, NVIDIA Titan RTX
i9-10900K, 3700 MHz
1.5 GB/s +36%
AMD Ryzen 7 5800X, NVIDIA Titan RTX
R7 5800X, 3800 MHz
1.3 GB/s +18%
AMD Ryzen 7 3800XT, NVIDIA Titan RTX
R7 3800XT, 3900 MHz
1.2 GB/s +9%
Intel Core i9-11900K, NVIDIA Titan RTX
i9-11900K, 3500 MHz
1.2 GB/s +9%
Intel Core i9-11900KB, NVIDIA GeForce RTX 3060
i9-11900KB, 3300 MHz
1.1 GB/s
Intel Core i9-9980HK, NVIDIA GeForce RTX 2070 (Desktop)
i9-9980HK, 2400 MHz
1 GB/s -9%
Intel Core i5-11600K, NVIDIA Titan RTX
i5-11600K, 3900 MHz
0.9 GB/s -18%
Intel Core i5-10600K, NVIDIA Titan RTX
i5-10600K, 4100 MHz
0.82 GB/s -25%
Geekbench 5.5
Multi-Core
AMD Ryzen 9 3950X, NVIDIA Titan RTX
R9 3950X, 3500 MHz
12363 Points +39%
Intel Core i9-10900K, NVIDIA Titan RTX
i9-10900K, 3700 MHz
11414 Points +28%
AMD Ryzen 7 5800X, NVIDIA Titan RTX
R7 5800X, 3800 MHz
11354 Points +27%
Intel Core i9-11900K, NVIDIA Titan RTX
i9-11900K, 3500 MHz
11035 Points +24%
AMD Ryzen 7 3800XT, NVIDIA Titan RTX
R7 3800XT, 3900 MHz
8948 Points 0%
Intel Core i9-11900KB, NVIDIA GeForce RTX 3060
i9-11900KB, 3300 MHz
8924 Points
Intel Core i5-11600K, NVIDIA Titan RTX
i5-11600K, 3900 MHz
8523 Points -4%
Intel Core i9-9980HK, NVIDIA GeForce RTX 2070 (Desktop)
i9-9980HK, 2400 MHz
7568 Points -15%
Intel Core i5-10600K, NVIDIA Titan RTX
i5-10600K, 4100 MHz
7248 Points -19%
Single-Core
Intel Core i9-11900K, NVIDIA Titan RTX
i9-11900K, 3500 MHz
1885 Points +14%
Intel Core i5-11600K, NVIDIA Titan RTX
i5-11600K, 3900 MHz
1752 Points +6%
AMD Ryzen 7 5800X, NVIDIA Titan RTX
R7 5800X, 3800 MHz
1665 Points +1%
Intel Core i9-11900KB, NVIDIA GeForce RTX 3060
i9-11900KB, 3300 MHz
1656 Points
Intel Core i9-10900K, NVIDIA Titan RTX
i9-10900K, 3700 MHz
1449 Points -12%
Intel Core i9-9980HK, NVIDIA GeForce RTX 2070 (Desktop)
i9-9980HK, 2400 MHz
1378 Points -17%
AMD Ryzen 7 3800XT, NVIDIA Titan RTX
R7 3800XT, 3900 MHz
1353 Points -18%
AMD Ryzen 9 3950X, NVIDIA Titan RTX
R9 3950X, 3500 MHz
1306 Points -21%
Intel Core i5-10600K, NVIDIA Titan RTX
i5-10600K, 4100 MHz
1286 Points -22%
Geekbench 5.0
5.0 Multi-Core
AMD Ryzen 9 3950X, NVIDIA Titan RTX
R9 3950X, 3500 MHz
12976 Points +47%
Intel Core i9-10900K, NVIDIA Titan RTX
i9-10900K, 3700 MHz
11407 Points +29%
AMD Ryzen 7 5800X, NVIDIA Titan RTX
R7 5800X, 3800 MHz
11246 Points +27%
Intel Core i9-11900K, NVIDIA Titan RTX
i9-11900K, 3500 MHz
11008 Points +24%
AMD Ryzen 7 3800XT, NVIDIA Titan RTX
R7 3800XT, 3900 MHz
9163 Points +4%
Intel Core i9-11900KB, NVIDIA GeForce RTX 3060
i9-11900KB, 3300 MHz
8845 Points
Intel Core i5-11600K, NVIDIA Titan RTX
i5-11600K, 3900 MHz
8542 Points -3%
Intel Core i9-9980HK, NVIDIA GeForce RTX 2070 (Desktop)
i9-9980HK, 2400 MHz
7540 Points -15%
Intel Core i5-10600K, NVIDIA Titan RTX
i5-10600K, 4100 MHz
7237 Points -18%
5.0 Single-Core
Intel Core i9-11900K, NVIDIA Titan RTX
i9-11900K, 3500 MHz
1863 Points +14%
Intel Core i5-11600K, NVIDIA Titan RTX
i5-11600K, 3900 MHz
1731 Points +6%
AMD Ryzen 7 5800X, NVIDIA Titan RTX
R7 5800X, 3800 MHz
1673 Points +2%
Intel Core i9-11900KB, NVIDIA GeForce RTX 3060
i9-11900KB, 3300 MHz
1638 Points
Intel Core i9-10900K, NVIDIA Titan RTX
i9-10900K, 3700 MHz
1440 Points -12%
AMD Ryzen 7 3800XT, NVIDIA Titan RTX
R7 3800XT, 3900 MHz
1360 Points -17%
Intel Core i9-9980HK, NVIDIA GeForce RTX 2070 (Desktop)
i9-9980HK, 2400 MHz
1355 Points -17%
AMD Ryzen 9 3950X, NVIDIA Titan RTX
R9 3950X, 3500 MHz
1315 Points -20%
Intel Core i5-10600K, NVIDIA Titan RTX
i5-10600K, 4100 MHz
1281 Points -22%
Geekbench 4.4
64 Bit Single-Core Score
Intel Core i9-11900K, NVIDIA Titan RTX
i9-11900K, 3500 MHz
7976 Points +14%
Intel Core i5-11600K, NVIDIA Titan RTX
i5-11600K, 3900 MHz
7438 Points +6%
AMD Ryzen 7 5800X, NVIDIA Titan RTX
R7 5800X, 3800 MHz
7333 Points +5%
Intel Core i9-11900KB, NVIDIA GeForce RTX 3060
i9-11900KB, 3300 MHz
6991 Points
Intel Core i9-10900K, NVIDIA Titan RTX
i9-10900K, 3700 MHz
6348 Points -9%
Intel Core i9-9980HK, NVIDIA GeForce RTX 2070 (Desktop)
i9-9980HK, 2400 MHz
5969 Points -15%
AMD Ryzen 7 3800XT, NVIDIA Titan RTX
R7 3800XT, 3900 MHz
5830 Points -17%
Intel Core i5-10600K, NVIDIA Titan RTX
i5-10600K, 4100 MHz
5821 Points -17%
AMD Ryzen 9 3950X, NVIDIA Titan RTX
R9 3950X, 3500 MHz
5749 Points -18%
64 Bit Multi-Core Score
AMD Ryzen 9 3950X, NVIDIA Titan RTX
R9 3950X, 3500 MHz
48962 Points +35%
AMD Ryzen 7 5800X, NVIDIA Titan RTX
R7 5800X, 3800 MHz
44131 Points +22%
Intel Core i9-10900K, NVIDIA Titan RTX
i9-10900K, 3700 MHz
43058 Points +19%
Intel Core i9-11900K, NVIDIA Titan RTX
i9-11900K, 3500 MHz
42329 Points +17%
Intel Core i9-11900KB, NVIDIA GeForce RTX 3060
i9-11900KB, 3300 MHz
36310 Points
AMD Ryzen 7 3800XT, NVIDIA Titan RTX
R7 3800XT, 3900 MHz
35526 Points -2%
Intel Core i5-11600K, NVIDIA Titan RTX
i5-11600K, 3900 MHz
33266 Points -8%
Intel Core i9-9980HK, NVIDIA GeForce RTX 2070 (Desktop)
i9-9980HK, 2400 MHz
29385 Points -19%
Intel Core i5-10600K, NVIDIA Titan RTX
i5-10600K, 4100 MHz
28391 Points -22%
3DMark 11 - 1280x720 Performance Physics
AMD Ryzen 7 5800X, NVIDIA Titan RTX
R7 5800X, 3800 MHz
23381 Points +31%
Intel Core i9-10900K, NVIDIA Titan RTX
i9-10900K, 3700 MHz
22140 Points +24%
Intel Core i9-11900K, NVIDIA Titan RTX
i9-11900K, 3500 MHz
21175 Points +19%
AMD Ryzen 9 3950X, NVIDIA Titan RTX
R9 3950X, 3500 MHz
21016 Points +18%
AMD Ryzen 7 3800XT, NVIDIA Titan RTX
R7 3800XT, 3900 MHz
18905 Points +6%
Intel Core i9-11900KB, NVIDIA GeForce RTX 3060
i9-11900KB, 3300 MHz
17803 Points
Intel Core i5-11600K, NVIDIA Titan RTX
i5-11600K, 3900 MHz
17381 Points -2%
Intel Core i9-9980HK, NVIDIA GeForce RTX 2070 (Desktop)
i9-9980HK, 2400 MHz
16422 Points -8%
Intel Core i5-10600K, NVIDIA Titan RTX
i5-10600K, 4100 MHz
15961 Points -10%
7-Zip 18.03
7z b 4
AMD Ryzen 9 3950X, NVIDIA Titan RTX
R9 3950X, 3500 MHz
99467 MIPS +98%
AMD Ryzen 7 5800X, NVIDIA Titan RTX
R7 5800X, 3800 MHz
74306 MIPS +48%
Intel Core i9-10900K, NVIDIA Titan RTX
i9-10900K, 3700 MHz
70968 MIPS +42%
Intel Core i9-11900K, NVIDIA Titan RTX
i9-11900K, 3500 MHz
62746 MIPS +25%
AMD Ryzen 7 3800XT, NVIDIA Titan RTX
R7 3800XT, 3900 MHz
59247 MIPS +18%
Intel Core i9-11900KB, NVIDIA GeForce RTX 3060
i9-11900KB, 3300 MHz
50152 MIPS
Intel Core i5-11600K, NVIDIA Titan RTX
i5-11600K, 3900 MHz
45322 MIPS -10%
Intel Core i9-9980HK, NVIDIA GeForce RTX 2070 (Desktop)
i9-9980HK, 2400 MHz
44081 MIPS -12%
Intel Core i5-10600K, NVIDIA Titan RTX
i5-10600K, 4100 MHz
40379 MIPS -19%
7z b 4 -mmt1
AMD Ryzen 7 5800X, NVIDIA Titan RTX
R7 5800X, 3800 MHz
6970 MIPS +17%
Intel Core i9-11900K, NVIDIA Titan RTX
i9-11900K, 3500 MHz
6652 MIPS +11%
Intel Core i5-11600K, NVIDIA Titan RTX
i5-11600K, 3900 MHz
6136 MIPS +3%
Intel Core i9-11900KB, NVIDIA GeForce RTX 3060
i9-11900KB, 3300 MHz
5979 MIPS
Intel Core i9-10900K, NVIDIA Titan RTX
i9-10900K, 3700 MHz
5954 MIPS 0%
Intel Core i9-9980HK, NVIDIA GeForce RTX 2070 (Desktop)
i9-9980HK, 2400 MHz
5642 MIPS -6%
AMD Ryzen 7 3800XT, NVIDIA Titan RTX
R7 3800XT, 3900 MHz
5516 MIPS -8%
AMD Ryzen 9 3950X, NVIDIA Titan RTX
R9 3950X, 3500 MHz
5340 MIPS -11%
Intel Core i5-10600K, NVIDIA Titan RTX
i5-10600K, 4100 MHz
5289 MIPS -12%
HWBOT x265 Benchmark v2.2 - 4k Preset
Intel Core i9-10900K, NVIDIA Titan RTX
i9-10900K, 3700 MHz
21 fps +46%
AMD Ryzen 7 5800X, NVIDIA Titan RTX
R7 5800X, 3800 MHz
20.8 fps +44%
Intel Core i9-11900K, NVIDIA Titan RTX
i9-11900K, 3500 MHz
19.8 fps +38%
AMD Ryzen 7 3800XT, NVIDIA Titan RTX
R7 3800XT, 3900 MHz
16.1 fps +12%
AMD Ryzen 9 3950X, NVIDIA Titan RTX
R9 3950X, 3500 MHz
15.8 fps +10%
Intel Core i5-11600K, NVIDIA Titan RTX
i5-11600K, 3900 MHz
14.7 fps +2%
Intel Core i9-11900KB, NVIDIA GeForce RTX 3060
i9-11900KB, 3300 MHz
14.4 fps
Intel Core i5-10600K, NVIDIA Titan RTX
i5-10600K, 4100 MHz
12.2 fps -15%
Intel Core i9-9980HK, NVIDIA GeForce RTX 2070 (Desktop)
i9-9980HK, 2400 MHz
11.4 fps -21%
R Benchmark 2.5 - Overall mean
Intel Core i5-10600K, NVIDIA Titan RTX
i5-10600K, 4100 MHz
0.593 sec * -11%
Intel Core i9-9980HK, NVIDIA GeForce RTX 2070 (Desktop)
i9-9980HK, 2400 MHz
0.541 sec * -1%
Intel Core i9-11900KB, NVIDIA GeForce RTX 3060
i9-11900KB, 3300 MHz
0.535 sec *
Intel Core i9-10900K, NVIDIA Titan RTX
i9-10900K, 3700 MHz
0.528 sec * +1%
AMD Ryzen 9 3950X, NVIDIA Titan RTX
R9 3950X, 3500 MHz
0.524 sec * +2%
AMD Ryzen 7 3800XT, NVIDIA Titan RTX
R7 3800XT, 3900 MHz
0.512 sec * +4%
Intel Core i5-11600K, NVIDIA Titan RTX
i5-11600K, 3900 MHz
0.506 sec * +5%
Intel Core i9-11900K, NVIDIA Titan RTX
i9-11900K, 3500 MHz
0.4733 sec * +12%
AMD Ryzen 7 5800X, NVIDIA Titan RTX
R7 5800X, 3800 MHz
0.4509 sec * +16%
LibreOffice - 20 Documents To PDF
Intel Core i9-10900K, NVIDIA Titan RTX
i9-10900K, 3700 MHz
76 s * -69%
Intel Core i9-11900K, NVIDIA Titan RTX
i9-11900K, 3500 MHz
72.5 s * -61%
AMD Ryzen 9 3950X, NVIDIA Titan RTX
R9 3950X, 3500 MHz
53.6 s * -19%
Intel Core i5-10600K, NVIDIA Titan RTX
i5-10600K, 4100 MHz
46.06 s * -3%
Intel Core i9-9980HK, NVIDIA GeForce RTX 2070 (Desktop)
i9-9980HK, 2400 MHz
45.23 s * -1%
Intel Core i9-11900KB, NVIDIA GeForce RTX 3060
i9-11900KB, 3300 MHz
44.9 s *
AMD Ryzen 7 3800XT, NVIDIA Titan RTX
R7 3800XT, 3900 MHz
44.78 s * -0%
AMD Ryzen 7 5800X, NVIDIA Titan RTX
R7 5800X, 3800 MHz
43.31 s * +4%
Intel Core i5-11600K, NVIDIA Titan RTX
i5-11600K, 3900 MHz
39.7 s * +12%
WebXPRT 3 - Overall
AMD Ryzen 7 5800X, NVIDIA Titan RTX
R7 5800X, 3800 MHz
296 Points +10%
Intel Core i5-11600K, NVIDIA Titan RTX
i5-11600K, 3900 MHz
280 Points +4%
Intel Core i9-11900KB, NVIDIA GeForce RTX 3060
i9-11900KB, 3300 MHz
269 Points
Intel Core i9-10900K, NVIDIA Titan RTX
i9-10900K, 3700 MHz
255 Points -5%
AMD Ryzen 7 3800XT, NVIDIA Titan RTX
R7 3800XT, 3900 MHz
249 Points -7%
AMD Ryzen 9 3950X, NVIDIA Titan RTX
R9 3950X, 3500 MHz
239 Points -11%
Intel Core i5-10600K, NVIDIA Titan RTX
i5-10600K, 4100 MHz
239 Points -11%
Intel Core i9-9980HK, NVIDIA GeForce RTX 2070 (Desktop)
i9-9980HK, 2400 MHz
233 Points -13%
Intel Core i9-11900K, NVIDIA Titan RTX
i9-11900K, 3500 MHz
217 Points -19%
Mozilla Kraken 1.1 - Total
Intel Core i5-10600K, NVIDIA Titan RTX
i5-10600K, 4100 MHz
760 ms * -26%
Intel Core i9-9980HK, NVIDIA GeForce RTX 2070 (Desktop)
i9-9980HK, 2400 MHz
754 ms * -25%
Intel Core i9-10900K, NVIDIA Titan RTX
i9-10900K, 3700 MHz
709 ms * -18%
AMD Ryzen 9 3950X, NVIDIA Titan RTX
R9 3950X, 3500 MHz
706 ms * -17%
AMD Ryzen 7 3800XT, NVIDIA Titan RTX
R7 3800XT, 3900 MHz
683 ms * -13%
Intel Core i9-11900KB, NVIDIA GeForce RTX 3060
i9-11900KB, 3300 MHz
602 ms *
Intel Core i5-11600K, NVIDIA Titan RTX
i5-11600K, 3900 MHz
587 ms * +2%
AMD Ryzen 7 5800X, NVIDIA Titan RTX
R7 5800X, 3800 MHz
558 ms * +7%
Intel Core i9-11900K, NVIDIA Titan RTX
i9-11900K, 3500 MHz
544 ms * +10%
3DMark
3840x2160 Fire Strike Ultra Physics
AMD Ryzen 9 3950X, NVIDIA Titan RTX
R9 3950X, 3500 MHz
31881 Points +33%
AMD Ryzen 7 5800X, NVIDIA Titan RTX
R7 5800X, 3800 MHz
31095 Points +30%
Intel Core i9-10900K, NVIDIA Titan RTX
i9-10900K, 3700 MHz
29374 Points +23%
Intel Core i9-11900K, NVIDIA Titan RTX
i9-11900K, 3500 MHz
27685 Points +16%
AMD Ryzen 7 3800XT, NVIDIA Titan RTX
R7 3800XT, 3900 MHz
25286 Points +6%
Intel Core i9-11900KB, NVIDIA GeForce RTX 3060
i9-11900KB, 3300 MHz
23921 Points
Intel Core i5-11600K, NVIDIA Titan RTX
i5-11600K, 3900 MHz
23190 Points -3%
Intel Core i9-9980HK, NVIDIA GeForce RTX 2070 (Desktop)
i9-9980HK, 2400 MHz
21864 Points -9%
Intel Core i5-10600K, NVIDIA Titan RTX
i5-10600K, 4100 MHz
19942 Points -17%
1920x1080 Fire Strike Physics
AMD Ryzen 9 3950X, NVIDIA Titan RTX
R9 3950X, 3500 MHz
32004 Points +32%
AMD Ryzen 7 5800X, NVIDIA Titan RTX
R7 5800X, 3800 MHz
30938 Points +27%
Intel Core i9-10900K, NVIDIA Titan RTX
i9-10900K, 3700 MHz
29805 Points +23%
Intel Core i9-11900K, NVIDIA Titan RTX
i9-11900K, 3500 MHz
28927 Points +19%
AMD Ryzen 7 3800XT, NVIDIA Titan RTX
R7 3800XT, 3900 MHz
25132 Points +3%
Intel Core i9-11900KB, NVIDIA GeForce RTX 3060
i9-11900KB, 3300 MHz
24327 Points
Intel Core i5-11600K, NVIDIA Titan RTX
i5-11600K, 3900 MHz
22631 Points -7%
Intel Core i9-9980HK, NVIDIA GeForce RTX 2070 (Desktop)
i9-9980HK, 2400 MHz
21706 Points -11%
Intel Core i5-10600K, NVIDIA Titan RTX
i5-10600K, 4100 MHz
20040 Points -18%
2560x1440 Time Spy CPU
Intel Core i9-10900K, NVIDIA Titan RTX
i9-10900K, 3700 MHz
14326 Points +43%
Intel Core i9-11900K, NVIDIA Titan RTX
i9-11900K, 3500 MHz
13433 Points +34%
AMD Ryzen 9 3950X, NVIDIA Titan RTX
R9 3950X, 3500 MHz
12404 Points +24%
AMD Ryzen 7 5800X, NVIDIA Titan RTX
R7 5800X, 3800 MHz
11599 Points +16%
AMD Ryzen 7 3800XT, NVIDIA Titan RTX
R7 3800XT, 3900 MHz
10302 Points +3%
Intel Core i9-11900KB, NVIDIA GeForce RTX 3060
i9-11900KB, 3300 MHz
10035 Points
Intel Core i5-11600K, NVIDIA Titan RTX
i5-11600K, 3900 MHz
9482 Points -6%
Intel Core i9-9980HK, NVIDIA GeForce RTX 2070 (Desktop)
i9-9980HK, 2400 MHz
9417 Points -6%
Intel Core i5-10600K, NVIDIA Titan RTX
i5-10600K, 4100 MHz
8290 Points -17%

* ... kleinere Werte sind besser

Intel NUC 11 Extreme Kit in der Cinebench-R15-Multi-Schleife

Beim ersten Lasttest mit der Cinebench-R15-Mult-Schleife zeigt sich eine stabile Performance. Mit 1.800 Punkten liefert der Intel Core i9-11900KB eine durchweg hohe Leistung ohne Leistungseinbrüche. Dennoch sst aber ein leichter Performancerückgang nach den ersten zwei Durchläufen zu verzeichnen.

1410.81460.81510.81560.81610.81660.81710.81760.81810.8Tooltip
Intel Beast Canyon NUC Intel Core i9-11900KB, Intel Core i9-11900KB: Ø1800 (1776.75-1859.25)
Intel Ghost Canyon NUC (RTX 2070) Intel Core i9-9980HK, Intel Core i9-9980HK: Ø1463 (1410.79-1593.44)

Anwendungsleistung

Bei den Anwendungsbenchmarks reiht sich der unser Testsample nur sehr knapp vor dem Ghost Canyon NUC ein. Insgesamt kann hier die neuere Hardware nicht für einen Performancegewinn sorgen. Subjektiv beurteilt lässt sich aber sagen, dass sowohl der Ghost Canyon NUC seinerzeit und auch der Beast Canyon NUC ein sehr hohes Arbeitstempo haben, was im Alltag durchaus nützlich sein kann. Lange Wartezeiten gab es nur beim Herunterladen großer Spiele, was aber auf die Bandbreitenbeschränkung des Internet-Providers zurückzuführen ist. Gegen aktuelle Testsysteme schlägt sich unser Testsample ebenfalls recht gut, wie man bei den Ergebnissen des PCMark 10 sehen kann.

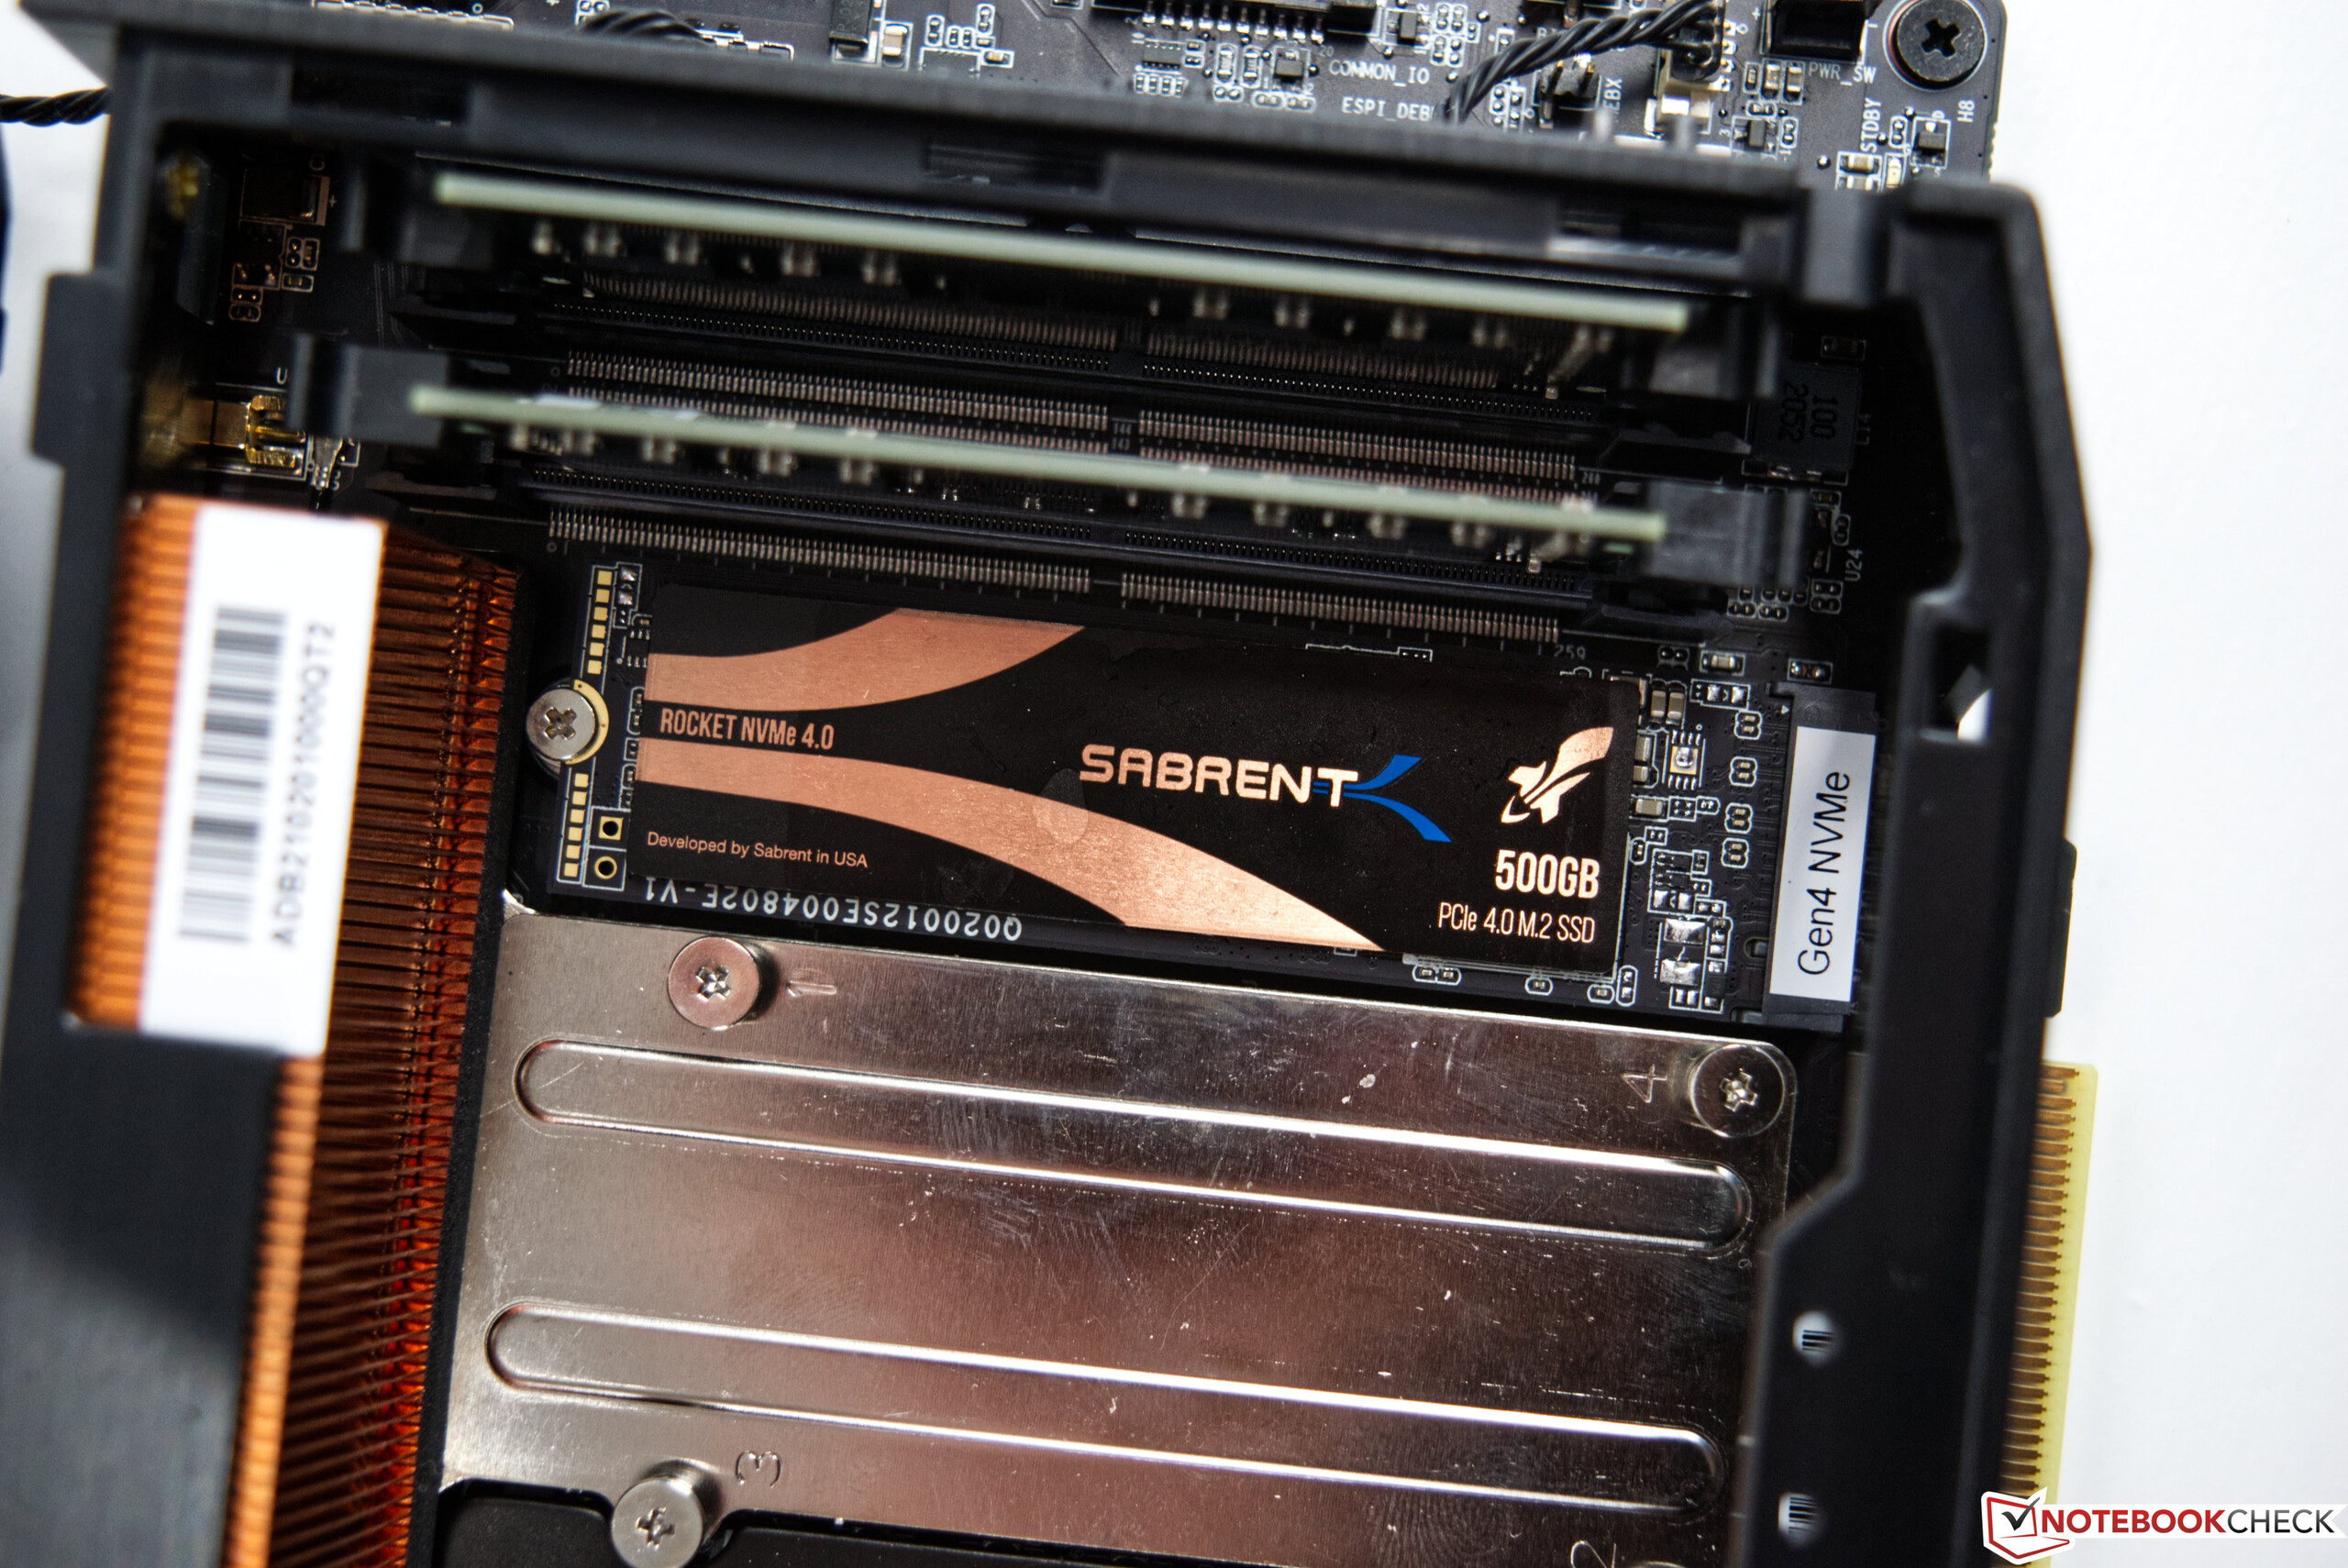
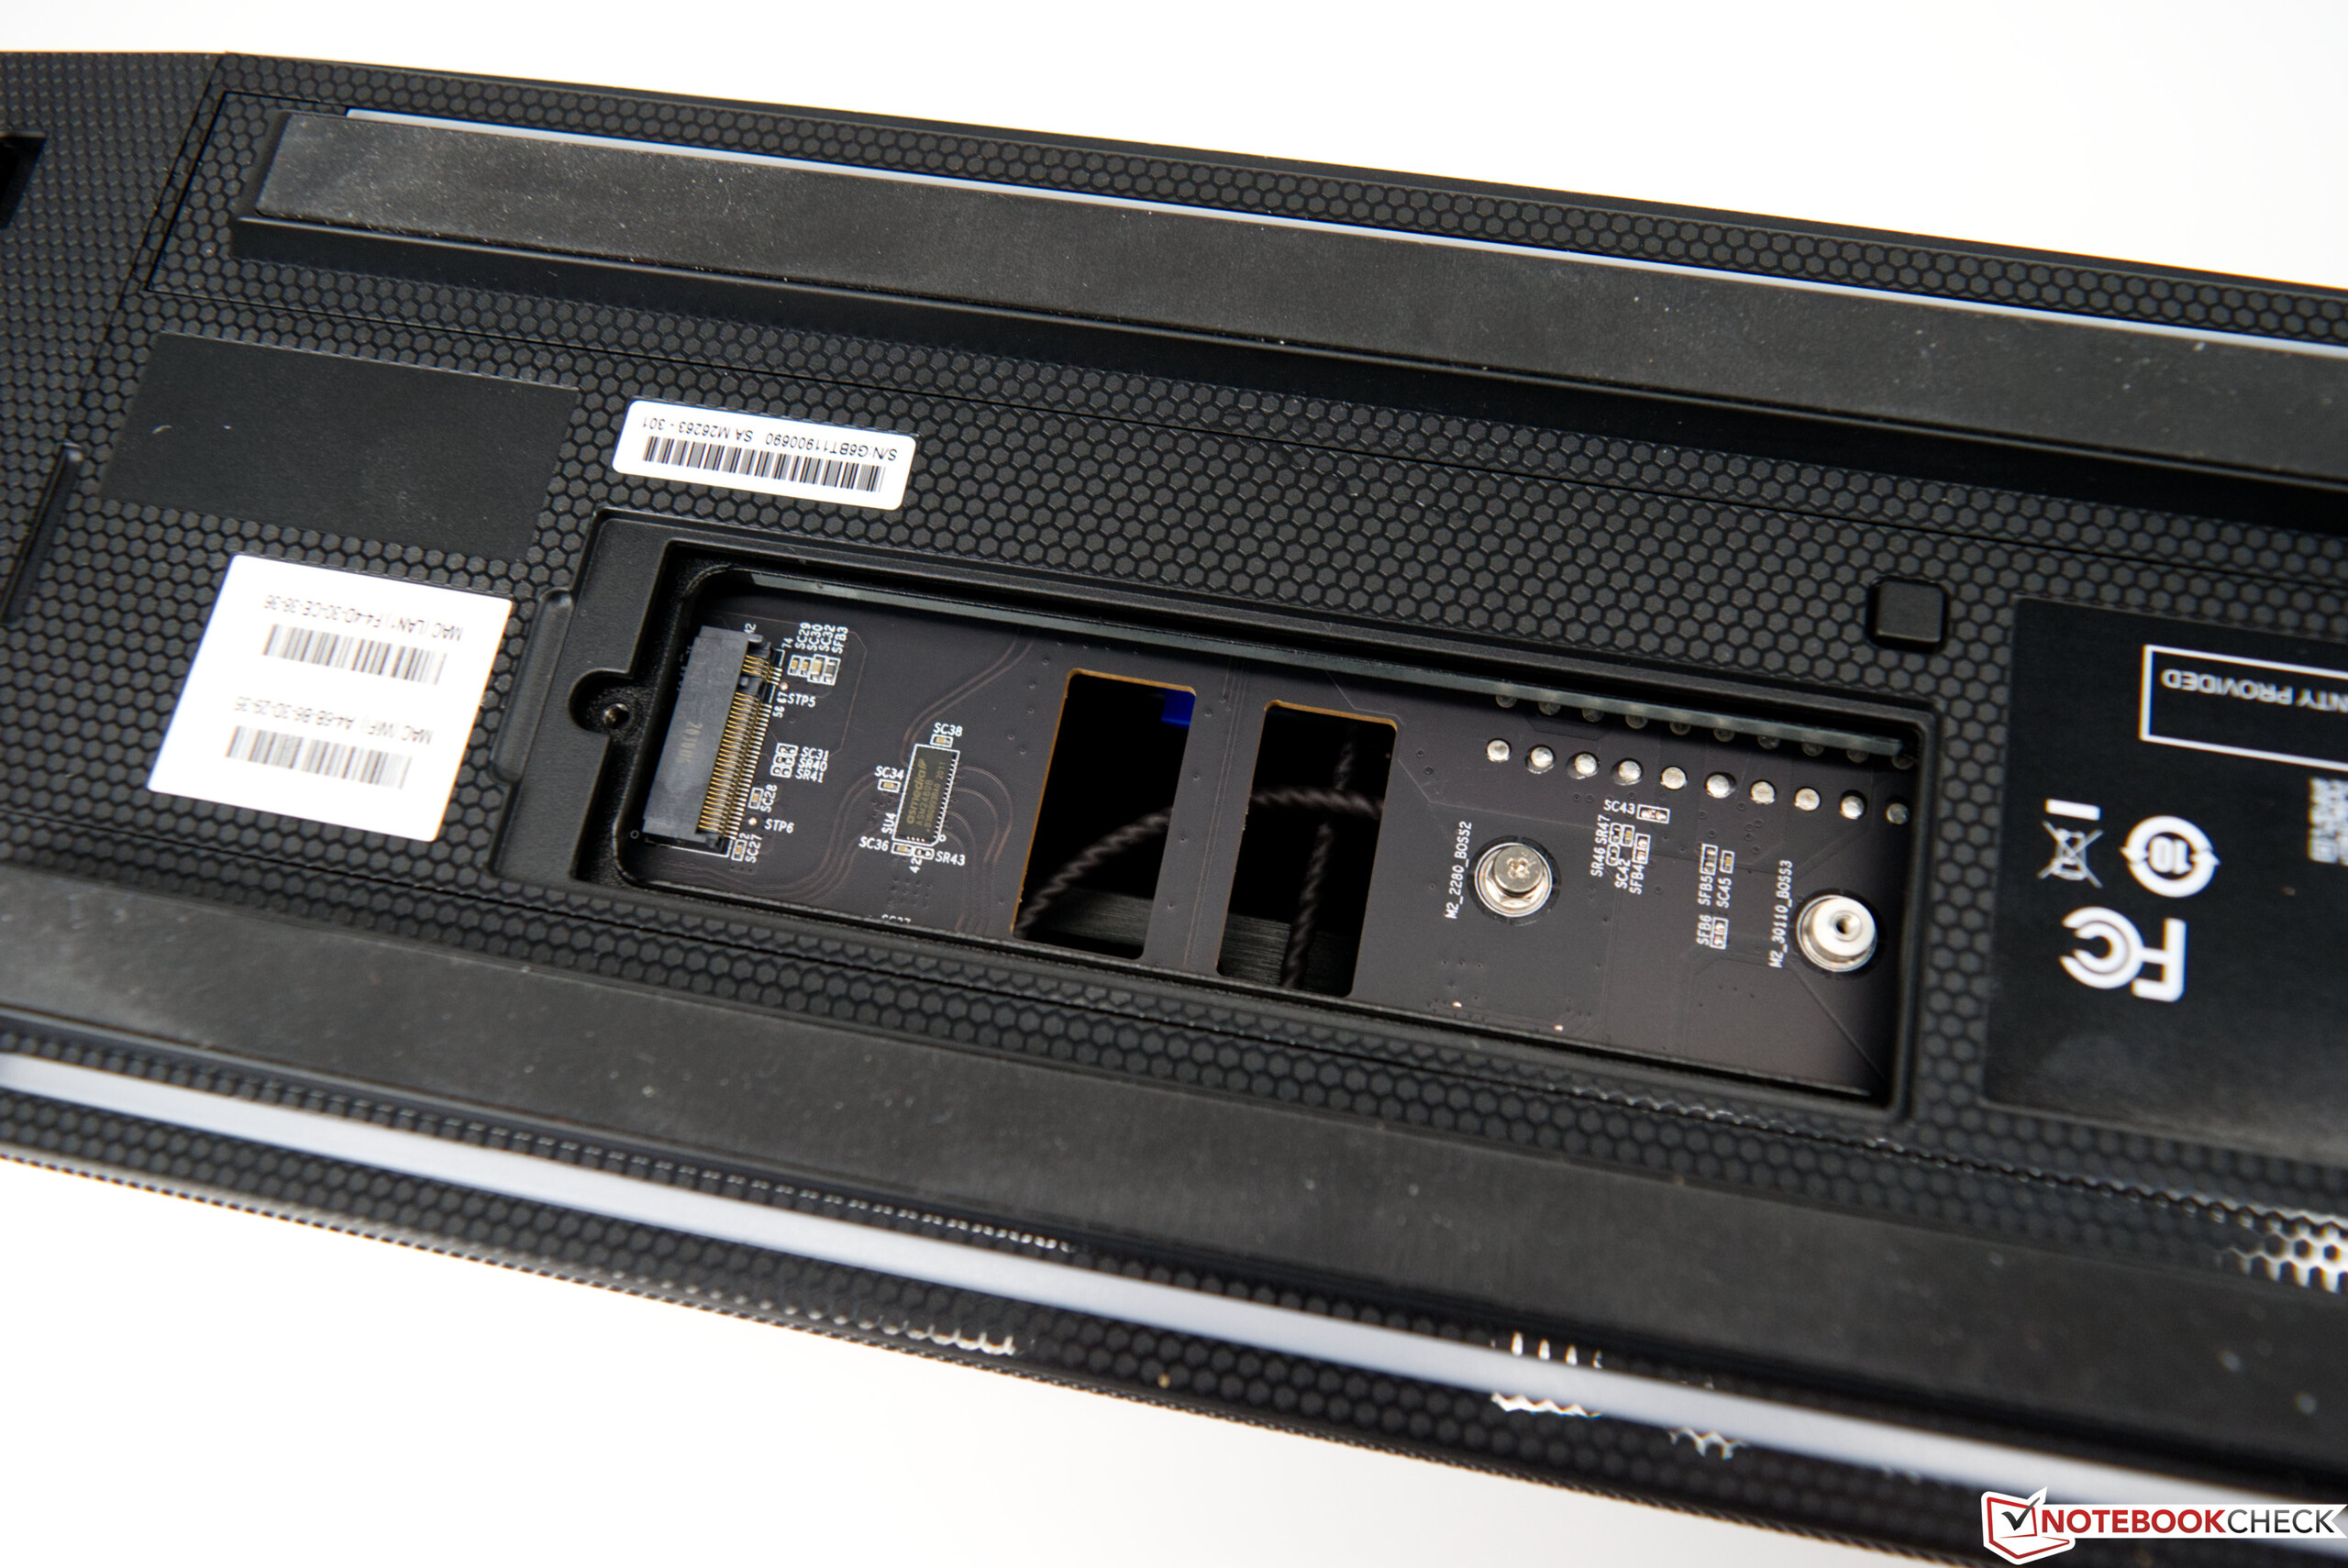
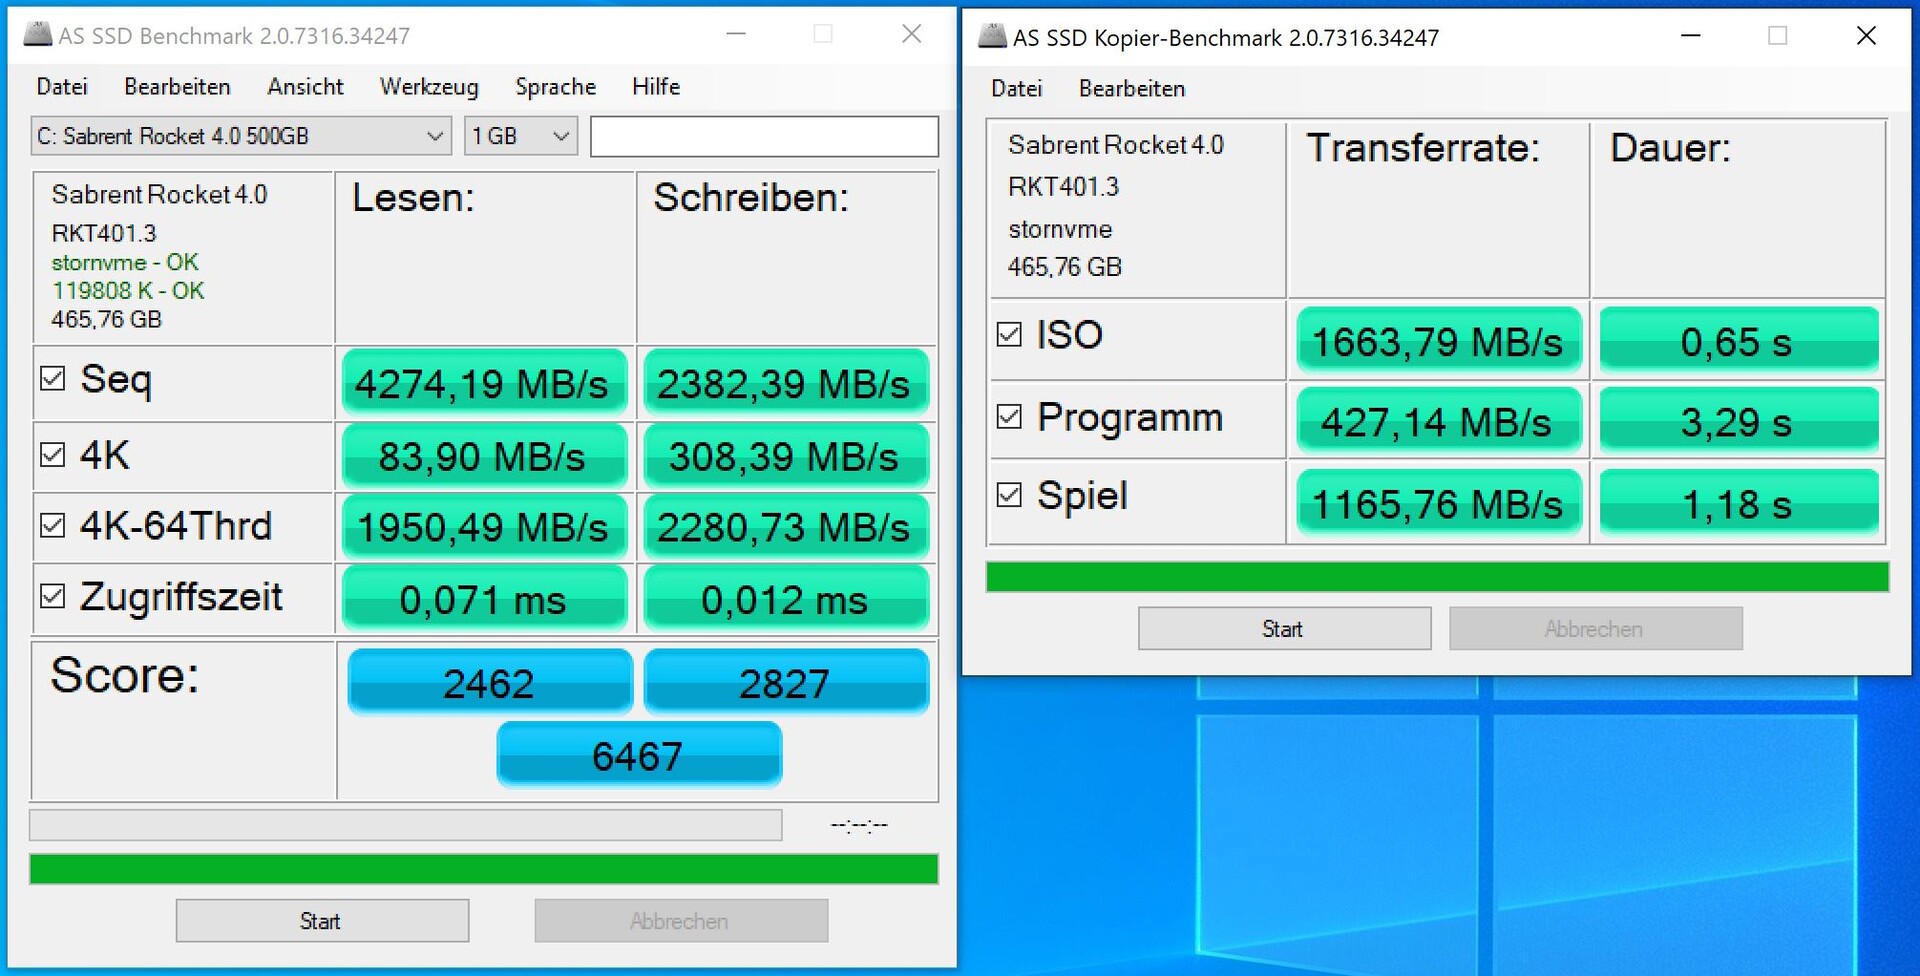
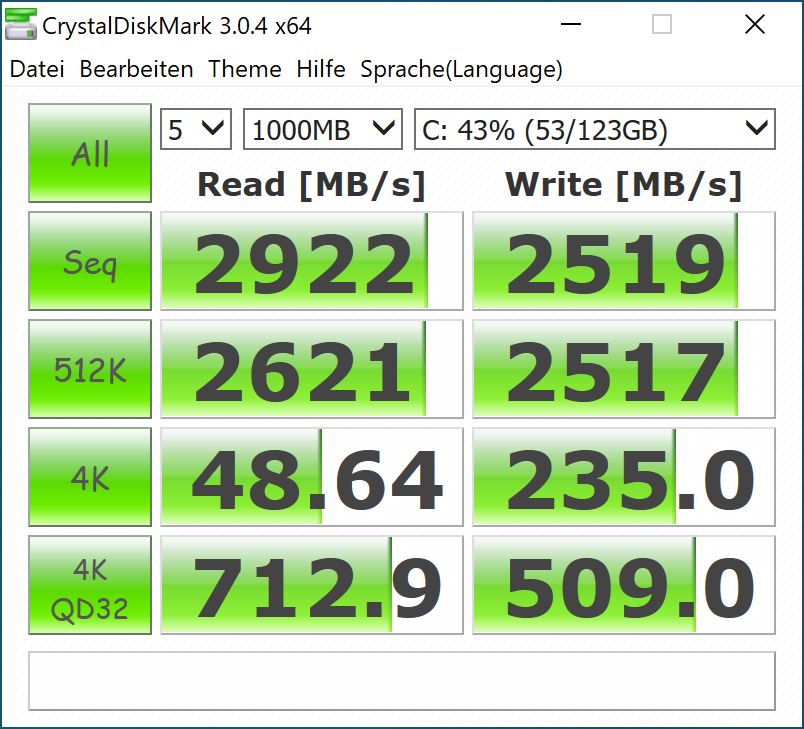
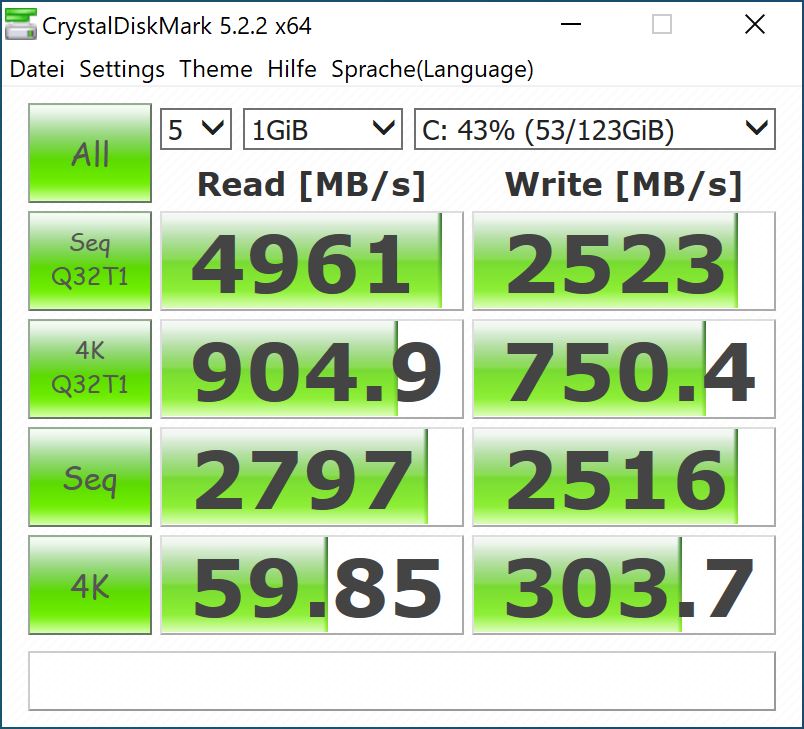
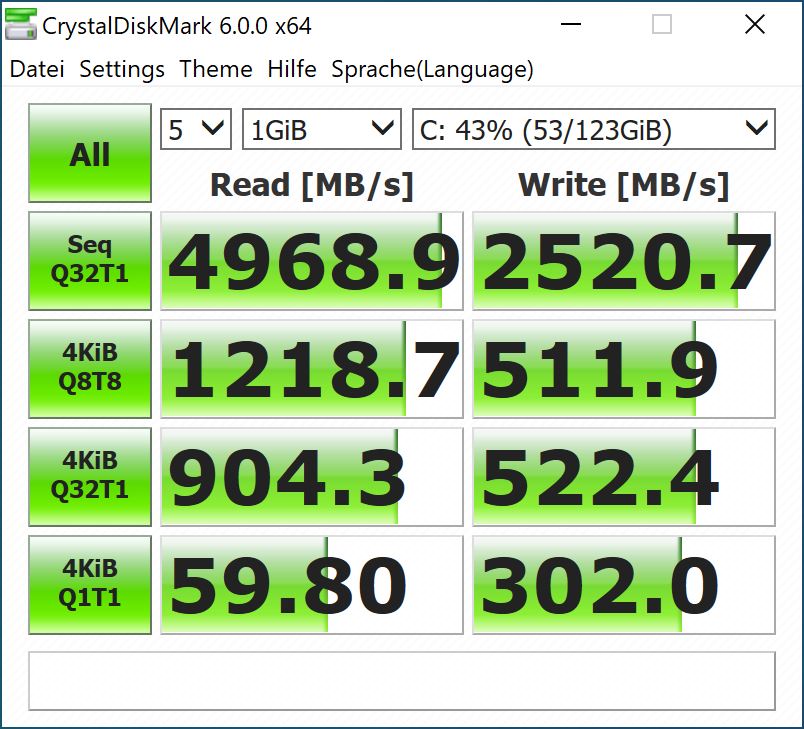
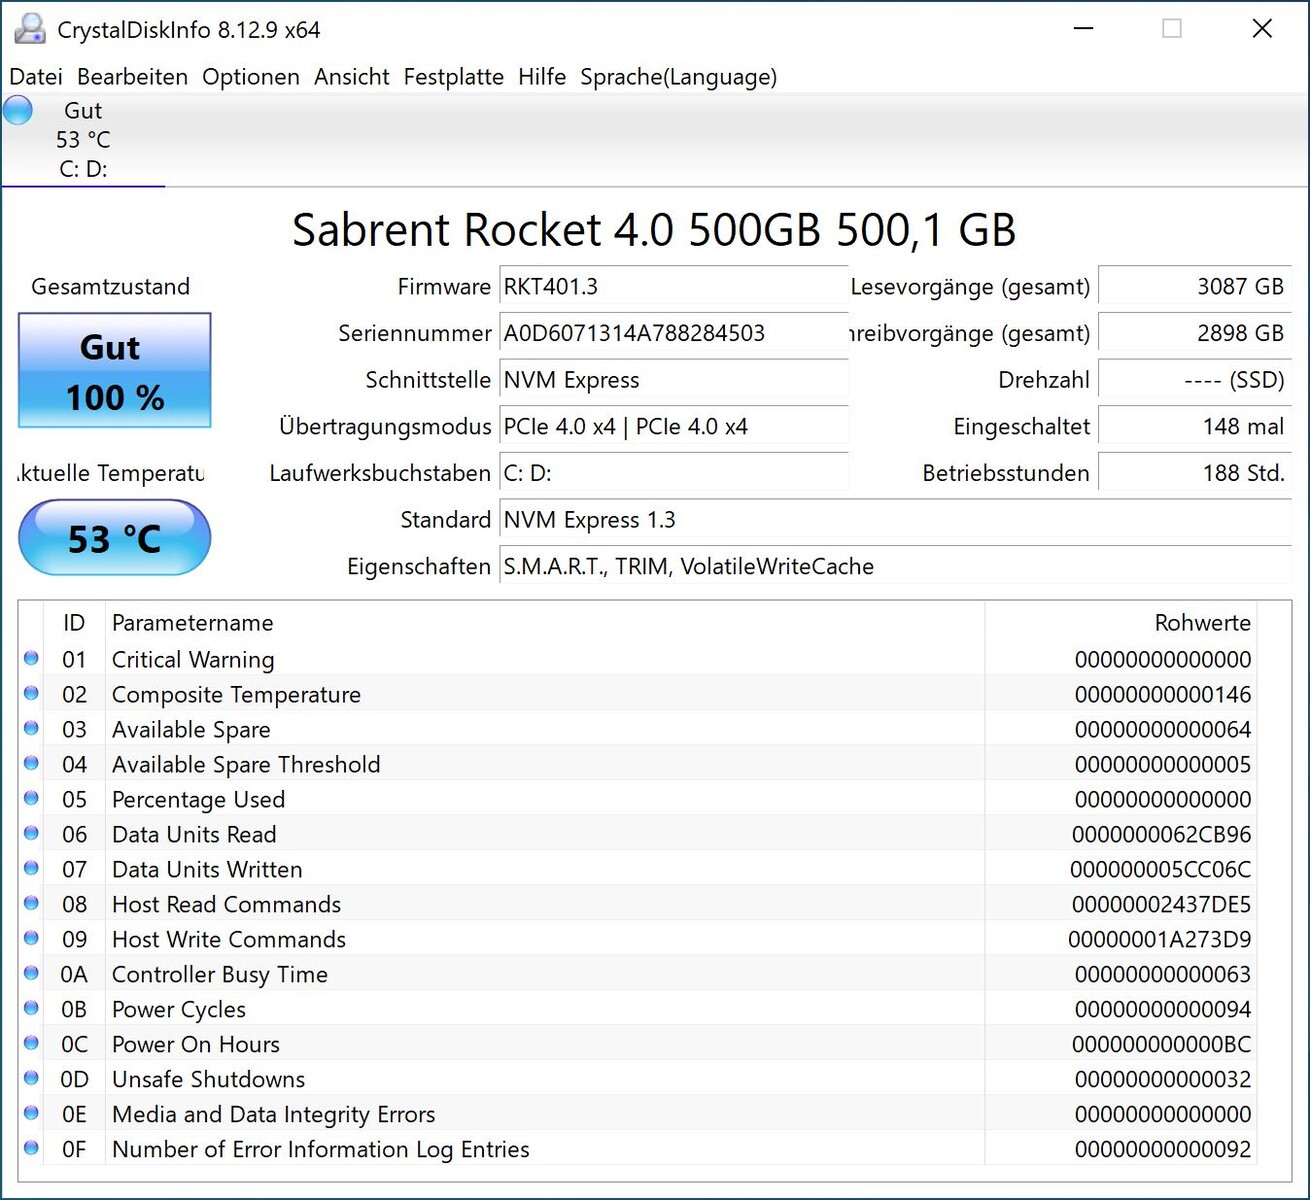
Intel hat uns das Testsample mit einer 500 GB SSD bestückt, die im Test eine sehr gute Leistung abliefert. Aufgrund des Aufbaus ist es nur möglich SSDs in dem Best Canyon NUC zu installieren. Ganze drei M.2-2280 Steckplätze beinhaltet das Compute-Element und ein weiteres Modul kann im Gehäuse auf der Unterseite installiert werden. 

AS SSD
AS SSD
CDM 3
CDM 3
CDM 5
CDM 5
CDM 6
CDM 6
CDI
CDI
Performance Rating - Percent
Intel Core i9-11900K, Intel Core i9-11900K
NVIDIA Titan RTX
98.5 pt
Intel Core i5-11600K, Intel Core i5-11600K
NVIDIA Titan RTX
96.7 pt
Intel Core i9-10900K, Intel Core i9-10900K
NVIDIA Titan RTX
95.1 pt
Intel Core i5-10600K, Intel Core i5-10600K
NVIDIA Titan RTX
92.5 pt
AMD Ryzen 9 3950X, AMD Ryzen 9 3950X
NVIDIA Titan RTX
91.1 pt
Corsair One i160, Intel Core i9-9900K
NVIDIA GeForce RTX 2080 Ti (Desktop)
65.2 pt
Intel Beast Canyon NUC, Intel Core i9-11900KB
NVIDIA GeForce RTX 3060
46.8 pt
Intel Ghost Canyon NUC (RTX 2070), Intel Core i9-9980HK
NVIDIA GeForce RTX 2070 (Desktop)
46.5 pt
PCMark 10 - Score
AMD Ryzen 9 3950X, AMD Ryzen 9 3950X
NVIDIA Titan RTX
7869 Points +8%
Intel Core i9-11900K, Intel Core i9-11900K
NVIDIA Titan RTX
7745 Points +6%
Intel Core i5-11600K, Intel Core i5-11600K
NVIDIA Titan RTX
7740 Points +6%
Intel Core i9-10900K, Intel Core i9-10900K
NVIDIA Titan RTX
7641 Points +5%
Corsair One i160, Intel Core i9-9900K
NVIDIA GeForce RTX 2080 Ti (Desktop)
7329 Points +1%
Intel Beast Canyon NUC, Intel Core i9-11900KB
NVIDIA GeForce RTX 3060
7281 Points
Intel Core i5-10600K, Intel Core i5-10600K
NVIDIA Titan RTX
7279 Points 0%
Intel Ghost Canyon NUC (RTX 2070), Intel Core i9-9980HK
NVIDIA GeForce RTX 2070 (Desktop)
6939 Points -5%
SPECviewperf 12
1900x1060 Solidworks (sw-03)
Intel Core i9-11900K, Intel Core i9-11900K
NVIDIA Titan RTX
182 fps +154%
Intel Core i9-10900K, Intel Core i9-10900K
NVIDIA Titan RTX
172.2 fps +141%
Intel Core i5-11600K, Intel Core i5-11600K
NVIDIA Titan RTX
171 fps +139%
Intel Core i5-10600K, Intel Core i5-10600K
NVIDIA Titan RTX
158.2 fps +121%
AMD Ryzen 9 3950X, AMD Ryzen 9 3950X
NVIDIA Titan RTX
157.6 fps +120%
Corsair One i160, Intel Core i9-9900K
NVIDIA GeForce RTX 2080 Ti (Desktop)
83.7 fps +17%
Intel Beast Canyon NUC, Intel Core i9-11900KB
NVIDIA GeForce RTX 3060
71.6 fps
Intel Ghost Canyon NUC (RTX 2070), Intel Core i9-9980HK
NVIDIA GeForce RTX 2070 (Desktop)
59.2 fps -17%
1900x1060 Siemens NX (snx-02)
Intel Core i9-10900K, Intel Core i9-10900K
NVIDIA Titan RTX
263.3 fps +2909%
Intel Core i5-10600K, Intel Core i5-10600K
NVIDIA Titan RTX
259.1 fps +2861%
AMD Ryzen 9 3950X, AMD Ryzen 9 3950X
NVIDIA Titan RTX
254.8 fps +2812%
Intel Core i5-11600K, Intel Core i5-11600K
NVIDIA Titan RTX
251 fps +2769%
Intel Core i9-11900K, Intel Core i9-11900K
NVIDIA Titan RTX
245 fps +2700%
Corsair One i160, Intel Core i9-9900K
NVIDIA GeForce RTX 2080 Ti (Desktop)
12.72 fps +45%
Intel Ghost Canyon NUC (RTX 2070), Intel Core i9-9980HK
NVIDIA GeForce RTX 2070 (Desktop)
9.08 fps +4%
Intel Beast Canyon NUC, Intel Core i9-11900KB
NVIDIA GeForce RTX 3060
8.75 fps
1900x1060 Showcase (showcase-01)
Intel Core i9-11900K, Intel Core i9-11900K
NVIDIA Titan RTX
203 fps +80%
Intel Core i5-11600K, Intel Core i5-11600K
NVIDIA Titan RTX
202 fps +79%
Intel Core i5-10600K, Intel Core i5-10600K
NVIDIA Titan RTX
196.1 fps +74%
Intel Core i9-10900K, Intel Core i9-10900K
NVIDIA Titan RTX
192.4 fps +70%
AMD Ryzen 9 3950X, AMD Ryzen 9 3950X
NVIDIA Titan RTX
188.3 fps +67%
Corsair One i160, Intel Core i9-9900K
NVIDIA GeForce RTX 2080 Ti (Desktop)
182.3 fps +61%
Intel Ghost Canyon NUC (RTX 2070), Intel Core i9-9980HK
NVIDIA GeForce RTX 2070 (Desktop)
118.5 fps +5%
Intel Beast Canyon NUC, Intel Core i9-11900KB
NVIDIA GeForce RTX 3060
113 fps
1900x1060 Medical (medical-01)
Intel Core i5-10600K, Intel Core i5-10600K
NVIDIA Titan RTX
94.6 fps +131%
Intel Core i9-10900K, Intel Core i9-10900K
NVIDIA Titan RTX
94.5 fps +131%
Intel Core i5-11600K, Intel Core i5-11600K
NVIDIA Titan RTX
88.7 fps +117%
AMD Ryzen 9 3950X, AMD Ryzen 9 3950X
NVIDIA Titan RTX
88.1 fps +115%
Intel Core i9-11900K, Intel Core i9-11900K
NVIDIA Titan RTX
87.8 fps +115%
Corsair One i160, Intel Core i9-9900K
NVIDIA GeForce RTX 2080 Ti (Desktop)
56.6 fps +38%
Intel Beast Canyon NUC, Intel Core i9-11900KB
NVIDIA GeForce RTX 3060
40.9 fps
Intel Ghost Canyon NUC (RTX 2070), Intel Core i9-9980HK
NVIDIA GeForce RTX 2070 (Desktop)
40.14 fps -2%
1900x1060 Maya (maya-04)
Intel Core i9-11900K, Intel Core i9-11900K
NVIDIA Titan RTX
199 fps +4%
Intel Beast Canyon NUC, Intel Core i9-11900KB
NVIDIA GeForce RTX 3060
191 fps
Corsair One i160, Intel Core i9-9900K
NVIDIA GeForce RTX 2080 Ti (Desktop)
190.9 fps 0%
Intel Core i9-10900K, Intel Core i9-10900K
NVIDIA Titan RTX
188.7 fps -1%
Intel Core i5-11600K, Intel Core i5-11600K
NVIDIA Titan RTX
186 fps -3%
AMD Ryzen 9 3950X, AMD Ryzen 9 3950X
NVIDIA Titan RTX
172.2 fps -10%
Intel Ghost Canyon NUC (RTX 2070), Intel Core i9-9980HK
NVIDIA GeForce RTX 2070 (Desktop)
171 fps -10%
Intel Core i5-10600K, Intel Core i5-10600K
NVIDIA Titan RTX
169.4 fps -11%
1900x1060 Energy (energy-01)
Intel Core i5-10600K, Intel Core i5-10600K
NVIDIA Titan RTX
28.77 fps +188%
Intel Core i9-10900K, Intel Core i9-10900K
NVIDIA Titan RTX
28.72 fps +187%
Intel Core i5-11600K, Intel Core i5-11600K
NVIDIA Titan RTX
28.3 fps +183%
Intel Core i9-11900K, Intel Core i9-11900K
NVIDIA Titan RTX
28.2 fps +182%
AMD Ryzen 9 3950X, AMD Ryzen 9 3950X
NVIDIA Titan RTX
28.18 fps +182%
Corsair One i160, Intel Core i9-9900K
NVIDIA GeForce RTX 2080 Ti (Desktop)
16.72 fps +67%
Intel Ghost Canyon NUC (RTX 2070), Intel Core i9-9980HK
NVIDIA GeForce RTX 2070 (Desktop)
11.49 fps +15%
Intel Beast Canyon NUC, Intel Core i9-11900KB
NVIDIA GeForce RTX 3060
10 fps
1900x1060 Creo (creo-01)
Intel Core i9-11900K, Intel Core i9-11900K
NVIDIA Titan RTX
173 fps +250%
Intel Core i5-11600K, Intel Core i5-11600K
NVIDIA Titan RTX
164 fps +232%
Intel Core i9-10900K, Intel Core i9-10900K
NVIDIA Titan RTX
157.2 fps +218%
Intel Core i5-10600K, Intel Core i5-10600K
NVIDIA Titan RTX
142.7 fps +189%
AMD Ryzen 9 3950X, AMD Ryzen 9 3950X
NVIDIA Titan RTX
134.8 fps +173%
Corsair One i160, Intel Core i9-9900K
NVIDIA GeForce RTX 2080 Ti (Desktop)
72.2 fps +46%
Intel Ghost Canyon NUC (RTX 2070), Intel Core i9-9980HK
NVIDIA GeForce RTX 2070 (Desktop)
52.2 fps +6%
Intel Beast Canyon NUC, Intel Core i9-11900KB
NVIDIA GeForce RTX 3060
49.4 fps
1900x1060 Catia (catia-04)
Intel Core i9-11900K, Intel Core i9-11900K
NVIDIA Titan RTX
269 fps +249%
Intel Core i5-11600K, Intel Core i5-11600K
NVIDIA Titan RTX
251 fps +226%
Intel Core i9-10900K, Intel Core i9-10900K
NVIDIA Titan RTX
225.2 fps +192%
AMD Ryzen 9 3950X, AMD Ryzen 9 3950X
NVIDIA Titan RTX
218.4 fps +184%
Intel Core i5-10600K, Intel Core i5-10600K
NVIDIA Titan RTX
215.5 fps +180%
Corsair One i160, Intel Core i9-9900K
NVIDIA GeForce RTX 2080 Ti (Desktop)
120.8 fps +57%
Intel Ghost Canyon NUC (RTX 2070), Intel Core i9-9980HK
NVIDIA GeForce RTX 2070 (Desktop)
78.3 fps +2%
Intel Beast Canyon NUC, Intel Core i9-11900KB
NVIDIA GeForce RTX 3060
77 fps
1900x1060 3ds Max (3dsmax-05)
Intel Core i9-10900K, Intel Core i9-10900K
NVIDIA Titan RTX
297.4 fps +48%
Intel Core i5-10600K, Intel Core i5-10600K
NVIDIA Titan RTX
296.9 fps +48%
Intel Core i9-11900K, Intel Core i9-11900K
NVIDIA Titan RTX
289 fps +44%
Intel Core i5-11600K, Intel Core i5-11600K
NVIDIA Titan RTX
288 fps +43%
AMD Ryzen 9 3950X, AMD Ryzen 9 3950X
NVIDIA Titan RTX
274.5 fps +37%
Corsair One i160, Intel Core i9-9900K
NVIDIA GeForce RTX 2080 Ti (Desktop)
271.8 fps +35%
Intel Beast Canyon NUC, Intel Core i9-11900KB
NVIDIA GeForce RTX 3060
201 fps
Intel Ghost Canyon NUC (RTX 2070), Intel Core i9-9980HK
NVIDIA GeForce RTX 2070 (Desktop)
180.8 fps -10%
SPECviewperf 13
Solidworks (sw-04)
Intel Core i9-11900K, Intel Core i9-11900K
NVIDIA Titan RTX
198 fps +90%
Intel Core i5-11600K, Intel Core i5-11600K
NVIDIA Titan RTX
185 fps +78%
Intel Core i9-10900K, Intel Core i9-10900K
NVIDIA Titan RTX
166.2 fps +60%
Intel Core i5-10600K, Intel Core i5-10600K
NVIDIA Titan RTX
153.9 fps +48%
AMD Ryzen 9 3950X, AMD Ryzen 9 3950X
NVIDIA Titan RTX
153.2 fps +47%
Corsair One i160, Intel Core i9-9900K
NVIDIA GeForce RTX 2080 Ti (Desktop)
116.3 fps +12%
Intel Beast Canyon NUC, Intel Core i9-11900KB
NVIDIA GeForce RTX 3060
104 fps
Intel Ghost Canyon NUC (RTX 2070), Intel Core i9-9980HK
NVIDIA GeForce RTX 2070 (Desktop)
85.4 fps -18%
Siemens NX (snx-03)
Intel Core i9-10900K, Intel Core i9-10900K
NVIDIA Titan RTX
472.9 fps +2893%
Intel Core i5-10600K, Intel Core i5-10600K
NVIDIA Titan RTX
469.1 fps +2869%
AMD Ryzen 9 3950X, AMD Ryzen 9 3950X
NVIDIA Titan RTX
460 fps +2811%
Intel Core i5-11600K, Intel Core i5-11600K
NVIDIA Titan RTX
453 fps +2767%
Intel Core i9-11900K, Intel Core i9-11900K
NVIDIA Titan RTX
450 fps +2748%
Corsair One i160, Intel Core i9-9900K
NVIDIA GeForce RTX 2080 Ti (Desktop)
23.03 fps +46%
Intel Ghost Canyon NUC (RTX 2070), Intel Core i9-9980HK
NVIDIA GeForce RTX 2070 (Desktop)
16.33 fps +3%
Intel Beast Canyon NUC, Intel Core i9-11900KB
NVIDIA GeForce RTX 3060
15.8 fps
Showcase (showcase-02)
Intel Core i5-10600K, Intel Core i5-10600K
NVIDIA Titan RTX
195.1 fps +73%
Intel Core i9-10900K, Intel Core i9-10900K
NVIDIA Titan RTX
194.1 fps +72%
Intel Core i9-11900K, Intel Core i9-11900K
NVIDIA Titan RTX
194 fps +72%
Intel Core i5-11600K, Intel Core i5-11600K
NVIDIA Titan RTX
193 fps +71%
AMD Ryzen 9 3950X, AMD Ryzen 9 3950X
NVIDIA Titan RTX
186.8 fps +65%
Corsair One i160, Intel Core i9-9900K
NVIDIA GeForce RTX 2080 Ti (Desktop)
182.6 fps +62%
Intel Ghost Canyon NUC (RTX 2070), Intel Core i9-9980HK
NVIDIA GeForce RTX 2070 (Desktop)
118.5 fps +5%
Intel Beast Canyon NUC, Intel Core i9-11900KB
NVIDIA GeForce RTX 3060
113 fps
Medical (medical-02)
AMD Ryzen 9 3950X, AMD Ryzen 9 3950X
NVIDIA Titan RTX
90.3 fps +66%
Intel Core i9-11900K, Intel Core i9-11900K
NVIDIA Titan RTX
90 fps +65%
Intel Core i5-11600K, Intel Core i5-11600K
NVIDIA Titan RTX
90 fps +65%
Intel Core i5-10600K, Intel Core i5-10600K
NVIDIA Titan RTX
89.7 fps +65%
Intel Core i9-10900K, Intel Core i9-10900K
NVIDIA Titan RTX
88.7 fps +63%
Corsair One i160, Intel Core i9-9900K
NVIDIA GeForce RTX 2080 Ti (Desktop)
85 fps +56%
Intel Ghost Canyon NUC (RTX 2070), Intel Core i9-9980HK
NVIDIA GeForce RTX 2070 (Desktop)
56.4 fps +4%
Intel Beast Canyon NUC, Intel Core i9-11900KB
NVIDIA GeForce RTX 3060
54.4 fps
Maya (maya-05)
Intel Core i9-11900K, Intel Core i9-11900K
NVIDIA Titan RTX
454 fps +73%
Intel Core i5-11600K, Intel Core i5-11600K
NVIDIA Titan RTX
449 fps +71%
Intel Core i9-10900K, Intel Core i9-10900K
NVIDIA Titan RTX
405.9 fps +55%
Corsair One i160, Intel Core i9-9900K
NVIDIA GeForce RTX 2080 Ti (Desktop)
402 fps +53%
AMD Ryzen 9 3950X, AMD Ryzen 9 3950X
NVIDIA Titan RTX
394.9 fps +51%
Intel Core i5-10600K, Intel Core i5-10600K
NVIDIA Titan RTX
387.5 fps +48%
Intel Ghost Canyon NUC (RTX 2070), Intel Core i9-9980HK
NVIDIA GeForce RTX 2070 (Desktop)
281 fps +7%
Intel Beast Canyon NUC, Intel Core i9-11900KB
NVIDIA GeForce RTX 3060
262 fps
Energy (energy-02)
Intel Core i5-11600K, Intel Core i5-11600K
NVIDIA Titan RTX
53.9 fps +293%
Intel Core i9-11900K, Intel Core i9-11900K
NVIDIA Titan RTX
53.7 fps +292%
Intel Core i5-10600K, Intel Core i5-10600K
NVIDIA Titan RTX
53.3 fps +289%
Intel Core i9-10900K, Intel Core i9-10900K
NVIDIA Titan RTX
53.2 fps +288%
AMD Ryzen 9 3950X, AMD Ryzen 9 3950X
NVIDIA Titan RTX
52.4 fps +282%
Corsair One i160, Intel Core i9-9900K
NVIDIA GeForce RTX 2080 Ti (Desktop)
31.93 fps +133%
Intel Ghost Canyon NUC (RTX 2070), Intel Core i9-9980HK
NVIDIA GeForce RTX 2070 (Desktop)
21.83 fps +59%
Intel Beast Canyon NUC, Intel Core i9-11900KB
NVIDIA GeForce RTX 3060
13.7 fps
Creo (creo-02)
Intel Core i9-11900K, Intel Core i9-11900K
NVIDIA Titan RTX
355 fps +106%
Intel Core i5-11600K, Intel Core i5-11600K
NVIDIA Titan RTX
354 fps +106%
Intel Core i9-10900K, Intel Core i9-10900K
NVIDIA Titan RTX
336.3 fps +96%
Intel Core i5-10600K, Intel Core i5-10600K
NVIDIA Titan RTX
331.7 fps +93%
AMD Ryzen 9 3950X, AMD Ryzen 9 3950X
NVIDIA Titan RTX
328.8 fps +91%
Corsair One i160, Intel Core i9-9900K
NVIDIA GeForce RTX 2080 Ti (Desktop)
286.1 fps +66%
Intel Ghost Canyon NUC (RTX 2070), Intel Core i9-9980HK
NVIDIA GeForce RTX 2070 (Desktop)
183.8 fps +7%
Intel Beast Canyon NUC, Intel Core i9-11900KB
NVIDIA GeForce RTX 3060
172 fps
Catia (catia-05)
Intel Core i9-11900K, Intel Core i9-11900K
NVIDIA Titan RTX
415 fps +299%
Intel Core i5-11600K, Intel Core i5-11600K
NVIDIA Titan RTX
397 fps +282%
Intel Core i9-10900K, Intel Core i9-10900K
NVIDIA Titan RTX
362.1 fps +248%
AMD Ryzen 9 3950X, AMD Ryzen 9 3950X
NVIDIA Titan RTX
355.2 fps +242%
Intel Core i5-10600K, Intel Core i5-10600K
NVIDIA Titan RTX
341.7 fps +229%
Corsair One i160, Intel Core i9-9900K
NVIDIA GeForce RTX 2080 Ti (Desktop)
177.3 fps +70%
Intel Ghost Canyon NUC (RTX 2070), Intel Core i9-9980HK
NVIDIA GeForce RTX 2070 (Desktop)
113.7 fps +9%
Intel Beast Canyon NUC, Intel Core i9-11900KB
NVIDIA GeForce RTX 3060
104 fps
3ds Max (3dsmax-06)
Intel Core i5-10600K, Intel Core i5-10600K
NVIDIA Titan RTX
294.4 fps +46%
Intel Core i9-10900K, Intel Core i9-10900K
NVIDIA Titan RTX
292.5 fps +45%
Intel Core i5-11600K, Intel Core i5-11600K
NVIDIA Titan RTX
288 fps +43%
Intel Core i9-11900K, Intel Core i9-11900K
NVIDIA Titan RTX
287 fps +42%
AMD Ryzen 9 3950X, AMD Ryzen 9 3950X
NVIDIA Titan RTX
274.5 fps +36%
Corsair One i160, Intel Core i9-9900K
NVIDIA GeForce RTX 2080 Ti (Desktop)
265.9 fps +32%
Intel Beast Canyon NUC, Intel Core i9-11900KB
NVIDIA GeForce RTX 3060
202 fps
Intel Ghost Canyon NUC (RTX 2070), Intel Core i9-9980HK
NVIDIA GeForce RTX 2070 (Desktop)
178.6 fps -12%

3D-Leistung und Gaming Performance

Für eine solide Spiele-Leistung steckt in unserem Testsystem eine Nvidia GeForce RTX 3060 aus dem Hause Asus. Da der Beast Canyon NUC ohne dedizierte Grafikkarte verkauft wird kann hier der Anwender selbst bestimmen, was er verbauen möchte. Die integrierte iGPU des Intel Core i9-11900KB ist indes nicht als Gaming-Grafikkarte zu empfehlen. Die hier verbaute GeForce RTX 3060 bietet eine solide Leistung, wenngleich die Leistung überwiegend für 1.080p sowie 1.440p ausreichend ist. Für durchweg flüssiges 4K-Gaming ist die Leistung nicht ganz ausreichend. Gleichwohl gibt es aber ältere Titel, die auch in der hohen Auflösung flüssig dargestellt werden können.

Für weitere Vergleiche und Benchmarks verweisen wir daher auf unsere GPU-Vergleichstabelle.

Wer eine andere Grafikkarte in dem Beast Canyon NUC verbauen möchte, sollte sich vorab über die Abmessungen der GPU genau informieren. Mehr als ein Zwei-Slot-Kühldesign darf die Grafikkarte nicht besitzen und die maximale Länge von 30,5 Zentimetern ist zu beachten.

Performance Rating - Percent
Zotac Magnus One (ECM73070C)
NVIDIA GeForce RTX 3070, i7-10700, Phison 512GB PA6620060U
89.5 pt
Inno3D GeForce RTX 3060 Twin X2
NVIDIA GeForce RTX 3060, R9 5900X, Corsair MP600
87.5 pt
Intel Beast Canyon NUC -2!
NVIDIA GeForce RTX 3060, i9-11900KB, Sabrent Rocket 4.0 500GB
84.9 pt
Intel Ghost Canyon NUC (RTX 2070)
GeForce RTX 2070 (Desktop), i9-9980HK, Kingston KC2500 1 TB SKC2500M81000G
75.5 pt
Borderlands 3
1280x720 Very Low Overall Quality (DX11)
Inno3D GeForce RTX 3060 Twin X2
NVIDIA GeForce RTX 3060, R9 5900X, Corsair MP600
172 fps +10%
Intel Beast Canyon NUC
NVIDIA GeForce RTX 3060, i9-11900KB, Sabrent Rocket 4.0 500GB
156 fps
Intel Ghost Canyon NUC (RTX 2070)
GeForce RTX 2070 (Desktop), i9-9980HK, Kingston KC2500 1 TB SKC2500M81000G
152 fps -3%
Zotac Magnus One (ECM73070C)
NVIDIA GeForce RTX 3070, i7-10700, Phison 512GB PA6620060U
149 fps -4%
1920x1080 Badass Overall Quality (DX11)
Intel Beast Canyon NUC
NVIDIA GeForce RTX 3060, i9-11900KB, Sabrent Rocket 4.0 500GB
100 fps
Zotac Magnus One (ECM73070C)
NVIDIA GeForce RTX 3070, i7-10700, Phison 512GB PA6620060U
98.8 fps -1%
Inno3D GeForce RTX 3060 Twin X2
NVIDIA GeForce RTX 3060, R9 5900X, Corsair MP600
78.5 fps -21%
Intel Ghost Canyon NUC (RTX 2070)
GeForce RTX 2070 (Desktop), i9-9980HK, Kingston KC2500 1 TB SKC2500M81000G
70.9 fps -29%
Metro Exodus
1280x720 Low Quality AF:4x
Inno3D GeForce RTX 3060 Twin X2
NVIDIA GeForce RTX 3060, R9 5900X, Corsair MP600
202 (94.16min - 331.35max) fps +2%
Intel Beast Canyon NUC
NVIDIA GeForce RTX 3060, i9-11900KB, Sabrent Rocket 4.0 500GB
198 (96.07min - 323.73max) fps
Intel Ghost Canyon NUC (RTX 2070)
GeForce RTX 2070 (Desktop), i9-9980HK, Kingston KC2500 1 TB SKC2500M81000G
181 (100.48min - 268.67max) fps -9%
Zotac Magnus One (ECM73070C)
NVIDIA GeForce RTX 3070, i7-10700, Phison 512GB PA6620060U
166 (92.98min - 251.64max) fps -16%
1920x1080 Ultra Quality AF:16x
Zotac Magnus One (ECM73070C)
NVIDIA GeForce RTX 3070, i7-10700, Phison 512GB PA6620060U
93.1 (45.73min - 151.06max) fps +56%
Intel Ghost Canyon NUC (RTX 2070)
GeForce RTX 2070 (Desktop), i9-9980HK, Kingston KC2500 1 TB SKC2500M81000G
60.9 (33.61min - 92.62max) fps +2%
Intel Beast Canyon NUC
NVIDIA GeForce RTX 3060, i9-11900KB, Sabrent Rocket 4.0 500GB
59.8 (30.99min - 119.9max) fps
Inno3D GeForce RTX 3060 Twin X2
NVIDIA GeForce RTX 3060, R9 5900X, Corsair MP600
55.1 (32.45min - 87.42max) fps -8%
Far Cry New Dawn
1280x720 Low Preset
Inno3D GeForce RTX 3060 Twin X2
NVIDIA GeForce RTX 3060, R9 5900X, Corsair MP600
163 (117min - 259max) fps +13%
Intel Beast Canyon NUC
NVIDIA GeForce RTX 3060, i9-11900KB, Sabrent Rocket 4.0 500GB
144 (82min - 218max) fps
Intel Ghost Canyon NUC (RTX 2070)
GeForce RTX 2070 (Desktop), i9-9980HK, Kingston KC2500 1 TB SKC2500M81000G
128 (92min - 190max) fps -11%
Zotac Magnus One (ECM73070C)
NVIDIA GeForce RTX 3070, i7-10700, Phison 512GB PA6620060U
126 (96min - 186max) fps -12%
1920x1080 Ultra Preset
Inno3D GeForce RTX 3060 Twin X2
NVIDIA GeForce RTX 3060, R9 5900X, Corsair MP600
112 (83min - 146max) fps +10%
Intel Beast Canyon NUC
NVIDIA GeForce RTX 3060, i9-11900KB, Sabrent Rocket 4.0 500GB
102 (72min - 145max) fps
Zotac Magnus One (ECM73070C)
NVIDIA GeForce RTX 3070, i7-10700, Phison 512GB PA6620060U
95 (66min - 149max) fps -7%
Intel Ghost Canyon NUC (RTX 2070)
GeForce RTX 2070 (Desktop), i9-9980HK, Kingston KC2500 1 TB SKC2500M81000G
79 (61min - 99max) fps -23%
Far Cry 5
1280x720 Low Preset AA:T
Inno3D GeForce RTX 3060 Twin X2
NVIDIA GeForce RTX 3060, R9 5900X, Corsair MP600
196 (146min - 267max) fps +15%
Intel Beast Canyon NUC
NVIDIA GeForce RTX 3060, i9-11900KB, Sabrent Rocket 4.0 500GB
170 (105min - 231max) fps
Zotac Magnus One (ECM73070C)
NVIDIA GeForce RTX 3070, i7-10700, Phison 512GB PA6620060U
150 (118min - 203max) fps -12%
Intel Ghost Canyon NUC (RTX 2070)
GeForce RTX 2070 (Desktop), i9-9980HK, Kingston KC2500 1 TB SKC2500M81000G
147 (119min - 193max) fps -14%
1920x1080 Ultra Preset AA:T
Inno3D GeForce RTX 3060 Twin X2
NVIDIA GeForce RTX 3060, R9 5900X, Corsair MP600
132 (109min - 150max) fps +8%
Intel Beast Canyon NUC
NVIDIA GeForce RTX 3060, i9-11900KB, Sabrent Rocket 4.0 500GB
122 (93min - 151max) fps
Zotac Magnus One (ECM73070C)
NVIDIA GeForce RTX 3070, i7-10700, Phison 512GB PA6620060U
117 (89min - 155max) fps -4%
Intel Ghost Canyon NUC (RTX 2070)
GeForce RTX 2070 (Desktop), i9-9980HK, Kingston KC2500 1 TB SKC2500M81000G
86 (68min - 111max) fps -30%
X-Plane 11.11
1280x720 low (fps_test=1)
Inno3D GeForce RTX 3060 Twin X2
NVIDIA GeForce RTX 3060, R9 5900X, Corsair MP600
160 fps +6%
Intel Beast Canyon NUC
NVIDIA GeForce RTX 3060, i9-11900KB, Sabrent Rocket 4.0 500GB
151 fps
Intel Ghost Canyon NUC (RTX 2070)
GeForce RTX 2070 (Desktop), i9-9980HK, Kingston KC2500 1 TB SKC2500M81000G
127 fps -16%
Zotac Magnus One (ECM73070C)
NVIDIA GeForce RTX 3070, i7-10700, Phison 512GB PA6620060U
124 fps -18%
1920x1080 high (fps_test=3)
Inno3D GeForce RTX 3060 Twin X2
NVIDIA GeForce RTX 3060, R9 5900X, Corsair MP600
112 fps +7%
Intel Beast Canyon NUC
NVIDIA GeForce RTX 3060, i9-11900KB, Sabrent Rocket 4.0 500GB
105 fps
Intel Ghost Canyon NUC (RTX 2070)
GeForce RTX 2070 (Desktop), i9-9980HK, Kingston KC2500 1 TB SKC2500M81000G
92.7 fps -12%
Zotac Magnus One (ECM73070C)
NVIDIA GeForce RTX 3070, i7-10700, Phison 512GB PA6620060U
91 fps -13%
Final Fantasy XV Benchmark
1280x720 Lite Quality
Inno3D GeForce RTX 3060 Twin X2
NVIDIA GeForce RTX 3060, R9 5900X, Corsair MP600
210 fps +7%
Intel Beast Canyon NUC
NVIDIA GeForce RTX 3060, i9-11900KB, Sabrent Rocket 4.0 500GB
196 fps
Intel Ghost Canyon NUC (RTX 2070)
GeForce RTX 2070 (Desktop), i9-9980HK, Kingston KC2500 1 TB SKC2500M81000G
193 (94min - 237max) fps -2%
Zotac Magnus One (ECM73070C)
NVIDIA GeForce RTX 3070, i7-10700, Phison 512GB PA6620060U
167 fps -15%
1920x1080 High Quality
Zotac Magnus One (ECM73070C)
NVIDIA GeForce RTX 3070, i7-10700, Phison 512GB PA6620060U
112 fps +26%
Intel Ghost Canyon NUC (RTX 2070)
GeForce RTX 2070 (Desktop), i9-9980HK, Kingston KC2500 1 TB SKC2500M81000G
90.6 (56min - 138max) fps +2%
Inno3D GeForce RTX 3060 Twin X2
NVIDIA GeForce RTX 3060, R9 5900X, Corsair MP600
88.6 fps 0%
Intel Beast Canyon NUC
NVIDIA GeForce RTX 3060, i9-11900KB, Sabrent Rocket 4.0 500GB
88.6 fps
Dota 2 Reborn
1280x720 min (0/3) fastest
Inno3D GeForce RTX 3060 Twin X2
NVIDIA GeForce RTX 3060, R9 5900X, Corsair MP600
202.1 (165min) fps +13%
Intel Beast Canyon NUC
NVIDIA GeForce RTX 3060, i9-11900KB, Sabrent Rocket 4.0 500GB
178.3 (153.2min) fps
Zotac Magnus One (ECM73070C)
NVIDIA GeForce RTX 3070, i7-10700, Phison 512GB PA6620060U
164.2 (143.5min) fps -8%
Intel Ghost Canyon NUC (RTX 2070)
GeForce RTX 2070 (Desktop), i9-9980HK, Kingston KC2500 1 TB SKC2500M81000G
155.6 (135.2min) fps -13%
1920x1080 ultra (3/3) best looking
Inno3D GeForce RTX 3060 Twin X2
NVIDIA GeForce RTX 3060, R9 5900X, Corsair MP600
159.7 (126.4min) fps +9%
Intel Beast Canyon NUC
NVIDIA GeForce RTX 3060, i9-11900KB, Sabrent Rocket 4.0 500GB
147.1 (126min) fps
Intel Ghost Canyon NUC (RTX 2070)
GeForce RTX 2070 (Desktop), i9-9980HK, Kingston KC2500 1 TB SKC2500M81000G
130.3 (114.9min) fps -11%
Zotac Magnus One (ECM73070C)
NVIDIA GeForce RTX 3070, i7-10700, Phison 512GB PA6620060U
129.7 (113.4min) fps -12%
The Witcher 3
1024x768 Low Graphics & Postprocessing
Inno3D GeForce RTX 3060 Twin X2
NVIDIA GeForce RTX 3060, R9 5900X, Corsair MP600
433 (59.9min, 150P0.1, 297P1 - 888max) fps
Zotac Magnus One (ECM73070C)
NVIDIA GeForce RTX 3070, i7-10700, Phison 512GB PA6620060U
367 fps
Intel Ghost Canyon NUC (RTX 2070)
GeForce RTX 2070 (Desktop), i9-9980HK, Kingston KC2500 1 TB SKC2500M81000G
286 (243min - 334max) fps
1920x1080 Ultra Graphics & Postprocessing (HBAO+)
Zotac Magnus One (ECM73070C)
NVIDIA GeForce RTX 3070, i7-10700, Phison 512GB PA6620060U
121 fps
Intel Ghost Canyon NUC (RTX 2070)
GeForce RTX 2070 (Desktop), i9-9980HK, Kingston KC2500 1 TB SKC2500M81000G
83.1 (72min - 93max) fps
Inno3D GeForce RTX 3060 Twin X2
NVIDIA GeForce RTX 3060, R9 5900X, Corsair MP600
63.3 (22.3min, 40.7P0.1, 51.3P1 - 358max) fps
3DMark
Fire Strike Extreme Graphics
Zotac Magnus One (ECM73070C)
NVIDIA GeForce RTX 3070, i7-10700, Phison 512GB PA6620060U
15597 Points +53%
Inno3D GeForce RTX 3060 Twin X2
NVIDIA GeForce RTX 3060, R9 5900X, Corsair MP600
10330 Points +1%
Intel Beast Canyon NUC
NVIDIA GeForce RTX 3060, i9-11900KB, Sabrent Rocket 4.0 500GB
10181 Points
Intel Ghost Canyon NUC (RTX 2070)
GeForce RTX 2070 (Desktop), i9-9980HK, Kingston KC2500 1 TB SKC2500M81000G
9979 Points -2%
1920x1080 Fire Strike Graphics
Zotac Magnus One (ECM73070C)
NVIDIA GeForce RTX 3070, i7-10700, Phison 512GB PA6620060U
30090 Points +41%
Inno3D GeForce RTX 3060 Twin X2
NVIDIA GeForce RTX 3060, R9 5900X, Corsair MP600
21847 Points +2%
Intel Beast Canyon NUC
NVIDIA GeForce RTX 3060, i9-11900KB, Sabrent Rocket 4.0 500GB
21379 Points
Intel Ghost Canyon NUC (RTX 2070)
GeForce RTX 2070 (Desktop), i9-9980HK, Kingston KC2500 1 TB SKC2500M81000G
20775 Points -3%
2560x1440 Time Spy Graphics
Zotac Magnus One (ECM73070C)
NVIDIA GeForce RTX 3070, i7-10700, Phison 512GB PA6620060U
12668 Points +49%
Intel Ghost Canyon NUC (RTX 2070)
GeForce RTX 2070 (Desktop), i9-9980HK, Kingston KC2500 1 TB SKC2500M81000G
8631 Points +1%
Inno3D GeForce RTX 3060 Twin X2
NVIDIA GeForce RTX 3060, R9 5900X, Corsair MP600
8559 Points 0%
Intel Beast Canyon NUC
NVIDIA GeForce RTX 3060, i9-11900KB, Sabrent Rocket 4.0 500GB
8525 Points
3DMark 11
1280x720 Performance GPU
Zotac Magnus One (ECM73070C)
NVIDIA GeForce RTX 3070, i7-10700, Phison 512GB PA6620060U
40950 Points +42%
Intel Beast Canyon NUC
NVIDIA GeForce RTX 3060, i9-11900KB, Sabrent Rocket 4.0 500GB
28939 Points
Intel Ghost Canyon NUC (RTX 2070)
GeForce RTX 2070 (Desktop), i9-9980HK, Kingston KC2500 1 TB SKC2500M81000G
28828 Points 0%
Inno3D GeForce RTX 3060 Twin X2
NVIDIA GeForce RTX 3060, R9 5900X, Corsair MP600
28072 Points -3%
1280x720 Performance
Zotac Magnus One (ECM73070C)
NVIDIA GeForce RTX 3070, i7-10700, Phison 512GB PA6620060U
29057 Points +16%
Inno3D GeForce RTX 3060 Twin X2
NVIDIA GeForce RTX 3060, R9 5900X, Corsair MP600
26986 Points +7%
Intel Beast Canyon NUC
NVIDIA GeForce RTX 3060, i9-11900KB, Sabrent Rocket 4.0 500GB
25149 Points
Intel Ghost Canyon NUC (RTX 2070)
GeForce RTX 2070 (Desktop), i9-9980HK, Kingston KC2500 1 TB SKC2500M81000G
24131 Points -4%
min. mittel hoch max.QHD4K
GTA V (2015) 186 181 177 104 81.4 82.3
Dota 2 Reborn (2015) 178.3 161.7 155.6 147.1 116.1
Final Fantasy XV Benchmark (2018) 196 123 88.6 64.8 38
X-Plane 11.11 (2018) 151 133 105 88.5
Far Cry 5 (2018) 170 140 131 122 94 49
Strange Brigade (2018) 491 230 180 154 116 66.8
Far Cry New Dawn (2019) 144 120 115 102 88 50
Metro Exodus (2019) 198 105 77.4 59.8 48.6 31.3
Borderlands 3 (2019) 156 152 133 100 70.2 36.8
F1 2020 (2020) 355 259 208 142 106 60.2
F1 2021 (2021) 419 261 206 96.9 72 40.9
Far Cry 6 (2021) 136 116 103 90.8 68.8 38.8

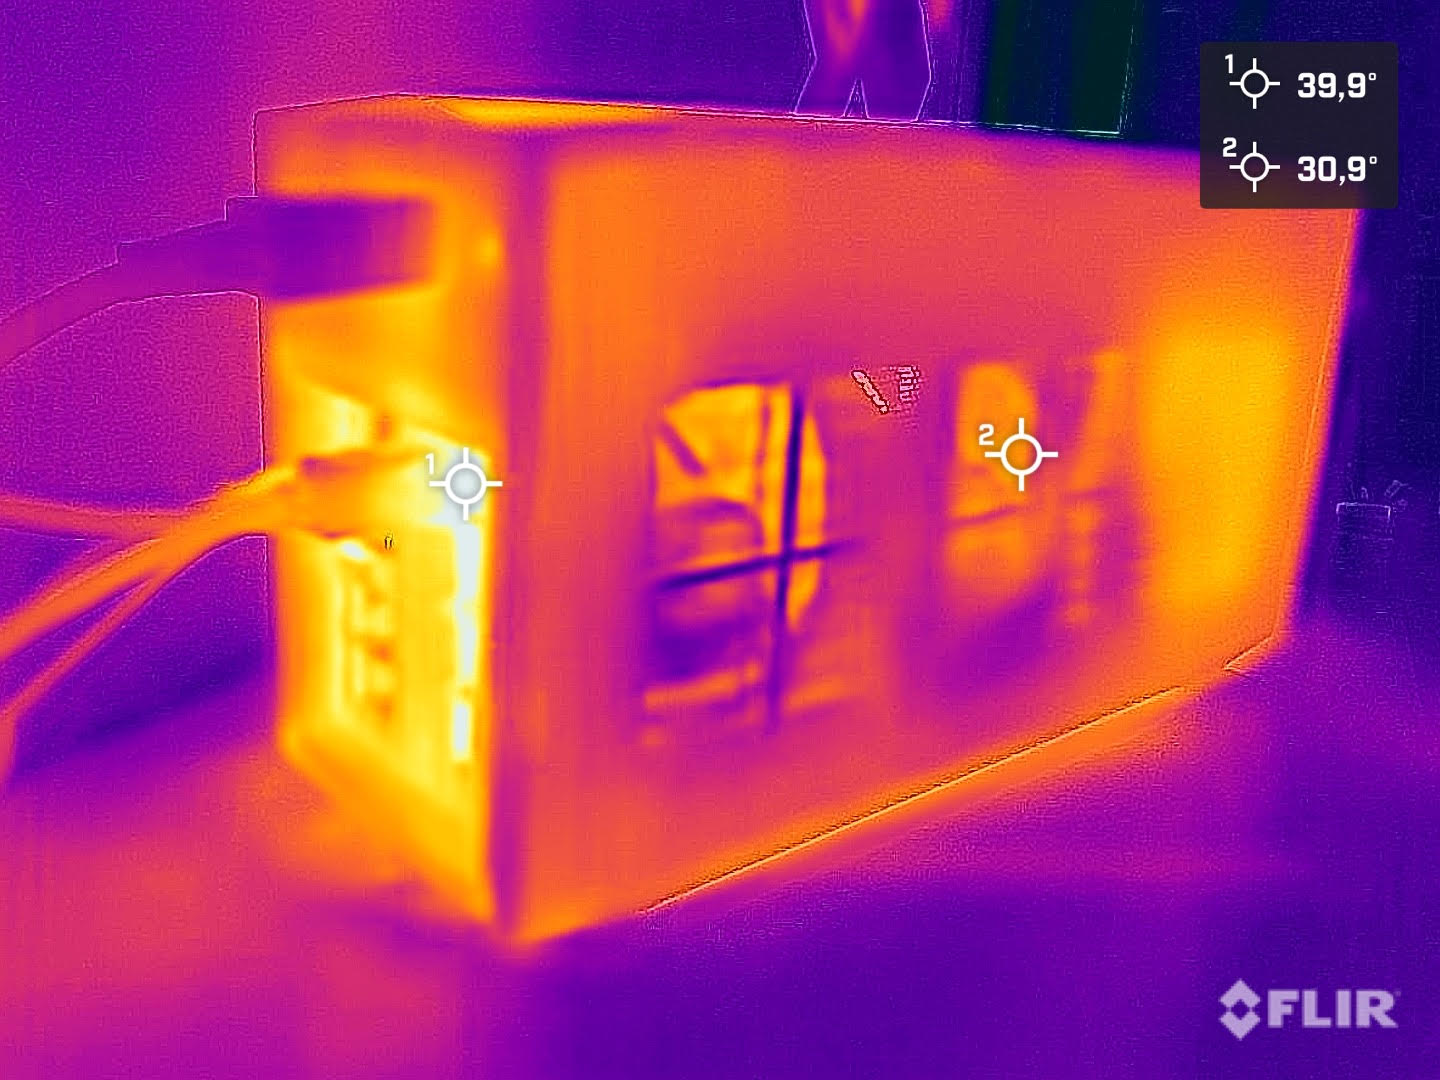
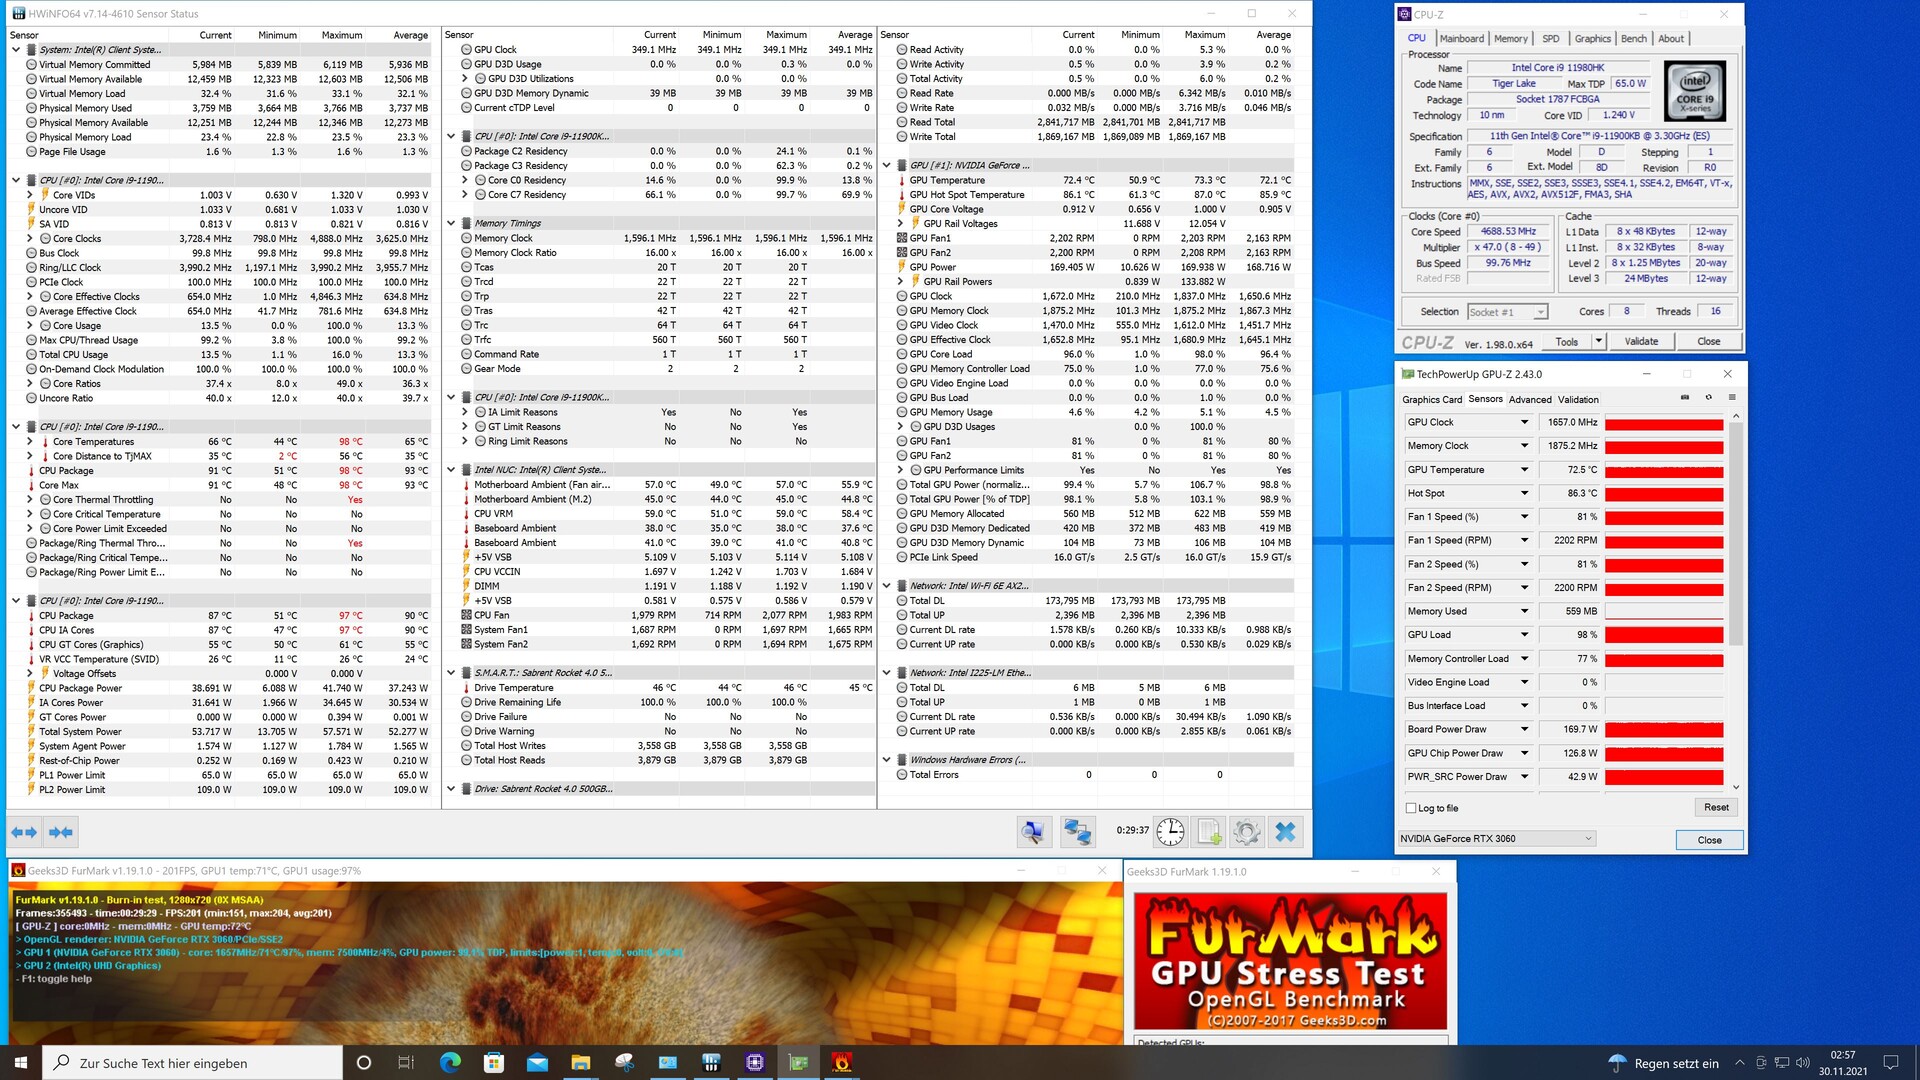
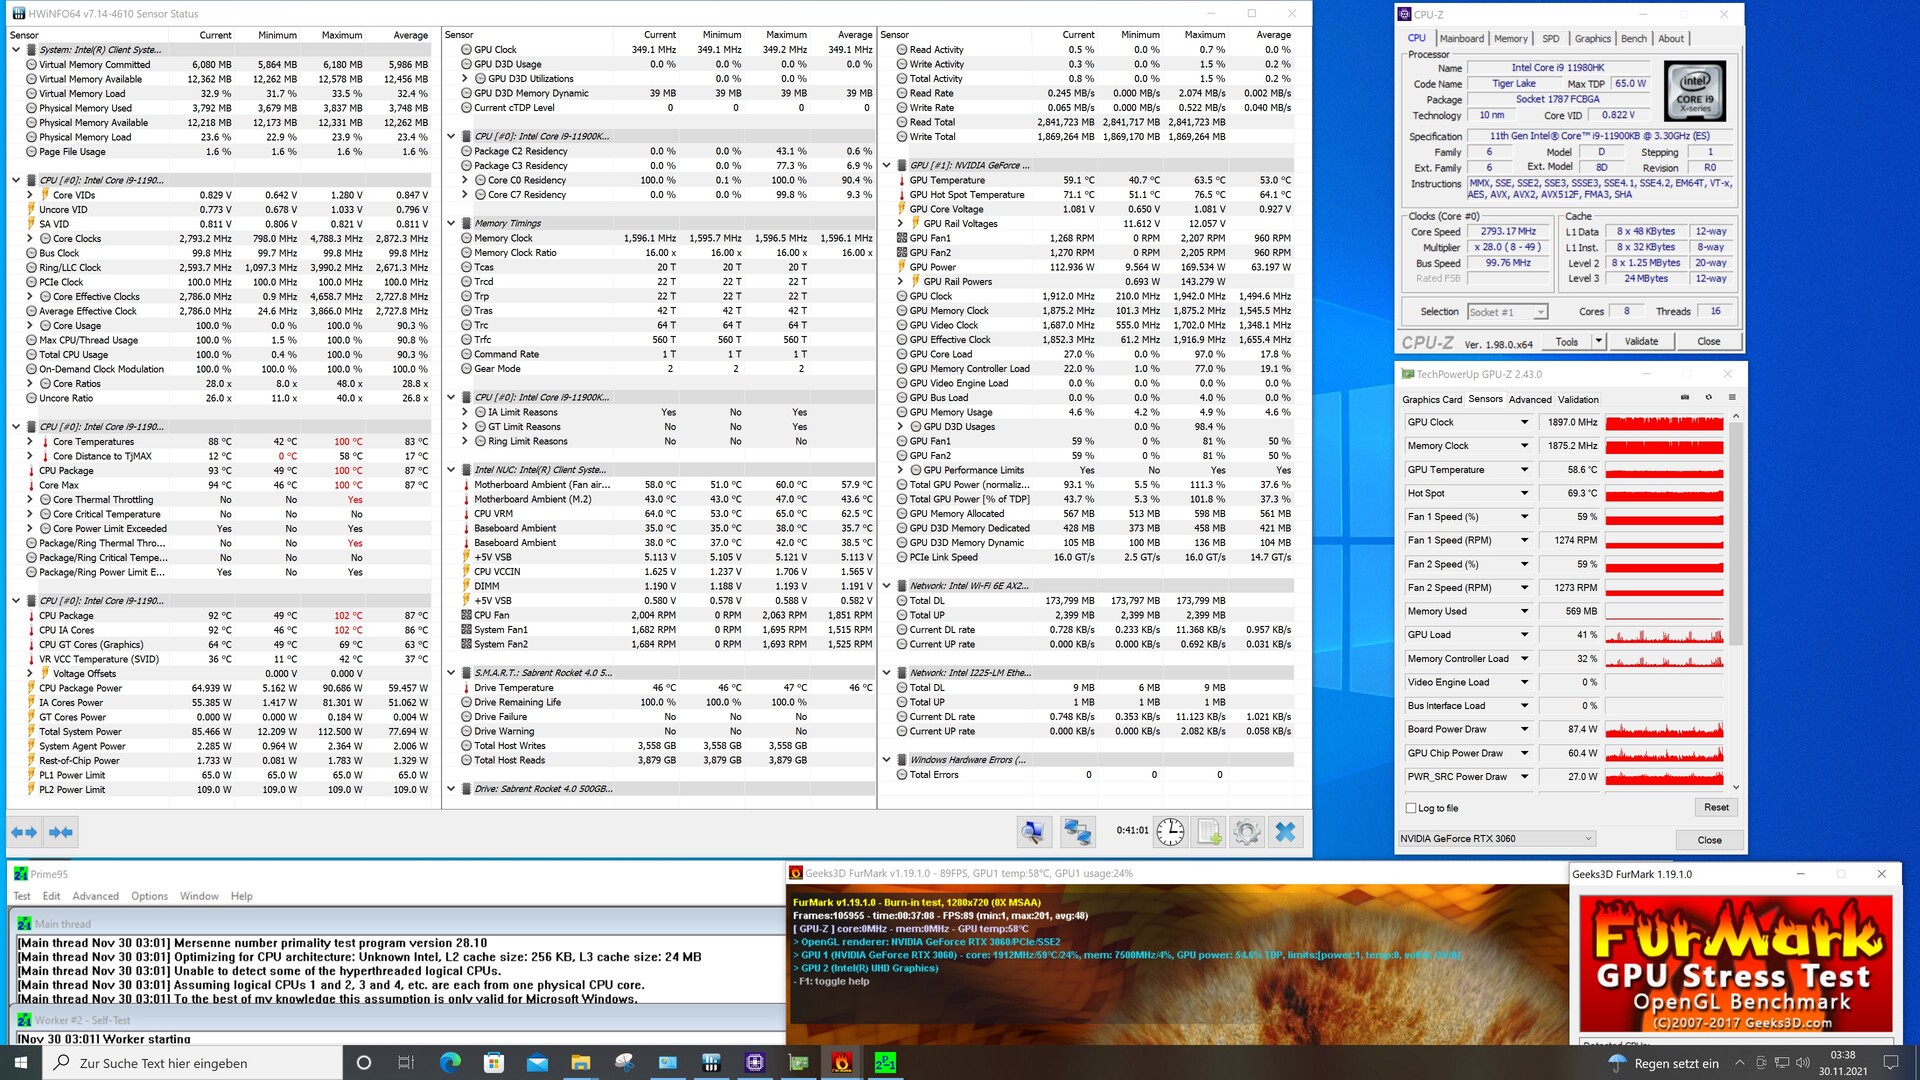
Energieverbrauch und Hitzeentwicklung beim Intel NUC 11 Beast Canyon

Intel NUC 11 Beast Canyon beim Stresstest

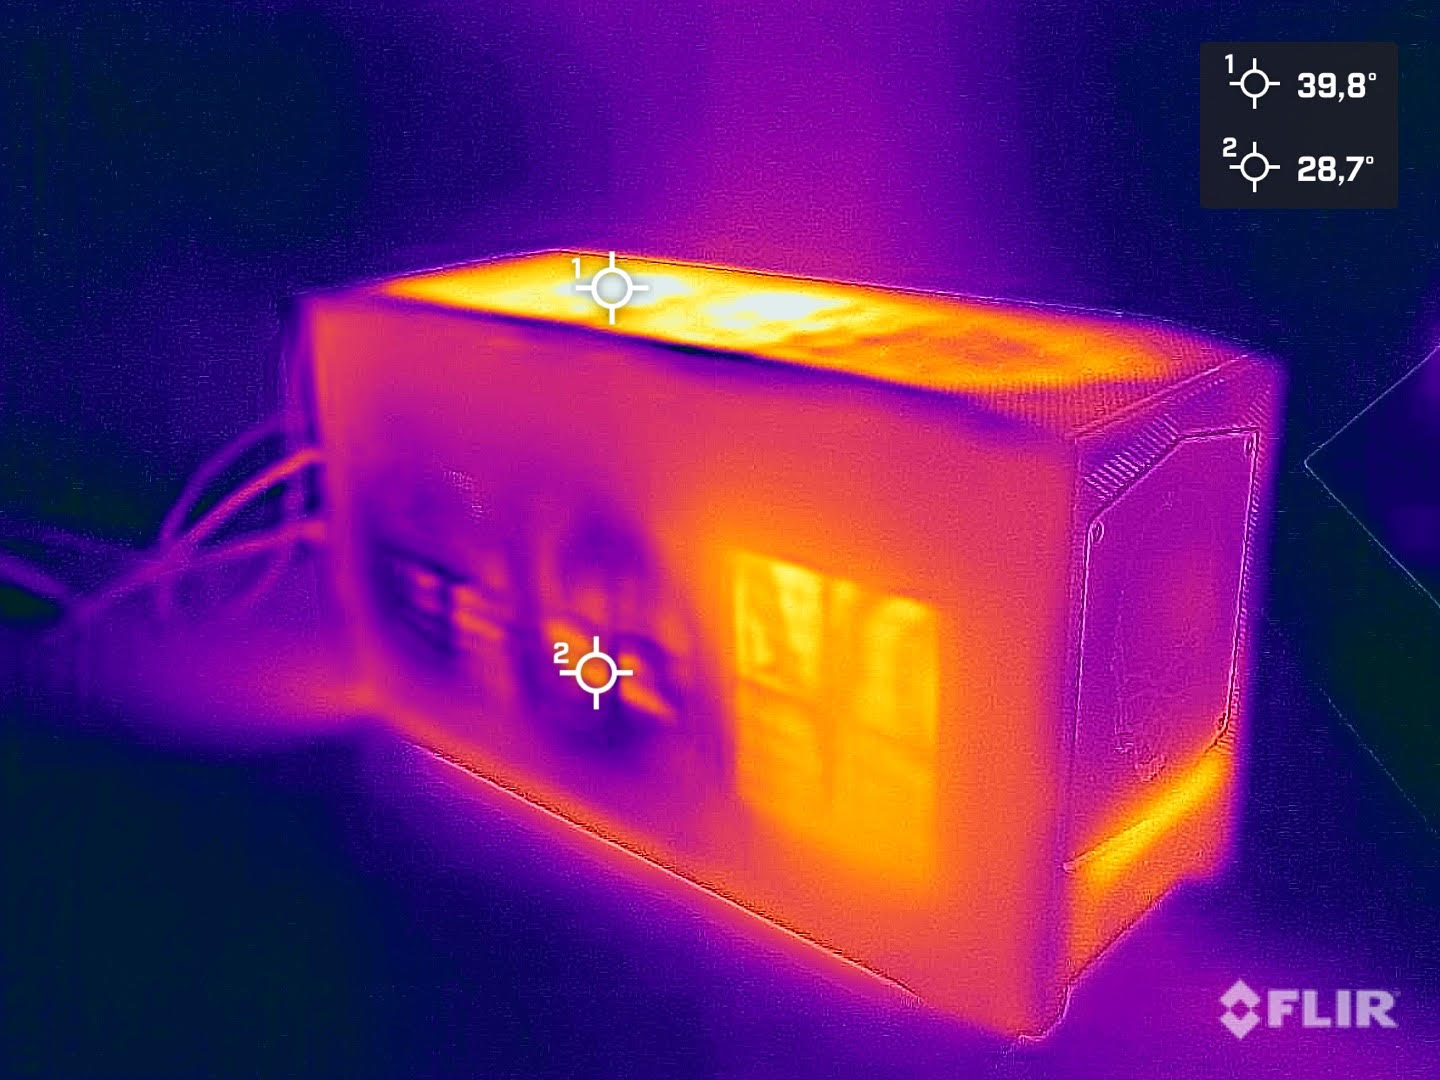
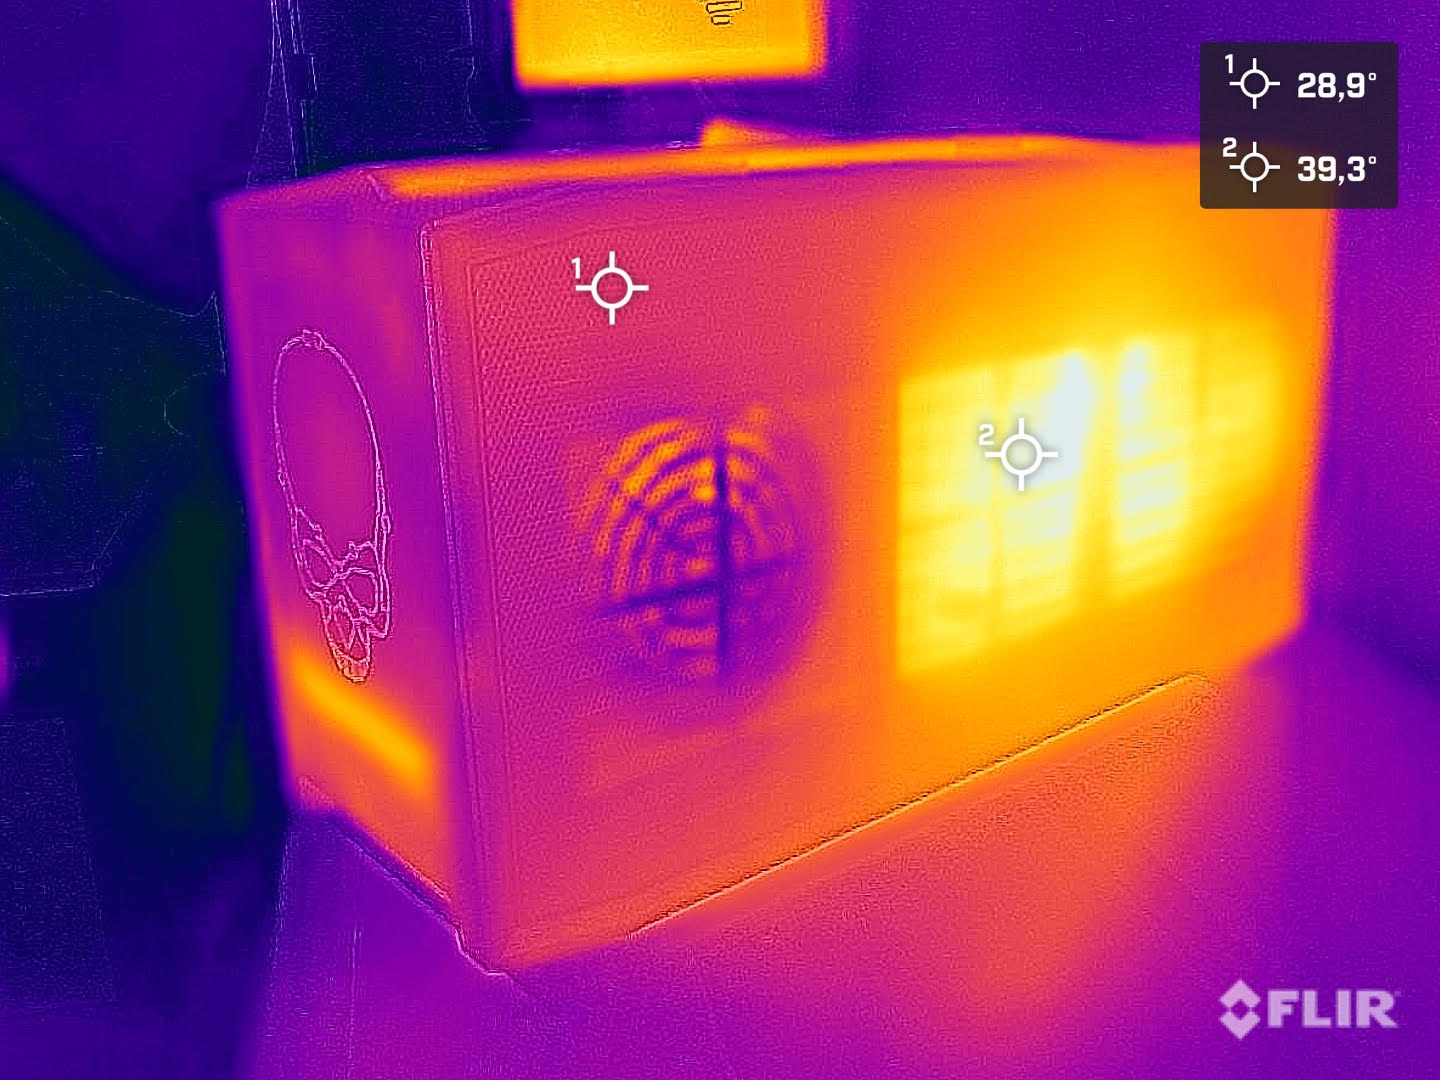
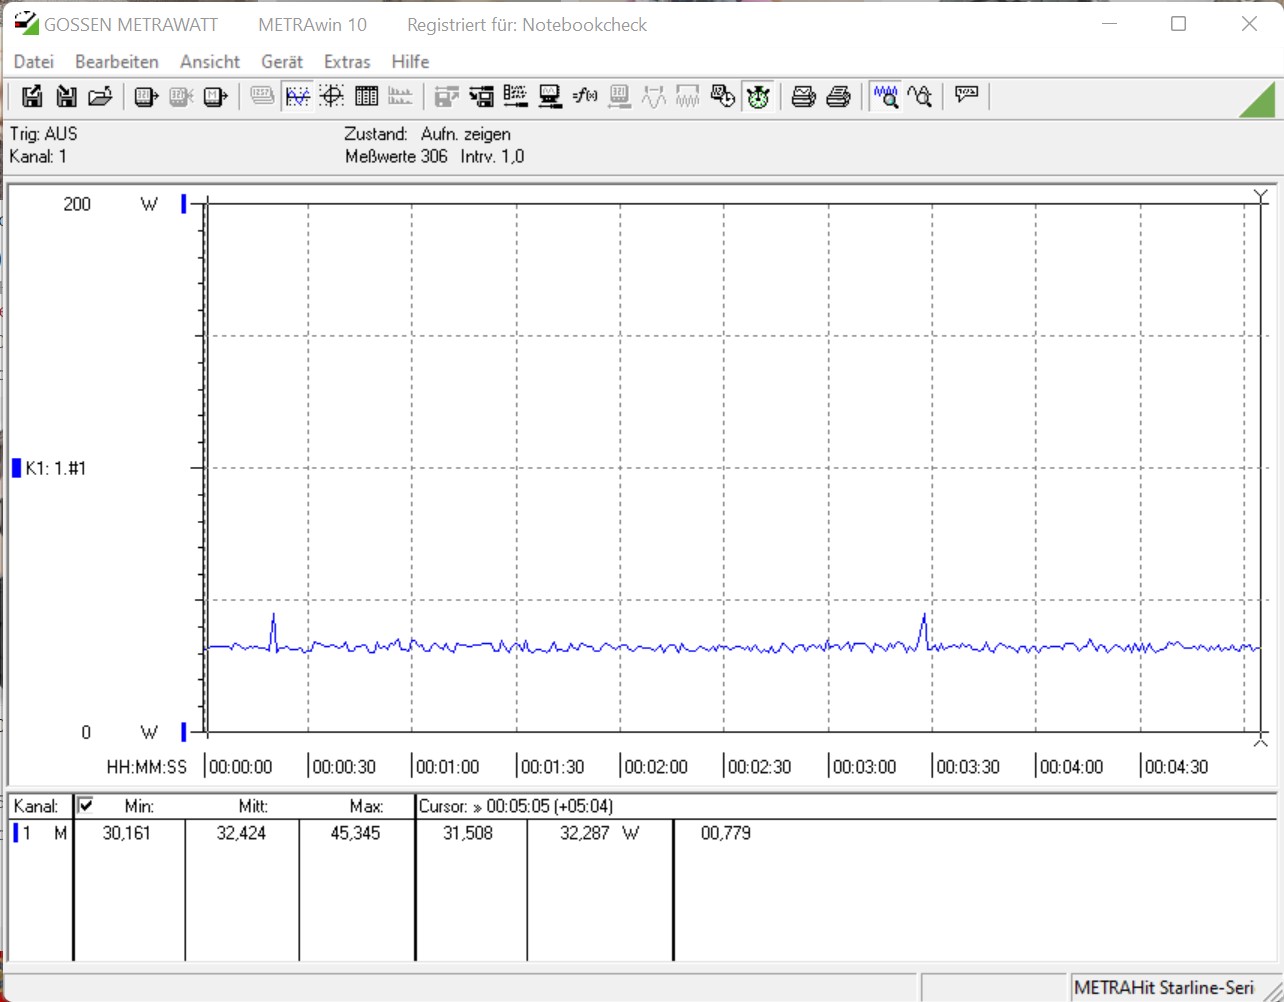
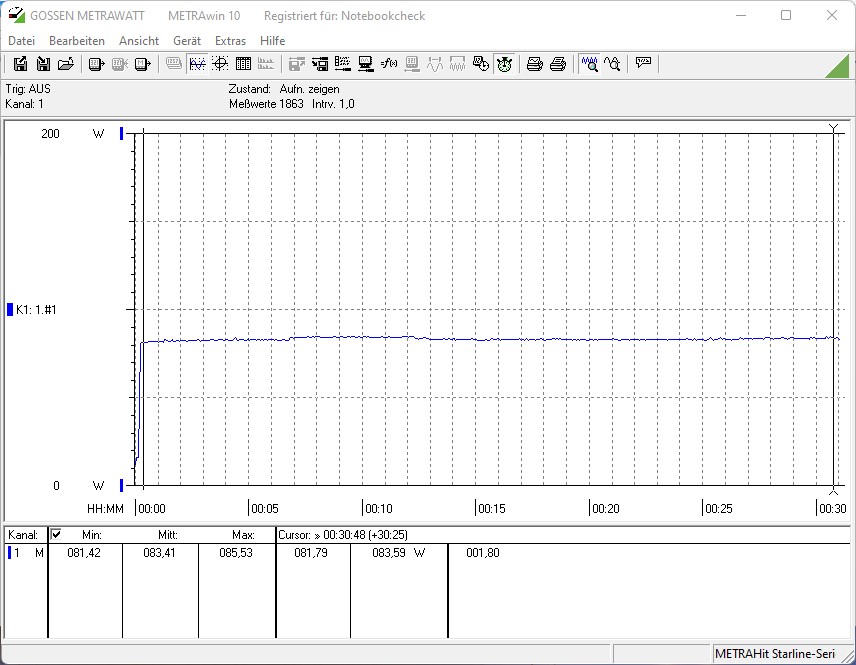
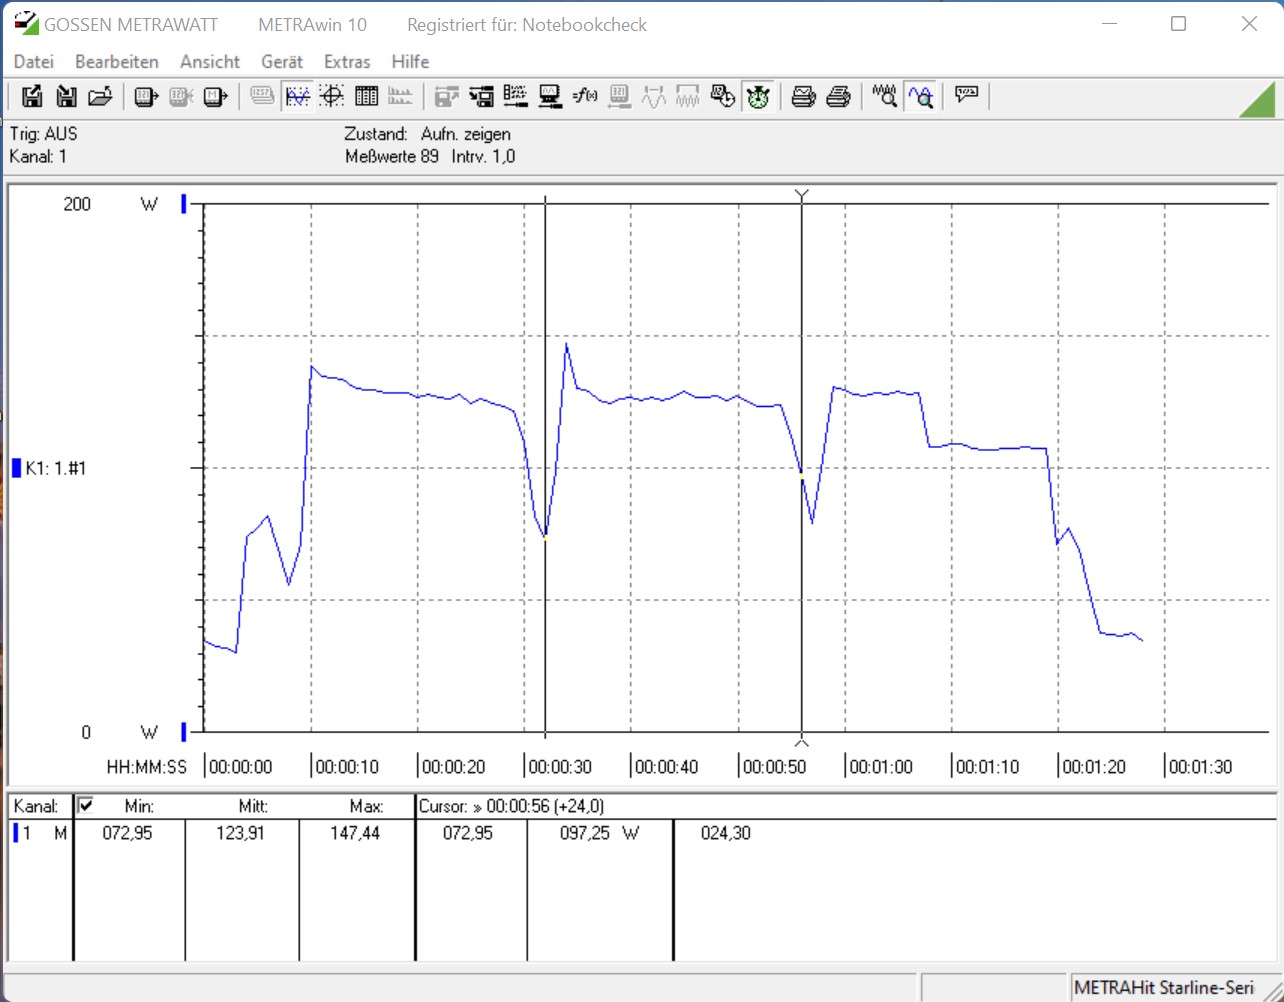
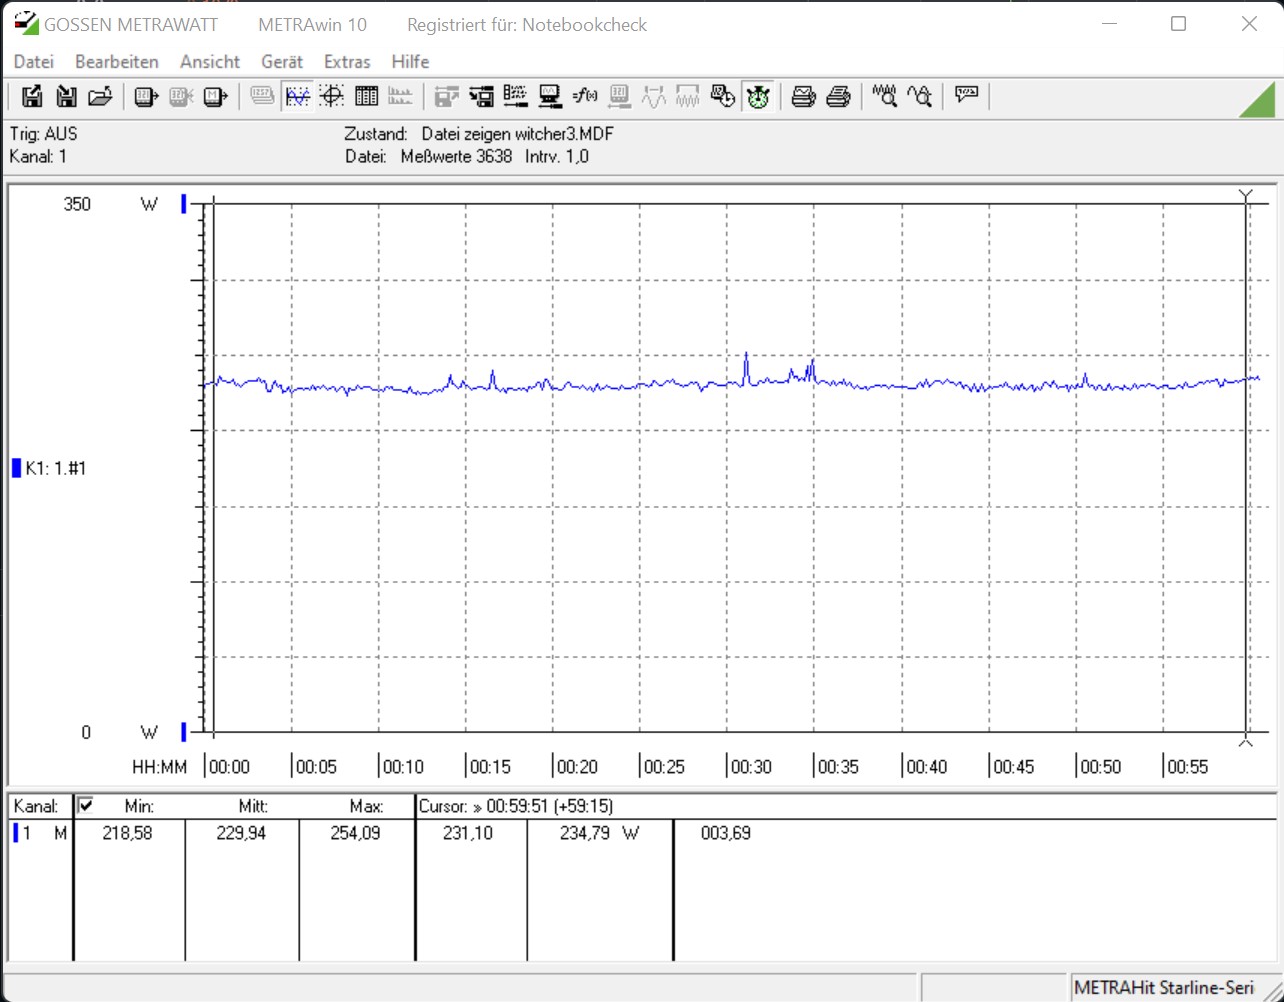
Beim Intel NUC 11 Extreme sorgt der geringe Energieverbrauch für Freude. Aufgrund des sparsamen SoC notieren wir unter Last beim Cinebench R15 Multi Test nur 124 Watt für das System. Das Desktop-System auf Basis eines Intel Core i5-10600K benötigt durchschnittlich 172,5 Watt. Noch einmal fast 100 Watt gönnte sich das Testsystem mit dem Intel Core i9-10900K. Beim Stresstest ist der Intel Core i9-11900KB im Vergleich zu dem Intel Core i9-9980HK etwas hungriger. Gleichwohl ist der Mehrbedarf mit nur drei Prozent überschaubar und unterm Strich mit 113 Watt ebenfalls recht gut. Beim Spielen bestimmt die verbaute Grafikkarte maßgeblich den Energiebedarf des Systems. Den Vergleich mit dem Ghost Canyon NUC gewinnt der Beast Canyon NUC knapp, obwohl die TDP der GeForce RTX 3060 mit 170 Watt deutlich geringer ist als bei der GeForce RTX 2070 Super (215 Watt).

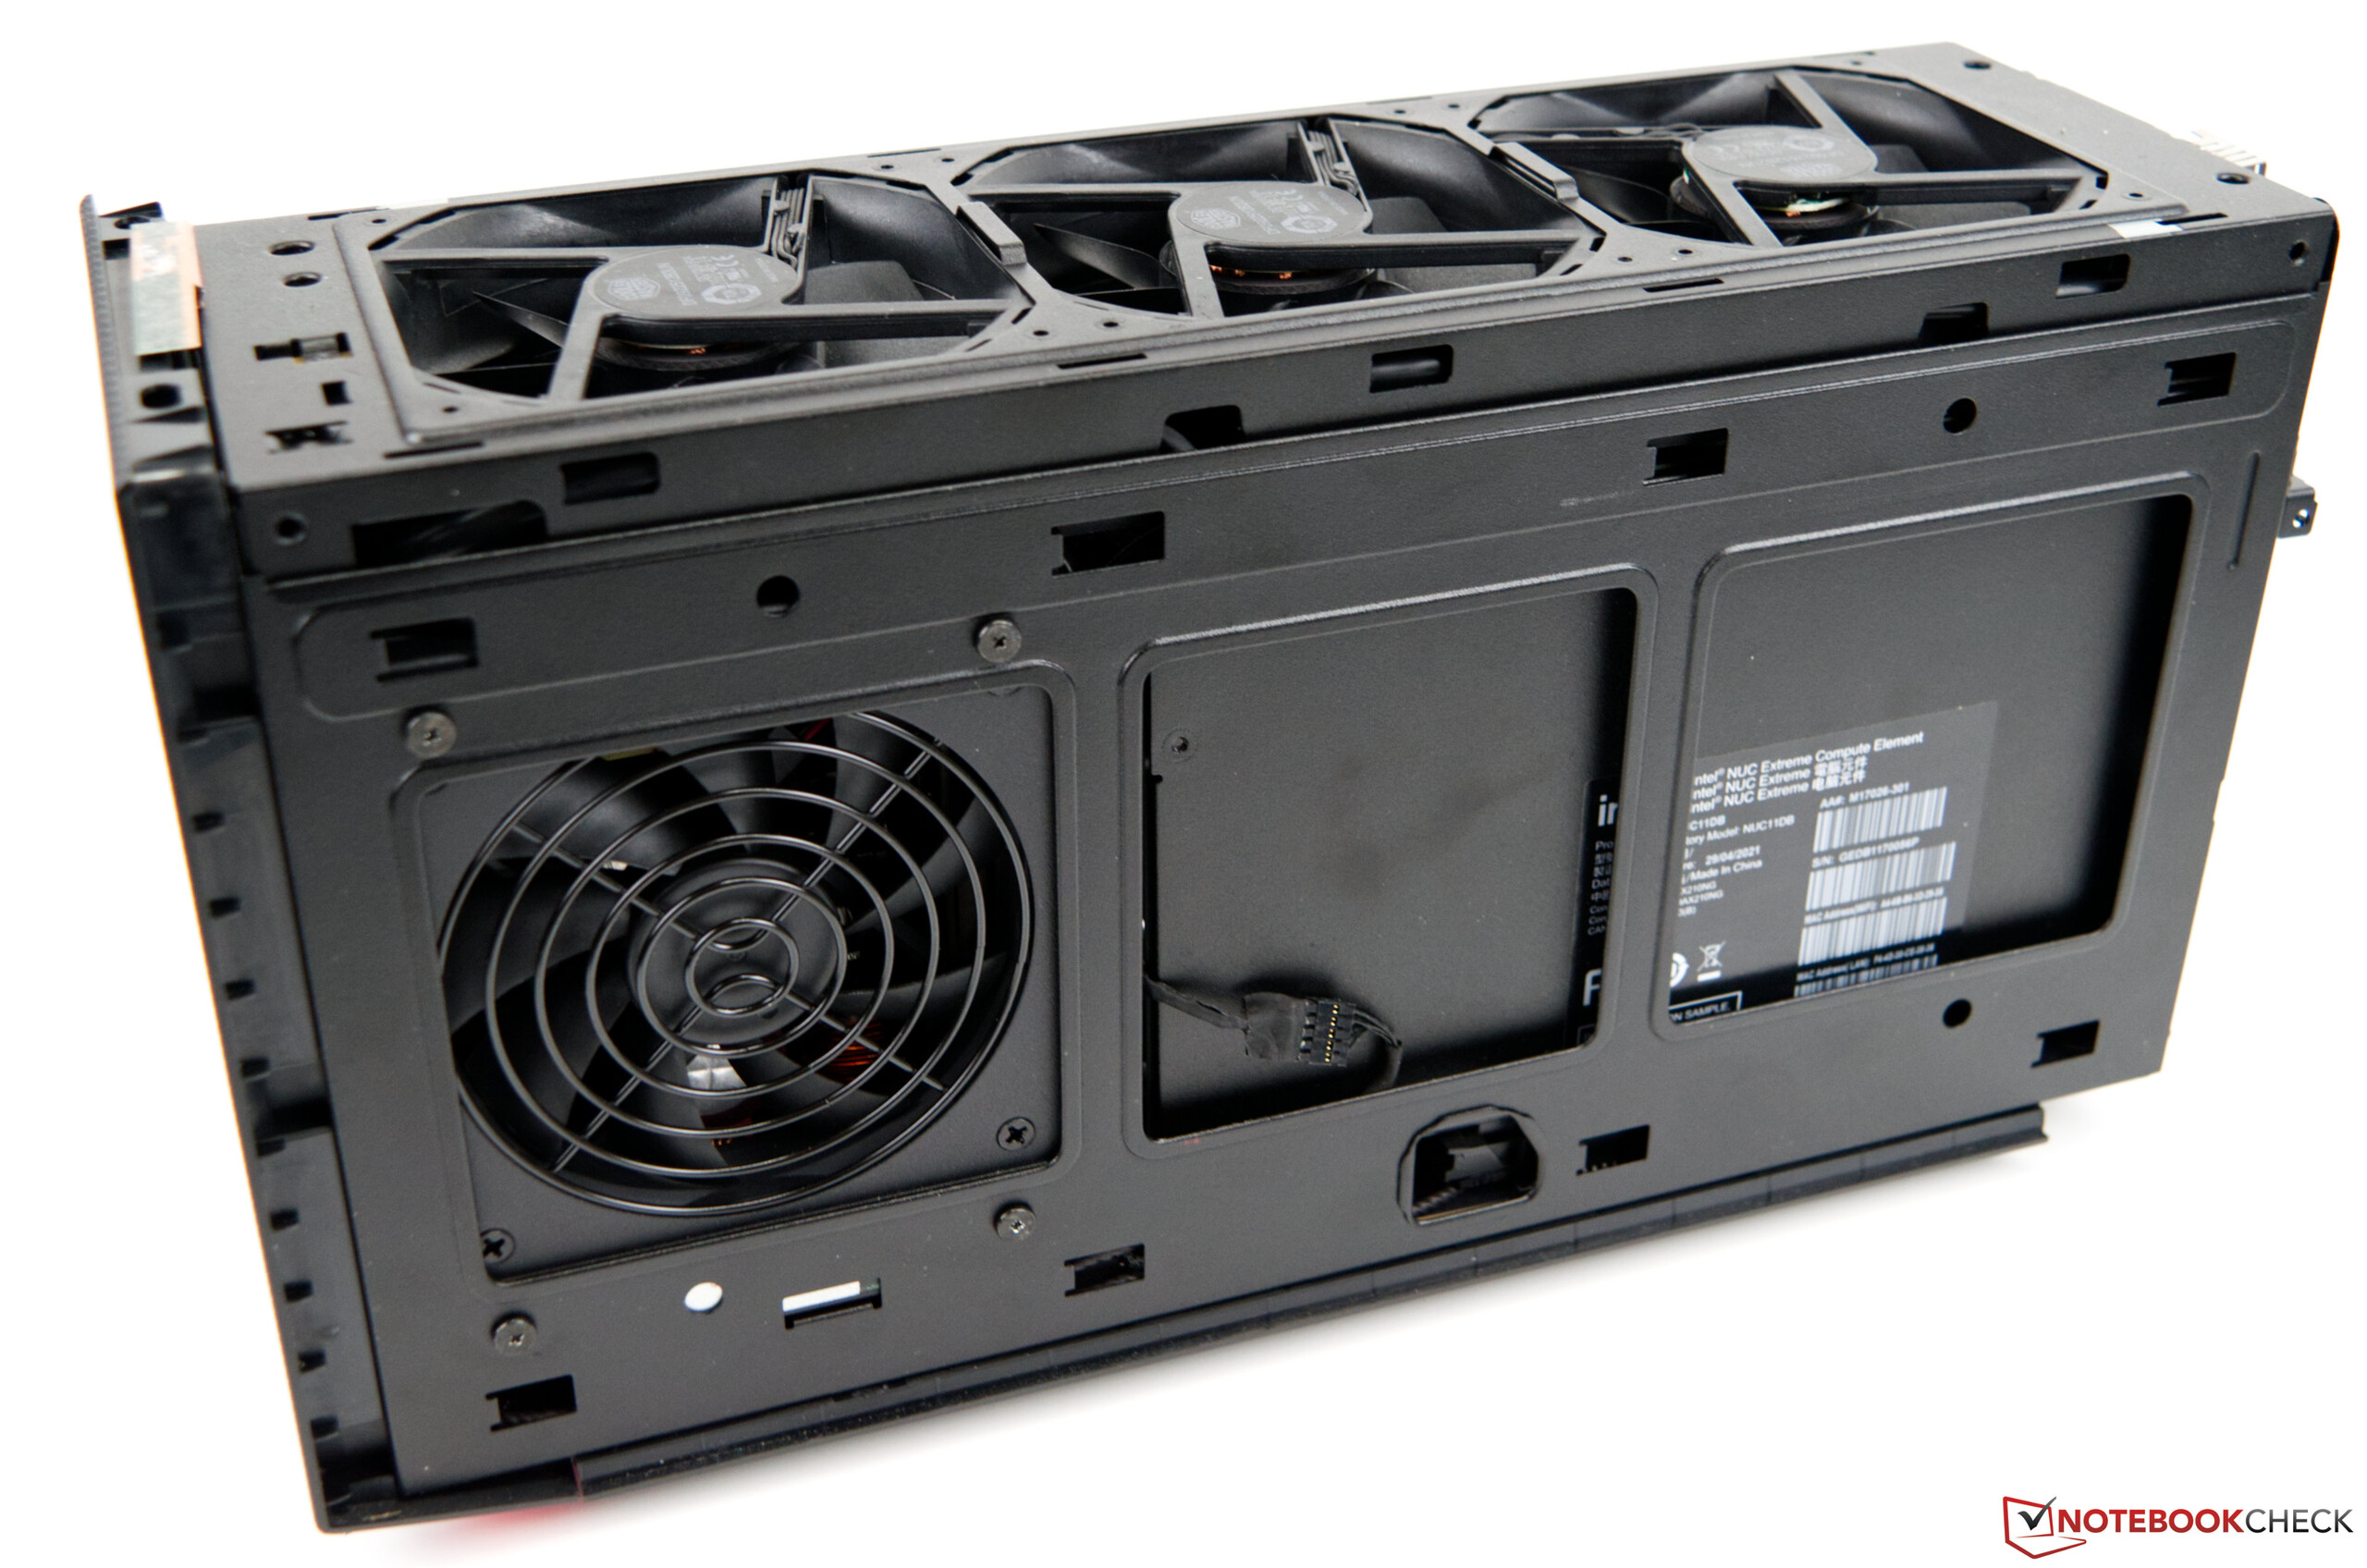
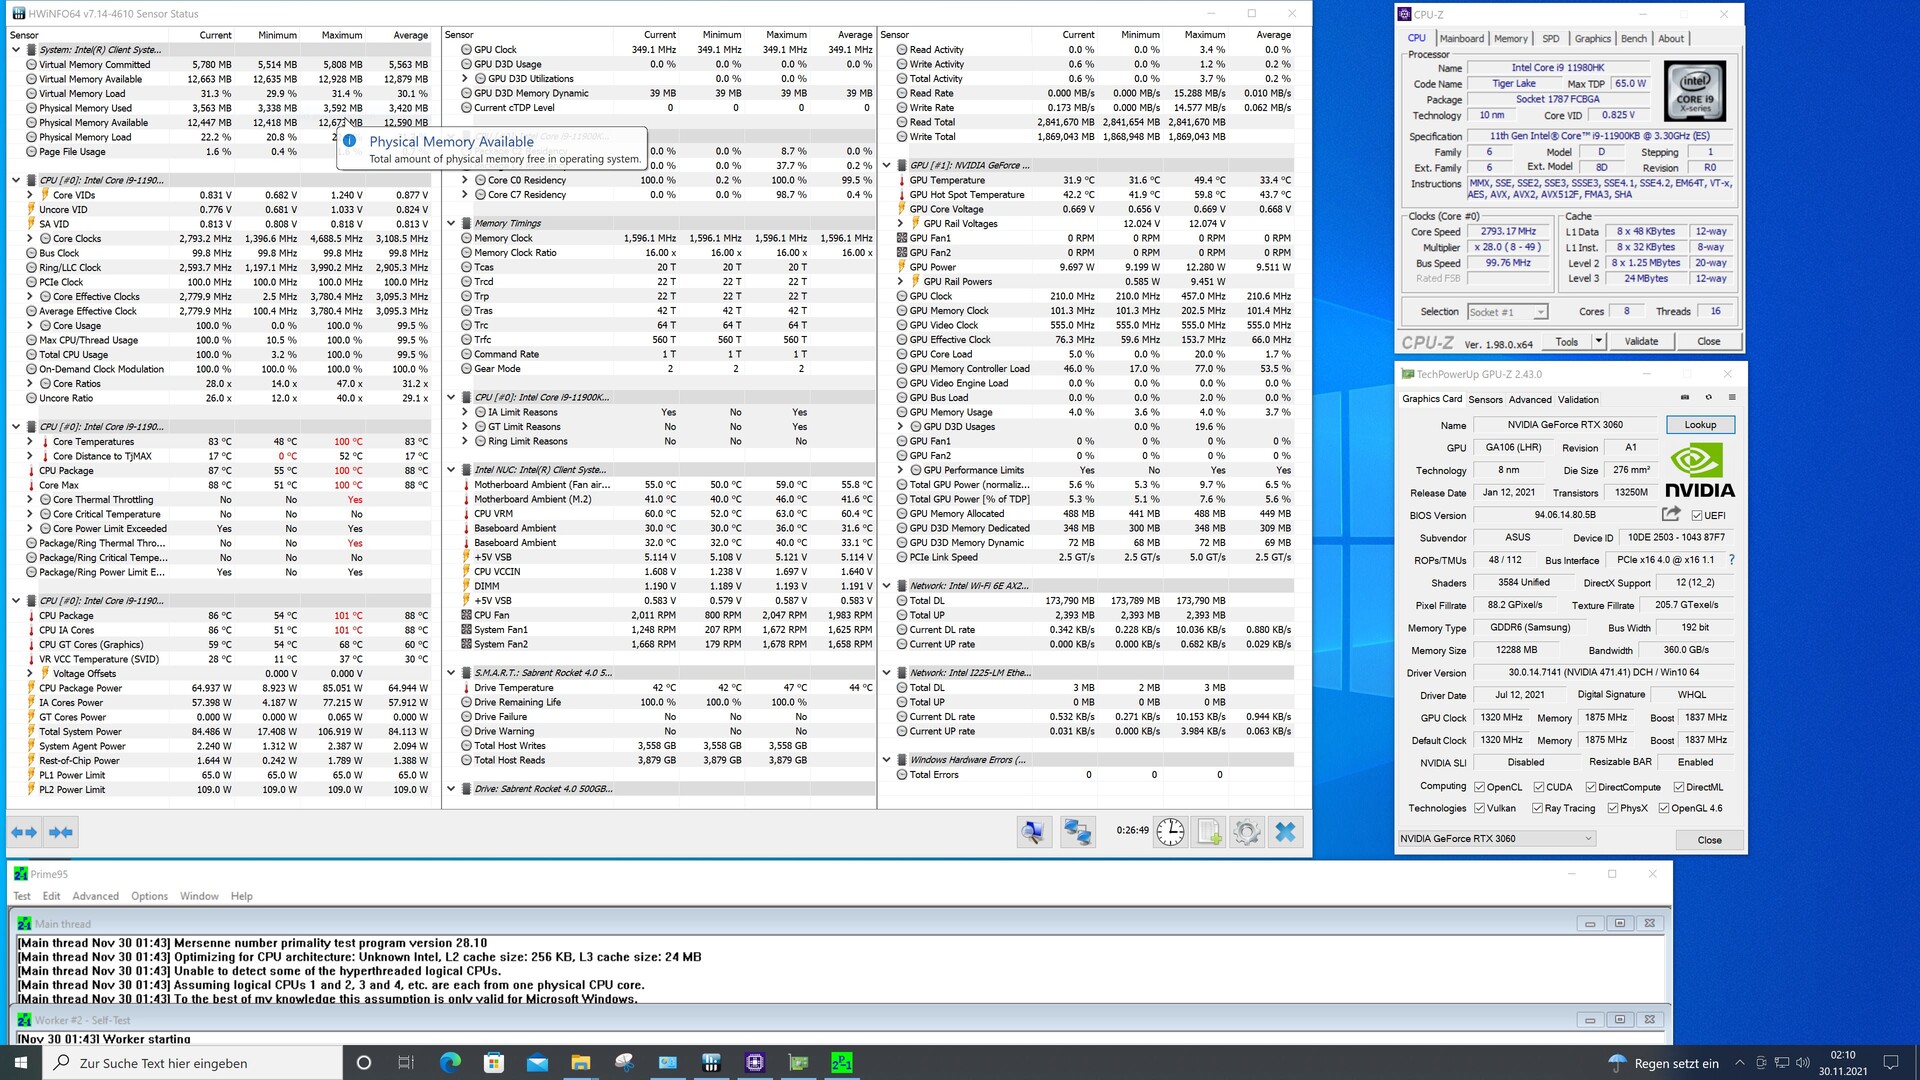
Dass Intel die Leistungsentfaltung des Intel Core i9-11900KB nicht übermäßig reglementiert, sieht man sehr schnell an den Temperaturen, sobald die Leistung abverlangt wird. Die 100 °C Marke ist problemlos erreichbar. Dennoch konnte dieses im Leistungstest nicht mit einer deutlich nachlassenden Leistung in Verbindung gebracht werden. Die Kühlung des Compute-Elements wird durch einen kleinen Lüfter sichergestellt, der im oberen Bereich des Gehäuses durch drei weitere Gehäuselüfter unterstützt wird. Die kompakte Bauweise hat natürliche ihren Anteil an den Temperaturen der Komponenten. Demnach ist es auch ausschlaggebend, welche dedizierte Grafikkarte in dem System steckt. Wer demzufolge nur die iGPU nutzen möchte und auf einen dedizierten Grafikadapter verzichtet, kann mit einer leicht erhöhten Leistung des SoC rechnen. Ein drastischer Performancegewinn sollte aber nicht zu erwarten sein.

Einen großen Nachteil hat die kompakte Bauweise aber noch, denn die Geräuschkulisse des Intel NUC 11 Extreme Kit – Beast Canyon ist deutlich zu hören. Mit 36 dB(A) ist das System selbst im Leerlauf nicht wirklich leise unterwegs. Somit verwundert es nicht, dass beim Spielen dann 50,5 dB(A) gemessen werden. Bei den Testbedingungen ermitteln wir die Lautstärke im Abstand von 15 Zentimetern zum Gerät. Wer den Intel NUC 11 Extreme Kit – Beast Canyon nicht direkt auf dem Schreibtisch neben sich platziert, sollte die Geräuschkulisse etwas weniger wahrnehmen.

Power Consumption
1920x1080 The Witcher 3 ultra (external Monitor)
AMD Ryzen 9 3950X
NVIDIA Titan RTX, R9 3950X, Intel Optane 905P 480GB 2.5 (Idle: 95 W)
423.6 (400min - 442max) Watt * -84%
Intel Core i9-10900K
NVIDIA Titan RTX, i9-10900K, WDC PC SN720 SDAQNTW-512G (Idle: 52.3 W)
396.2 (380min - 475max) Watt * -72%
Intel Core i5-10600K
NVIDIA Titan RTX, i5-10600K (Idle: 52.2 W)
386.9 (380min - 404max) Watt * -68%
Corsair One i160
GeForce RTX 2080 Ti (Desktop), i9-9900K, Samsung PM961 NVMe MZVLW512HMJP (Idle: 51.5 W)
359 (348min - 374max) Watt * -56%
Intel Ghost Canyon NUC (RTX 2070)
GeForce RTX 2070 (Desktop), i9-9980HK, Kingston KC2500 1 TB SKC2500M81000G (Idle: 33.1 W)
237.1 (227min - 263max) Watt * -3%
Intel Beast Canyon NUC
NVIDIA GeForce RTX 3060, i9-11900KB, Sabrent Rocket 4.0 500GB (Idle: 32 W)
229.9 (219min - 254max) Watt *
Prime95 V2810 Stress (external Monitor)
Intel Core i9-10900K
NVIDIA Titan RTX, i9-10900K, WDC PC SN720 SDAQNTW-512G (Idle: 52.3 W)
275.7 (254min - 385max) Watt * -144%
Intel Core i5-10600K
NVIDIA Titan RTX, i5-10600K (Idle: 52.2 W)
204.4 (191min - 261max) Watt * -81%
AMD Ryzen 9 3950X
NVIDIA Titan RTX, R9 3950X, Intel Optane 905P 480GB 2.5 (Idle: 95 W)
198.8 (185min - 240max) Watt * -76%
Intel Beast Canyon NUC
NVIDIA GeForce RTX 3060, i9-11900KB, Sabrent Rocket 4.0 500GB (Idle: 34 W)
112.9 (108min - 135max) Watt *
Intel Ghost Canyon NUC (RTX 2070)
GeForce RTX 2070 (Desktop), i9-9980HK, Kingston KC2500 1 TB SKC2500M81000G (Idle: 33.1 W)
109.4 (107min - 151max) Watt * +3%
Cinebench R15 Multi (external Monitor)
Intel Core i9-10900K
NVIDIA Titan RTX, i9-10900K, WDC PC SN720 SDAQNTW-512G (Idle: 52.3 W)
268.5 (265min - 270max) Watt * -117%
AMD Ryzen 9 3950X
NVIDIA Titan RTX, R9 3950X, Intel Optane 905P 480GB 2.5 (Idle: 95 W)
219.5 (218min - 225max) Watt * -77%
Intel Core i5-10600K
NVIDIA Titan RTX, i5-10600K (Idle: 52.2 W)
172.5 (170min - 176max) Watt * -39%
Intel Beast Canyon NUC
NVIDIA GeForce RTX 3060, i9-11900KB, Sabrent Rocket 4.0 500GB (Idle: 32 W)
123.9 (73min - 147max) Watt *
Temperatures - CPU Temperature Prime95
Intel Core i9-10900K
NVIDIA Titan RTX, i9-10900K, WDC PC SN720 SDAQNTW-512G
88 °C
AMD Ryzen 9 3950X
NVIDIA Titan RTX, R9 3950X, Intel Optane 905P 480GB 2.5
83.8 °C
Intel Core i5-10600K
NVIDIA Titan RTX, i5-10600K
70 °C

* ... kleinere Werte sind besser

Intel NUC 11 Extreme Kit – Beast Canyon - Stromverbrauch Idle
Intel NUC 11 Extreme Kit – Beast Canyon - Stromverbrauch Prime95
Intel NUC 11 Extreme Kit – Beast Canyon - Stromverbrauch FurMark
Intel NUC 11 Extreme Kit – Beast Canyon - Stromverbrauch Prime95 und FurMark
Intel NUC 11 Extreme Kit – Beast Canyon - Stromverbrauch Cinebench R15 nT
Intel NUC 11 Extreme Kit – Beast Canyon - Stromverbrauch The Witcher 3 (Ultra-Preset)
Intel NUC 11 Extreme Kit – Beast Canyon - Stresstest Prime95 solo
Intel NUC 11 Extreme Kit – Beast Canyon - Stresstest FurMark solo
Intel NUC 11 Extreme Kit – Beast Canyon - Stresstest Prime95 und FurMark

Pro

+ stabiles und kompaktes Gehäuse
+ Core i9 mit 8 Kernen und 16 Threads
+ hohe Systemperformance
+ Netzteil mit SFX-Formfaktor mit 650 Watt
+ viele Anschlussmöglichkeiten
+ 2x Thunderbolt 4
+ UHS-II SD-Kartenleser
+ vier M.2 Steckplätze
+ Wi-Fi 6

Contra

- deutlich hörbar unter Last
- eingeschränkte Kompatibilität bei Erweiterungskarten

Fazit - Kompakt, Modern und Schnell

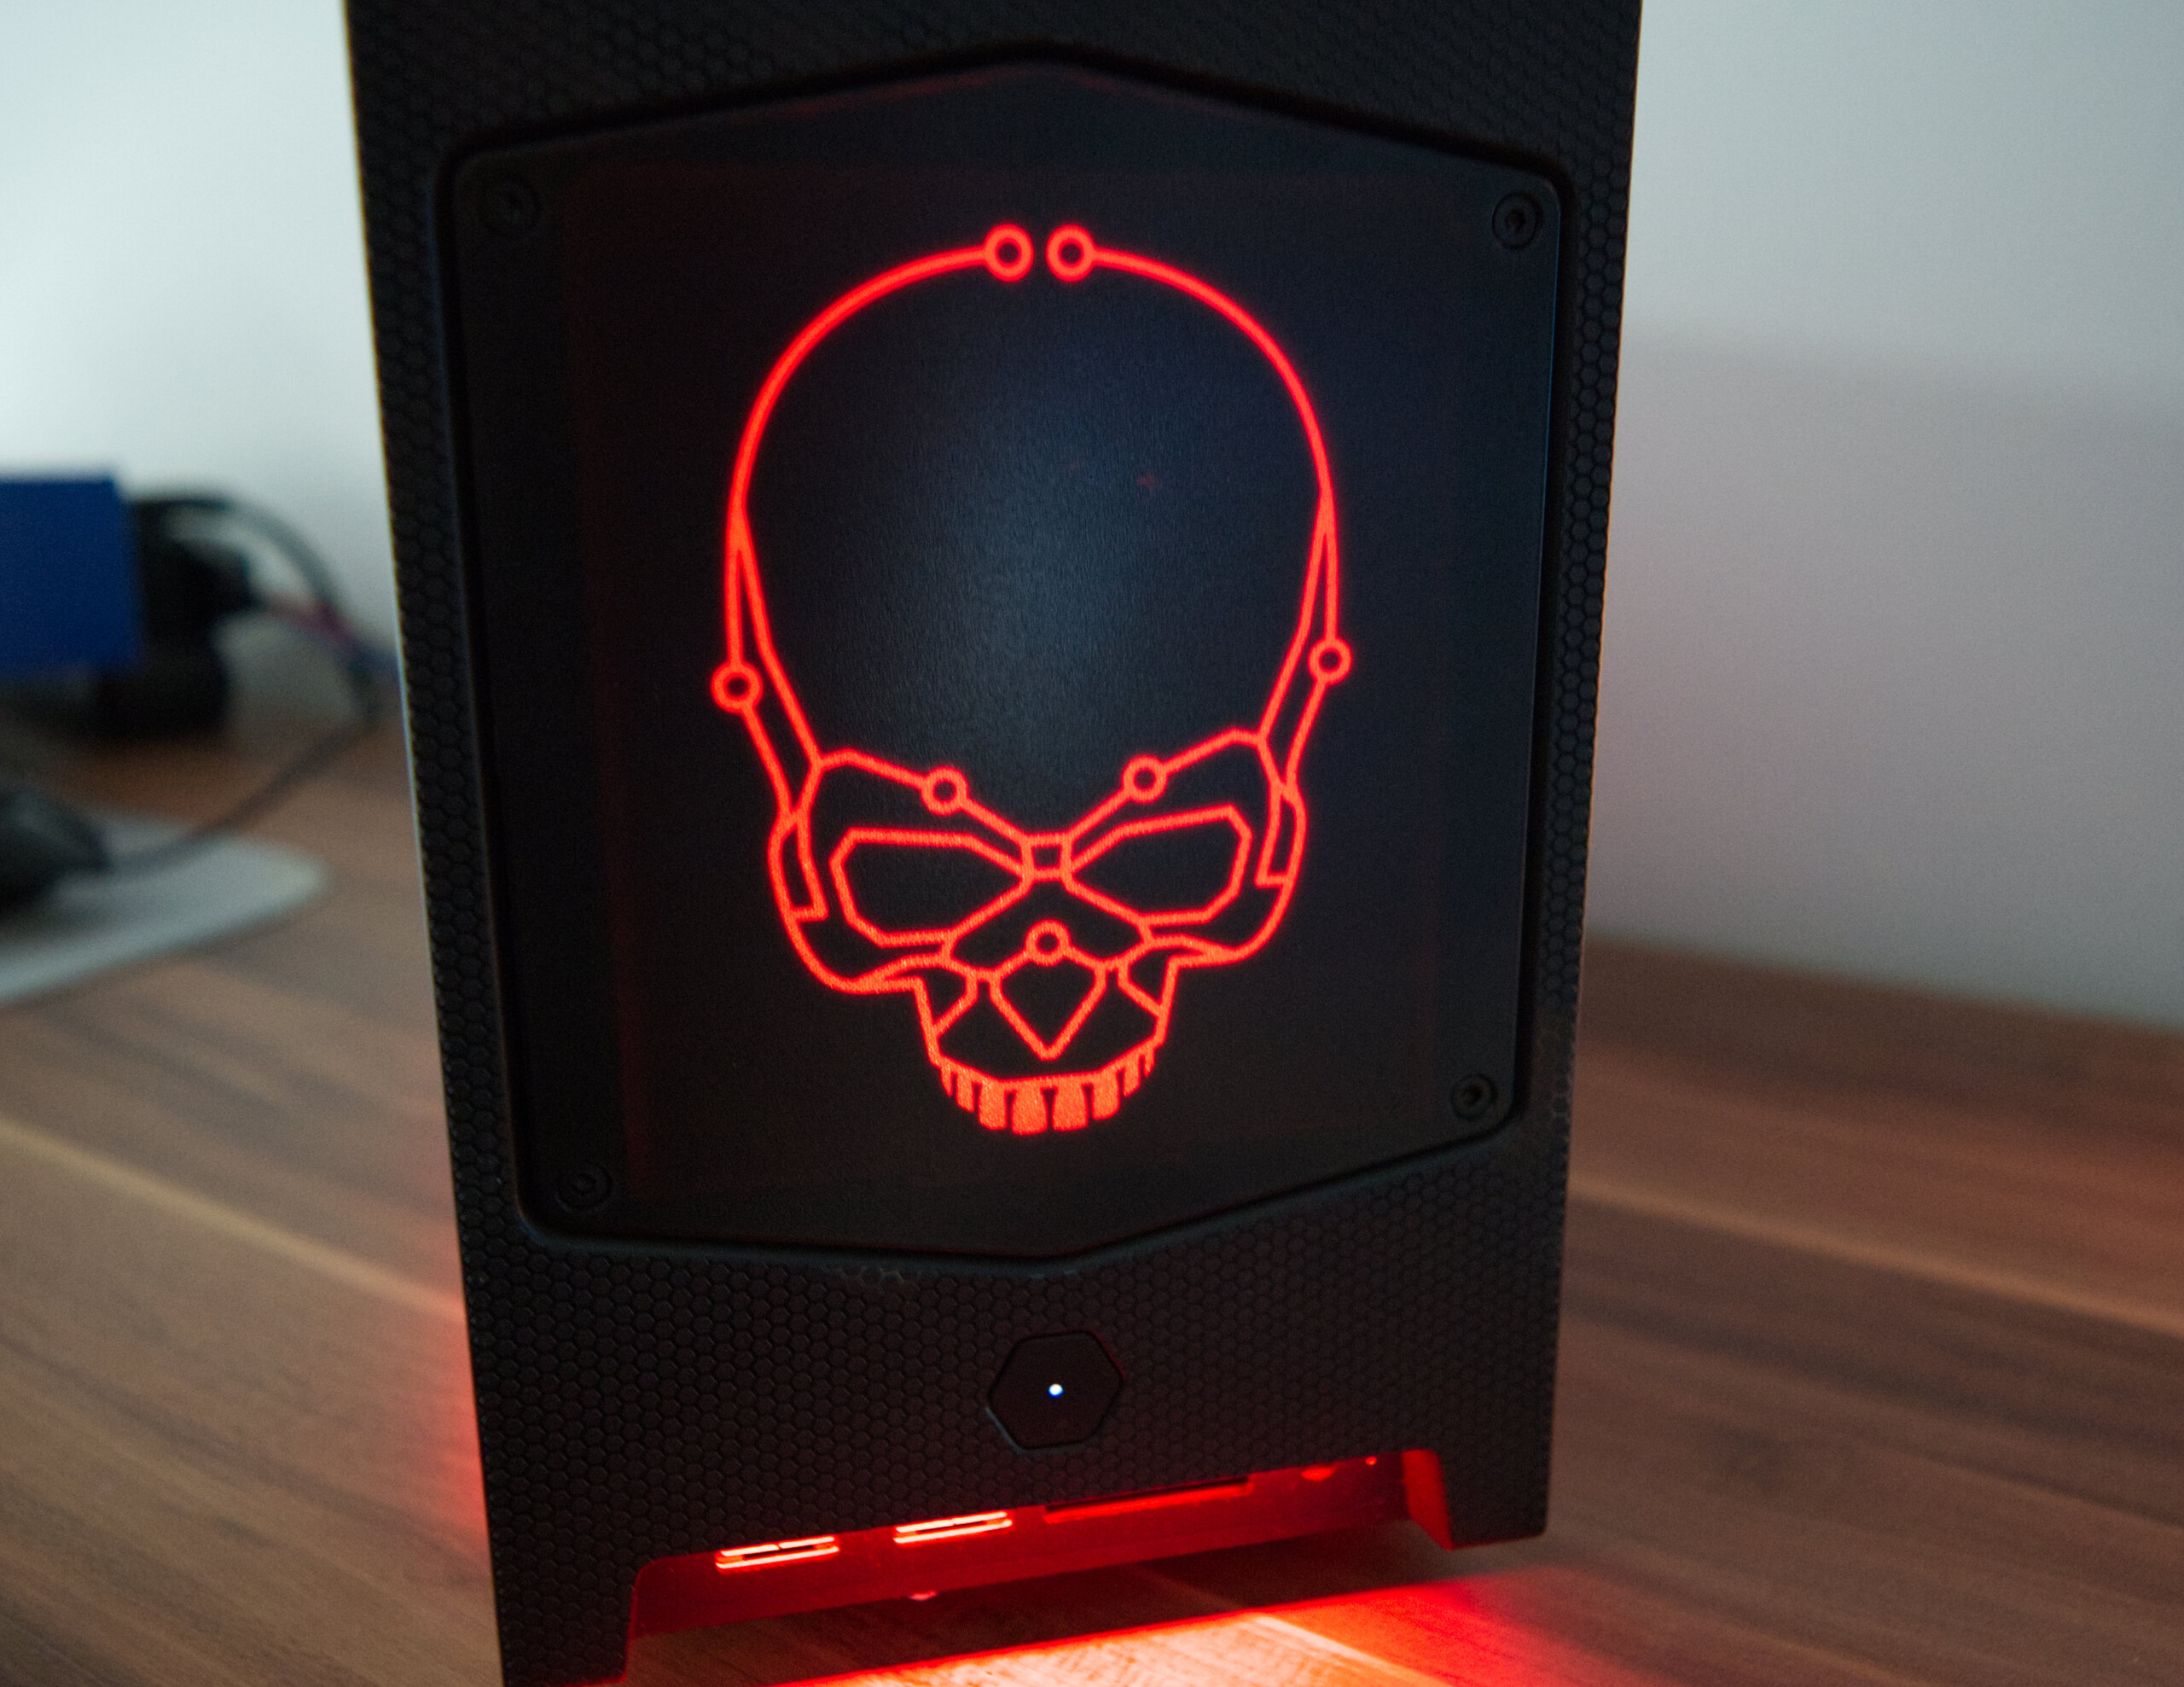
Der Intel NUC 11 Extreme Kit – Beast Canyon bietet auf kleinem Raum eine sehr gute Leistung. Mit dem neuen Compute-Element auf Basis des Intel Core i9-11900KB gibt es ein sparsames SoC, welches aus dem Notebook-Segment stammt. Die 8 Kerne und 16 Threads sorgen aufgrund der hohen IPC für eine sehr gute Leistung bei Spielen oder auch beim Arbeiten. Ein Schnäppchen sind die 1.200 US-Dollar, die mindestens fällig werden aber nicht, denn eine dedizierte Grafikkarte, Arbeitsspeicher, Massenspeicher und das Betriebssystem kommen noch obendrauf, sodass man schnell bei gut 2.000 US-Dollar liegt. Vergleichbare Desktop-Systeme sind momentan ähnlich teuer, sodass man hier durchaus die Überlegung machen darf, sich für den Intel NUC 11 Extreme Kit – Beast Canyon zu entscheiden. Der größte Nachteil ist vermutlich die hohe Geräuschbelastung, welche unter Last schon deutlich hörbar ist. Wer mit den Nachteilen des Systems leben kann und auch nicht die größte Grafikkarte verbauen will kann, bekommt mit dem Intel NUC 11 Extreme Kit – Beast Canyon ein kompaktes System mit Seltenheitswert. Das Gehäuse ist nicht separat erhältlich und mit optischen Akzenten ein Hingucker.

Mit dem Intel NUC 11 Extreme Kit – Beast Canyon schraubt Intel die Leistung seiner Kompaktgeräte weiter nach oben.

Sehr gut ist die Auswahl und die Anzahl der Schnittstellen. Mit zweimal Thunderbolt 4 gibt es sogar den schnellsten und modernsten Standard, was Zukunftssicherheit ausstrahlt. Ebenso gibt es viele USB-Schnittstellen, um Peripheriegeräte anzuschießen und selbst auf einen schnellen SD-Kartenleser mit dem UHS-II-Standard wird nicht verzichtet. Einzig das Fehlen eines zweiten Ethernet-Ports könnte man kritisieren, wenngleich das schon Meckern auf hohem Niveau wäre.

Die Alternative zum Intel NUC 11 Extreme Kit – Beast Canyon wäre der eigene Zusammenbau eines Systems, bei dem die Kosten vermutlich auf demselben Level liegen würden. Mit dem Zotac Magnus One gibt es eine gute Alternative, wenn es um sehr kompakte Gaming-PCs geht.

Alle 3 Beträge lesen / Antworten
static version load dynamic
Die Kommentare zum Artikel werden geladen
Diesen Artikel kommentieren / Antworten
Teilen Sie diesen Artikel, um uns zu unterstützen. Jeder Link hilft!
> Notebook Test, Laptop Test und News > Tests > Sonstige Tests > Intel NUC 11 Beast Canyon mit Core i9 und RTX 3060 im Test
Autor: Sebastian Bade,  9.12.2021 (Update: 26.11.2022)