Notebookcheck Logo

Intel NUC 12 Dragon Canyon mit Intel Core i9-12900 im Test

Gaming-PC oder Arbeitstier? Das aktuelle Intel NUC 12 Extreme Kit kommt mit dem bereits bekannten Compute-Element daher. Dennoch gibt es wesentliche Änderungen, denn mit einer gesockelten CPU auf Basis des LGA1700 lässt sich das Compute-Element sogar mit verschiedenen Prozessoren betreiben. Mit dem bereits installierten Intel Core i9-12900 bekommt man derzeit ein richtig schnelles und kompaktes System geliefert.

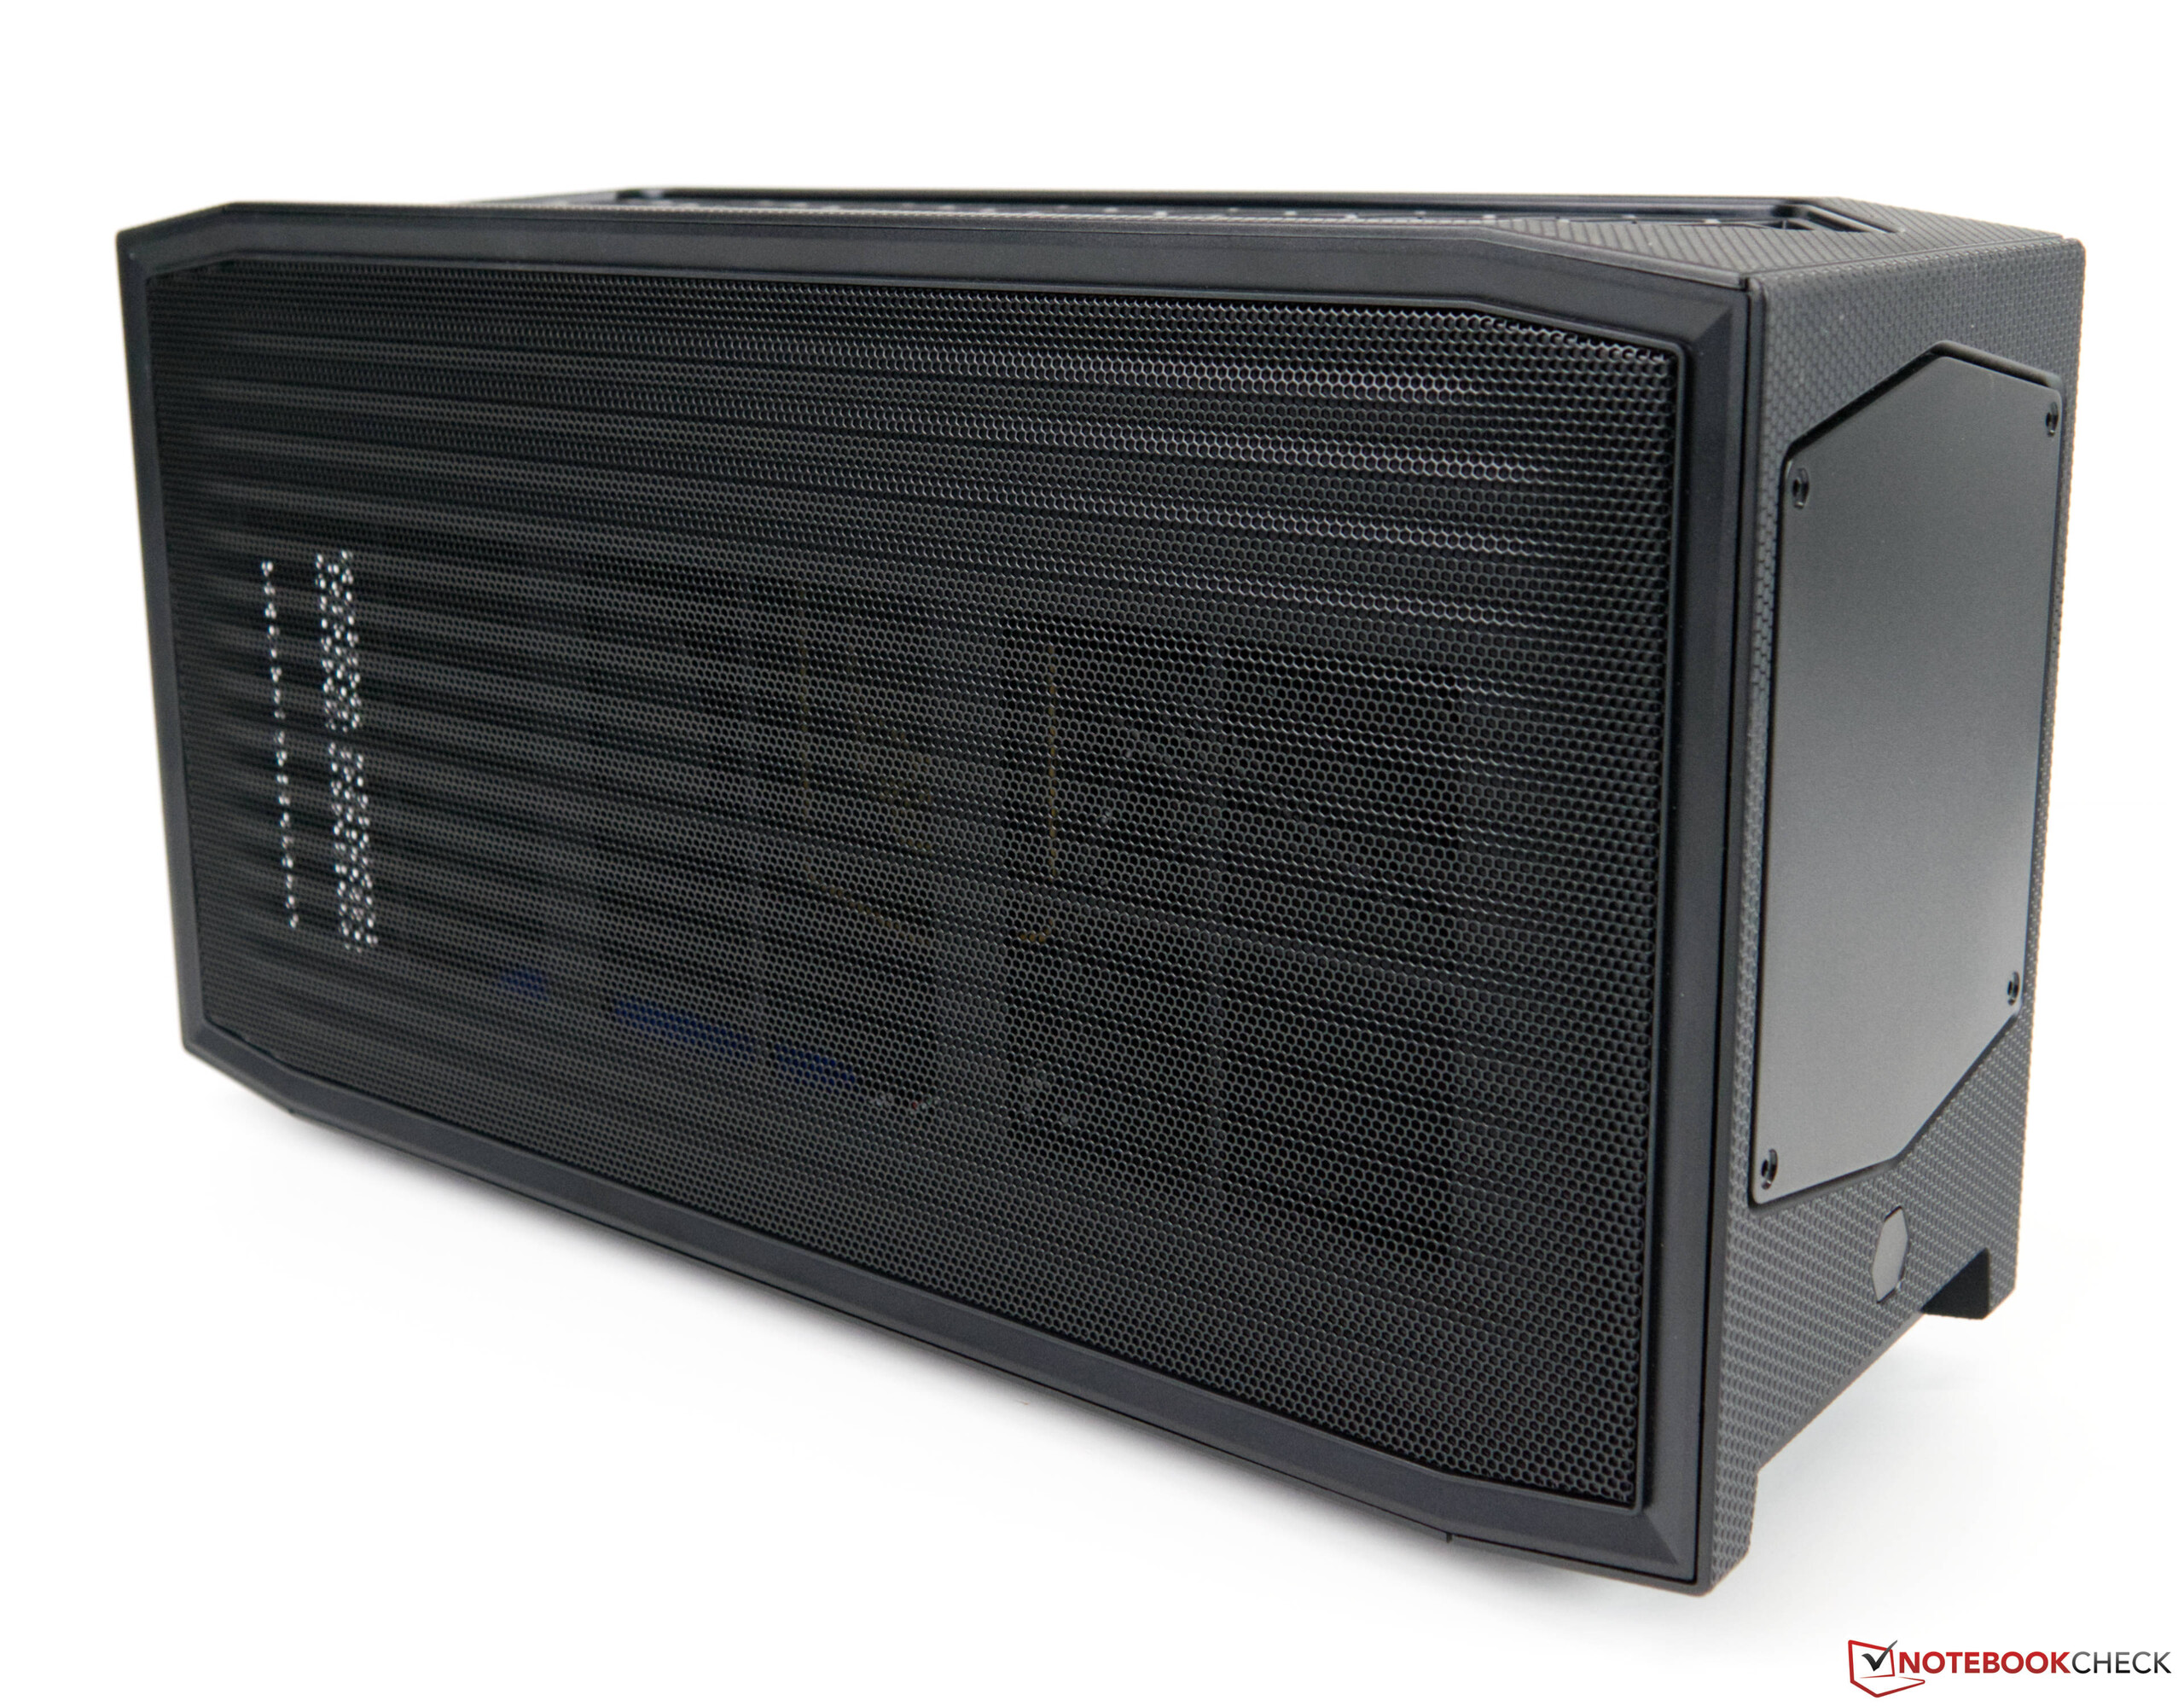
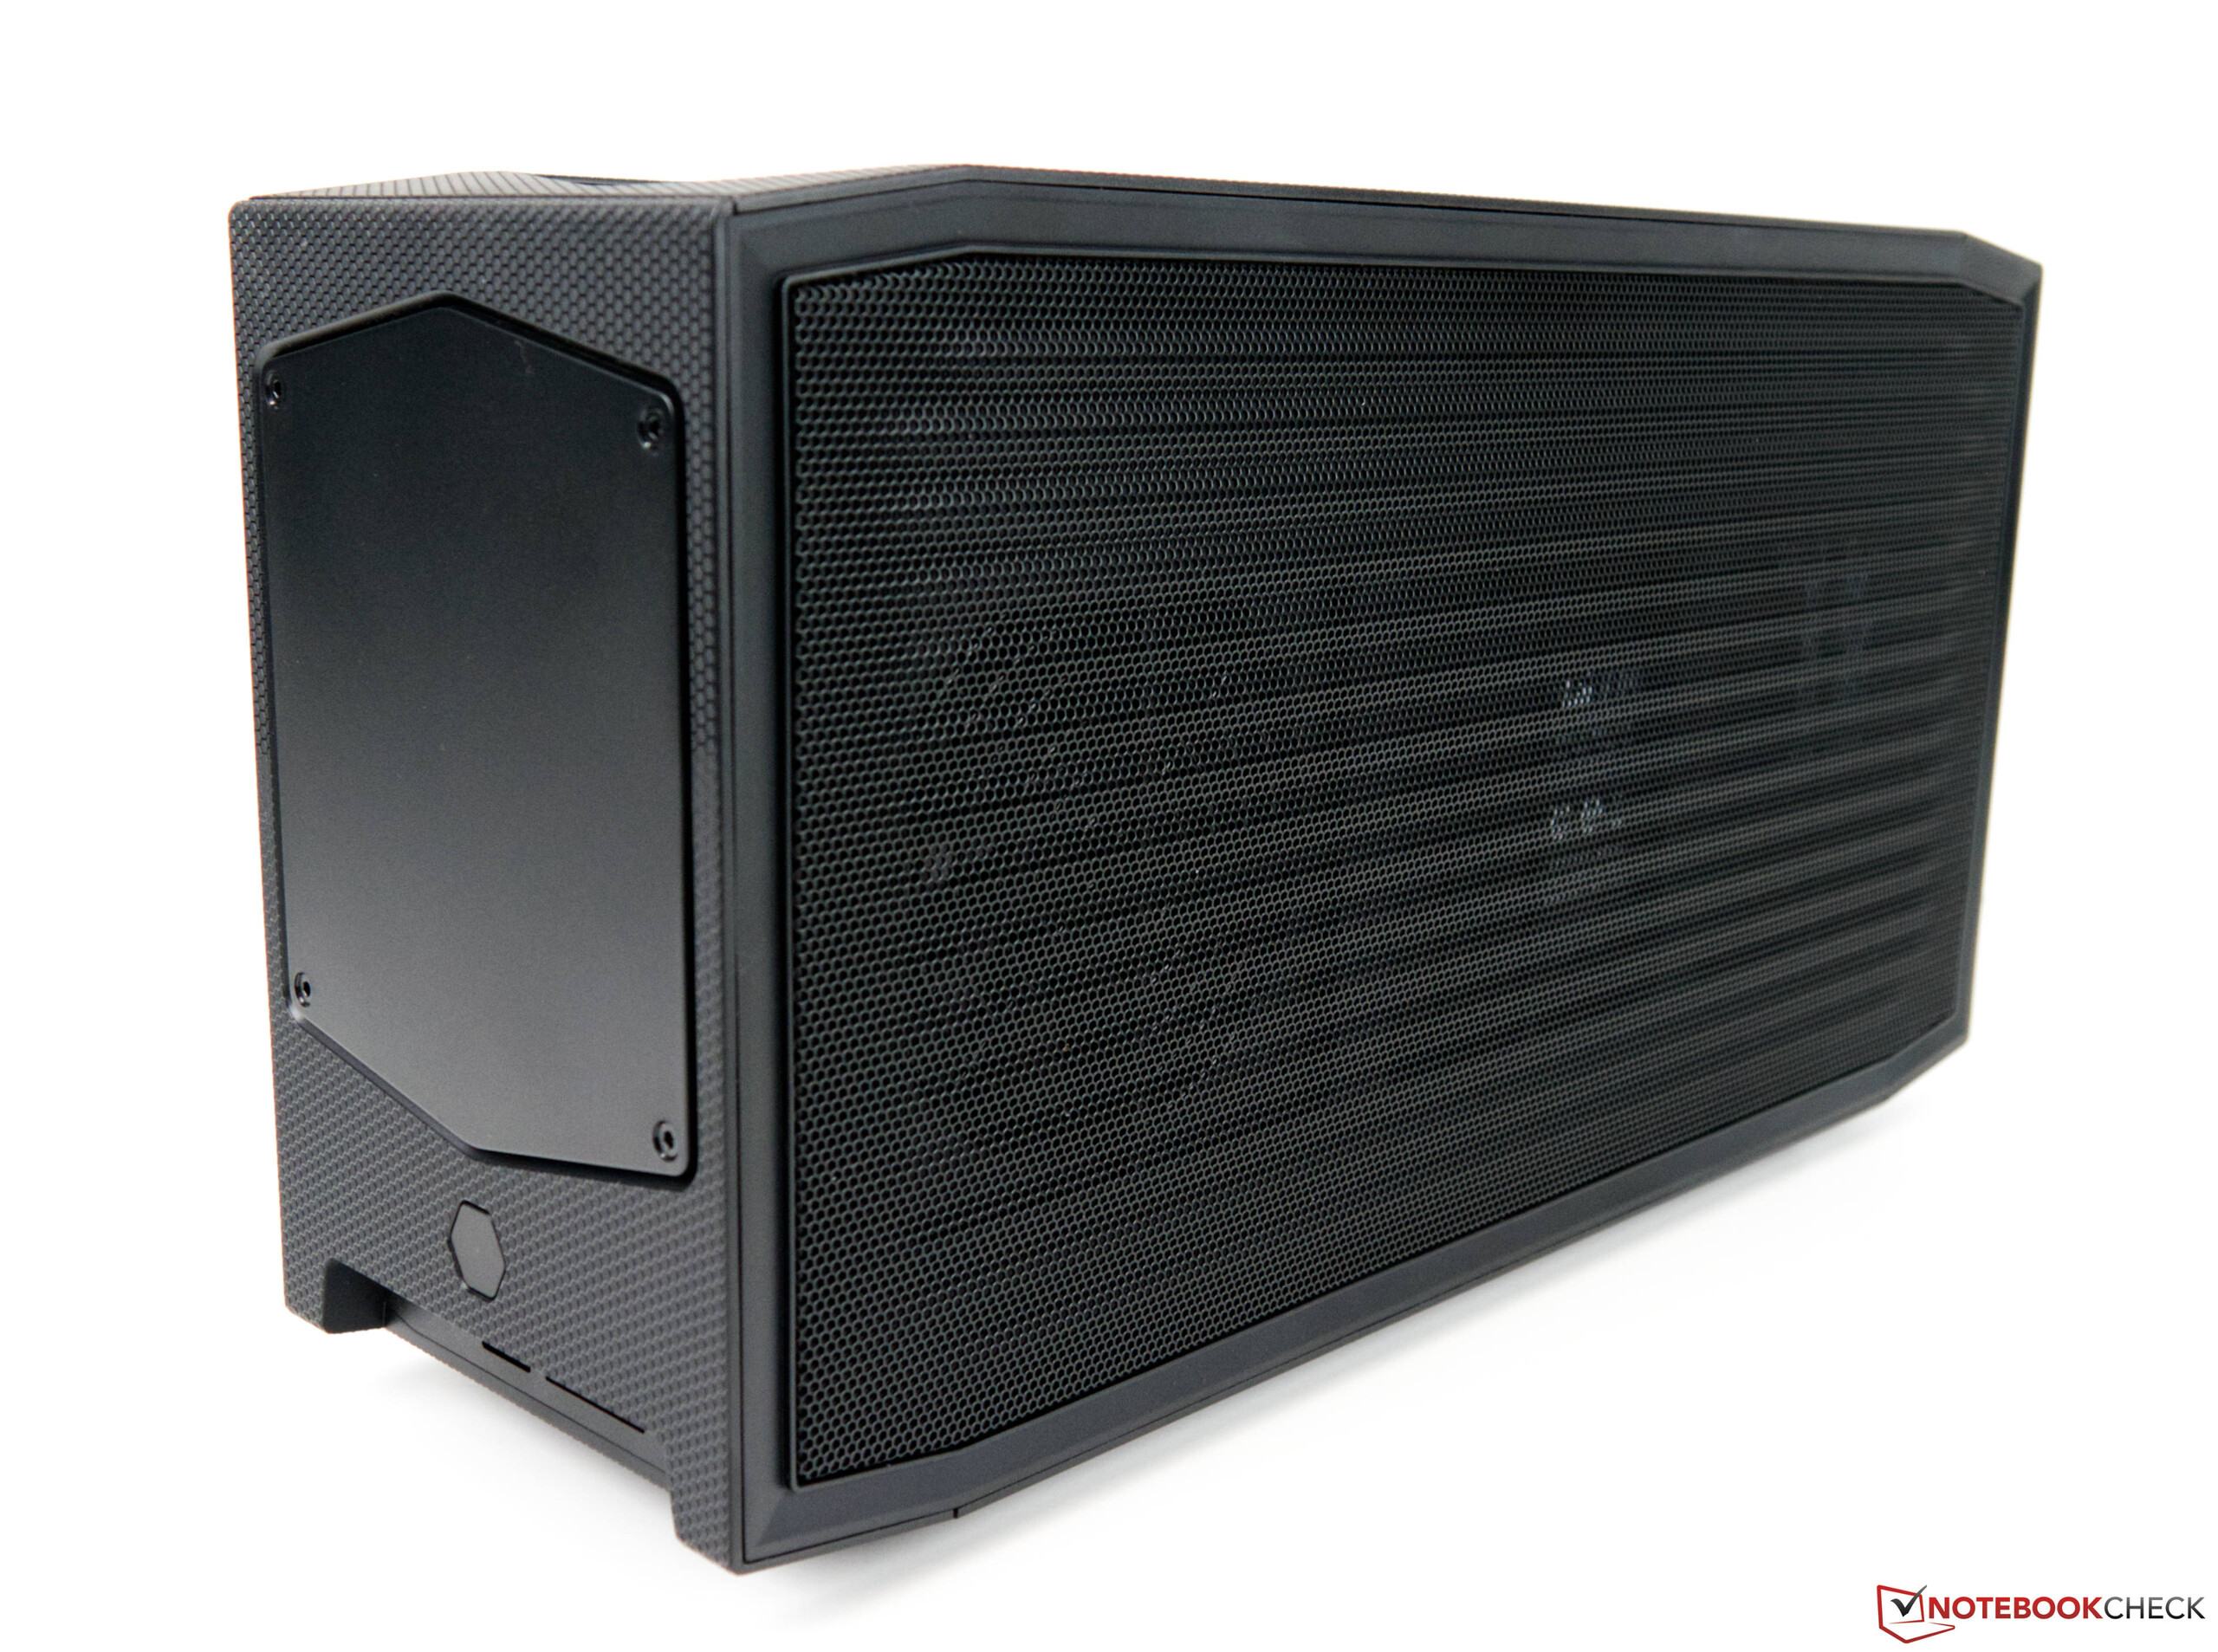
Das Intel NUC Extreme Kit ist schon seit einiger Zeit bekannt und sticht durch seine kompakte Bauweise und seiner guten Ausstattung aus der Masse hervor. Auch das Design des kompakten Desktop-Rechners bietet zweifelsohne einen deutlichen Wiedererkennungswert.

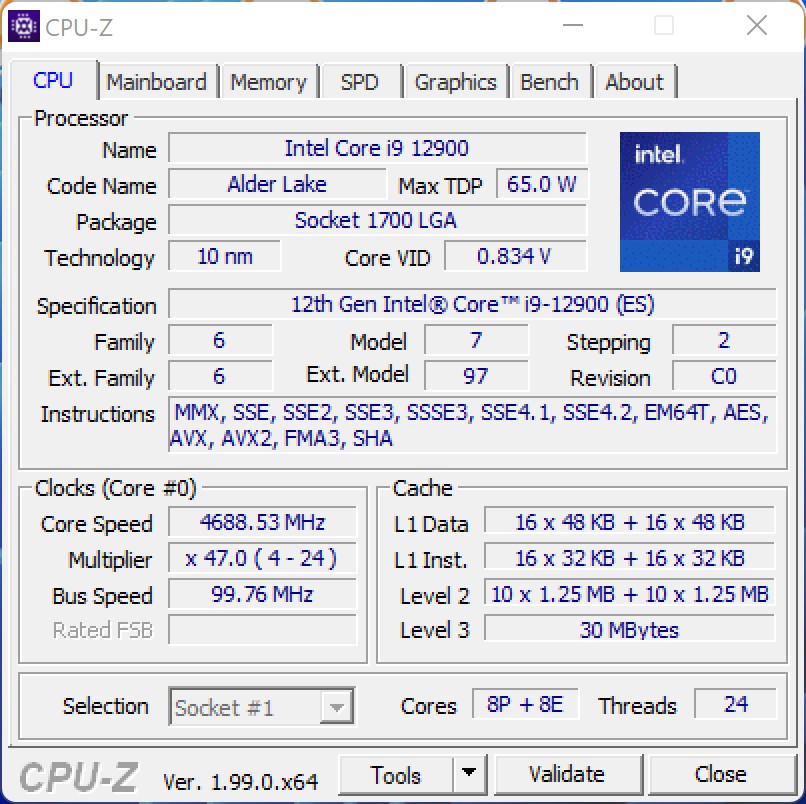
Das Intel NUC 11 Extreme Kit alias Beast Canyon haben wir uns vor kurzem im Detail angeschaut und waren damals schon von der Leistungsfähigkeit überrascht. Mit dem Intel NUC 12 Extreme Kit alias Dragon Canyon schiebt tritt Intel das Erbe an und zeigt, dass mit neuer CPU nochmals mehr Leistung geboten wird. Aufgrund des Fortschritts ist dies aber auch zu erwarten, denn Alder-Lake ist der älteren Tiger-Lake-Plattform deutlich überlegen. Verbaut wird noch immer das bekannte Compute-Element, welches alle wichtigen Bestandteile eines PCs vereint. Dabei geht Intel erstmals den Weg eine gesockelte CPU, wie man sie aus dem herkömmlichen Desktop-Segment kennt, zu verbauen. Zum Einsatz kommt der Intel Core i9-12900 der aktuellen Alder-Lake-S-Serie. Genau wie der Intel Core i9-12900K bietet der Prozessor die bereits bekannten P- und E-Cores welche in Summe bis zu 24 Threads verarbeiten können. Mit einer etwas geringeren TDP muss man aber mit einer etwas geringeren Leistung rechnen. Mehr Details dazu gibt es weiter unten im Artikel.

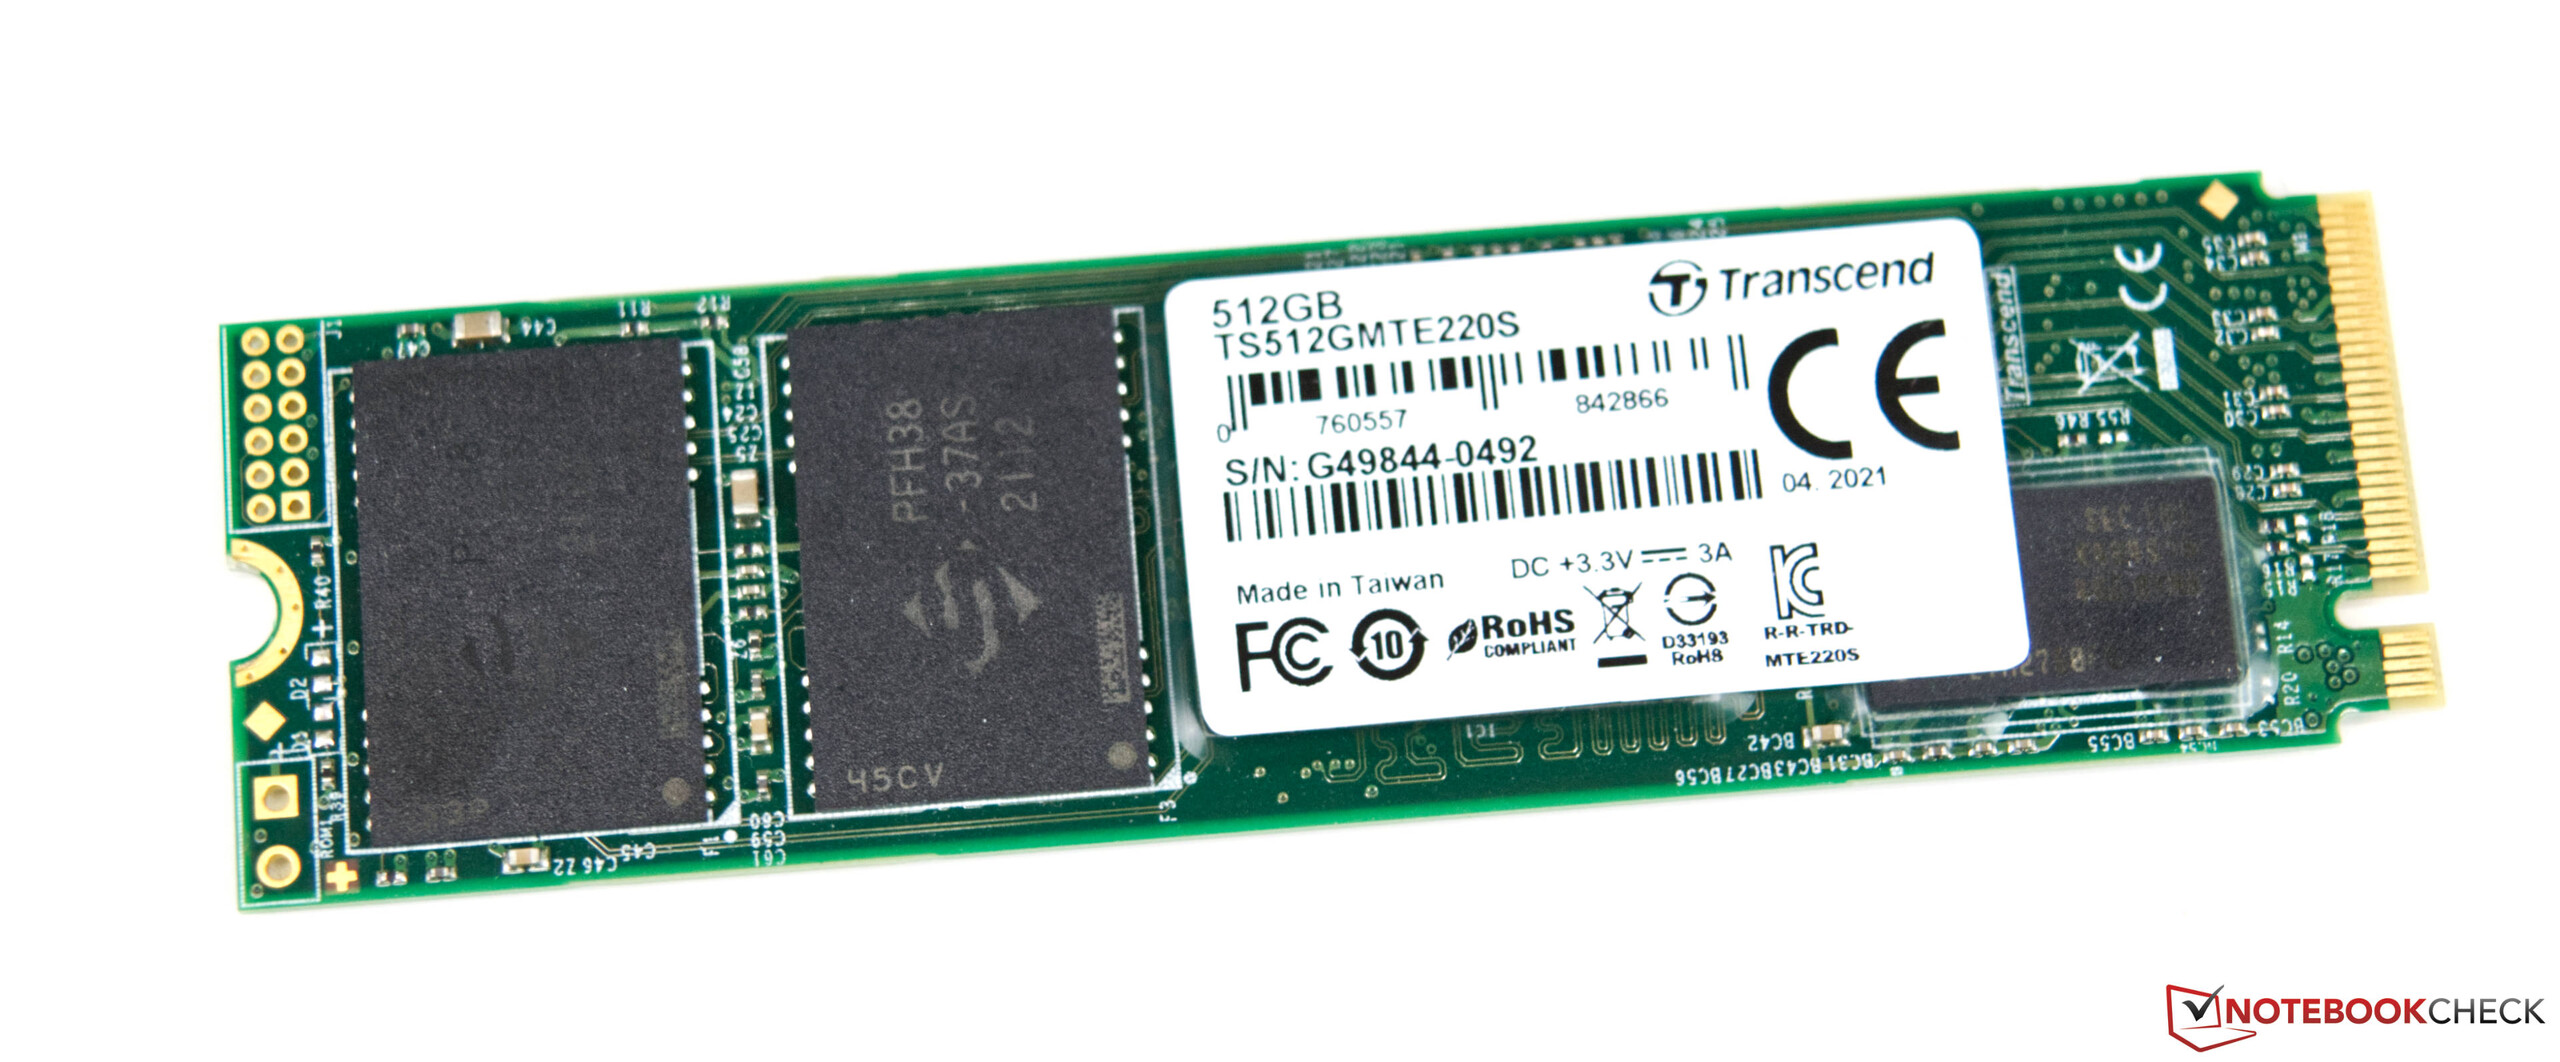
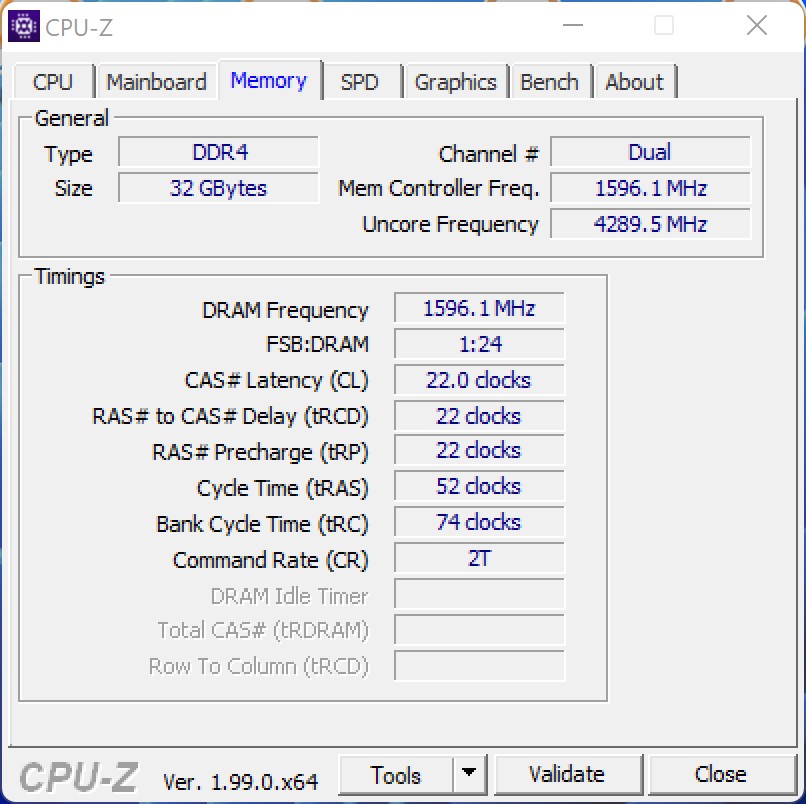
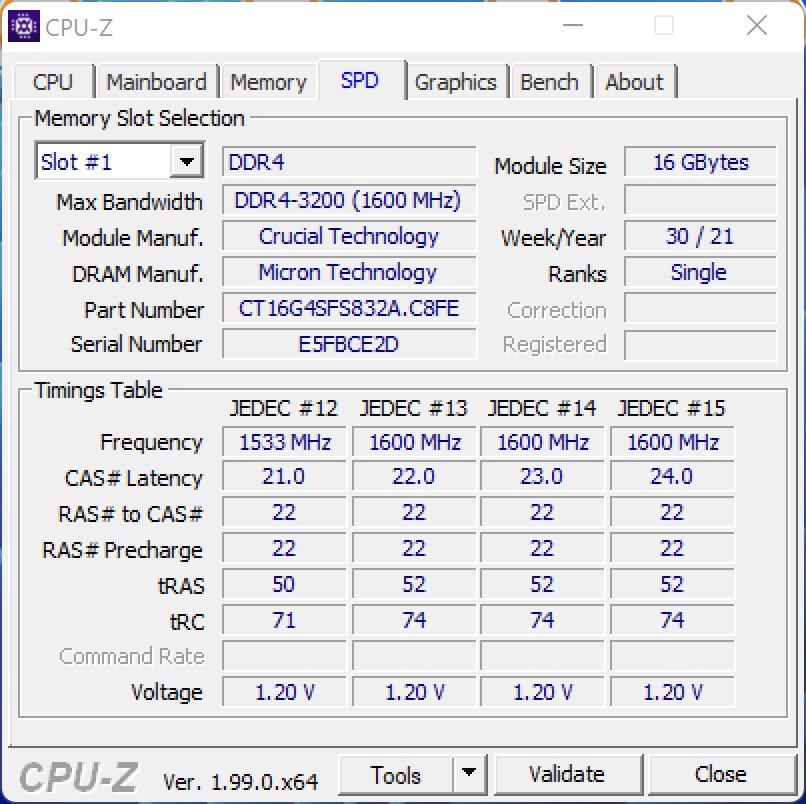
Bei Kauf des Intel NUC 12 Extreme Kit muss bedacht werden, dass es sich um ein Barebone-System handelt. SSD, RAM und eine dedizierte Grafikkarte gehören nicht zum Lieferumfang. Hierfür haben wir auf unseren eigenen Fundus zurückgegriffen und das System mit einer 512 GB NVMe-SSD, sowie 32 GB DDR4 RAM bestückt. Als dedizierte Grafikkarte haben wir uns bewusst für die Nvidia GeForce RTX 3060 entschieden, um den Vergleich zum Intel NUC 11 Extreme Kit fair zu gestalten.

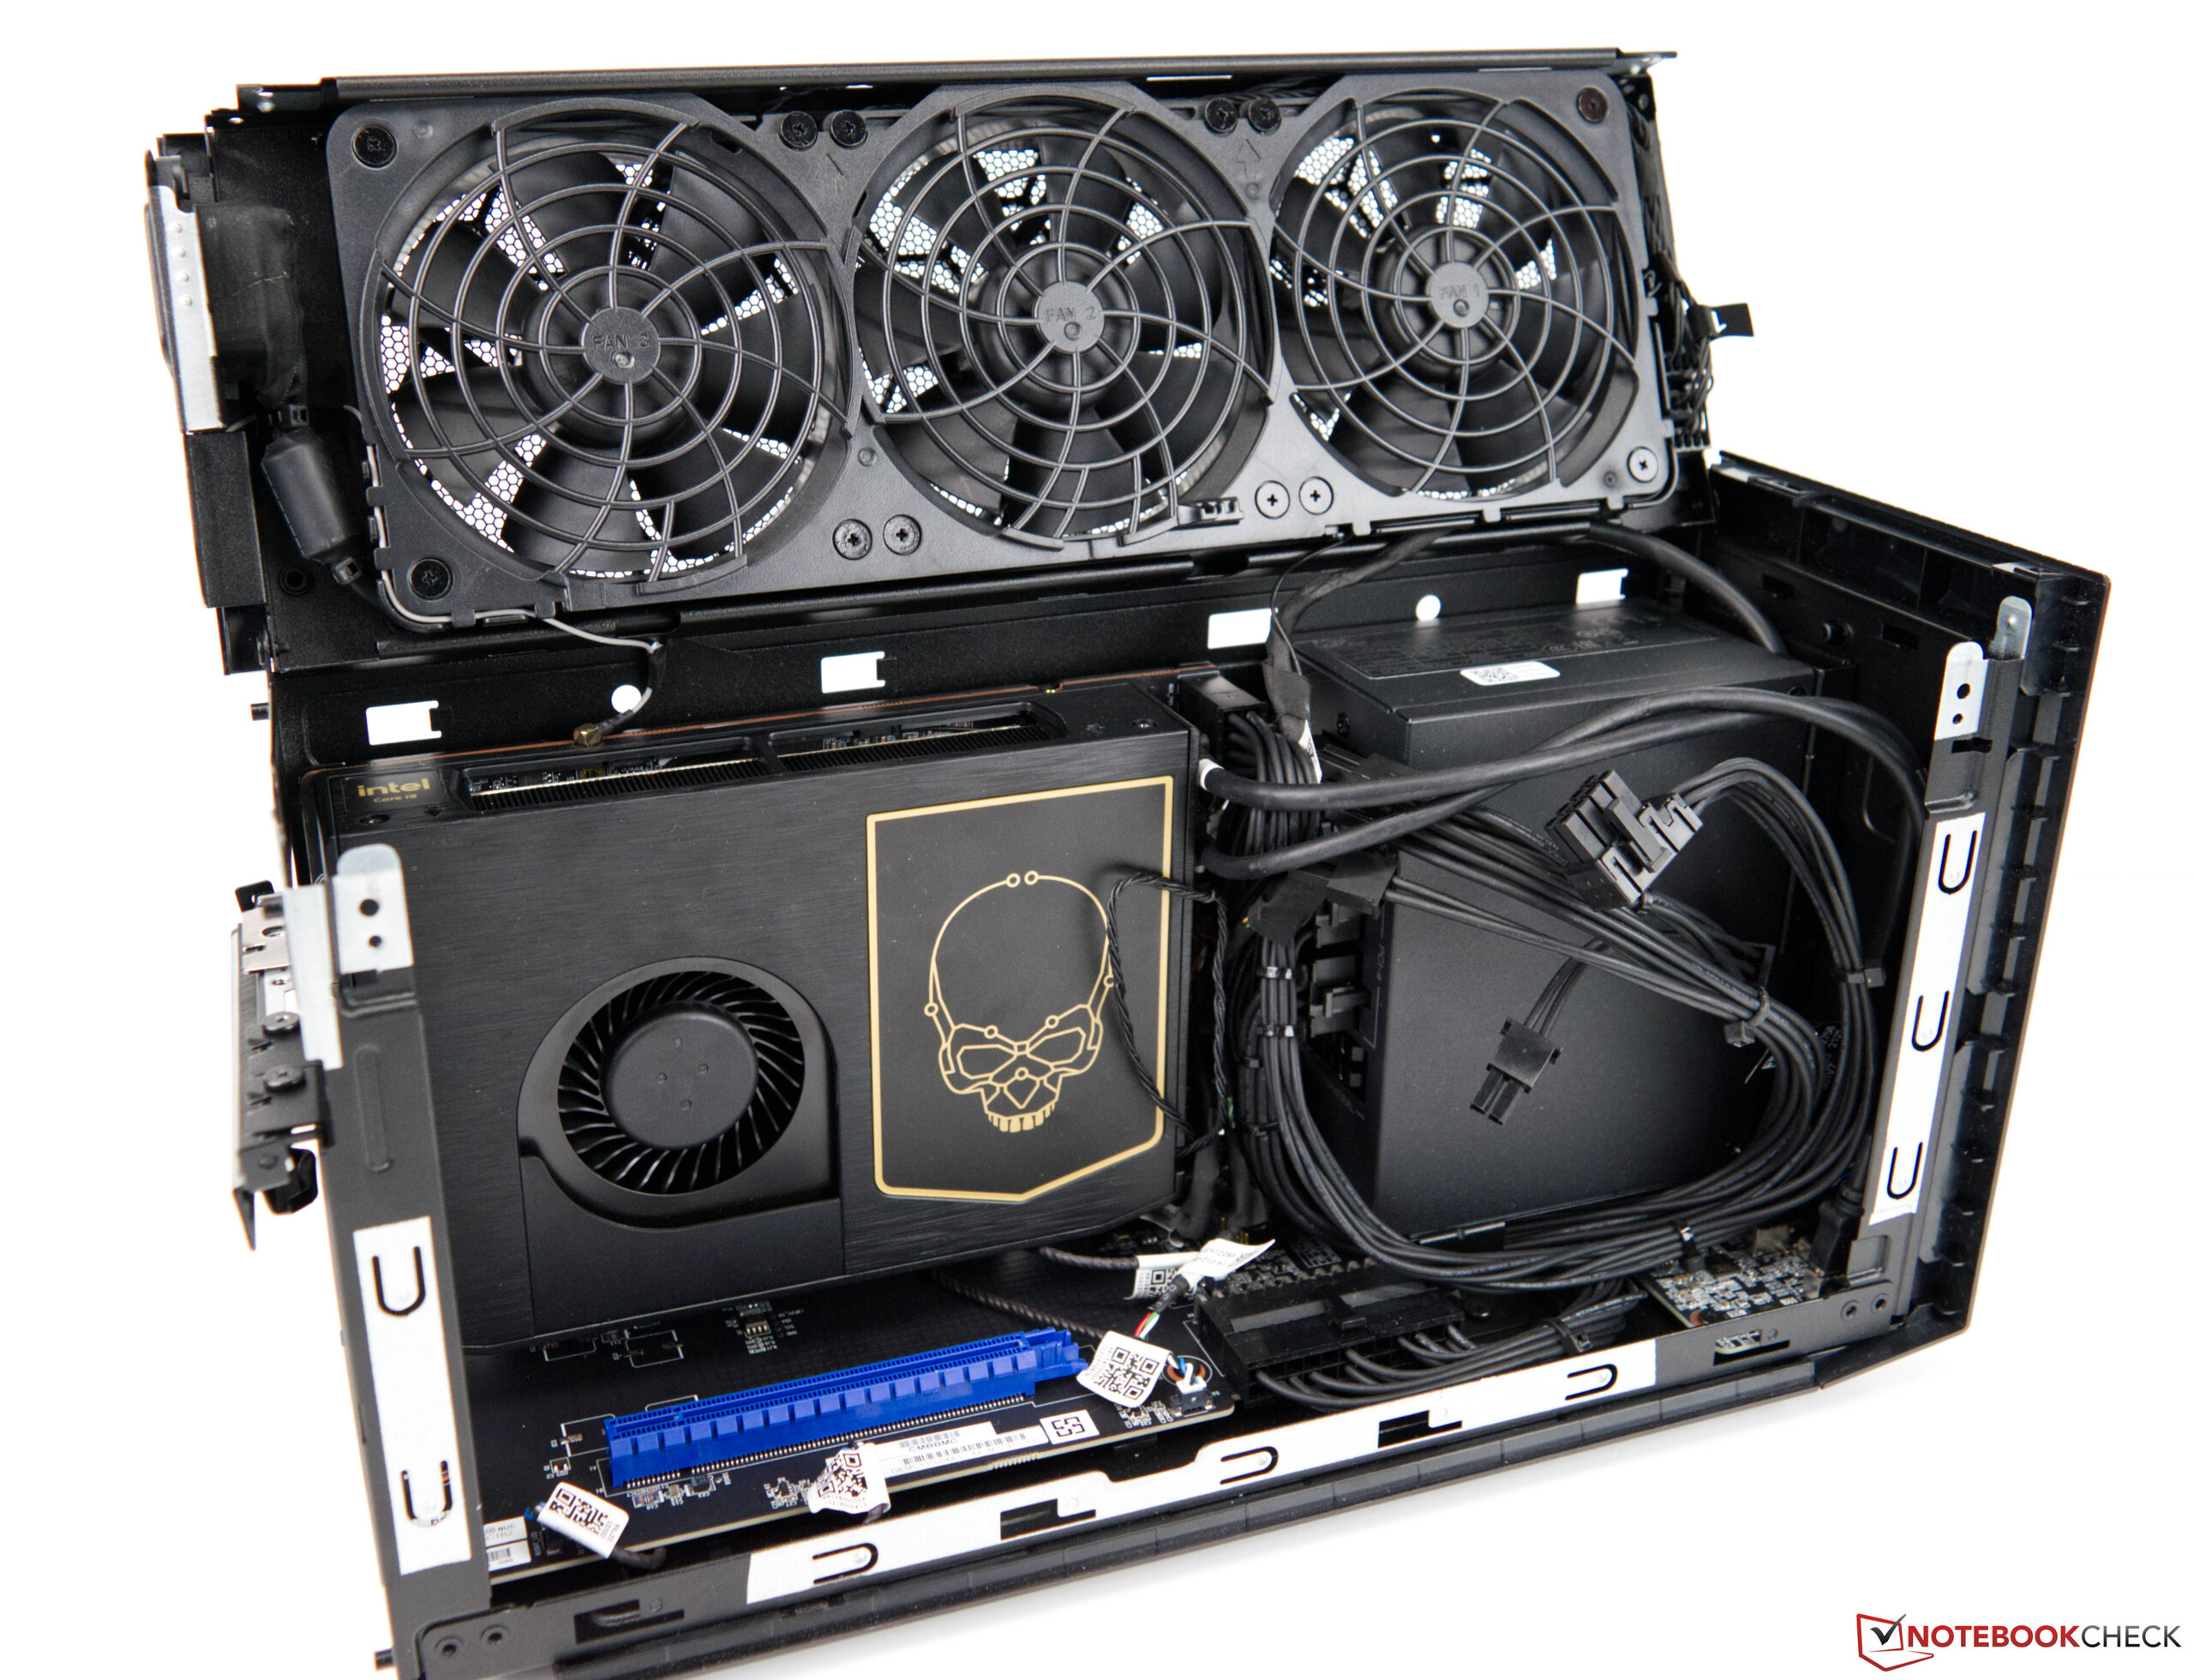
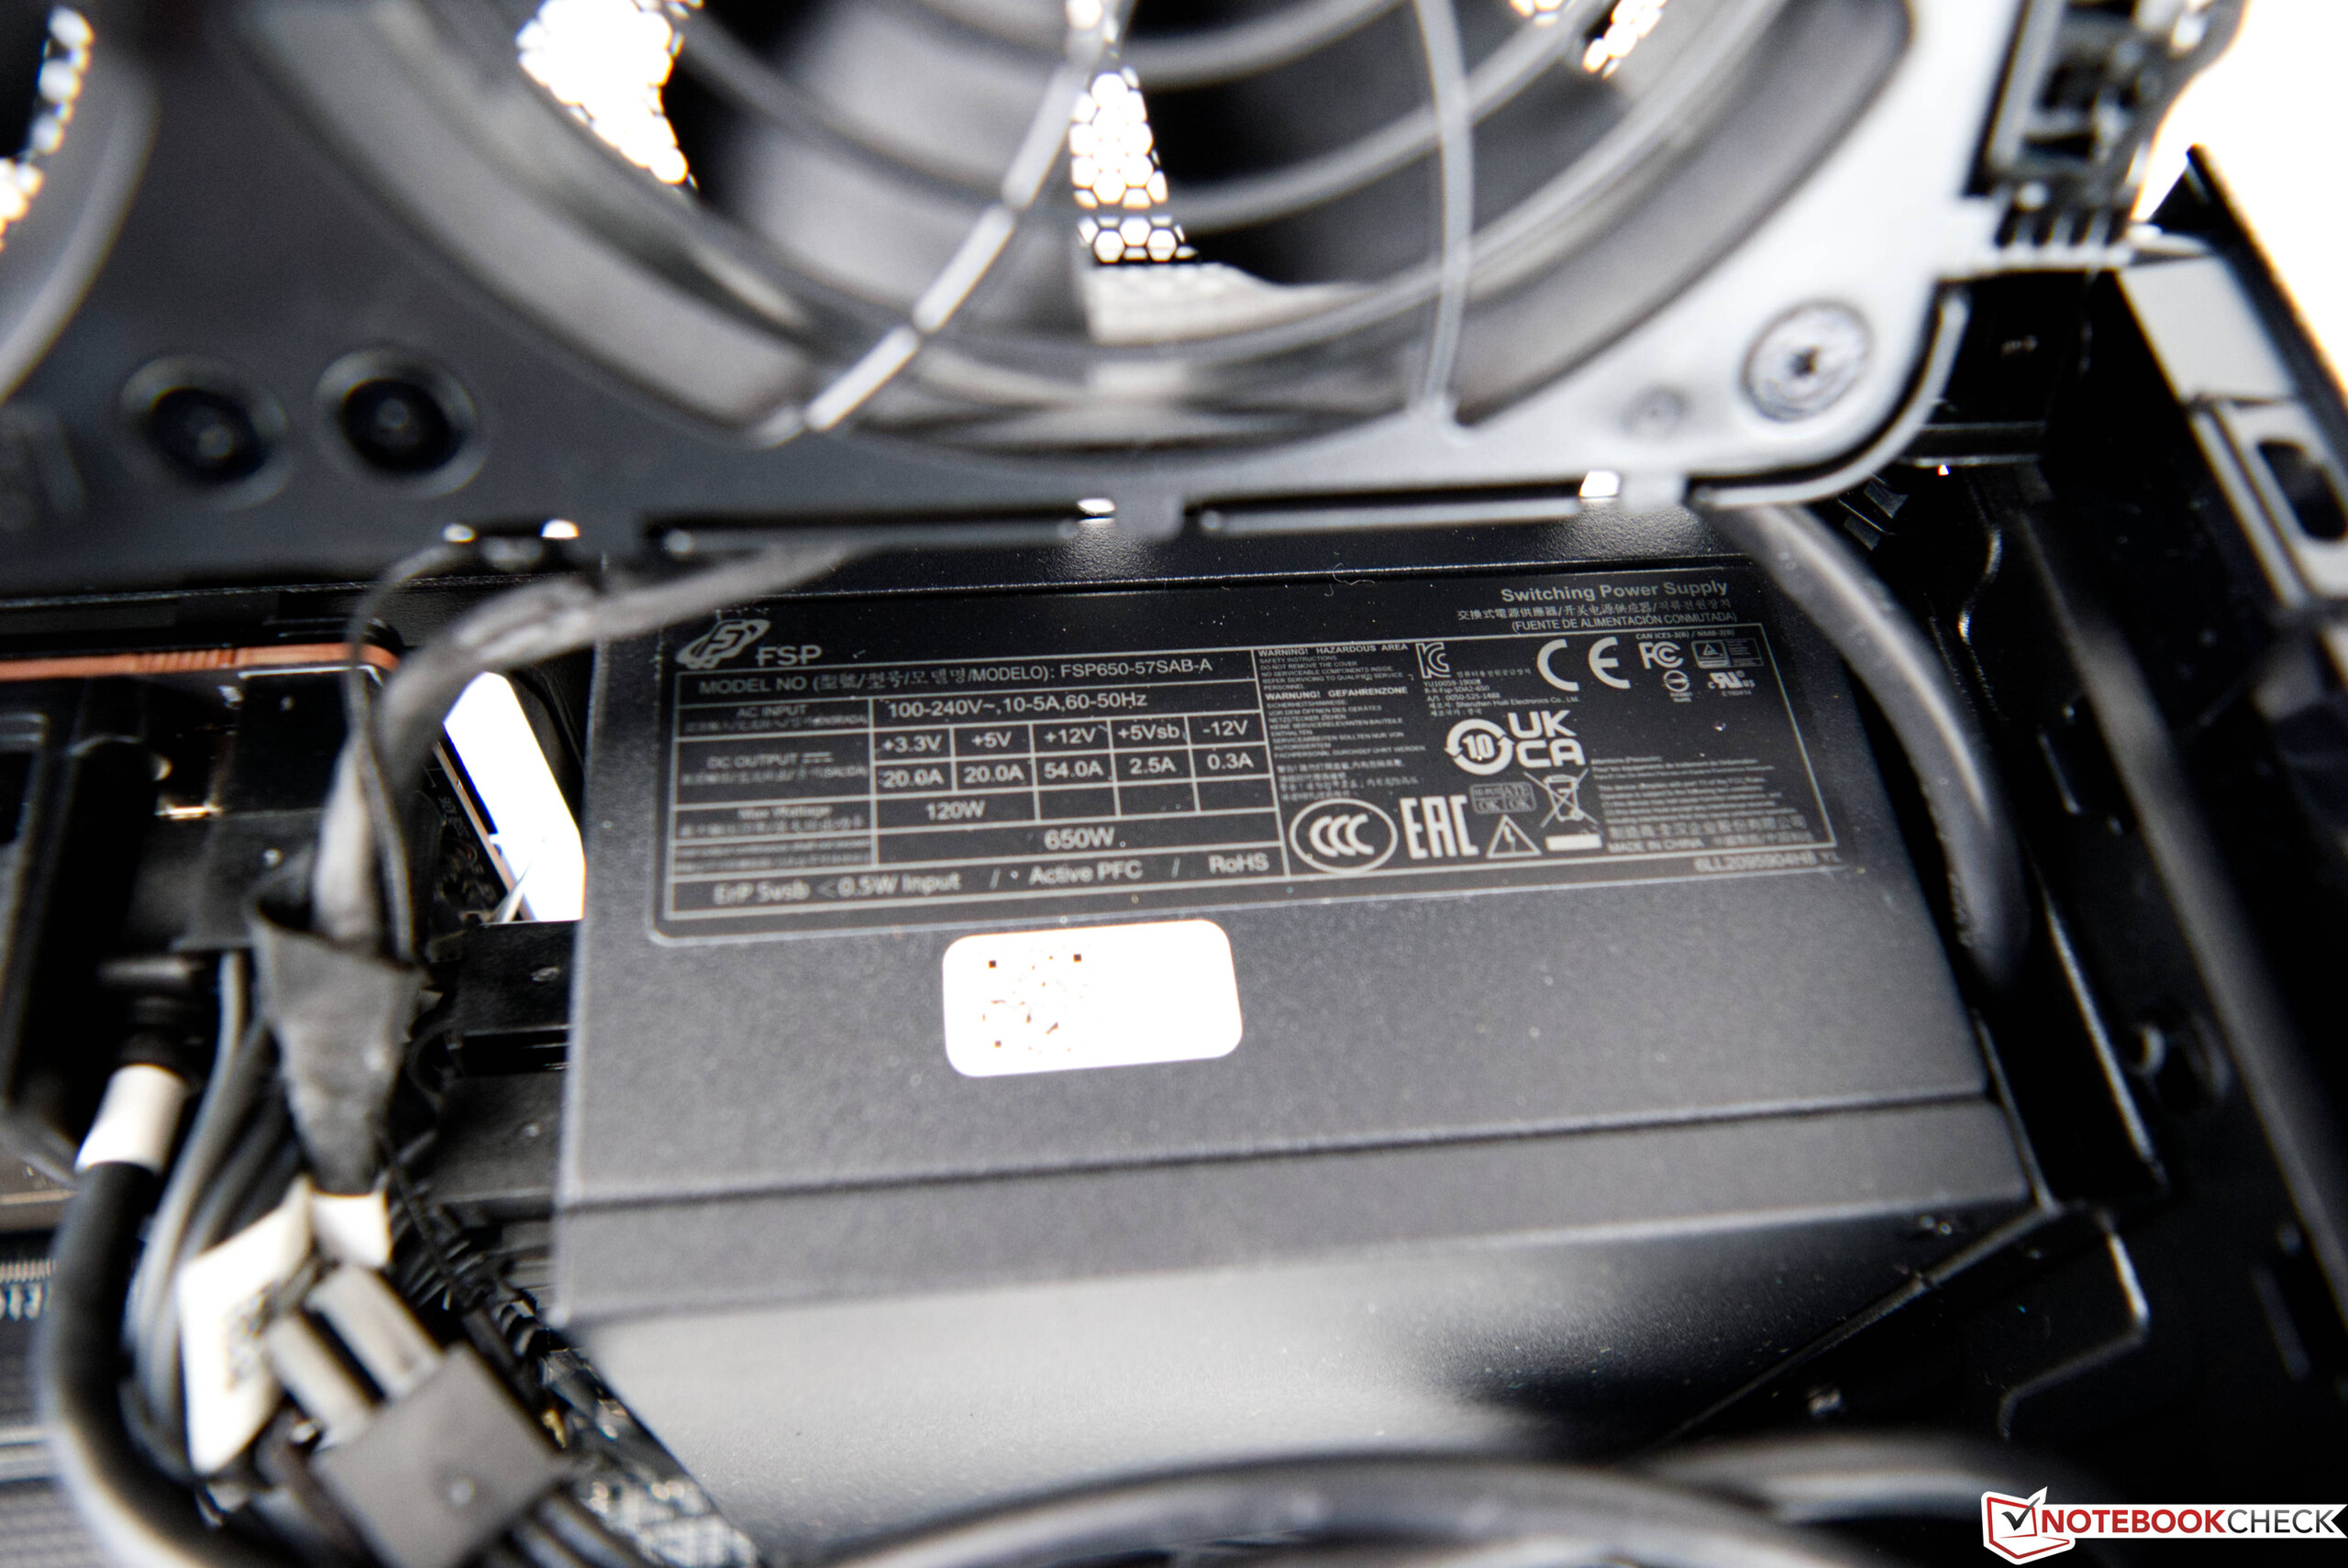
Als dedizierte Grafikkarten lassen sich Modelle mit einer Länge von maximal 30,5 Zentimetern einbauen. Das 650-Watt-SFX-Netzteil bietet genügend Leistung, um auch aktuelle High-End-Modelle zu befeuern. Die Kühlung der Pixelbeschleuniger sollten aber nicht mehr als zwei Slots einnehmen. Aktuell ist das Intel NUC 12 Extreme Kit für 1.450 Euro zu bekommen.

Intel Dragon Canyon NUC - RTX 3060
Prozessor
Intel Core i9-12900 16 x 2.4 - 5.1 GHz, 202 W PL2 / Short Burst, 65 W PL1 / Sustained, Alder Lake
Grafikkarte
NVIDIA GeForce RTX 3060 - 12 GB VRAM, Kerntakt: 1777 MHz, Speichertakt: 15000 MHz, GDDR6, Nvidia 511.79
Hauptspeicher
32 GB 
, DDR4-3200
Mainboard
Intel Z690 (Alder Lake-S PCH)
Massenspeicher
Transcend M.2 SSD 2200S TS512GMTE220S, 512 GB 
Anschlüsse
1 USB 2.0, 10 USB 3.1 Gen2, 2 Thunderbolt, 1 HDMI, 1 DisplayPort, Card Reader: SDXC with UHS-II support
Netzwerk
Aquantia AQtion 10Gbit Network Adapter (10/100/1000/2500/5000/10000MBit/s), Intel Wi-Fi 6E AX211 (a/b/g/h/n = Wi-Fi 4/ac = Wi-Fi 5/ax = Wi-Fi 6/ Wi-Fi 6E 6 GHz), Bluetooth 5.2
Abmessungen
Höhe x Breite x Tiefe (in mm): 189 x 120 x 357
Sonstiges
36 Monate Garantie
Preis
0 Euro
Hinweis: Der Hersteller kann abweichende Bauteile wie Bildschirme, Laufwerke und Speicherriegel mit ähnlichen Spezifikationen unter dem gleichen Modellnamen einsetzen.


Intel NUC 12 Extreme Kit Dragon Canyon
SO-DIMM 32-GB-DDR4-3200
Transcend 512 GB NVME-SSD

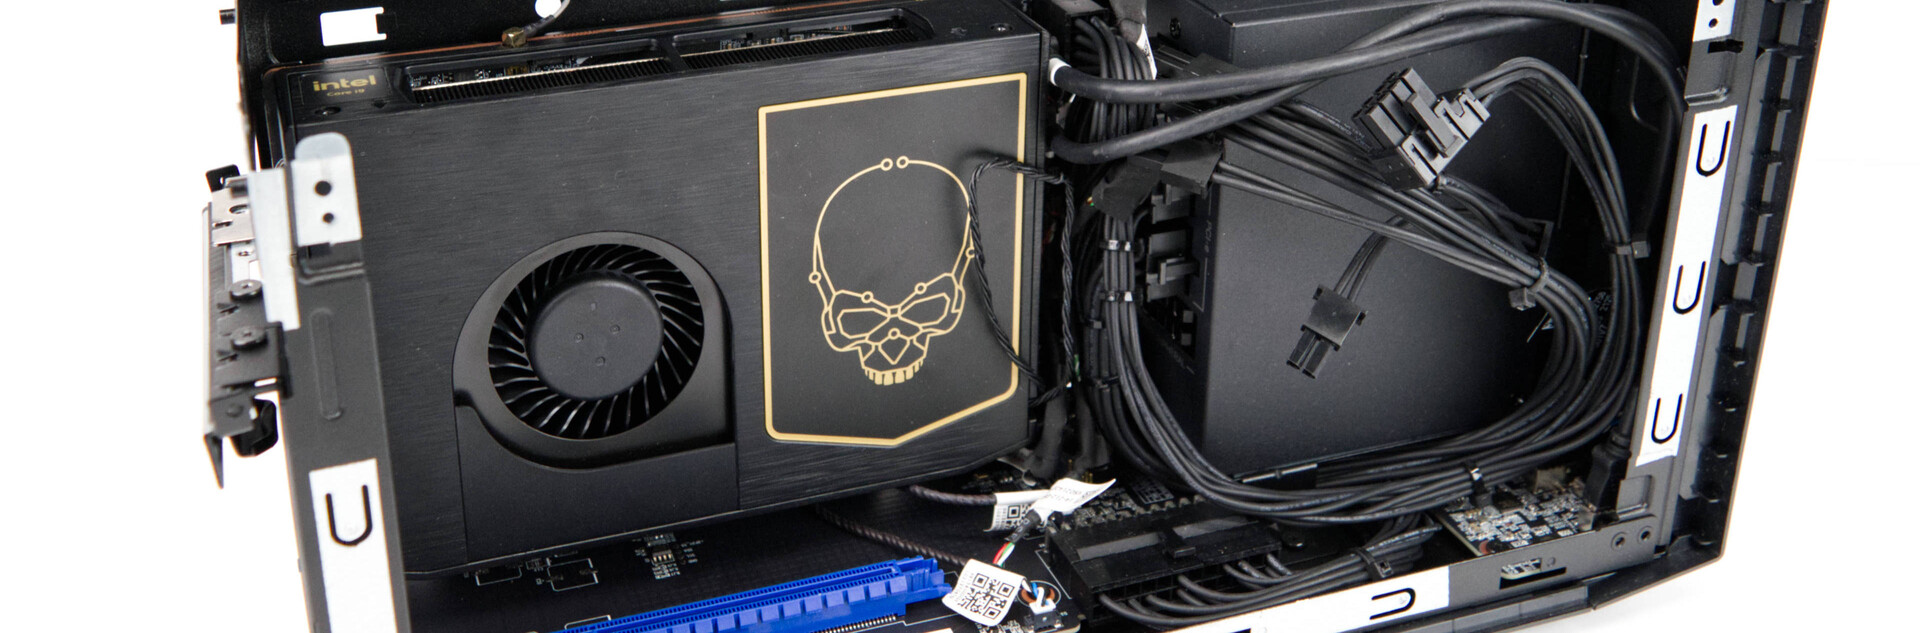
Intel NUC 12 Extreme Compute-Element im Detail

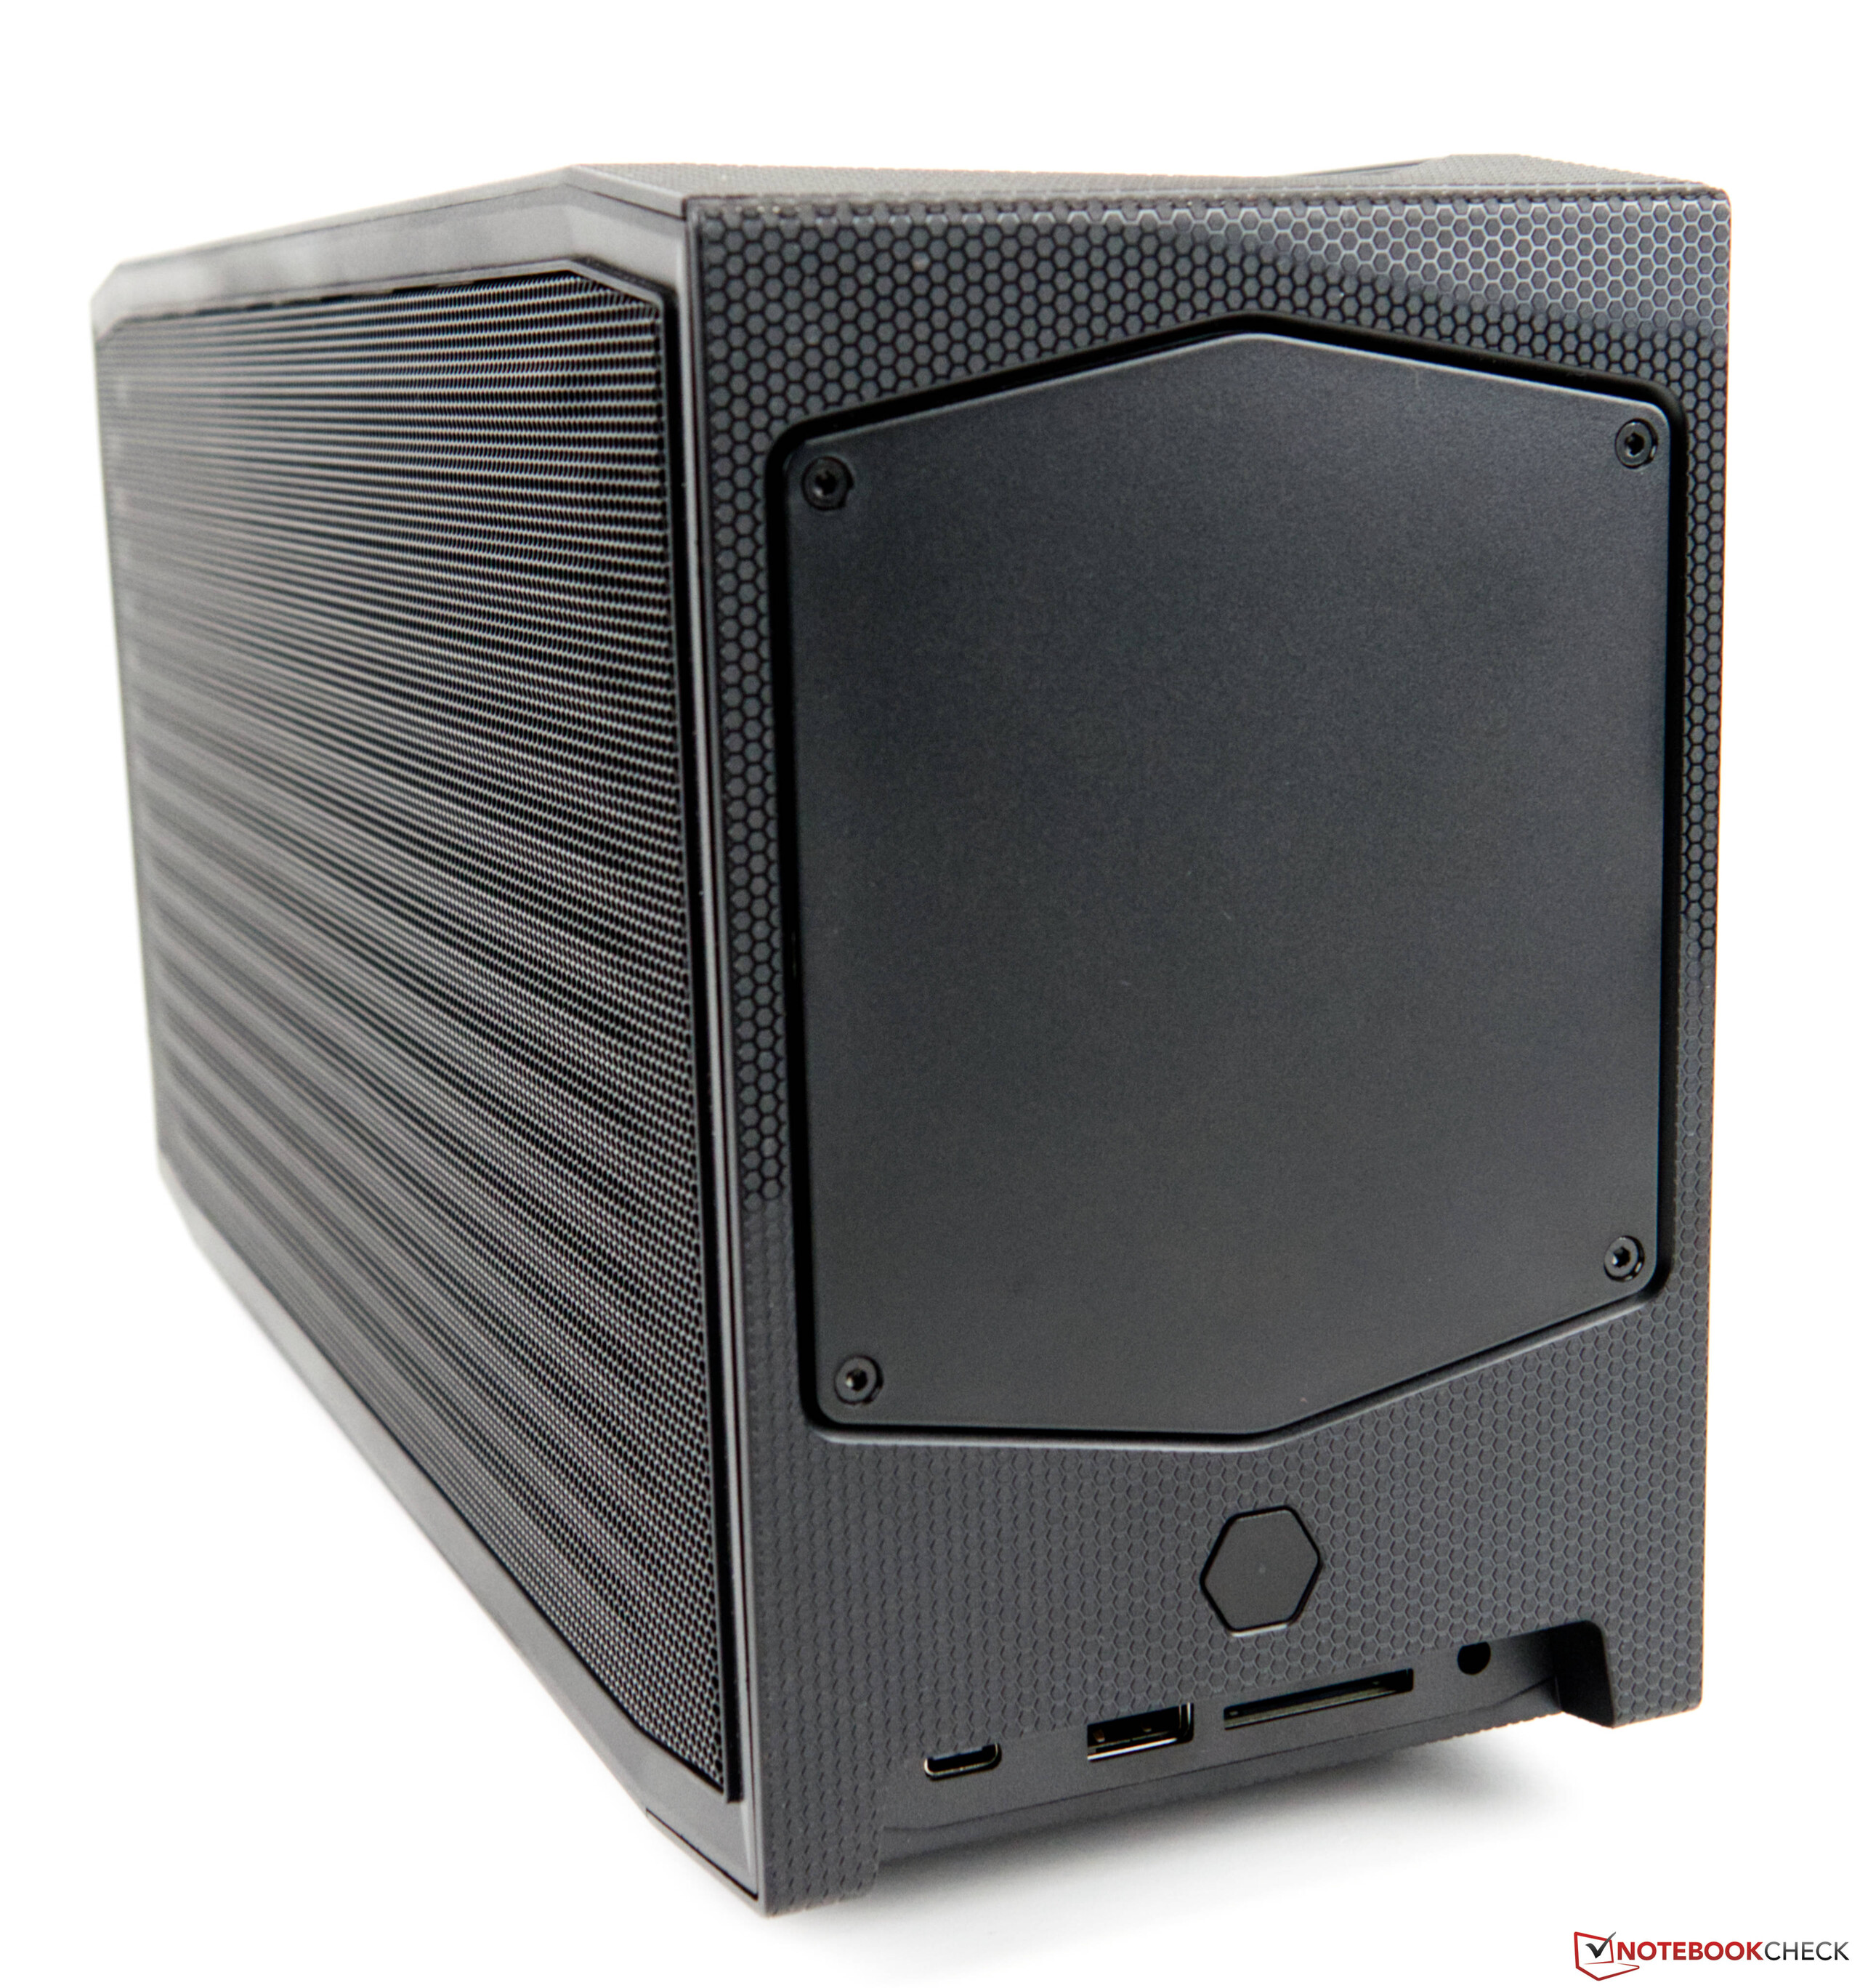
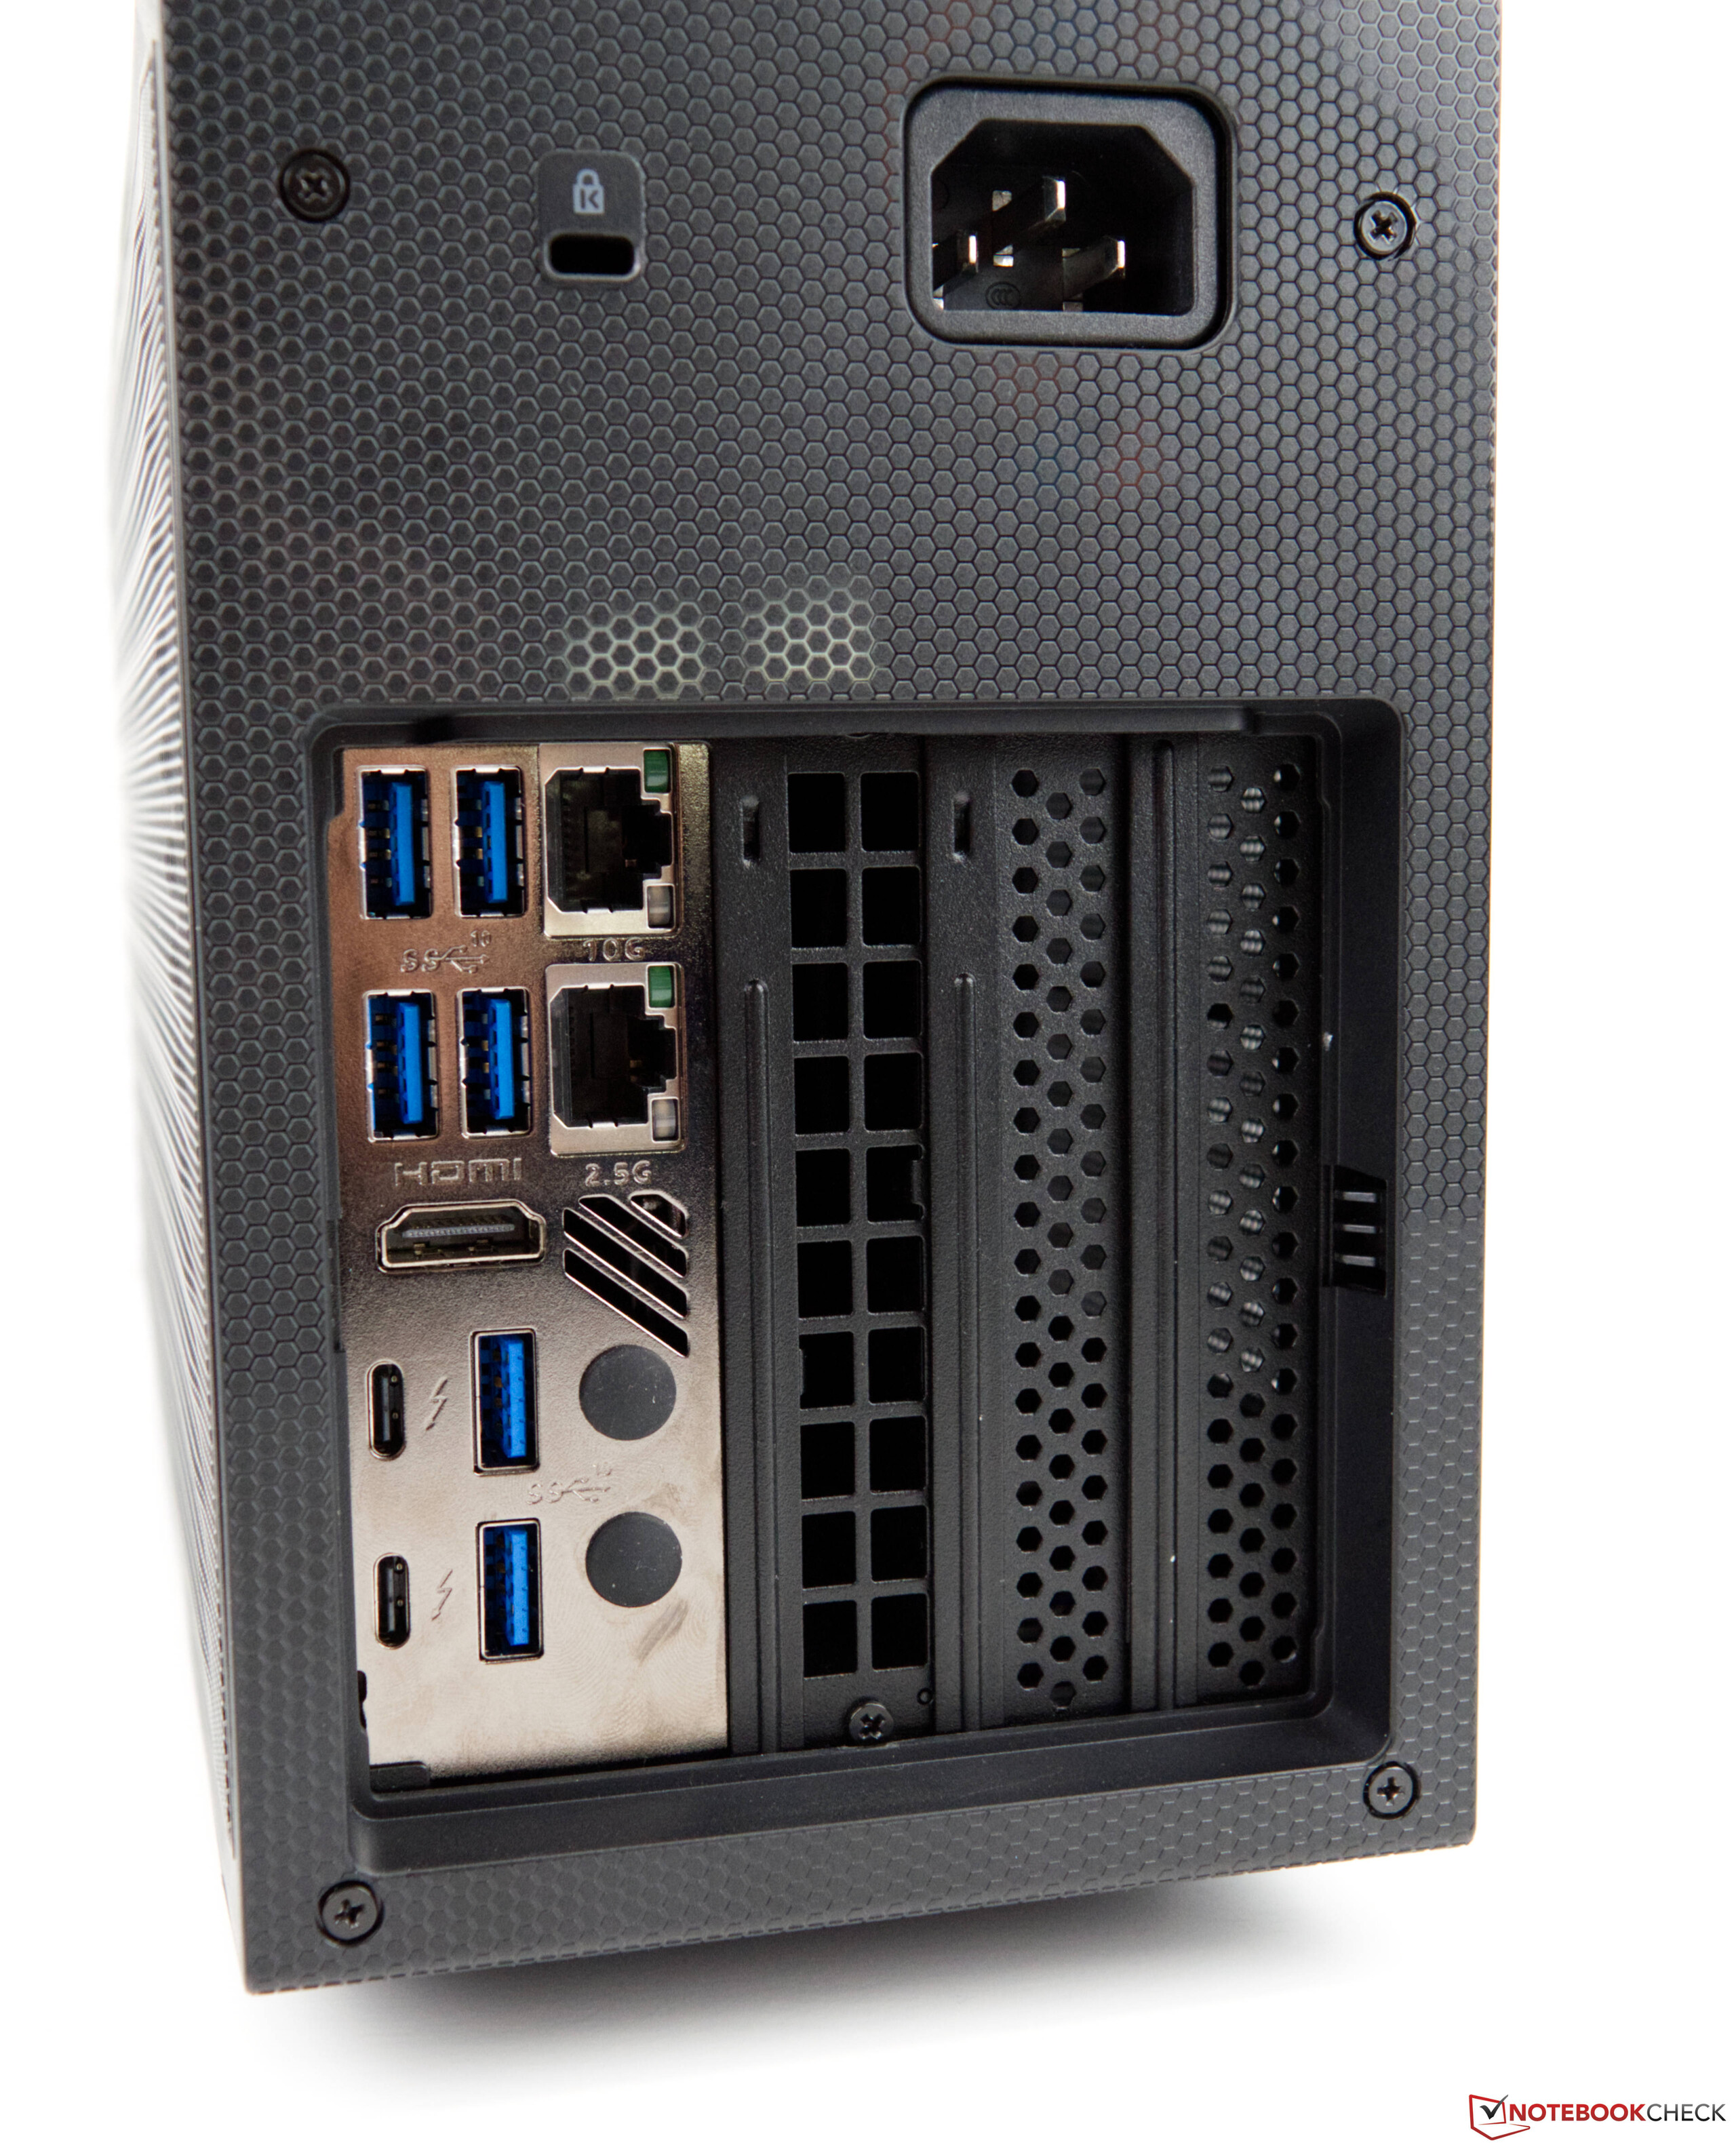
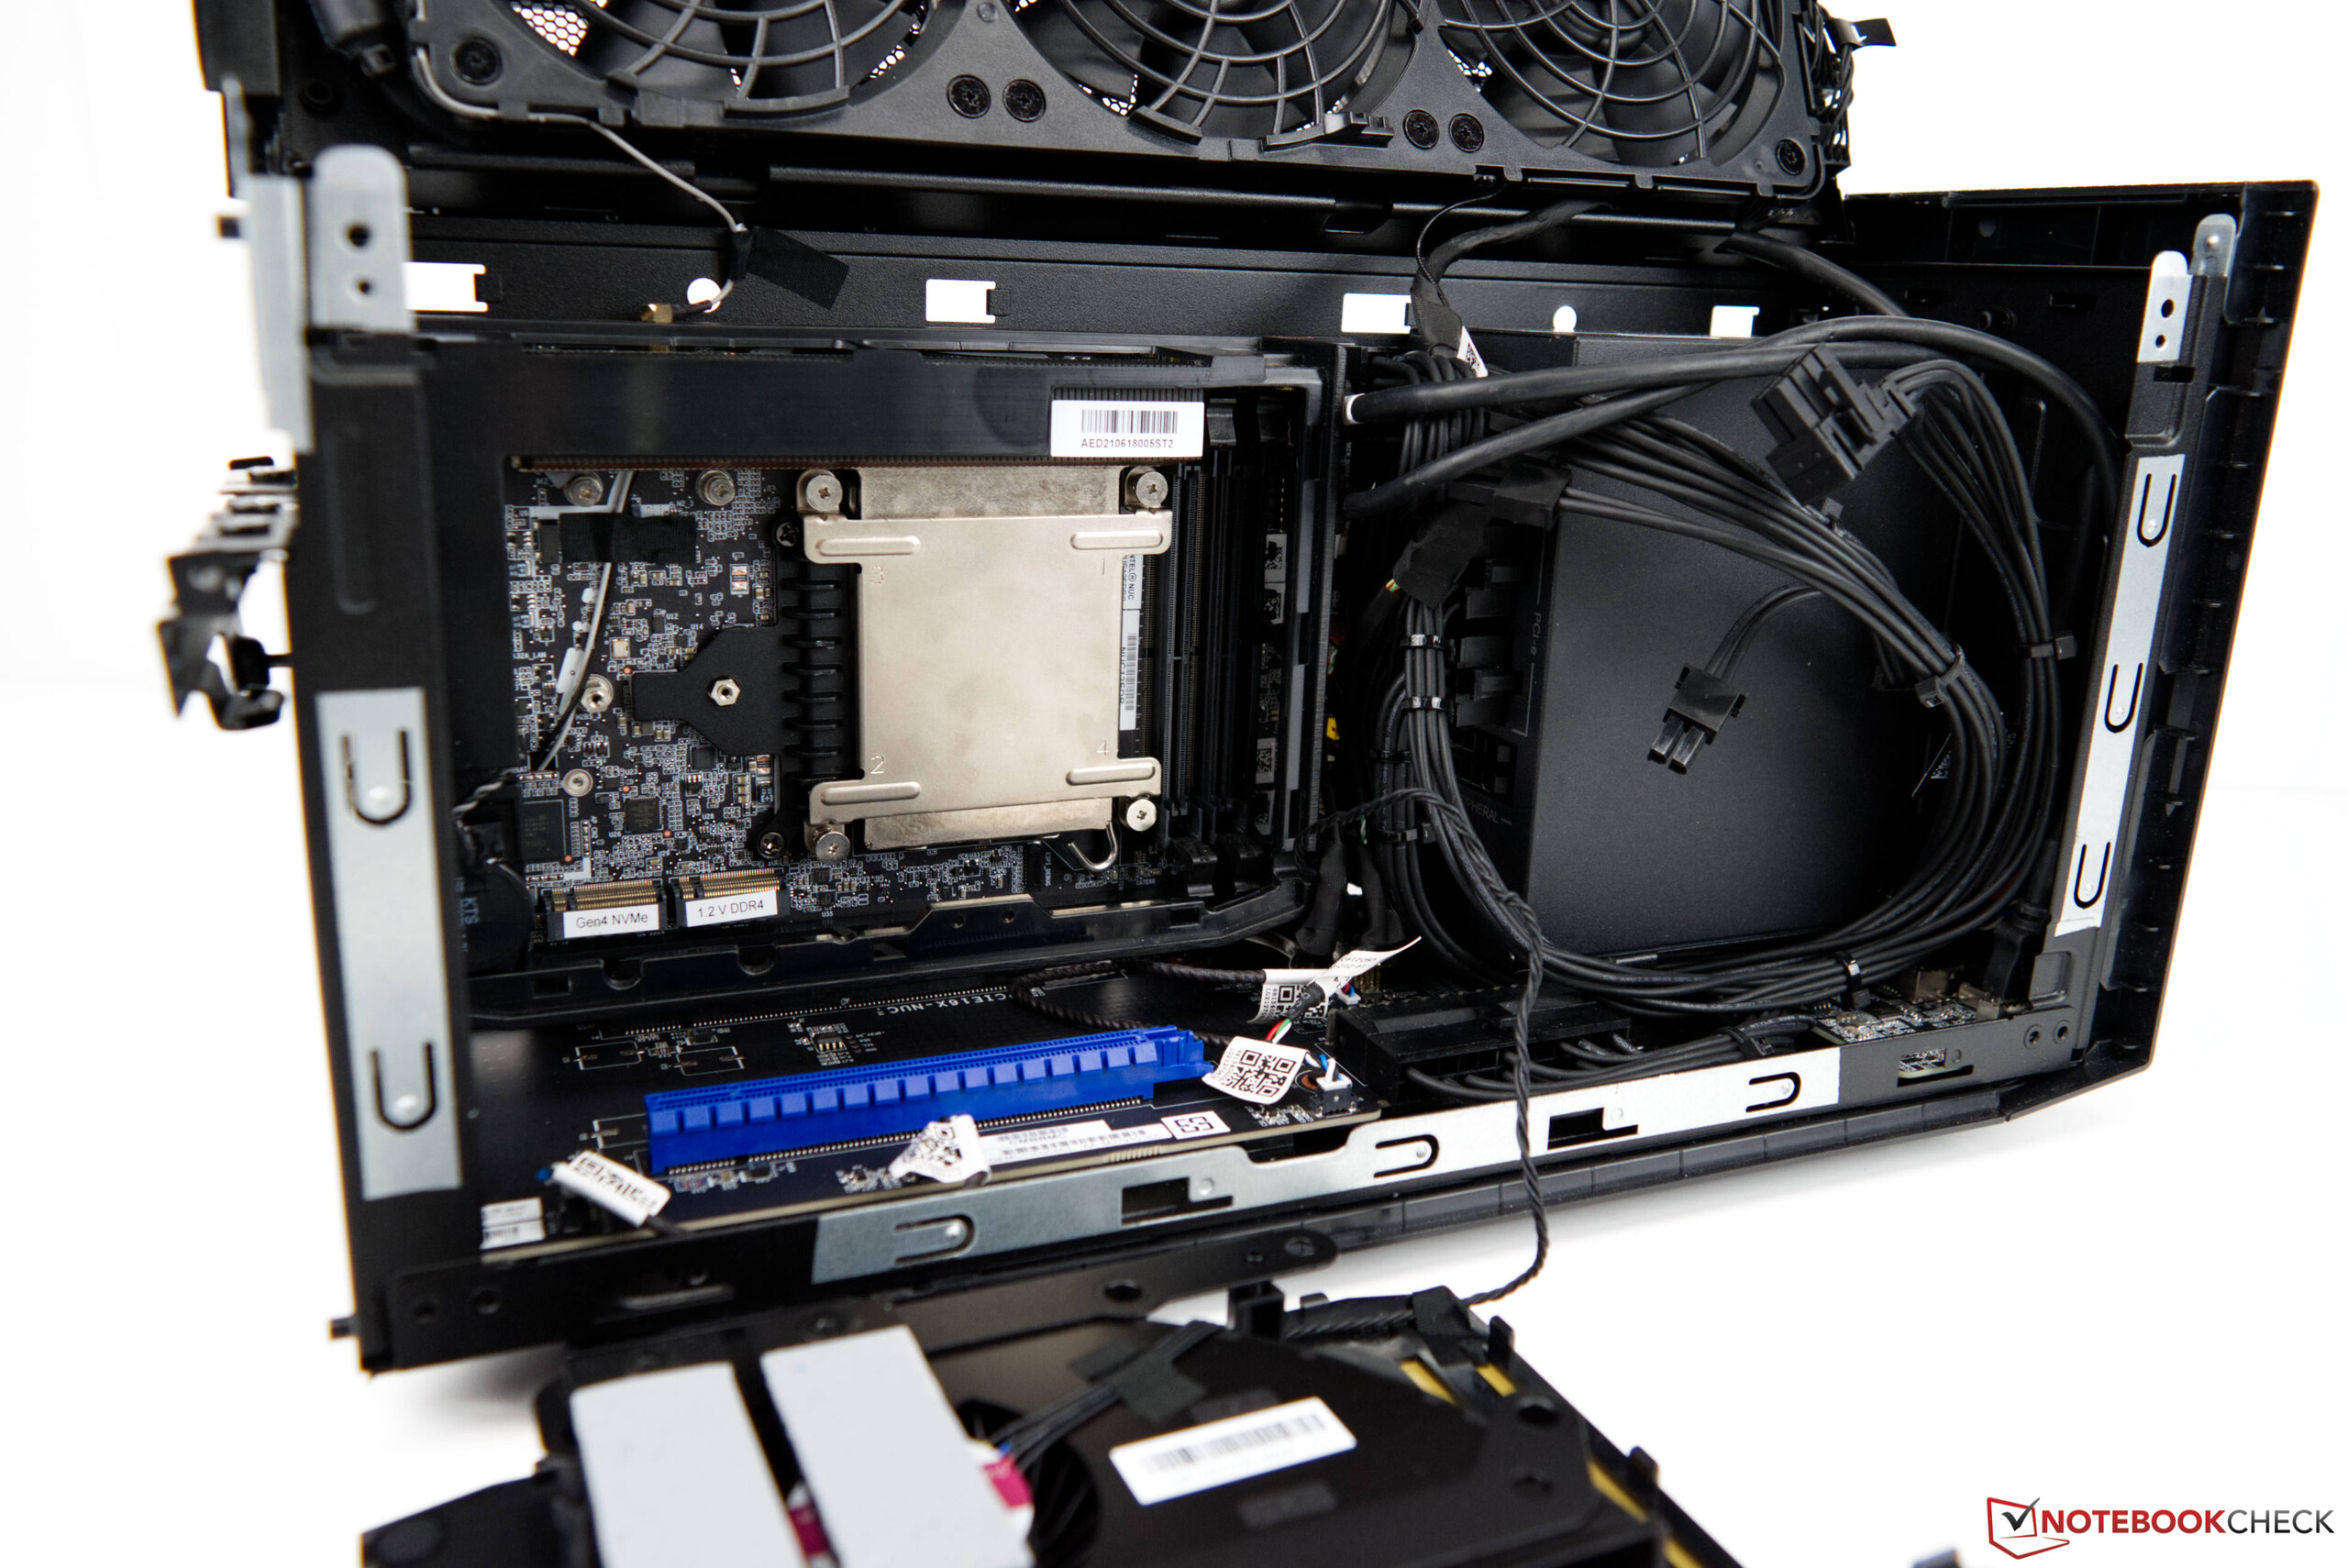
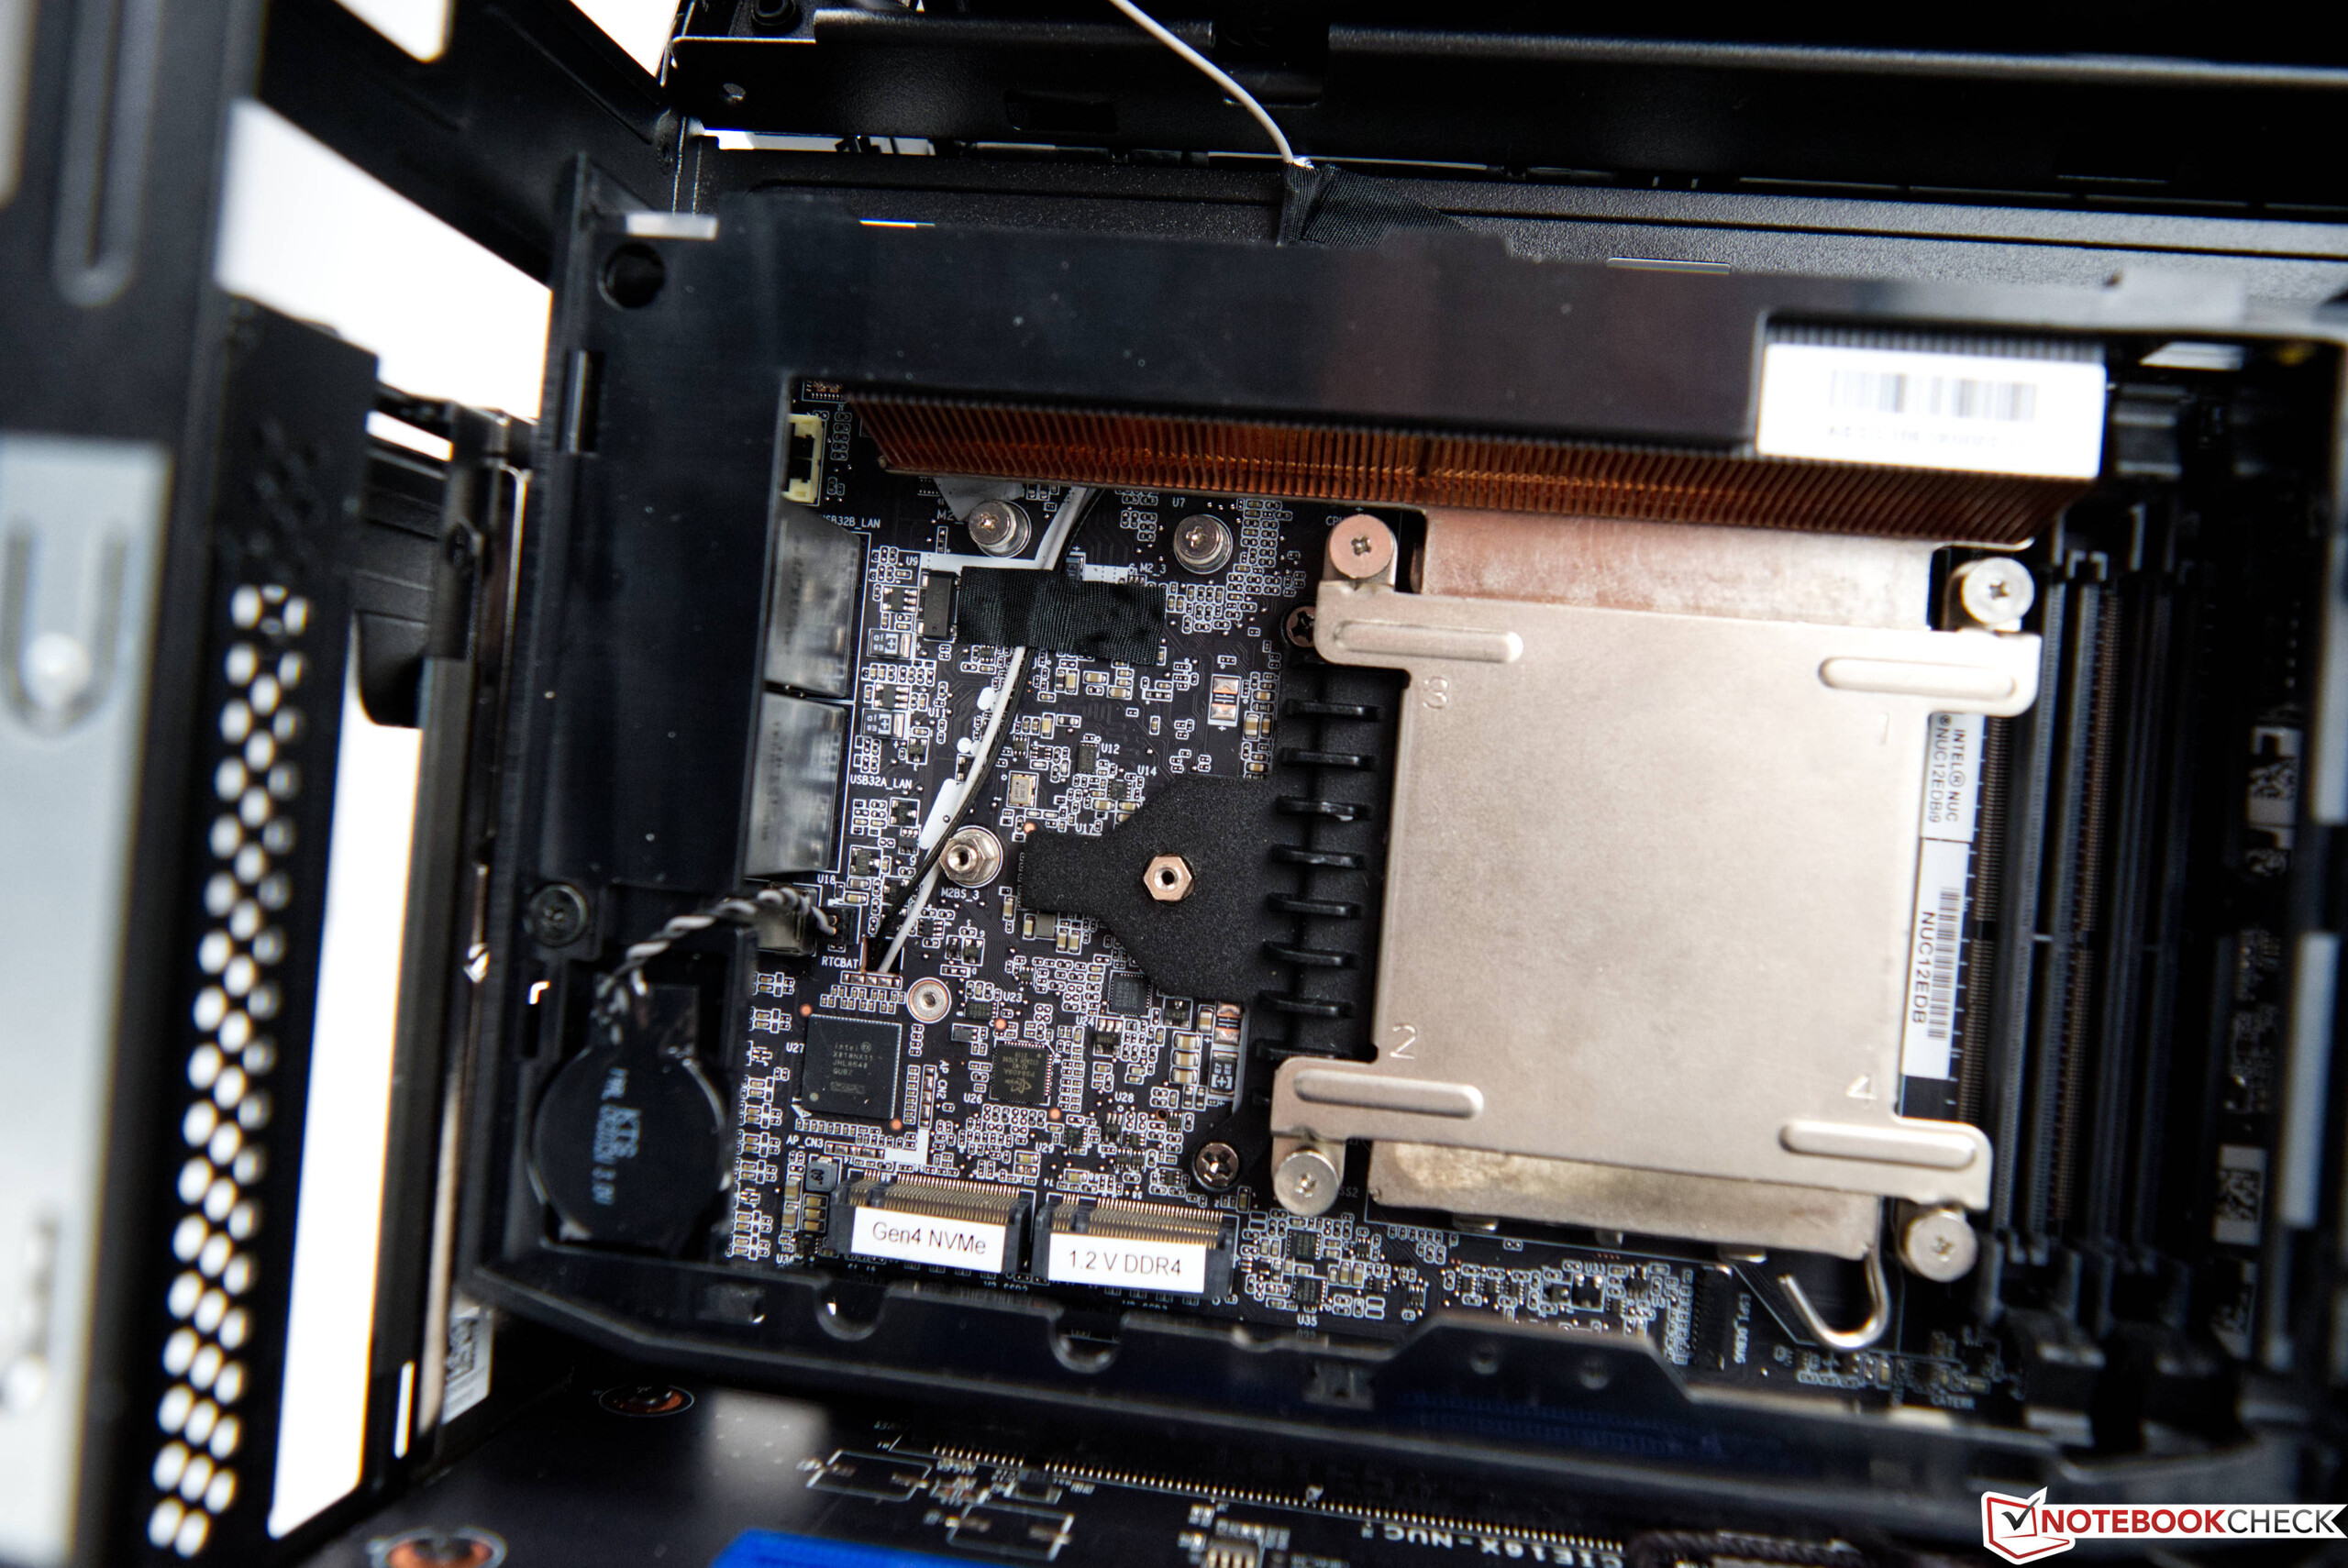
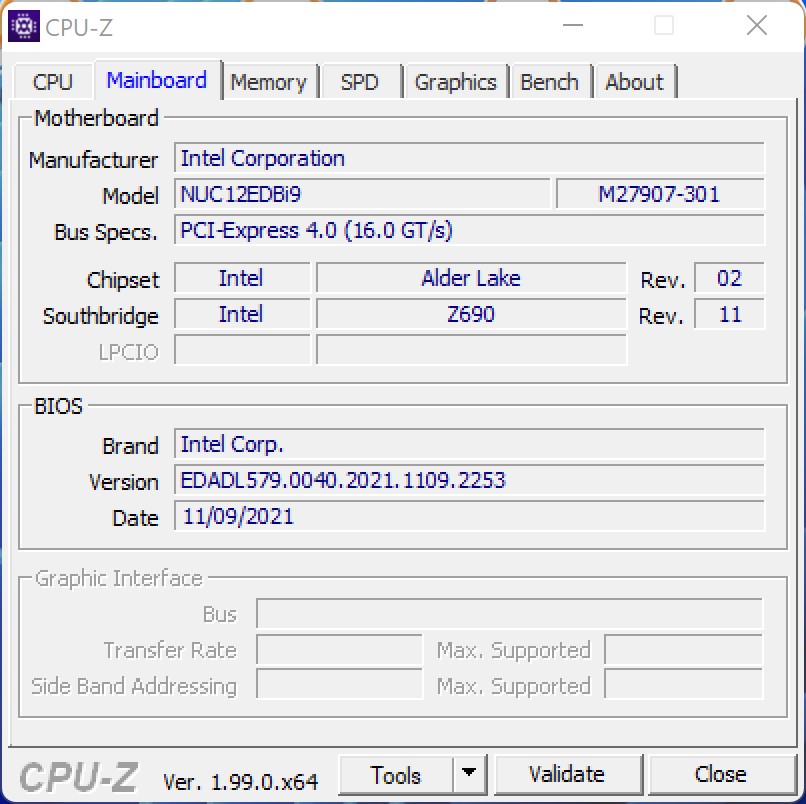
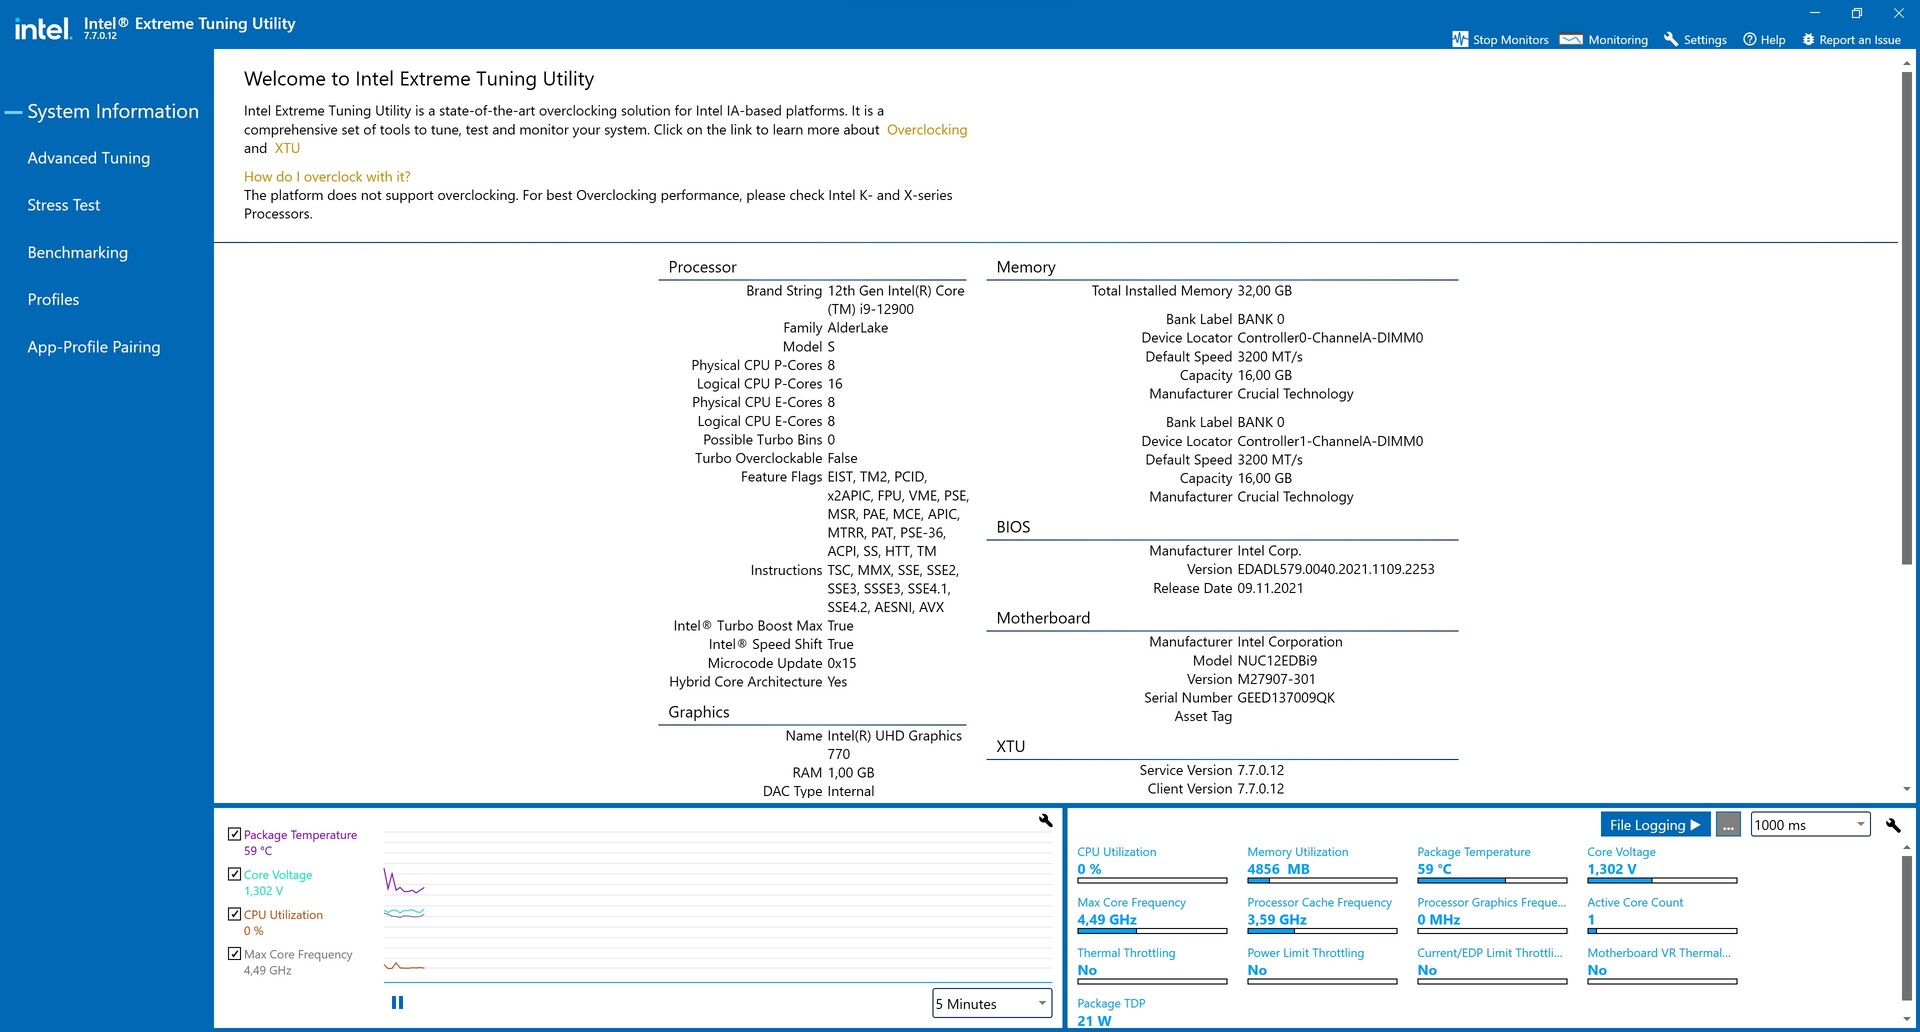
Der Intel NUC 12 Extreme bietet mit dem Intel Core i9-12900 einen 16-Kern-SoC mit 24 Threads auf Basis der Alder-Lake-S-Serie. Wie bereits bekannt verwendet der Core i9-12900 einen Mix aus P- und E-Kernen. Anders als zuvor beim Intel NUC 11 Extreme Kit wird nunmehr ein vollwertiger Desktop-Prozessor eingesetzt. Weiterhin befinden sich alle externen Schnittstellen an dem Compute-Element, welches in bekannter Form einer PCI-Express-Steckkarte im System steckt. Auf der Rückseite gibt es 6x USB 3.1 Gen2 Typ-A und zwei USB-C-Anschlüsse inklusive Thunderbolt 4. Über HDMI oder Thunderbolt lassen sich bis zu drei Displays gleichzeitig betreiben. Beim Netzwerk gibt es 10G und 2.5G für Drahtverbindungen. Zudem funkt das Intel WiFi 6E AX211 mit dem neuesten Standard. Im Compute-Element selbst lassen sich zwei SO-DIMM-RAM-Module mit jeweils maximal 64 GB verbauen. Überdies finden hier noch zwei M.2 SSDs Platz.

WLAN-Performance

Beim WLAN-Test kann das Intel WiFi 6E AX211 im 6 GHz-Bereich in Verbindung mit unsrem Testrouter ASUS GT-AXE11000 sehr gute Werte erreichen. Beim Testaufbau waren notieren wie durchschnittlich gut 1.850 MBit/s beim Senden und Empfangen von Daten. 

Networking
iperf3 transmit AXE11000 6GHz
Intel Dragon Canyon NUC - RTX 3060
Intel Wi-Fi 6E AX211
1851 (1799min - 1897max) MBit/s
Durchschnitt der Klasse
  (229 - 1961, n=397)
1387 MBit/s -25%
Durchschnittliche Intel Wi-Fi 6E AX211
  (632 - 1851, n=173)
1371 MBit/s -26%
Minisforum EliteMini TH50
MediaTek MT7921
866 (502min - 950max) MBit/s -53%
iperf3 receive AXE11000 6GHz
Intel Dragon Canyon NUC - RTX 3060
Intel Wi-Fi 6E AX211
1848 (1731min - 1888max) MBit/s
Durchschnittliche Intel Wi-Fi 6E AX211
  (883 - 1857, n=172)
1489 MBit/s -19%
Durchschnitt der Klasse
  (390 - 1858, n=398)
1435 MBit/s -22%
Minisforum EliteMini TH50
MediaTek MT7921
776 (482min - 881max) MBit/s -58%
iperf3 receive AX12
MSI Vector GP66 12UGS
Intel Wi-Fi 6E AX211
1462 (1366min - 1531max) MBit/s
Durchschnittliche Intel Wi-Fi 6E AX211
  (1178 - 1623, n=4)
1409 MBit/s
Alienware x14 i7 RTX 3060
Intel Wi-Fi 6E AX211
1371 (1221min - 1483max) MBit/s
Durchschnitt der Klasse
  (5 - 2374, n=2624)
621 MBit/s
iperf3 transmit AX12
MSI Vector GP66 12UGS
Intel Wi-Fi 6E AX211
1501 (755min - 1562max) MBit/s
Alienware x14 i7 RTX 3060
Intel Wi-Fi 6E AX211
1410 (1239min - 1603max) MBit/s
Durchschnittliche Intel Wi-Fi 6E AX211
  (1003 - 1501, n=4)
1320 MBit/s
Durchschnitt der Klasse
  (5.59 - 2371, n=2621)
587 MBit/s

Prozessor Benchmarks

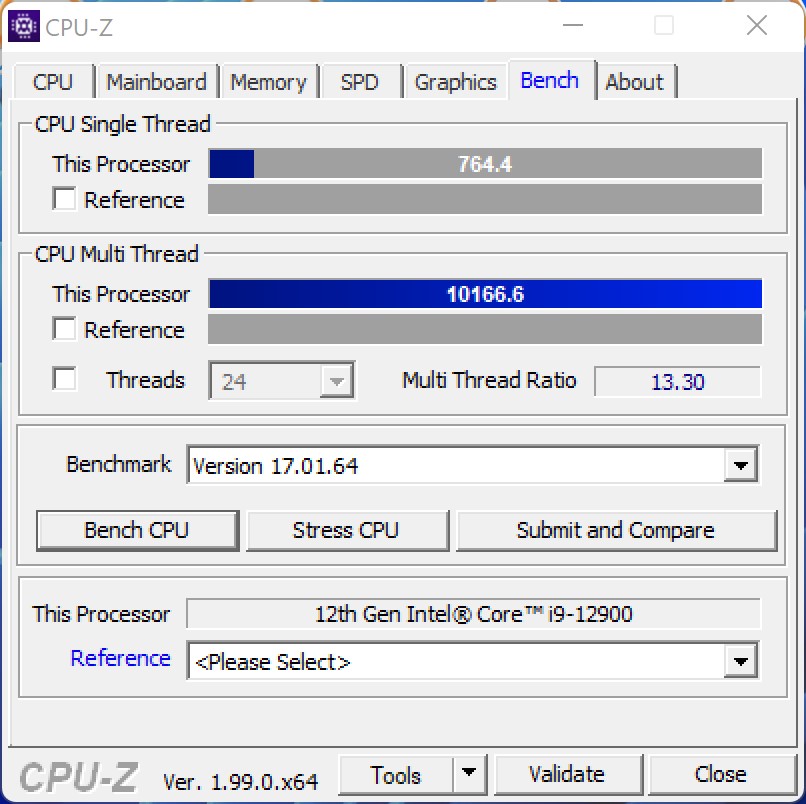
Bei dem Intel Core i9-12900 handelt es sich um ein Desktop-Modell der aktuellen Alder-Lake-S-Serie. Die Leistungsaufnahme beträgt beim PL1 65 Watt und kann bis auf 202 Watt gesteigert werden, was das PL2 ergibt.

Im Test zeigt der Intel Core i9-12900 seine Klasse und übertrifft die Leistung des Intel Core i9-11900KB um 15 Prozent, wenn wir uns einmal das Ergebnis über alle Benchmarks hinweg anschauen (Performance Rating). Gegenüber herkömmlichen Desktop-Systemen kann es der Intel Core i9-12900 im Intel NUC 12 Extreme Kit auch mit einem AMD Ryzen 7 5800X oder einem Intel Core i9-11900K aufnehmen. Gegen den Intel Core i7-12700K muss sich unser der Dragon Canyon NUC aber geschlagen geben. Hier gibt es einen ersten Hinweis auf eine etwas gedrosselte Leistung aufgrund der sehr kleinen Kühlung des Systems. Dennoch ist der Rückstand überschaubar. Nur knapp 10 Prozent war der Intel Core i7-12700K seiner Zeit im Test schneller.

Für weitere Vergleiche und Benchmarks verweisen wir hier auf unsere CPU-Vergleichstabelle.

CPU-Z
CPU-Z
CPU-Z
CPU-Z
CPU-Z
CPU-Z
XTU
XTU - Benchmark
Performance Rating - Percent
Intel Core i9-12900K, NVIDIA Titan RTX
i9-12900K, 3200 MHz
63.4 pt
Intel Core i7-12700K, NVIDIA Titan RTX
i7-12700K, 2700 MHz
59.4 pt
Intel Core i9-12900, NVIDIA GeForce RTX 3060
i9-12900, 2400 MHz
54.3 pt
AMD Ryzen 7 5800X, NVIDIA Titan RTX
R7 5800X, 3800 MHz
54.2 pt
Intel Core i9-11900K, NVIDIA Titan RTX
i9-11900K, 3500 MHz
52.4 pt
AMD Ryzen 9 3950X, NVIDIA Titan RTX
R9 3950X, 3500 MHz
51.4 pt
Intel Core i9-10900K, NVIDIA Titan RTX
i9-10900K, 3700 MHz
50.9 pt
Intel Core i9-11900KB, NVIDIA GeForce RTX 3060
i9-11900KB, 3300 MHz
48.1 pt
Intel Core i5-11600K, NVIDIA Titan RTX
i5-11600K, 3900 MHz
47.7 pt
AMD Ryzen 7 3800XT, NVIDIA Titan RTX
R7 3800XT, 3900 MHz
46.9 pt
Intel Core i9-9980HK, NVIDIA GeForce RTX 2070 (Desktop)
i9-9980HK, 2400 MHz
43.7 pt
Intel Core i5-10600K, NVIDIA Titan RTX
i5-10600K, 4100 MHz
42.2 pt
Cinebench R15
CPU Single 64Bit
Intel Core i9-12900K, NVIDIA Titan RTX
i9-12900K, 3200 MHz
286 Points +9%
Intel Core i7-12700K, NVIDIA Titan RTX
i7-12700K, 2700 MHz
272 Points +4%
AMD Ryzen 7 5800X, NVIDIA Titan RTX
R7 5800X, 3800 MHz
266 Points +2%
Intel Core i9-11900K, NVIDIA Titan RTX
i9-11900K, 3500 MHz
262 Points 0%
Intel Core i9-12900, NVIDIA GeForce RTX 3060
i9-12900, 2400 MHz
262 Points
Intel Core i9-11900KB, NVIDIA GeForce RTX 3060
i9-11900KB, 3300 MHz
247 Points -6%
Intel Core i5-11600K, NVIDIA Titan RTX
i5-11600K, 3900 MHz
242 Points -8%
Intel Core i9-10900K, NVIDIA Titan RTX
i9-10900K, 3700 MHz
224 Points -15%
AMD Ryzen 7 3800XT, NVIDIA Titan RTX
R7 3800XT, 3900 MHz
219 Points -16%
Intel Core i9-9980HK, NVIDIA GeForce RTX 2070 (Desktop)
i9-9980HK, 2400 MHz
215 Points -18%
AMD Ryzen 9 3950X, NVIDIA Titan RTX
R9 3950X, 3500 MHz
209 Points -20%
Intel Core i5-10600K, NVIDIA Titan RTX
i5-10600K, 4100 MHz
205 Points -22%
CPU Multi 64Bit
Intel Core i9-12900K, NVIDIA Titan RTX
i9-12900K, 3200 MHz
4057 Points +23%
AMD Ryzen 9 3950X, NVIDIA Titan RTX
R9 3950X, 3500 MHz
4002 Points +21%
Intel Core i7-12700K, NVIDIA Titan RTX
i7-12700K, 2700 MHz
3325 Points +1%
Intel Core i9-12900, NVIDIA GeForce RTX 3060
i9-12900, 2400 MHz
3299 Points
Intel Core i9-10900K, NVIDIA Titan RTX
i9-10900K, 3700 MHz
2620 Points -21%
AMD Ryzen 7 5800X, NVIDIA Titan RTX
R7 5800X, 3800 MHz
2616 Points -21%
Intel Core i9-11900K, NVIDIA Titan RTX
i9-11900K, 3500 MHz
2436 Points -26%
AMD Ryzen 7 3800XT, NVIDIA Titan RTX
R7 3800XT, 3900 MHz
2230 Points -32%
Intel Core i9-11900KB, NVIDIA GeForce RTX 3060
i9-11900KB, 3300 MHz
2027 Points -39%
Intel Core i5-11600K, NVIDIA Titan RTX
i5-11600K, 3900 MHz
1738 Points -47%
Intel Core i9-9980HK, NVIDIA GeForce RTX 2070 (Desktop)
i9-9980HK, 2400 MHz
1607 Points -51%
Intel Core i5-10600K, NVIDIA Titan RTX
i5-10600K, 4100 MHz
1452 Points -56%
Cinebench R20
CPU (Single Core)
Intel Core i9-12900K, NVIDIA Titan RTX
i9-12900K, 3200 MHz
766 Points +9%
Intel Core i7-12700K, NVIDIA Titan RTX
i7-12700K, 2700 MHz
731 Points +4%
Intel Core i9-12900, NVIDIA GeForce RTX 3060
i9-12900, 2400 MHz
703 Points
Intel Core i9-11900K, NVIDIA Titan RTX
i9-11900K, 3500 MHz
647 Points -8%
Intel Core i9-11900KB, NVIDIA GeForce RTX 3060
i9-11900KB, 3300 MHz
629 Points -11%
AMD Ryzen 7 5800X, NVIDIA Titan RTX
R7 5800X, 3800 MHz
625 Points -11%
Intel Core i5-11600K, NVIDIA Titan RTX
i5-11600K, 3900 MHz
595 Points -15%
AMD Ryzen 7 3800XT, NVIDIA Titan RTX
R7 3800XT, 3900 MHz
544 Points -23%
Intel Core i9-10900K, NVIDIA Titan RTX
i9-10900K, 3700 MHz
532 Points -24%
AMD Ryzen 9 3950X, NVIDIA Titan RTX
R9 3950X, 3500 MHz
520 Points -26%
Intel Core i9-9980HK, NVIDIA GeForce RTX 2070 (Desktop)
i9-9980HK, 2400 MHz
504 Points -28%
Intel Core i5-10600K, NVIDIA Titan RTX
i5-10600K, 4100 MHz
464 Points -34%
CPU (Multi Core)
Intel Core i9-12900K, NVIDIA Titan RTX
i9-12900K, 3200 MHz
10240 Points +43%
AMD Ryzen 9 3950X, NVIDIA Titan RTX
R9 3950X, 3500 MHz
9075 Points +26%
Intel Core i7-12700K, NVIDIA Titan RTX
i7-12700K, 2700 MHz
8648 Points +20%
Intel Core i9-12900, NVIDIA GeForce RTX 3060
i9-12900, 2400 MHz
7179 Points
Intel Core i9-10900K, NVIDIA Titan RTX
i9-10900K, 3700 MHz
6381 Points -11%
AMD Ryzen 7 5800X, NVIDIA Titan RTX
R7 5800X, 3800 MHz
6068 Points -15%
Intel Core i9-11900K, NVIDIA Titan RTX
i9-11900K, 3500 MHz
5997 Points -16%
AMD Ryzen 7 3800XT, NVIDIA Titan RTX
R7 3800XT, 3900 MHz
5120 Points -29%
Intel Core i9-11900KB, NVIDIA GeForce RTX 3060
i9-11900KB, 3300 MHz
4644 Points -35%
Intel Core i5-11600K, NVIDIA Titan RTX
i5-11600K, 3900 MHz
4349 Points -39%
Intel Core i5-10600K, NVIDIA Titan RTX
i5-10600K, 4100 MHz
3443 Points -52%
Intel Core i9-9980HK, NVIDIA GeForce RTX 2070 (Desktop)
i9-9980HK, 2400 MHz
3357 Points -53%
Cinebench R11.5
CPU Single 64Bit
Intel Core i9-12900K, NVIDIA Titan RTX
i9-12900K, 3200 MHz
3.49 Points +10%
Intel Core i7-12700K, NVIDIA Titan RTX
i7-12700K, 2700 MHz
3.29 Points +4%
Intel Core i9-12900, NVIDIA GeForce RTX 3060
i9-12900, 2400 MHz
3.16 Points
Intel Core i9-11900K, NVIDIA Titan RTX
i9-11900K, 3500 MHz
3.1 Points -2%
AMD Ryzen 7 5800X, NVIDIA Titan RTX
R7 5800X, 3800 MHz
3.09 Points -2%
Intel Core i5-11600K, NVIDIA Titan RTX
i5-11600K, 3900 MHz
2.87 Points -9%
Intel Core i9-11900KB, NVIDIA GeForce RTX 3060
i9-11900KB, 3300 MHz
2.84 Points -10%
Intel Core i9-10900K, NVIDIA Titan RTX
i9-10900K, 3700 MHz
2.56 Points -19%
Intel Core i9-9980HK, NVIDIA GeForce RTX 2070 (Desktop)
i9-9980HK, 2400 MHz
2.4 Points -24%
AMD Ryzen 9 3950X, NVIDIA Titan RTX
R9 3950X, 3500 MHz
2.37 Points -25%
AMD Ryzen 7 3800XT, NVIDIA Titan RTX
R7 3800XT, 3900 MHz
2.36 Points -25%
Intel Core i5-10600K, NVIDIA Titan RTX
i5-10600K, 4100 MHz
2.19 Points -31%
CPU Multi 64Bit
Intel Core i9-12900K, NVIDIA Titan RTX
i9-12900K, 3200 MHz
47.06 Points +21%
AMD Ryzen 9 3950X, NVIDIA Titan RTX
R9 3950X, 3500 MHz
43.68 Points +12%
Intel Core i9-12900, NVIDIA GeForce RTX 3060
i9-12900, 2400 MHz
38.96 Points
Intel Core i7-12700K, NVIDIA Titan RTX
i7-12700K, 2700 MHz
38.38 Points -1%
AMD Ryzen 7 5800X, NVIDIA Titan RTX
R7 5800X, 3800 MHz
29.31 Points -25%
Intel Core i9-10900K, NVIDIA Titan RTX
i9-10900K, 3700 MHz
29.03 Points -25%
Intel Core i9-11900K, NVIDIA Titan RTX
i9-11900K, 3500 MHz
26.76 Points -31%
AMD Ryzen 7 3800XT, NVIDIA Titan RTX
R7 3800XT, 3900 MHz
24.18 Points -38%
Intel Core i9-11900KB, NVIDIA GeForce RTX 3060
i9-11900KB, 3300 MHz
22.07 Points -43%
Intel Core i5-11600K, NVIDIA Titan RTX
i5-11600K, 3900 MHz
19.32 Points -50%
Intel Core i9-9980HK, NVIDIA GeForce RTX 2070 (Desktop)
i9-9980HK, 2400 MHz
18.04 Points -54%
Intel Core i5-10600K, NVIDIA Titan RTX
i5-10600K, 4100 MHz
15.76 Points -60%
Cinebench R10
Rendering Single CPUs 64Bit
Intel Core i9-12900K, NVIDIA Titan RTX
i9-12900K, 3200 MHz
16144 Points +10%
Intel Core i7-12700K, NVIDIA Titan RTX
i7-12700K, 2700 MHz
15179 Points +4%
Intel Core i9-12900, NVIDIA GeForce RTX 3060
i9-12900, 2400 MHz
14610 Points
Intel Core i9-11900K, NVIDIA Titan RTX
i9-11900K, 3500 MHz
14149 Points -3%
AMD Ryzen 7 5800X, NVIDIA Titan RTX
R7 5800X, 3800 MHz
13039 Points -11%
Intel Core i5-11600K, NVIDIA Titan RTX
i5-11600K, 3900 MHz
12957 Points -11%
Intel Core i9-11900KB, NVIDIA GeForce RTX 3060
i9-11900KB, 3300 MHz
12508 Points -14%
Intel Core i9-10900K, NVIDIA Titan RTX
i9-10900K, 3700 MHz
10625 Points -27%
AMD Ryzen 9 3950X, NVIDIA Titan RTX
R9 3950X, 3500 MHz
10580 Points -28%
AMD Ryzen 7 3800XT, NVIDIA Titan RTX
R7 3800XT, 3900 MHz
10497 Points -28%
Intel Core i9-9980HK, NVIDIA GeForce RTX 2070 (Desktop)
i9-9980HK, 2400 MHz
10359 Points -29%
Intel Core i5-10600K, NVIDIA Titan RTX
i5-10600K, 4100 MHz
9594 Points -34%
Rendering Multiple CPUs 64Bit
Intel Core i9-12900K, NVIDIA Titan RTX
i9-12900K, 3200 MHz
112749 Points +5%
Intel Core i9-12900, NVIDIA GeForce RTX 3060
i9-12900, 2400 MHz
107565 Points
Intel Core i7-12700K, NVIDIA Titan RTX
i7-12700K, 2700 MHz
102539 Points -5%
AMD Ryzen 9 3950X, NVIDIA Titan RTX
R9 3950X, 3500 MHz
86232 Points -20%
AMD Ryzen 7 5800X, NVIDIA Titan RTX
R7 5800X, 3800 MHz
83426 Points -22%
Intel Core i9-11900K, NVIDIA Titan RTX
i9-11900K, 3500 MHz
80613 Points -25%
Intel Core i9-10900K, NVIDIA Titan RTX
i9-10900K, 3700 MHz
80495 Points -25%
AMD Ryzen 7 3800XT, NVIDIA Titan RTX
R7 3800XT, 3900 MHz
68388 Points -36%
Intel Core i9-11900KB, NVIDIA GeForce RTX 3060
i9-11900KB, 3300 MHz
67183 Points -38%
Intel Core i5-11600K, NVIDIA Titan RTX
i5-11600K, 3900 MHz
64663 Points -40%
Intel Core i9-9980HK, NVIDIA GeForce RTX 2070 (Desktop)
i9-9980HK, 2400 MHz
55742 Points -48%
Intel Core i5-10600K, NVIDIA Titan RTX
i5-10600K, 4100 MHz
51816 Points -52%
Blender - v2.79 BMW27 CPU
Intel Core i9-9980HK, NVIDIA GeForce RTX 2070 (Desktop)
i9-9980HK, 2400 MHz
317.4 Seconds * -21%
Intel Core i5-10600K, NVIDIA Titan RTX
i5-10600K, 4100 MHz
302.4 Seconds * -15%
Intel Core i5-11600K, NVIDIA Titan RTX
i5-11600K, 3900 MHz
264.5 Seconds * -1%
Intel Core i9-11900KB, NVIDIA GeForce RTX 3060
i9-11900KB, 3300 MHz
262.7 Seconds * -0%
Intel Core i9-12900, NVIDIA GeForce RTX 3060
i9-12900, 2400 MHz
262.7 Seconds *
AMD Ryzen 7 3800XT, NVIDIA Titan RTX
R7 3800XT, 3900 MHz
222.7 Seconds * +15%
AMD Ryzen 7 5800X, NVIDIA Titan RTX
R7 5800X, 3800 MHz
196.8 Seconds * +25%
Intel Core i9-11900K, NVIDIA Titan RTX
i9-11900K, 3500 MHz
190.3 Seconds * +28%
Intel Core i9-10900K, NVIDIA Titan RTX
i9-10900K, 3700 MHz
167.3 Seconds * +36%
Intel Core i7-12700K, NVIDIA Titan RTX
i7-12700K, 2700 MHz
152.3 Seconds * +42%
AMD Ryzen 9 3950X, NVIDIA Titan RTX
R9 3950X, 3500 MHz
125.8 Seconds * +52%
Intel Core i9-12900K, NVIDIA Titan RTX
i9-12900K, 3200 MHz
121.1 Seconds * +54%
wPrime 2.10
32m
Intel Core i9-12900K, NVIDIA Titan RTX
i9-12900K, 3200 MHz
4.924 s * -84%
Intel Core i5-11600K, NVIDIA Titan RTX
i5-11600K, 3900 MHz
4.919 s * -84%
Intel Core i5-10600K, NVIDIA Titan RTX
i5-10600K, 4100 MHz
4.648 s * -74%
AMD Ryzen 9 3950X, NVIDIA Titan RTX
R9 3950X, 3500 MHz
4.112 s * -54%
Intel Core i9-11900K, NVIDIA Titan RTX
i9-11900K, 3500 MHz
3.982 s * -49%
Intel Core i9-9980HK, NVIDIA GeForce RTX 2070 (Desktop)
i9-9980HK, 2400 MHz
3.788 s * -42%
AMD Ryzen 7 3800XT, NVIDIA Titan RTX
R7 3800XT, 3900 MHz
3.74 s * -40%
Intel Core i9-10900K, NVIDIA Titan RTX
i9-10900K, 3700 MHz
3.582 s * -34%
Intel Core i9-11900KB, NVIDIA GeForce RTX 3060
i9-11900KB, 3300 MHz
3.416 s * -28%
AMD Ryzen 7 5800X, NVIDIA Titan RTX
R7 5800X, 3800 MHz
3.037 s * -14%
Intel Core i9-12900, NVIDIA GeForce RTX 3060
i9-12900, 2400 MHz
2.67 s *
Intel Core i7-12700K, NVIDIA Titan RTX
i7-12700K, 2700 MHz
2.659 s * -0%
1024m
Intel Core i9-12900, NVIDIA GeForce RTX 3060
i9-12900, 2400 MHz
211.8 s *
Intel Core i9-12900K, NVIDIA Titan RTX
i9-12900K, 3200 MHz
190.6 s * +10%
Intel Core i7-12700K, NVIDIA Titan RTX
i7-12700K, 2700 MHz
171.2 s * +19%
Intel Core i9-9980HK, NVIDIA GeForce RTX 2070 (Desktop)
i9-9980HK, 2400 MHz
120.2 s * +43%
Intel Core i5-10600K, NVIDIA Titan RTX
i5-10600K, 4100 MHz
113.2 s * +47%
Intel Core i5-11600K, NVIDIA Titan RTX
i5-11600K, 3900 MHz
107.6 s * +49%
Intel Core i9-11900KB, NVIDIA GeForce RTX 3060
i9-11900KB, 3300 MHz
102.2 s * +52%
AMD Ryzen 7 5800X, NVIDIA Titan RTX
R7 5800X, 3800 MHz
86.1 s * +59%
AMD Ryzen 7 3800XT, NVIDIA Titan RTX
R7 3800XT, 3900 MHz
81.4 s * +62%
Intel Core i9-11900K, NVIDIA Titan RTX
i9-11900K, 3500 MHz
77.9 s * +63%
Intel Core i9-10900K, NVIDIA Titan RTX
i9-10900K, 3700 MHz
66.3 s * +69%
AMD Ryzen 9 3950X, NVIDIA Titan RTX
R9 3950X, 3500 MHz
44.86 s * +79%
X264 HD Benchmark 4.0
Pass 1
Intel Core i9-12900K, NVIDIA Titan RTX
i9-12900K, 3200 MHz
368.5 (366min - 369max) fps +19%
Intel Core i7-12700K, NVIDIA Titan RTX
i7-12700K, 2700 MHz
349.5 (349min - 352max) fps +13%
AMD Ryzen 7 5800X, NVIDIA Titan RTX
R7 5800X, 3800 MHz
339 (338min - 341max) fps +9%
Intel Core i9-12900, NVIDIA GeForce RTX 3060
i9-12900, 2400 MHz
310 (303min - 324max) fps
Intel Core i9-11900K, NVIDIA Titan RTX
i9-11900K, 3500 MHz
309.5 (308min - 311max) fps 0%
Intel Core i5-11600K, NVIDIA Titan RTX
i5-11600K, 3900 MHz
299 (294min - 299max) fps -4%
Intel Core i9-10900K, NVIDIA Titan RTX
i9-10900K, 3700 MHz
289.5 (289min - 291max) fps -7%
Intel Core i9-11900KB, NVIDIA GeForce RTX 3060
i9-11900KB, 3300 MHz
272.5 (271min - 279max) fps -12%
AMD Ryzen 7 3800XT, NVIDIA Titan RTX
R7 3800XT, 3900 MHz
271 (270min - 273max) fps -13%
AMD Ryzen 9 3950X, NVIDIA Titan RTX
R9 3950X, 3500 MHz
265 (265min - 266max) fps -15%
Intel Core i5-10600K, NVIDIA Titan RTX
i5-10600K, 4100 MHz
251.5 (250min - 253max) fps -19%
Intel Core i9-9980HK, NVIDIA GeForce RTX 2070 (Desktop)
i9-9980HK, 2400 MHz
237.5 (236min - 239max) fps -23%
Pass 2
Intel Core i9-12900K, NVIDIA Titan RTX
i9-12900K, 3200 MHz
206 (206min - 206max) fps +40%
Intel Core i7-12700K, NVIDIA Titan RTX
i7-12700K, 2700 MHz
179 (179min - 179max) fps +21%
AMD Ryzen 9 3950X, NVIDIA Titan RTX
R9 3950X, 3500 MHz
168 (168min - 169max) fps +14%
AMD Ryzen 7 5800X, NVIDIA Titan RTX
R7 5800X, 3800 MHz
152 (151min - 152max) fps +3%
Intel Core i9-10900K, NVIDIA Titan RTX
i9-10900K, 3700 MHz
149 (149min - 149max) fps +1%
Intel Core i9-12900, NVIDIA GeForce RTX 3060
i9-12900, 2400 MHz
147.5 (134min - 173max) fps
Intel Core i9-11900K, NVIDIA Titan RTX
i9-11900K, 3500 MHz
137 (137min - 137max) fps -7%
AMD Ryzen 7 3800XT, NVIDIA Titan RTX
R7 3800XT, 3900 MHz
119 (118min - 119max) fps -19%
Intel Core i9-11900KB, NVIDIA GeForce RTX 3060
i9-11900KB, 3300 MHz
106 (101min - 108max) fps -28%
Intel Core i5-11600K, NVIDIA Titan RTX
i5-11600K, 3900 MHz
101 (101min - 101max) fps -32%
Intel Core i9-9980HK, NVIDIA GeForce RTX 2070 (Desktop)
i9-9980HK, 2400 MHz
92.8 (89.1min - 100max) fps -37%
Intel Core i5-10600K, NVIDIA Titan RTX
i5-10600K, 4100 MHz
88.2 (88min - 88.2max) fps -40%
WinRAR - Result
AMD Ryzen 7 5800X, NVIDIA Titan RTX
R7 5800X, 3800 MHz
15604 KB/s +45%
Intel Core i9-12900K, NVIDIA Titan RTX
i9-12900K, 3200 MHz
10792 KB/s 0%
Intel Core i9-12900, NVIDIA GeForce RTX 3060
i9-12900, 2400 MHz
10739 KB/s
Intel Core i7-12700K, NVIDIA Titan RTX
i7-12700K, 2700 MHz
10389 KB/s -3%
Intel Core i9-10900K, NVIDIA Titan RTX
i9-10900K, 3700 MHz
9739 KB/s -9%
Intel Core i9-11900KB, NVIDIA GeForce RTX 3060
i9-11900KB, 3300 MHz
9584 KB/s -11%
Intel Core i9-11900K, NVIDIA Titan RTX
i9-11900K, 3500 MHz
9030 KB/s -16%
Intel Core i5-11600K, NVIDIA Titan RTX
i5-11600K, 3900 MHz
7850 KB/s -27%
AMD Ryzen 7 3800XT, NVIDIA Titan RTX
R7 3800XT, 3900 MHz
7467 KB/s -30%
AMD Ryzen 9 3950X, NVIDIA Titan RTX
R9 3950X, 3500 MHz
7409 KB/s -31%
Intel Core i9-9980HK, NVIDIA GeForce RTX 2070 (Desktop)
i9-9980HK, 2400 MHz
7266 KB/s -32%
Intel Core i5-10600K, NVIDIA Titan RTX
i5-10600K, 4100 MHz
6536 KB/s -39%
TrueCrypt
AES Mean 100MB
Intel Core i9-12900K, NVIDIA Titan RTX
i9-12900K, 3200 MHz
18.5 GB/s +8%
Intel Core i9-12900, NVIDIA GeForce RTX 3060
i9-12900, 2400 MHz
17.2 GB/s
Intel Core i7-12700K, NVIDIA Titan RTX
i7-12700K, 2700 MHz
15.7 GB/s -9%
AMD Ryzen 7 5800X, NVIDIA Titan RTX
R7 5800X, 3800 MHz
15 GB/s -13%
Intel Core i9-10900K, NVIDIA Titan RTX
i9-10900K, 3700 MHz
14.6 GB/s -15%
Intel Core i9-11900K, NVIDIA Titan RTX
i9-11900K, 3500 MHz
13 GB/s -24%
Intel Core i9-11900KB, NVIDIA GeForce RTX 3060
i9-11900KB, 3300 MHz
11.6 GB/s -33%
AMD Ryzen 7 3800XT, NVIDIA Titan RTX
R7 3800XT, 3900 MHz
11.4 GB/s -34%
AMD Ryzen 9 3950X, NVIDIA Titan RTX
R9 3950X, 3500 MHz
10.8 GB/s -37%
Intel Core i9-9980HK, NVIDIA GeForce RTX 2070 (Desktop)
i9-9980HK, 2400 MHz
10.1 GB/s -41%
Intel Core i5-11600K, NVIDIA Titan RTX
i5-11600K, 3900 MHz
9.7 GB/s -44%
Intel Core i5-10600K, NVIDIA Titan RTX
i5-10600K, 4100 MHz
8 GB/s -53%
Twofish Mean 100MB
Intel Core i9-12900K, NVIDIA Titan RTX
i9-12900K, 3200 MHz
3.7 GB/s +9%
AMD Ryzen 9 3950X, NVIDIA Titan RTX
R9 3950X, 3500 MHz
3.6 GB/s +6%
Intel Core i9-12900, NVIDIA GeForce RTX 3060
i9-12900, 2400 MHz
3.4 GB/s
Intel Core i7-12700K, NVIDIA Titan RTX
i7-12700K, 2700 MHz
2.8 GB/s -18%
Intel Core i9-10900K, NVIDIA Titan RTX
i9-10900K, 3700 MHz
2.6 GB/s -24%
AMD Ryzen 7 3800XT, NVIDIA Titan RTX
R7 3800XT, 3900 MHz
2 GB/s -41%
AMD Ryzen 7 5800X, NVIDIA Titan RTX
R7 5800X, 3800 MHz
2 GB/s -41%
Intel Core i9-11900K, NVIDIA Titan RTX
i9-11900K, 3500 MHz
1.9 GB/s -44%
Intel Core i9-9980HK, NVIDIA GeForce RTX 2070 (Desktop)
i9-9980HK, 2400 MHz
1.7 GB/s -50%
Intel Core i9-11900KB, NVIDIA GeForce RTX 3060
i9-11900KB, 3300 MHz
1.7 GB/s -50%
Intel Core i5-11600K, NVIDIA Titan RTX
i5-11600K, 3900 MHz
1.5 GB/s -56%
Intel Core i5-10600K, NVIDIA Titan RTX
i5-10600K, 4100 MHz
1.4 GB/s -59%
Serpent Mean 100MB
AMD Ryzen 9 3950X, NVIDIA Titan RTX
R9 3950X, 3500 MHz
2.3 GB/s +21%
Intel Core i9-12900K, NVIDIA Titan RTX
i9-12900K, 3200 MHz
1.9 GB/s 0%
Intel Core i9-12900, NVIDIA GeForce RTX 3060
i9-12900, 2400 MHz
1.9 GB/s
Intel Core i7-12700K, NVIDIA Titan RTX
i7-12700K, 2700 MHz
1.6 GB/s -16%
Intel Core i9-10900K, NVIDIA Titan RTX
i9-10900K, 3700 MHz
1.5 GB/s -21%
AMD Ryzen 7 5800X, NVIDIA Titan RTX
R7 5800X, 3800 MHz
1.3 GB/s -32%
AMD Ryzen 7 3800XT, NVIDIA Titan RTX
R7 3800XT, 3900 MHz
1.2 GB/s -37%
Intel Core i9-11900K, NVIDIA Titan RTX
i9-11900K, 3500 MHz
1.2 GB/s -37%
Intel Core i9-11900KB, NVIDIA GeForce RTX 3060
i9-11900KB, 3300 MHz
1.1 GB/s -42%
Intel Core i9-9980HK, NVIDIA GeForce RTX 2070 (Desktop)
i9-9980HK, 2400 MHz
1 GB/s -47%
Intel Core i5-11600K, NVIDIA Titan RTX
i5-11600K, 3900 MHz
0.9 GB/s -53%
Intel Core i5-10600K, NVIDIA Titan RTX
i5-10600K, 4100 MHz
0.82 GB/s -57%
Geekbench 5.5
Multi-Core
Intel Core i9-12900K, NVIDIA Titan RTX
i9-12900K, 3200 MHz
17854 Points +100%
Intel Core i7-12700K, NVIDIA Titan RTX
i7-12700K, 2700 MHz
15557 Points +74%
AMD Ryzen 9 3950X, NVIDIA Titan RTX
R9 3950X, 3500 MHz
12363 Points +39%
Intel Core i9-10900K, NVIDIA Titan RTX
i9-10900K, 3700 MHz
11414 Points +28%
AMD Ryzen 7 5800X, NVIDIA Titan RTX
R7 5800X, 3800 MHz
11354 Points +27%
Intel Core i9-11900K, NVIDIA Titan RTX
i9-11900K, 3500 MHz
11035 Points +24%
AMD Ryzen 7 3800XT, NVIDIA Titan RTX
R7 3800XT, 3900 MHz
8948 Points 0%
Intel Core i9-11900KB, NVIDIA GeForce RTX 3060
i9-11900KB, 3300 MHz
8924 Points 0%
Intel Core i9-12900, NVIDIA GeForce RTX 3060
i9-12900, 2400 MHz
8924 Points
Intel Core i5-11600K, NVIDIA Titan RTX
i5-11600K, 3900 MHz
8523 Points -4%
Intel Core i9-9980HK, NVIDIA GeForce RTX 2070 (Desktop)
i9-9980HK, 2400 MHz
7568 Points -15%
Intel Core i5-10600K, NVIDIA Titan RTX
i5-10600K, 4100 MHz
7248 Points -19%
Single-Core
Intel Core i9-12900K, NVIDIA Titan RTX
i9-12900K, 3200 MHz
2042 Points +23%
Intel Core i7-12700K, NVIDIA Titan RTX
i7-12700K, 2700 MHz
1890 Points +14%
Intel Core i9-11900K, NVIDIA Titan RTX
i9-11900K, 3500 MHz
1885 Points +14%
Intel Core i5-11600K, NVIDIA Titan RTX
i5-11600K, 3900 MHz
1752 Points +6%
AMD Ryzen 7 5800X, NVIDIA Titan RTX
R7 5800X, 3800 MHz
1665 Points +1%
Intel Core i9-11900KB, NVIDIA GeForce RTX 3060
i9-11900KB, 3300 MHz
1656 Points 0%
Intel Core i9-12900, NVIDIA GeForce RTX 3060
i9-12900, 2400 MHz
1656 Points
Intel Core i9-10900K, NVIDIA Titan RTX
i9-10900K, 3700 MHz
1449 Points -12%
Intel Core i9-9980HK, NVIDIA GeForce RTX 2070 (Desktop)
i9-9980HK, 2400 MHz
1378 Points -17%
AMD Ryzen 7 3800XT, NVIDIA Titan RTX
R7 3800XT, 3900 MHz
1353 Points -18%
AMD Ryzen 9 3950X, NVIDIA Titan RTX
R9 3950X, 3500 MHz
1306 Points -21%
Intel Core i5-10600K, NVIDIA Titan RTX
i5-10600K, 4100 MHz
1286 Points -22%
Geekbench 5.0
5.0 Multi-Core
Intel Core i9-12900K, NVIDIA Titan RTX
i9-12900K, 3200 MHz
17959 Points +103%
Intel Core i7-12700K, NVIDIA Titan RTX
i7-12700K, 2700 MHz
15440 Points +75%
AMD Ryzen 9 3950X, NVIDIA Titan RTX
R9 3950X, 3500 MHz
12976 Points +47%
Intel Core i9-10900K, NVIDIA Titan RTX
i9-10900K, 3700 MHz
11407 Points +29%
AMD Ryzen 7 5800X, NVIDIA Titan RTX
R7 5800X, 3800 MHz
11246 Points +27%
Intel Core i9-11900K, NVIDIA Titan RTX
i9-11900K, 3500 MHz
11008 Points +24%
AMD Ryzen 7 3800XT, NVIDIA Titan RTX
R7 3800XT, 3900 MHz
9163 Points +4%
Intel Core i9-11900KB, NVIDIA GeForce RTX 3060
i9-11900KB, 3300 MHz
8845 Points 0%
Intel Core i9-12900, NVIDIA GeForce RTX 3060
i9-12900, 2400 MHz
8845 Points
Intel Core i5-11600K, NVIDIA Titan RTX
i5-11600K, 3900 MHz
8542 Points -3%
Intel Core i9-9980HK, NVIDIA GeForce RTX 2070 (Desktop)
i9-9980HK, 2400 MHz
7540 Points -15%
Intel Core i5-10600K, NVIDIA Titan RTX
i5-10600K, 4100 MHz
7237 Points -18%
5.0 Single-Core
Intel Core i9-12900K, NVIDIA Titan RTX
i9-12900K, 3200 MHz
1968 Points +20%
Intel Core i9-11900K, NVIDIA Titan RTX
i9-11900K, 3500 MHz
1863 Points +14%
Intel Core i7-12700K, NVIDIA Titan RTX
i7-12700K, 2700 MHz
1835 Points +12%
Intel Core i5-11600K, NVIDIA Titan RTX
i5-11600K, 3900 MHz
1731 Points +6%
AMD Ryzen 7 5800X, NVIDIA Titan RTX
R7 5800X, 3800 MHz
1673 Points +2%
Intel Core i9-11900KB, NVIDIA GeForce RTX 3060
i9-11900KB, 3300 MHz
1638 Points 0%
Intel Core i9-12900, NVIDIA GeForce RTX 3060
i9-12900, 2400 MHz
1638 Points
Intel Core i9-10900K, NVIDIA Titan RTX
i9-10900K, 3700 MHz
1440 Points -12%
AMD Ryzen 7 3800XT, NVIDIA Titan RTX
R7 3800XT, 3900 MHz
1360 Points -17%
Intel Core i9-9980HK, NVIDIA GeForce RTX 2070 (Desktop)
i9-9980HK, 2400 MHz
1355 Points -17%
AMD Ryzen 9 3950X, NVIDIA Titan RTX
R9 3950X, 3500 MHz
1315 Points -20%
Intel Core i5-10600K, NVIDIA Titan RTX
i5-10600K, 4100 MHz
1281 Points -22%
Geekbench 4.4
64 Bit Single-Core Score
Intel Core i9-12900K, NVIDIA Titan RTX
i9-12900K, 3200 MHz
8665 Points +24%
Intel Core i7-12700K, NVIDIA Titan RTX
i7-12700K, 2700 MHz
8133 Points +16%
Intel Core i9-11900K, NVIDIA Titan RTX
i9-11900K, 3500 MHz
7976 Points +14%
Intel Core i5-11600K, NVIDIA Titan RTX
i5-11600K, 3900 MHz
7438 Points +6%
AMD Ryzen 7 5800X, NVIDIA Titan RTX
R7 5800X, 3800 MHz
7333 Points +5%
Intel Core i9-11900KB, NVIDIA GeForce RTX 3060
i9-11900KB, 3300 MHz
6991 Points 0%
Intel Core i9-12900, NVIDIA GeForce RTX 3060
i9-12900, 2400 MHz
6991 Points
Intel Core i9-10900K, NVIDIA Titan RTX
i9-10900K, 3700 MHz
6348 Points -9%
Intel Core i9-9980HK, NVIDIA GeForce RTX 2070 (Desktop)
i9-9980HK, 2400 MHz
5969 Points -15%
AMD Ryzen 7 3800XT, NVIDIA Titan RTX
R7 3800XT, 3900 MHz
5830 Points -17%
Intel Core i5-10600K, NVIDIA Titan RTX
i5-10600K, 4100 MHz
5821 Points -17%
AMD Ryzen 9 3950X, NVIDIA Titan RTX
R9 3950X, 3500 MHz
5749 Points -18%
64 Bit Multi-Core Score
Intel Core i9-12900K, NVIDIA Titan RTX
i9-12900K, 3200 MHz
63583 Points +75%
Intel Core i7-12700K, NVIDIA Titan RTX
i7-12700K, 2700 MHz
55786 Points +54%
AMD Ryzen 9 3950X, NVIDIA Titan RTX
R9 3950X, 3500 MHz
48962 Points +35%
AMD Ryzen 7 5800X, NVIDIA Titan RTX
R7 5800X, 3800 MHz
44131 Points +22%
Intel Core i9-10900K, NVIDIA Titan RTX
i9-10900K, 3700 MHz
43058 Points +19%
Intel Core i9-11900K, NVIDIA Titan RTX
i9-11900K, 3500 MHz
42329 Points +17%
Intel Core i9-11900KB, NVIDIA GeForce RTX 3060
i9-11900KB, 3300 MHz
36310 Points 0%
Intel Core i9-12900, NVIDIA GeForce RTX 3060
i9-12900, 2400 MHz
36310 Points
AMD Ryzen 7 3800XT, NVIDIA Titan RTX
R7 3800XT, 3900 MHz
35526 Points -2%
Intel Core i5-11600K, NVIDIA Titan RTX
i5-11600K, 3900 MHz
33266 Points -8%
Intel Core i9-9980HK, NVIDIA GeForce RTX 2070 (Desktop)
i9-9980HK, 2400 MHz
29385 Points -19%
Intel Core i5-10600K, NVIDIA Titan RTX
i5-10600K, 4100 MHz
28391 Points -22%
3DMark 11 - 1280x720 Performance Physics
Intel Core i9-12900K, NVIDIA Titan RTX
i9-12900K, 3200 MHz
28211 Points +16%
Intel Core i7-12700K, NVIDIA Titan RTX
i7-12700K, 2700 MHz
26765 Points +10%
Intel Core i9-12900, NVIDIA GeForce RTX 3060
i9-12900, 2400 MHz
24314 Points
AMD Ryzen 7 5800X, NVIDIA Titan RTX
R7 5800X, 3800 MHz
23381 Points -4%
Intel Core i9-10900K, NVIDIA Titan RTX
i9-10900K, 3700 MHz
22140 Points -9%
Intel Core i9-11900K, NVIDIA Titan RTX
i9-11900K, 3500 MHz
21175 Points -13%
AMD Ryzen 9 3950X, NVIDIA Titan RTX
R9 3950X, 3500 MHz
21016 Points -14%
AMD Ryzen 7 3800XT, NVIDIA Titan RTX
R7 3800XT, 3900 MHz
18905 Points -22%
Intel Core i9-11900KB, NVIDIA GeForce RTX 3060
i9-11900KB, 3300 MHz
17803 Points -27%
Intel Core i5-11600K, NVIDIA Titan RTX
i5-11600K, 3900 MHz
17381 Points -29%
Intel Core i9-9980HK, NVIDIA GeForce RTX 2070 (Desktop)
i9-9980HK, 2400 MHz
16422 Points -32%
Intel Core i5-10600K, NVIDIA Titan RTX
i5-10600K, 4100 MHz
15961 Points -34%
7-Zip 18.03
7z b 4
AMD Ryzen 9 3950X, NVIDIA Titan RTX
R9 3950X, 3500 MHz
99467 MIPS +98%
Intel Core i9-12900K, NVIDIA Titan RTX
i9-12900K, 3200 MHz
97671 MIPS +95%
Intel Core i7-12700K, NVIDIA Titan RTX
i7-12700K, 2700 MHz
81369 MIPS +62%
AMD Ryzen 7 5800X, NVIDIA Titan RTX
R7 5800X, 3800 MHz
74306 MIPS +48%
Intel Core i9-10900K, NVIDIA Titan RTX
i9-10900K, 3700 MHz
70968 MIPS +42%
Intel Core i9-11900K, NVIDIA Titan RTX
i9-11900K, 3500 MHz
62746 MIPS +25%
AMD Ryzen 7 3800XT, NVIDIA Titan RTX
R7 3800XT, 3900 MHz
59247 MIPS +18%
Intel Core i9-11900KB, NVIDIA GeForce RTX 3060
i9-11900KB, 3300 MHz
50152 MIPS 0%
Intel Core i9-12900, NVIDIA GeForce RTX 3060
i9-12900, 2400 MHz
50152 MIPS
Intel Core i5-11600K, NVIDIA Titan RTX
i5-11600K, 3900 MHz
45322 MIPS -10%
Intel Core i9-9980HK, NVIDIA GeForce RTX 2070 (Desktop)
i9-9980HK, 2400 MHz
44081 MIPS -12%
Intel Core i5-10600K, NVIDIA Titan RTX
i5-10600K, 4100 MHz
40379 MIPS -19%
7z b 4 -mmt1
AMD Ryzen 7 5800X, NVIDIA Titan RTX
R7 5800X, 3800 MHz
6970 MIPS +17%
Intel Core i9-11900K, NVIDIA Titan RTX
i9-11900K, 3500 MHz
6652 MIPS +11%
Intel Core i9-12900K, NVIDIA Titan RTX
i9-12900K, 3200 MHz
6571 MIPS +10%
Intel Core i5-11600K, NVIDIA Titan RTX
i5-11600K, 3900 MHz
6136 MIPS +3%
Intel Core i7-12700K, NVIDIA Titan RTX
i7-12700K, 2700 MHz
6117 MIPS +2%
Intel Core i9-11900KB, NVIDIA GeForce RTX 3060
i9-11900KB, 3300 MHz
5979 MIPS 0%
Intel Core i9-12900, NVIDIA GeForce RTX 3060
i9-12900, 2400 MHz
5979 MIPS
Intel Core i9-10900K, NVIDIA Titan RTX
i9-10900K, 3700 MHz
5954 MIPS 0%
Intel Core i9-9980HK, NVIDIA GeForce RTX 2070 (Desktop)
i9-9980HK, 2400 MHz
5642 MIPS -6%
AMD Ryzen 7 3800XT, NVIDIA Titan RTX
R7 3800XT, 3900 MHz
5516 MIPS -8%
AMD Ryzen 9 3950X, NVIDIA Titan RTX
R9 3950X, 3500 MHz
5340 MIPS -11%
Intel Core i5-10600K, NVIDIA Titan RTX
i5-10600K, 4100 MHz
5289 MIPS -12%
HWBOT x265 Benchmark v2.2 - 4k Preset
Intel Core i9-12900K, NVIDIA Titan RTX
i9-12900K, 3200 MHz
30 fps +108%
Intel Core i7-12700K, NVIDIA Titan RTX
i7-12700K, 2700 MHz
26.1 fps +81%
Intel Core i9-10900K, NVIDIA Titan RTX
i9-10900K, 3700 MHz
21 fps +46%
AMD Ryzen 7 5800X, NVIDIA Titan RTX
R7 5800X, 3800 MHz
20.8 fps +44%
Intel Core i9-11900K, NVIDIA Titan RTX
i9-11900K, 3500 MHz
19.8 fps +38%
AMD Ryzen 7 3800XT, NVIDIA Titan RTX
R7 3800XT, 3900 MHz
16.1 fps +12%
AMD Ryzen 9 3950X, NVIDIA Titan RTX
R9 3950X, 3500 MHz
15.8 fps +10%
Intel Core i5-11600K, NVIDIA Titan RTX
i5-11600K, 3900 MHz
14.7 fps +2%
Intel Core i9-11900KB, NVIDIA GeForce RTX 3060
i9-11900KB, 3300 MHz
14.4 fps 0%
Intel Core i9-12900, NVIDIA GeForce RTX 3060
i9-12900, 2400 MHz
14.4 fps
Intel Core i5-10600K, NVIDIA Titan RTX
i5-10600K, 4100 MHz
12.2 fps -15%
Intel Core i9-9980HK, NVIDIA GeForce RTX 2070 (Desktop)
i9-9980HK, 2400 MHz
11.4 fps -21%
R Benchmark 2.5 - Overall mean
Intel Core i5-10600K, NVIDIA Titan RTX
i5-10600K, 4100 MHz
0.593 sec * -11%
Intel Core i9-9980HK, NVIDIA GeForce RTX 2070 (Desktop)
i9-9980HK, 2400 MHz
0.541 sec * -1%
Intel Core i9-11900KB, NVIDIA GeForce RTX 3060
i9-11900KB, 3300 MHz
0.535 sec * -0%
Intel Core i9-12900, NVIDIA GeForce RTX 3060
i9-12900, 2400 MHz
0.535 sec *
Intel Core i9-10900K, NVIDIA Titan RTX
i9-10900K, 3700 MHz
0.528 sec * +1%
AMD Ryzen 9 3950X, NVIDIA Titan RTX
R9 3950X, 3500 MHz
0.524 sec * +2%
AMD Ryzen 7 3800XT, NVIDIA Titan RTX
R7 3800XT, 3900 MHz
0.512 sec * +4%
Intel Core i5-11600K, NVIDIA Titan RTX
i5-11600K, 3900 MHz
0.506 sec * +5%
Intel Core i9-11900K, NVIDIA Titan RTX
i9-11900K, 3500 MHz
0.4733 sec * +12%
AMD Ryzen 7 5800X, NVIDIA Titan RTX
R7 5800X, 3800 MHz
0.4509 sec * +16%
Intel Core i7-12700K, NVIDIA Titan RTX
i7-12700K, 2700 MHz
0.423 sec * +21%
Intel Core i9-12900K, NVIDIA Titan RTX
i9-12900K, 3200 MHz
0.4216 sec * +21%
LibreOffice - 20 Documents To PDF
Intel Core i9-10900K, NVIDIA Titan RTX
i9-10900K, 3700 MHz
76 s * -69%
Intel Core i9-11900K, NVIDIA Titan RTX
i9-11900K, 3500 MHz
72.5 s * -61%
AMD Ryzen 9 3950X, NVIDIA Titan RTX
R9 3950X, 3500 MHz
53.6 s * -19%
Intel Core i5-10600K, NVIDIA Titan RTX
i5-10600K, 4100 MHz
46.06 s * -3%
Intel Core i9-9980HK, NVIDIA GeForce RTX 2070 (Desktop)
i9-9980HK, 2400 MHz
45.23 s * -1%
Intel Core i9-11900KB, NVIDIA GeForce RTX 3060
i9-11900KB, 3300 MHz
44.9 s * -0%
Intel Core i9-12900, NVIDIA GeForce RTX 3060
i9-12900, 2400 MHz
44.9 s *
AMD Ryzen 7 3800XT, NVIDIA Titan RTX
R7 3800XT, 3900 MHz
44.78 s * -0%
AMD Ryzen 7 5800X, NVIDIA Titan RTX
R7 5800X, 3800 MHz
43.31 s * +4%
Intel Core i9-12900K, NVIDIA Titan RTX
i9-12900K, 3200 MHz
40.6 s * +10%
Intel Core i7-12700K, NVIDIA Titan RTX
i7-12700K, 2700 MHz
39.8 s * +11%
Intel Core i5-11600K, NVIDIA Titan RTX
i5-11600K, 3900 MHz
39.7 s * +12%
WebXPRT 3 - Overall
Intel Core i9-12900K, NVIDIA Titan RTX
i9-12900K, 3200 MHz
320 Points +19%
Intel Core i7-12700K, NVIDIA Titan RTX
i7-12700K, 2700 MHz
306 Points +14%
AMD Ryzen 7 5800X, NVIDIA Titan RTX
R7 5800X, 3800 MHz
296 Points +10%
Intel Core i5-11600K, NVIDIA Titan RTX
i5-11600K, 3900 MHz
280 Points +4%
Intel Core i9-11900KB, NVIDIA GeForce RTX 3060
i9-11900KB, 3300 MHz
269 Points 0%
Intel Core i9-12900, NVIDIA GeForce RTX 3060
i9-12900, 2400 MHz
269 Points
Intel Core i9-10900K, NVIDIA Titan RTX
i9-10900K, 3700 MHz
255 Points -5%
AMD Ryzen 7 3800XT, NVIDIA Titan RTX
R7 3800XT, 3900 MHz
249 Points -7%
AMD Ryzen 9 3950X, NVIDIA Titan RTX
R9 3950X, 3500 MHz
239 Points -11%
Intel Core i5-10600K, NVIDIA Titan RTX
i5-10600K, 4100 MHz
239 Points -11%
Intel Core i9-9980HK, NVIDIA GeForce RTX 2070 (Desktop)
i9-9980HK, 2400 MHz
233 Points -13%
Intel Core i9-11900K, NVIDIA Titan RTX
i9-11900K, 3500 MHz
217 Points -19%
Mozilla Kraken 1.1 - Total
Intel Core i5-10600K, NVIDIA Titan RTX
i5-10600K, 4100 MHz
760 ms * -26%
Intel Core i9-9980HK, NVIDIA GeForce RTX 2070 (Desktop)
i9-9980HK, 2400 MHz
754 ms * -25%
Intel Core i9-10900K, NVIDIA Titan RTX
i9-10900K, 3700 MHz
709 ms * -18%
AMD Ryzen 9 3950X, NVIDIA Titan RTX
R9 3950X, 3500 MHz
706 ms * -17%
AMD Ryzen 7 3800XT, NVIDIA Titan RTX
R7 3800XT, 3900 MHz
683 ms * -13%
Intel Core i9-11900KB, NVIDIA GeForce RTX 3060
i9-11900KB, 3300 MHz
602 ms * -0%
Intel Core i9-12900, NVIDIA GeForce RTX 3060
i9-12900, 2400 MHz
602 ms *
Intel Core i5-11600K, NVIDIA Titan RTX
i5-11600K, 3900 MHz
587 ms * +2%
AMD Ryzen 7 5800X, NVIDIA Titan RTX
R7 5800X, 3800 MHz
558 ms * +7%
Intel Core i9-11900K, NVIDIA Titan RTX
i9-11900K, 3500 MHz
544 ms * +10%
Intel Core i7-12700K, NVIDIA Titan RTX
i7-12700K, 2700 MHz
496 ms * +18%
Intel Core i9-12900K, NVIDIA Titan RTX
i9-12900K, 3200 MHz
481 ms * +20%
3DMark
3840x2160 Fire Strike Ultra Physics
Intel Core i9-12900K, NVIDIA Titan RTX
i9-12900K, 3200 MHz
39462 Points +4%
Intel Core i9-12900, NVIDIA GeForce RTX 3060
i9-12900, 2400 MHz
37967 Points
Intel Core i7-12700K, NVIDIA Titan RTX
i7-12700K, 2700 MHz
37324 Points -2%
AMD Ryzen 9 3950X, NVIDIA Titan RTX
R9 3950X, 3500 MHz
31881 Points -16%
AMD Ryzen 7 5800X, NVIDIA Titan RTX
R7 5800X, 3800 MHz
31095 Points -18%
Intel Core i9-10900K, NVIDIA Titan RTX
i9-10900K, 3700 MHz
29374 Points -23%
Intel Core i9-11900K, NVIDIA Titan RTX
i9-11900K, 3500 MHz
27685 Points -27%
AMD Ryzen 7 3800XT, NVIDIA Titan RTX
R7 3800XT, 3900 MHz
25286 Points -33%
Intel Core i9-11900KB, NVIDIA GeForce RTX 3060
i9-11900KB, 3300 MHz
23921 Points -37%
Intel Core i5-11600K, NVIDIA Titan RTX
i5-11600K, 3900 MHz
23190 Points -39%
Intel Core i9-9980HK, NVIDIA GeForce RTX 2070 (Desktop)
i9-9980HK, 2400 MHz
21864 Points -42%
Intel Core i5-10600K, NVIDIA Titan RTX
i5-10600K, 4100 MHz
19942 Points -47%
1920x1080 Fire Strike Physics
Intel Core i9-12900K, NVIDIA Titan RTX
i9-12900K, 3200 MHz
39112 Points +11%
Intel Core i7-12700K, NVIDIA Titan RTX
i7-12700K, 2700 MHz
37079 Points +5%
Intel Core i9-12900, NVIDIA GeForce RTX 3060
i9-12900, 2400 MHz
35153 Points
AMD Ryzen 9 3950X, NVIDIA Titan RTX
R9 3950X, 3500 MHz
32004 Points -9%
AMD Ryzen 7 5800X, NVIDIA Titan RTX
R7 5800X, 3800 MHz
30938 Points -12%
Intel Core i9-10900K, NVIDIA Titan RTX
i9-10900K, 3700 MHz
29805 Points -15%
Intel Core i9-11900K, NVIDIA Titan RTX
i9-11900K, 3500 MHz
28927 Points -18%
AMD Ryzen 7 3800XT, NVIDIA Titan RTX
R7 3800XT, 3900 MHz
25132 Points -29%
Intel Core i9-11900KB, NVIDIA GeForce RTX 3060
i9-11900KB, 3300 MHz
24327 Points -31%
Intel Core i5-11600K, NVIDIA Titan RTX
i5-11600K, 3900 MHz
22631 Points -36%
Intel Core i9-9980HK, NVIDIA GeForce RTX 2070 (Desktop)
i9-9980HK, 2400 MHz
21706 Points -38%
Intel Core i5-10600K, NVIDIA Titan RTX
i5-10600K, 4100 MHz
20040 Points -43%
2560x1440 Time Spy CPU
Intel Core i9-12900K, NVIDIA Titan RTX
i9-12900K, 3200 MHz
18431 Points +22%
Intel Core i7-12700K, NVIDIA Titan RTX
i7-12700K, 2700 MHz
17185 Points +14%
Intel Core i9-12900, NVIDIA GeForce RTX 3060
i9-12900, 2400 MHz
15095 Points
Intel Core i9-10900K, NVIDIA Titan RTX
i9-10900K, 3700 MHz
14326 Points -5%
Intel Core i9-11900K, NVIDIA Titan RTX
i9-11900K, 3500 MHz
13433 Points -11%
AMD Ryzen 9 3950X, NVIDIA Titan RTX
R9 3950X, 3500 MHz
12404 Points -18%
AMD Ryzen 7 5800X, NVIDIA Titan RTX
R7 5800X, 3800 MHz
11599 Points -23%
AMD Ryzen 7 3800XT, NVIDIA Titan RTX
R7 3800XT, 3900 MHz
10302 Points -32%
Intel Core i9-11900KB, NVIDIA GeForce RTX 3060
i9-11900KB, 3300 MHz
10035 Points -34%
Intel Core i5-11600K, NVIDIA Titan RTX
i5-11600K, 3900 MHz
9482 Points -37%
Intel Core i9-9980HK, NVIDIA GeForce RTX 2070 (Desktop)
i9-9980HK, 2400 MHz
9417 Points -38%
Intel Core i5-10600K, NVIDIA Titan RTX
i5-10600K, 4100 MHz
8290 Points -45%

* ... kleinere Werte sind besser

Intel NUC 12 Extreme Kit in der Cinebench-R15-Multi-Schleife

Beim Lasttest mit der Cinebench-R15-Mult-Schleife zeigt nach dem ersten Durchlauf ein deutlicher Performanceeinbruch, welcher sich im weiteren Verlauf bei 2.592 Punkten einpendelt. Im Vergleich zu den beiden Vorgängern ist aber ein deutlicher Leistungsgewinn auch unter Volllast ersichtlich.

017034051068085010201190136015301700187020402210238025502720289030603230Tooltip
Intel Dragon Canyon NUC - RTX 3060 Intel Core i9-12900, Intel Core i9-12900: Ø2592 (2433.39-3346.44)
Intel Ghost Canyon NUC (RTX 2070) Intel Core i9-9980HK, Intel Core i9-9980HK: Ø1463 (1410.79-1593.44)
Intel Beast Canyon NUC Intel Core i9-11900KB, Intel Core i9-11900KB: Ø1800 (1776.75-1859.25)

Anwendungsleistung

Bei den Anwendungsbenchmarks fällt der reine Leistungsgewinn gegenüber dem Vorgängermodell deutlich geringer aus als erwartet. Subjektiv beurteilt lässt sich aber sagen, dass sowohl der Beast Canyon NUC seinerzeit und auch der Dragon Canyon NUC ein sehr hohes Arbeitstempo haben, um im Alltag eine gute Figur zu hinterlassen. Wird eine schnelle SSD installiert, so ist das System schon nach wenigen Sekunden einsatzbereit. Lange Wartezeiten gab es bei unserer Testkonfiguration nicht. Gegen aktuelle High-End-Systeme muss sich das Intel NUC 12 Extreme Kit allerdings geschlagen geben. Hier hat aber die verwendete GPU einen großen Einfluss. Dennoch ist unser Testsample 14 Prozent schneller, als ein System auf Basis eines AMD Ryzen 9 5900X bei identischer GPU.

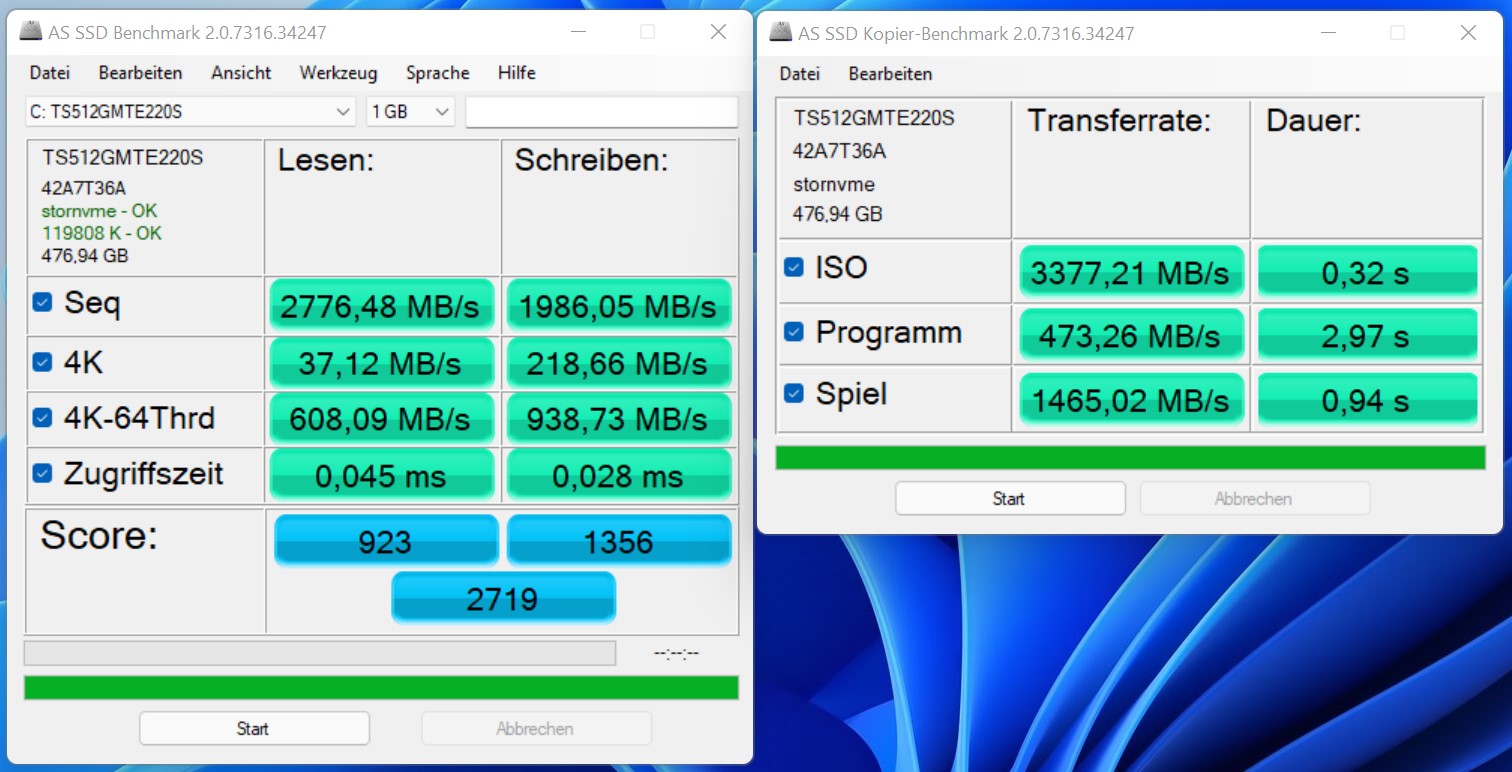
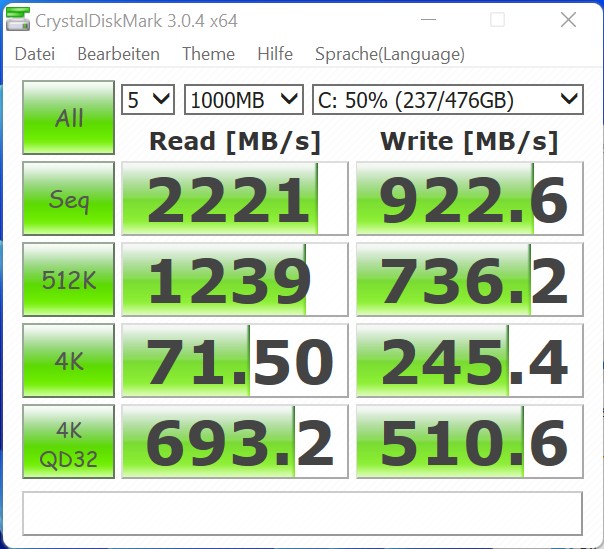
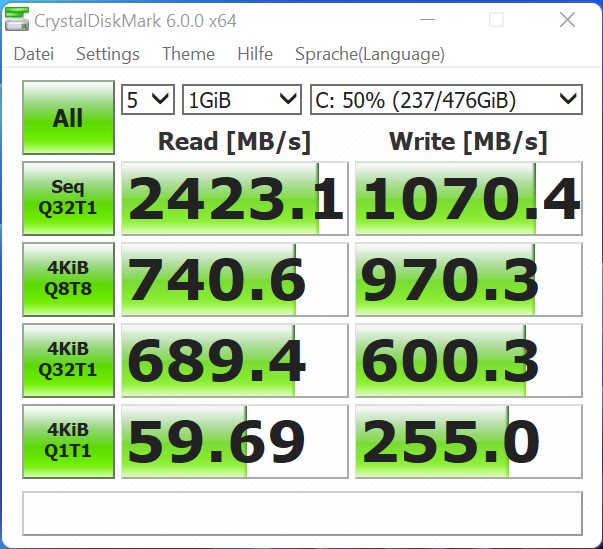
Wir haben das Barebone System mit einer 512 GB NVMe-SSD bestückt. Im Test lieferte das Modell aus dem Hause Transcend eine solide Leistung. Insgesamt lassen sich zwei M.2-2280 SSD in dem Compute-Element verstauen.

AS SSD
AS SSD
CDM 3
CDM 3
CDM 5
CDM 5
CDM 6
CDM 6
Performance Rating - Percent
Intel Core i7-12700K, Intel Core i7-12700K
NVIDIA Titan RTX
98.4 pt
Intel Core i9-12900K, Intel Core i9-12900K
NVIDIA Titan RTX
98.2 pt
Intel Core i9-11900K, Intel Core i9-11900K
NVIDIA Titan RTX
93.1 pt
Intel Core i5-11600K, Intel Core i5-11600K
NVIDIA Titan RTX
91.5 pt
Intel Core i9-10900K, Intel Core i9-10900K
NVIDIA Titan RTX
89.9 pt
Intel Core i5-10600K, Intel Core i5-10600K
NVIDIA Titan RTX
87.5 pt
AMD Ryzen 9 3950X, AMD Ryzen 9 3950X
NVIDIA Titan RTX
86.2 pt
Corsair One i160, Intel Core i9-9900K
NVIDIA GeForce RTX 2080 Ti (Desktop)
62 pt
Intel Dragon Canyon NUC - RTX 3060, Intel Core i9-12900
NVIDIA GeForce RTX 3060
47 pt
Intel Beast Canyon NUC, Intel Core i9-11900KB
NVIDIA GeForce RTX 3060
44.4 pt
Intel Ghost Canyon NUC (RTX 2070), Intel Core i9-9980HK
NVIDIA GeForce RTX 2070 (Desktop)
44.1 pt
Inno3D GeForce RTX 3060 Twin X2, AMD Ryzen 9 5900X -1!
NVIDIA GeForce RTX 3060
41.3 pt
PCMark 10 - Score
Intel Core i9-12900K, Intel Core i9-12900K
NVIDIA Titan RTX
8604 Points +6%
Intel Core i7-12700K, Intel Core i7-12700K
NVIDIA Titan RTX
8430 Points +4%
Intel Dragon Canyon NUC - RTX 3060, Intel Core i9-12900
NVIDIA GeForce RTX 3060
8083 Points
AMD Ryzen 9 3950X, AMD Ryzen 9 3950X
NVIDIA Titan RTX
7869 Points -3%
Intel Core i9-11900K, Intel Core i9-11900K
NVIDIA Titan RTX
7745 Points -4%
Intel Core i5-11600K, Intel Core i5-11600K
NVIDIA Titan RTX
7740 Points -4%
Intel Core i9-10900K, Intel Core i9-10900K
NVIDIA Titan RTX
7641 Points -5%
Corsair One i160, Intel Core i9-9900K
NVIDIA GeForce RTX 2080 Ti (Desktop)
7329 Points -9%
Intel Beast Canyon NUC, Intel Core i9-11900KB
NVIDIA GeForce RTX 3060
7281 Points -10%
Intel Core i5-10600K, Intel Core i5-10600K
NVIDIA Titan RTX
7279 Points -10%
Intel Ghost Canyon NUC (RTX 2070), Intel Core i9-9980HK
NVIDIA GeForce RTX 2070 (Desktop)
6939 Points -14%
SPECviewperf 12
1900x1060 Solidworks (sw-03)
Intel Core i9-11900K, Intel Core i9-11900K
NVIDIA Titan RTX
182 fps +148%
Intel Core i9-12900K, Intel Core i9-12900K
NVIDIA Titan RTX
174 fps +137%
Intel Core i9-10900K, Intel Core i9-10900K
NVIDIA Titan RTX
172.2 fps +135%
Intel Core i5-11600K, Intel Core i5-11600K
NVIDIA Titan RTX
171 fps +133%
Intel Core i7-12700K, Intel Core i7-12700K
NVIDIA Titan RTX
167 fps +128%
Intel Core i5-10600K, Intel Core i5-10600K
NVIDIA Titan RTX
158.2 fps +116%
AMD Ryzen 9 3950X, AMD Ryzen 9 3950X
NVIDIA Titan RTX
157.6 fps +115%
Corsair One i160, Intel Core i9-9900K
NVIDIA GeForce RTX 2080 Ti (Desktop)
83.7 fps +14%
Intel Dragon Canyon NUC - RTX 3060, Intel Core i9-12900
NVIDIA GeForce RTX 3060
73.3 fps
Intel Beast Canyon NUC, Intel Core i9-11900KB
NVIDIA GeForce RTX 3060
71.6 fps -2%
Intel Ghost Canyon NUC (RTX 2070), Intel Core i9-9980HK
NVIDIA GeForce RTX 2070 (Desktop)
59.2 fps -19%
Inno3D GeForce RTX 3060 Twin X2, AMD Ryzen 9 5900X
NVIDIA GeForce RTX 3060
56.1 fps -23%
1900x1060 Siemens NX (snx-02)
Intel Core i7-12700K, Intel Core i7-12700K
NVIDIA Titan RTX
289 fps +2840%
Intel Core i9-12900K, Intel Core i9-12900K
NVIDIA Titan RTX
287 fps +2820%
Intel Core i9-10900K, Intel Core i9-10900K
NVIDIA Titan RTX
263.3 fps +2579%
Intel Core i5-10600K, Intel Core i5-10600K
NVIDIA Titan RTX
259.1 fps +2536%
AMD Ryzen 9 3950X, AMD Ryzen 9 3950X
NVIDIA Titan RTX
254.8 fps +2492%
Intel Core i5-11600K, Intel Core i5-11600K
NVIDIA Titan RTX
251 fps +2453%
Intel Core i9-11900K, Intel Core i9-11900K
NVIDIA Titan RTX
245 fps +2392%
Corsair One i160, Intel Core i9-9900K
NVIDIA GeForce RTX 2080 Ti (Desktop)
12.72 fps +29%
Intel Dragon Canyon NUC - RTX 3060, Intel Core i9-12900
NVIDIA GeForce RTX 3060
9.83 fps
Intel Ghost Canyon NUC (RTX 2070), Intel Core i9-9980HK
NVIDIA GeForce RTX 2070 (Desktop)
9.08 fps -8%
Inno3D GeForce RTX 3060 Twin X2, AMD Ryzen 9 5900X
NVIDIA GeForce RTX 3060
8.98 fps -9%
Intel Beast Canyon NUC, Intel Core i9-11900KB
NVIDIA GeForce RTX 3060
8.75 fps -11%
1900x1060 Showcase (showcase-01)
Intel Core i9-11900K, Intel Core i9-11900K
NVIDIA Titan RTX
203 fps +74%
Intel Core i5-11600K, Intel Core i5-11600K
NVIDIA Titan RTX
202 fps +73%
Intel Core i9-12900K, Intel Core i9-12900K
NVIDIA Titan RTX
200 fps +71%
Intel Core i7-12700K, Intel Core i7-12700K
NVIDIA Titan RTX
200 fps +71%
Intel Core i5-10600K, Intel Core i5-10600K
NVIDIA Titan RTX
196.1 fps +68%
Intel Core i9-10900K, Intel Core i9-10900K
NVIDIA Titan RTX
192.4 fps +64%
AMD Ryzen 9 3950X, AMD Ryzen 9 3950X
NVIDIA Titan RTX
188.3 fps +61%
Corsair One i160, Intel Core i9-9900K
NVIDIA GeForce RTX 2080 Ti (Desktop)
182.3 fps +56%
Intel Ghost Canyon NUC (RTX 2070), Intel Core i9-9980HK
NVIDIA GeForce RTX 2070 (Desktop)
118.5 fps +1%
Intel Dragon Canyon NUC - RTX 3060, Intel Core i9-12900
NVIDIA GeForce RTX 3060
117 fps
Inno3D GeForce RTX 3060 Twin X2, AMD Ryzen 9 5900X
NVIDIA GeForce RTX 3060
114 fps -3%
Intel Beast Canyon NUC, Intel Core i9-11900KB
NVIDIA GeForce RTX 3060
113 fps -3%
1900x1060 Medical (medical-01)
Intel Core i9-12900K, Intel Core i9-12900K
NVIDIA Titan RTX
108 fps +120%
Intel Core i7-12700K, Intel Core i7-12700K
NVIDIA Titan RTX
106 fps +115%
Intel Core i5-10600K, Intel Core i5-10600K
NVIDIA Titan RTX
94.6 fps +92%
Intel Core i9-10900K, Intel Core i9-10900K
NVIDIA Titan RTX
94.5 fps +92%
Intel Core i5-11600K, Intel Core i5-11600K
NVIDIA Titan RTX
88.7 fps +80%
AMD Ryzen 9 3950X, AMD Ryzen 9 3950X
NVIDIA Titan RTX
88.1 fps +79%
Intel Core i9-11900K, Intel Core i9-11900K
NVIDIA Titan RTX
87.8 fps +78%
Corsair One i160, Intel Core i9-9900K
NVIDIA GeForce RTX 2080 Ti (Desktop)
56.6 fps +15%
Intel Dragon Canyon NUC - RTX 3060, Intel Core i9-12900
NVIDIA GeForce RTX 3060
49.2 fps
Intel Beast Canyon NUC, Intel Core i9-11900KB
NVIDIA GeForce RTX 3060
40.9 fps -17%
Intel Ghost Canyon NUC (RTX 2070), Intel Core i9-9980HK
NVIDIA GeForce RTX 2070 (Desktop)
40.14 fps -18%
Inno3D GeForce RTX 3060 Twin X2, AMD Ryzen 9 5900X
NVIDIA GeForce RTX 3060
36.5 fps -26%
1900x1060 Maya (maya-04)
Intel Core i9-12900K, Intel Core i9-12900K
NVIDIA Titan RTX
211 fps +8%
Intel Core i7-12700K, Intel Core i7-12700K
NVIDIA Titan RTX
204 fps +4%
Intel Core i9-11900K, Intel Core i9-11900K
NVIDIA Titan RTX
199 fps +2%
Intel Dragon Canyon NUC - RTX 3060, Intel Core i9-12900
NVIDIA GeForce RTX 3060
196 fps
Intel Beast Canyon NUC, Intel Core i9-11900KB
NVIDIA GeForce RTX 3060
191 fps -3%
Corsair One i160, Intel Core i9-9900K
NVIDIA GeForce RTX 2080 Ti (Desktop)
190.9 fps -3%
Intel Core i9-10900K, Intel Core i9-10900K
NVIDIA Titan RTX
188.7 fps -4%
Intel Core i5-11600K, Intel Core i5-11600K
NVIDIA Titan RTX
186 fps -5%
Inno3D GeForce RTX 3060 Twin X2, AMD Ryzen 9 5900X
NVIDIA GeForce RTX 3060
173 fps -12%
AMD Ryzen 9 3950X, AMD Ryzen 9 3950X
NVIDIA Titan RTX
172.2 fps -12%
Intel Ghost Canyon NUC (RTX 2070), Intel Core i9-9980HK
NVIDIA GeForce RTX 2070 (Desktop)
171 fps -13%
Intel Core i5-10600K, Intel Core i5-10600K
NVIDIA Titan RTX
169.4 fps -14%
1900x1060 Energy (energy-01)
Intel Core i9-12900K, Intel Core i9-12900K
NVIDIA Titan RTX
30.1 fps +184%
Intel Core i7-12700K, Intel Core i7-12700K
NVIDIA Titan RTX
29.9 fps +182%
Intel Core i5-10600K, Intel Core i5-10600K
NVIDIA Titan RTX
28.77 fps +171%
Intel Core i9-10900K, Intel Core i9-10900K
NVIDIA Titan RTX
28.72 fps +171%
Intel Core i5-11600K, Intel Core i5-11600K
NVIDIA Titan RTX
28.3 fps +167%
Intel Core i9-11900K, Intel Core i9-11900K
NVIDIA Titan RTX
28.2 fps +166%
AMD Ryzen 9 3950X, AMD Ryzen 9 3950X
NVIDIA Titan RTX
28.18 fps +166%
Corsair One i160, Intel Core i9-9900K
NVIDIA GeForce RTX 2080 Ti (Desktop)
16.72 fps +58%
Intel Ghost Canyon NUC (RTX 2070), Intel Core i9-9980HK
NVIDIA GeForce RTX 2070 (Desktop)
11.49 fps +8%
Intel Dragon Canyon NUC - RTX 3060, Intel Core i9-12900
NVIDIA GeForce RTX 3060
10.6 fps
Intel Beast Canyon NUC, Intel Core i9-11900KB
NVIDIA GeForce RTX 3060
10 fps -6%
Inno3D GeForce RTX 3060 Twin X2, AMD Ryzen 9 5900X
NVIDIA GeForce RTX 3060
9.89 fps -7%
1900x1060 Creo (creo-01)
Intel Core i9-12900K, Intel Core i9-12900K
NVIDIA Titan RTX
187 fps +229%
Intel Core i7-12700K, Intel Core i7-12700K
NVIDIA Titan RTX
182 fps +220%
Intel Core i9-11900K, Intel Core i9-11900K
NVIDIA Titan RTX
173 fps +204%
Intel Core i5-11600K, Intel Core i5-11600K
NVIDIA Titan RTX
164 fps +188%
Intel Core i9-10900K, Intel Core i9-10900K
NVIDIA Titan RTX
157.2 fps +176%
Intel Core i5-10600K, Intel Core i5-10600K
NVIDIA Titan RTX
142.7 fps +151%
AMD Ryzen 9 3950X, AMD Ryzen 9 3950X
NVIDIA Titan RTX
134.8 fps +137%
Corsair One i160, Intel Core i9-9900K
NVIDIA GeForce RTX 2080 Ti (Desktop)
72.2 fps +27%
Intel Dragon Canyon NUC - RTX 3060, Intel Core i9-12900
NVIDIA GeForce RTX 3060
56.9 fps
Inno3D GeForce RTX 3060 Twin X2, AMD Ryzen 9 5900X
NVIDIA GeForce RTX 3060
52.4 fps -8%
Intel Ghost Canyon NUC (RTX 2070), Intel Core i9-9980HK
NVIDIA GeForce RTX 2070 (Desktop)
52.2 fps -8%
Intel Beast Canyon NUC, Intel Core i9-11900KB
NVIDIA GeForce RTX 3060
49.4 fps -13%
1900x1060 Catia (catia-04)
Intel Core i9-12900K, Intel Core i9-12900K
NVIDIA Titan RTX
290 fps +274%
Intel Core i7-12700K, Intel Core i7-12700K
NVIDIA Titan RTX
285 fps +268%
Intel Core i9-11900K, Intel Core i9-11900K
NVIDIA Titan RTX
269 fps +247%
Intel Core i5-11600K, Intel Core i5-11600K
NVIDIA Titan RTX
251 fps +224%
Intel Core i9-10900K, Intel Core i9-10900K
NVIDIA Titan RTX
225.2 fps +191%
AMD Ryzen 9 3950X, AMD Ryzen 9 3950X
NVIDIA Titan RTX
218.4 fps +182%
Intel Core i5-10600K, Intel Core i5-10600K
NVIDIA Titan RTX
215.5 fps +178%
Corsair One i160, Intel Core i9-9900K
NVIDIA GeForce RTX 2080 Ti (Desktop)
120.8 fps +56%
Intel Ghost Canyon NUC (RTX 2070), Intel Core i9-9980HK
NVIDIA GeForce RTX 2070 (Desktop)
78.3 fps +1%
Intel Dragon Canyon NUC - RTX 3060, Intel Core i9-12900
NVIDIA GeForce RTX 3060
77.5 fps
Intel Beast Canyon NUC, Intel Core i9-11900KB
NVIDIA GeForce RTX 3060
77 fps -1%
Inno3D GeForce RTX 3060 Twin X2, AMD Ryzen 9 5900X
NVIDIA GeForce RTX 3060
73.9 fps -5%
1900x1060 3ds Max (3dsmax-05)
Intel Core i7-12700K, Intel Core i7-12700K
NVIDIA Titan RTX
302 fps +41%
Intel Core i9-10900K, Intel Core i9-10900K
NVIDIA Titan RTX
297.4 fps +39%
Intel Core i5-10600K, Intel Core i5-10600K
NVIDIA Titan RTX
296.9 fps +39%
Intel Core i9-11900K, Intel Core i9-11900K
NVIDIA Titan RTX
289 fps +35%
Intel Core i5-11600K, Intel Core i5-11600K
NVIDIA Titan RTX
288 fps +35%
AMD Ryzen 9 3950X, AMD Ryzen 9 3950X
NVIDIA Titan RTX
274.5 fps +28%
Corsair One i160, Intel Core i9-9900K
NVIDIA GeForce RTX 2080 Ti (Desktop)
271.8 fps +27%
Intel Core i9-12900K, Intel Core i9-12900K
NVIDIA Titan RTX
262 fps +22%
Inno3D GeForce RTX 3060 Twin X2, AMD Ryzen 9 5900X
NVIDIA GeForce RTX 3060
217 fps +1%
Intel Dragon Canyon NUC - RTX 3060, Intel Core i9-12900
NVIDIA GeForce RTX 3060
214 fps
Intel Beast Canyon NUC, Intel Core i9-11900KB
NVIDIA GeForce RTX 3060
201 fps -6%
Intel Ghost Canyon NUC (RTX 2070), Intel Core i9-9980HK
NVIDIA GeForce RTX 2070 (Desktop)
180.8 fps -16%
SPECviewperf 13
Solidworks (sw-04)
Intel Core i9-12900K, Intel Core i9-12900K
NVIDIA Titan RTX
199 fps +86%
Intel Core i9-11900K, Intel Core i9-11900K
NVIDIA Titan RTX
198 fps +85%
Intel Core i7-12700K, Intel Core i7-12700K
NVIDIA Titan RTX
193 fps +80%
Intel Core i5-11600K, Intel Core i5-11600K
NVIDIA Titan RTX
185 fps +73%
Intel Core i9-10900K, Intel Core i9-10900K
NVIDIA Titan RTX
166.2 fps +55%
Intel Core i5-10600K, Intel Core i5-10600K
NVIDIA Titan RTX
153.9 fps +44%
AMD Ryzen 9 3950X, AMD Ryzen 9 3950X
NVIDIA Titan RTX
153.2 fps +43%
Corsair One i160, Intel Core i9-9900K
NVIDIA GeForce RTX 2080 Ti (Desktop)
116.3 fps +9%
Intel Dragon Canyon NUC - RTX 3060, Intel Core i9-12900
NVIDIA GeForce RTX 3060
107 fps
Intel Beast Canyon NUC, Intel Core i9-11900KB
NVIDIA GeForce RTX 3060
104 fps -3%
Intel Ghost Canyon NUC (RTX 2070), Intel Core i9-9980HK
NVIDIA GeForce RTX 2070 (Desktop)
85.4 fps -20%
Inno3D GeForce RTX 3060 Twin X2, AMD Ryzen 9 5900X
NVIDIA GeForce RTX 3060
84.9 fps -21%
Siemens NX (snx-03)
Intel Core i9-12900K, Intel Core i9-12900K
NVIDIA Titan RTX
516 fps +2815%
Intel Core i7-12700K, Intel Core i7-12700K
NVIDIA Titan RTX
513 fps +2798%
Intel Core i9-10900K, Intel Core i9-10900K
NVIDIA Titan RTX
472.9 fps +2572%
Intel Core i5-10600K, Intel Core i5-10600K
NVIDIA Titan RTX
469.1 fps +2550%
AMD Ryzen 9 3950X, AMD Ryzen 9 3950X
NVIDIA Titan RTX
460 fps +2499%
Intel Core i5-11600K, Intel Core i5-11600K
NVIDIA Titan RTX
453 fps +2459%
Intel Core i9-11900K, Intel Core i9-11900K
NVIDIA Titan RTX
450 fps +2442%
Corsair One i160, Intel Core i9-9900K
NVIDIA GeForce RTX 2080 Ti (Desktop)
23.03 fps +30%
Intel Dragon Canyon NUC - RTX 3060, Intel Core i9-12900
NVIDIA GeForce RTX 3060
17.7 fps
Intel Ghost Canyon NUC (RTX 2070), Intel Core i9-9980HK
NVIDIA GeForce RTX 2070 (Desktop)
16.33 fps -8%
Inno3D GeForce RTX 3060 Twin X2, AMD Ryzen 9 5900X
NVIDIA GeForce RTX 3060
16.2 fps -8%
Intel Beast Canyon NUC, Intel Core i9-11900KB
NVIDIA GeForce RTX 3060
15.8 fps -11%
Showcase (showcase-02)
Intel Core i9-12900K, Intel Core i9-12900K
NVIDIA Titan RTX
199 fps +70%
Intel Core i7-12700K, Intel Core i7-12700K
NVIDIA Titan RTX
199 fps +70%
Intel Core i5-10600K, Intel Core i5-10600K
NVIDIA Titan RTX
195.1 fps +67%
Intel Core i9-10900K, Intel Core i9-10900K
NVIDIA Titan RTX
194.1 fps +66%
Intel Core i9-11900K, Intel Core i9-11900K
NVIDIA Titan RTX
194 fps +66%
Intel Core i5-11600K, Intel Core i5-11600K
NVIDIA Titan RTX
193 fps +65%
AMD Ryzen 9 3950X, AMD Ryzen 9 3950X
NVIDIA Titan RTX
186.8 fps +60%
Corsair One i160, Intel Core i9-9900K
NVIDIA GeForce RTX 2080 Ti (Desktop)
182.6 fps +56%
Intel Ghost Canyon NUC (RTX 2070), Intel Core i9-9980HK
NVIDIA GeForce RTX 2070 (Desktop)
118.5 fps +1%
Intel Dragon Canyon NUC - RTX 3060, Intel Core i9-12900
NVIDIA GeForce RTX 3060
117 fps
Inno3D GeForce RTX 3060 Twin X2, AMD Ryzen 9 5900X
NVIDIA GeForce RTX 3060
115 fps -2%
Intel Beast Canyon NUC, Intel Core i9-11900KB
NVIDIA GeForce RTX 3060
113 fps -3%
Medical (medical-02)
Intel Core i7-12700K, Intel Core i7-12700K
NVIDIA Titan RTX
93.7 fps +68%
Intel Core i9-12900K, Intel Core i9-12900K
NVIDIA Titan RTX
93.6 fps +68%
AMD Ryzen 9 3950X, AMD Ryzen 9 3950X
NVIDIA Titan RTX
90.3 fps +62%
Intel Core i9-11900K, Intel Core i9-11900K
NVIDIA Titan RTX
90 fps +62%
Intel Core i5-11600K, Intel Core i5-11600K
NVIDIA Titan RTX
90 fps +62%
Intel Core i5-10600K, Intel Core i5-10600K
NVIDIA Titan RTX
89.7 fps +61%
Intel Core i9-10900K, Intel Core i9-10900K
NVIDIA Titan RTX
88.7 fps +59%
Corsair One i160, Intel Core i9-9900K
NVIDIA GeForce RTX 2080 Ti (Desktop)
85 fps +53%
Intel Ghost Canyon NUC (RTX 2070), Intel Core i9-9980HK
NVIDIA GeForce RTX 2070 (Desktop)
56.4 fps +1%
Intel Dragon Canyon NUC - RTX 3060, Intel Core i9-12900
NVIDIA GeForce RTX 3060
55.7 fps
Inno3D GeForce RTX 3060 Twin X2, AMD Ryzen 9 5900X
NVIDIA GeForce RTX 3060
55 fps -1%
Intel Beast Canyon NUC, Intel Core i9-11900KB
NVIDIA GeForce RTX 3060
54.4 fps -2%
Maya (maya-05)
Intel Core i9-12900K, Intel Core i9-12900K
NVIDIA Titan RTX
505 fps +80%
Intel Core i7-12700K, Intel Core i7-12700K
NVIDIA Titan RTX
500 fps +78%
Intel Core i9-11900K, Intel Core i9-11900K
NVIDIA Titan RTX
454 fps +62%
Intel Core i5-11600K, Intel Core i5-11600K
NVIDIA Titan RTX
449 fps +60%
Intel Core i9-10900K, Intel Core i9-10900K
NVIDIA Titan RTX
405.9 fps +44%
Corsair One i160, Intel Core i9-9900K
NVIDIA GeForce RTX 2080 Ti (Desktop)
402 fps +43%
AMD Ryzen 9 3950X, AMD Ryzen 9 3950X
NVIDIA Titan RTX
394.9 fps +41%
Intel Core i5-10600K, Intel Core i5-10600K
NVIDIA Titan RTX
387.5 fps +38%
Intel Ghost Canyon NUC (RTX 2070), Intel Core i9-9980HK
NVIDIA GeForce RTX 2070 (Desktop)
281 fps 0%
Intel Dragon Canyon NUC - RTX 3060, Intel Core i9-12900
NVIDIA GeForce RTX 3060
281 fps
Intel Beast Canyon NUC, Intel Core i9-11900KB
NVIDIA GeForce RTX 3060
262 fps -7%
Inno3D GeForce RTX 3060 Twin X2, AMD Ryzen 9 5900X
NVIDIA GeForce RTX 3060
261 fps -7%
Energy (energy-02)
Intel Core i5-11600K, Intel Core i5-11600K
NVIDIA Titan RTX
53.9 fps +293%
Intel Core i9-11900K, Intel Core i9-11900K
NVIDIA Titan RTX
53.7 fps +292%
Intel Core i5-10600K, Intel Core i5-10600K
NVIDIA Titan RTX
53.3 fps +289%
Intel Core i9-10900K, Intel Core i9-10900K
NVIDIA Titan RTX
53.2 fps +288%
Intel Core i9-12900K, Intel Core i9-12900K
NVIDIA Titan RTX
52.7 fps +285%
Intel Core i7-12700K, Intel Core i7-12700K
NVIDIA Titan RTX
52.6 fps +284%
AMD Ryzen 9 3950X, AMD Ryzen 9 3950X
NVIDIA Titan RTX
52.4 fps +282%
Corsair One i160, Intel Core i9-9900K
NVIDIA GeForce RTX 2080 Ti (Desktop)
31.93 fps +133%
Intel Ghost Canyon NUC (RTX 2070), Intel Core i9-9980HK
NVIDIA GeForce RTX 2070 (Desktop)
21.83 fps +59%
Intel Beast Canyon NUC, Intel Core i9-11900KB
NVIDIA GeForce RTX 3060
13.7 fps 0%
Intel Dragon Canyon NUC - RTX 3060, Intel Core i9-12900
NVIDIA GeForce RTX 3060
13.7 fps
Inno3D GeForce RTX 3060 Twin X2, AMD Ryzen 9 5900X
NVIDIA GeForce RTX 3060
13.6 fps -1%
Creo (creo-02)
Intel Core i9-12900K, Intel Core i9-12900K
NVIDIA Titan RTX
389 fps +104%
Intel Core i7-12700K, Intel Core i7-12700K
NVIDIA Titan RTX
388 fps +103%
Intel Core i9-11900K, Intel Core i9-11900K
NVIDIA Titan RTX
355 fps +86%
Intel Core i5-11600K, Intel Core i5-11600K
NVIDIA Titan RTX
354 fps +85%
Intel Core i9-10900K, Intel Core i9-10900K
NVIDIA Titan RTX
336.3 fps +76%
Intel Core i5-10600K, Intel Core i5-10600K
NVIDIA Titan RTX
331.7 fps +74%
AMD Ryzen 9 3950X, AMD Ryzen 9 3950X
NVIDIA Titan RTX
328.8 fps +72%
Corsair One i160, Intel Core i9-9900K
NVIDIA GeForce RTX 2080 Ti (Desktop)
286.1 fps +50%
Intel Dragon Canyon NUC - RTX 3060, Intel Core i9-12900
NVIDIA GeForce RTX 3060
191 fps
Intel Ghost Canyon NUC (RTX 2070), Intel Core i9-9980HK
NVIDIA GeForce RTX 2070 (Desktop)
183.8 fps -4%
Inno3D GeForce RTX 3060 Twin X2, AMD Ryzen 9 5900X
NVIDIA GeForce RTX 3060
181 fps -5%
Intel Beast Canyon NUC, Intel Core i9-11900KB
NVIDIA GeForce RTX 3060
172 fps -10%
Catia (catia-05)
Intel Core i9-12900K, Intel Core i9-12900K
NVIDIA Titan RTX
467 fps +336%
Intel Core i7-12700K, Intel Core i7-12700K
NVIDIA Titan RTX
459 fps +329%
Intel Core i9-11900K, Intel Core i9-11900K
NVIDIA Titan RTX
415 fps +288%
Intel Core i5-11600K, Intel Core i5-11600K
NVIDIA Titan RTX
397 fps +271%
Intel Core i9-10900K, Intel Core i9-10900K
NVIDIA Titan RTX
362.1 fps +238%
AMD Ryzen 9 3950X, AMD Ryzen 9 3950X
NVIDIA Titan RTX
355.2 fps +232%
Intel Core i5-10600K, Intel Core i5-10600K
NVIDIA Titan RTX
341.7 fps +219%
Corsair One i160, Intel Core i9-9900K
NVIDIA GeForce RTX 2080 Ti (Desktop)
177.3 fps +66%
Intel Ghost Canyon NUC (RTX 2070), Intel Core i9-9980HK
NVIDIA GeForce RTX 2070 (Desktop)
113.7 fps +6%
Inno3D GeForce RTX 3060 Twin X2, AMD Ryzen 9 5900X
NVIDIA GeForce RTX 3060
109 fps +2%
Intel Dragon Canyon NUC - RTX 3060, Intel Core i9-12900
NVIDIA GeForce RTX 3060
107 fps
Intel Beast Canyon NUC, Intel Core i9-11900KB
NVIDIA GeForce RTX 3060
104 fps -3%
3ds Max (3dsmax-06)
Intel Core i7-12700K, Intel Core i7-12700K
NVIDIA Titan RTX
303 fps +46%
Intel Core i5-10600K, Intel Core i5-10600K
NVIDIA Titan RTX
294.4 fps +42%
Intel Core i9-10900K, Intel Core i9-10900K
NVIDIA Titan RTX
292.5 fps +41%
Intel Core i5-11600K, Intel Core i5-11600K
NVIDIA Titan RTX
288 fps +39%
Intel Core i9-11900K, Intel Core i9-11900K
NVIDIA Titan RTX
287 fps +39%
AMD Ryzen 9 3950X, AMD Ryzen 9 3950X
NVIDIA Titan RTX
274.5 fps +33%
Corsair One i160, Intel Core i9-9900K
NVIDIA GeForce RTX 2080 Ti (Desktop)
265.9 fps +28%
Intel Core i9-12900K, Intel Core i9-12900K
NVIDIA Titan RTX
265 fps +28%
Inno3D GeForce RTX 3060 Twin X2, AMD Ryzen 9 5900X
NVIDIA GeForce RTX 3060
215 fps +4%
Intel Dragon Canyon NUC - RTX 3060, Intel Core i9-12900
NVIDIA GeForce RTX 3060
207 fps
Intel Beast Canyon NUC, Intel Core i9-11900KB
NVIDIA GeForce RTX 3060
202 fps -2%
Intel Ghost Canyon NUC (RTX 2070), Intel Core i9-9980HK
NVIDIA GeForce RTX 2070 (Desktop)
178.6 fps -14%

3D-Leistung und Gaming Performance

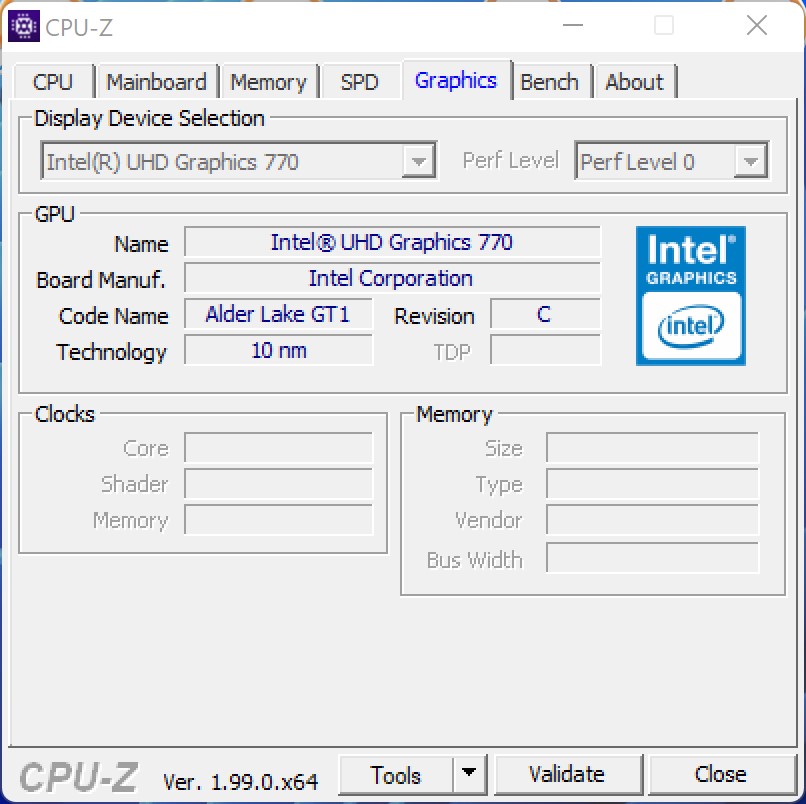
Da der Intel Core i9-12900 mit der Intel UHD Graphics 770 nur eine einfache iGPU bietet, ist die 3D-Leistung für anspruchsvolle Videospiele schlichtweg nicht vorhanden. Im Gehäuse lässt sich ab eine dedizierte Grafikkarte installieren, was das Gerät zu einem sehr kompakten Gaming-PC mutieren lässt. Aufgrund der Tatsache, dass wir den Beast Canyon NUC seinerzeit ebenfalls mit einer Nvidia GeForce RTX 3060 getestet hatten, haben wir uns auch beim Dragon Canyon NUC für ein Modell der RTX 3060 entschieden. Zusammen mit dem Alder-Lake-Prozessor steigt die Leistung um etwa 4 Prozent im Gaming-Betrieb. Ein Ergebnis, welches ein Upgrade nicht rechtfertigt und nur für den Neukauf relevant sein sollte. 

Das Zusammenspiel mit der Nvidia GeForce RTX 3060 aus dem Hause INNO 3D klappt sehr gut. Alle aktuellen Spiele lassen sich problemlos und mit ausreichend FPS in 1.440 genießen. Mitunter lassen sich aber auch viele Spiele sogar in 2.160p wiedergeben. Da wir aber mit steigender Auflösung und höheren Details eher im GPU-Limit stecken, ist die Leistung der CPU nur noch zweitrangig, was den geringen Leistungszuwachs gegenüber dem Best Canyon NUC rechtfertigt.  

Für weitere Vergleiche und Benchmarks verweisen wir daher auf unsere GPU-Vergleichstabelle.

Wer sein Dragon Canyon NUC mit einer dedizierten Grafikkarte bestücken möchte, sollte sich vorab über die Dimensionen der GPU genau informieren. Mehr als ein Zwei-Slot-Kühldesign darf die Grafikkarte nicht besitzen. Zudem sollte die maximale Länge von 30,5 Zentimetern beachtet werden.

Performance Rating - Percent
Zotac Magnus One (ECM73070C)
NVIDIA GeForce RTX 3070, i7-10700, Phison 512GB PA6620060U
88.8 pt
Inno3D GeForce RTX 3060 Twin X2
NVIDIA GeForce RTX 3060, R9 5900X, Corsair MP600
88.1 pt
Intel Dragon Canyon NUC - RTX 3060
NVIDIA GeForce RTX 3060, i9-12900, Transcend M.2 SSD 2200S TS512GMTE220S
87.7 pt
Intel Beast Canyon NUC
NVIDIA GeForce RTX 3060, i9-11900KB, Sabrent Rocket 4.0 500GB
84.4 pt
Intel Ghost Canyon NUC (RTX 2070)
GeForce RTX 2070 (Desktop), i9-9980HK, Kingston KC2500 1 TB SKC2500M81000G
75.9 pt
Borderlands 3
1280x720 Very Low Overall Quality (DX11)
Intel Dragon Canyon NUC - RTX 3060
NVIDIA GeForce RTX 3060, i9-12900, Transcend M.2 SSD 2200S TS512GMTE220S
185 fps
Inno3D GeForce RTX 3060 Twin X2
NVIDIA GeForce RTX 3060, R9 5900X, Corsair MP600
172 fps -7%
Intel Beast Canyon NUC
NVIDIA GeForce RTX 3060, i9-11900KB, Sabrent Rocket 4.0 500GB
156 fps -16%
Intel Ghost Canyon NUC (RTX 2070)
GeForce RTX 2070 (Desktop), i9-9980HK, Kingston KC2500 1 TB SKC2500M81000G
152 fps -18%
Zotac Magnus One (ECM73070C)
NVIDIA GeForce RTX 3070, i7-10700, Phison 512GB PA6620060U
149 fps -19%
1920x1080 Badass Overall Quality (DX11)
Intel Beast Canyon NUC
NVIDIA GeForce RTX 3060, i9-11900KB, Sabrent Rocket 4.0 500GB
100 fps +18%
Zotac Magnus One (ECM73070C)
NVIDIA GeForce RTX 3070, i7-10700, Phison 512GB PA6620060U
98.8 fps +17%
Intel Dragon Canyon NUC - RTX 3060
NVIDIA GeForce RTX 3060, i9-12900, Transcend M.2 SSD 2200S TS512GMTE220S
84.7 fps
Inno3D GeForce RTX 3060 Twin X2
NVIDIA GeForce RTX 3060, R9 5900X, Corsair MP600
78.5 fps -7%
Intel Ghost Canyon NUC (RTX 2070)
GeForce RTX 2070 (Desktop), i9-9980HK, Kingston KC2500 1 TB SKC2500M81000G
70.9 fps -16%
Metro Exodus
1280x720 Low Quality AF:4x
Intel Dragon Canyon NUC - RTX 3060
NVIDIA GeForce RTX 3060, i9-12900, Transcend M.2 SSD 2200S TS512GMTE220S
207 (93.55min - 336.7max) fps
Inno3D GeForce RTX 3060 Twin X2
NVIDIA GeForce RTX 3060, R9 5900X, Corsair MP600
202 (94.16min - 331.35max) fps -2%
Intel Beast Canyon NUC
NVIDIA GeForce RTX 3060, i9-11900KB, Sabrent Rocket 4.0 500GB
198 (96.07min - 323.73max) fps -4%
Intel Ghost Canyon NUC (RTX 2070)
GeForce RTX 2070 (Desktop), i9-9980HK, Kingston KC2500 1 TB SKC2500M81000G
181 (100.48min - 268.67max) fps -13%
Zotac Magnus One (ECM73070C)
NVIDIA GeForce RTX 3070, i7-10700, Phison 512GB PA6620060U
166 (92.98min - 251.64max) fps -20%
1920x1080 Ultra Quality AF:16x
Zotac Magnus One (ECM73070C)
NVIDIA GeForce RTX 3070, i7-10700, Phison 512GB PA6620060U
93.1 (45.73min - 151.06max) fps +43%
Intel Dragon Canyon NUC - RTX 3060
NVIDIA GeForce RTX 3060, i9-12900, Transcend M.2 SSD 2200S TS512GMTE220S
65.3 (34.71min - 117.86max) fps
Intel Ghost Canyon NUC (RTX 2070)
GeForce RTX 2070 (Desktop), i9-9980HK, Kingston KC2500 1 TB SKC2500M81000G
60.9 (33.61min - 92.62max) fps -7%
Intel Beast Canyon NUC
NVIDIA GeForce RTX 3060, i9-11900KB, Sabrent Rocket 4.0 500GB
59.8 (30.99min - 119.9max) fps -8%
Inno3D GeForce RTX 3060 Twin X2
NVIDIA GeForce RTX 3060, R9 5900X, Corsair MP600
55.1 (32.45min - 87.42max) fps -16%
Far Cry New Dawn
1280x720 Low Preset
Inno3D GeForce RTX 3060 Twin X2
NVIDIA GeForce RTX 3060, R9 5900X, Corsair MP600
163 (117min - 259max) fps +1%
Intel Dragon Canyon NUC - RTX 3060
NVIDIA GeForce RTX 3060, i9-12900, Transcend M.2 SSD 2200S TS512GMTE220S
161 (119min - 232max) fps
Intel Beast Canyon NUC
NVIDIA GeForce RTX 3060, i9-11900KB, Sabrent Rocket 4.0 500GB
144 (82min - 218max) fps -11%
Intel Ghost Canyon NUC (RTX 2070)
GeForce RTX 2070 (Desktop), i9-9980HK, Kingston KC2500 1 TB SKC2500M81000G
128 (92min - 190max) fps -20%
Zotac Magnus One (ECM73070C)
NVIDIA GeForce RTX 3070, i7-10700, Phison 512GB PA6620060U
126 (96min - 186max) fps -22%
1920x1080 Ultra Preset
Intel Dragon Canyon NUC - RTX 3060
NVIDIA GeForce RTX 3060, i9-12900, Transcend M.2 SSD 2200S TS512GMTE220S
113 (86min - 148max) fps
Inno3D GeForce RTX 3060 Twin X2
NVIDIA GeForce RTX 3060, R9 5900X, Corsair MP600
112 (83min - 146max) fps -1%
Intel Beast Canyon NUC
NVIDIA GeForce RTX 3060, i9-11900KB, Sabrent Rocket 4.0 500GB
102 (72min - 145max) fps -10%
Zotac Magnus One (ECM73070C)
NVIDIA GeForce RTX 3070, i7-10700, Phison 512GB PA6620060U
95 (66min - 149max) fps -16%
Intel Ghost Canyon NUC (RTX 2070)
GeForce RTX 2070 (Desktop), i9-9980HK, Kingston KC2500 1 TB SKC2500M81000G
79 (61min - 99max) fps -30%
Far Cry 5
1280x720 Low Preset AA:T
Inno3D GeForce RTX 3060 Twin X2
NVIDIA GeForce RTX 3060, R9 5900X, Corsair MP600
196 (146min - 267max) fps +2%
Intel Dragon Canyon NUC - RTX 3060
NVIDIA GeForce RTX 3060, i9-12900, Transcend M.2 SSD 2200S TS512GMTE220S
193 (135min - 251max) fps
Intel Beast Canyon NUC
NVIDIA GeForce RTX 3060, i9-11900KB, Sabrent Rocket 4.0 500GB
170 (105min - 231max) fps -12%
Zotac Magnus One (ECM73070C)
NVIDIA GeForce RTX 3070, i7-10700, Phison 512GB PA6620060U
150 (118min - 203max) fps -22%
Intel Ghost Canyon NUC (RTX 2070)
GeForce RTX 2070 (Desktop), i9-9980HK, Kingston KC2500 1 TB SKC2500M81000G
147 (119min - 193max) fps -24%
1920x1080 Ultra Preset AA:T
Inno3D GeForce RTX 3060 Twin X2
NVIDIA GeForce RTX 3060, R9 5900X, Corsair MP600
132 (109min - 150max) fps 0%
Intel Dragon Canyon NUC - RTX 3060
NVIDIA GeForce RTX 3060, i9-12900, Transcend M.2 SSD 2200S TS512GMTE220S
132 (114min - 150max) fps
Intel Beast Canyon NUC
NVIDIA GeForce RTX 3060, i9-11900KB, Sabrent Rocket 4.0 500GB
122 (93min - 151max) fps -8%
Zotac Magnus One (ECM73070C)
NVIDIA GeForce RTX 3070, i7-10700, Phison 512GB PA6620060U
117 (89min - 155max) fps -11%
Intel Ghost Canyon NUC (RTX 2070)
GeForce RTX 2070 (Desktop), i9-9980HK, Kingston KC2500 1 TB SKC2500M81000G
86 (68min - 111max) fps -35%
X-Plane 11.11
1280x720 low (fps_test=1)
Inno3D GeForce RTX 3060 Twin X2
NVIDIA GeForce RTX 3060, R9 5900X, Corsair MP600
160 fps +6%
Intel Beast Canyon NUC
NVIDIA GeForce RTX 3060, i9-11900KB, Sabrent Rocket 4.0 500GB
151 fps 0%
Intel Dragon Canyon NUC - RTX 3060
NVIDIA GeForce RTX 3060, i9-12900, Transcend M.2 SSD 2200S TS512GMTE220S
151 fps
Intel Ghost Canyon NUC (RTX 2070)
GeForce RTX 2070 (Desktop), i9-9980HK, Kingston KC2500 1 TB SKC2500M81000G
127 fps -16%
Zotac Magnus One (ECM73070C)
NVIDIA GeForce RTX 3070, i7-10700, Phison 512GB PA6620060U
124 fps -18%
1920x1080 high (fps_test=3)
Inno3D GeForce RTX 3060 Twin X2
NVIDIA GeForce RTX 3060, R9 5900X, Corsair MP600
112 fps +7%
Intel Beast Canyon NUC
NVIDIA GeForce RTX 3060, i9-11900KB, Sabrent Rocket 4.0 500GB
105 fps 0%
Intel Dragon Canyon NUC - RTX 3060
NVIDIA GeForce RTX 3060, i9-12900, Transcend M.2 SSD 2200S TS512GMTE220S
105 fps
Intel Ghost Canyon NUC (RTX 2070)
GeForce RTX 2070 (Desktop), i9-9980HK, Kingston KC2500 1 TB SKC2500M81000G
92.7 fps -12%
Zotac Magnus One (ECM73070C)
NVIDIA GeForce RTX 3070, i7-10700, Phison 512GB PA6620060U
91 fps -13%
Final Fantasy XV Benchmark
1280x720 Lite Quality
Inno3D GeForce RTX 3060 Twin X2
NVIDIA GeForce RTX 3060, R9 5900X, Corsair MP600
210 fps +7%
Intel Beast Canyon NUC
NVIDIA GeForce RTX 3060, i9-11900KB, Sabrent Rocket 4.0 500GB
196 fps 0%
Intel Dragon Canyon NUC - RTX 3060
NVIDIA GeForce RTX 3060, i9-12900, Transcend M.2 SSD 2200S TS512GMTE220S
196 fps
Intel Ghost Canyon NUC (RTX 2070)
GeForce RTX 2070 (Desktop), i9-9980HK, Kingston KC2500 1 TB SKC2500M81000G
193 (94min - 237max) fps -2%
Zotac Magnus One (ECM73070C)
NVIDIA GeForce RTX 3070, i7-10700, Phison 512GB PA6620060U
167 fps -15%
1920x1080 High Quality
Zotac Magnus One (ECM73070C)
NVIDIA GeForce RTX 3070, i7-10700, Phison 512GB PA6620060U
112 fps +26%
Intel Ghost Canyon NUC (RTX 2070)
GeForce RTX 2070 (Desktop), i9-9980HK, Kingston KC2500 1 TB SKC2500M81000G
90.6 (56min - 138max) fps +2%
Inno3D GeForce RTX 3060 Twin X2
NVIDIA GeForce RTX 3060, R9 5900X, Corsair MP600
88.6 fps 0%
Intel Beast Canyon NUC
NVIDIA GeForce RTX 3060, i9-11900KB, Sabrent Rocket 4.0 500GB
88.6 fps 0%
Intel Dragon Canyon NUC - RTX 3060
NVIDIA GeForce RTX 3060, i9-12900, Transcend M.2 SSD 2200S TS512GMTE220S
88.6 fps
Dota 2 Reborn
1280x720 min (0/3) fastest
Inno3D GeForce RTX 3060 Twin X2
NVIDIA GeForce RTX 3060, R9 5900X, Corsair MP600
202.1 (165min) fps +13%
Intel Beast Canyon NUC
NVIDIA GeForce RTX 3060, i9-11900KB, Sabrent Rocket 4.0 500GB
178.3 (153.2min) fps 0%
Intel Dragon Canyon NUC - RTX 3060
NVIDIA GeForce RTX 3060, i9-12900, Transcend M.2 SSD 2200S TS512GMTE220S
178.3 (153.2min) fps
Zotac Magnus One (ECM73070C)
NVIDIA GeForce RTX 3070, i7-10700, Phison 512GB PA6620060U
164.2 (143.5min) fps -8%
Intel Ghost Canyon NUC (RTX 2070)
GeForce RTX 2070 (Desktop), i9-9980HK, Kingston KC2500 1 TB SKC2500M81000G
155.6 (135.2min) fps -13%
1920x1080 ultra (3/3) best looking
Inno3D GeForce RTX 3060 Twin X2
NVIDIA GeForce RTX 3060, R9 5900X, Corsair MP600
159.7 (126.4min) fps +9%
Intel Beast Canyon NUC
NVIDIA GeForce RTX 3060, i9-11900KB, Sabrent Rocket 4.0 500GB
147.1 (126min) fps 0%
Intel Dragon Canyon NUC - RTX 3060
NVIDIA GeForce RTX 3060, i9-12900, Transcend M.2 SSD 2200S TS512GMTE220S
147.1 (126min) fps
Intel Ghost Canyon NUC (RTX 2070)
GeForce RTX 2070 (Desktop), i9-9980HK, Kingston KC2500 1 TB SKC2500M81000G
130.3 (114.9min) fps -11%
Zotac Magnus One (ECM73070C)
NVIDIA GeForce RTX 3070, i7-10700, Phison 512GB PA6620060U
129.7 (113.4min) fps -12%
3DMark
Fire Strike Extreme Graphics
Zotac Magnus One (ECM73070C)
NVIDIA GeForce RTX 3070, i7-10700, Phison 512GB PA6620060U
15597 Points +52%
Inno3D GeForce RTX 3060 Twin X2
NVIDIA GeForce RTX 3060, R9 5900X, Corsair MP600
10330 Points +1%
Intel Dragon Canyon NUC - RTX 3060
NVIDIA GeForce RTX 3060, i9-12900, Transcend M.2 SSD 2200S TS512GMTE220S
10244 Points
Intel Beast Canyon NUC
NVIDIA GeForce RTX 3060, i9-11900KB, Sabrent Rocket 4.0 500GB
10181 Points -1%
Intel Ghost Canyon NUC (RTX 2070)
GeForce RTX 2070 (Desktop), i9-9980HK, Kingston KC2500 1 TB SKC2500M81000G
9979 Points -3%
1920x1080 Fire Strike Graphics
Zotac Magnus One (ECM73070C)
NVIDIA GeForce RTX 3070, i7-10700, Phison 512GB PA6620060U
30090 Points +37%
Intel Dragon Canyon NUC - RTX 3060
NVIDIA GeForce RTX 3060, i9-12900, Transcend M.2 SSD 2200S TS512GMTE220S
21984 Points
Inno3D GeForce RTX 3060 Twin X2
NVIDIA GeForce RTX 3060, R9 5900X, Corsair MP600
21847 Points -1%
Intel Beast Canyon NUC
NVIDIA GeForce RTX 3060, i9-11900KB, Sabrent Rocket 4.0 500GB
21379 Points -3%
Intel Ghost Canyon NUC (RTX 2070)
GeForce RTX 2070 (Desktop), i9-9980HK, Kingston KC2500 1 TB SKC2500M81000G
20775 Points -5%
2560x1440 Time Spy Graphics
Zotac Magnus One (ECM73070C)
NVIDIA GeForce RTX 3070, i7-10700, Phison 512GB PA6620060U
12668 Points +48%
Intel Ghost Canyon NUC (RTX 2070)
GeForce RTX 2070 (Desktop), i9-9980HK, Kingston KC2500 1 TB SKC2500M81000G
8631 Points +1%
Intel Dragon Canyon NUC - RTX 3060
NVIDIA GeForce RTX 3060, i9-12900, Transcend M.2 SSD 2200S TS512GMTE220S
8578 Points
Inno3D GeForce RTX 3060 Twin X2
NVIDIA GeForce RTX 3060, R9 5900X, Corsair MP600
8559 Points 0%
Intel Beast Canyon NUC
NVIDIA GeForce RTX 3060, i9-11900KB, Sabrent Rocket 4.0 500GB
8525 Points -1%
3DMark 11
1280x720 Performance GPU
Zotac Magnus One (ECM73070C)
NVIDIA GeForce RTX 3070, i7-10700, Phison 512GB PA6620060U
40950 Points +40%
Intel Dragon Canyon NUC - RTX 3060
NVIDIA GeForce RTX 3060, i9-12900, Transcend M.2 SSD 2200S TS512GMTE220S
29172 Points
Intel Beast Canyon NUC
NVIDIA GeForce RTX 3060, i9-11900KB, Sabrent Rocket 4.0 500GB
28939 Points -1%
Intel Ghost Canyon NUC (RTX 2070)
GeForce RTX 2070 (Desktop), i9-9980HK, Kingston KC2500 1 TB SKC2500M81000G
28828 Points -1%
Inno3D GeForce RTX 3060 Twin X2
NVIDIA GeForce RTX 3060, R9 5900X, Corsair MP600
28072 Points -4%
1280x720 Performance
Zotac Magnus One (ECM73070C)
NVIDIA GeForce RTX 3070, i7-10700, Phison 512GB PA6620060U
29057 Points +5%
Intel Dragon Canyon NUC - RTX 3060
NVIDIA GeForce RTX 3060, i9-12900, Transcend M.2 SSD 2200S TS512GMTE220S
27726 Points
Inno3D GeForce RTX 3060 Twin X2
NVIDIA GeForce RTX 3060, R9 5900X, Corsair MP600
26986 Points -3%
Intel Beast Canyon NUC
NVIDIA GeForce RTX 3060, i9-11900KB, Sabrent Rocket 4.0 500GB
25149 Points -9%
Intel Ghost Canyon NUC (RTX 2070)
GeForce RTX 2070 (Desktop), i9-9980HK, Kingston KC2500 1 TB SKC2500M81000G
24131 Points -13%

Intel NUC 12 Dragon Canyon + Nvidia GeForce RTX 3060

min. mittel hoch max.QHD4K
GTA V (2015) 186 181 177 104 81.4 82.3
The Witcher 3 (2015) 462 305 178 91.3 62.5
Dota 2 Reborn (2015) 178.3 161.7 155.6 147.1 116.1
Final Fantasy XV Benchmark (2018) 196 123 88.6 64.8 38
X-Plane 11.11 (2018) 151 133 105 88.5
Far Cry 5 (2018) 193 153 139 132 94 48
Strange Brigade (2018) 491 230 180 154 116 66.8
Far Cry New Dawn (2019) 161 132 126 113 92 51
Metro Exodus (2019) 207 113 83.7 65.3 51.7 32.2
Borderlands 3 (2019) 185 148 104 84.7 60.3 33.3
F1 2020 (2020) 355 259 208 142 106 60.2
F1 2021 (2021) 419 261 206 96.9 72 40.9
Far Cry 6 (2021) 167 129 110 96 70.5 39.3

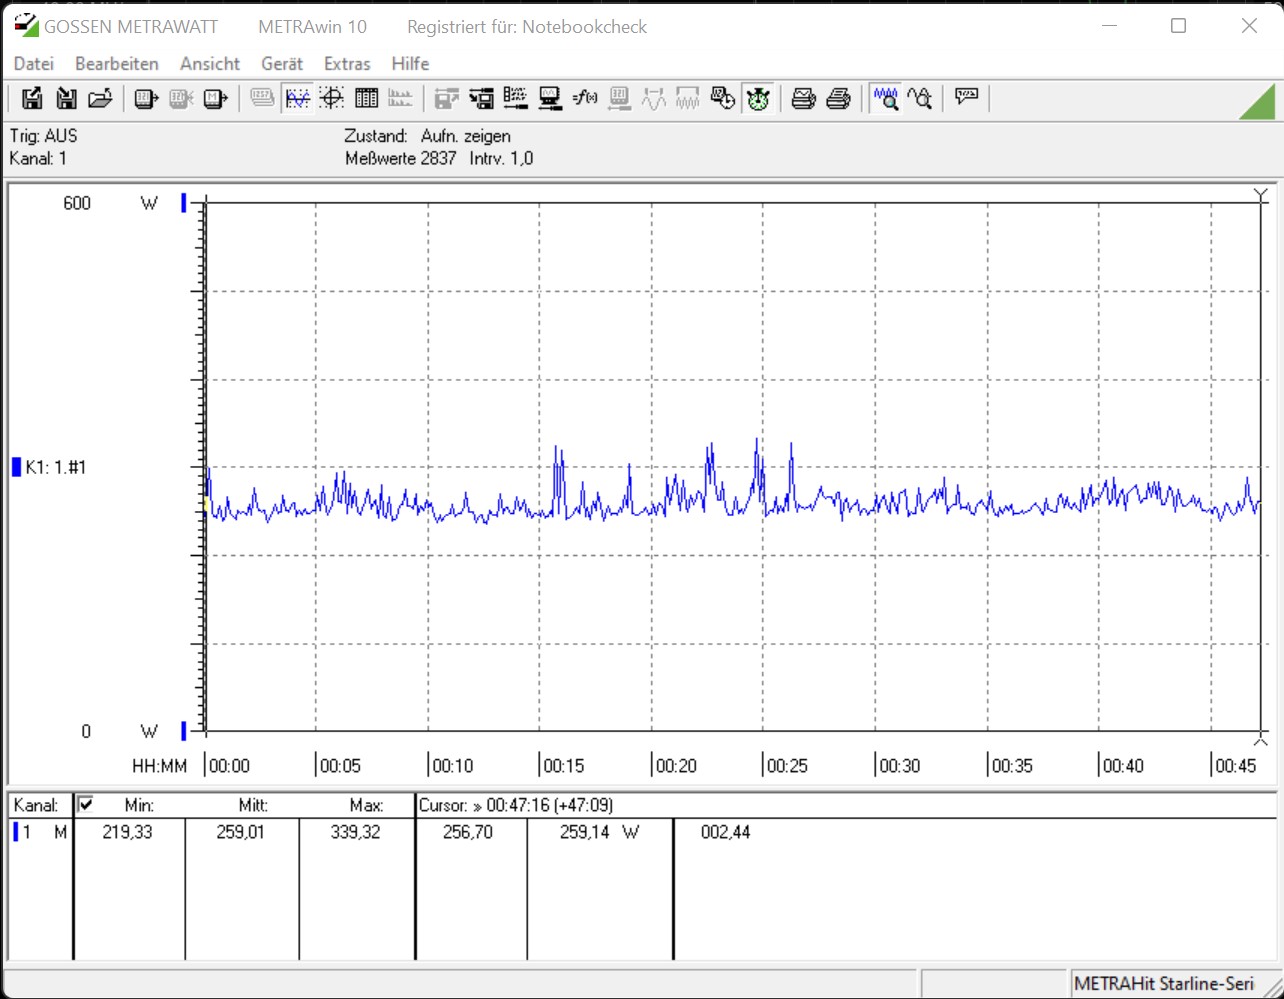
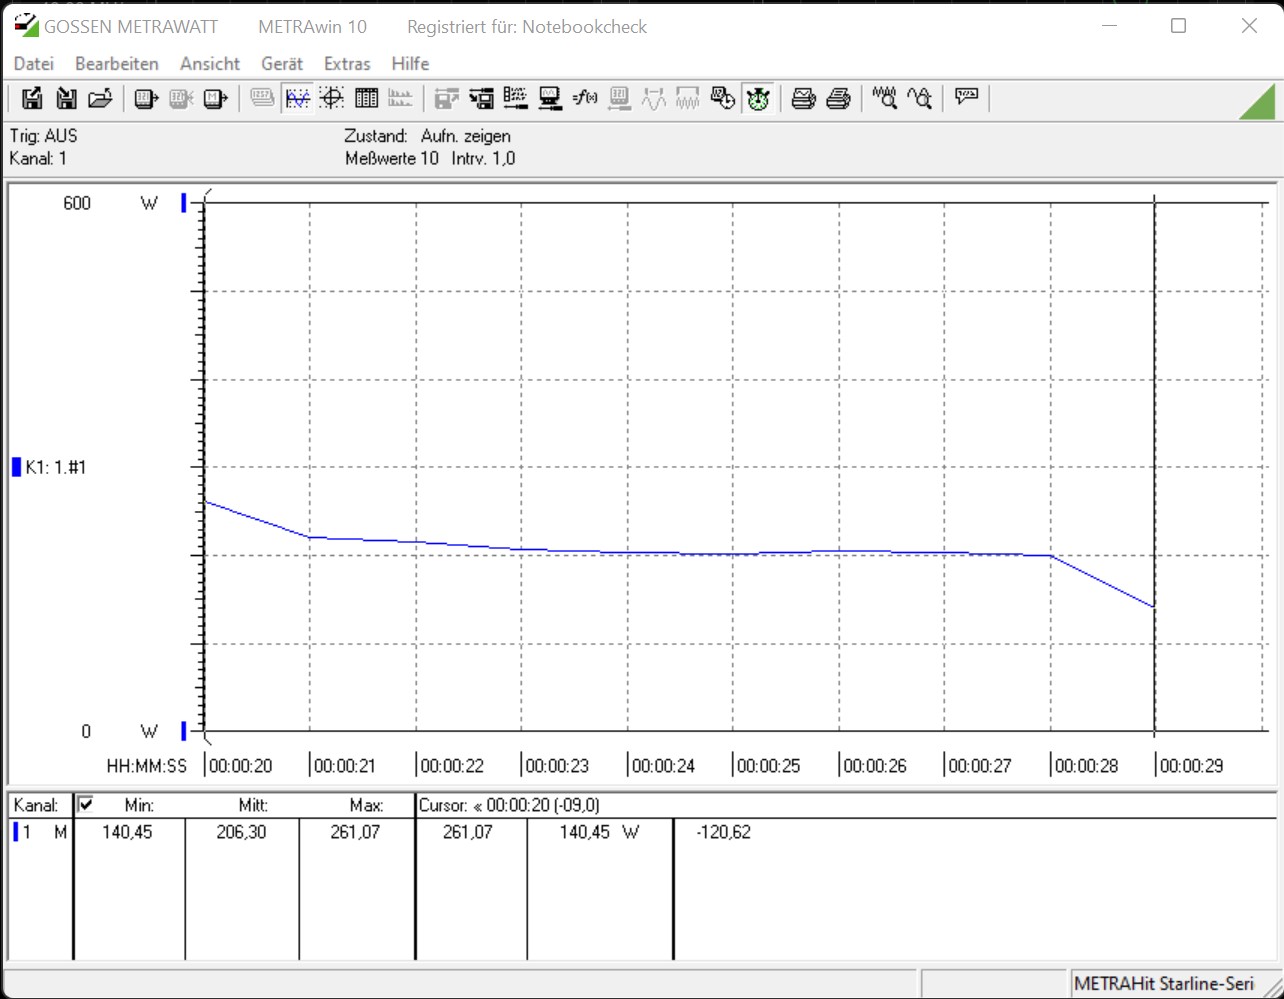
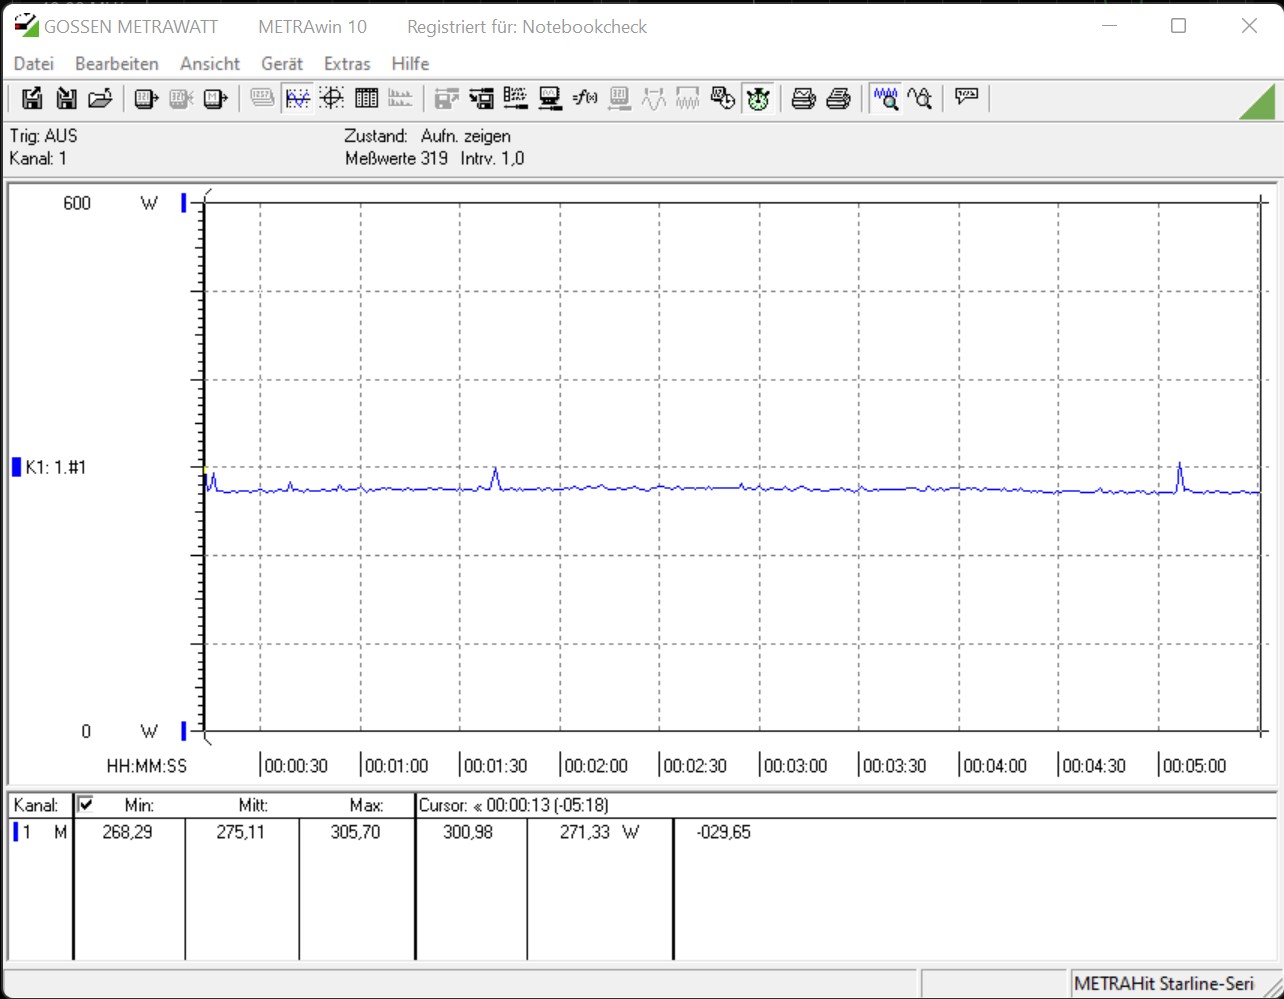
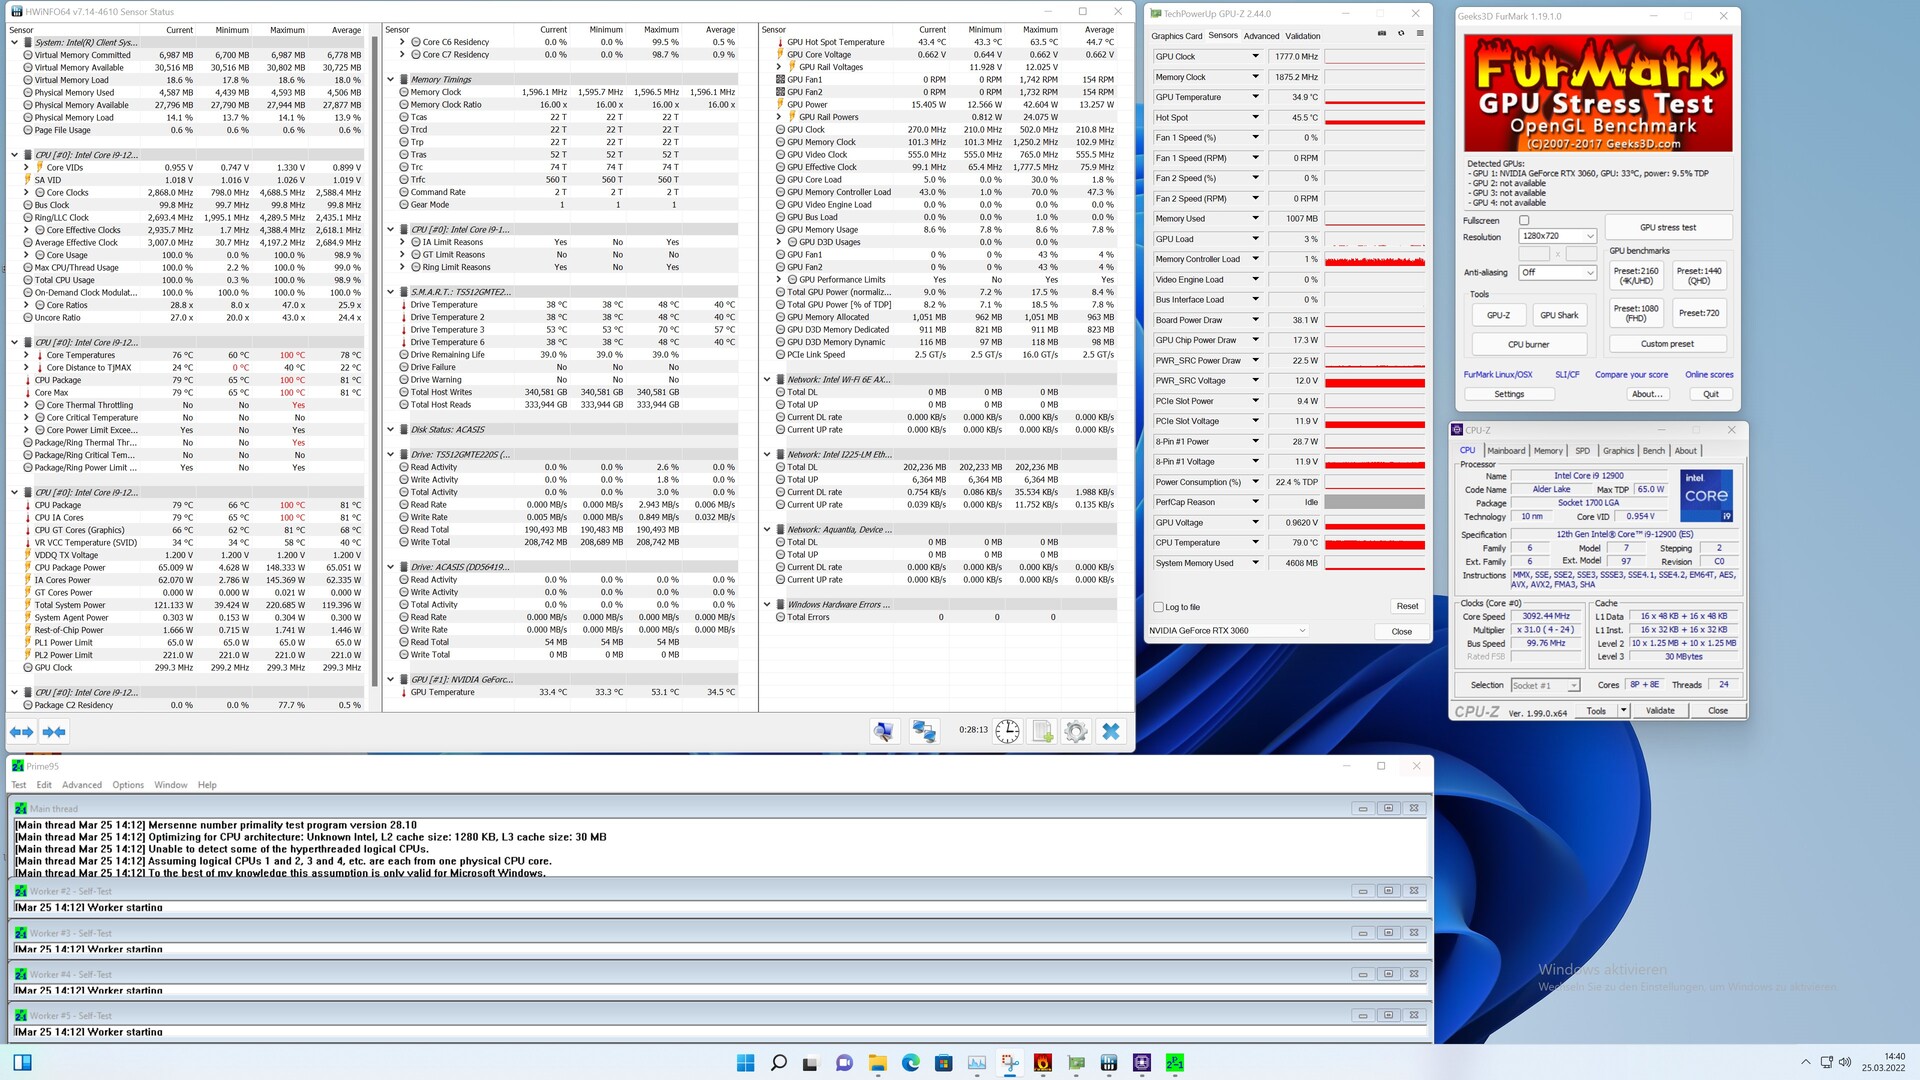
Energieverbrauch und Hitzeentwicklung und Lautstärke beim Intel NUC 12 Dragon Canyon

Intel NUC 12 Dragon Canyon beim Stresstest

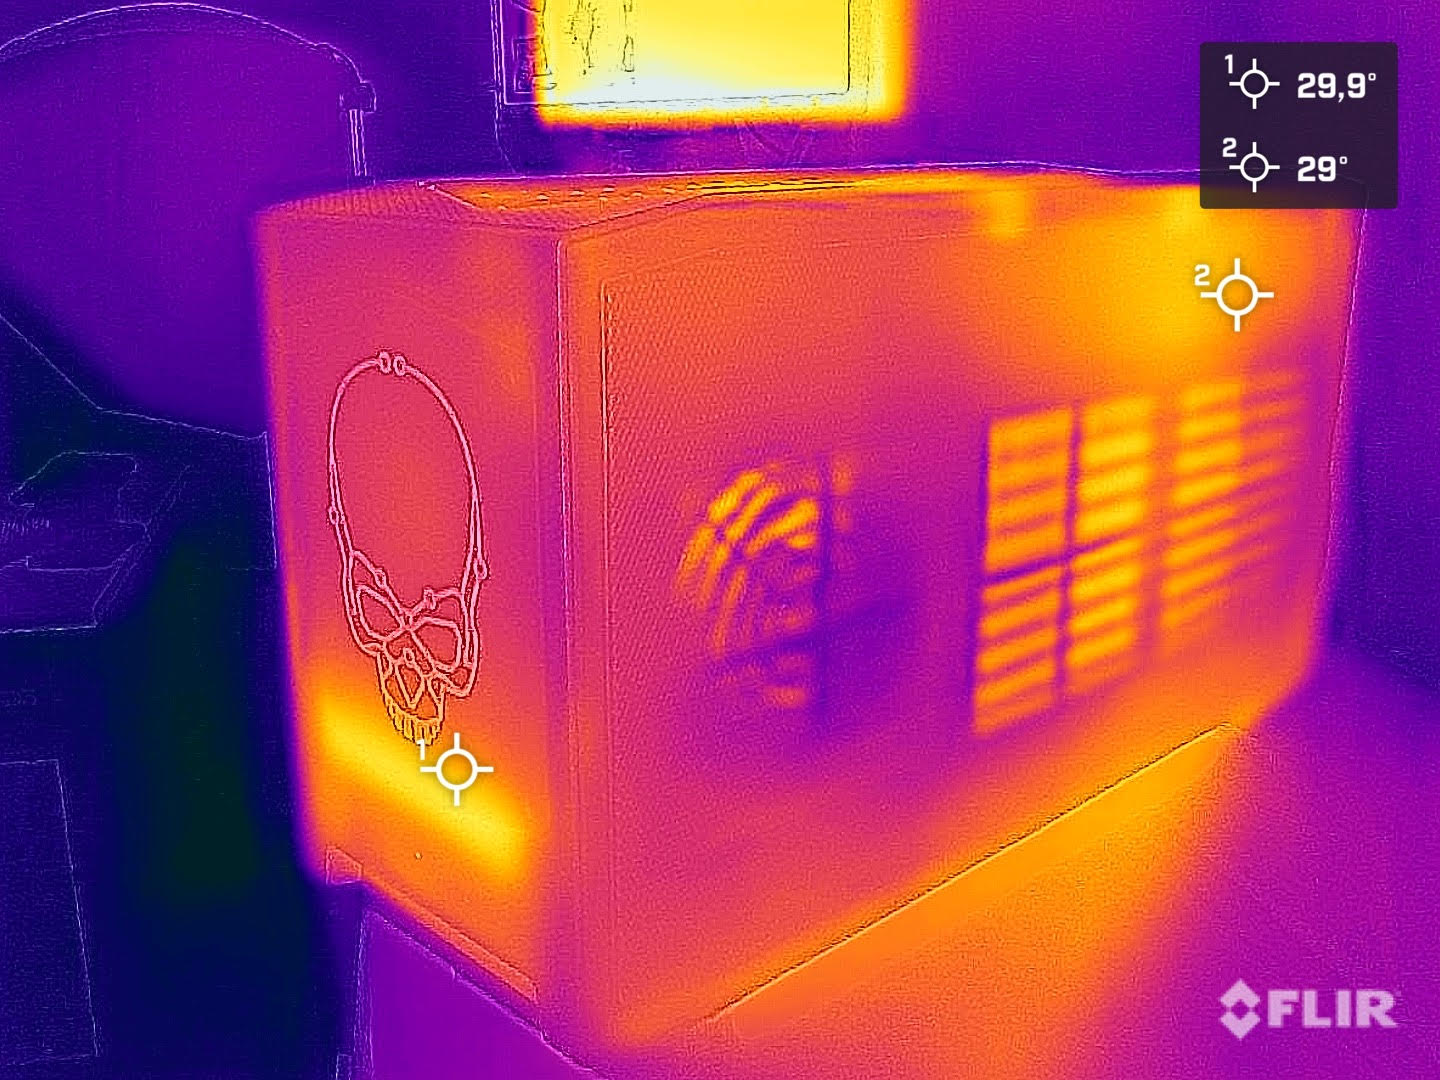
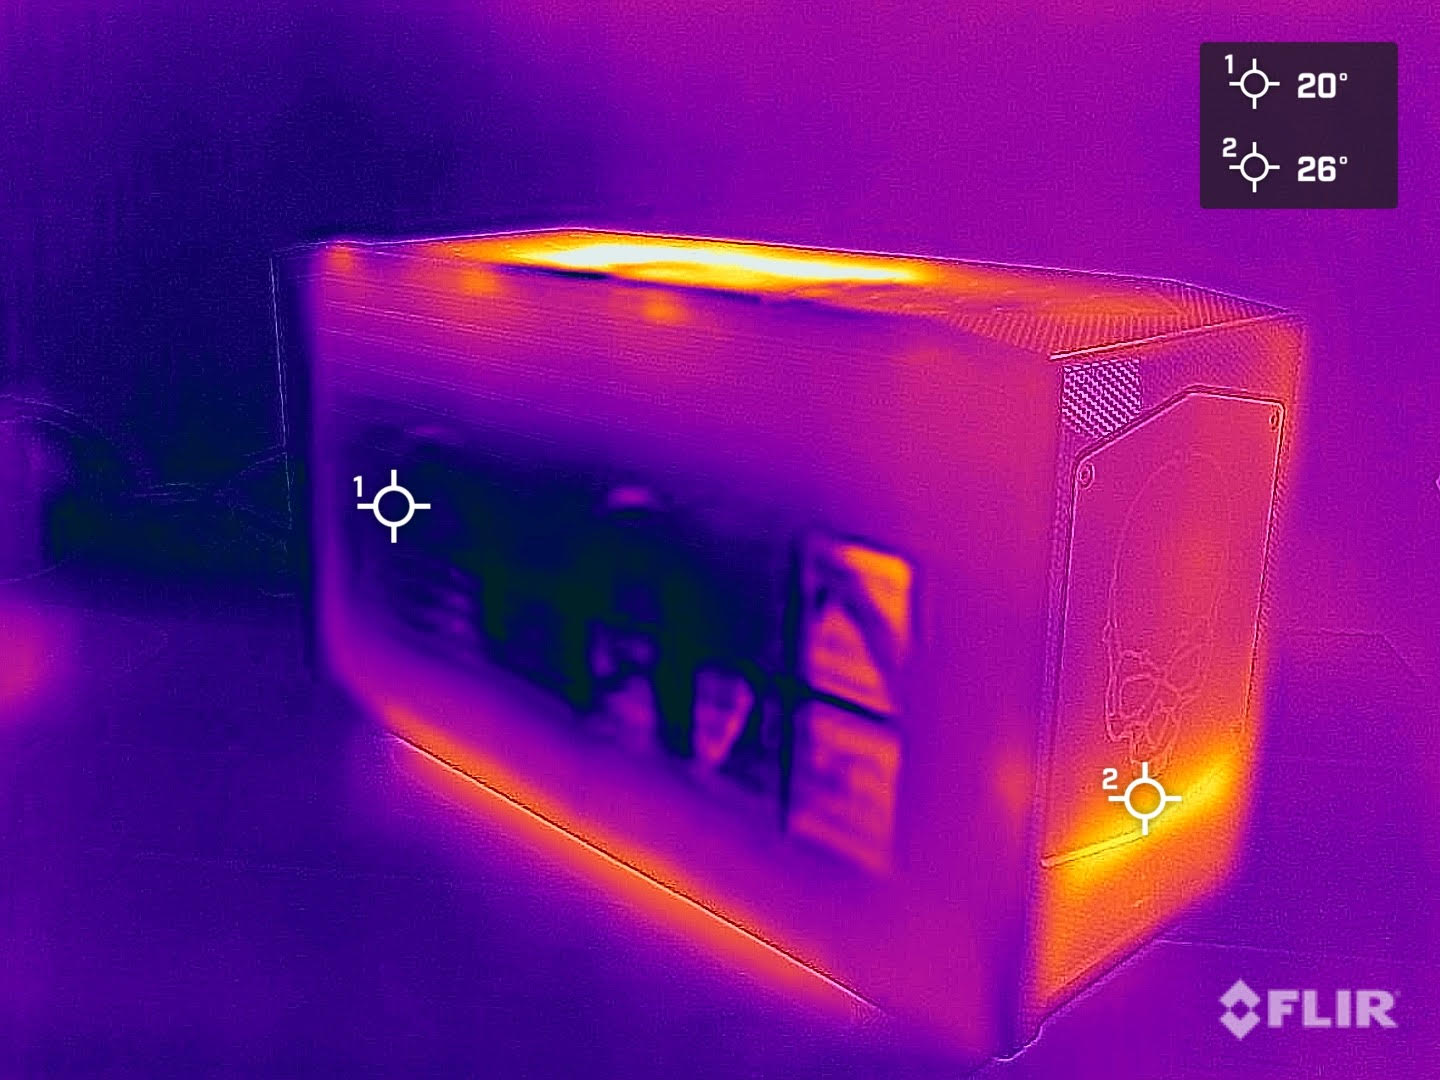
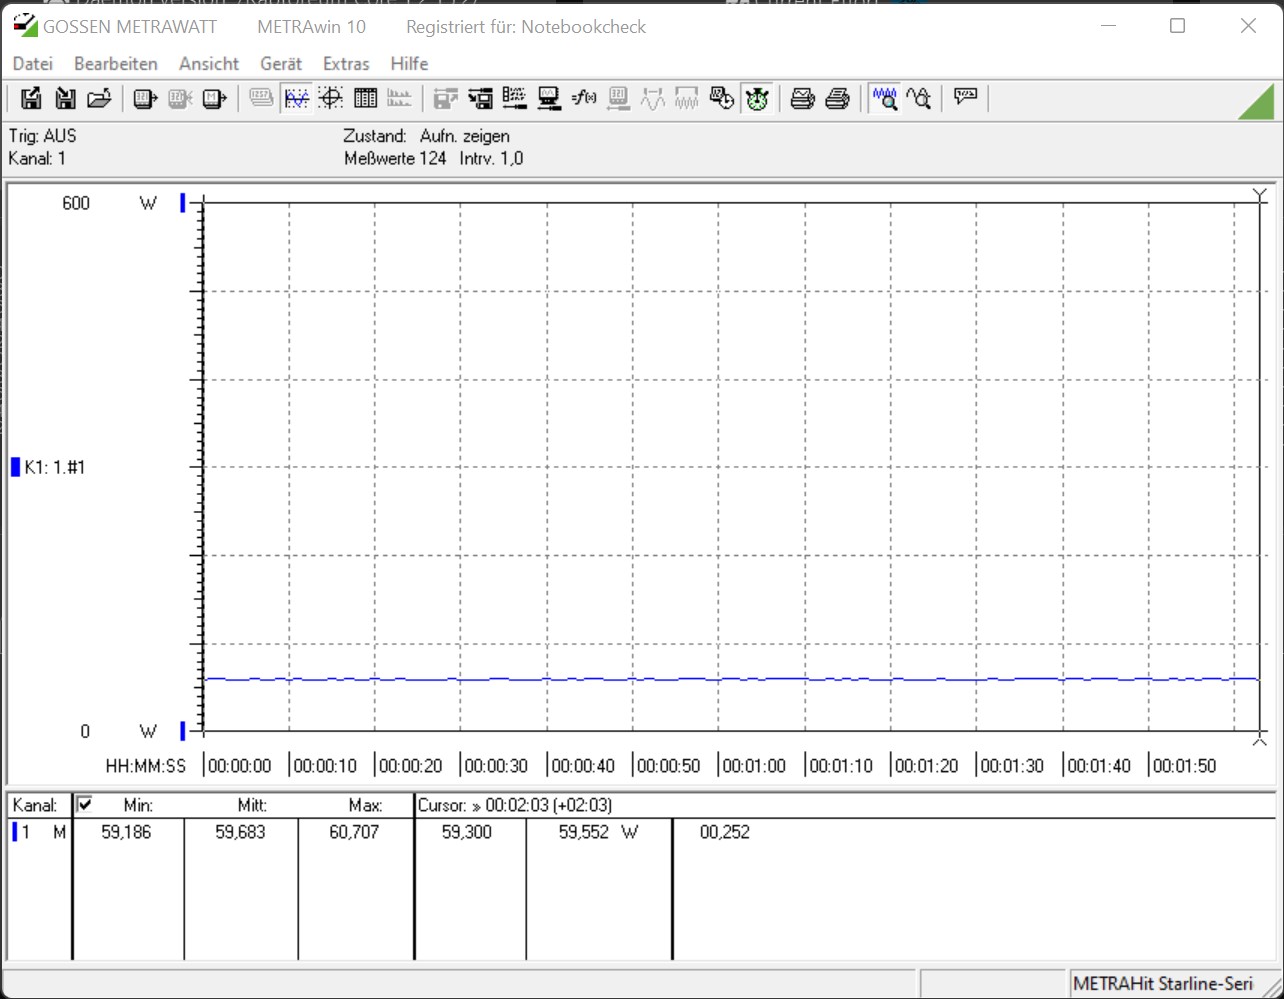
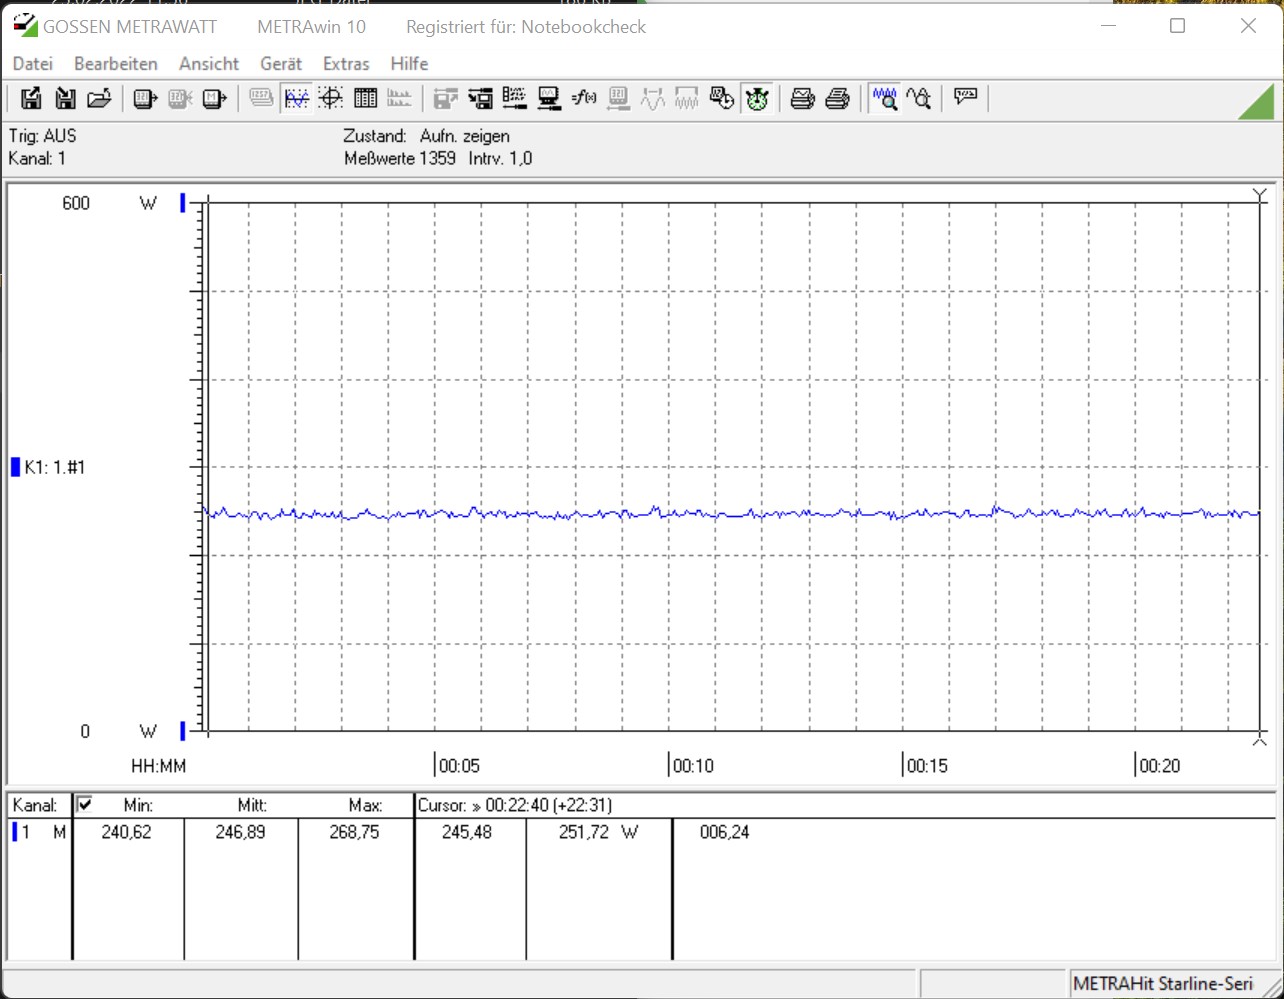
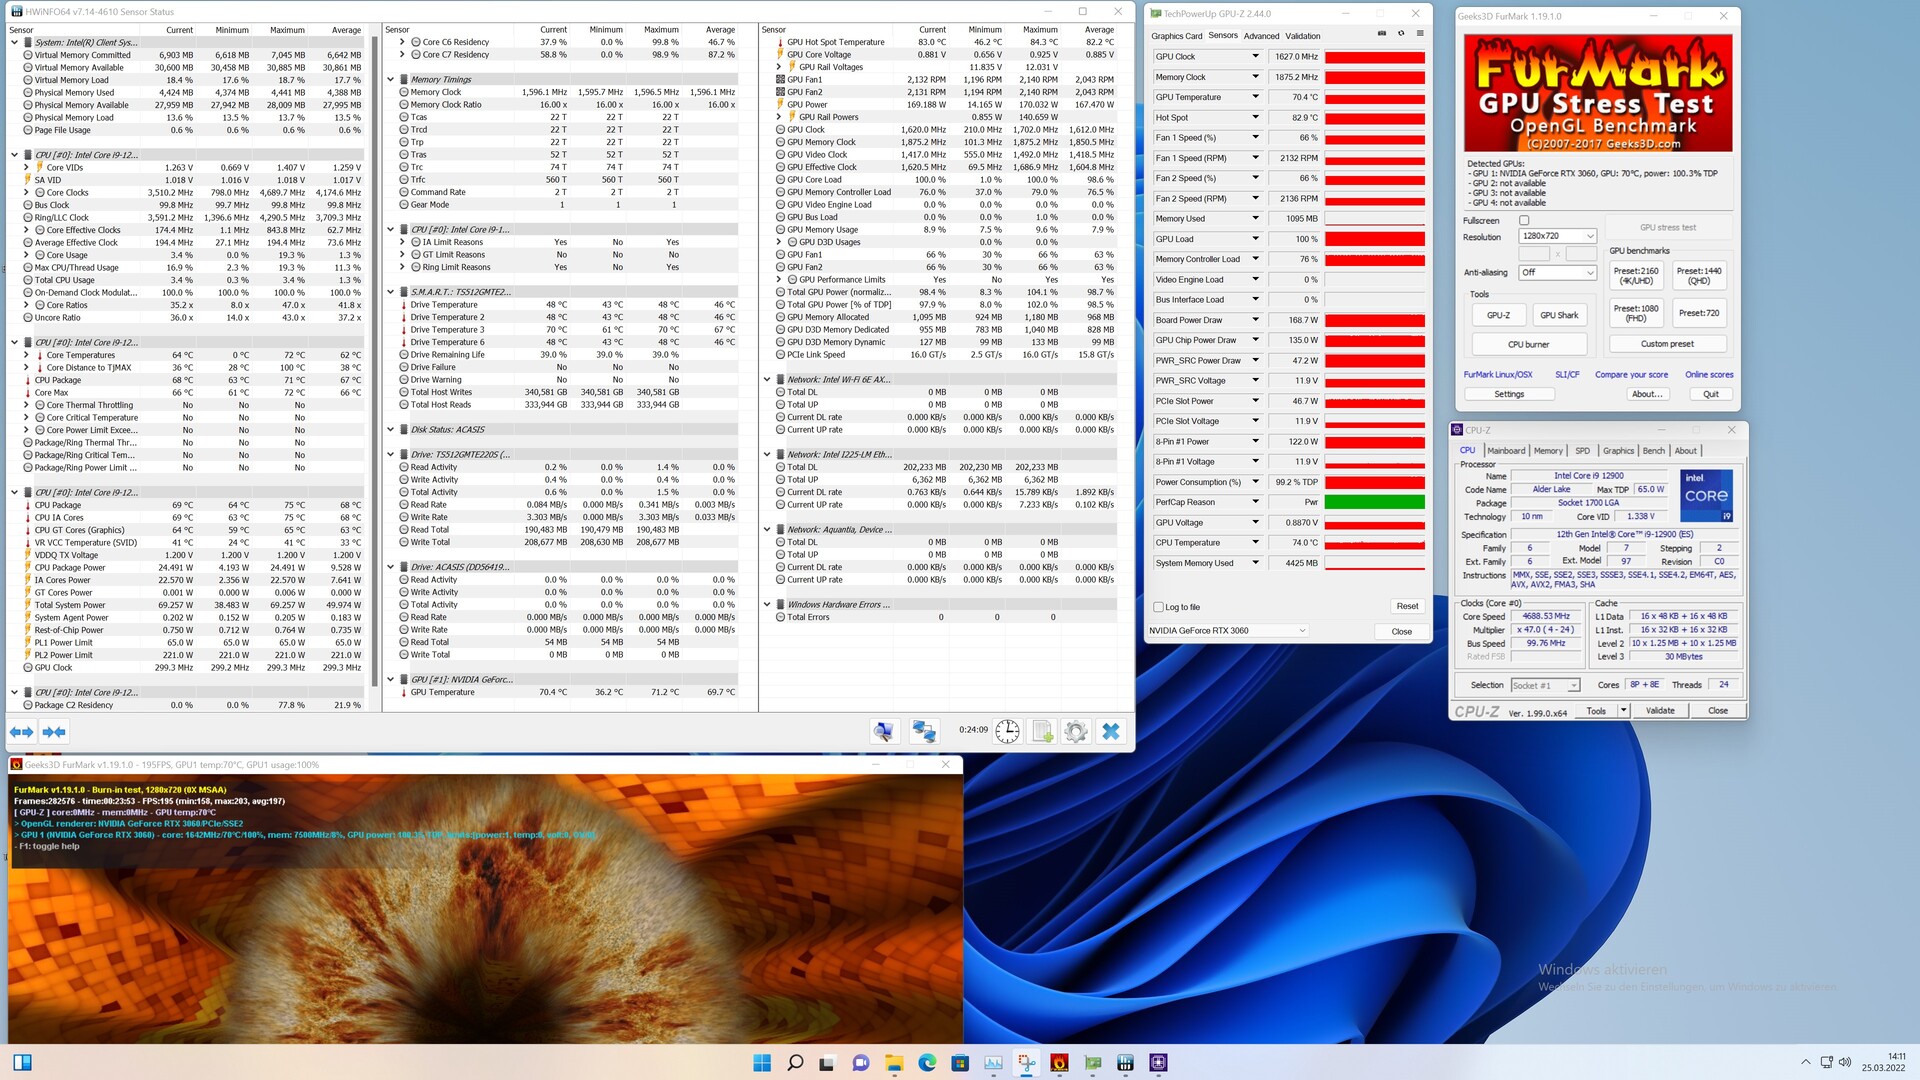
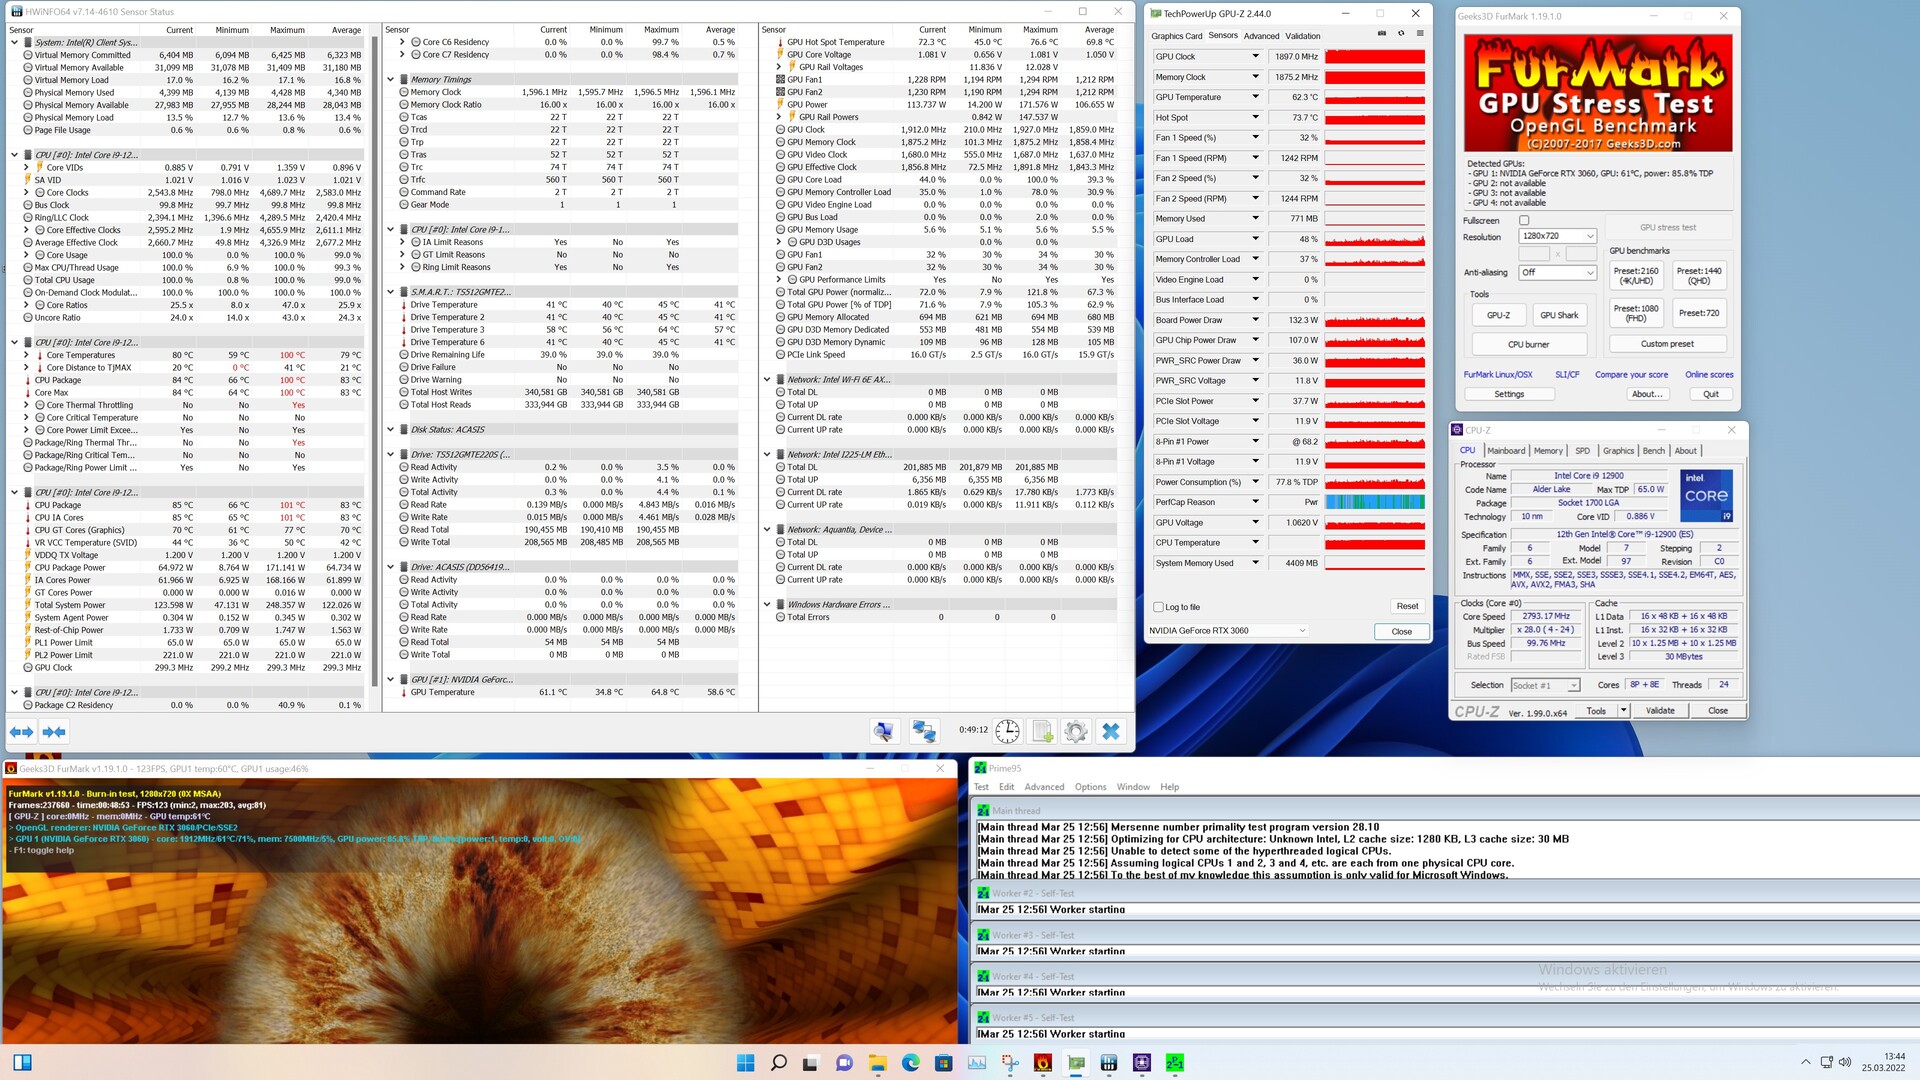
Beim Intel NUC 12 Extreme Kit sorgt der Intel Core i9-12900 für einen deutlich höheren Energieverbrauch im Vergleich zum Intel NUC 11 Extreme Kit. Aufgrund der höheren TDP des Intel Core i9-12900 gegenüber dem Intel Core i9-11900KB war dieses aber schon absehbar. Gegenüber den anderen beiden Alder-Lake Vergleichssystemen, die wir hier einmal mit aufgelistet haben, fällt der Energiebedarf des Intel Dragon Canyon NUC jedoch deutlich geringer aus. Der Grund ist aber schnell gefunden, denn die relativ kleine Kühleinheit ist unter Last mit dem Intel Core i9-12900 schnell am Limit, sodass die Leistung des Prozessors gedrosselt werden muss. Unter Last wird fast immer das Temperatur-Limit von 100 °C spielend erreicht. Beim Stresstest mit Prime95 wird schon nach ein paar Sekunden das Temperaturlimit erreicht. Durchschnittlich taktet der Intel Core i9-12900 aber dennoch mit knapp 2,6 GHz, was immerhin noch etwas mehr als der Basistakt (2,4 GHz) ist. Zu erwähnen ist jedoch noch, dass das Temperaturlimit nur sehr kurz erreicht wird. Über den Test hinweg liegt die durchschnittliche Temperatur bei 78 °C, was unterm Strich in einem vertretbaren Rahmen liegt. Ein ähnliches Bild zeigt sich auch bei gleichzeitiger Belastung von CPU und GPU. 

Einen großen Nachteil hat die kompakte Bauweise. Schon der Intel Beast Canyon NUC war unter Last deutlich hörbar. Etwas besser macht es Intel beim Dragon Canyon NUC, wenngleich dieser aber mit 45,1 dB(A) unter Volllast aber immer noch deutlich hörbar ist. Im Leerlauf oder bei geringer Last arbeitet das System aber weitgehend lautlos. Nur ab und an ist ein Auftouren der Lüfter zu hören. Das Lüftergeräusch ist aber aufgrund der niedrigen Frequenzen relativ angenehm.

Lautstärkediagramm

Idle
30.2 / 30.4 / 30.8 dB(A)
Last
/ 45.1 dB(A)
  red to green bar
 
 
30 dB
leise
40 dB(A)
deutlich hörbar
50 dB(A)
störend
 
min: dark, med: mid, max: light   Earthworks M23R, Arta (aus 15 cm gemessen)   Umgebungsgeräusche: 30.2 dB(A)
Power Consumption
1920x1080 The Witcher 3 ultra (external Monitor)
Intel Core i9-12900K
NVIDIA Titan RTX, i9-12900K, Intel Optane 905P 480GB 2.5 (Idle: 70.5 W)
463 (439min - 490max) Watt * -68%
AMD Ryzen 9 3950X
NVIDIA Titan RTX, R9 3950X, Intel Optane 905P 480GB 2.5 (Idle: 95 W)
423.6 (400min - 442max) Watt * -54%
Intel Core i7-12700K
NVIDIA Titan RTX, i7-12700K, Intel Optane 905P 480GB 2.5 (Idle: 81 W)
419.7 (402min - 454max) Watt * -53%
Intel Core i9-10900K
NVIDIA Titan RTX, i9-10900K, WDC PC SN720 SDAQNTW-512G (Idle: 52.3 W)
396.2 (380min - 475max) Watt * -44%
Intel Core i5-10600K
NVIDIA Titan RTX, i5-10600K (Idle: 52.2 W)
386.9 (380min - 404max) Watt * -41%
Corsair One i160
GeForce RTX 2080 Ti (Desktop), i9-9900K, Samsung PM961 NVMe MZVLW512HMJP (Idle: 51.5 W)
359 (348min - 374max) Watt * -31%
Intel Dragon Canyon NUC - RTX 3060
NVIDIA GeForce RTX 3060, i9-12900, Transcend M.2 SSD 2200S TS512GMTE220S
275 (270min, 270P1 - 306max) Watt *
Intel Ghost Canyon NUC (RTX 2070)
GeForce RTX 2070 (Desktop), i9-9980HK, Kingston KC2500 1 TB SKC2500M81000G (Idle: 33.1 W)
237.1 (227min - 263max) Watt * +14%
Intel Beast Canyon NUC
NVIDIA GeForce RTX 3060, i9-11900KB, Sabrent Rocket 4.0 500GB (Idle: 32 W)
229.9 (219min - 254max) Watt * +16%
Prime95 V2810 Stress (external Monitor)
Intel Core i7-12700K
NVIDIA Titan RTX, i7-12700K, Intel Optane 905P 480GB 2.5 (Idle: 81 W)
281 (250min - 366max) Watt * -86%
Intel Core i9-12900K
NVIDIA Titan RTX, i9-12900K, Intel Optane 905P 480GB 2.5 (Idle: 70.5 W)
279.6 (261min - 357max) Watt * -85%
Intel Core i9-10900K
NVIDIA Titan RTX, i9-10900K, WDC PC SN720 SDAQNTW-512G (Idle: 52.3 W)
275.7 (254min - 385max) Watt * -83%
Intel Core i5-10600K
NVIDIA Titan RTX, i5-10600K (Idle: 52.2 W)
204.4 (191min - 261max) Watt * -35%
AMD Ryzen 9 3950X
NVIDIA Titan RTX, R9 3950X, Intel Optane 905P 480GB 2.5 (Idle: 95 W)
198.8 (185min - 240max) Watt * -32%
Intel Dragon Canyon NUC - RTX 3060
NVIDIA GeForce RTX 3060, i9-12900, Transcend M.2 SSD 2200S TS512GMTE220S
151 (143min, 144P1 - 326max) Watt *
Intel Beast Canyon NUC
NVIDIA GeForce RTX 3060, i9-11900KB, Sabrent Rocket 4.0 500GB (Idle: 34 W)
112.9 (108min - 135max) Watt * +25%
Intel Ghost Canyon NUC (RTX 2070)
GeForce RTX 2070 (Desktop), i9-9980HK, Kingston KC2500 1 TB SKC2500M81000G (Idle: 33.1 W)
109.4 (107min - 151max) Watt * +28%
Cinebench R15 Multi (external Monitor)
Intel Core i9-12900K
NVIDIA Titan RTX, i9-12900K, Intel Optane 905P 480GB 2.5 (Idle: 70.5 W)
324.4 Watt * -57%
Intel Core i7-12700K
NVIDIA Titan RTX, i7-12700K, Intel Optane 905P 480GB 2.5 (Idle: 81 W)
278.2 (151min - 298max) Watt * -35%
Intel Core i9-10900K
NVIDIA Titan RTX, i9-10900K, WDC PC SN720 SDAQNTW-512G (Idle: 52.3 W)
268.5 (265min - 270max) Watt * -30%
AMD Ryzen 9 3950X
NVIDIA Titan RTX, R9 3950X, Intel Optane 905P 480GB 2.5 (Idle: 95 W)
219.5 (218min - 225max) Watt * -7%
Intel Dragon Canyon NUC - RTX 3060
NVIDIA GeForce RTX 3060, i9-12900, Transcend M.2 SSD 2200S TS512GMTE220S
206 (140min, 145P1 - 261max) Watt *
Intel Core i5-10600K
NVIDIA Titan RTX, i5-10600K (Idle: 52.2 W)
172.5 (170min - 176max) Watt * +16%
Intel Beast Canyon NUC
NVIDIA GeForce RTX 3060, i9-11900KB, Sabrent Rocket 4.0 500GB (Idle: 32 W)
123.9 (73min - 147max) Watt * +40%
Temperatures - CPU Temperature Prime95
Intel Dragon Canyon NUC - RTX 3060
NVIDIA GeForce RTX 3060, i9-12900, Transcend M.2 SSD 2200S TS512GMTE220S
100 °C
Intel Core i9-10900K
NVIDIA Titan RTX, i9-10900K, WDC PC SN720 SDAQNTW-512G
88 °C -12%
AMD Ryzen 9 3950X
NVIDIA Titan RTX, R9 3950X, Intel Optane 905P 480GB 2.5
83.8 °C -16%
Intel Core i5-10600K
NVIDIA Titan RTX, i5-10600K
70 °C -30%

* ... kleinere Werte sind besser

Intel NUC 12 Extreme Kit – Dragon Canyon - Stromverbrauch Idle
Intel NUC 12 Extreme Kit – Dragon Canyon - Stromverbrauch Prime95
Intel NUC 12 Extreme Kit – Dragon Canyon - Stromverbrauch FurMark
Intel NUC 12 Extreme Kit – Dragon Canyon - Stromverbrauch Prime95 und FurMark
Intel NUC 12 Extreme Kit – Dragon Canyon - Stromverbrauch Cinebench R15 nT
Intel NUC 12 Extreme Kit – Dragon Canyon - Stromverbrauch The Witcher 3 (Ultra-Preset)
Intel NUC 12 Extreme Kit – Dragon Canyon - Stresstest Prime95 solo
Intel NUC 12 Extreme Kit – Dragon Canyon - Stresstest FurMark solo
Intel NUC 12 Extreme Kit – Dragon Canyon - Stresstest Prime95 und FurMark

Pro

+ stabiles und kompaktes Gehäuse
+ Core i9 mit 16 Kernen und 24 Threads
+ gesockelter Prozessor
+ hohe Systemperformance
+ Netzteil mit SFX-Formfaktor mit 650 W
+ viele Anschlussmöglichkeiten
+ 2x Thunderbolt 4
+ UHS-II SD-Kartenleser
+ Wi-Fi 6E
+ 10Gbe LAN

Contra

- deutlich hörbar unter Last
- Kühleinheit sehr schnell am Limit
- eingeschränkte Kompatibilität bei Erweiterungskarten

Fazit - Ein kompaktes Arbeitstier

Intel Dragon Canyon NUC - NUC12DCMi9 im Test, zur Verfügung gestellt von Intel Deutschland

Der Intel NUC 12 Dragon Canyon ist ein kleines Upgrade des Intel NUC 11 Extreme Kit alias Beast Canyon. Mit neuer Alder-Lake-CPU betreibt Intel Produktpflege und schickt den älteren Tiger-Lake in Rente. Zudem gibt es aber erstmals eine gesockelte CPU in dem Compute-Element, was den Einsatz verschiedener Prozessoren ermöglicht. Rein leistungstechnisch kann der Intel Core i9-12900 etwas mehr Performance bieten als der Intel Core i9-11900KB. Gleichwohl bietet die kompakte Bauweise aber nur bedingt Platz für eine angemessene Kühlung. Diese ist mit dem ungedrosselten Intel Core i9-12900 unter Last sehr schnell am Limit, sodass immer mal wieder das Temperaturlimit erreicht wird.

Der Kaufpreis liegt derzeit bei 1.450 Euro für das Barebone-System. Wenn man die restlichen Komponenten, wie RAM, SSD oder GPU, mit einkalkuliert ist der Intel NUC 12 Dragon Canyon nicht viel teurer als andere Komplettsysteme. Somit hat der Kunde die Qual der Wahl. Wenn einem das Design des Intel NUC 12 Dragon Canyon gefällt, kann man hier bedenkenlos zugreifen. Die vielfältigen Anschlüsse sind zukunftssicher und in ausreichender Anzahl vorhanden. Selbst auf einen schnellen SD-Kartenleser mit dem UHS-II-Standard wird nicht verzichtet.

Mit dem Intel NUC 12 Extreme Kit alias Dragon Canyon schraubt Intel die Messlatte in puncto Leistung bei seinen Kompaktgeräten noch einmal weiter nach oben.

Bleibt anschließend noch die eingangs erwähnte Frage zu beantworten. Rein optisch würden wir den Intel NUC 12 Dragon Canyon eher im Gaming-Bereich einordnen. Aufgrund der Leistung des Alder-Lake-Prozessors und der iGPU eignet sich das System auch als High-End-Office-PC. Zudem besteht auch die Möglichkeit eine professionelle Grafikkarte einzubauen, was das System wiederum zu einer vollwertigen Workstation mutieren lässt. Foto- und Viedeobearbeitung sind dann auch mit dem kleinen Intel NUC 12 Dragon Canyon spielend möglich. 

Die Alternative zum Intel NUC 12 Extreme Kit – Dragon Canyon wäre der eigene Zusammenbau eines Systems, bei dem die Kosten vermutlich auf demselben Level liegen würden. Mit dem Zotac Magnus One gibt es eine gute Alternative, wenn es um sehr kompakte Gaming-PCs geht.

static version load dynamic
Die Kommentare zum Artikel werden geladen
Diesen Artikel kommentieren / Antworten
Teilen Sie diesen Artikel, um uns zu unterstützen. Jeder Link hilft!
> Notebook Test, Laptop Test und News > Tests > Sonstige Tests > Intel NUC 12 Dragon Canyon mit Intel Core i9-12900 im Test
Autor: Sebastian Bade,  5.04.2022 (Update:  9.12.2022)