 Deutsch
 English
 Español
 Français
 Italiano
 Nederlands
 Polski
 Português
 Русский
 Türkçe
 Svenska
 Chinese
 Magyar
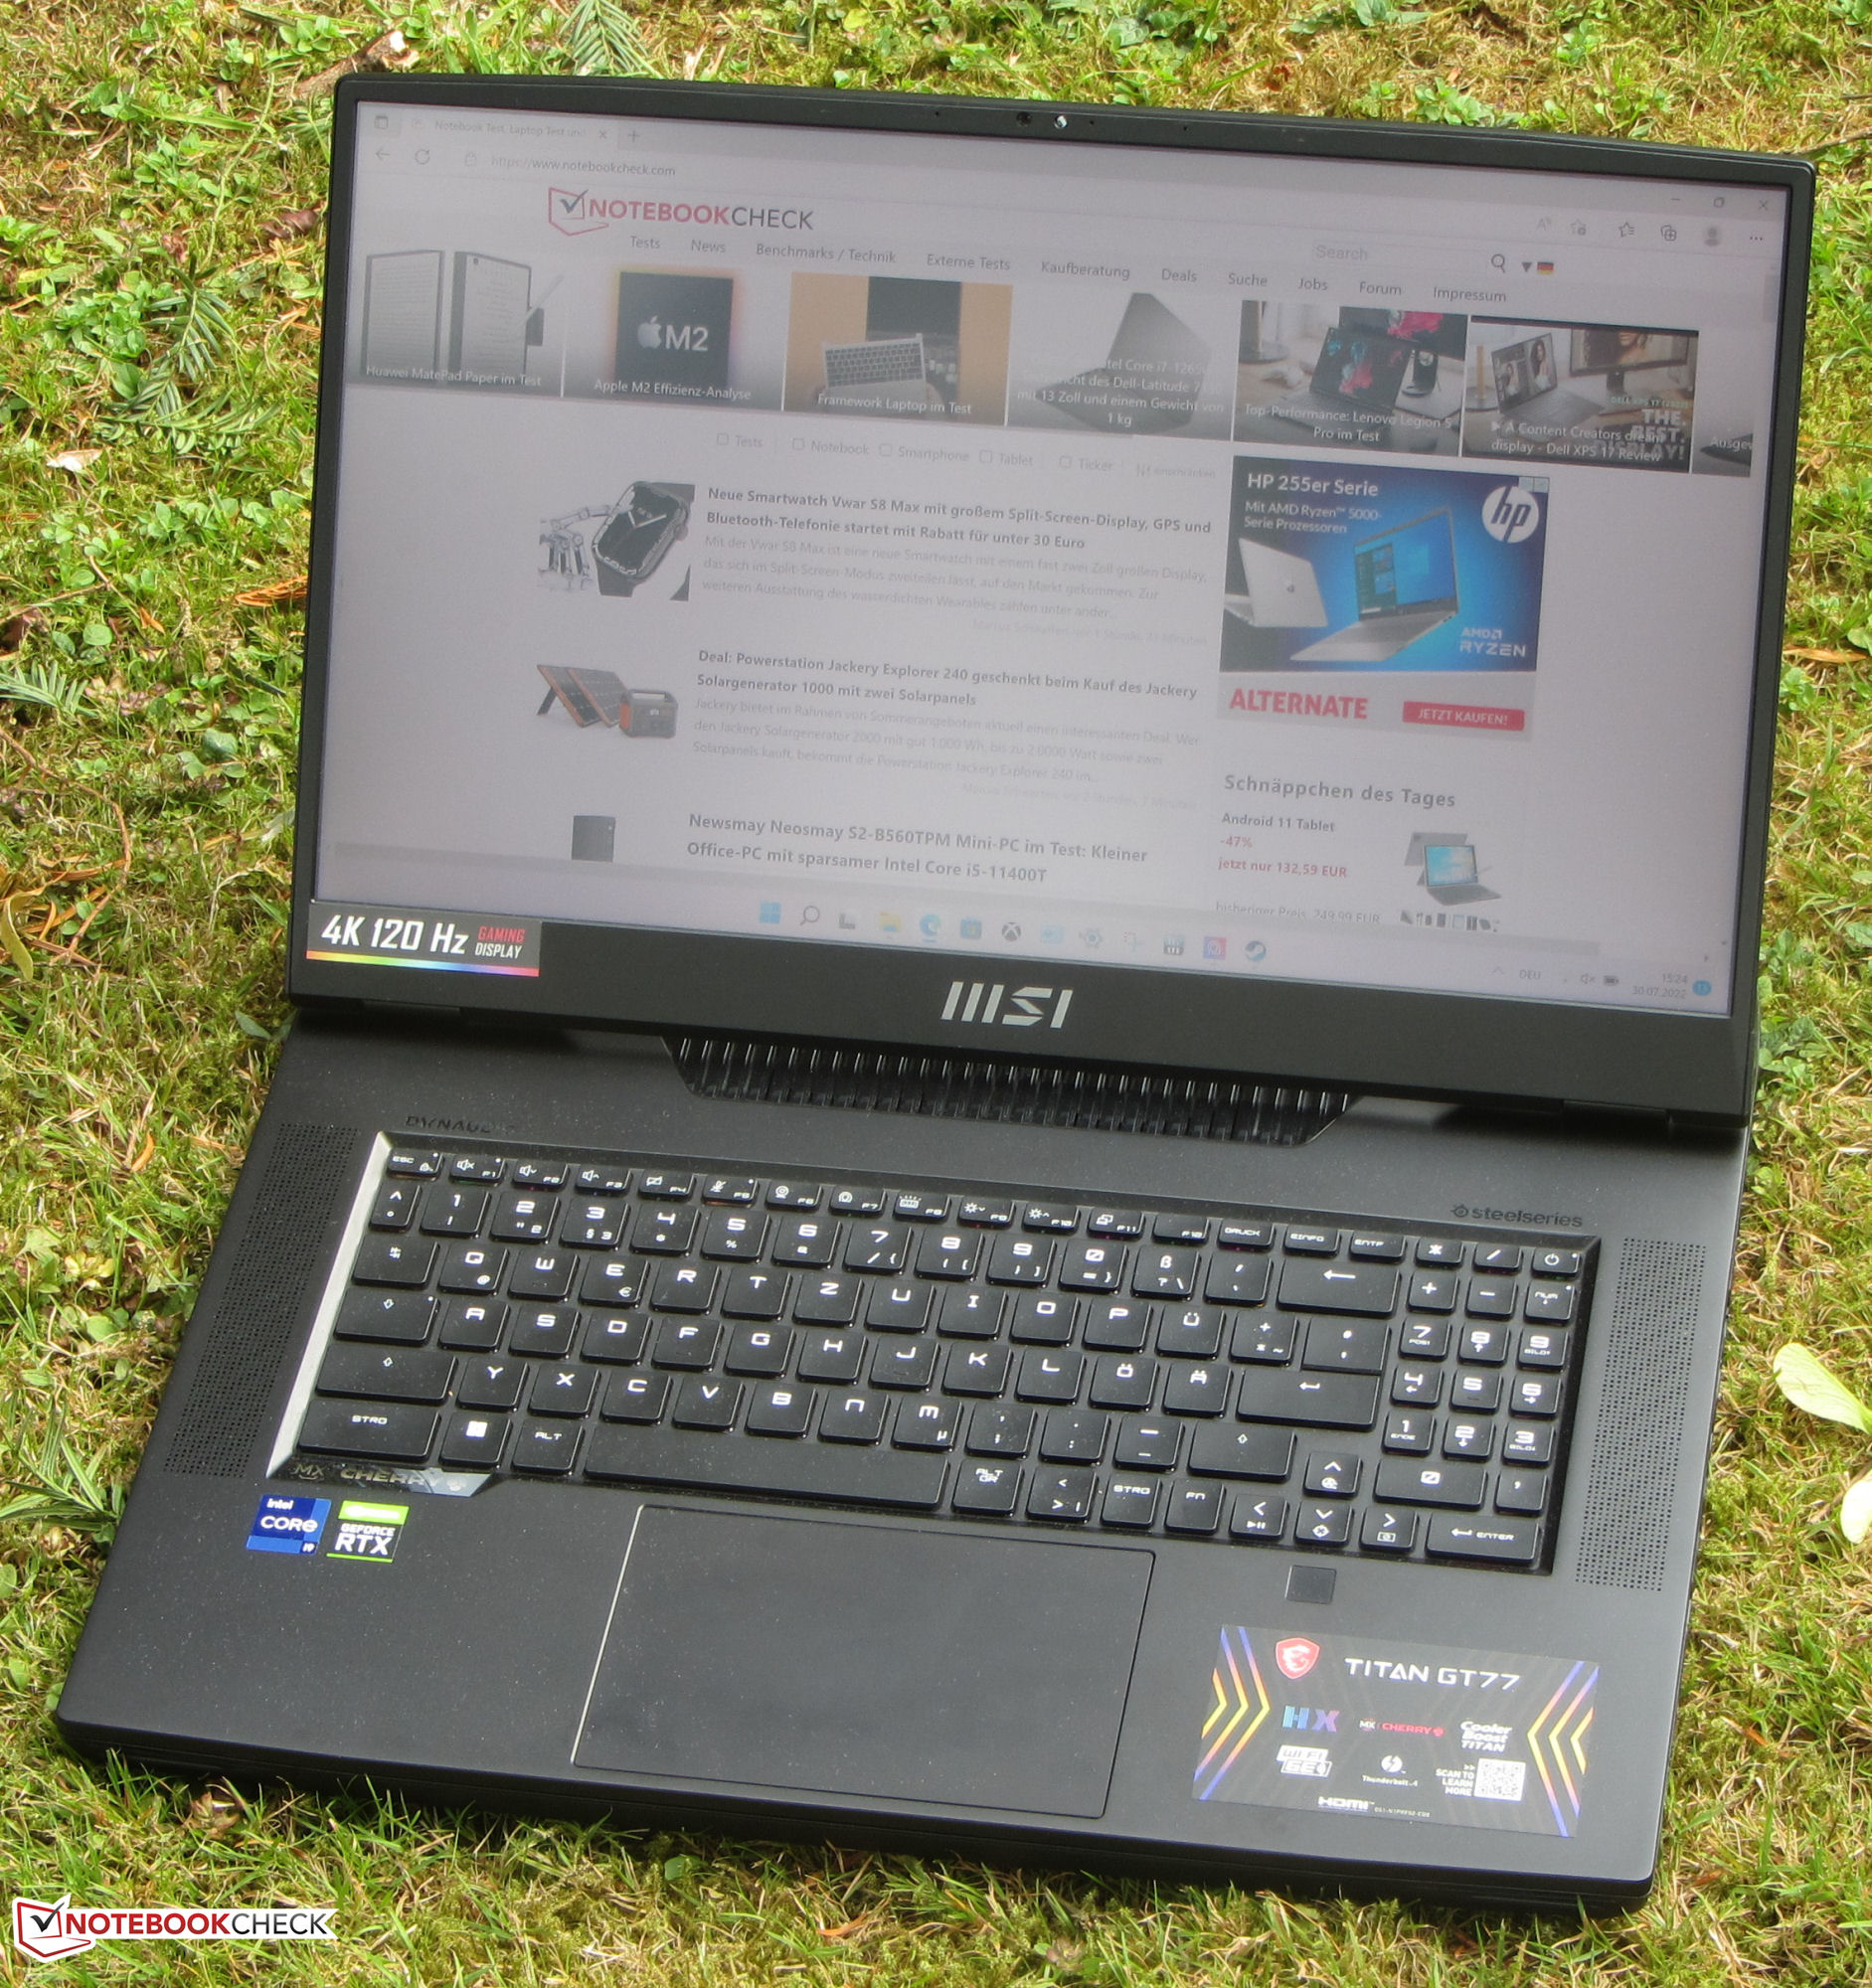
MSI Titan GT77 12UHS 4k im Test: Top-Platzierung unter den UHD-DTR-Notebooks
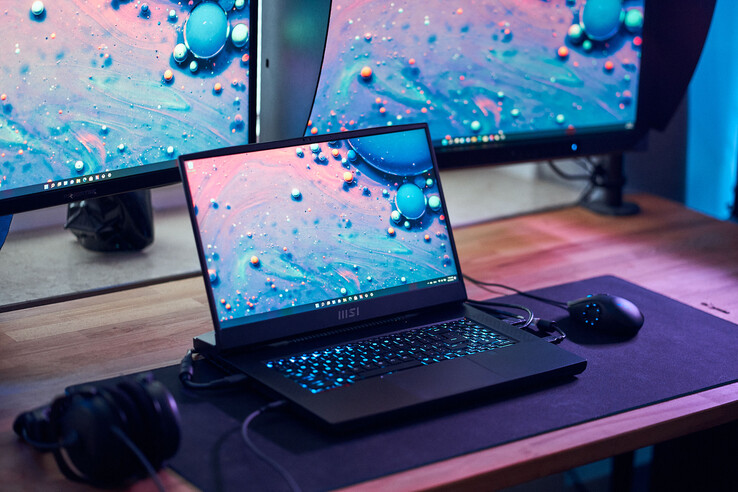
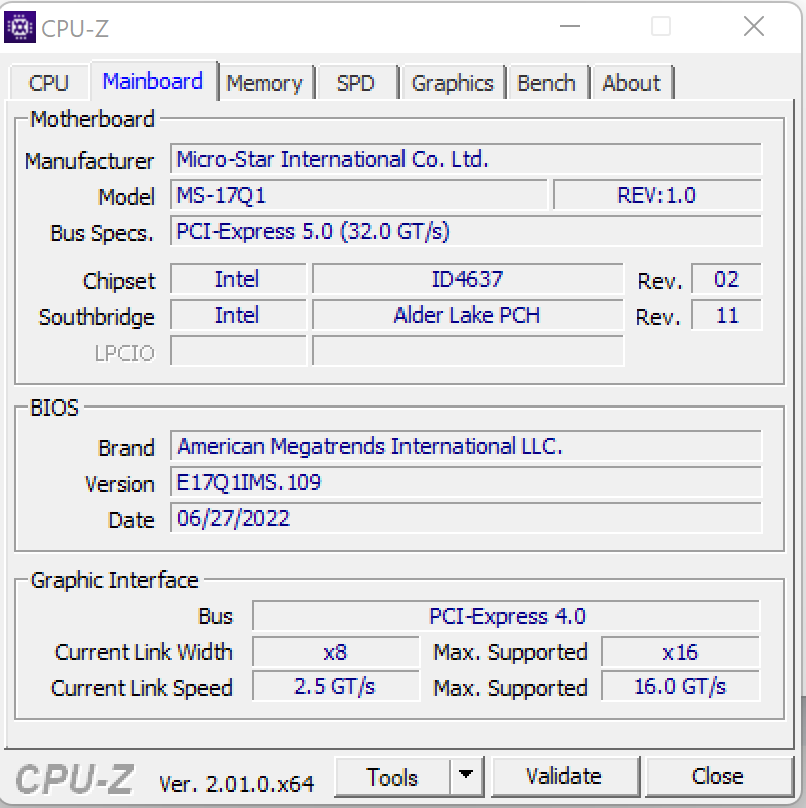
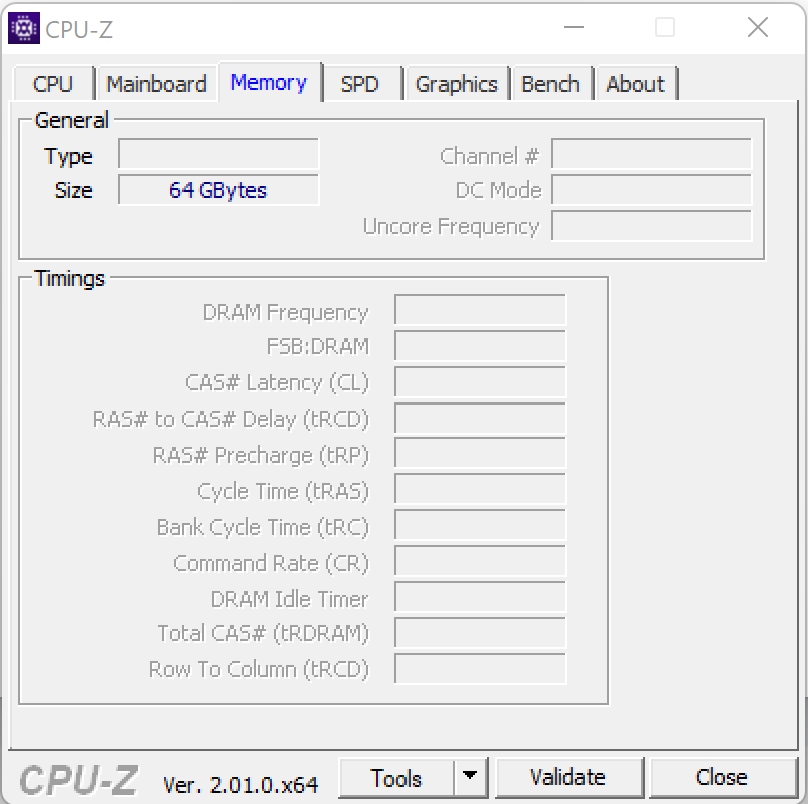
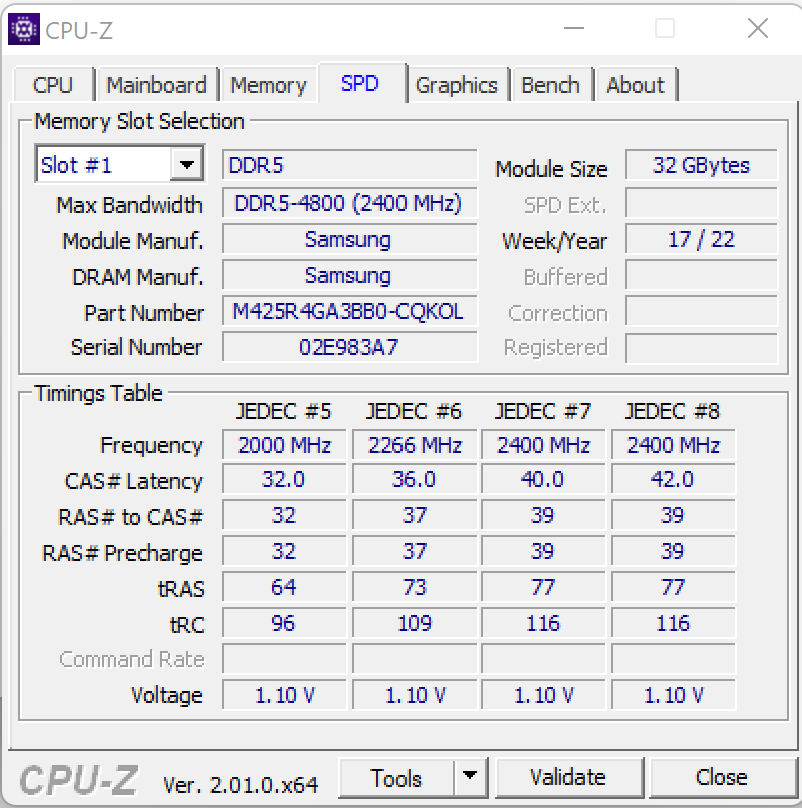
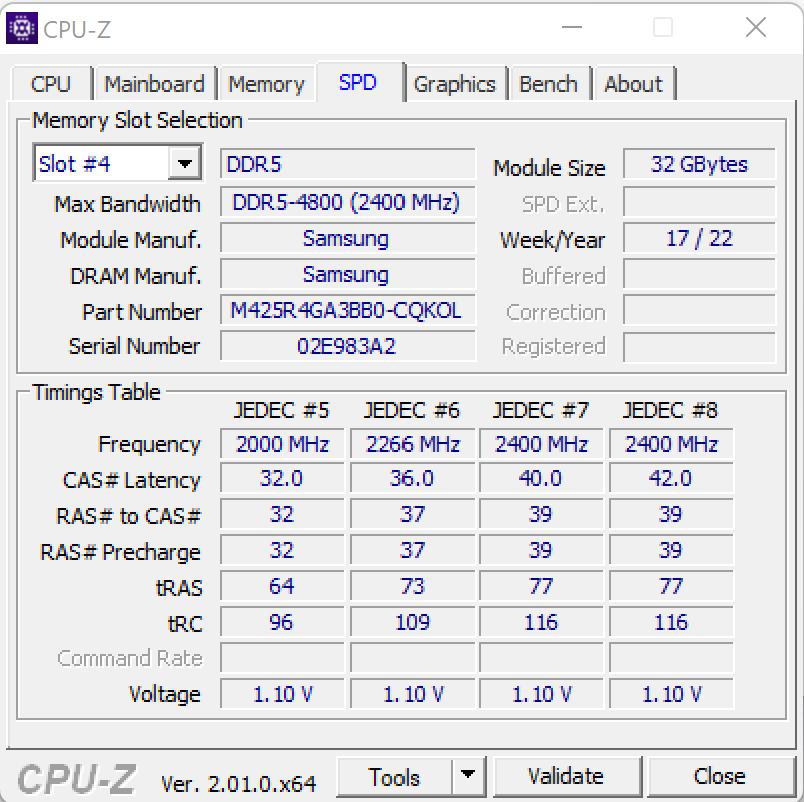
Gamer und Kreativ-Arbeiter zählen zur Zielgruppe des MSI Titan GT77 12UHS - einem mobilen DTR-Notebook. Die potente Ausstattung (Core i9-12900HX, GeForce RTX 3080 Ti Laptop, 64 GB RAM) treibt den Preis des Laptops auf etwa 5.600 Euro. Den Hauptunterschied zu dem kürzlich getesteten Schwestermodell (FHD) stellt das Display dar: Das aktuelle Testgerät hat ein 4k-Panel an Bord. Zu den Konkurrenten zählen Geräte wie das Schenker XMG Ultra 17, das Razer Blade 17 und das Alienware x17 R2.
Informationen bezüglich Gehäuse, Ausstattung, Eingabegeräten und Lautsprechern sind dem Testbericht des baugleichen MSI Titan GT77 12UHS (Core i9, FHD) zu entnehmen.
mögliche Konkurrenten im Vergleich
Bew. | Datum | Modell | Gewicht | Dicke | Größe | Auflösung | Preis ab |
|---|---|---|---|---|---|---|---|
| 87.8 % | 08.2022 | MSI Titan GT77 12UHS i9-12900HX, GeForce RTX 3080 Ti Laptop GPU | 3.4 kg | 23 mm | 17.30" | 3840x2160 | |
| 89.9 % | 07.2022 | Razer Blade 17 Early 2022 i9-12900H, GeForce RTX 3080 Ti Laptop GPU | 2.8 kg | 19.9 mm | 17.30" | 3840x2160 | |
| 89.2 % | 05.2022 | Alienware x17 R2 P48E i9-12900HK, GeForce RTX 3080 Ti Laptop GPU | 3.1 kg | 20.9 mm | 17.30" | 1920x1080 | |
| 84.9 % | 04.2021 | SCHENKER XMG Ultra 17 Rocket Lake i9-11900K, GeForce RTX 3080 Laptop GPU | 4.7 kg | 43.5 mm | 17.30" | 1920x1080 |


| SD Card Reader - average JPG Copy Test (av. of 3 runs) | |
| SCHENKER XMG Ultra 17 Rocket Lake | |
| Alienware x17 R2 P48E (AV Pro V60) | |
| Razer Blade 17 Early 2022 (AV PRO microSD 128 GB V60) | |
| Durchschnitt der Klasse Gaming (19 - 202, n=100, der letzten 2 Jahre) | |
| MSI Titan GT77 12UHS (AV PRO microSD 128 GB V60) | |
| MSI Titan GT77 12UHS 4k (AV PRO microSD 128 GB V60) | |


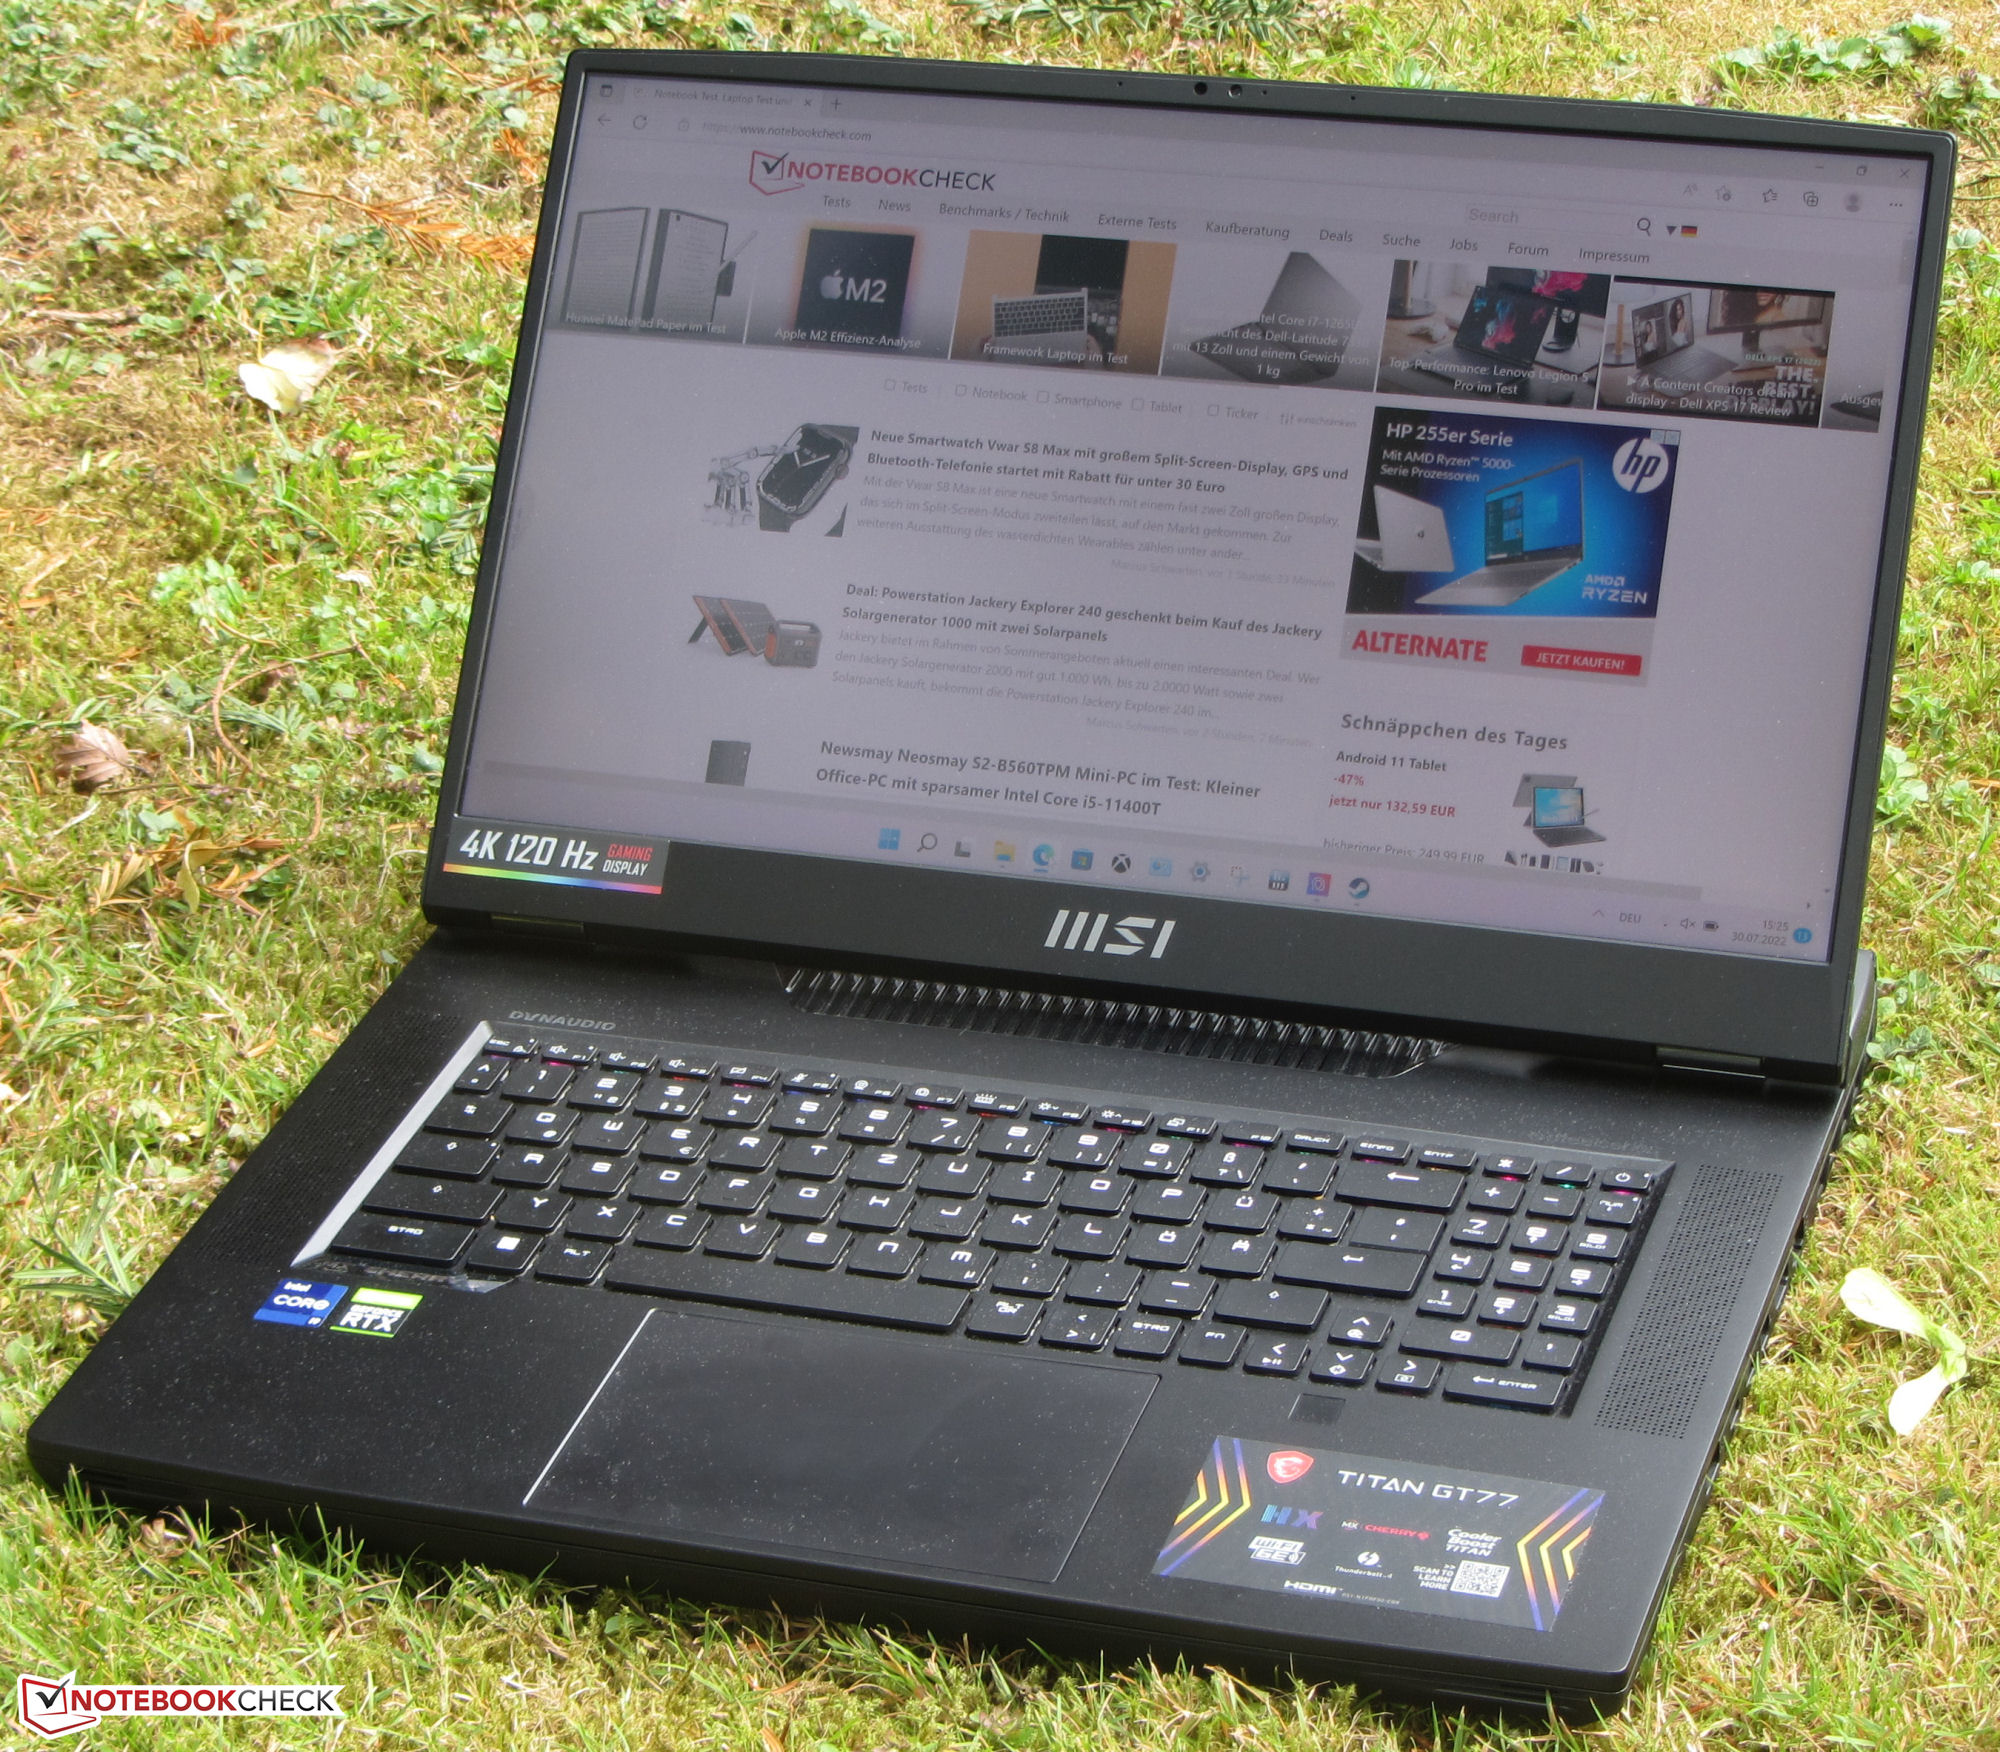
Display - Helles Panel mit DCI-P3-Abdeckung
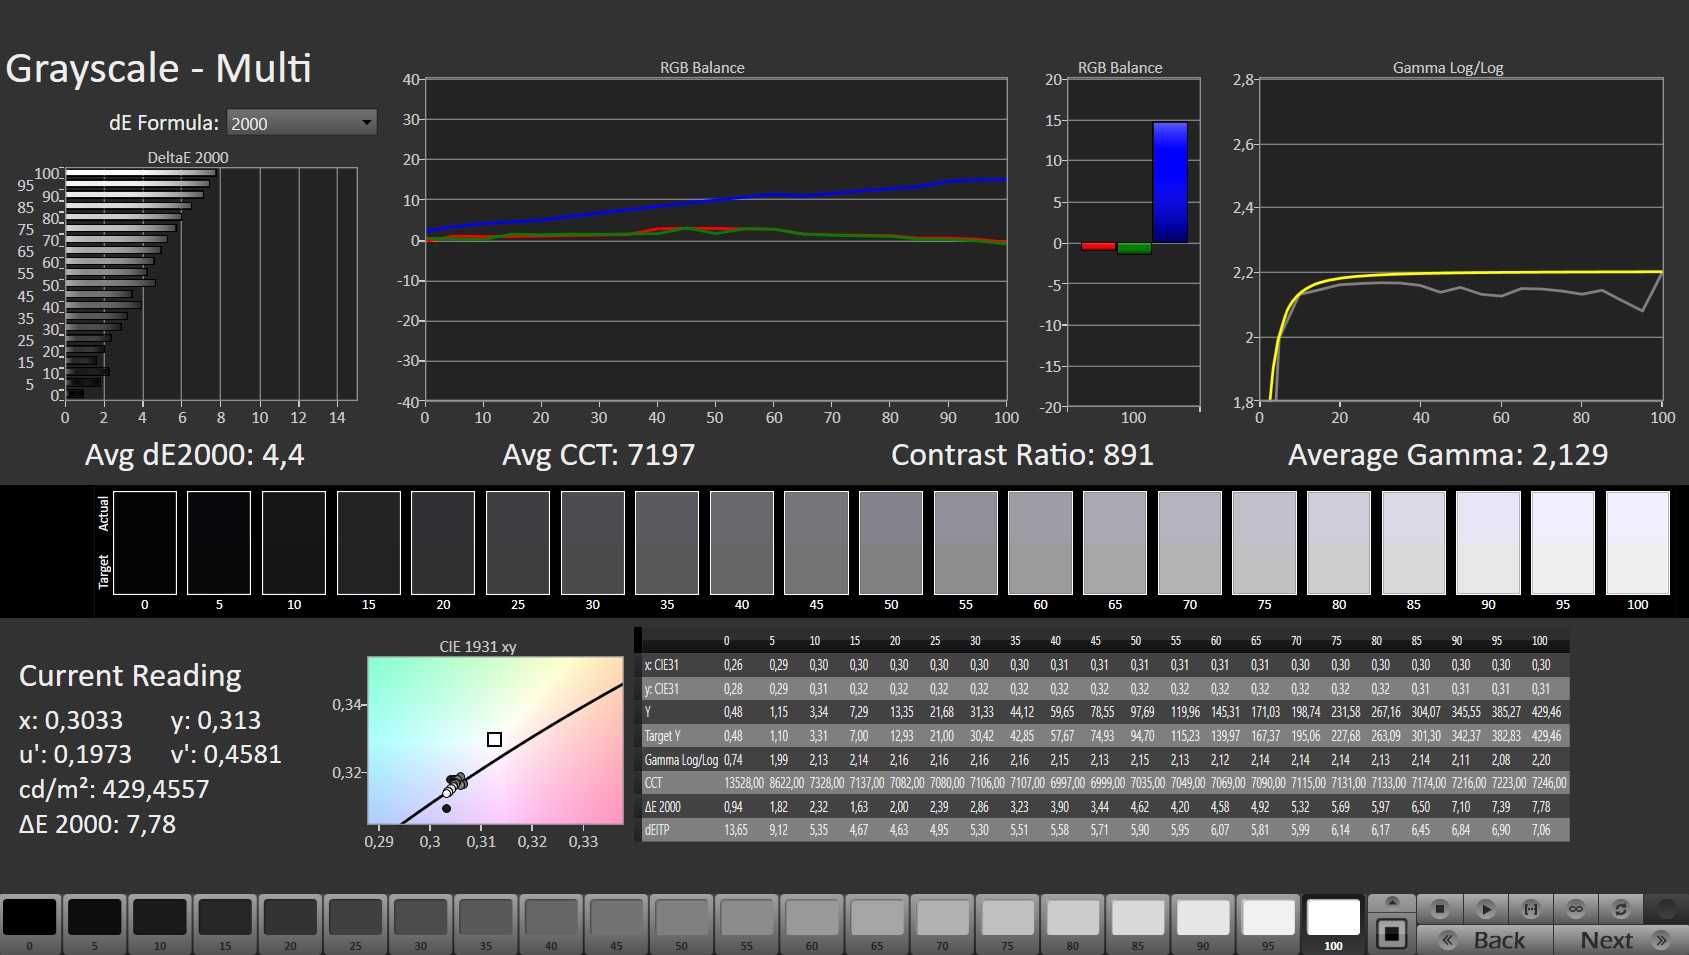
Das matte 4k-Panel (3.840 x 2.160 Bildpunkte) des aktuellen Testgeräts liefert eine deutlich größere Helligkeit (401 cd/m² vs. 275,1 cd/m²) als das FHD-Display des Schwestermodells.
In Sachen Kontrast (871:1 vs. 700:1) besteht Luft nach oben: Beide Displays verfehlen das Soll (> 1.000:1). Es handelt sich in beiden Fällen um reaktionsschnelle Panels, das FHD-Modell bietet deutlich höhere Wiederholraten (120 Hz vs. 360 Hz). PWM-Flimmern wurde im Rahmen der Messungen nicht beobachtet.
| |||||||||||||||||||||||||
Ausleuchtung: 91 %
Helligkeit Akku: 418 cd/m²
Kontrast: 871:1 (Schwarzwert: 0.48 cd/m²)
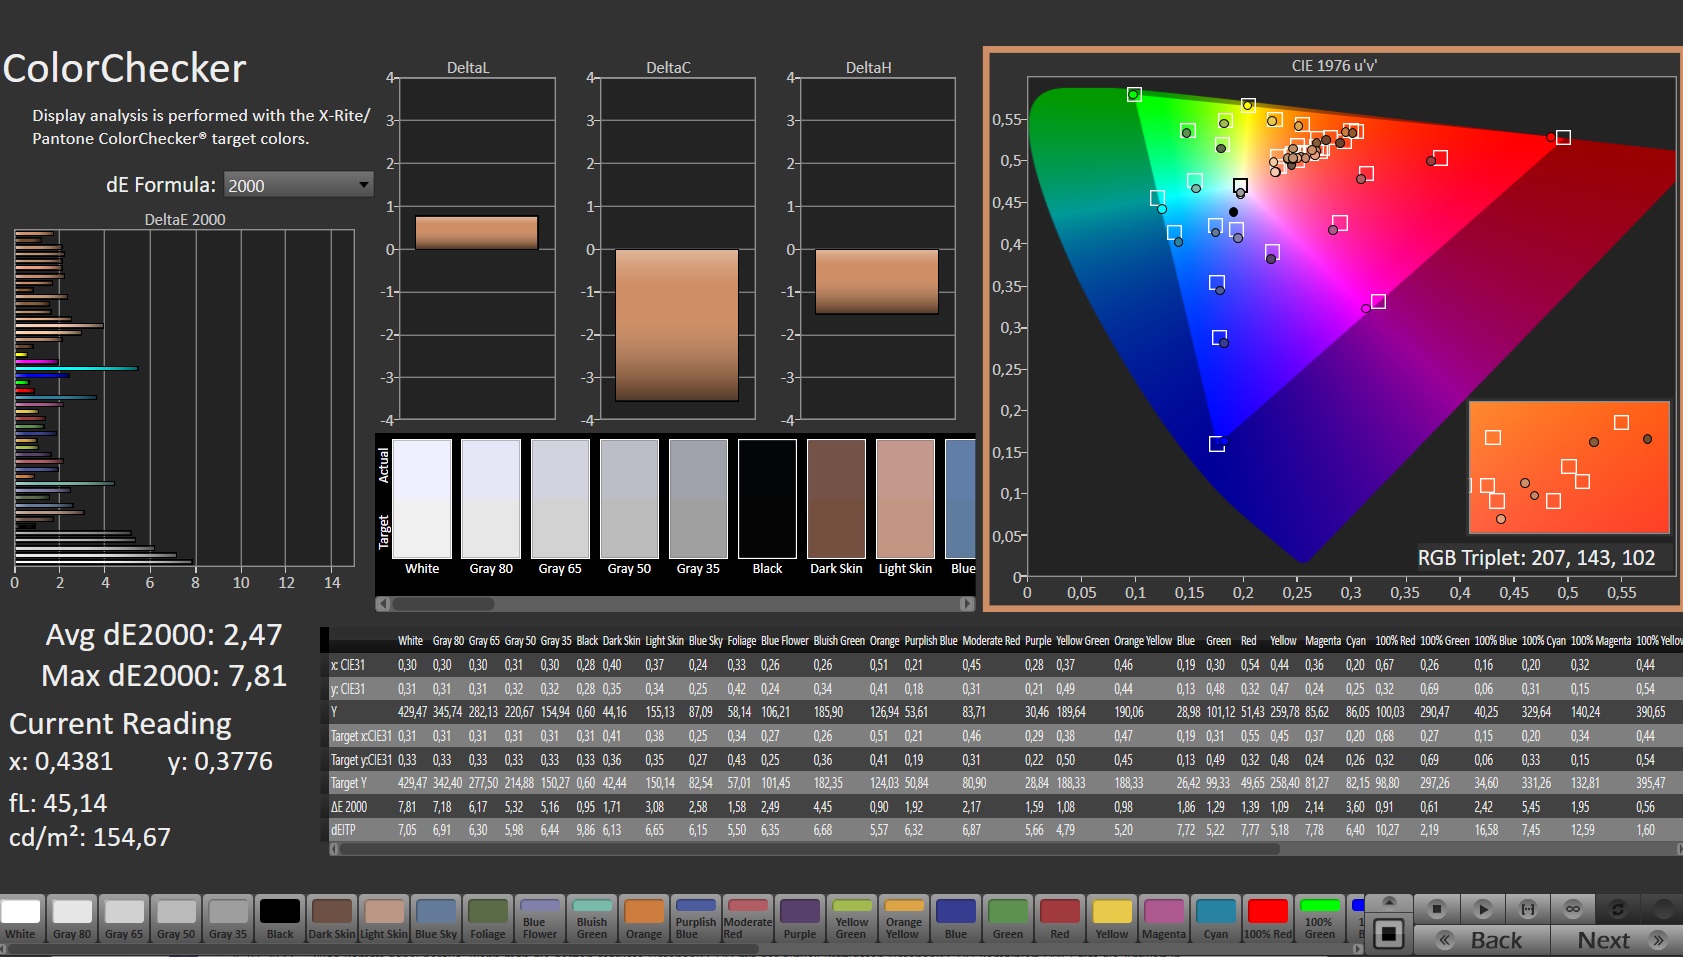
ΔE Color 2.47 | 0.5-29.43 Ø5, calibrated: 0.66
ΔE Greyscale 4.4 | 0.57-98 Ø5.3
86.2% AdobeRGB 1998 (Argyll 2.2.0 3D)
99.8% sRGB (Argyll 2.2.0 3D)
97% Display P3 (Argyll 2.2.0 3D)
Gamma: 2.129
| MSI Titan GT77 12UHS 4k AU Optronics B173ZAN06.1, IPS, 3840x2160, 17.30 | Razer Blade 17 Early 2022 AU Optronics B173ZAN06.9, IPS, 3840x2160, 17.30 | Alienware x17 R2 P48E AU Optronics B173HAN, IPS, 1920x1080, 17.30 | SCHENKER XMG Ultra 17 Rocket Lake AU Optronics B173HAN05.1, IPS, 1920x1080, 17.30 | MSI Titan GT77 12UHS Sharp SHP1544 LQ173M1JW08, IPS-Level, 1920x1080, 17.30 | |
|---|---|---|---|---|---|
| Display | 1% | -9% | -16% | -14% | |
| Display P3 Coverage | 97 | 99.4 2% | 79.2 -18% | 69.8 -28% | 70.8 -27% |
| sRGB Coverage | 99.8 | 100 0% | 99.8 0% | 97.2 -3% | 98.9 -1% |
| AdobeRGB 1998 Coverage | 86.2 | 87.3 1% | 79.6 -8% | 72 -16% | 73 -15% |
| Response Times | -27% | -109% | -44% | 19% | |
| Response Time Grey 50% / Grey 80% * | 5.2 ? | 7.5 ? -44% | 12.4 ? -138% | 5.6 ? -8% | 3.03 ? 42% |
| Response Time Black / White * | 5.1 ? | 5.6 ? -10% | 9.2 ? -80% | 9.2 ? -80% | 5.28 ? -4% |
| PWM Frequency | |||||
| Bildschirm | 28% | 3% | 9% | -17% | |
| Helligkeit Bildmitte | 418 | 503 20% | 365.4 -13% | 306 -27% | 280 -33% |
| Brightness | 401 | 486 21% | 344 -14% | 299 -25% | 275 -31% |
| Brightness Distribution | 91 | 84 -8% | 85 -7% | 93 2% | 79 -13% |
| Schwarzwert * | 0.48 | 0.44 8% | 0.29 40% | 0.22 54% | 0.4 17% |
| Kontrast | 871 | 1143 31% | 1260 45% | 1391 60% | 700 -20% |
| Delta E Colorchecker * | 2.47 | 1.08 56% | 3.17 -28% | 1.92 22% | 2.1 15% |
| Colorchecker dE 2000 max. * | 7.81 | 4.54 42% | 7.69 2% | 4.78 39% | 5.83 25% |
| Colorchecker dE 2000 calibrated * | 0.66 | 0.6 9% | 0.51 23% | 1.34 -103% | 1.58 -139% |
| Delta E Graustufen * | 4.4 | 1.3 70% | 5.3 -20% | 2 55% | 3.3 25% |
| Gamma | 2.129 103% | 2.151 102% | 2.18 101% | 2.153 102% | 2.13 103% |
| CCT | 7197 90% | 6541 99% | 5879 111% | 6738 96% | 7060 92% |
| Farbraum (Prozent von AdobeRGB 1998) | 72 | ||||
| Color Space (Percent of sRGB) | 93 | ||||
| Durchschnitt gesamt (Programm / Settings) | 1% /
14% | -38% /
-15% | -17% /
-4% | -4% /
-11% |
* ... kleinere Werte sind besser
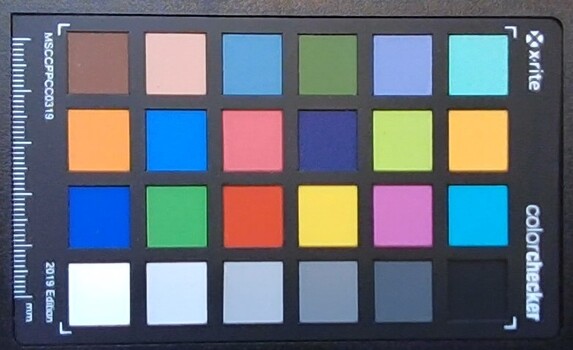
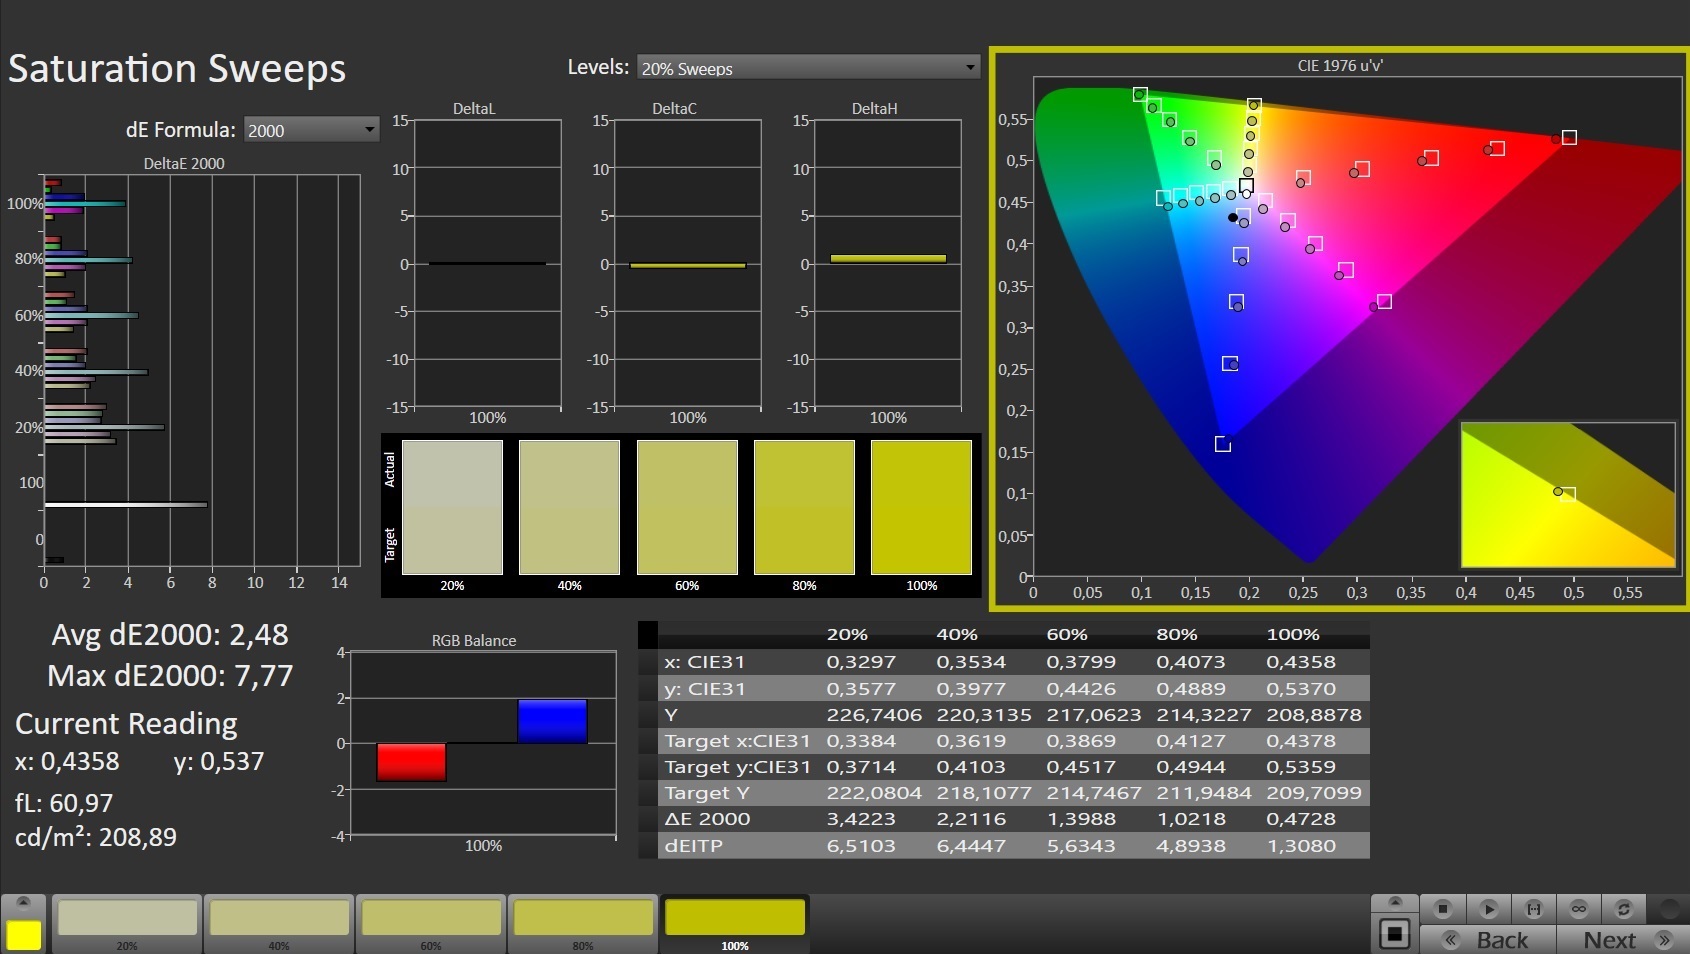
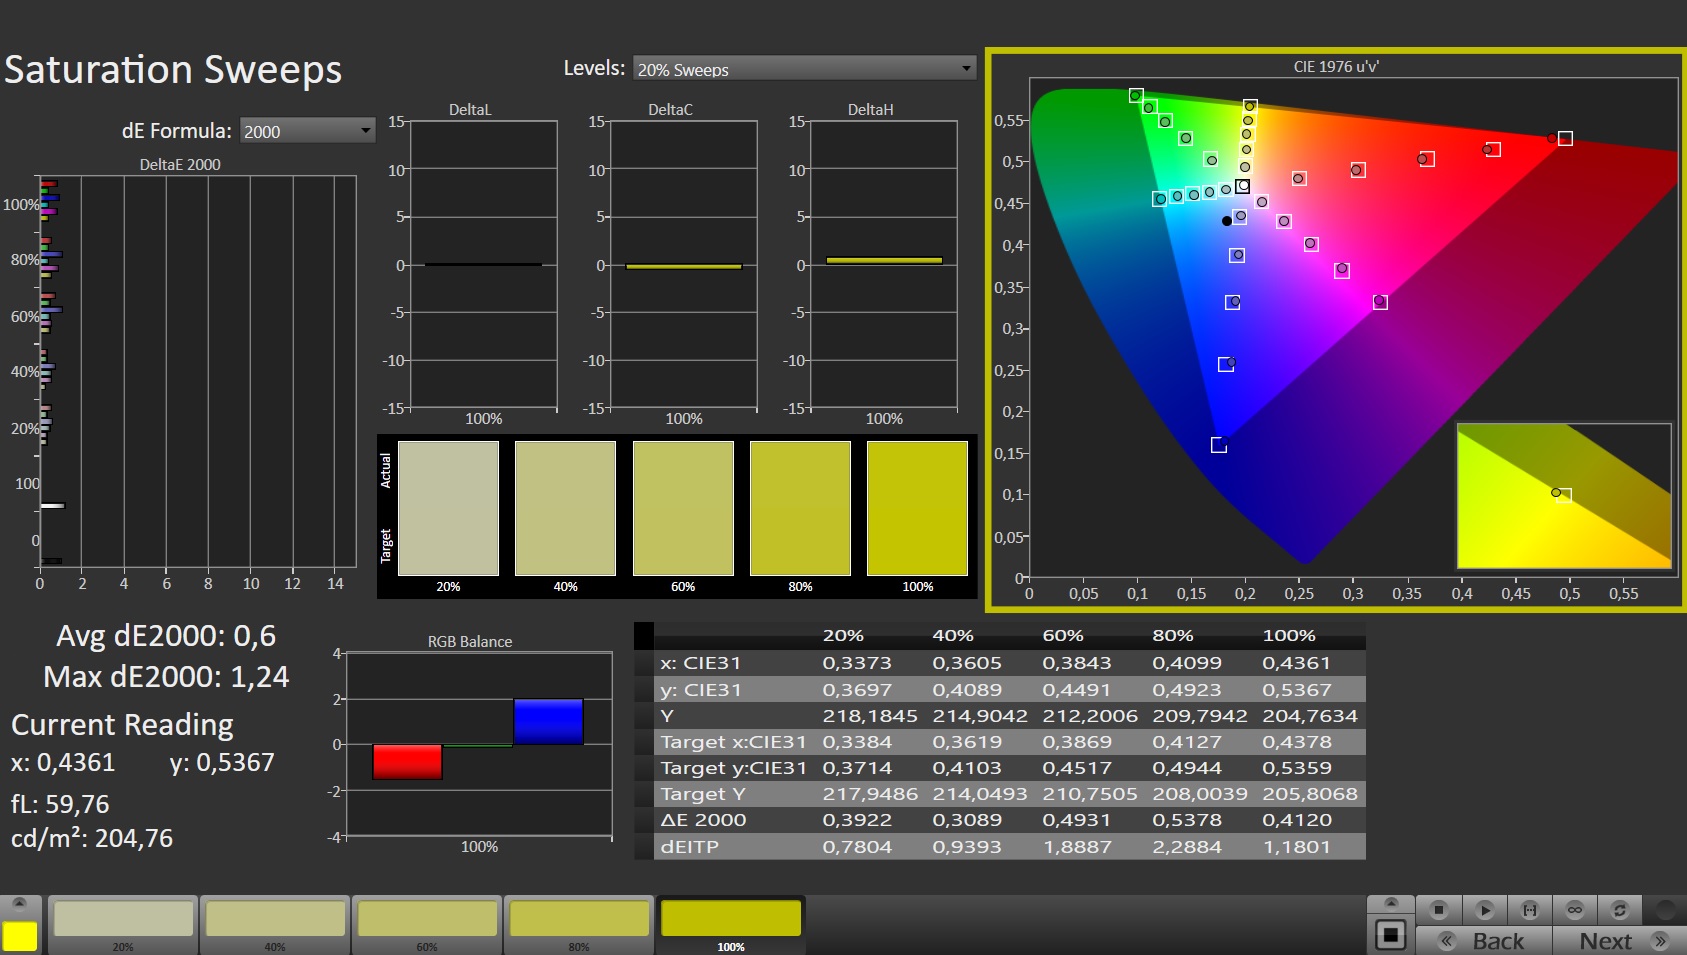
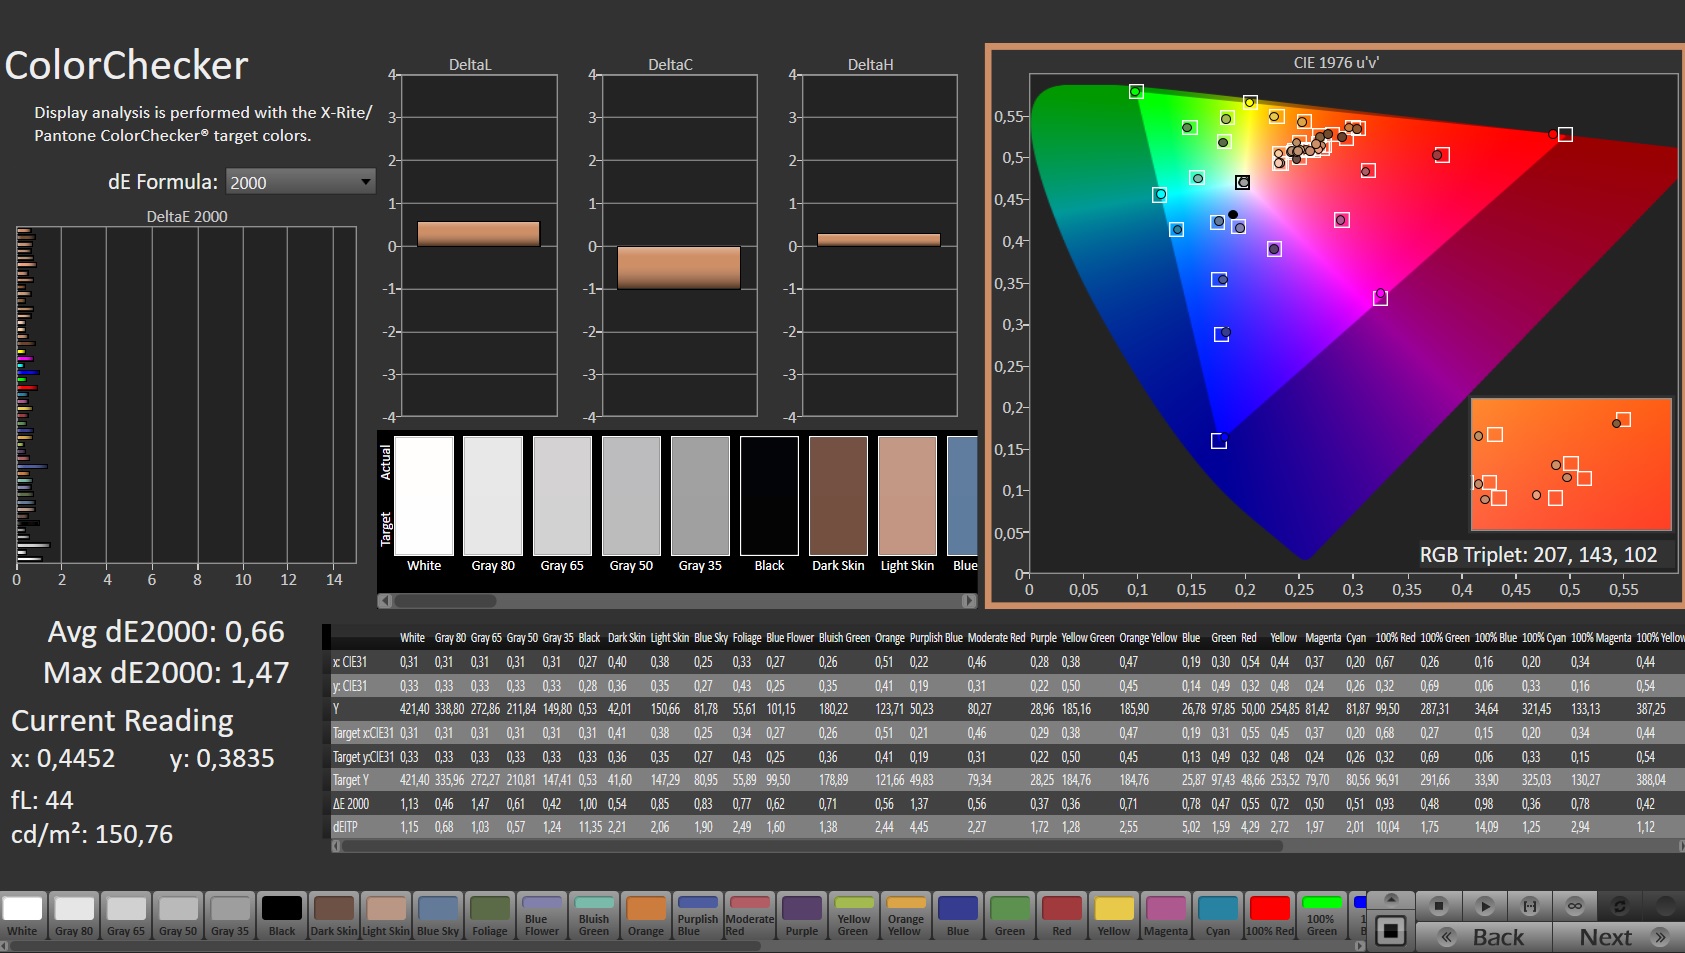
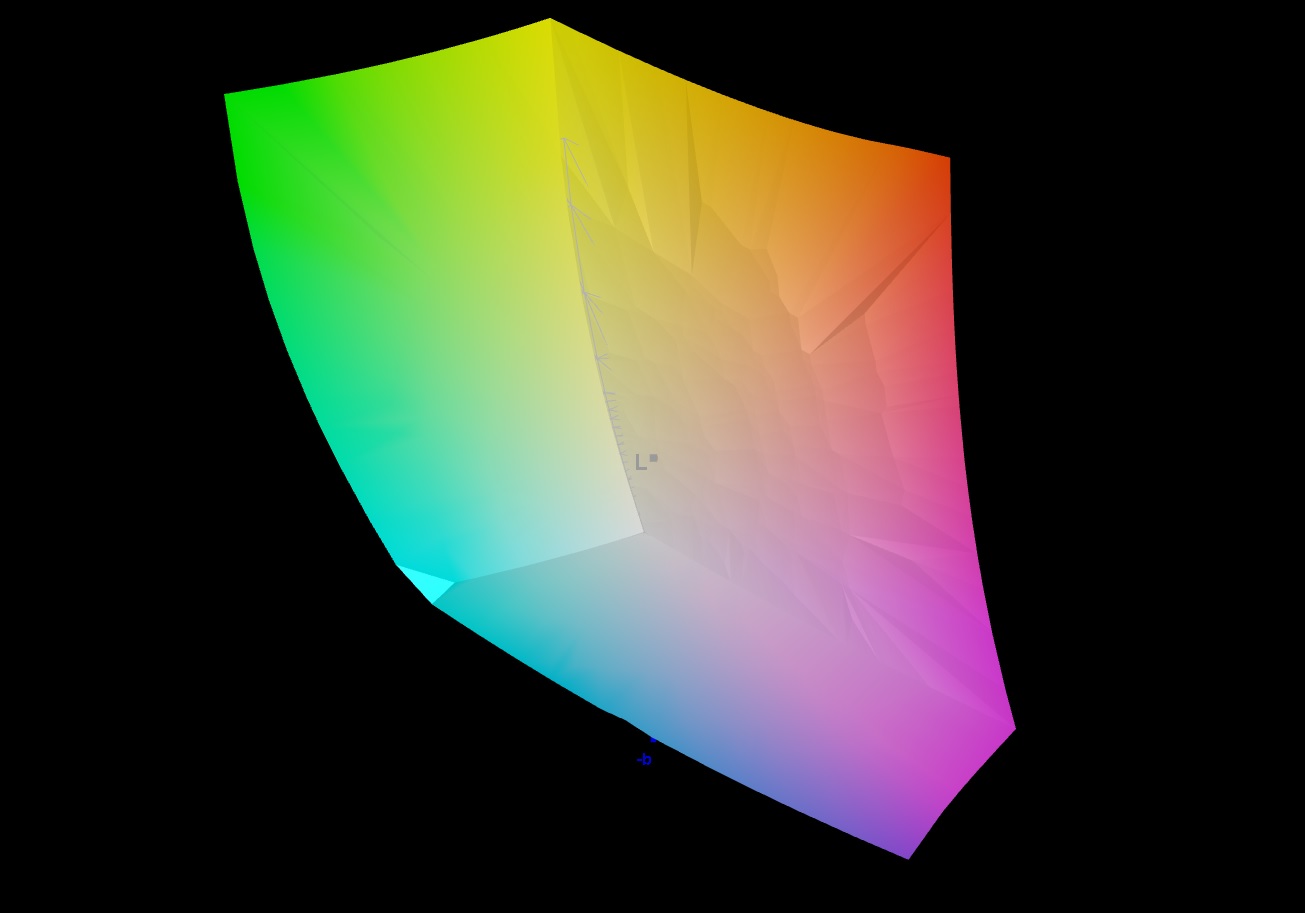
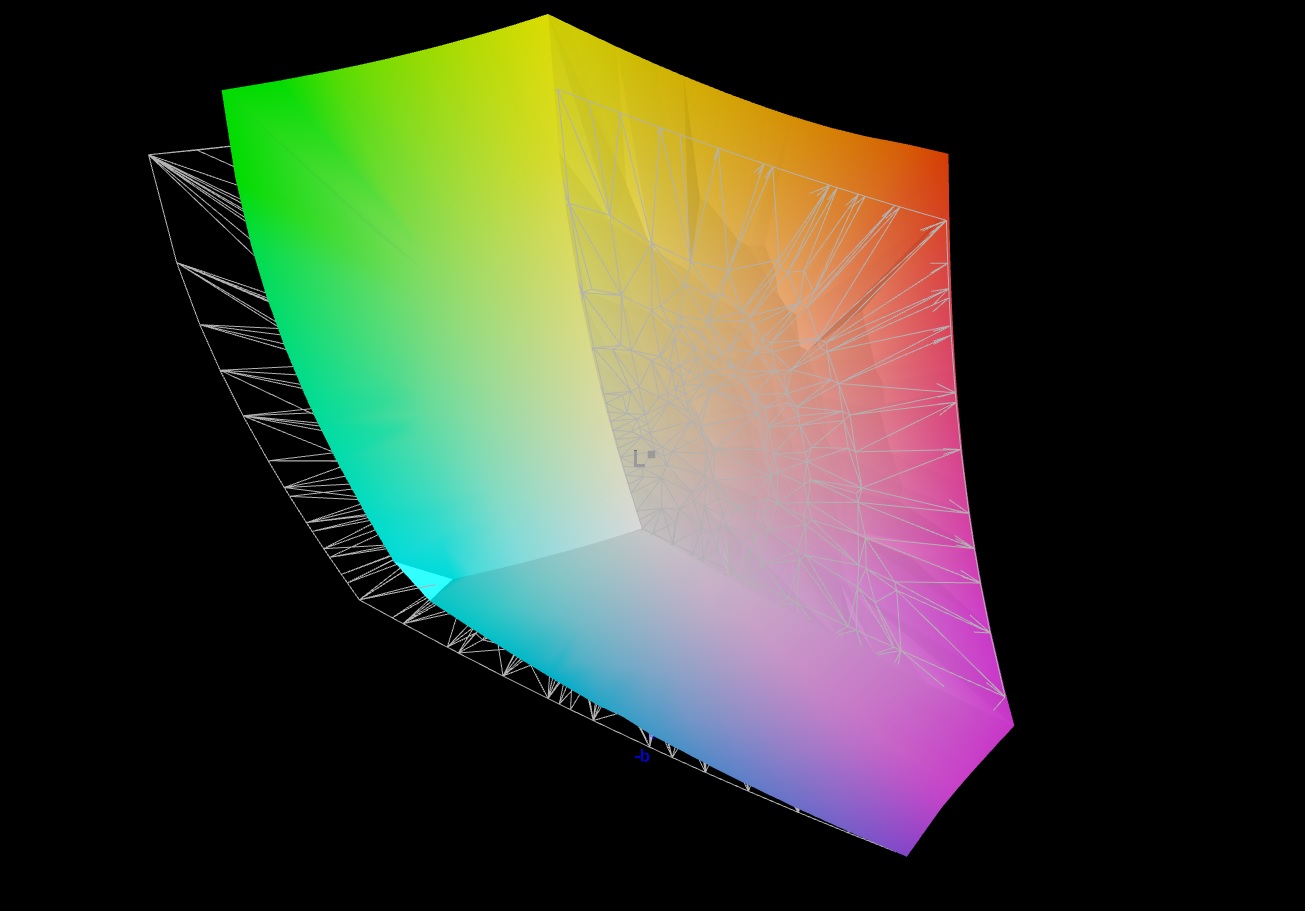
Das 4k-Display bildet die Farbräume sRGB (99,8 %) und DCI-P3 (97 %) nahezu komplett ab, den AdobeRGB-Farbraum immerhin zu 86 %. Hier kann das FHD-Panel (sRGB: 97 %, AdobeRGB: 73 %, DCI-P3: 71 %) des Schwestermodells nicht mithalten. Somit stellt das 4k-Panel die erste Wahl dar, wenn es auf Farbtreue ankommt.
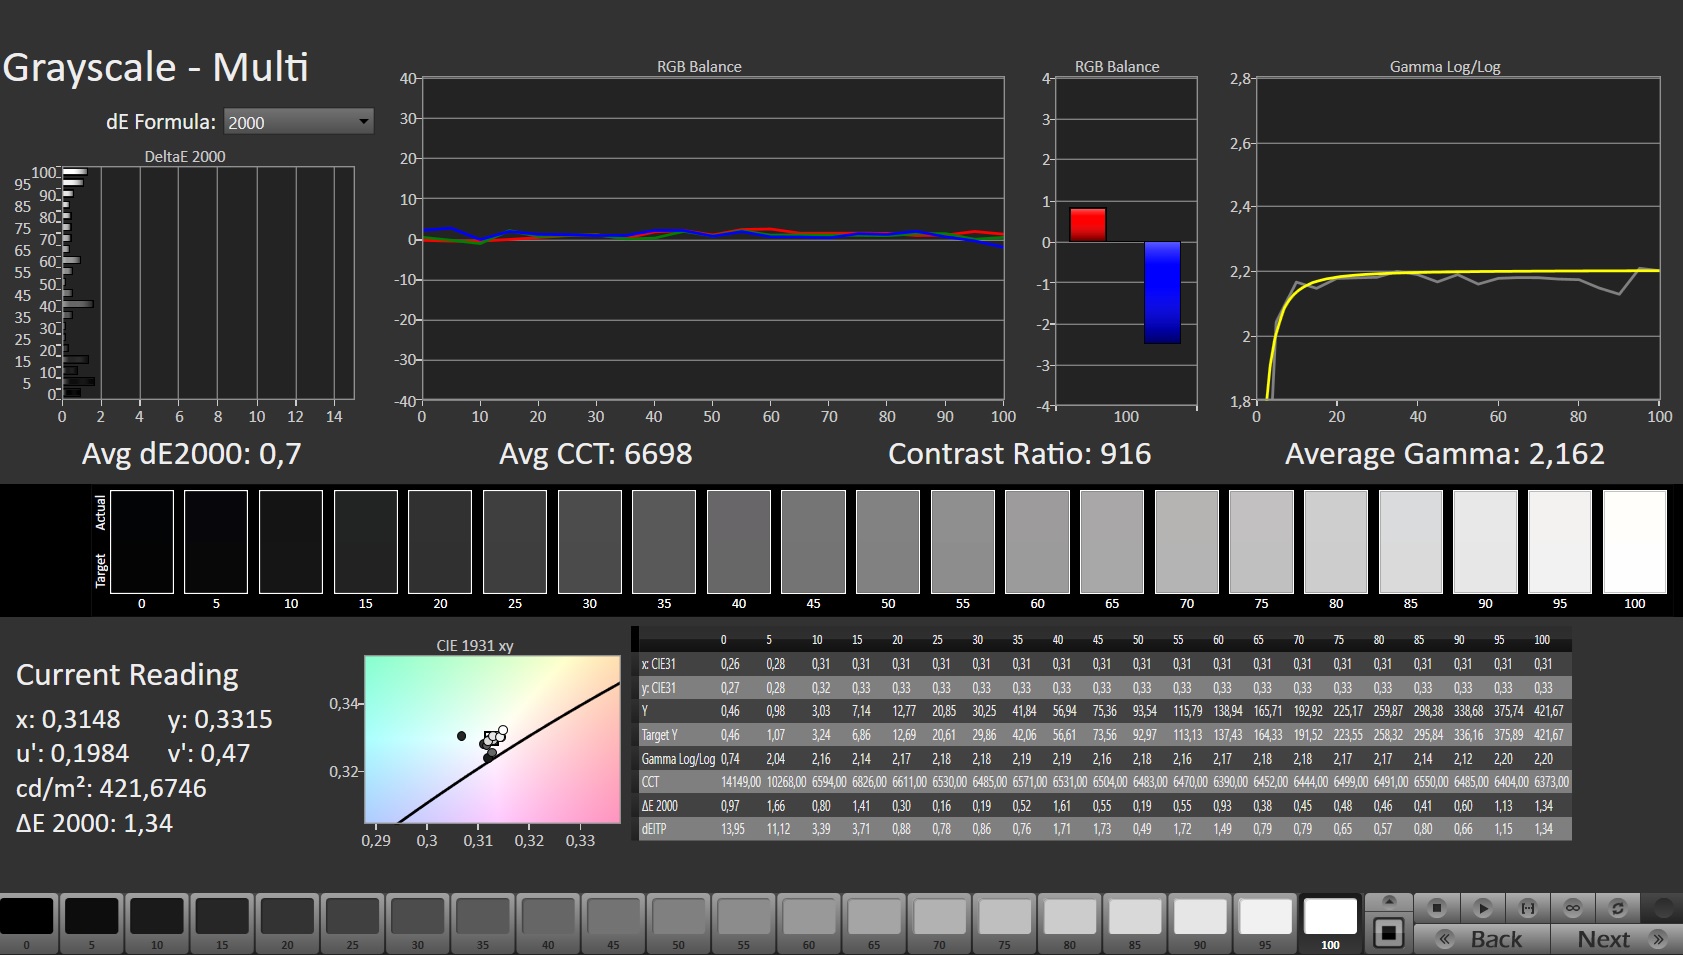
Die Bildschirme zeigen bereits im Auslieferungszustand eine gute Farbdarstellung: Das Soll (Delta E < 3) wird mit nicht wahrnehmbaren Farbabweichungen von 2,47 bzw. 2,1 erfüllt. Eine Kalibrierung sorgt für eine ausgewogenere Darstellung der Graustufen und lässt die Abweichungen auf 0,66 bzw. 1,58 sinken. Die von uns erzeugten Farbprofile sind in der Infobox des jeweiligen Displays verlinkt und können kostenlos herunter geladen werden.
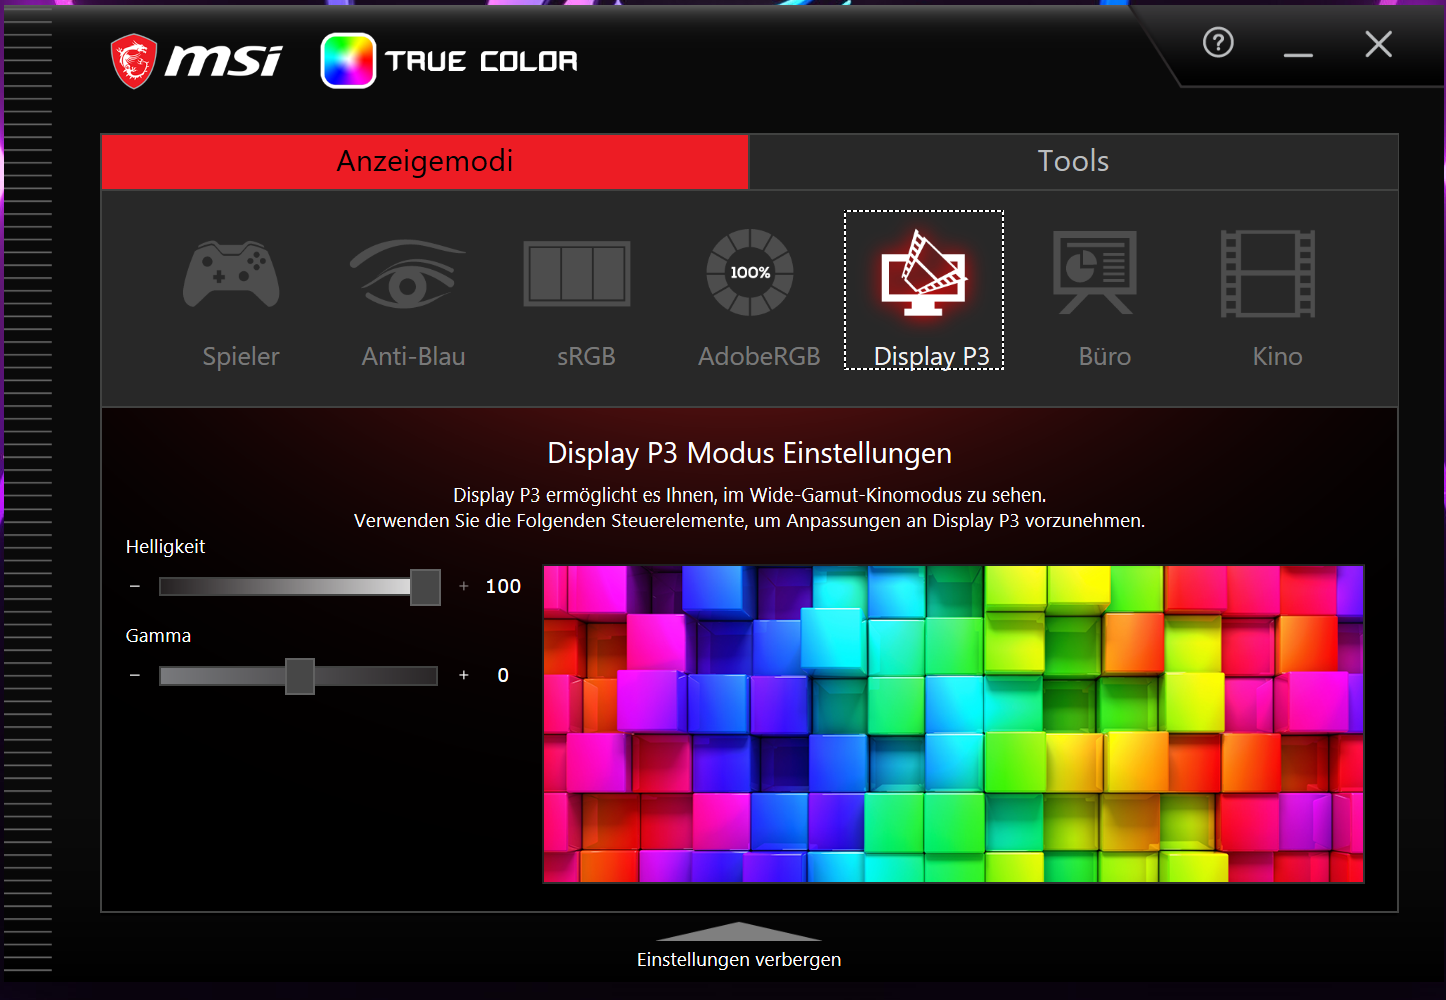
Hinweis: Die MSI-True-Color-Software erlaubt eine Anpassung der Farbdarstellung in Richtung eines Farbraums oder auch eines definierten Anwendungsszenarios. Wir nutzen das Preset "Display P3".

Reaktionszeiten (Response Times) des Displays
| ↔ Reaktionszeiten Schwarz zu Weiß | ||
|---|---|---|
| 5.1 ms ... steigend ↗ und fallend ↘ kombiniert | ↗ 1.5 ms steigend | 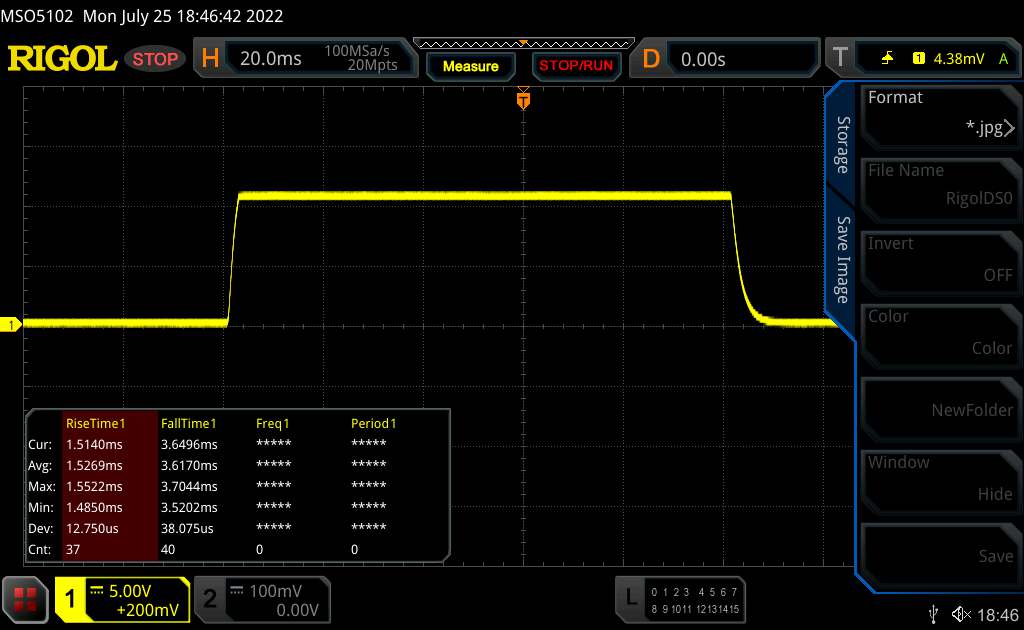 |
| ↘ 3.6 ms fallend | ||
| Die gemessenen Reaktionszeiten sind sehr kurz, wodurch sich der Bildschirm auch für schnelle 3D Spiele eignen sollte. Im Vergleich rangierten die bei uns getesteten Geräte von 0.1 (Minimum) zu 240 (Maximum) ms. » 12 % aller Screens waren schneller als der getestete. Daher sind die gemessenen Reaktionszeiten besser als der Durchschnitt aller vermessenen Geräte (21.5 ms). | ||
| ↔ Reaktionszeiten 50% Grau zu 80% Grau | ||
| 5.2 ms ... steigend ↗ und fallend ↘ kombiniert | ↗ 1.2 ms steigend | 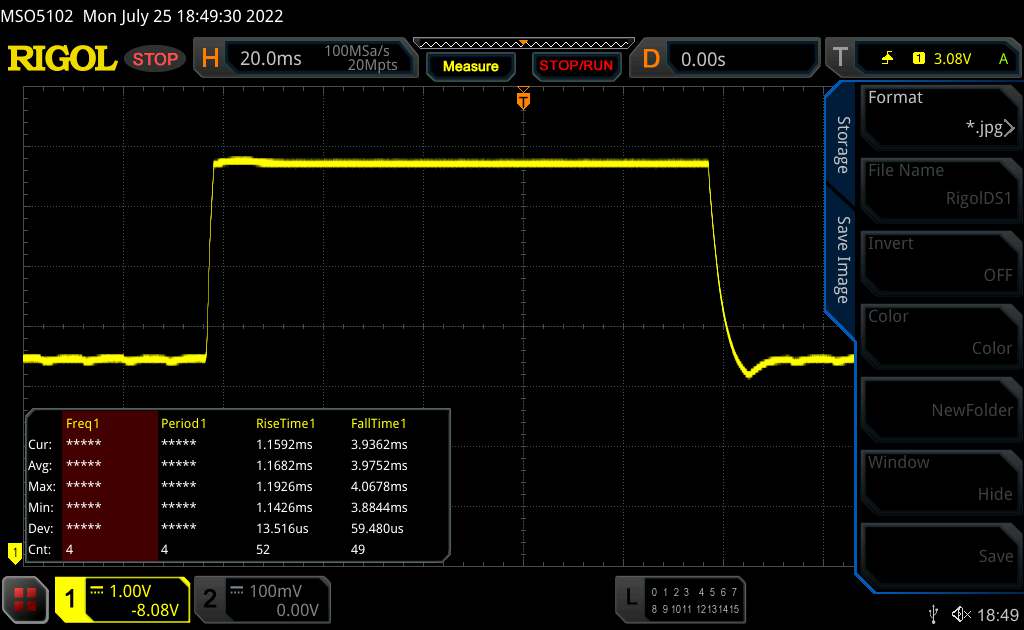 |
| ↘ 4 ms fallend | ||
| Die gemessenen Reaktionszeiten sind sehr kurz, wodurch sich der Bildschirm auch für schnelle 3D Spiele eignen sollte. Im Vergleich rangierten die bei uns getesteten Geräte von 0.2 (Minimum) zu 636 (Maximum) ms. » 12 % aller Screens waren schneller als der getestete. Daher sind die gemessenen Reaktionszeiten besser als der Durchschnitt aller vermessenen Geräte (33.7 ms). | ||
Bildschirm-Flackern / PWM (Pulse-Width Modulation)
| Flackern / PWM nicht festgestellt |  | ||
Im Vergleich: 53 % aller getesteten Geräte nutzten kein PWM um die Helligkeit zu reduzieren. Wenn PWM eingesetzt wurde, dann bei einer Frequenz von durchschnittlich 17900 (Minimum 5, Maximum 3846000) Hz. | |||
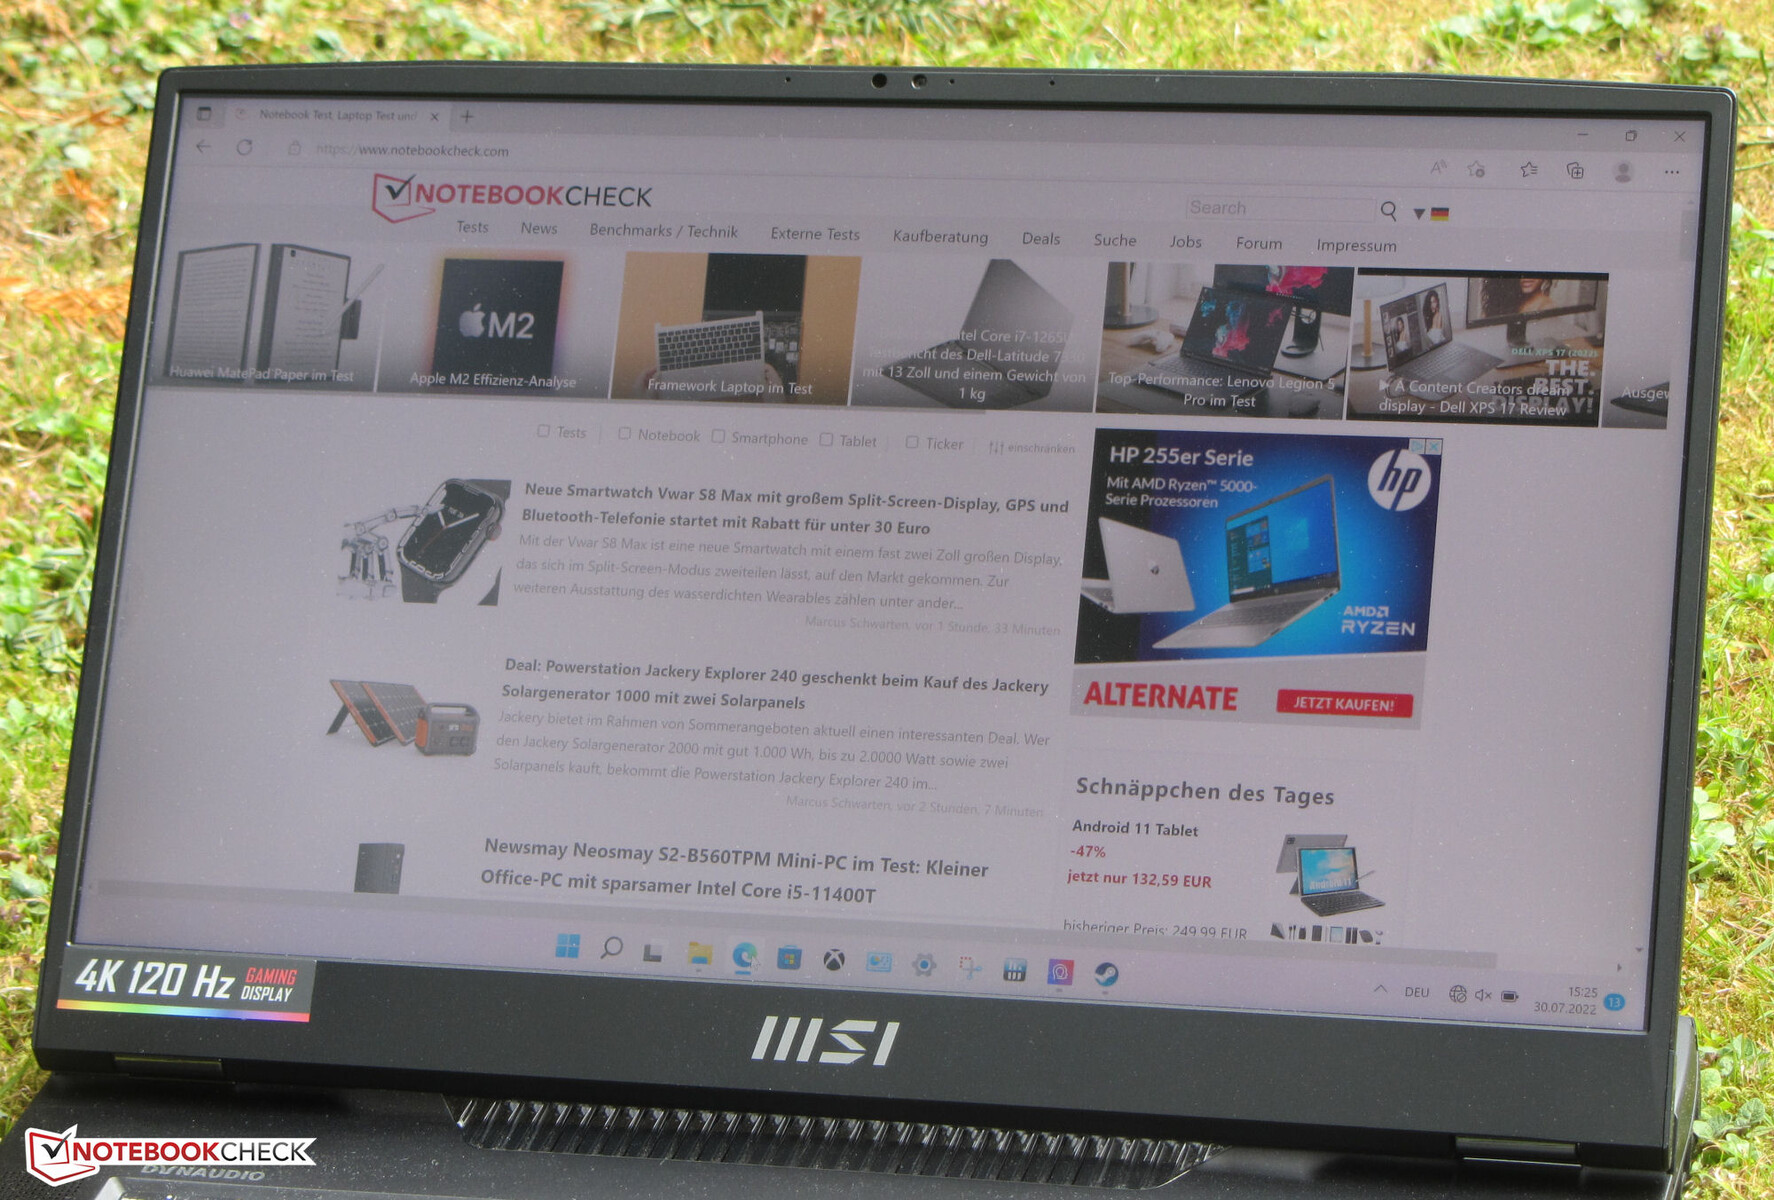
Das blickwinkelstabile IPS-Panel ist aus jeder Position heraus ablesbar. Im Freien ist ein Ablesen des Displays möglich.

Falsche Farbdarstellung durch Softwareprobleme
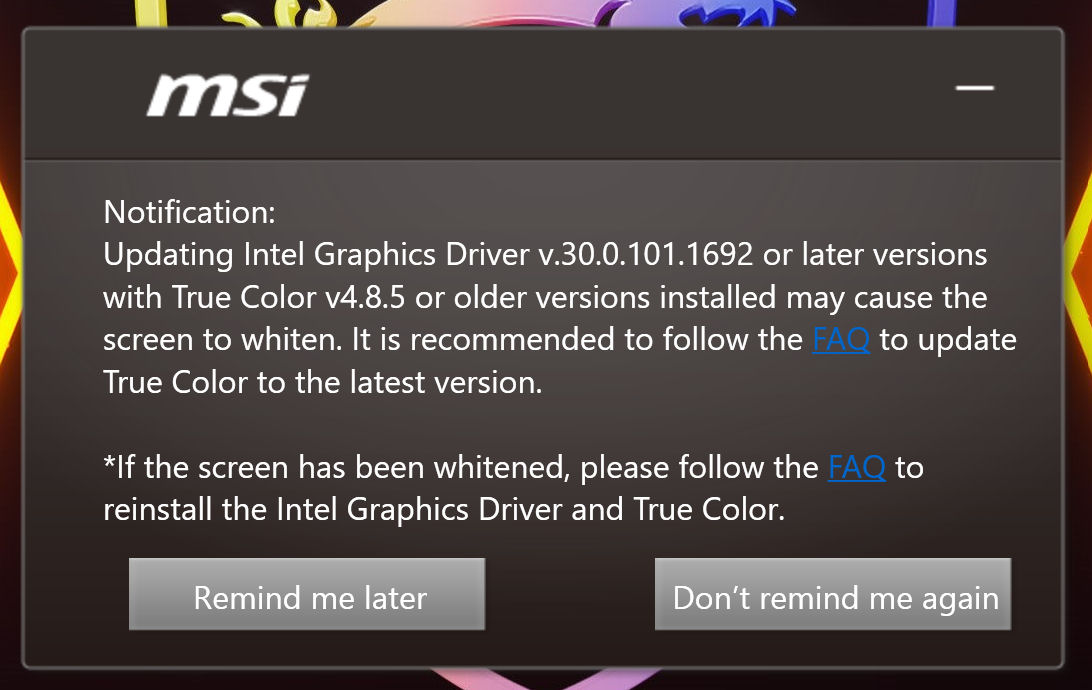
Gewisse Kombinationen aus True-Color-Software und iGPU-Treiber können zu Fehldarstellungen führen: Alle angezeigten Farben machen einen übersteuerten, milchigen Eindruck. MSI empfiehlt die komplette Deinstallation und anschließende Neuinstallation beider Komponenten. Diese Vorgehensweise führt zum Erfolg - wir haben es ausprobiert.
Leistung - Ampere und Alder Lake machen viel Dampf
MSI hat mit dem Titan GT77 12UHS ein potentes 17,3-Zoll-Notebook im Sortiment, das in allen leistungsfordernden Anwendungsszenarien eine gute Figur abgibt.
Testbedingungen
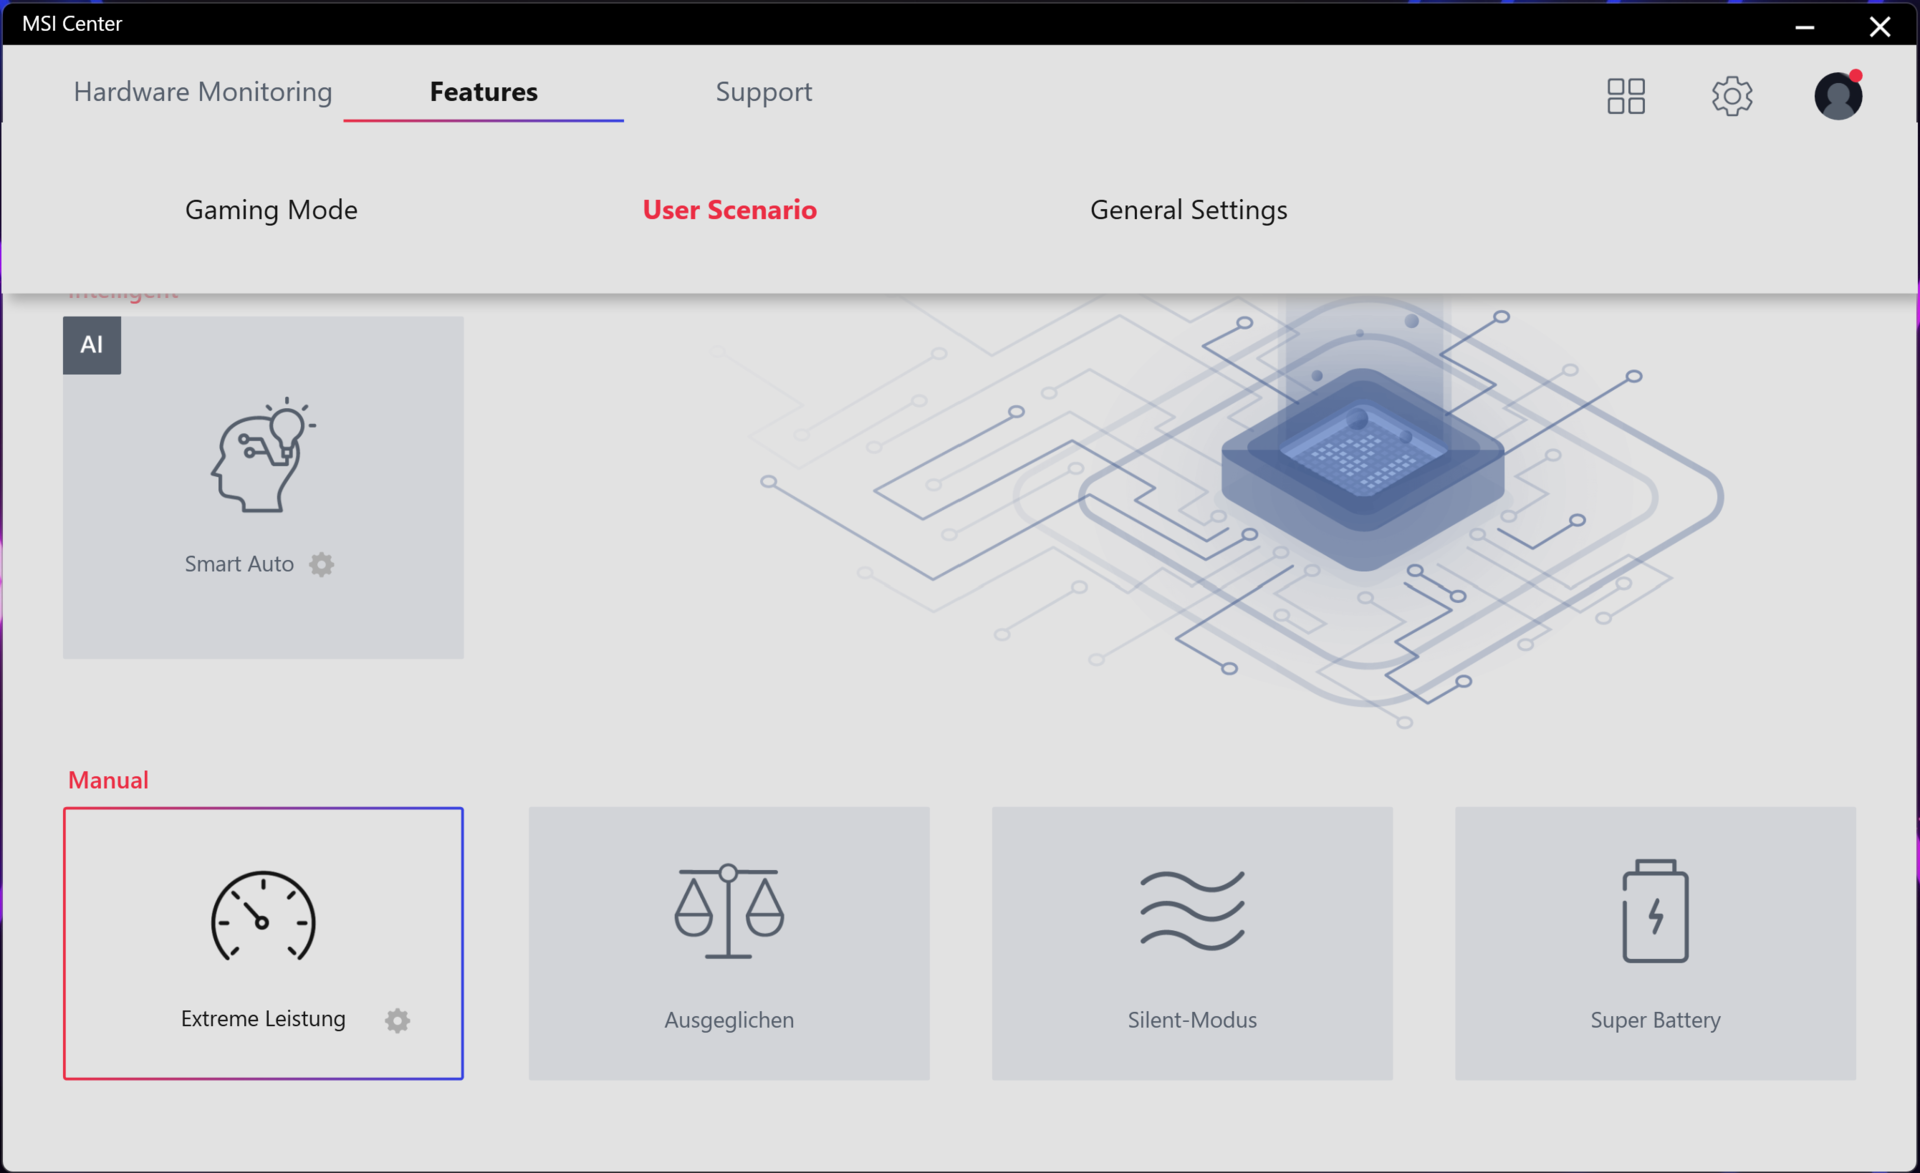
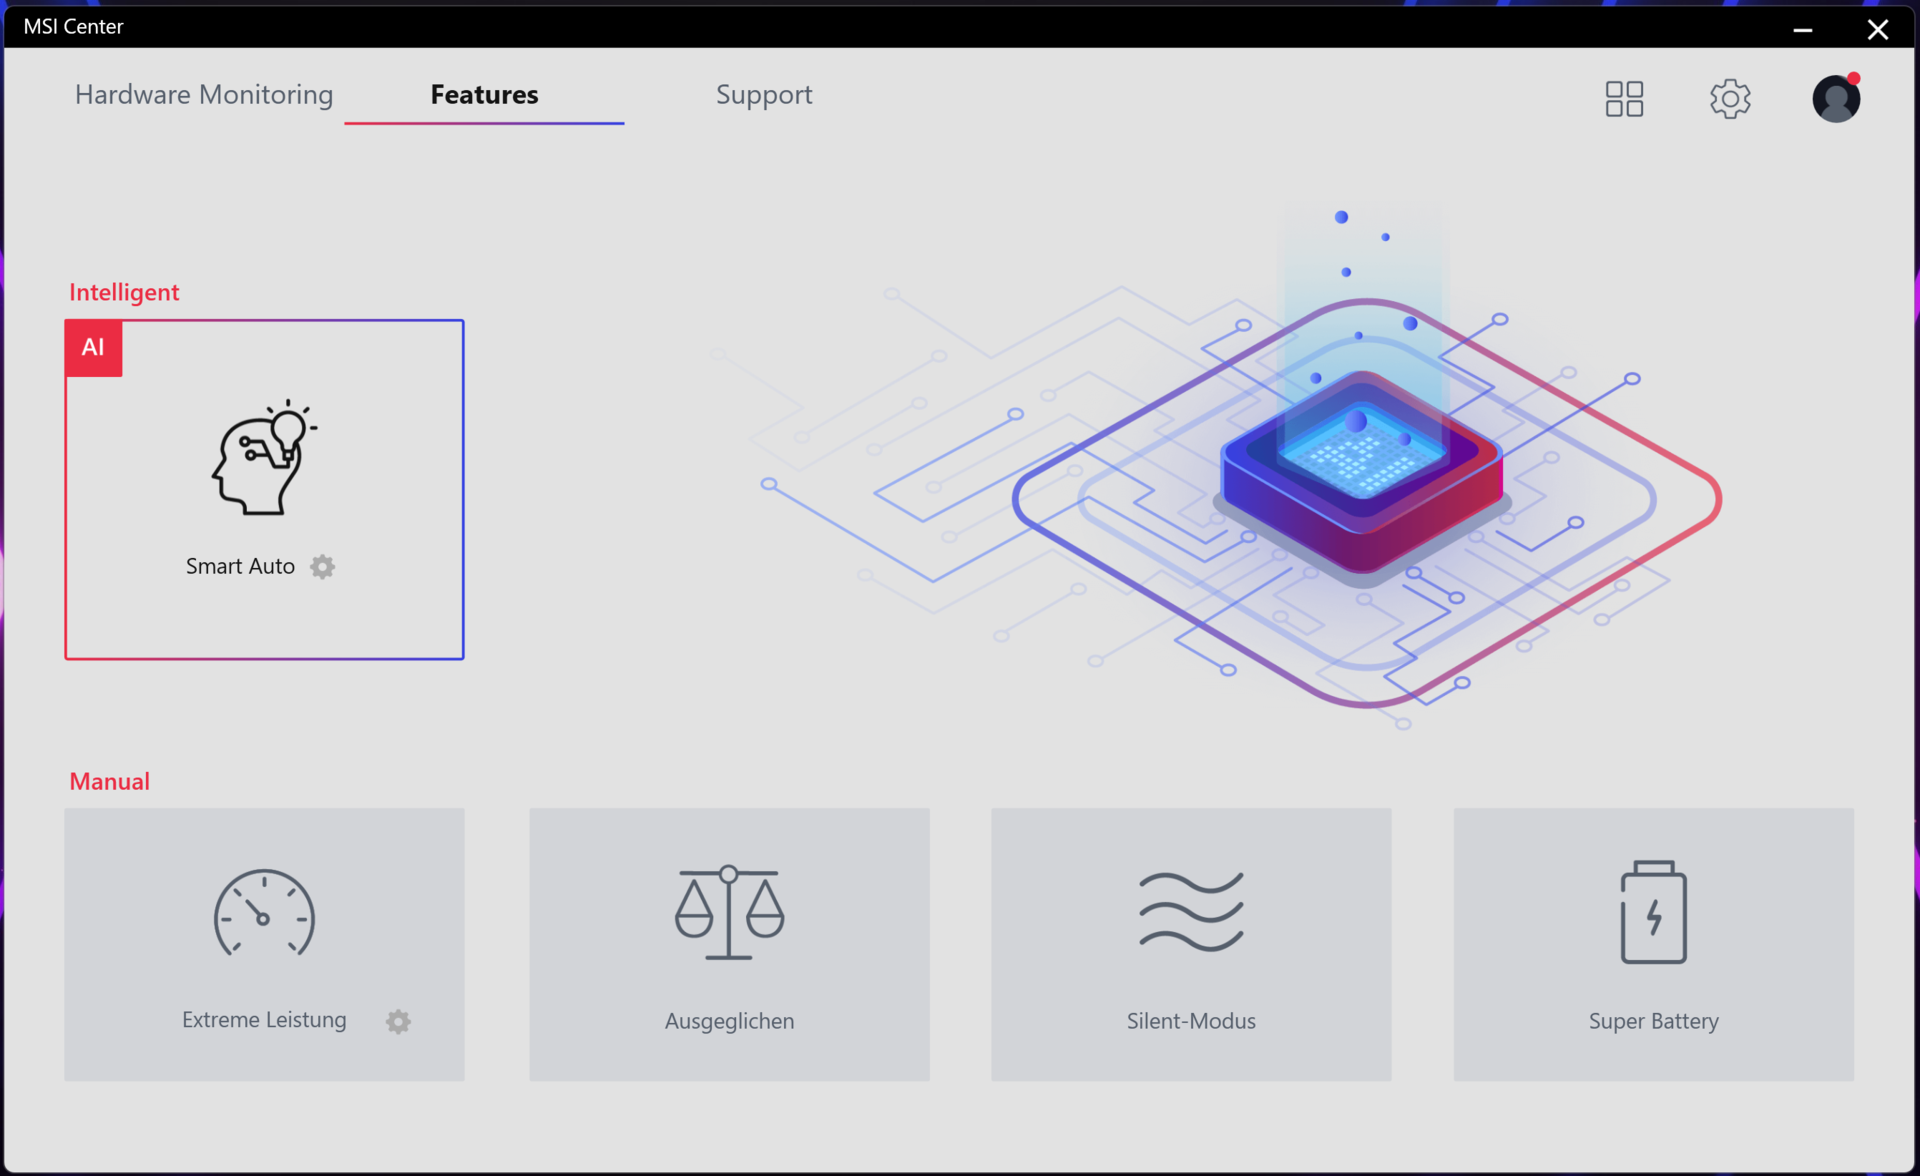
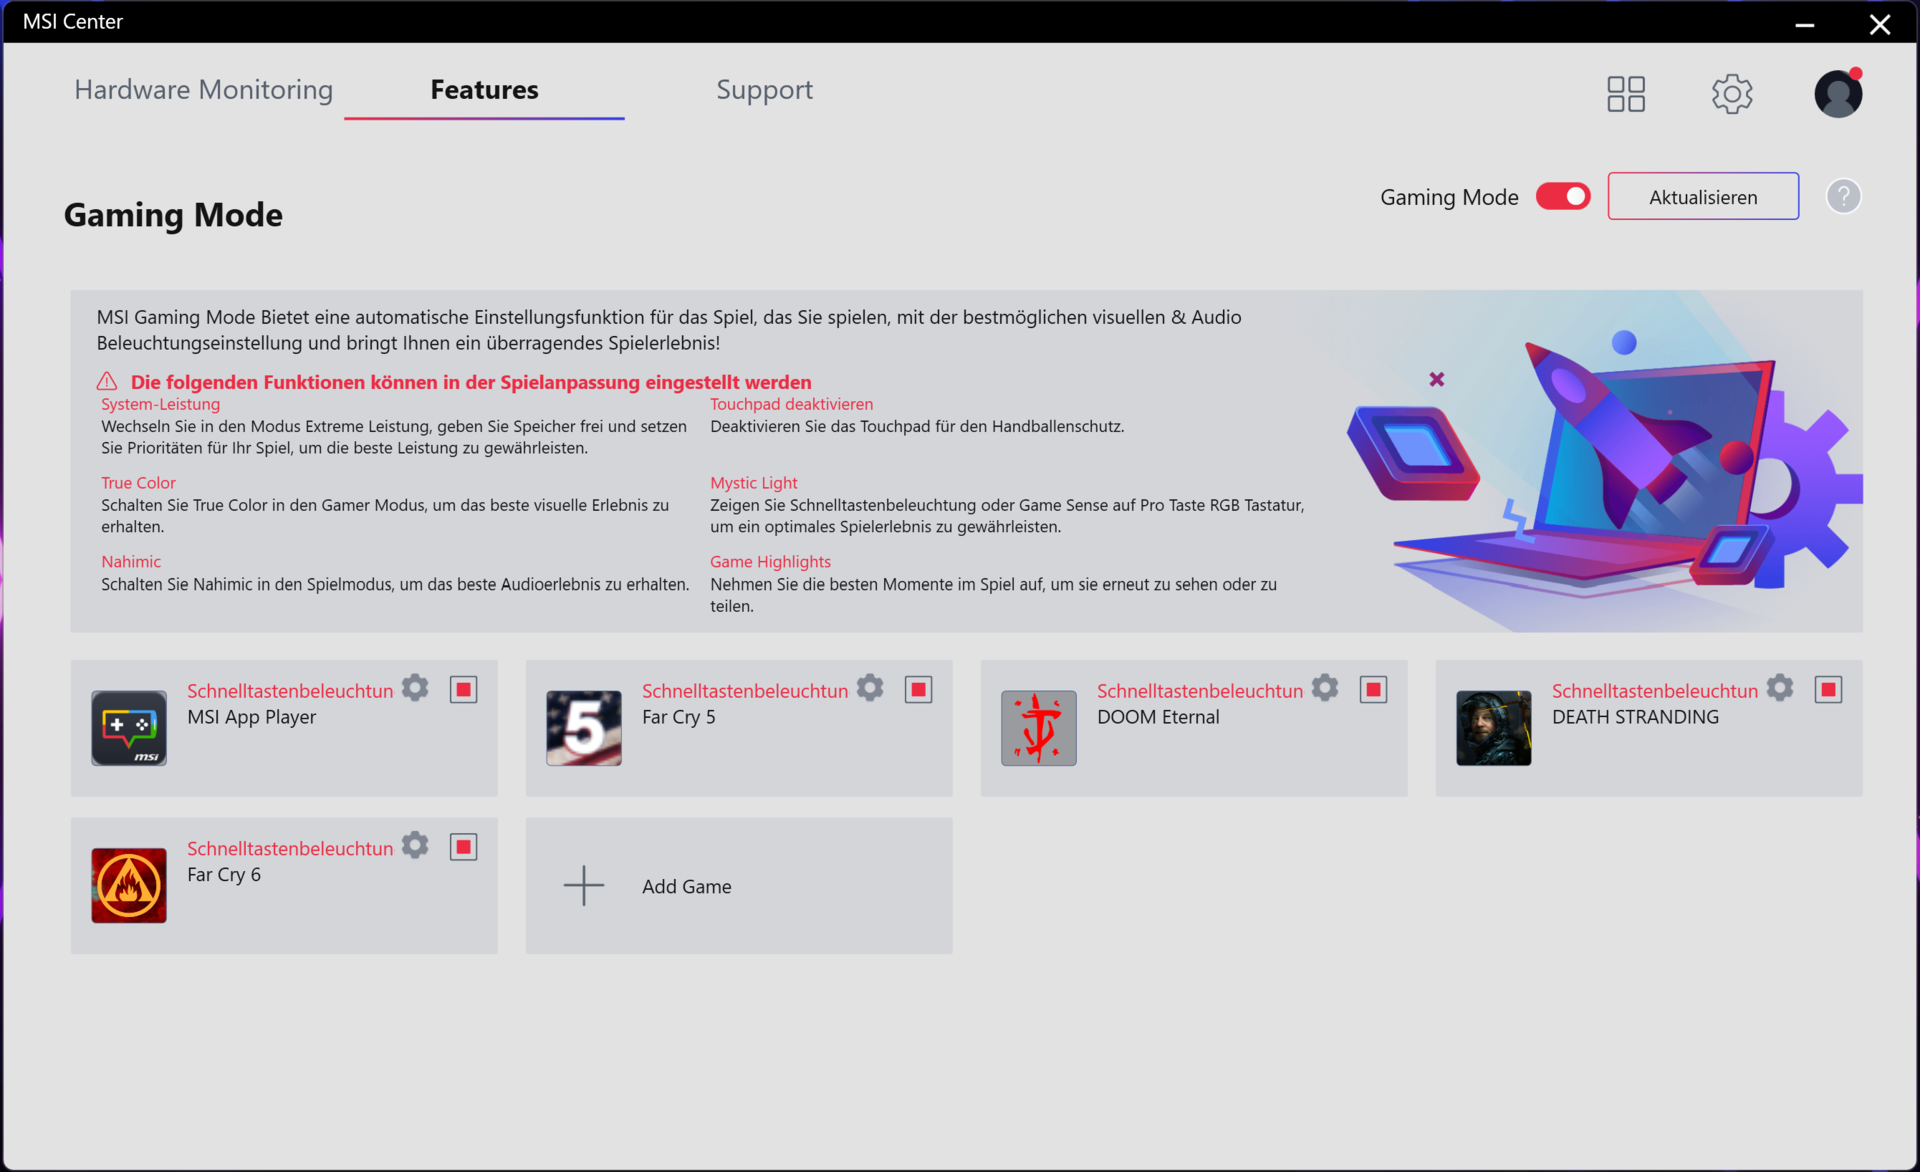
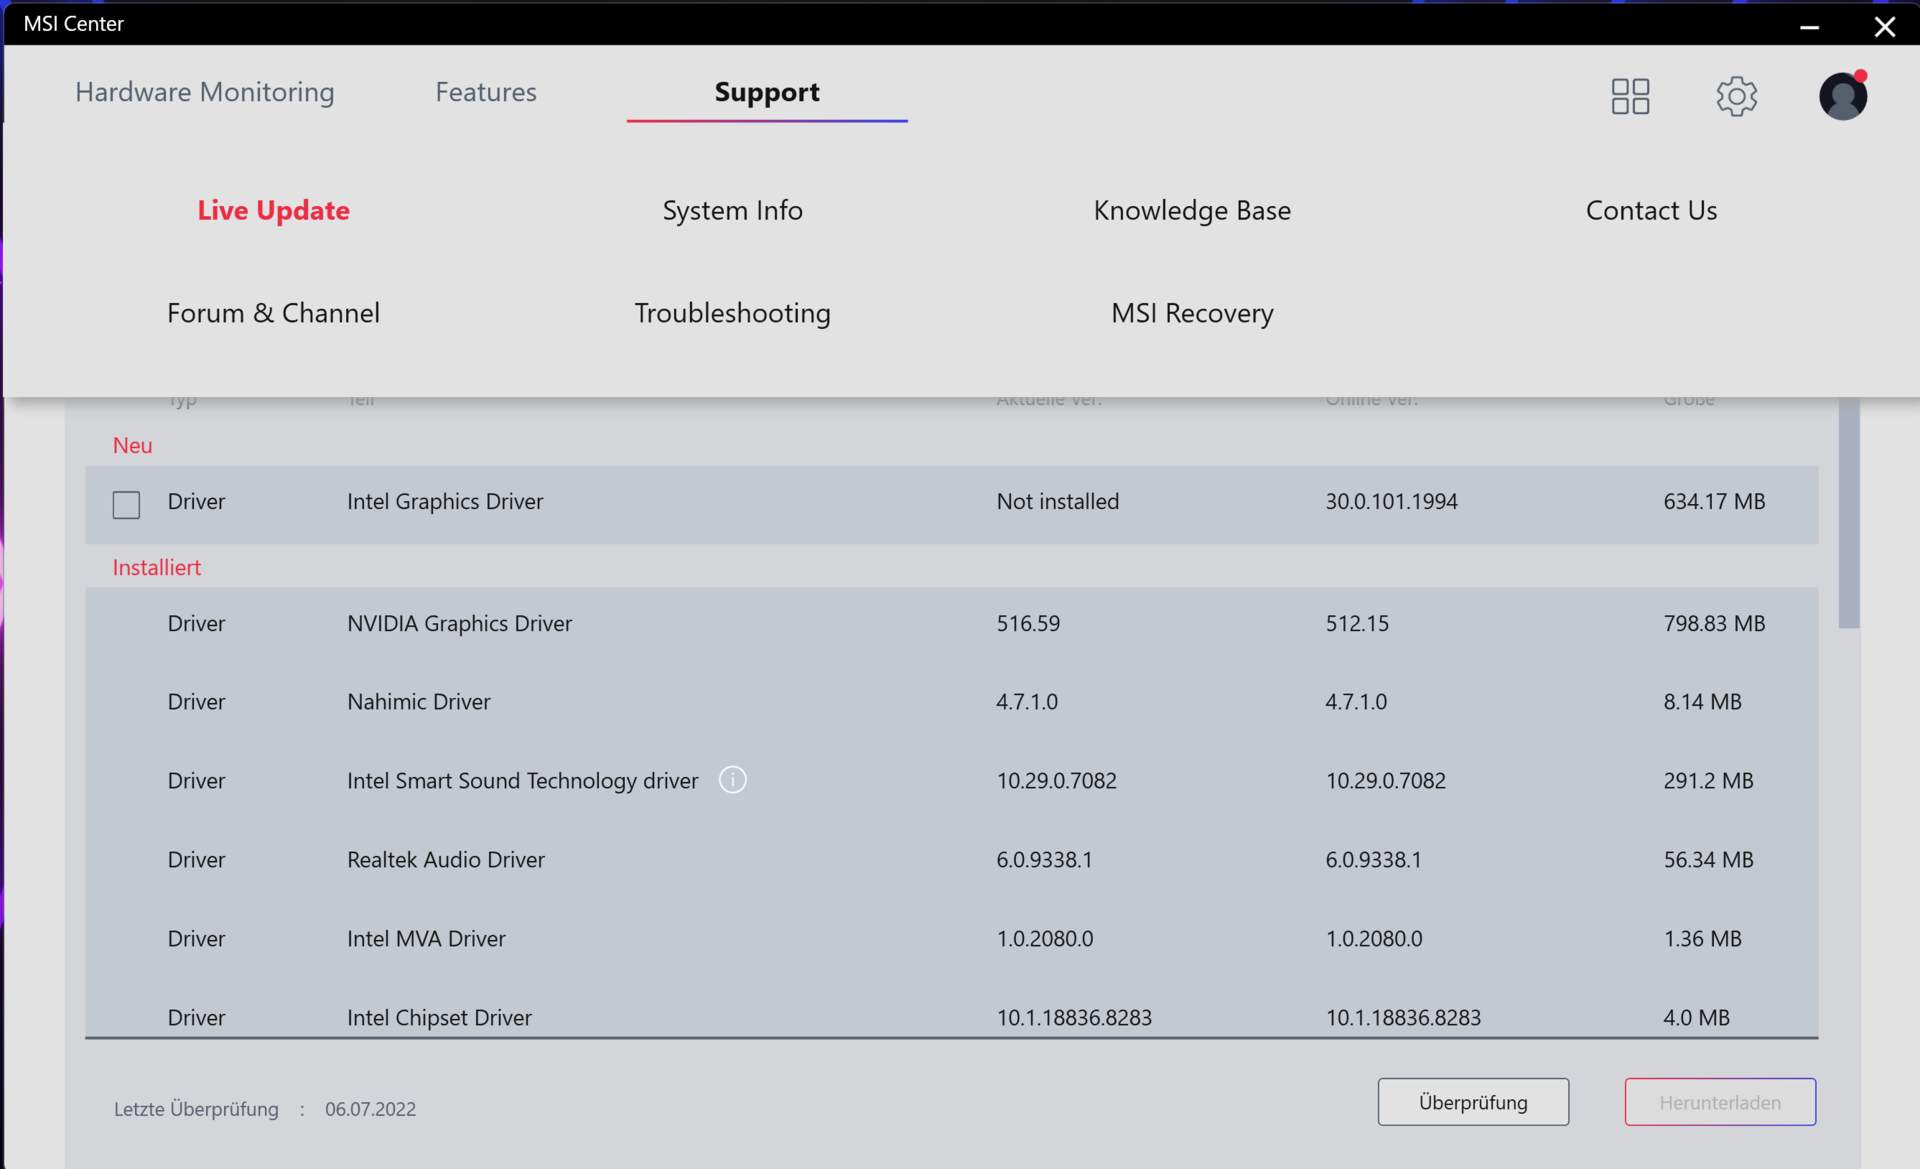
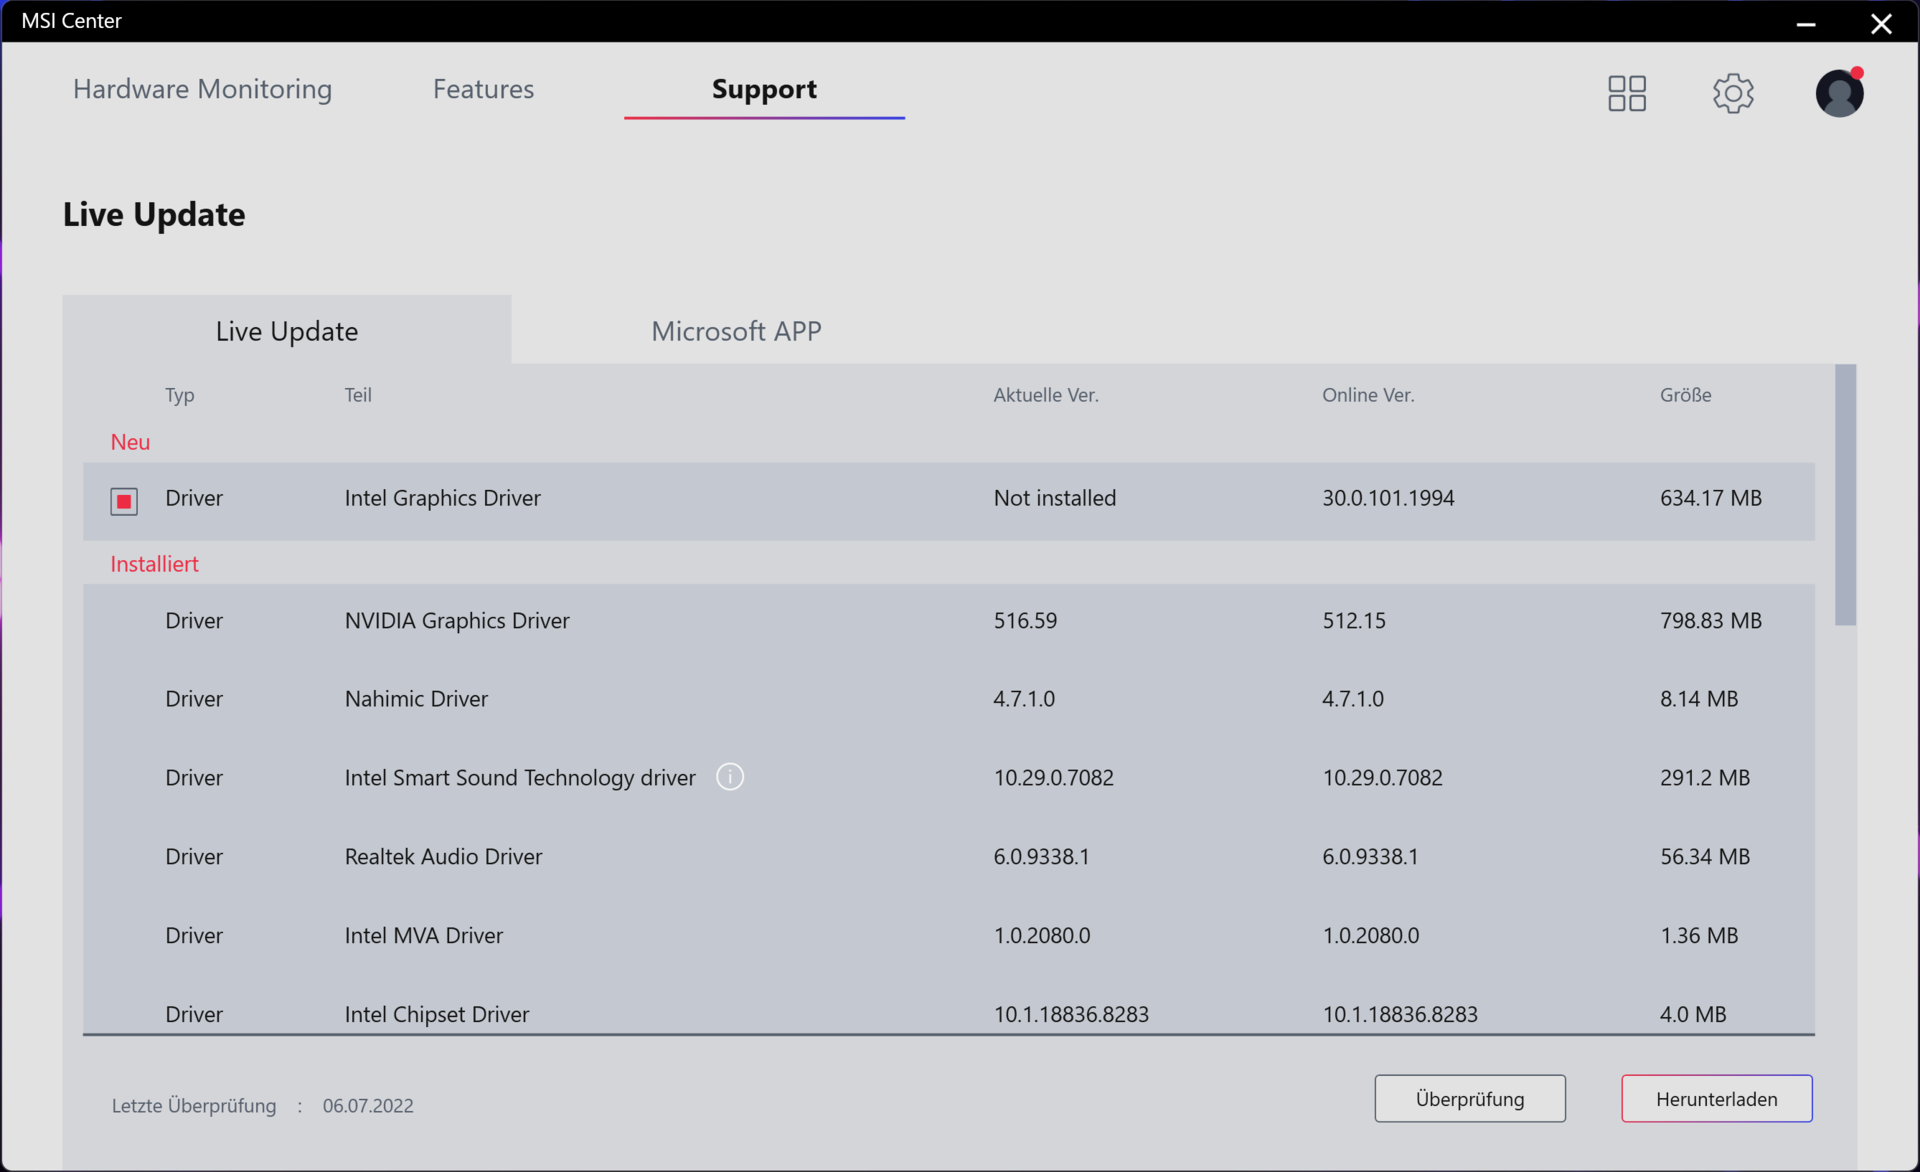
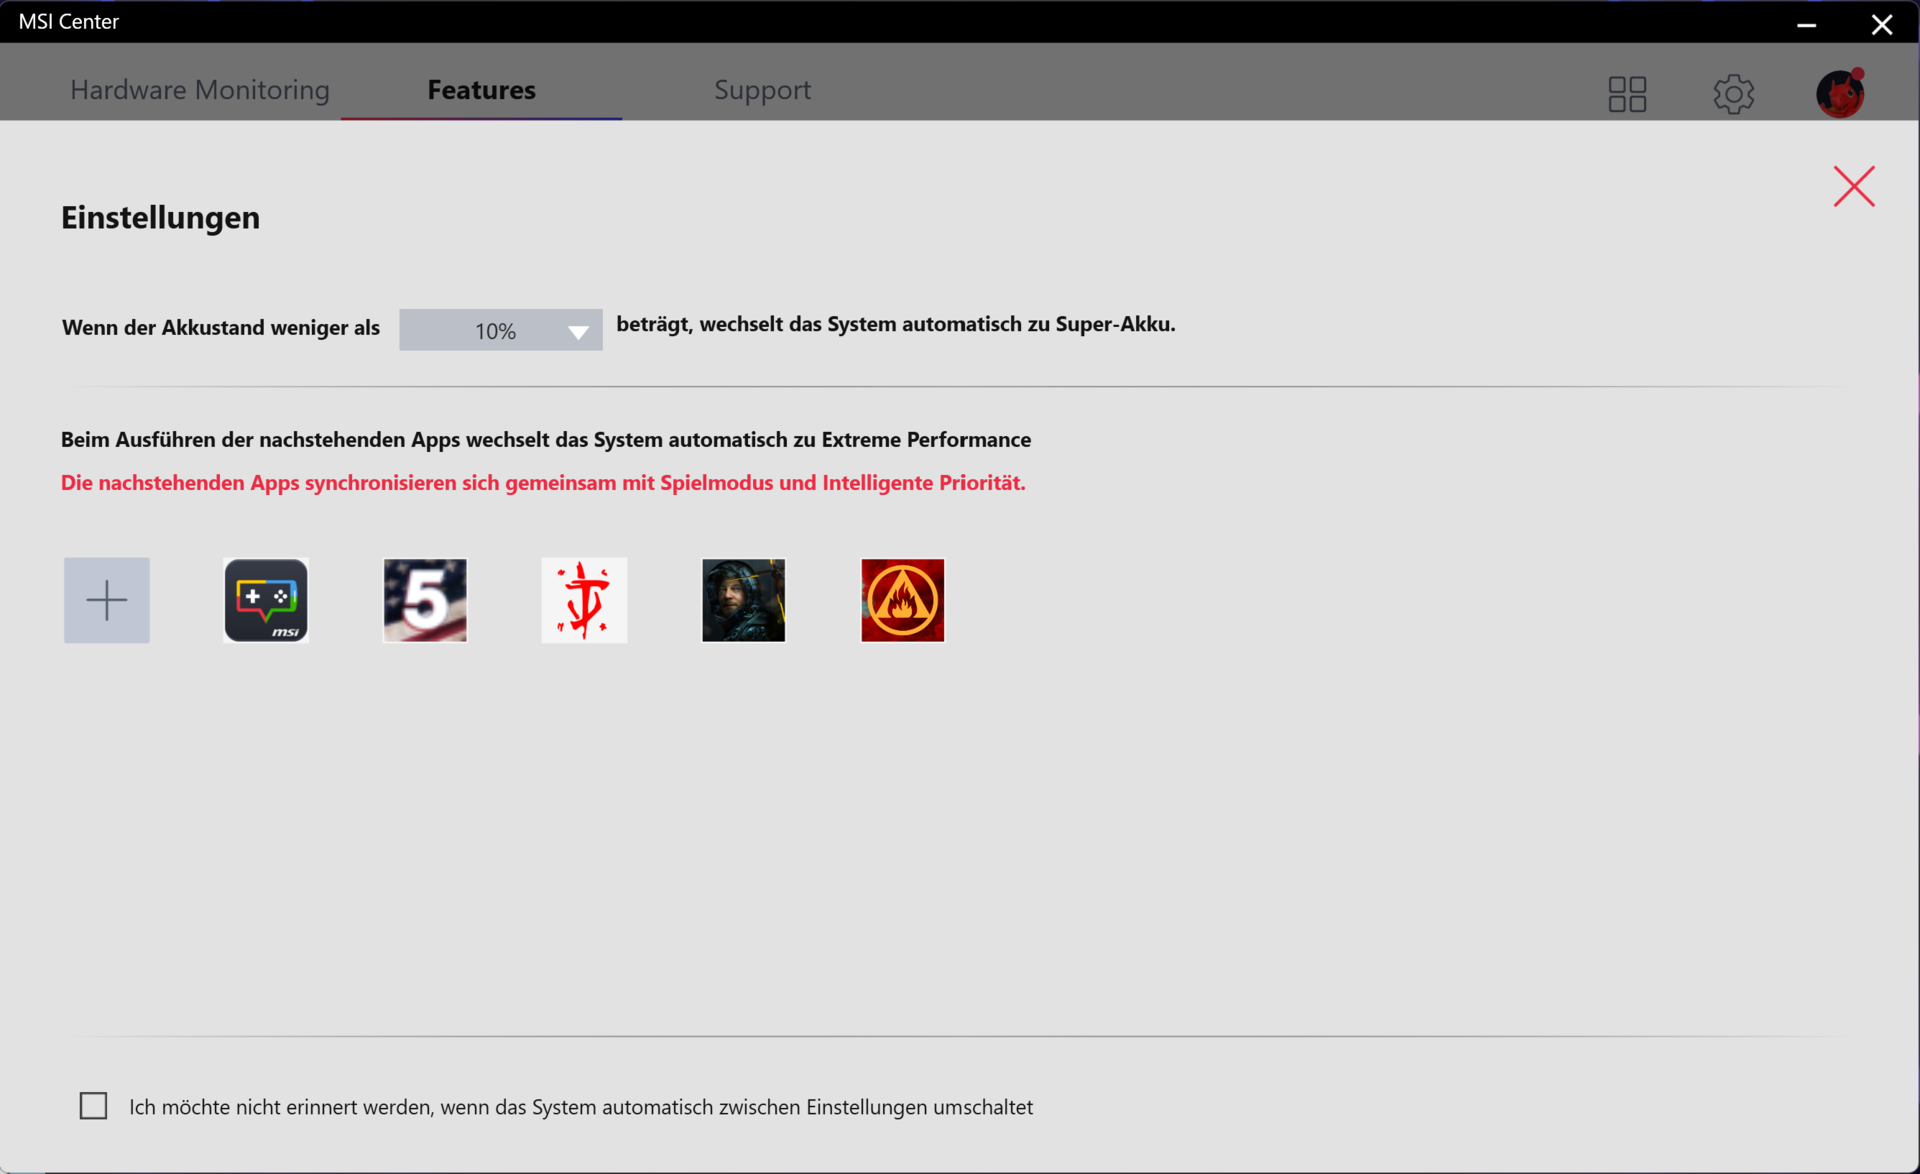
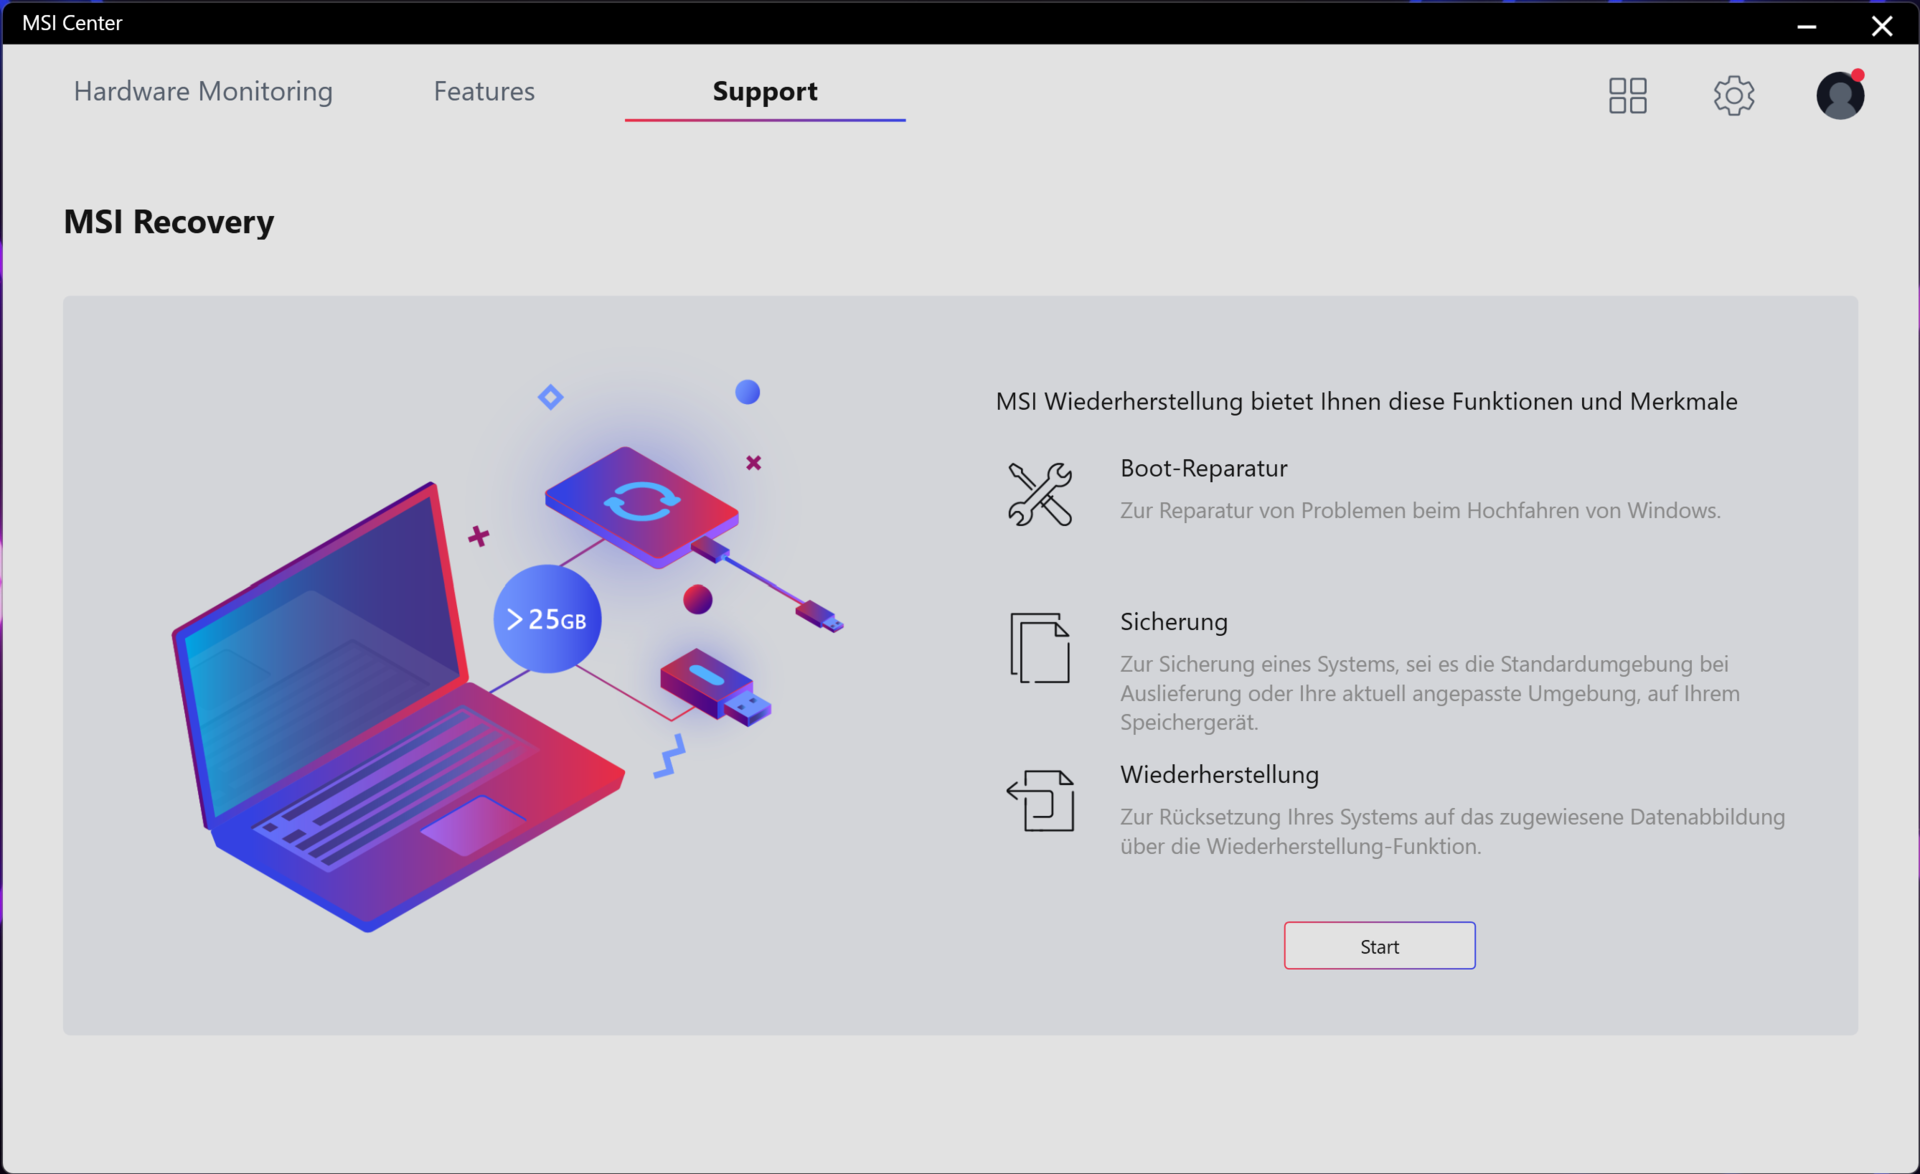
Zwischen den vier Leistungsprofilen des Notebooks kann per vorinstallierter MSI-Center-Software (siehe Bilder) oder über die Tastenkombination "FN" + "F7" gewechselt werden. Wird - wie in unserem Fall - die übergeordnete, AI-basierte "Smart Auto"-Funktion genutzt, wählt das MSI Center automatisch jeweils das zum Szenario passende Profil.
Das FHD-Schwestermodell wurde bei aktivem dGPU-Modus getestet, das aktuelle Testgerät bei aktivem Optimus. Somit sind die Messergebnisse nicht immer direkt vergleichbar.
| Extreme Leistung | Ausgeglichen | Silent-Modus | Super Battery | |
|---|---|---|---|---|
| Power Limit 1 | 125 Watt | 100 Watt | 45 Watt | 45 Watt |
| Power Limit 2 | 200 Watt | 200 Watt | 65 Watt | 65 Watt |
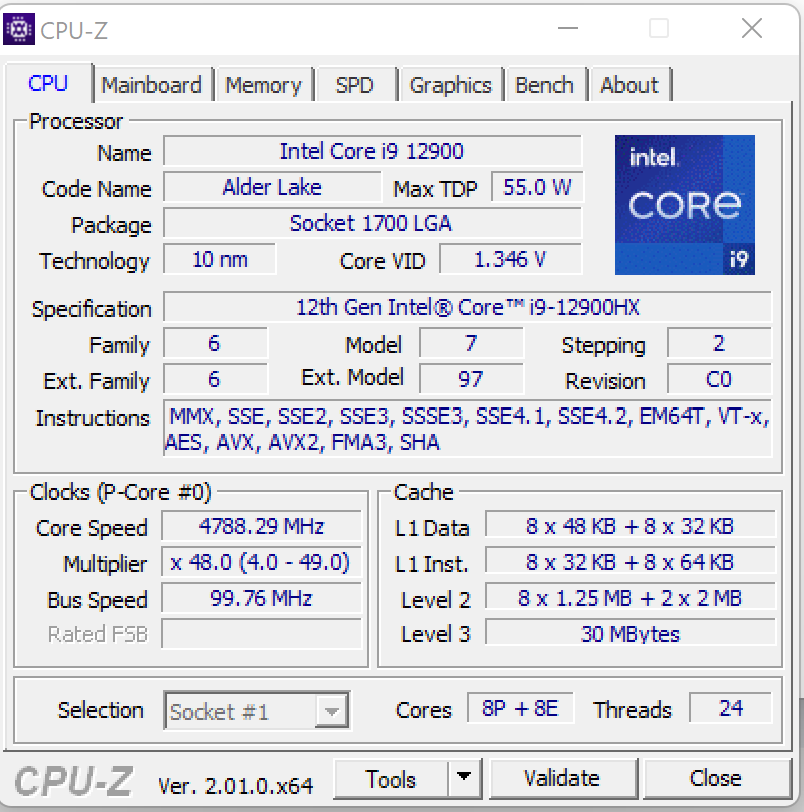
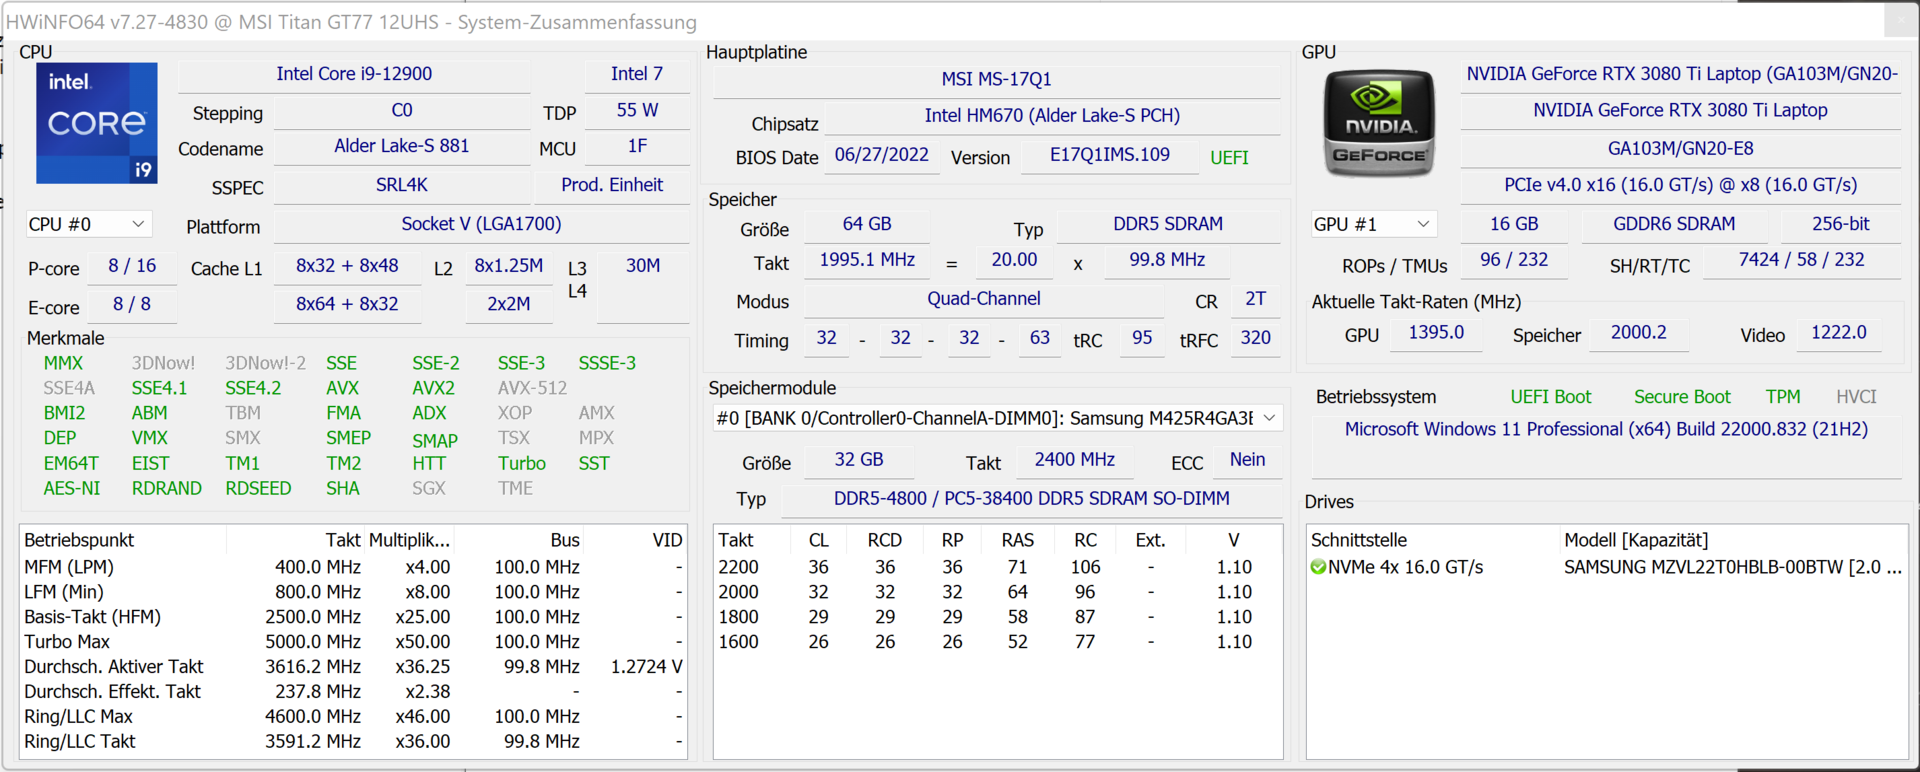
Prozessor
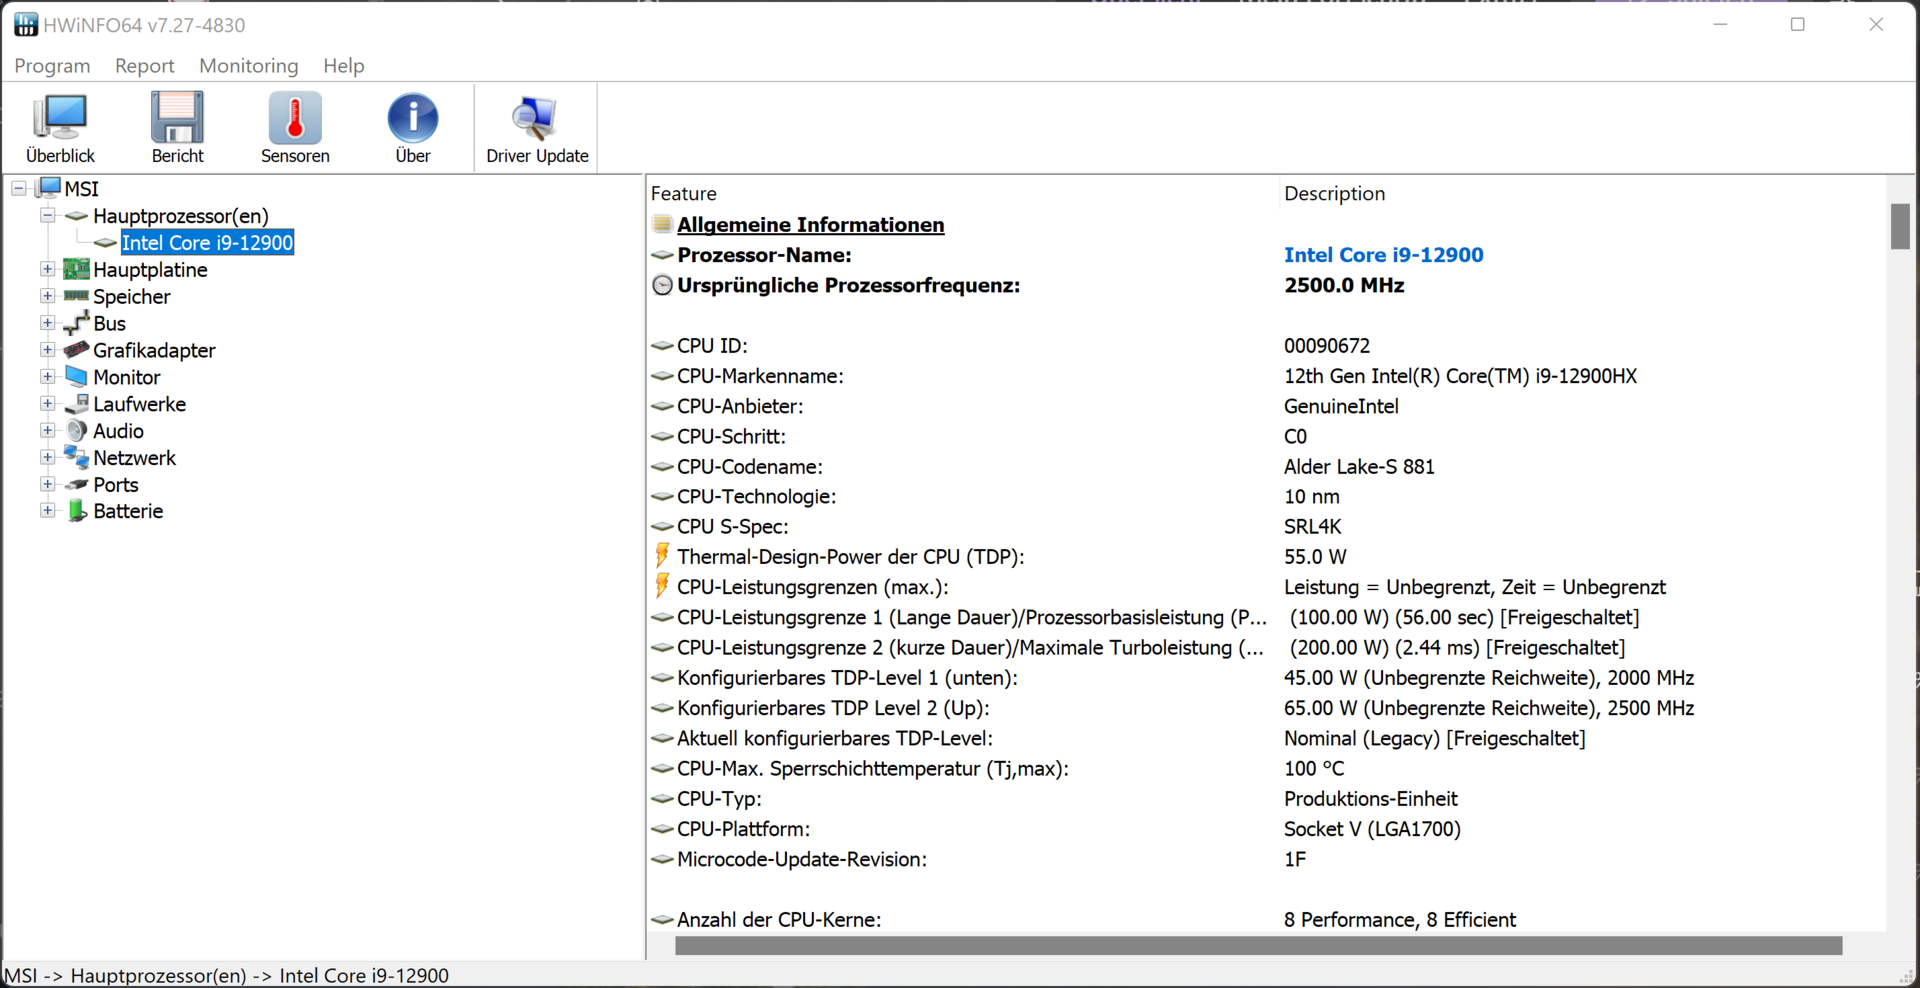
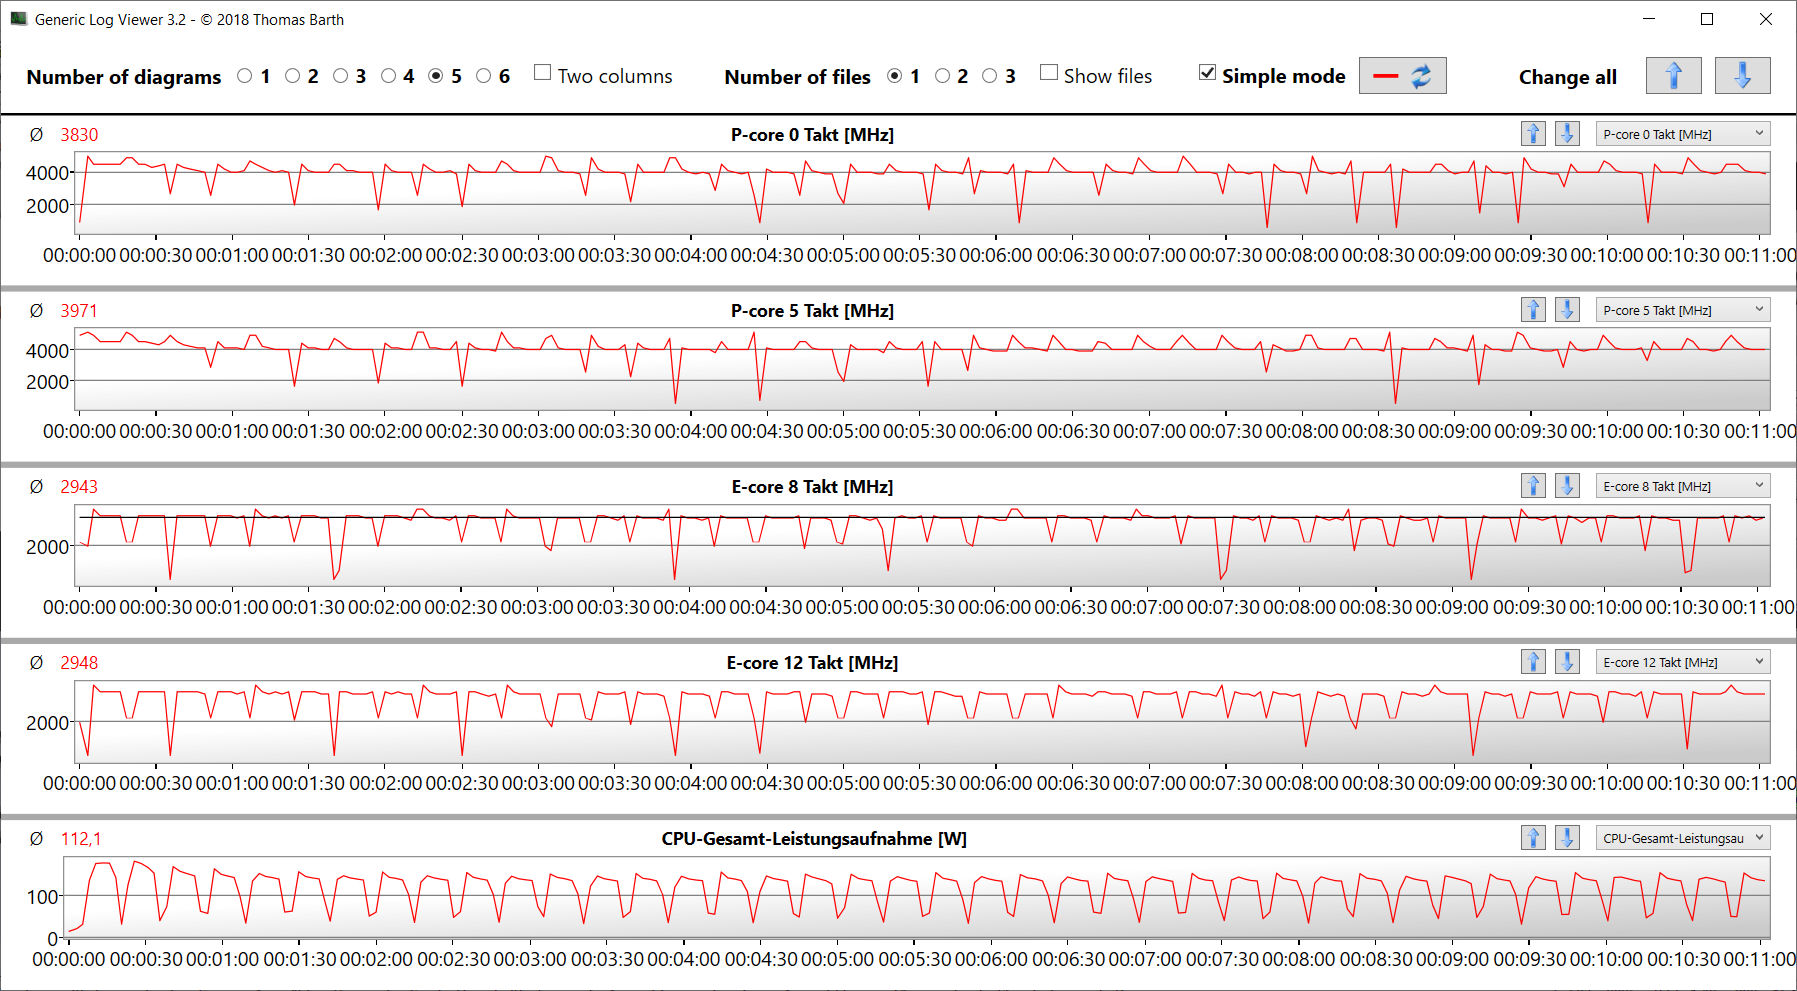
Der Core-i7-12900HX-Prozessor (Alder Lake) setzt sich aus acht Performancekernen (Hyperthreading, 2,3 bis 5 GHz) und acht Effizienzkernen (kein Hyperthreading, 1,7 bis 3,6 GHz) zusammen. In der Summe ergeben sich 24 logische CPU-Kerne.
Sowohl der Multi-Thread-Test des Cinebench-R15-Benchmarks (P-Kerne: 4,4 GHz, E-Kerne: 3,3 GHz) als auch der Single-Thread-Test (P-Kerne: 500 MHz bis 5 GHz, E-Kerne: 400 MHz bis 3,6 GHz) werden mit hohen Taktraten durchlaufen. Im Akkubetrieb liegen die Geschwindigkeiten etwas niedriger.
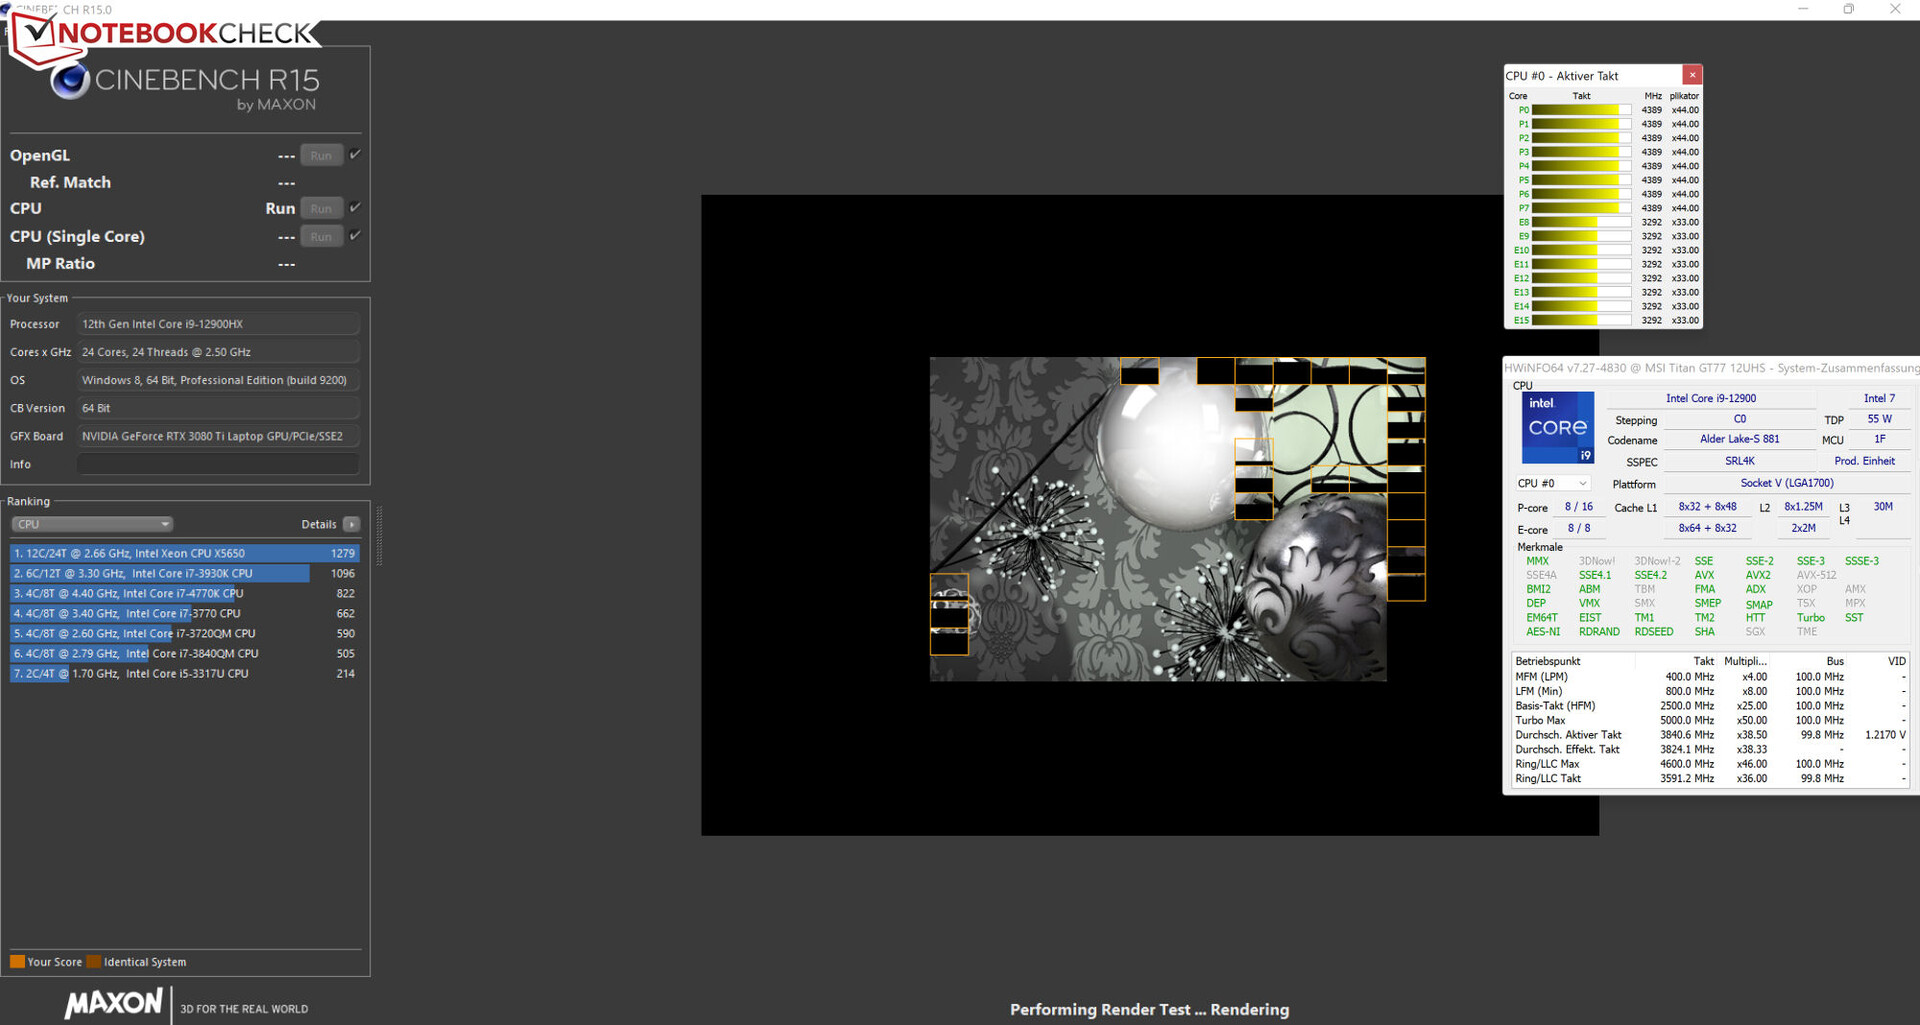
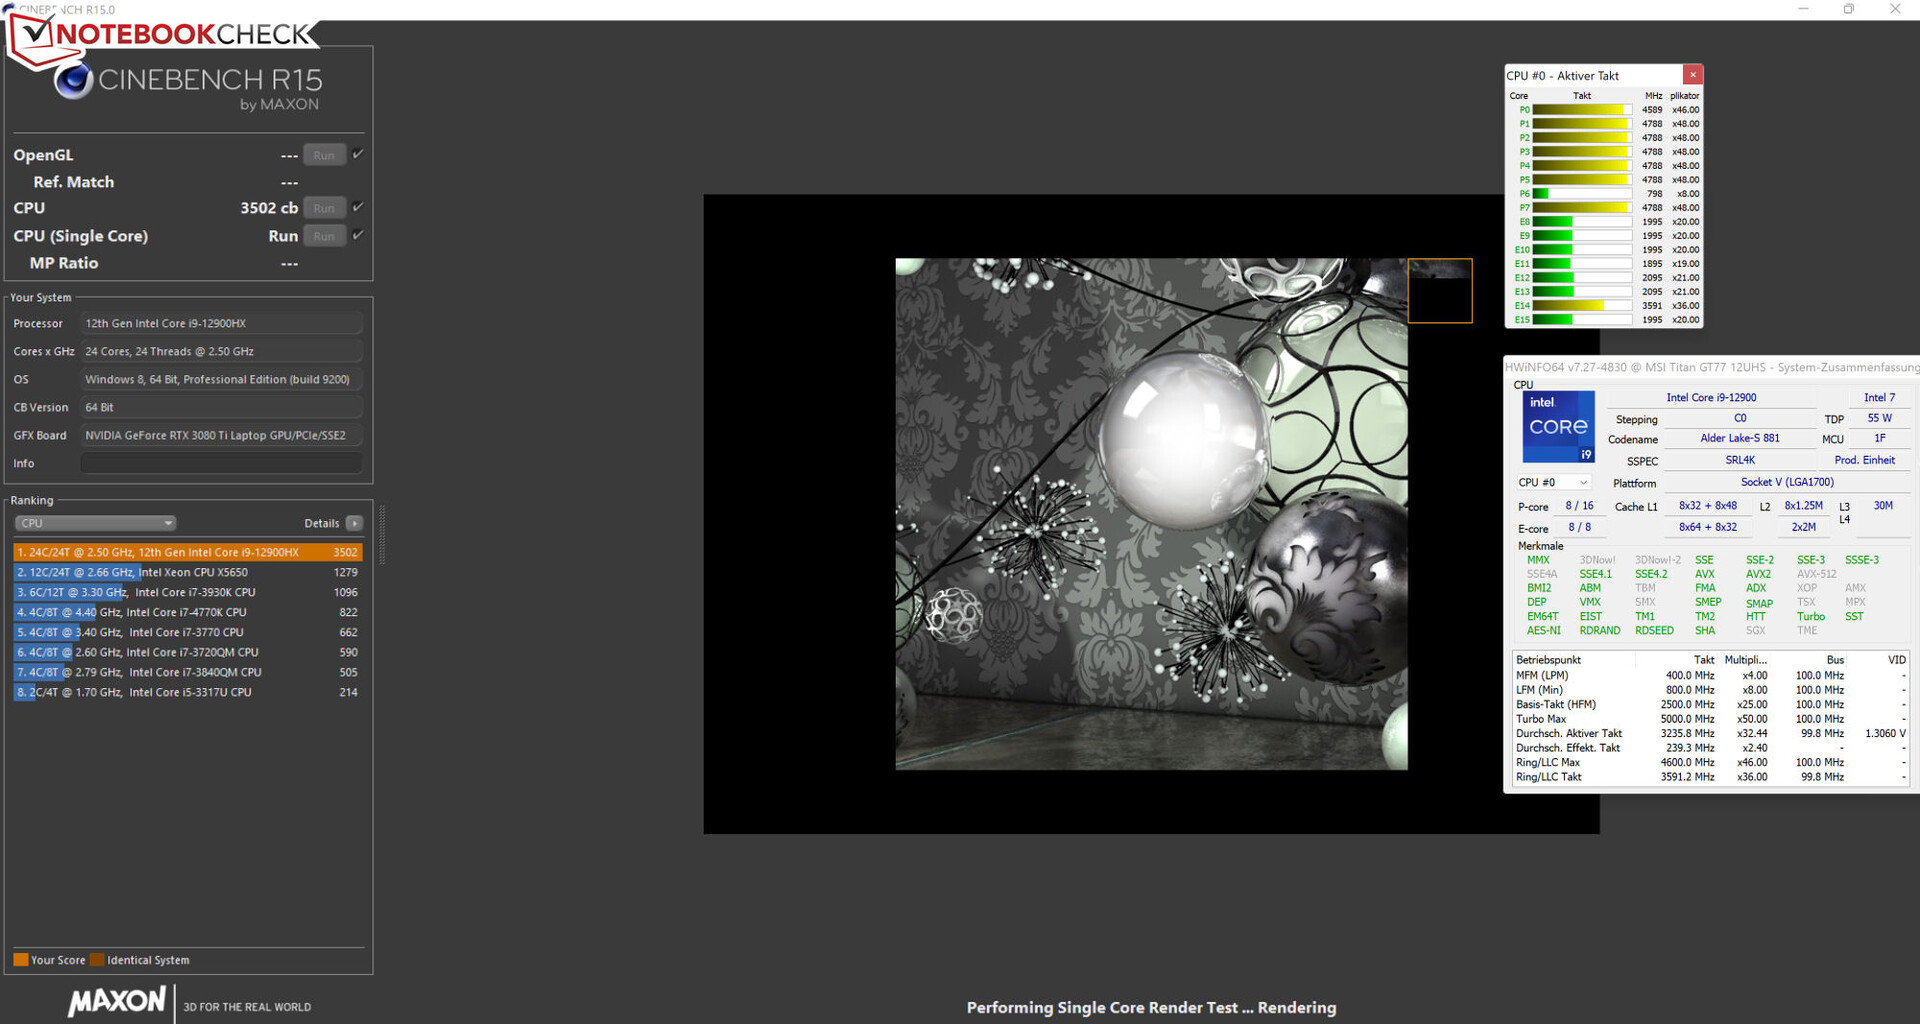
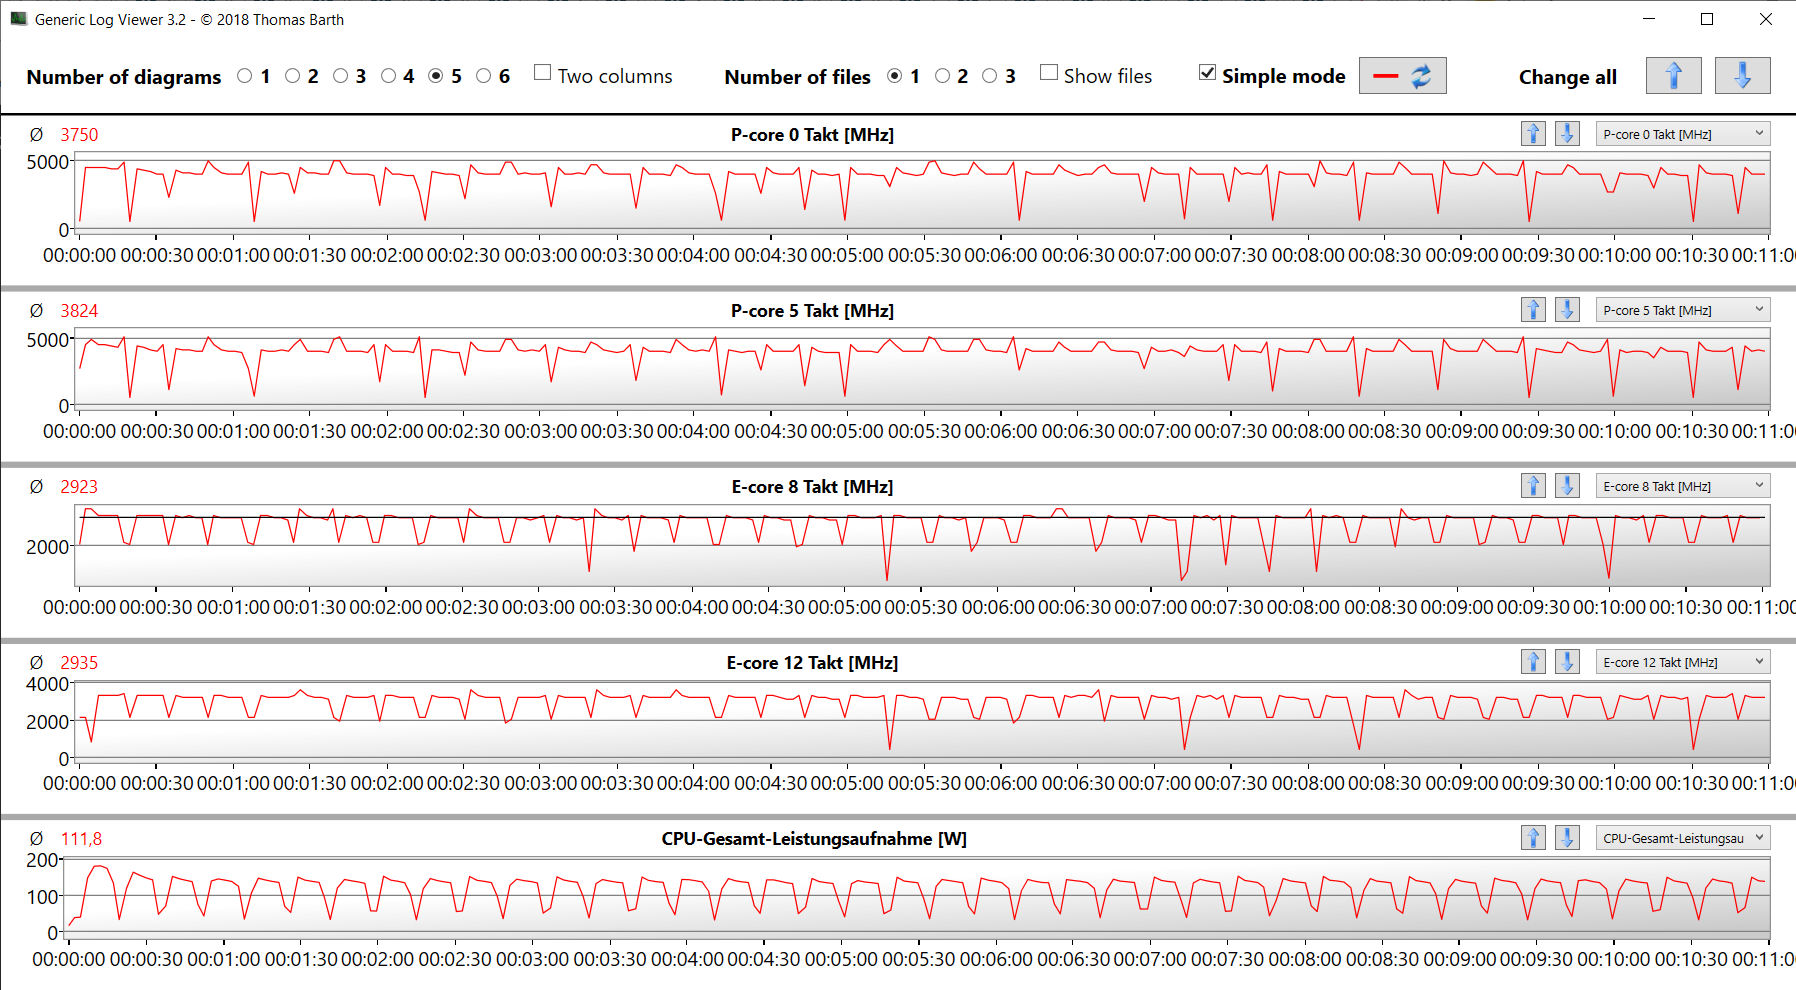
Der CB-15-Schleifentest verrät, dass die CPU dauerhaft mit hohen Taktraten arbeiten kann. Das Profil "Extreme Leistung" bewirkt eine minimal gleichmäßigere Leistungsentfaltung.
Cinebench R15 Multi Dauertest
| CPU Performance Rating - Percent | |
| MSI Titan GT77 12UHS 4k | |
| MSI Titan GT77 12UHS | |
| MSI Titan GT77 12UHS | |
| Durchschnittliche Intel Core i9-12900HX | |
| Alienware x17 R2 P48E | |
| Durchschnitt der Klasse Gaming | |
| SCHENKER XMG Ultra 17 Rocket Lake | |
| Razer Blade 17 Early 2022 | |
| Cinebench R23 | |
| Multi Core | |
| MSI Titan GT77 12UHS 4k | |
| MSI Titan GT77 12UHS (4k, Extreme Leistung, Cooler Boost) | |
| MSI Titan GT77 12UHS | |
| Durchschnittliche Intel Core i9-12900HX (18337 - 23482, n=8) | |
| Durchschnitt der Klasse Gaming (2435 - 34613, n=232, der letzten 2 Jahre) | |
| Alienware x17 R2 P48E | |
| SCHENKER XMG Ultra 17 Rocket Lake | |
| Razer Blade 17 Early 2022 | |
| Single Core | |
| MSI Titan GT77 12UHS 4k | |
| Durchschnittliche Intel Core i9-12900HX (1897 - 1936, n=8) | |
| MSI Titan GT77 12UHS | |
| MSI Titan GT77 12UHS (4k, Extreme Leistung, Cooler Boost) | |
| Razer Blade 17 Early 2022 | |
| Alienware x17 R2 P48E | |
| Durchschnitt der Klasse Gaming (527 - 2235, n=230, der letzten 2 Jahre) | |
| SCHENKER XMG Ultra 17 Rocket Lake | |
| Cinebench R20 | |
| CPU (Multi Core) | |
| MSI Titan GT77 12UHS 4k | |
| MSI Titan GT77 12UHS (4k, Extreme Leistung, Cooler Boost) | |
| MSI Titan GT77 12UHS | |
| Durchschnittliche Intel Core i9-12900HX (7037 - 9042, n=8) | |
| Durchschnitt der Klasse Gaming (930 - 13769, n=230, der letzten 2 Jahre) | |
| Alienware x17 R2 P48E | |
| SCHENKER XMG Ultra 17 Rocket Lake | |
| Razer Blade 17 Early 2022 | |
| CPU (Single Core) | |
| MSI Titan GT77 12UHS 4k | |
| MSI Titan GT77 12UHS | |
| Durchschnittliche Intel Core i9-12900HX (728 - 745, n=8) | |
| MSI Titan GT77 12UHS (4k, Extreme Leistung, Cooler Boost) | |
| Alienware x17 R2 P48E | |
| Razer Blade 17 Early 2022 | |
| Durchschnitt der Klasse Gaming (169 - 855, n=230, der letzten 2 Jahre) | |
| SCHENKER XMG Ultra 17 Rocket Lake | |
| Cinebench R15 | |
| CPU Multi 64Bit | |
| MSI Titan GT77 12UHS 4k | |
| MSI Titan GT77 12UHS (4k, Extreme Leistung, Cooler Boost) | |
| MSI Titan GT77 12UHS | |
| Durchschnittliche Intel Core i9-12900HX (2830 - 3652, n=8) | |
| Durchschnitt der Klasse Gaming (400 - 5663, n=235, der letzten 2 Jahre) | |
| Alienware x17 R2 P48E | |
| SCHENKER XMG Ultra 17 Rocket Lake | |
| Razer Blade 17 Early 2022 | |
| CPU Single 64Bit | |
| MSI Titan GT77 12UHS 4k | |
| MSI Titan GT77 12UHS | |
| MSI Titan GT77 12UHS (4k, Extreme Leistung, Cooler Boost) | |
| Durchschnittliche Intel Core i9-12900HX (274 - 282, n=8) | |
| Alienware x17 R2 P48E | |
| Durchschnitt der Klasse Gaming (79.2 - 318, n=234, der letzten 2 Jahre) | |
| Razer Blade 17 Early 2022 | |
| SCHENKER XMG Ultra 17 Rocket Lake | |
| Blender - v2.79 BMW27 CPU | |
| Razer Blade 17 Early 2022 | |
| SCHENKER XMG Ultra 17 Rocket Lake | |
| Durchschnitt der Klasse Gaming (87 - 1259, n=228, der letzten 2 Jahre) | |
| Alienware x17 R2 P48E | |
| Durchschnittliche Intel Core i9-12900HX (144 - 201, n=8) | |
| MSI Titan GT77 12UHS 4k | |
| MSI Titan GT77 12UHS | |
| MSI Titan GT77 12UHS (4k, Extreme Leistung, Cooler Boost) | |
| Geekbench 5.5 | |
| Multi-Core | |
| MSI Titan GT77 12UHS 4k | |
| MSI Titan GT77 12UHS (4k, Extreme Leistung, Cooler Boost) | |
| MSI Titan GT77 12UHS | |
| Durchschnittliche Intel Core i9-12900HX (15116 - 16925, n=8) | |
| Alienware x17 R2 P48E | |
| Durchschnitt der Klasse Gaming (1946 - 22200, n=234, der letzten 2 Jahre) | |
| SCHENKER XMG Ultra 17 Rocket Lake | |
| Razer Blade 17 Early 2022 | |
| Single-Core | |
| MSI Titan GT77 12UHS | |
| MSI Titan GT77 12UHS 4k | |
| MSI Titan GT77 12UHS (4k, Extreme Leistung, Cooler Boost) | |
| Durchschnittliche Intel Core i9-12900HX (1874 - 1949, n=8) | |
| Alienware x17 R2 P48E | |
| Durchschnitt der Klasse Gaming (158 - 2210, n=234, der letzten 2 Jahre) | |
| Razer Blade 17 Early 2022 | |
| SCHENKER XMG Ultra 17 Rocket Lake | |
| HWBOT x265 Benchmark v2.2 - 4k Preset | |
| MSI Titan GT77 12UHS 4k | |
| MSI Titan GT77 12UHS (4k, Extreme Leistung, Cooler Boost) | |
| MSI Titan GT77 12UHS | |
| Durchschnittliche Intel Core i9-12900HX (19.6 - 26.6, n=7) | |
| Alienware x17 R2 P48E | |
| Durchschnitt der Klasse Gaming (3 - 37.6, n=232, der letzten 2 Jahre) | |
| SCHENKER XMG Ultra 17 Rocket Lake | |
| Razer Blade 17 Early 2022 | |
| LibreOffice - 20 Documents To PDF | |
| Durchschnitt der Klasse Gaming (32.8 - 332, n=226, der letzten 2 Jahre) | |
| Alienware x17 R2 P48E | |
| SCHENKER XMG Ultra 17 Rocket Lake | |
| Razer Blade 17 Early 2022 | |
| MSI Titan GT77 12UHS | |
| MSI Titan GT77 12UHS 4k | |
| Durchschnittliche Intel Core i9-12900HX (33.6 - 42.4, n=7) | |
| MSI Titan GT77 12UHS (4k, Extreme Leistung, Cooler Boost) | |
| R Benchmark 2.5 - Overall mean | |
| SCHENKER XMG Ultra 17 Rocket Lake | |
| Durchschnitt der Klasse Gaming (0.3609 - 4.47, n=229, der letzten 2 Jahre) | |
| Razer Blade 17 Early 2022 | |
| Alienware x17 R2 P48E | |
| MSI Titan GT77 12UHS 4k | |
| MSI Titan GT77 12UHS (4k, Extreme Leistung, Cooler Boost) | |
| Durchschnittliche Intel Core i9-12900HX (0.4159 - 0.4242, n=7) | |
| MSI Titan GT77 12UHS | |
* ... kleinere Werte sind besser
AIDA64: FP32 Ray-Trace | FPU Julia | CPU SHA3 | CPU Queen | FPU SinJulia | FPU Mandel | CPU AES | CPU ZLib | FP64 Ray-Trace | CPU PhotoWorxx
| Performance Rating | |
| MSI Titan GT77 12UHS 4k | |
| MSI Titan GT77 12UHS | |
| MSI Titan GT77 12UHS | |
| Durchschnittliche Intel Core i9-12900HX | |
| Durchschnitt der Klasse Gaming | |
| SCHENKER XMG Ultra 17 Rocket Lake | |
| Alienware x17 R2 P48E | |
| Razer Blade 17 Early 2022 | |
| AIDA64 / FP32 Ray-Trace | |
| MSI Titan GT77 12UHS 4k (v6.70.6000) | |
| MSI Titan GT77 12UHS (v6.70.6000, 4k, Extreme Leistung, Cooler Boost) | |
| MSI Titan GT77 12UHS (v6.70.6000) | |
| Durchschnittliche Intel Core i9-12900HX (11535 - 22183, n=7) | |
| Durchschnitt der Klasse Gaming (3069 - 60169, n=225, der letzten 2 Jahre) | |
| SCHENKER XMG Ultra 17 Rocket Lake (v6.32.5600) | |
| Alienware x17 R2 P48E (v6.50.5800) | |
| Razer Blade 17 Early 2022 (v6.50.5800) | |
| AIDA64 / FPU Julia | |
| MSI Titan GT77 12UHS 4k (v6.70.6000) | |
| MSI Titan GT77 12UHS (v6.70.6000) | |
| MSI Titan GT77 12UHS (v6.70.6000, 4k, Extreme Leistung, Cooler Boost) | |
| Durchschnittliche Intel Core i9-12900HX (52916 - 110093, n=7) | |
| Durchschnitt der Klasse Gaming (18567 - 252486, n=225, der letzten 2 Jahre) | |
| SCHENKER XMG Ultra 17 Rocket Lake (v6.32.5600) | |
| Alienware x17 R2 P48E (v6.50.5800) | |
| Razer Blade 17 Early 2022 (v6.50.5800) | |
| AIDA64 / CPU SHA3 | |
| MSI Titan GT77 12UHS 4k (v6.70.6000) | |
| MSI Titan GT77 12UHS (v6.70.6000, 4k, Extreme Leistung, Cooler Boost) | |
| MSI Titan GT77 12UHS (v6.70.6000) | |
| SCHENKER XMG Ultra 17 Rocket Lake (v6.32.5600) | |
| Durchschnittliche Intel Core i9-12900HX (3559 - 5123, n=7) | |
| Durchschnitt der Klasse Gaming (629 - 10389, n=225, der letzten 2 Jahre) | |
| Alienware x17 R2 P48E (v6.50.5800) | |
| Razer Blade 17 Early 2022 (v6.50.5800) | |
| AIDA64 / CPU Queen | |
| Durchschnitt der Klasse Gaming (15371 - 200651, n=225, der letzten 2 Jahre) | |
| Alienware x17 R2 P48E (v6.50.5800) | |
| SCHENKER XMG Ultra 17 Rocket Lake (v6.32.5600) | |
| MSI Titan GT77 12UHS (v6.70.6000) | |
| MSI Titan GT77 12UHS 4k (v6.70.6000) | |
| MSI Titan GT77 12UHS (v6.70.6000, 4k, Extreme Leistung, Cooler Boost) | |
| Durchschnittliche Intel Core i9-12900HX (101029 - 104457, n=7) | |
| Razer Blade 17 Early 2022 (v6.50.5800) | |
| AIDA64 / FPU SinJulia | |
| MSI Titan GT77 12UHS 4k (v6.70.6000) | |
| MSI Titan GT77 12UHS (v6.70.6000, 4k, Extreme Leistung, Cooler Boost) | |
| MSI Titan GT77 12UHS (v6.70.6000) | |
| Durchschnittliche Intel Core i9-12900HX (10475 - 13062, n=7) | |
| Durchschnitt der Klasse Gaming (2137 - 32988, n=225, der letzten 2 Jahre) | |
| SCHENKER XMG Ultra 17 Rocket Lake (v6.32.5600) | |
| Alienware x17 R2 P48E (v6.50.5800) | |
| Razer Blade 17 Early 2022 (v6.50.5800) | |
| AIDA64 / FPU Mandel | |
| MSI Titan GT77 12UHS 4k (v6.70.6000) | |
| MSI Titan GT77 12UHS (v6.70.6000, 4k, Extreme Leistung, Cooler Boost) | |
| MSI Titan GT77 12UHS (v6.70.6000) | |
| Durchschnittliche Intel Core i9-12900HX (31779 - 53628, n=7) | |
| Durchschnitt der Klasse Gaming (10291 - 134044, n=225, der letzten 2 Jahre) | |
| SCHENKER XMG Ultra 17 Rocket Lake (v6.32.5600) | |
| Alienware x17 R2 P48E (v6.50.5800) | |
| Razer Blade 17 Early 2022 (v6.50.5800) | |
| AIDA64 / CPU AES | |
| MSI Titan GT77 12UHS (v6.70.6000, 4k, Extreme Leistung, Cooler Boost) | |
| MSI Titan GT77 12UHS | |
| MSI Titan GT77 12UHS 4k (v6.70.6000) | |
| Durchschnittliche Intel Core i9-12900HX (125268 - 183146, n=7) | |
| SCHENKER XMG Ultra 17 Rocket Lake (v6.32.5600) | |
| Durchschnitt der Klasse Gaming (19065 - 328679, n=225, der letzten 2 Jahre) | |
| Alienware x17 R2 P48E (v6.50.5800) | |
| Razer Blade 17 Early 2022 (v6.50.5800) | |
| AIDA64 / CPU ZLib | |
| MSI Titan GT77 12UHS 4k (v6.70.6000) | |
| MSI Titan GT77 12UHS (v6.70.6000, 4k, Extreme Leistung, Cooler Boost) | |
| MSI Titan GT77 12UHS (v6.70.6000) | |
| Durchschnittliche Intel Core i9-12900HX (990 - 1408, n=7) | |
| Durchschnitt der Klasse Gaming (150.9 - 2409, n=225, der letzten 2 Jahre) | |
| Alienware x17 R2 P48E (v6.50.5800) | |
| SCHENKER XMG Ultra 17 Rocket Lake (v6.32.5600) | |
| Razer Blade 17 Early 2022 (v6.50.5800) | |
| AIDA64 / FP64 Ray-Trace | |
| MSI Titan GT77 12UHS 4k (v6.70.6000) | |
| MSI Titan GT77 12UHS (v6.70.6000, 4k, Extreme Leistung, Cooler Boost) | |
| MSI Titan GT77 12UHS (v6.70.6000) | |
| Durchschnittliche Intel Core i9-12900HX (6663 - 11913, n=7) | |
| Durchschnitt der Klasse Gaming (1518 - 31796, n=225, der letzten 2 Jahre) | |
| SCHENKER XMG Ultra 17 Rocket Lake (v6.32.5600) | |
| Alienware x17 R2 P48E (v6.50.5800) | |
| Razer Blade 17 Early 2022 (v6.50.5800) | |
| AIDA64 / CPU PhotoWorxx | |
| Durchschnittliche Intel Core i9-12900HX (40239 - 47710, n=7) | |
| MSI Titan GT77 12UHS (v6.70.6000) | |
| MSI Titan GT77 12UHS 4k (v6.70.6000) | |
| MSI Titan GT77 12UHS (v6.70.6000, 4k, Extreme Leistung, Cooler Boost) | |
| Razer Blade 17 Early 2022 (v6.50.5800) | |
| Durchschnitt der Klasse Gaming (10805 - 60161, n=226, der letzten 2 Jahre) | |
| Alienware x17 R2 P48E (v6.50.5800) | |
| SCHENKER XMG Ultra 17 Rocket Lake (v6.32.5600) | |
System Performance
An Rechenleistung mangelt es dem GT77 nicht - das verrät schon ein Blick auf die Ausstattungsliste. Gaming, Rendering etc. zählen zu den Domänen des 17-Zöllers. Die Transferraten des Arbeitsspeichers bewegen sich auf einem normalen Niveau für DDR4-4800-Speicher. Dazu gesellen sich gute PC-Mark-Resultate.
CrossMark: Overall | Productivity | Creativity | Responsiveness
| PCMark 10 / Score | |
| MSI Titan GT77 12UHS (dGPU, Extreme Leistung) | |
| MSI Titan GT77 12UHS | |
| Alienware x17 R2 P48E | |
| Durchschnittliche Intel Core i9-12900HX, NVIDIA GeForce RTX 3080 Ti Laptop GPU (6812 - 8636, n=6) | |
| SCHENKER XMG Ultra 17 Rocket Lake | |
| Durchschnitt der Klasse Gaming (5235 - 9852, n=200, der letzten 2 Jahre) | |
| Razer Blade 17 Early 2022 | |
| MSI Titan GT77 12UHS 4k | |
| PCMark 10 / Essentials | |
| Alienware x17 R2 P48E | |
| MSI Titan GT77 12UHS (dGPU, Extreme Leistung) | |
| MSI Titan GT77 12UHS | |
| SCHENKER XMG Ultra 17 Rocket Lake | |
| Durchschnitt der Klasse Gaming (8300 - 12334, n=199, der letzten 2 Jahre) | |
| Durchschnittliche Intel Core i9-12900HX, NVIDIA GeForce RTX 3080 Ti Laptop GPU (9598 - 11192, n=6) | |
| Razer Blade 17 Early 2022 | |
| MSI Titan GT77 12UHS 4k | |
| PCMark 10 / Productivity | |
| MSI Titan GT77 12UHS (dGPU, Extreme Leistung) | |
| Durchschnittliche Intel Core i9-12900HX, NVIDIA GeForce RTX 3080 Ti Laptop GPU (9365 - 10932, n=6) | |
| MSI Titan GT77 12UHS | |
| Alienware x17 R2 P48E | |
| SCHENKER XMG Ultra 17 Rocket Lake | |
| Durchschnitt der Klasse Gaming (6662 - 11833, n=199, der letzten 2 Jahre) | |
| MSI Titan GT77 12UHS 4k | |
| Razer Blade 17 Early 2022 | |
| PCMark 10 / Digital Content Creation | |
| MSI Titan GT77 12UHS (dGPU, Extreme Leistung) | |
| MSI Titan GT77 12UHS | |
| Alienware x17 R2 P48E | |
| Durchschnittliche Intel Core i9-12900HX, NVIDIA GeForce RTX 3080 Ti Laptop GPU (9543 - 14291, n=6) | |
| SCHENKER XMG Ultra 17 Rocket Lake | |
| Durchschnitt der Klasse Gaming (6462 - 18475, n=199, der letzten 2 Jahre) | |
| Razer Blade 17 Early 2022 | |
| MSI Titan GT77 12UHS 4k | |
| CrossMark / Overall | |
| MSI Titan GT77 12UHS 4k | |
| Durchschnittliche Intel Core i9-12900HX, NVIDIA GeForce RTX 3080 Ti Laptop GPU (2108 - 2170, n=5) | |
| MSI Titan GT77 12UHS | |
| Alienware x17 R2 P48E | |
| Durchschnitt der Klasse Gaming (1247 - 2334, n=170, der letzten 2 Jahre) | |
| Razer Blade 17 Early 2022 | |
| CrossMark / Productivity | |
| MSI Titan GT77 12UHS 4k | |
| Durchschnittliche Intel Core i9-12900HX, NVIDIA GeForce RTX 3080 Ti Laptop GPU (1978 - 2047, n=5) | |
| MSI Titan GT77 12UHS | |
| Alienware x17 R2 P48E | |
| Durchschnitt der Klasse Gaming (1299 - 2204, n=170, der letzten 2 Jahre) | |
| Razer Blade 17 Early 2022 | |
| CrossMark / Creativity | |
| MSI Titan GT77 12UHS 4k | |
| Durchschnittliche Intel Core i9-12900HX, NVIDIA GeForce RTX 3080 Ti Laptop GPU (2288 - 2366, n=5) | |
| MSI Titan GT77 12UHS | |
| Alienware x17 R2 P48E | |
| Durchschnitt der Klasse Gaming (1275 - 2514, n=170, der letzten 2 Jahre) | |
| Razer Blade 17 Early 2022 | |
| CrossMark / Responsiveness | |
| MSI Titan GT77 12UHS 4k | |
| Durchschnittliche Intel Core i9-12900HX, NVIDIA GeForce RTX 3080 Ti Laptop GPU (1991 - 2090, n=5) | |
| MSI Titan GT77 12UHS | |
| Durchschnitt der Klasse Gaming (1030 - 2330, n=170, der letzten 2 Jahre) | |
| Alienware x17 R2 P48E | |
| Razer Blade 17 Early 2022 | |
| PCMark 8 Home Score Accelerated v2 | 4166 Punkte | |
| PCMark 8 Creative Score Accelerated v2 | 6677 Punkte | |
| PCMark 8 Work Score Accelerated v2 | 5165 Punkte | |
| PCMark 10 Score | 6812 Punkte | |
Hilfe | ||
| AIDA64 / Memory Copy | |
| Durchschnittliche Intel Core i9-12900HX (62852 - 70863, n=7) | |
| MSI Titan GT77 12UHS | |
| MSI Titan GT77 12UHS 4k | |
| Razer Blade 17 Early 2022 | |
| Durchschnitt der Klasse Gaming (21842 - 92565, n=225, der letzten 2 Jahre) | |
| Alienware x17 R2 P48E | |
| SCHENKER XMG Ultra 17 Rocket Lake | |
| AIDA64 / Memory Read | |
| Durchschnittliche Intel Core i9-12900HX (62140 - 72930, n=7) | |
| Durchschnitt der Klasse Gaming (24879 - 90647, n=225, der letzten 2 Jahre) | |
| MSI Titan GT77 12UHS 4k | |
| Razer Blade 17 Early 2022 | |
| MSI Titan GT77 12UHS | |
| Alienware x17 R2 P48E | |
| SCHENKER XMG Ultra 17 Rocket Lake | |
| AIDA64 / Memory Write | |
| Durchschnittliche Intel Core i9-12900HX (60001 - 68782, n=7) | |
| Durchschnitt der Klasse Gaming (21619 - 103259, n=225, der letzten 2 Jahre) | |
| MSI Titan GT77 12UHS 4k | |
| MSI Titan GT77 12UHS | |
| Razer Blade 17 Early 2022 | |
| Alienware x17 R2 P48E | |
| SCHENKER XMG Ultra 17 Rocket Lake | |
| AIDA64 / Memory Latency | |
| Alienware x17 R2 P48E | |
| MSI Titan GT77 12UHS 4k | |
| MSI Titan GT77 12UHS | |
| Durchschnittliche Intel Core i9-12900HX (83.9 - 93.4, n=7) | |
| Durchschnitt der Klasse Gaming (59.5 - 152.5, n=222, der letzten 2 Jahre) | |
| SCHENKER XMG Ultra 17 Rocket Lake | |
* ... kleinere Werte sind besser
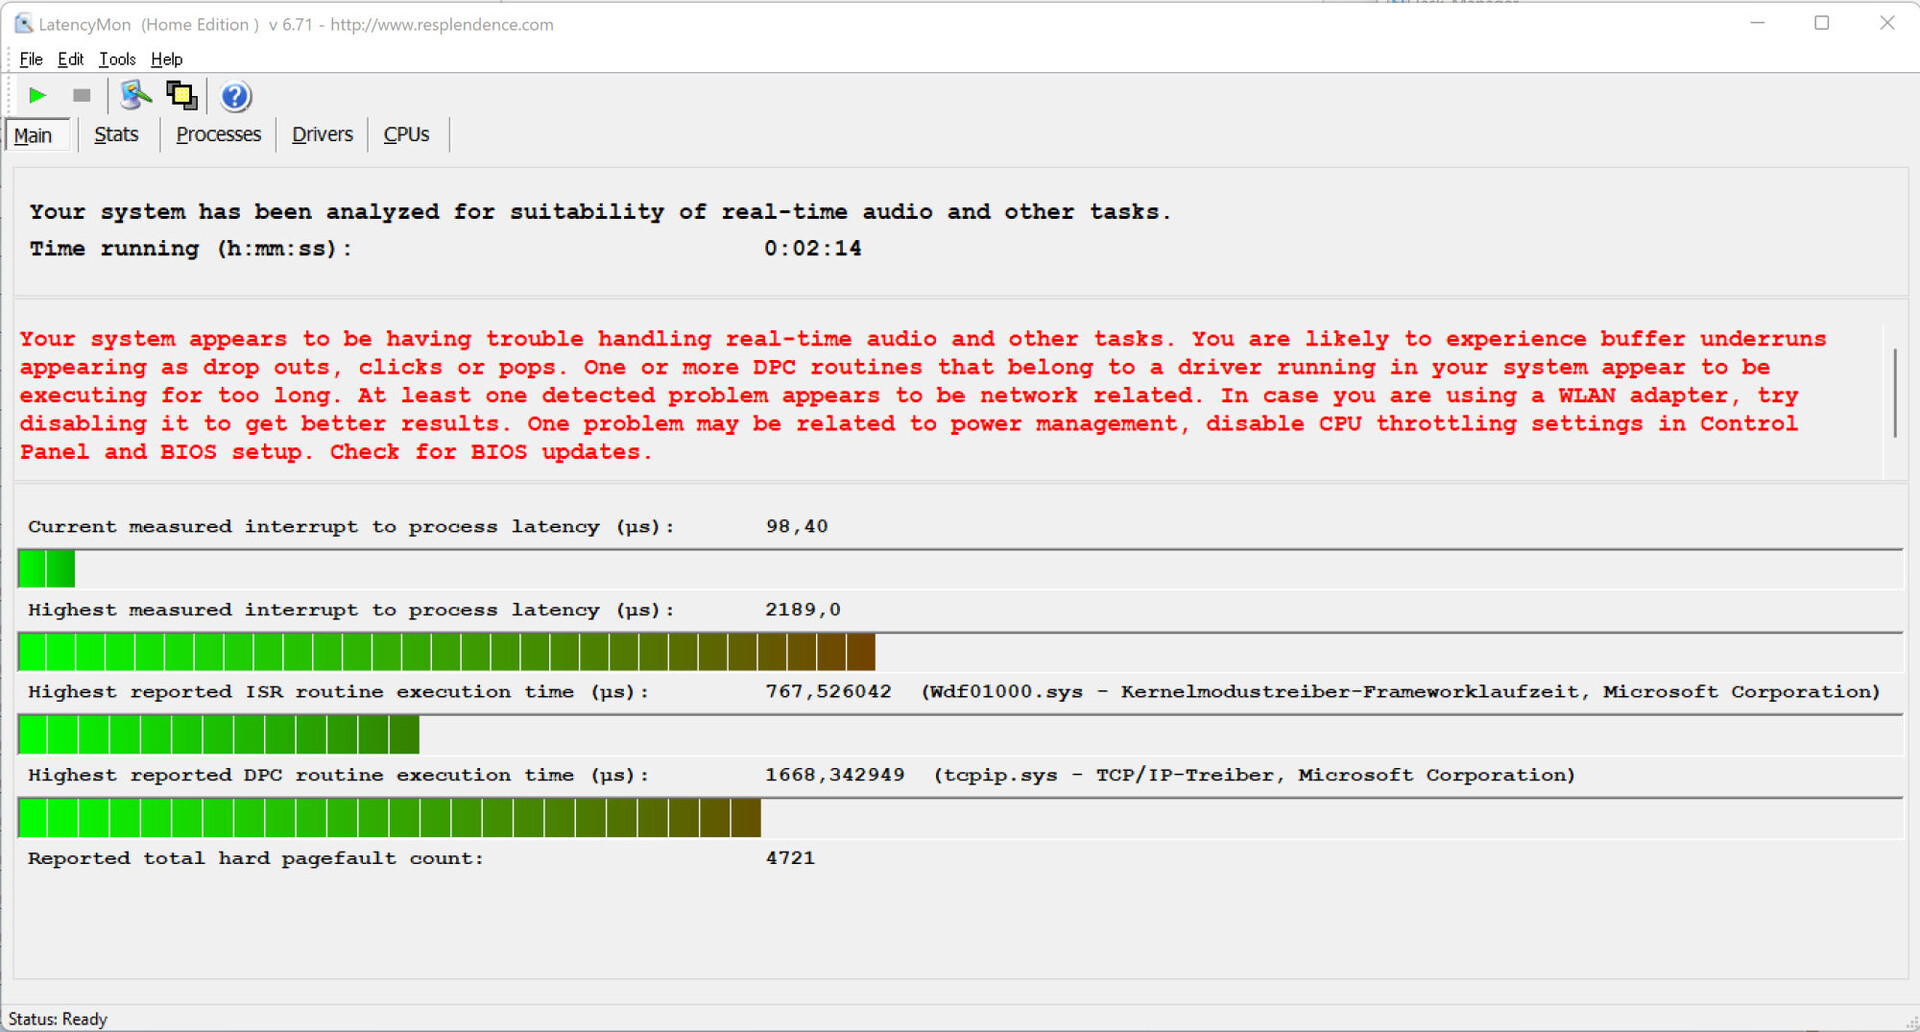
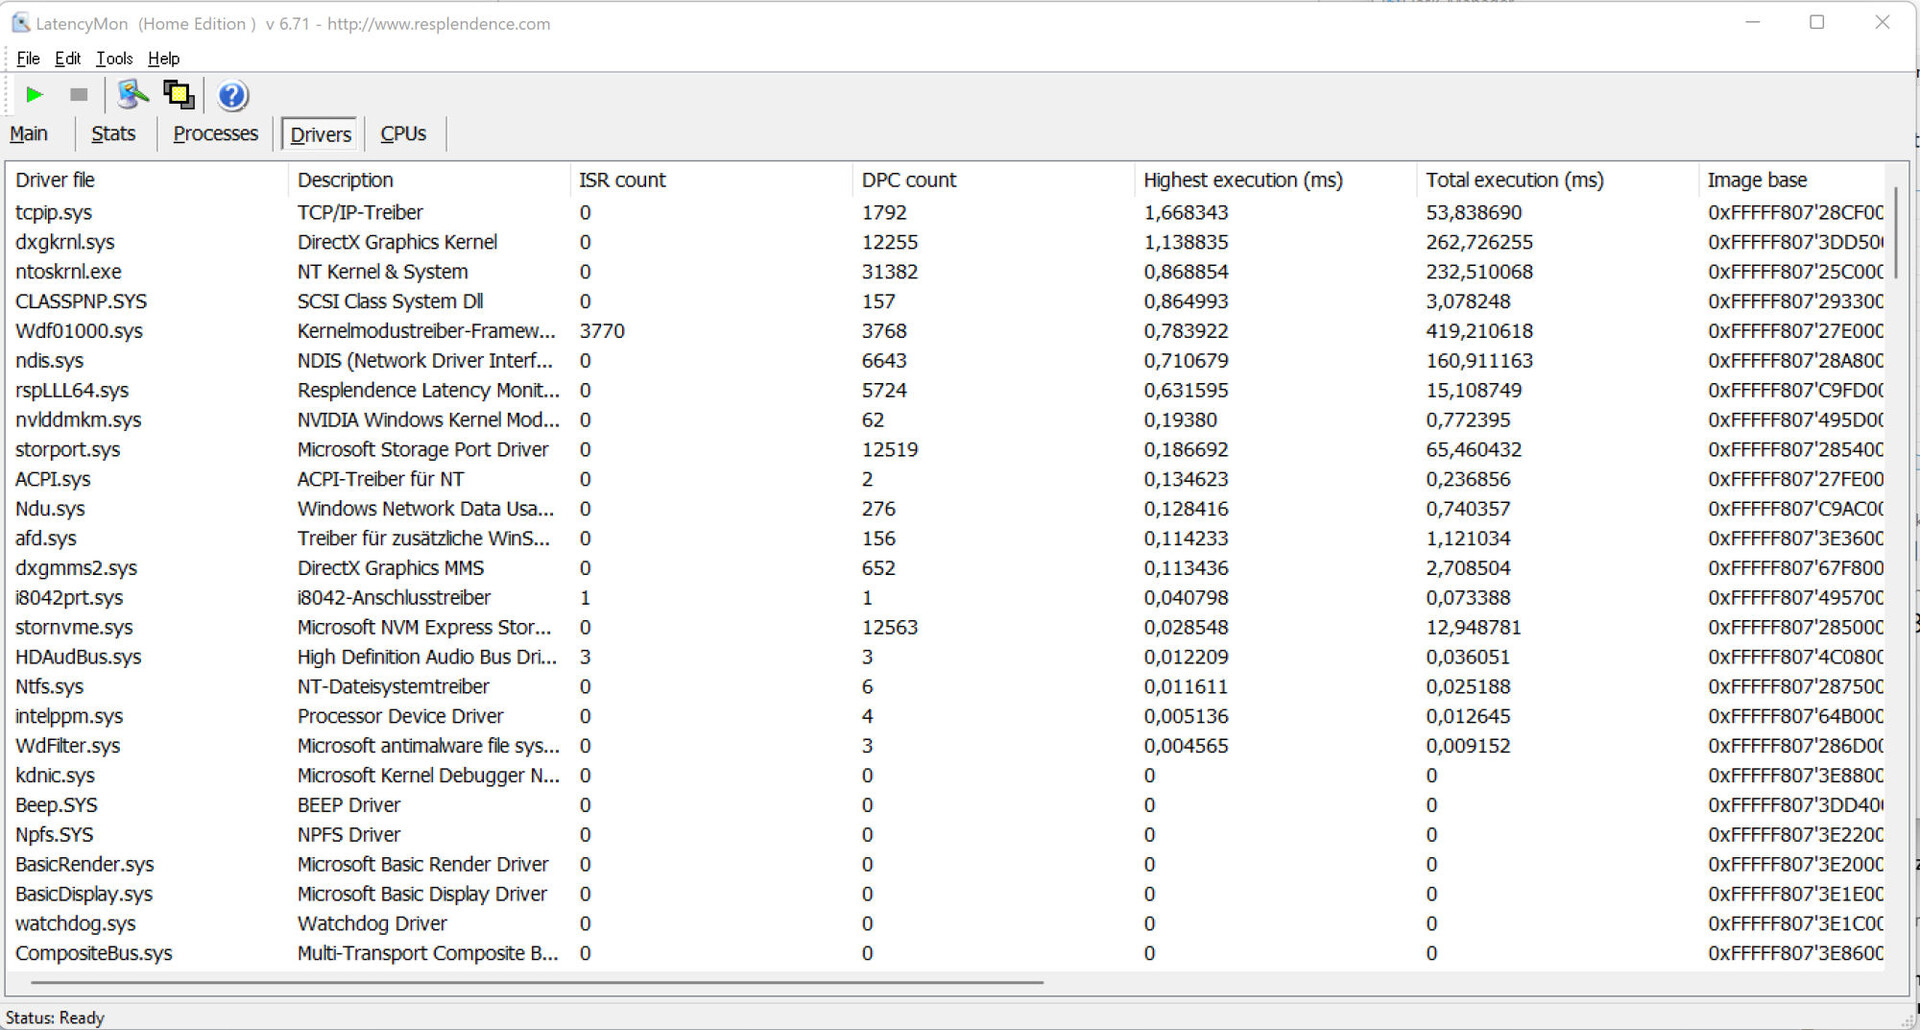
DPC-Latenzen
Der standardisierte Latency-Monitor-Test (Websurfen, 4k-Videowiedergabe, Prime95 High-Load) hat Auffälligkeiten bei den DPC-Latenzen offenbart. Das System scheint nicht für Video- und Audiobearbeitung in Echtzeit geeignet zu sein. Zukünftige Software-Updates könnten zu Verbesserungen oder auch Verschlechterungen führen.
| DPC Latencies / LatencyMon - interrupt to process latency (max), Web, Youtube, Prime95 | |
| MSI Titan GT77 12UHS | |
| MSI Titan GT77 12UHS | |
| MSI Titan GT77 12UHS 4k | |
| Alienware x17 R2 P48E | |
| SCHENKER XMG Ultra 17 Rocket Lake | |
| Razer Blade 17 Early 2022 | |
* ... kleinere Werte sind besser
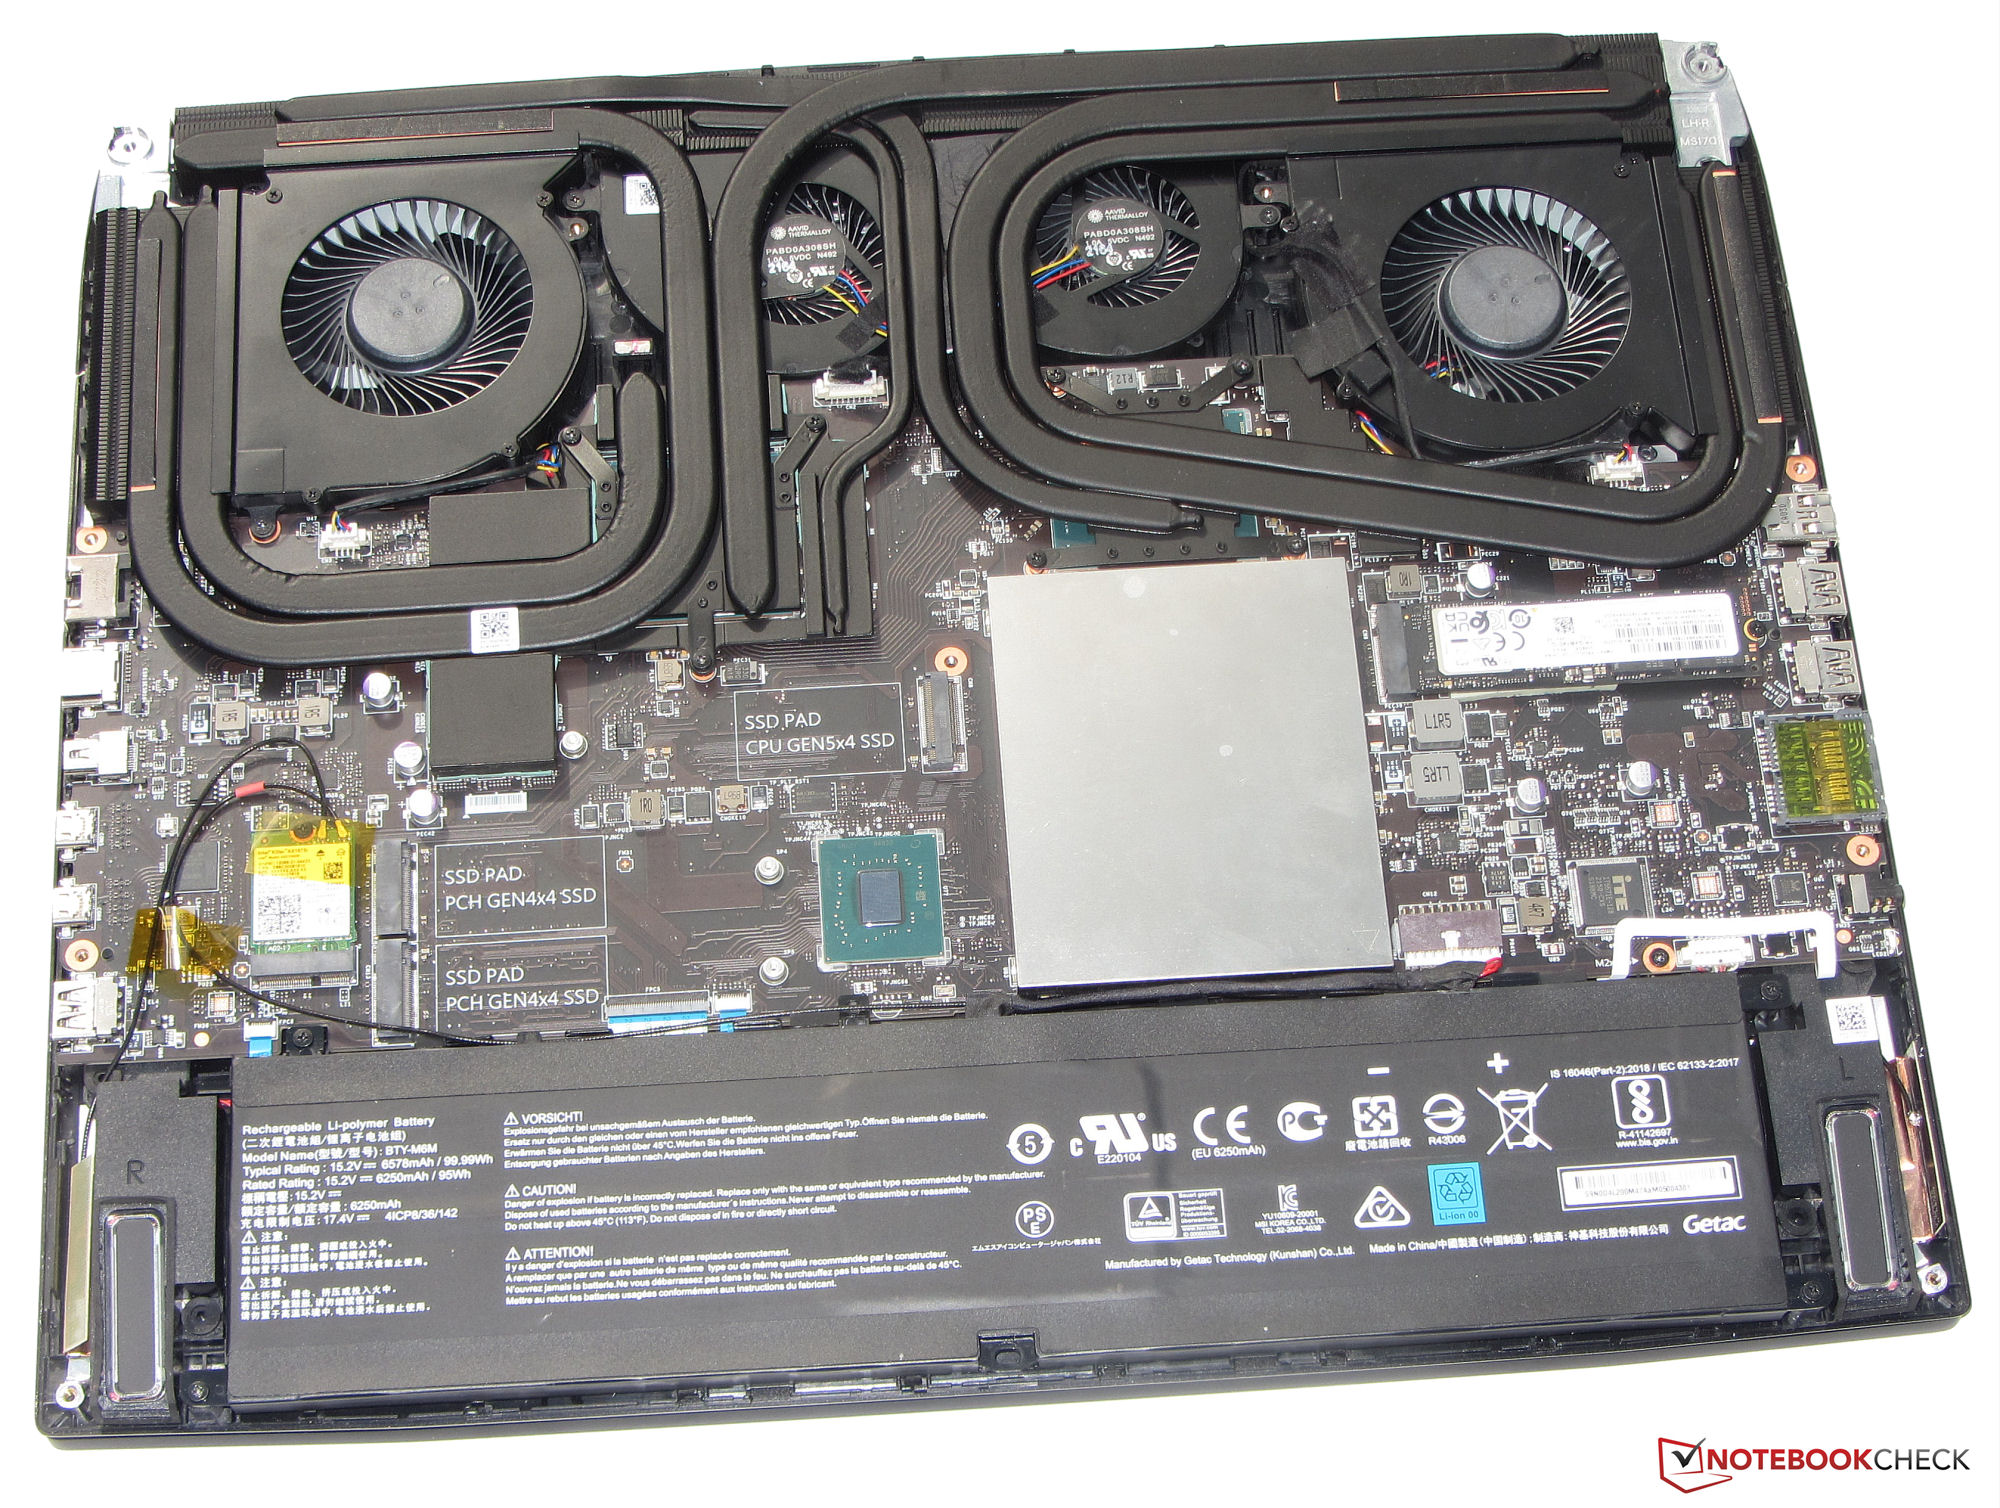
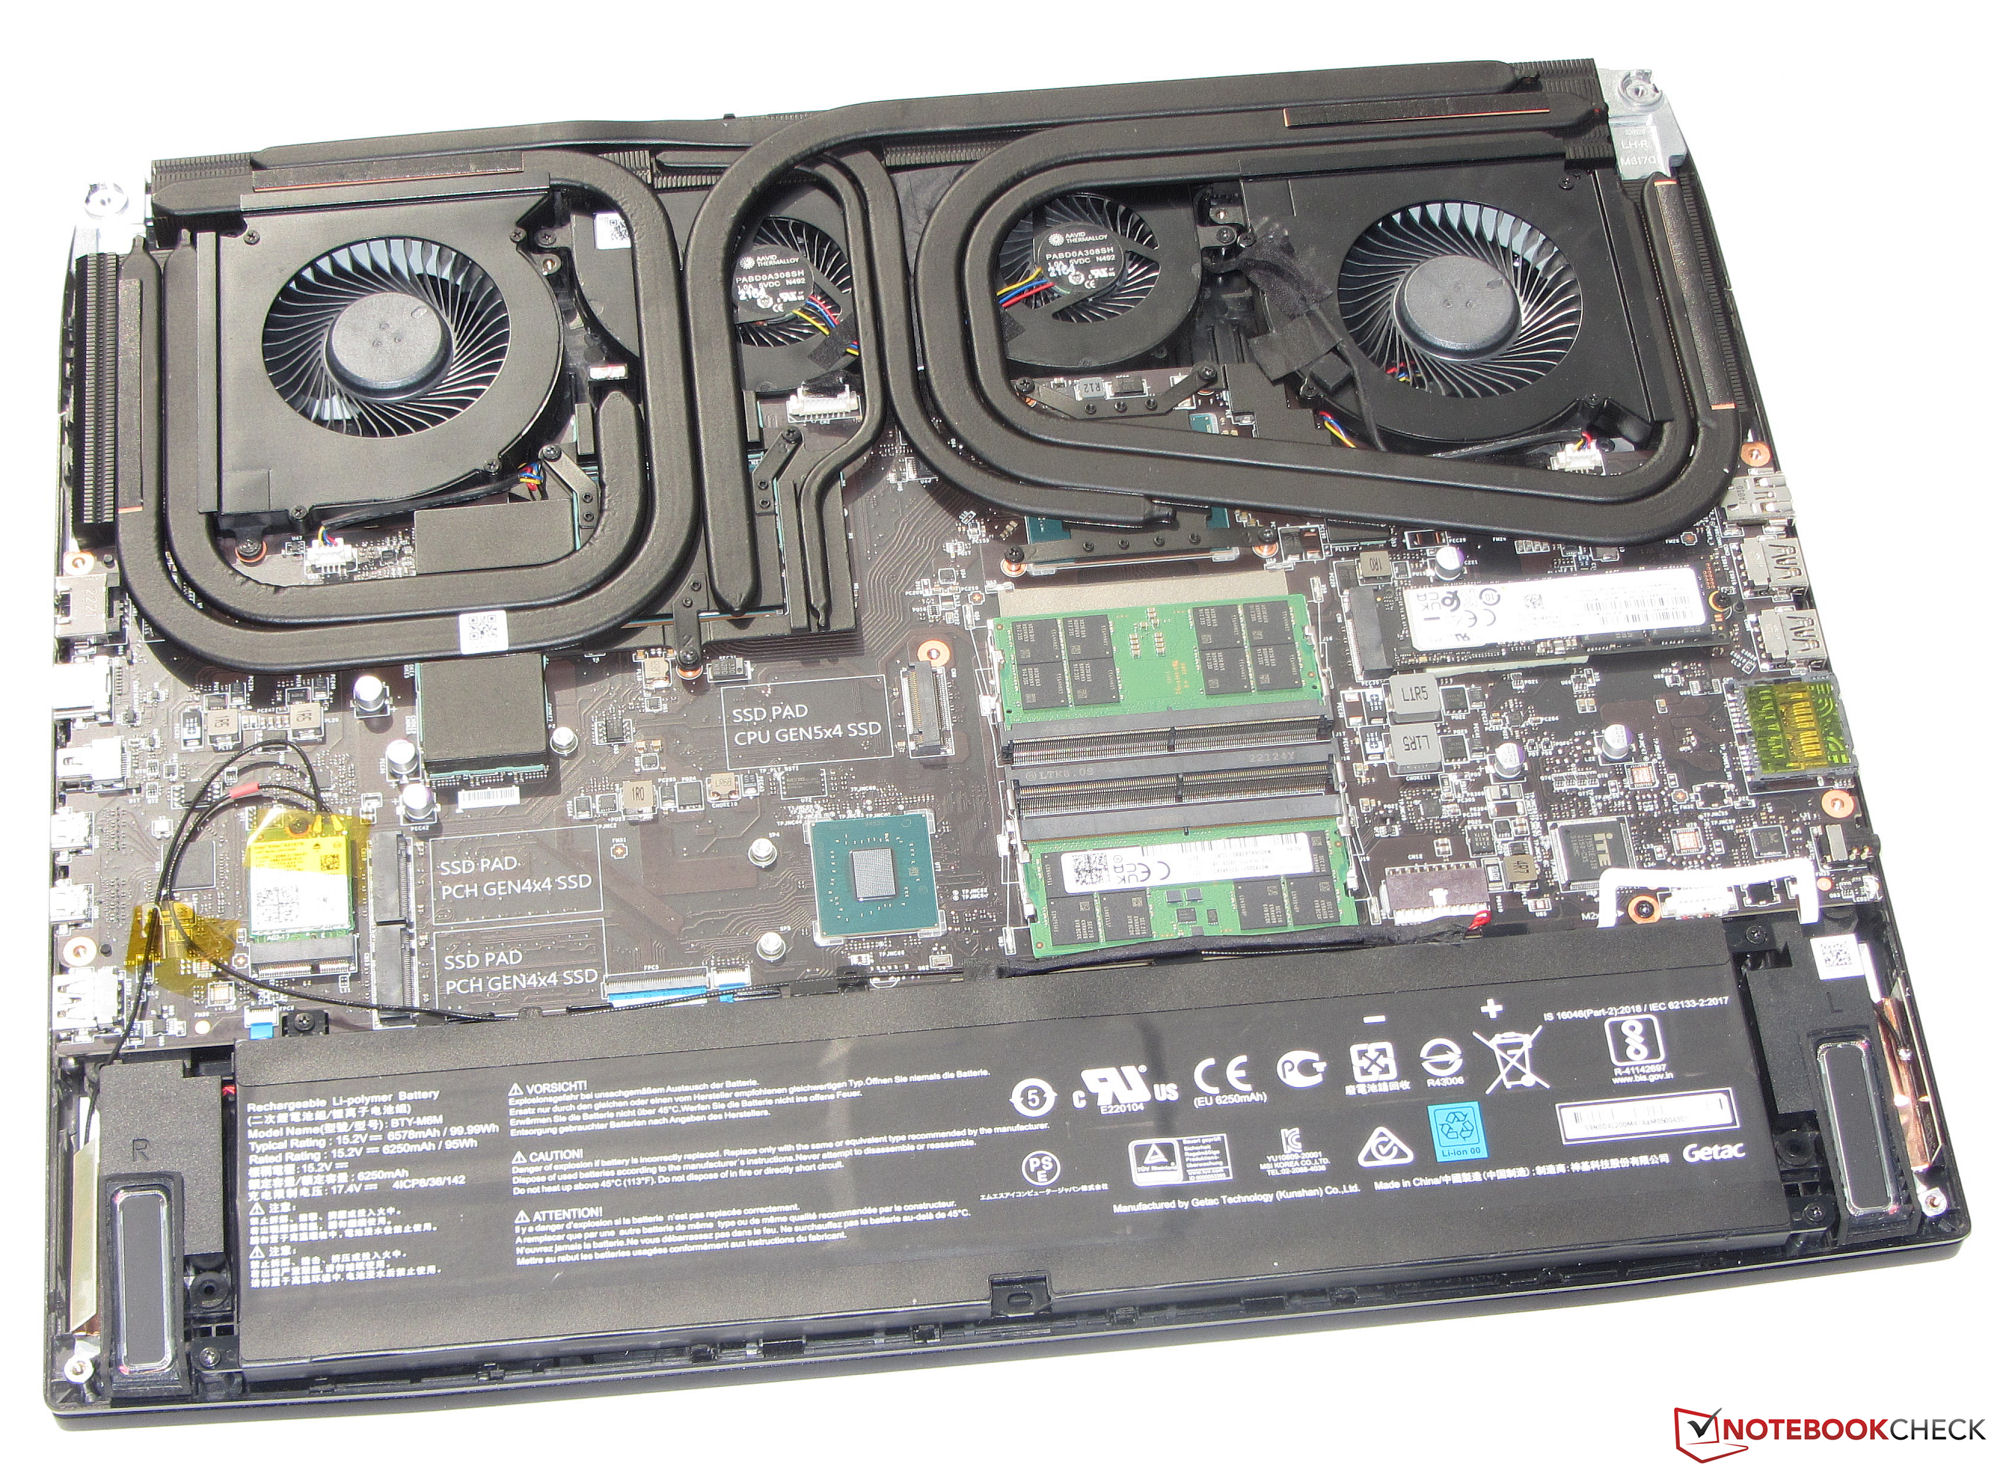
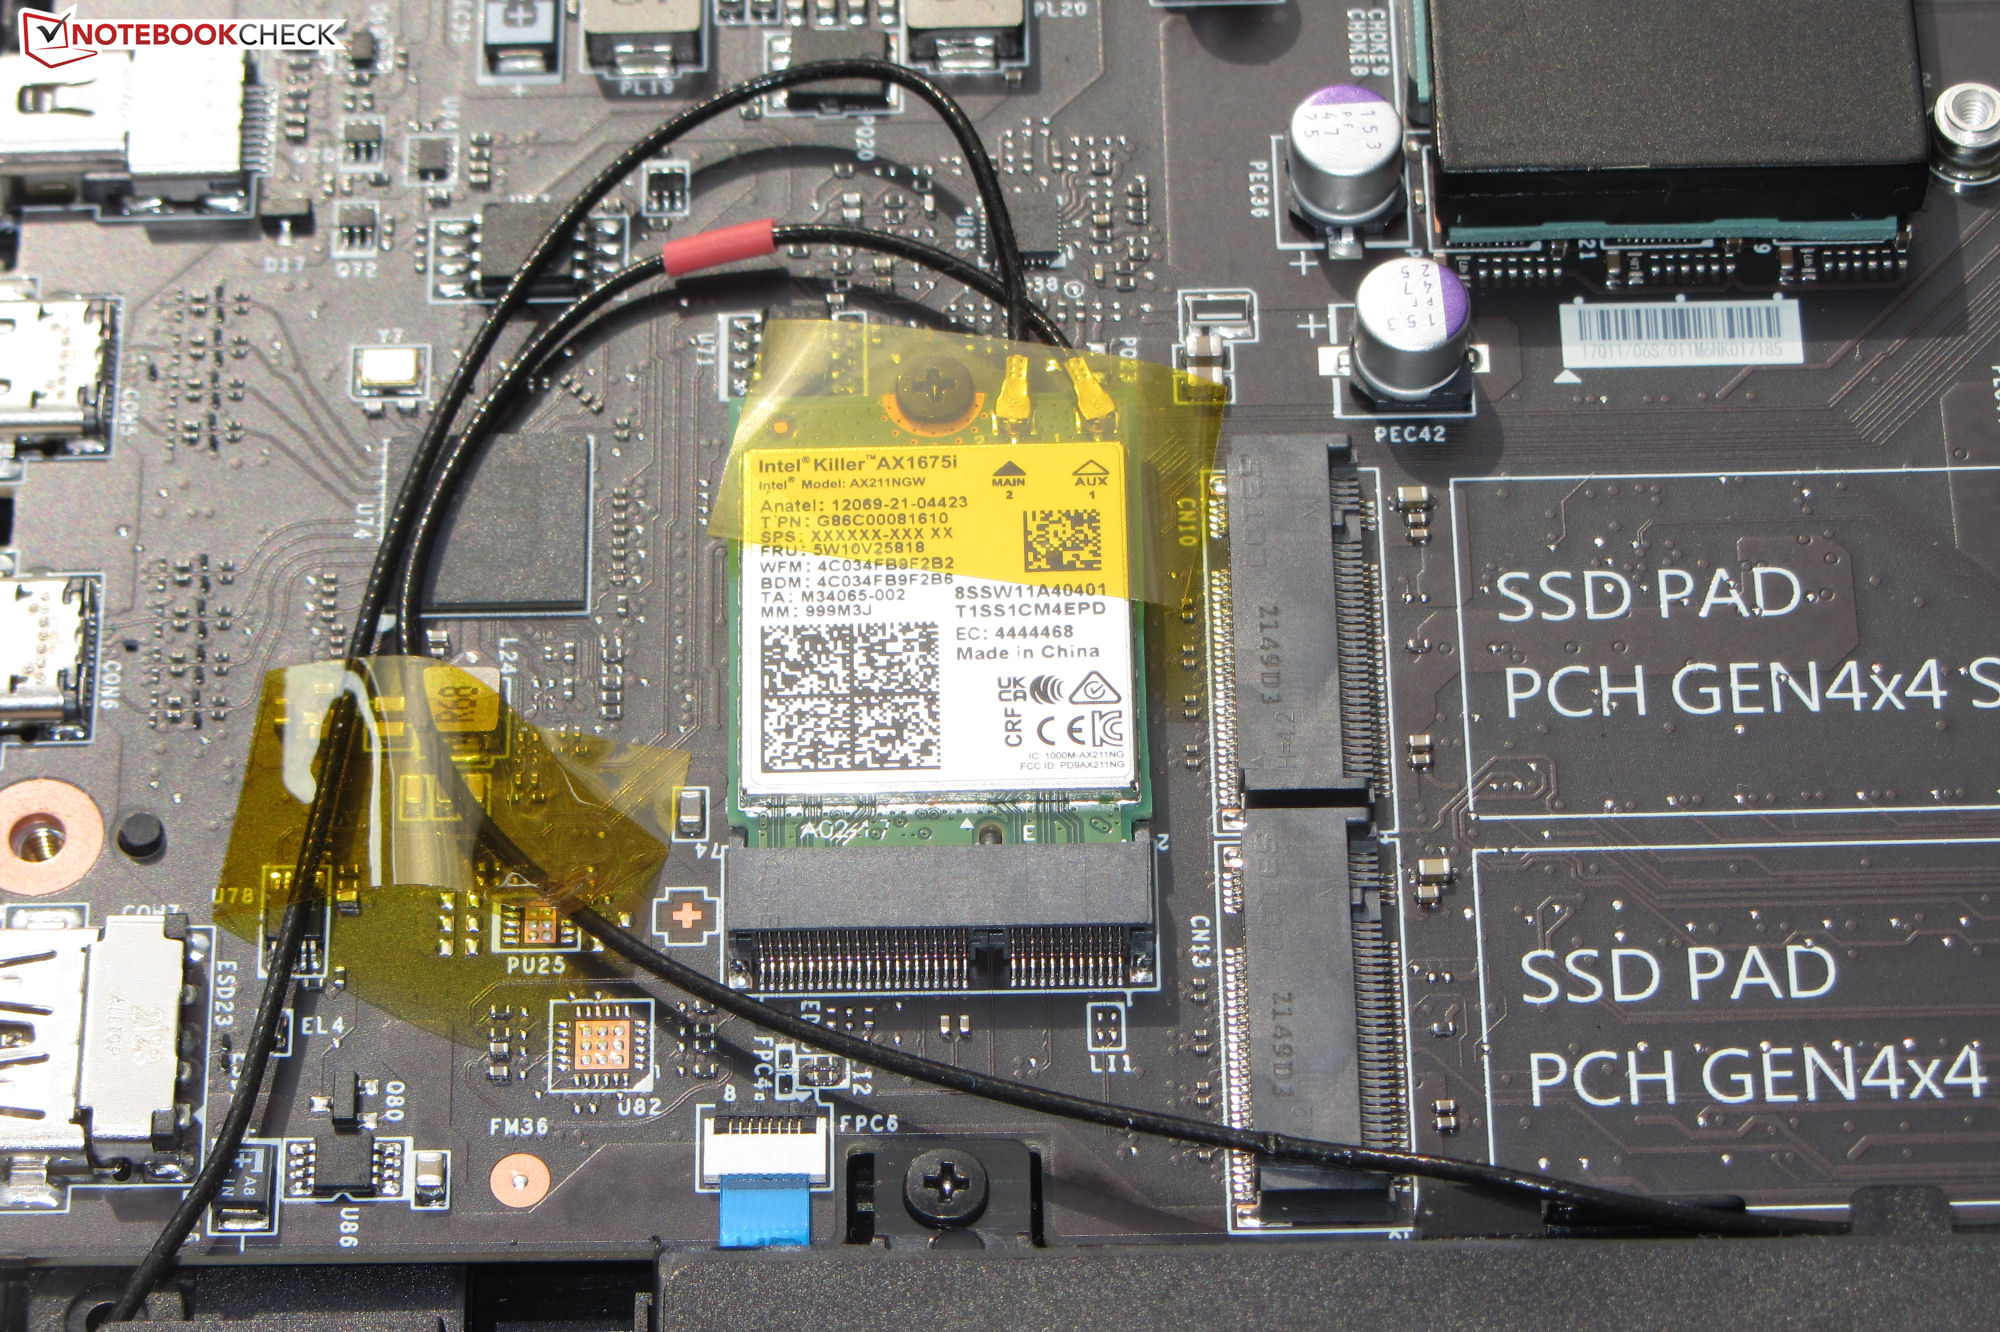
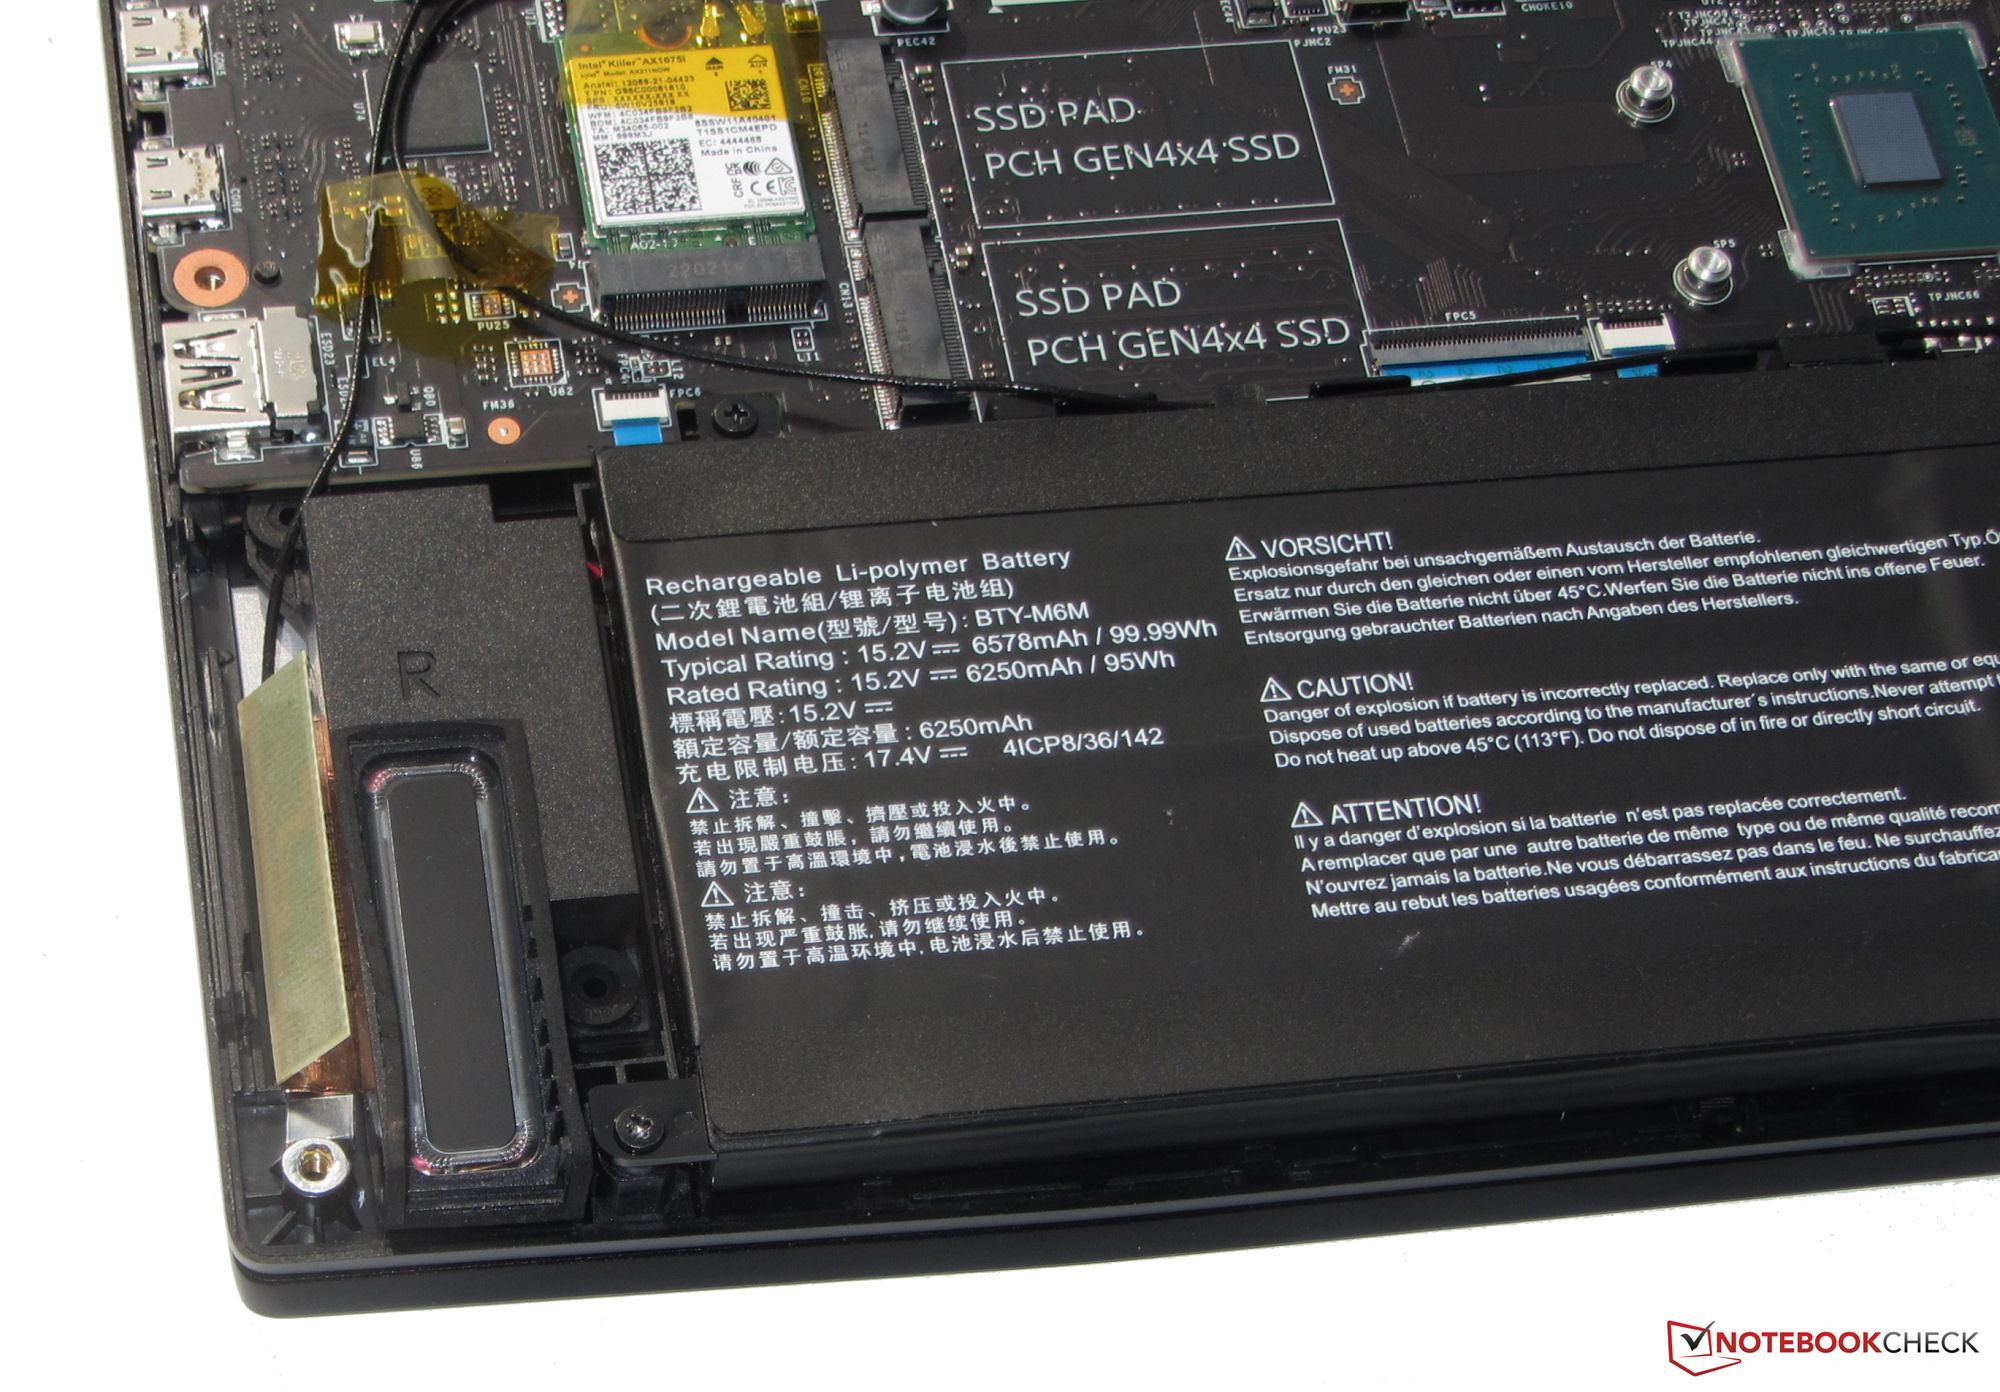
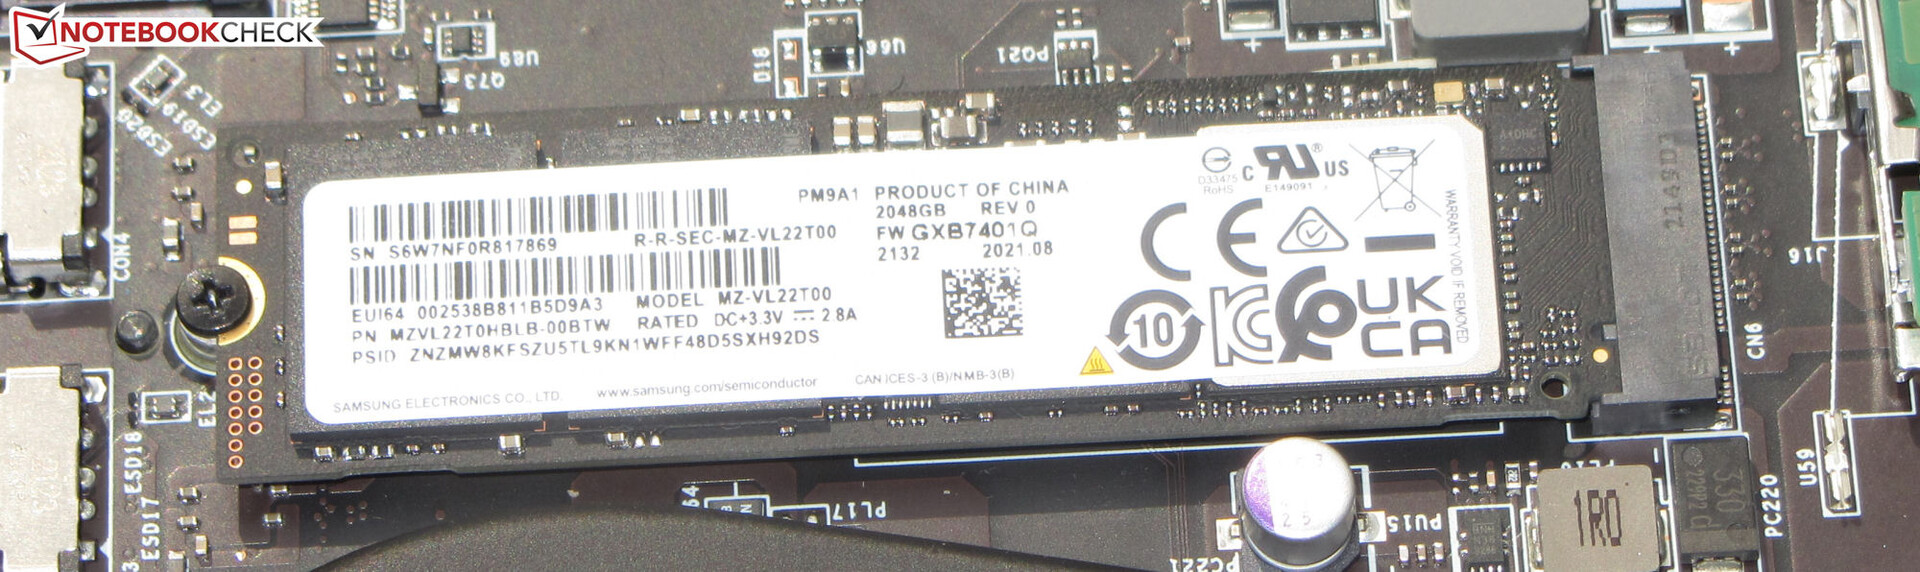
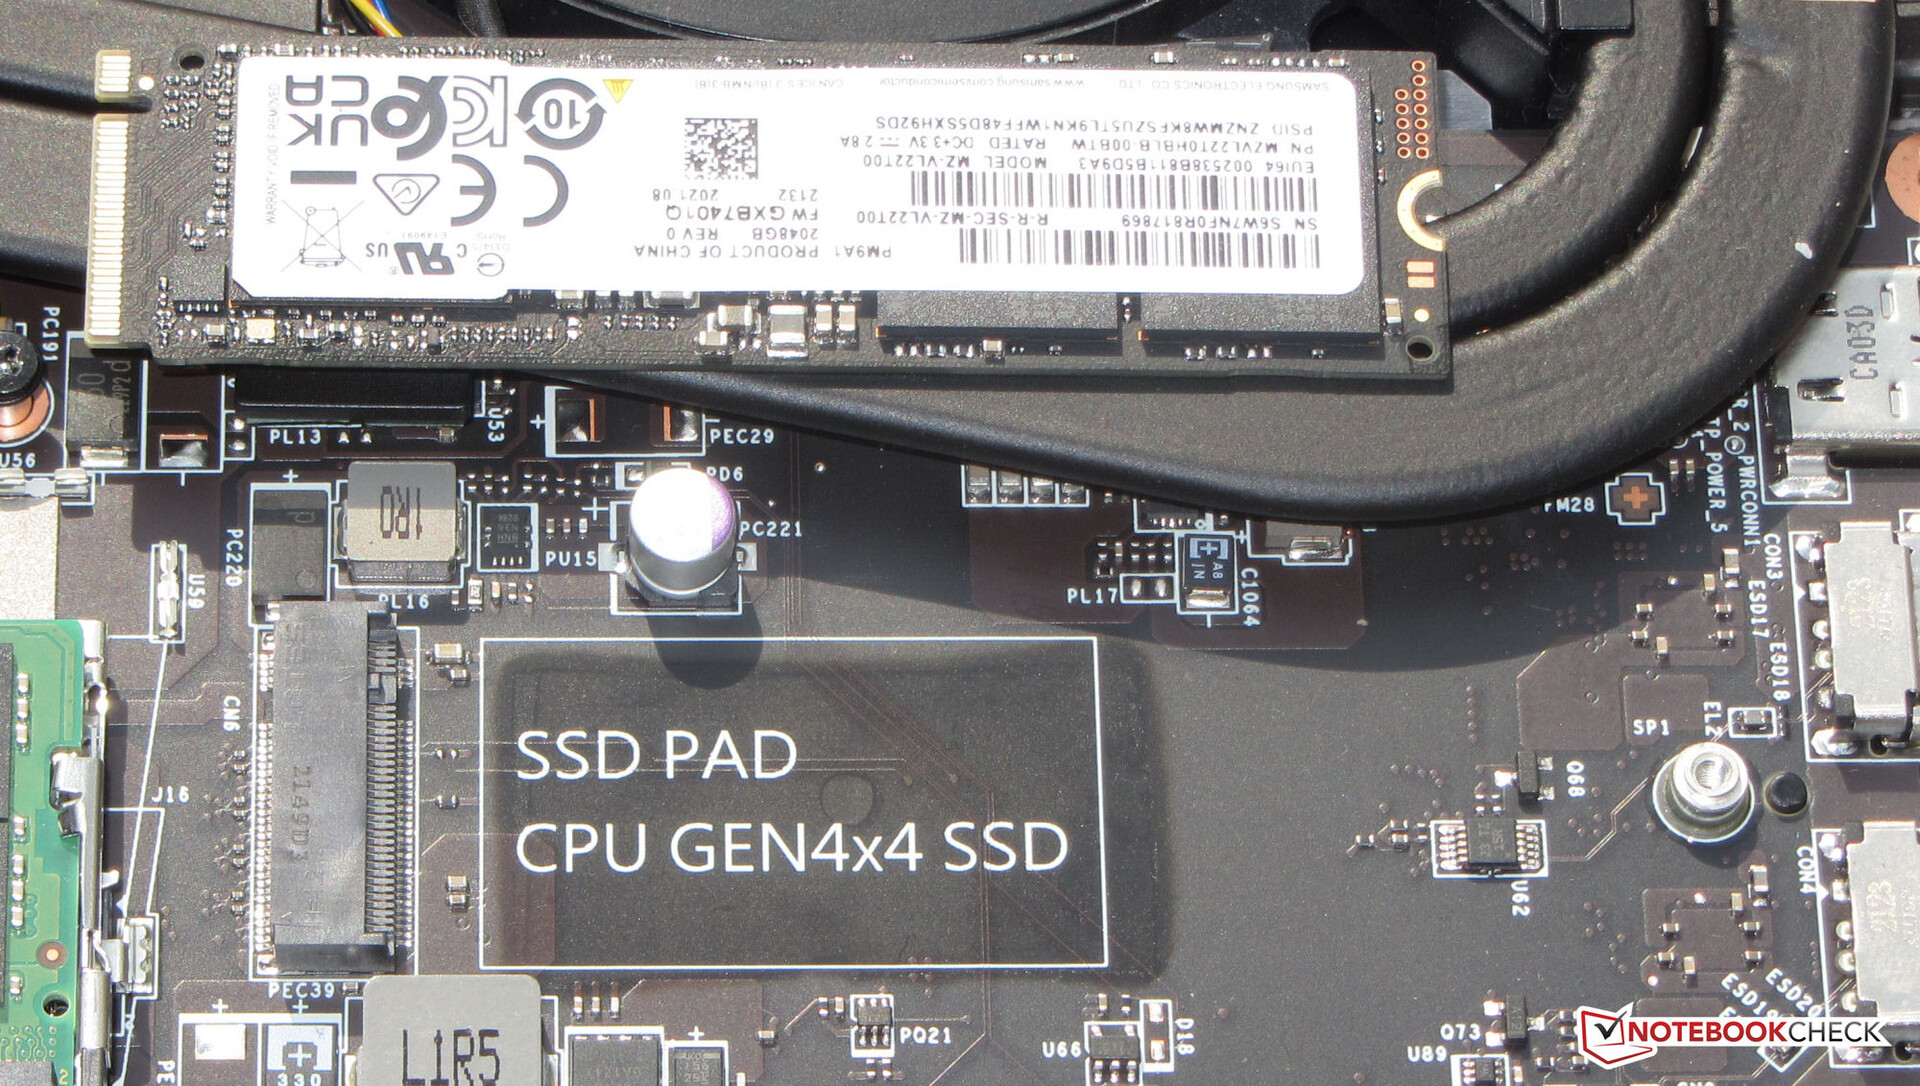
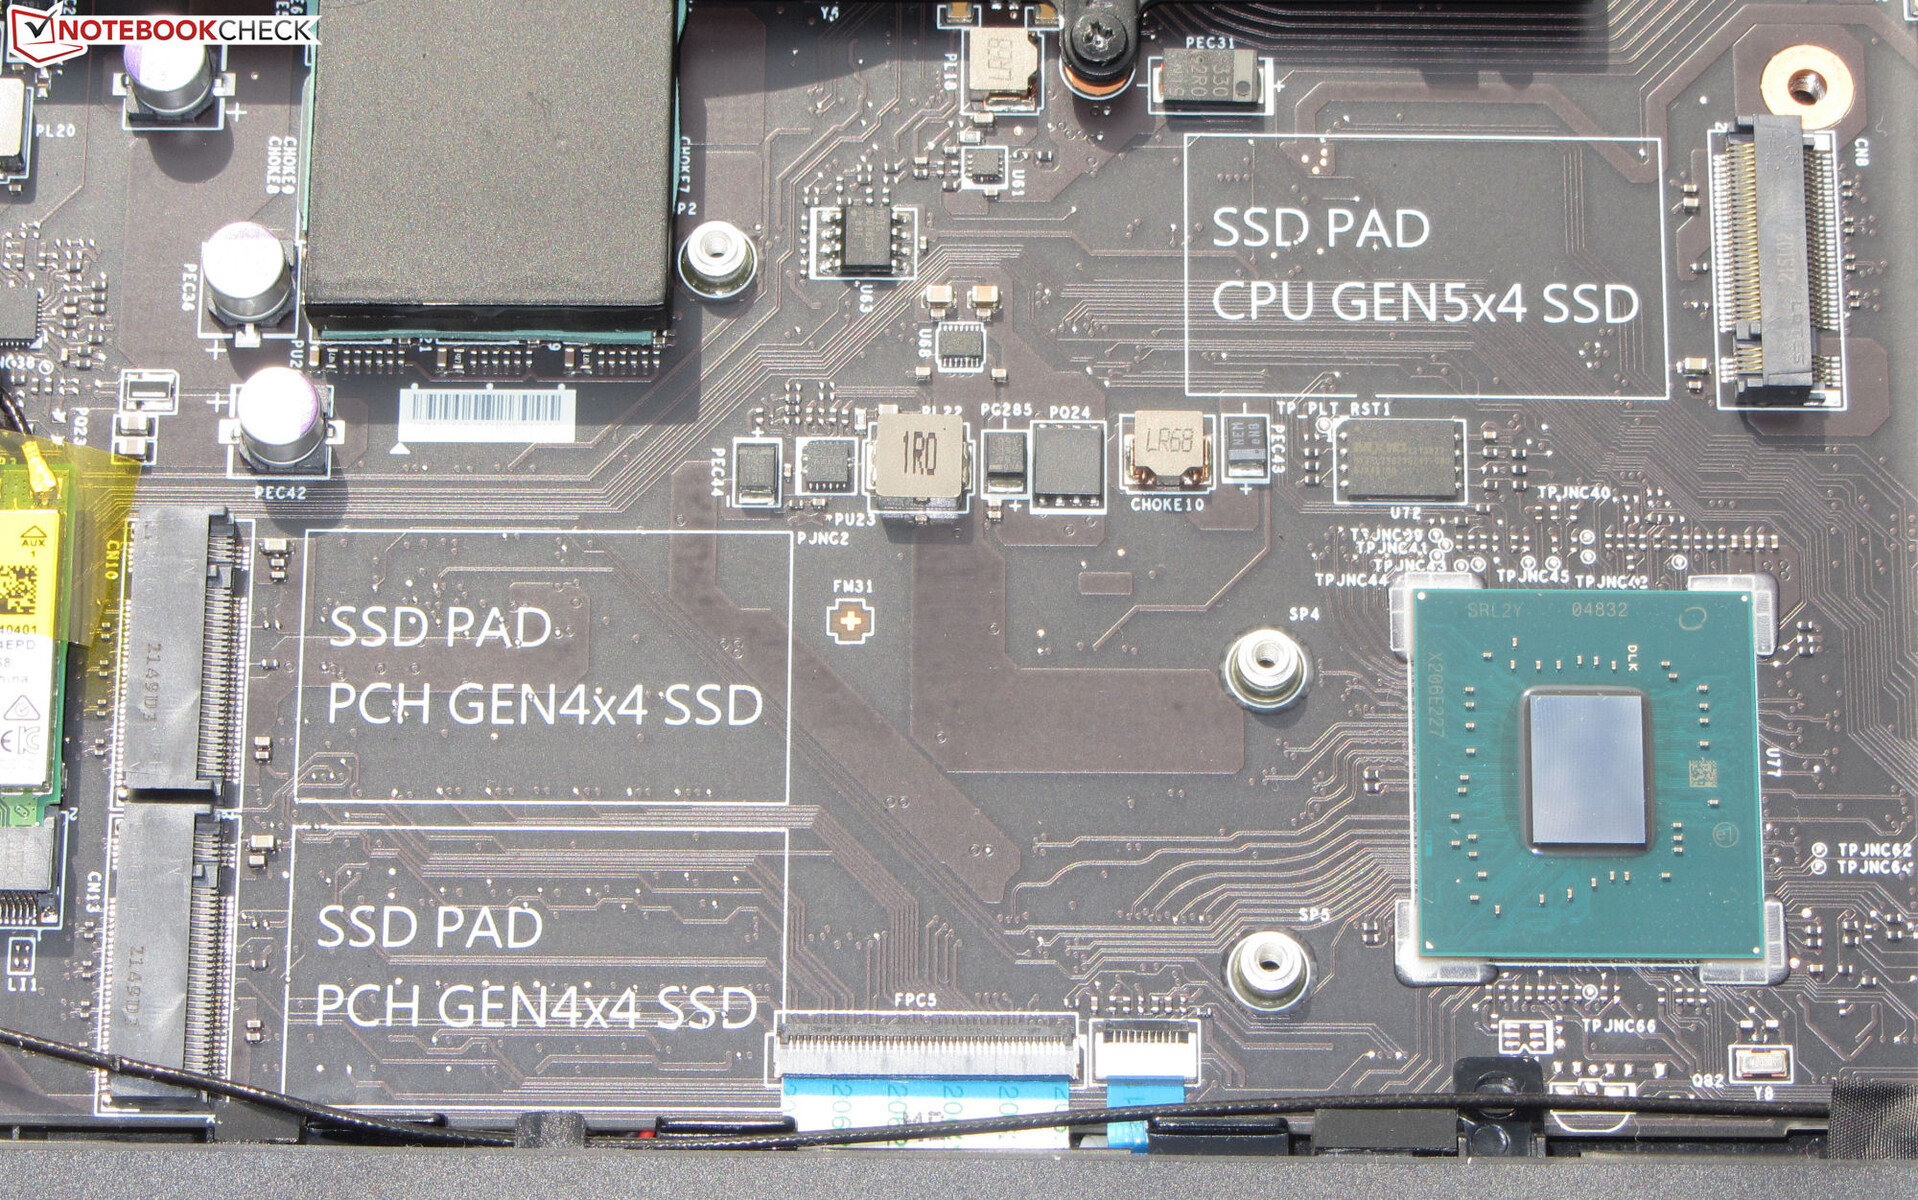
Massenspeicher
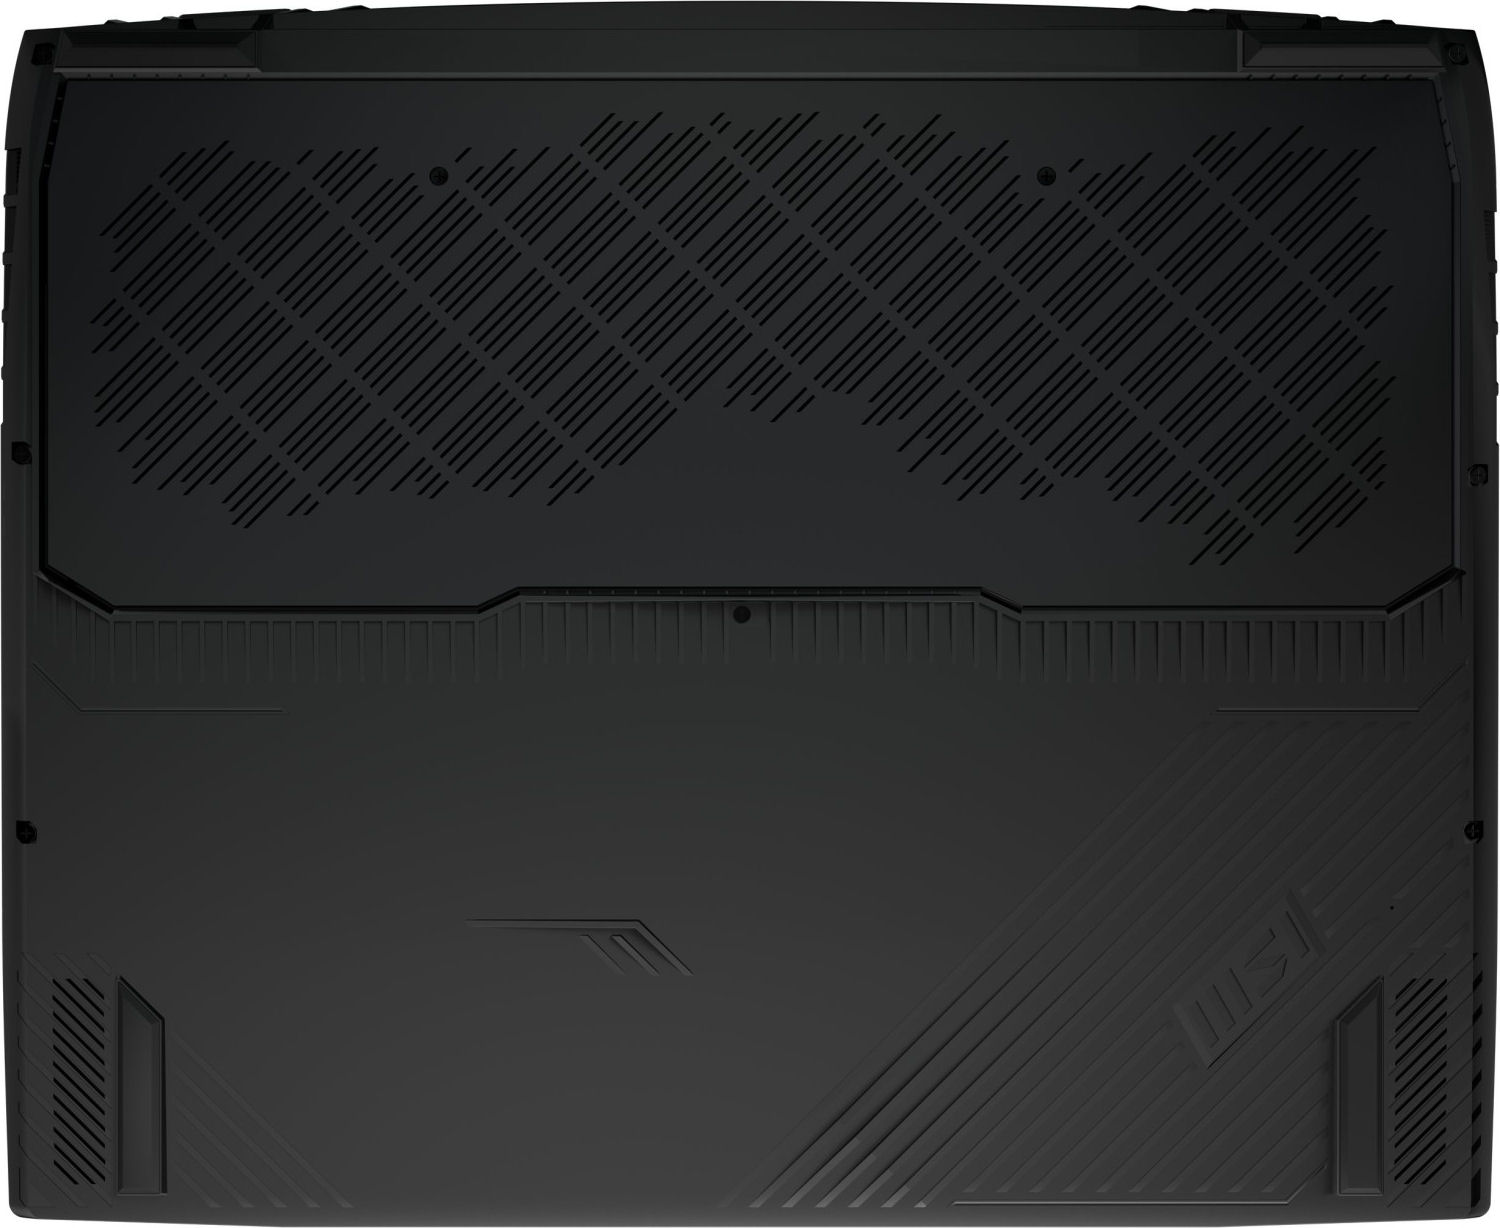
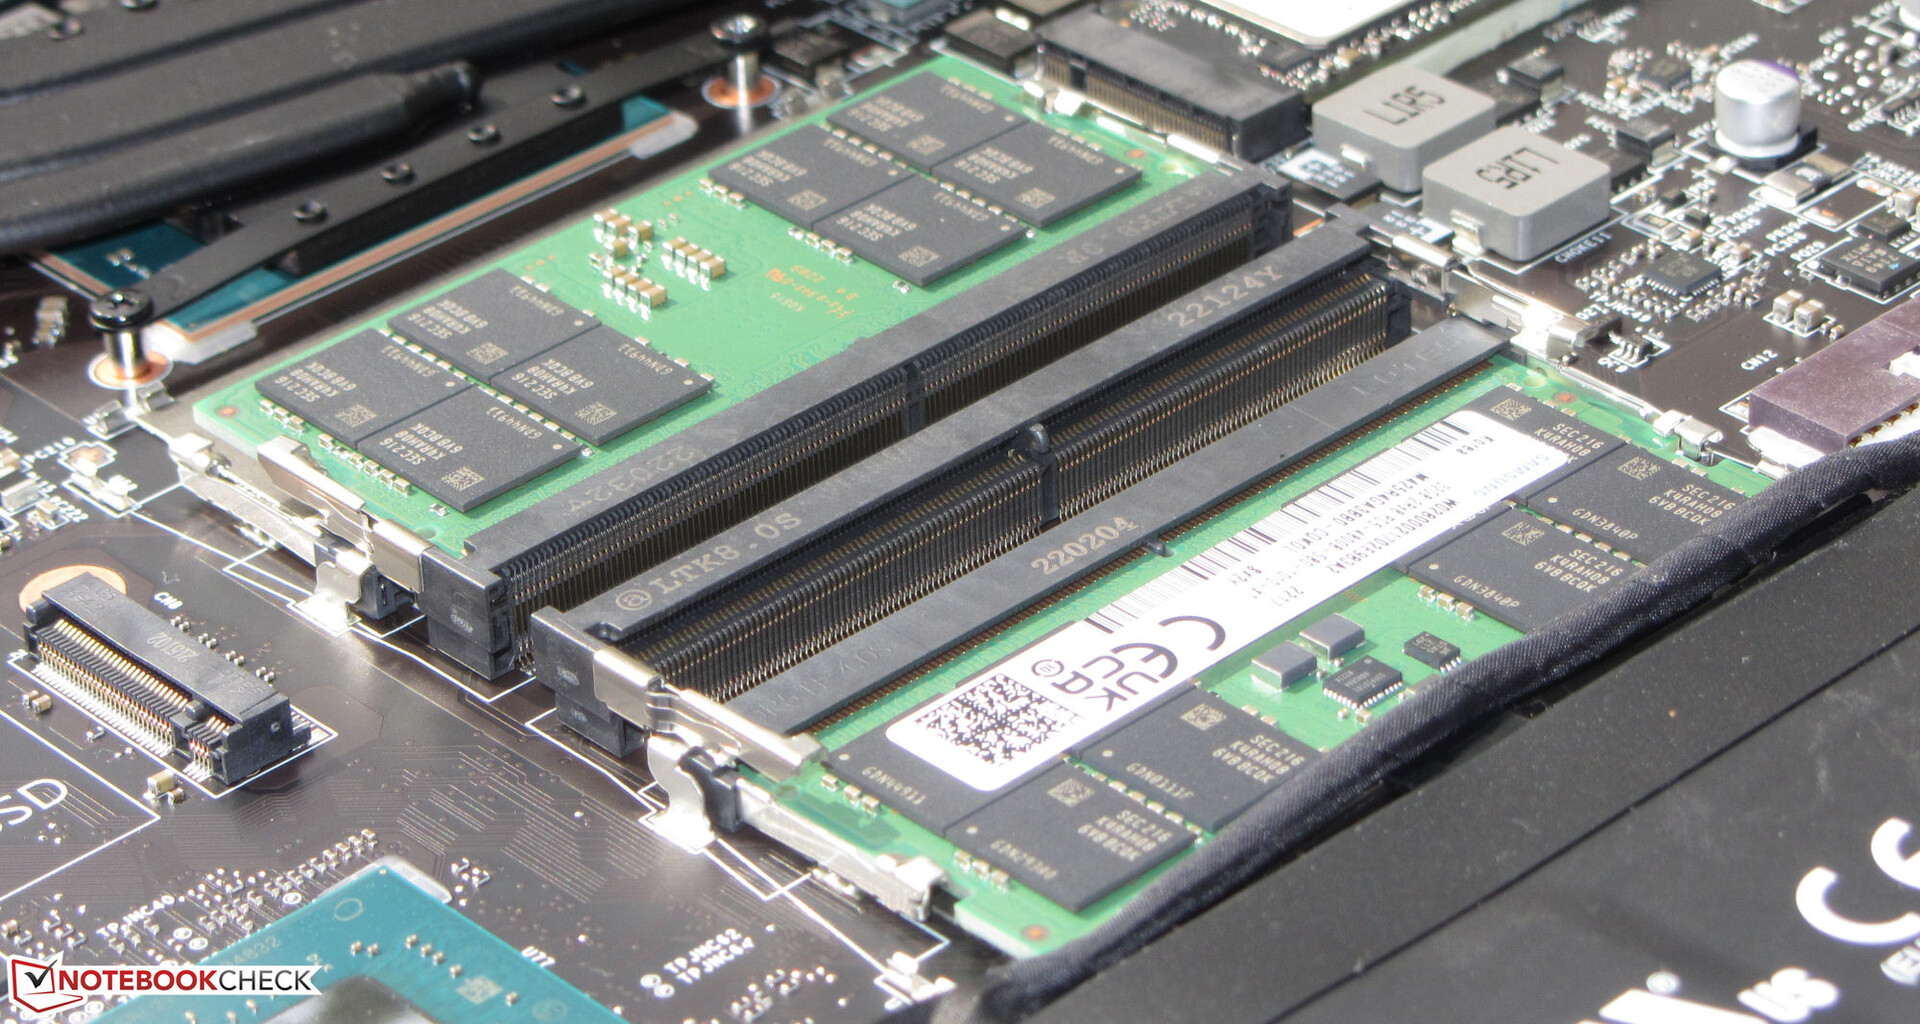
Ganze vier M.2-2280-SSDs (3x PCIe 4, 1x PCIe 5) kann das Titan aufnehmen. Die verbaute 2-TB-SSD (PCIe 4) der Firma Samsung wartet mit hervorragenden Transferraten auf.
Die System-SSD (ebenfalls von Samsung) des FHD-Schwestermodells leidet unter Leistungseinbrüchen aufgrund thermischer Drosselung. Eventuell behindern die übrigen drei verbauten SSDs einen optimalen Luftfluss. Die SSD unseres aktuellen Testgeräts zeigt keine Leistungseinbrüche.

* ... kleinere Werte sind besser
Dauerleistung Lesen: DiskSpd Read Loop, Queue Depth 8
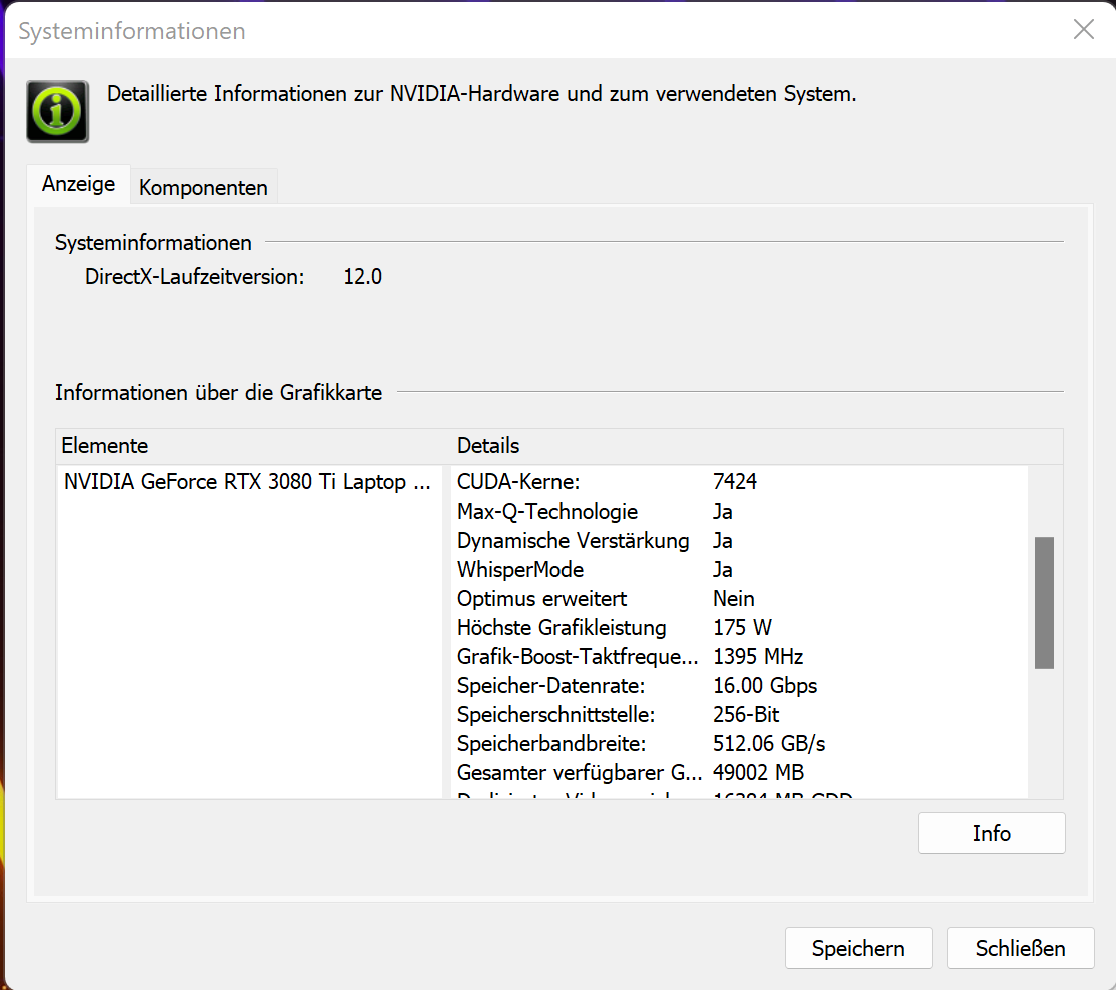
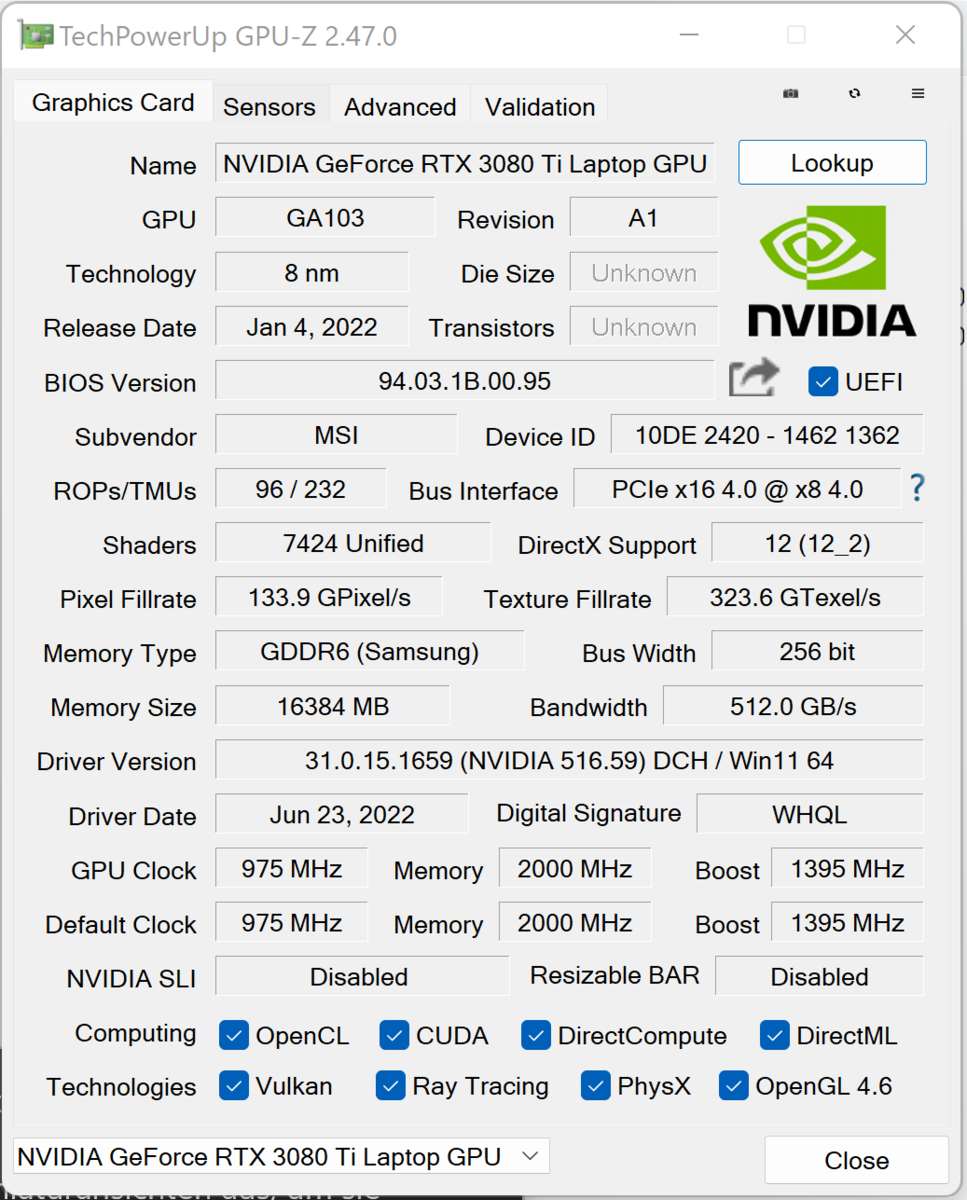
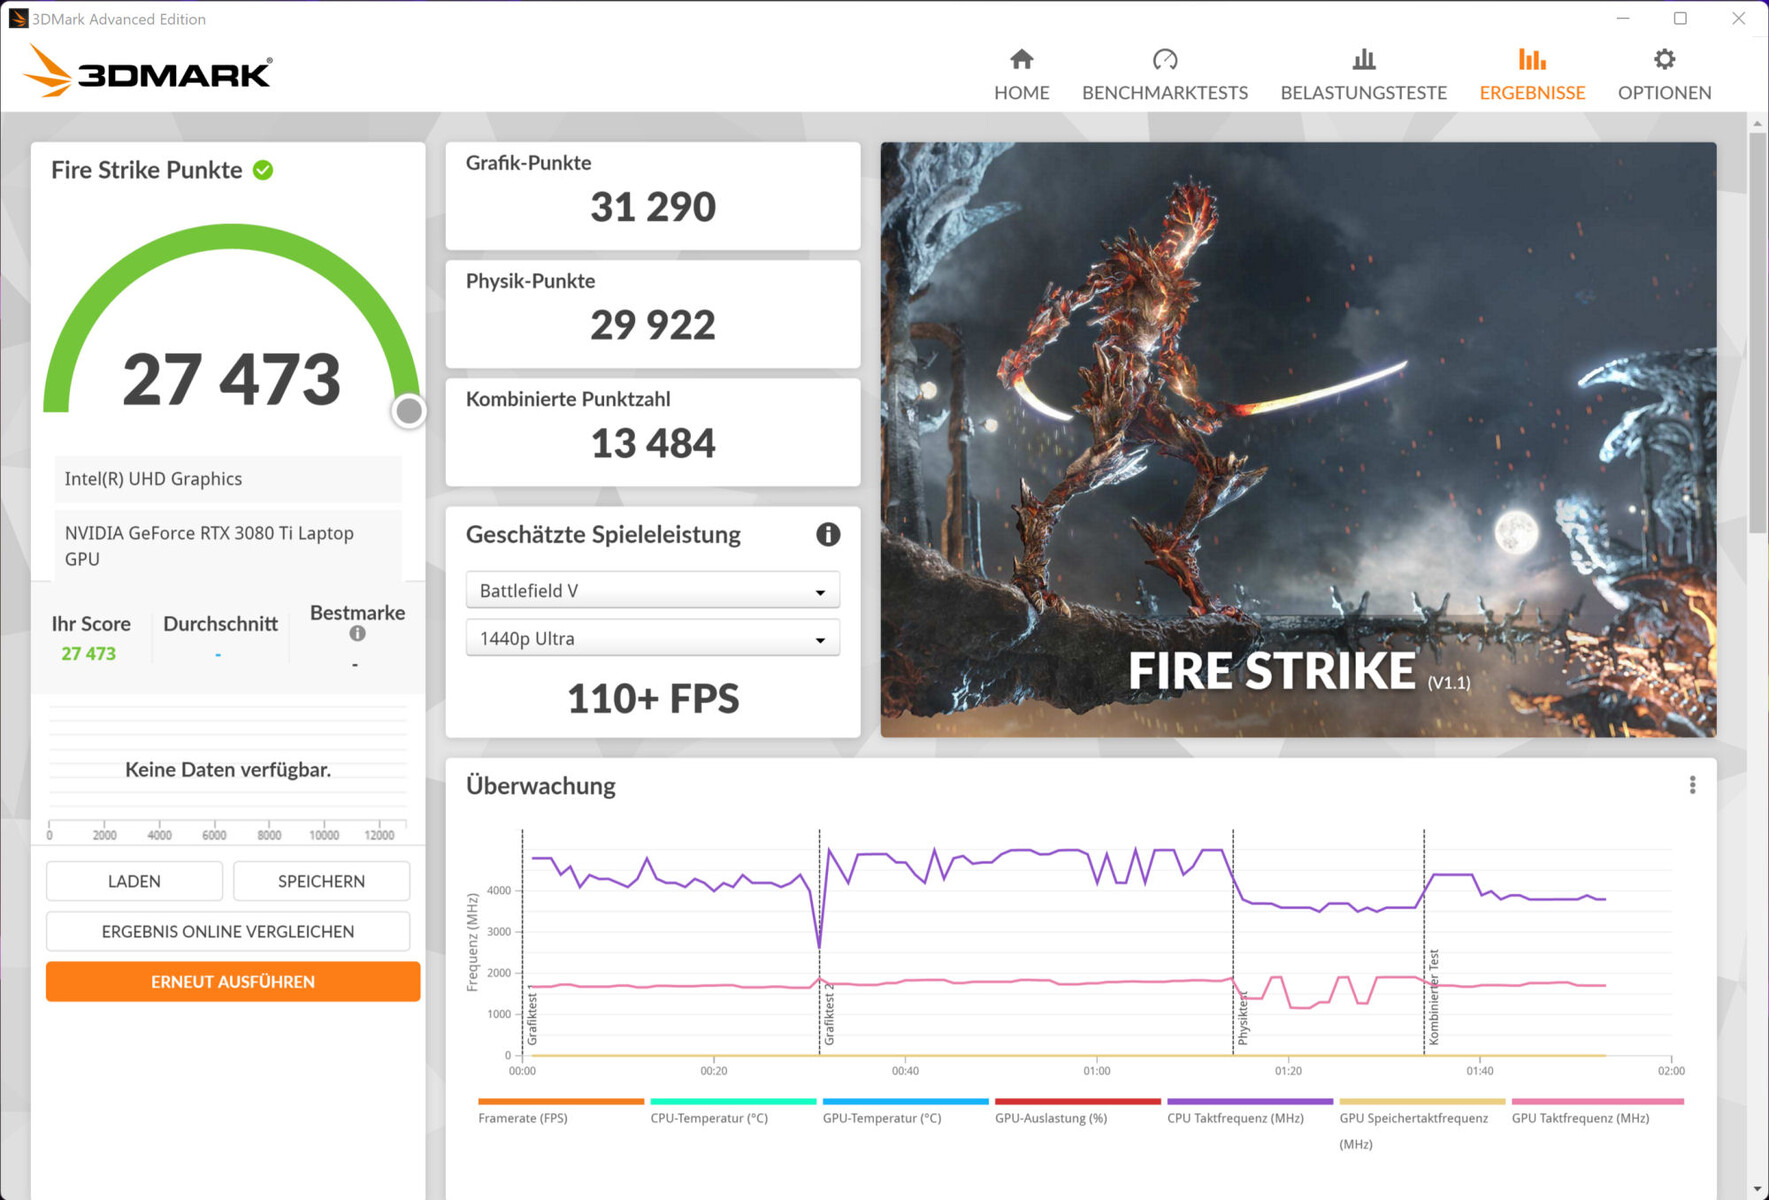
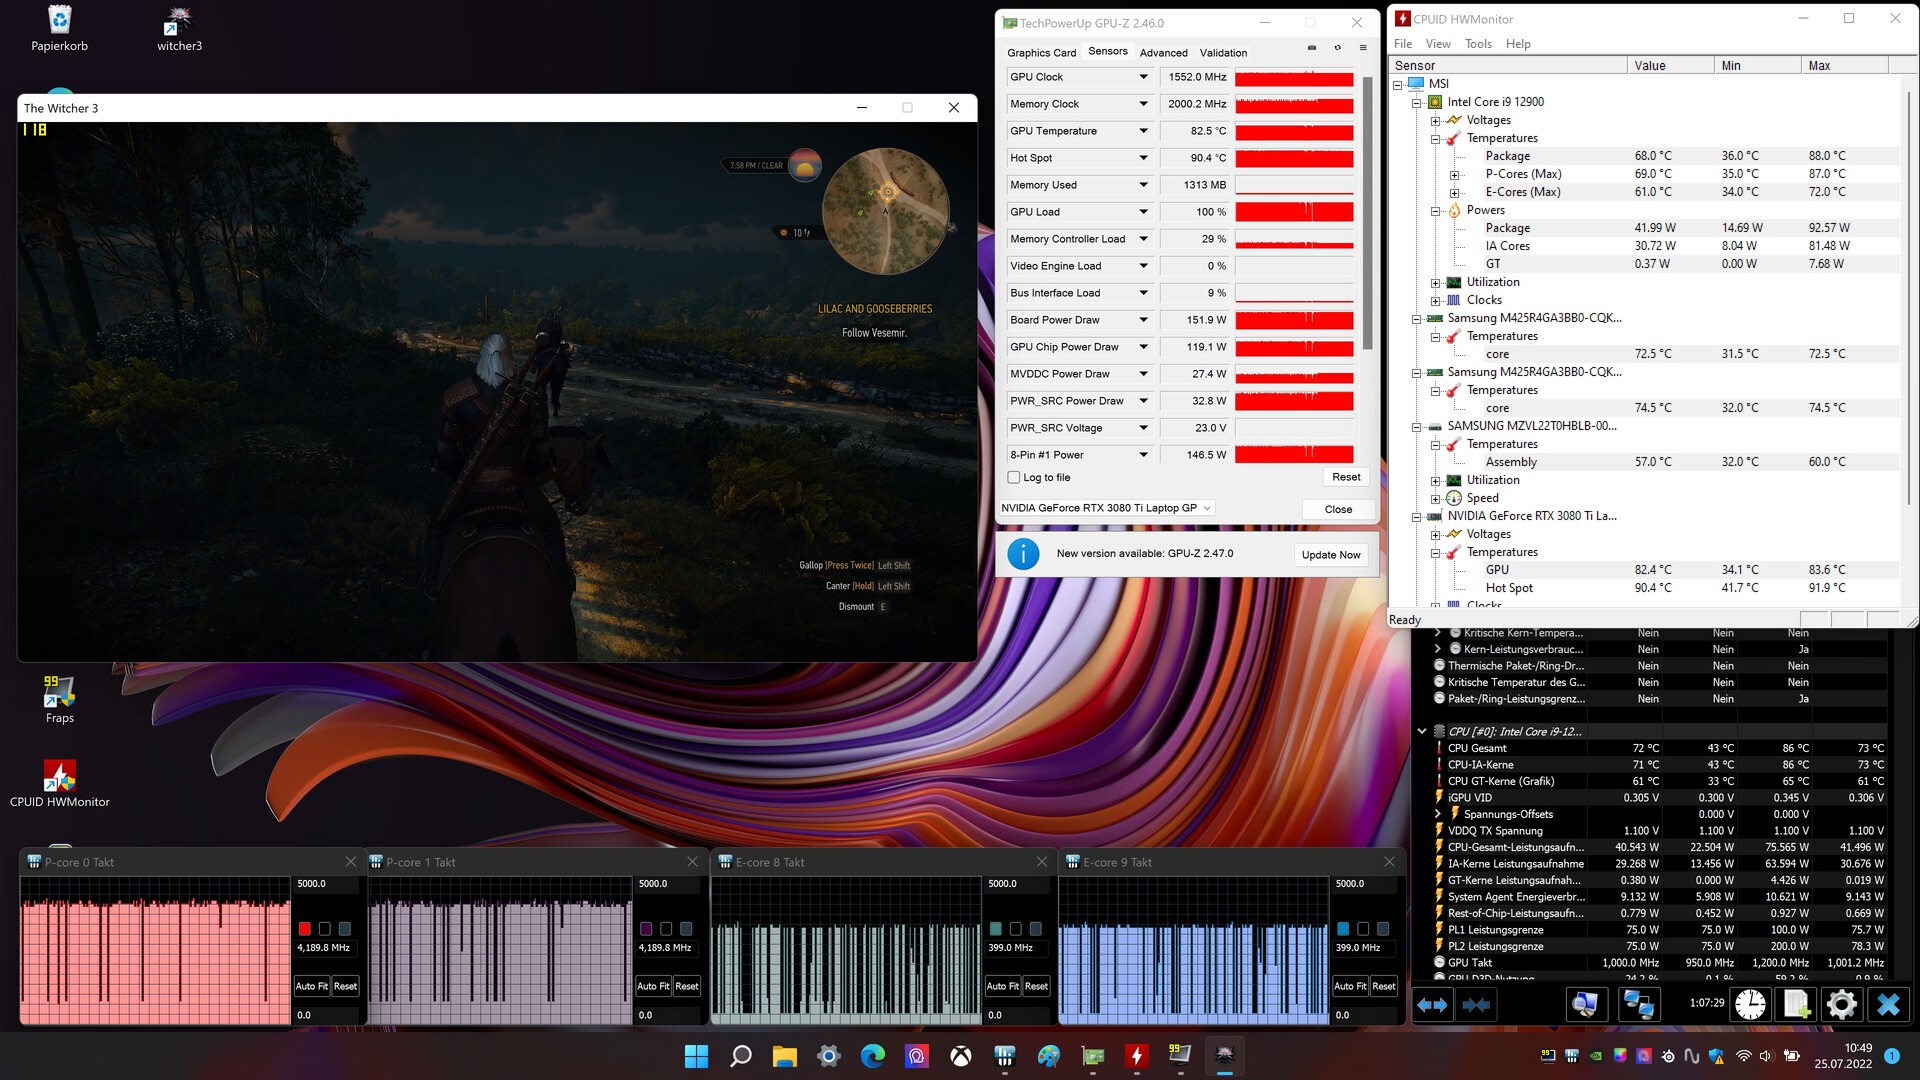
Grafikkarte
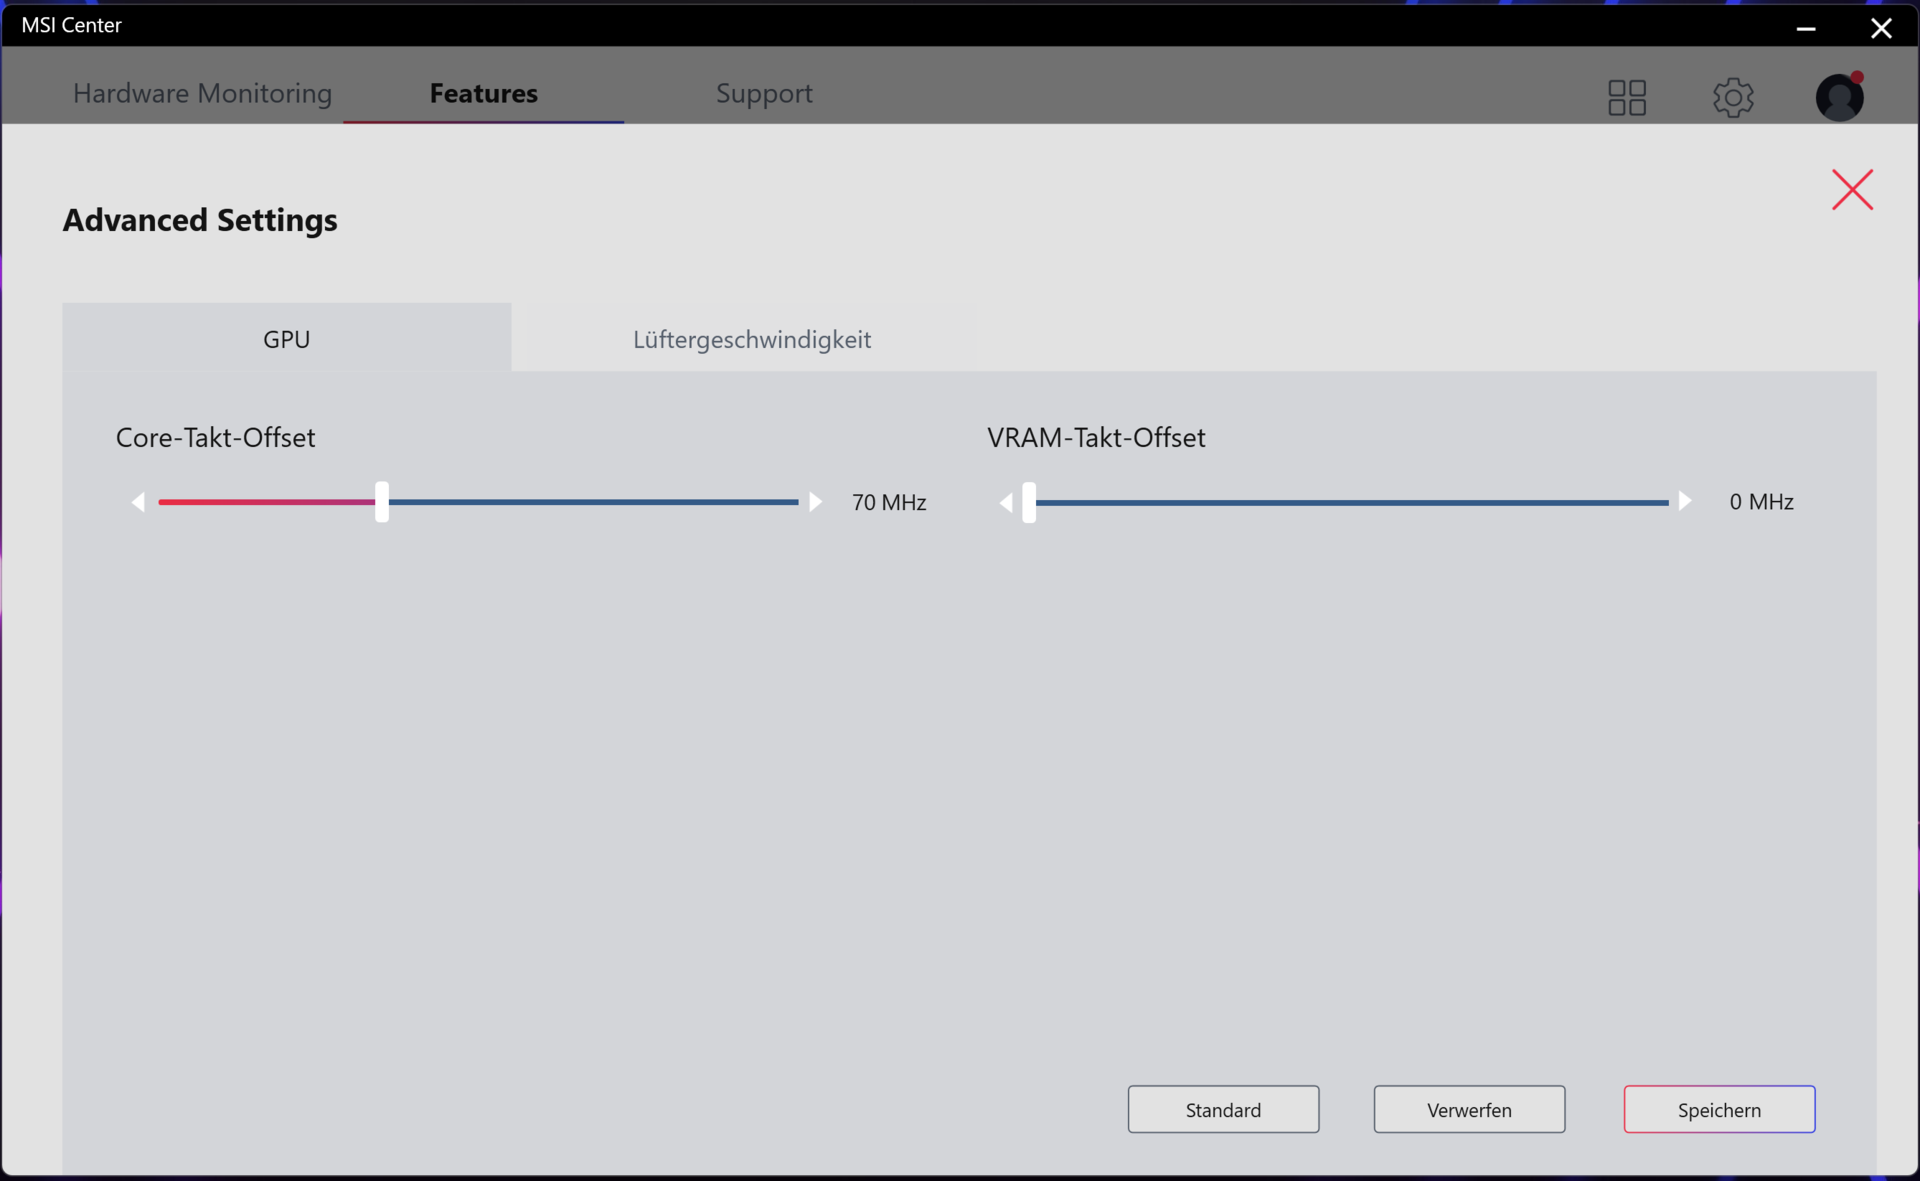
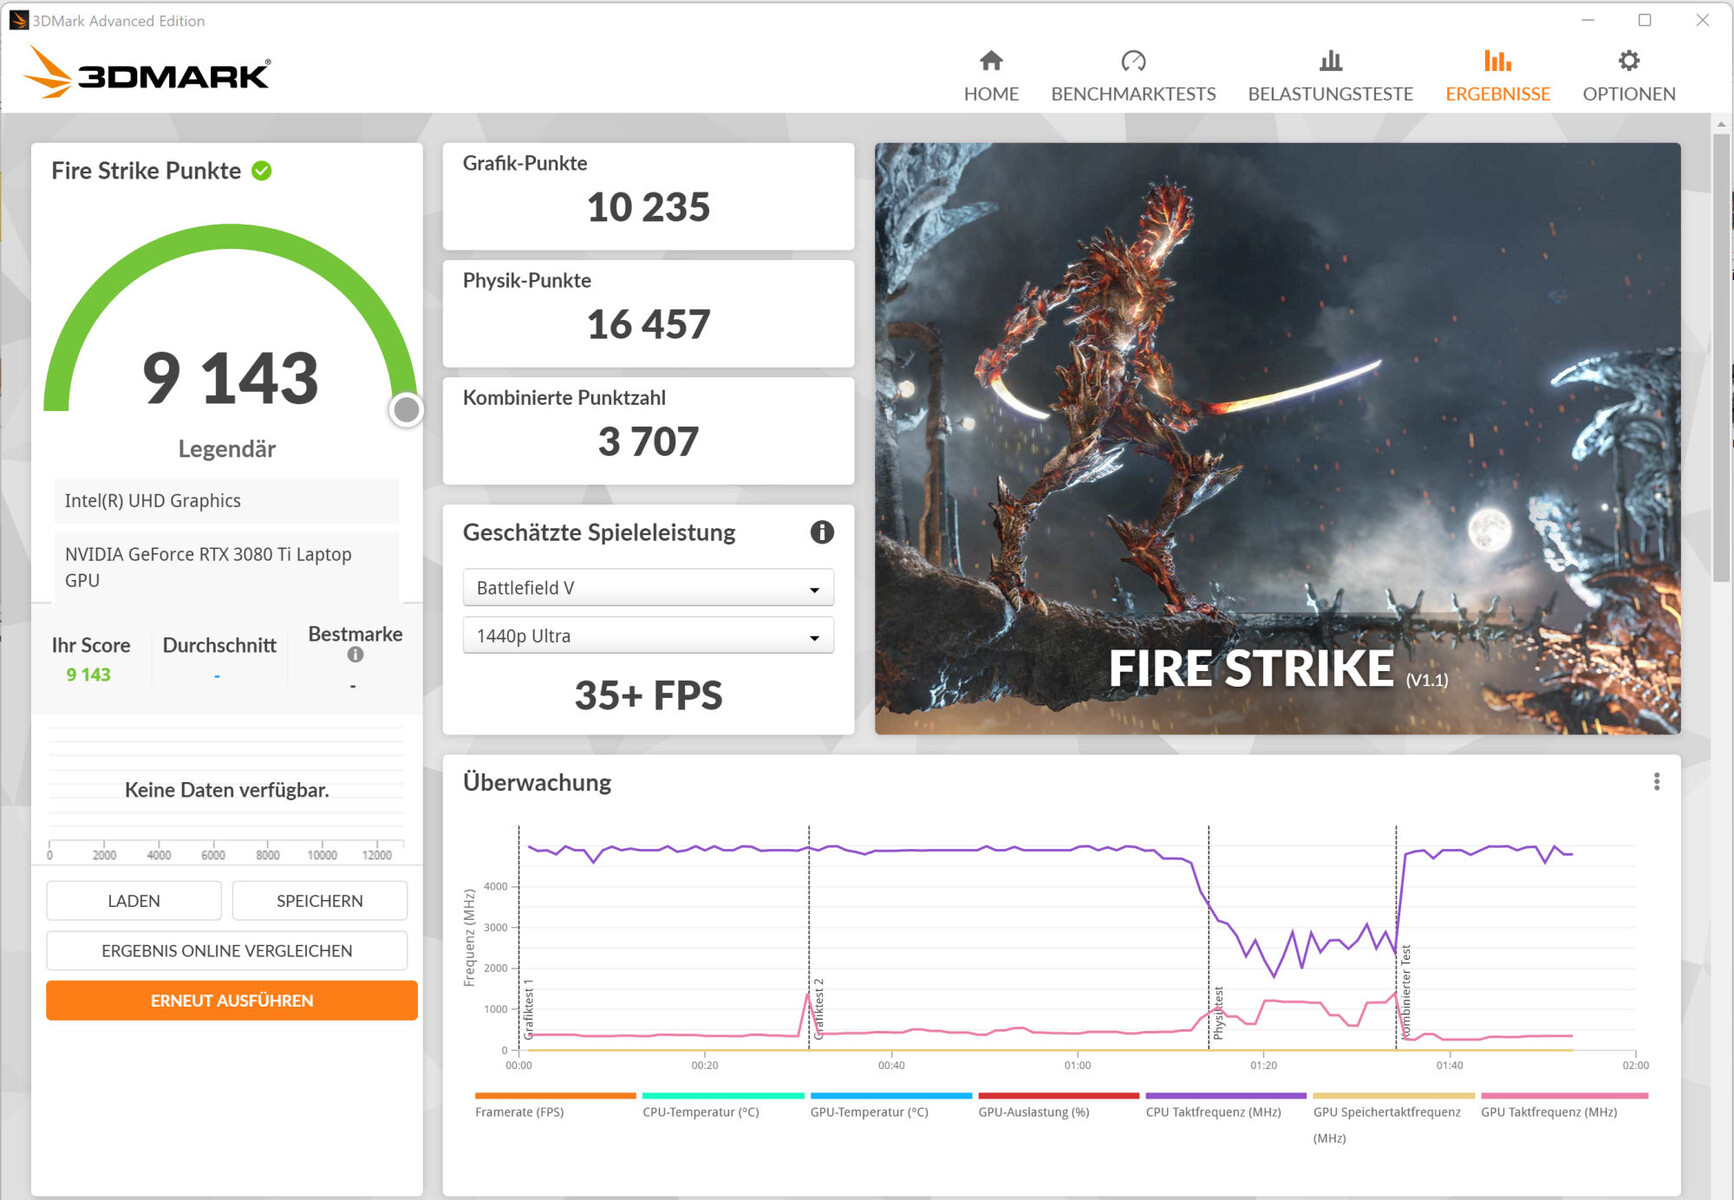
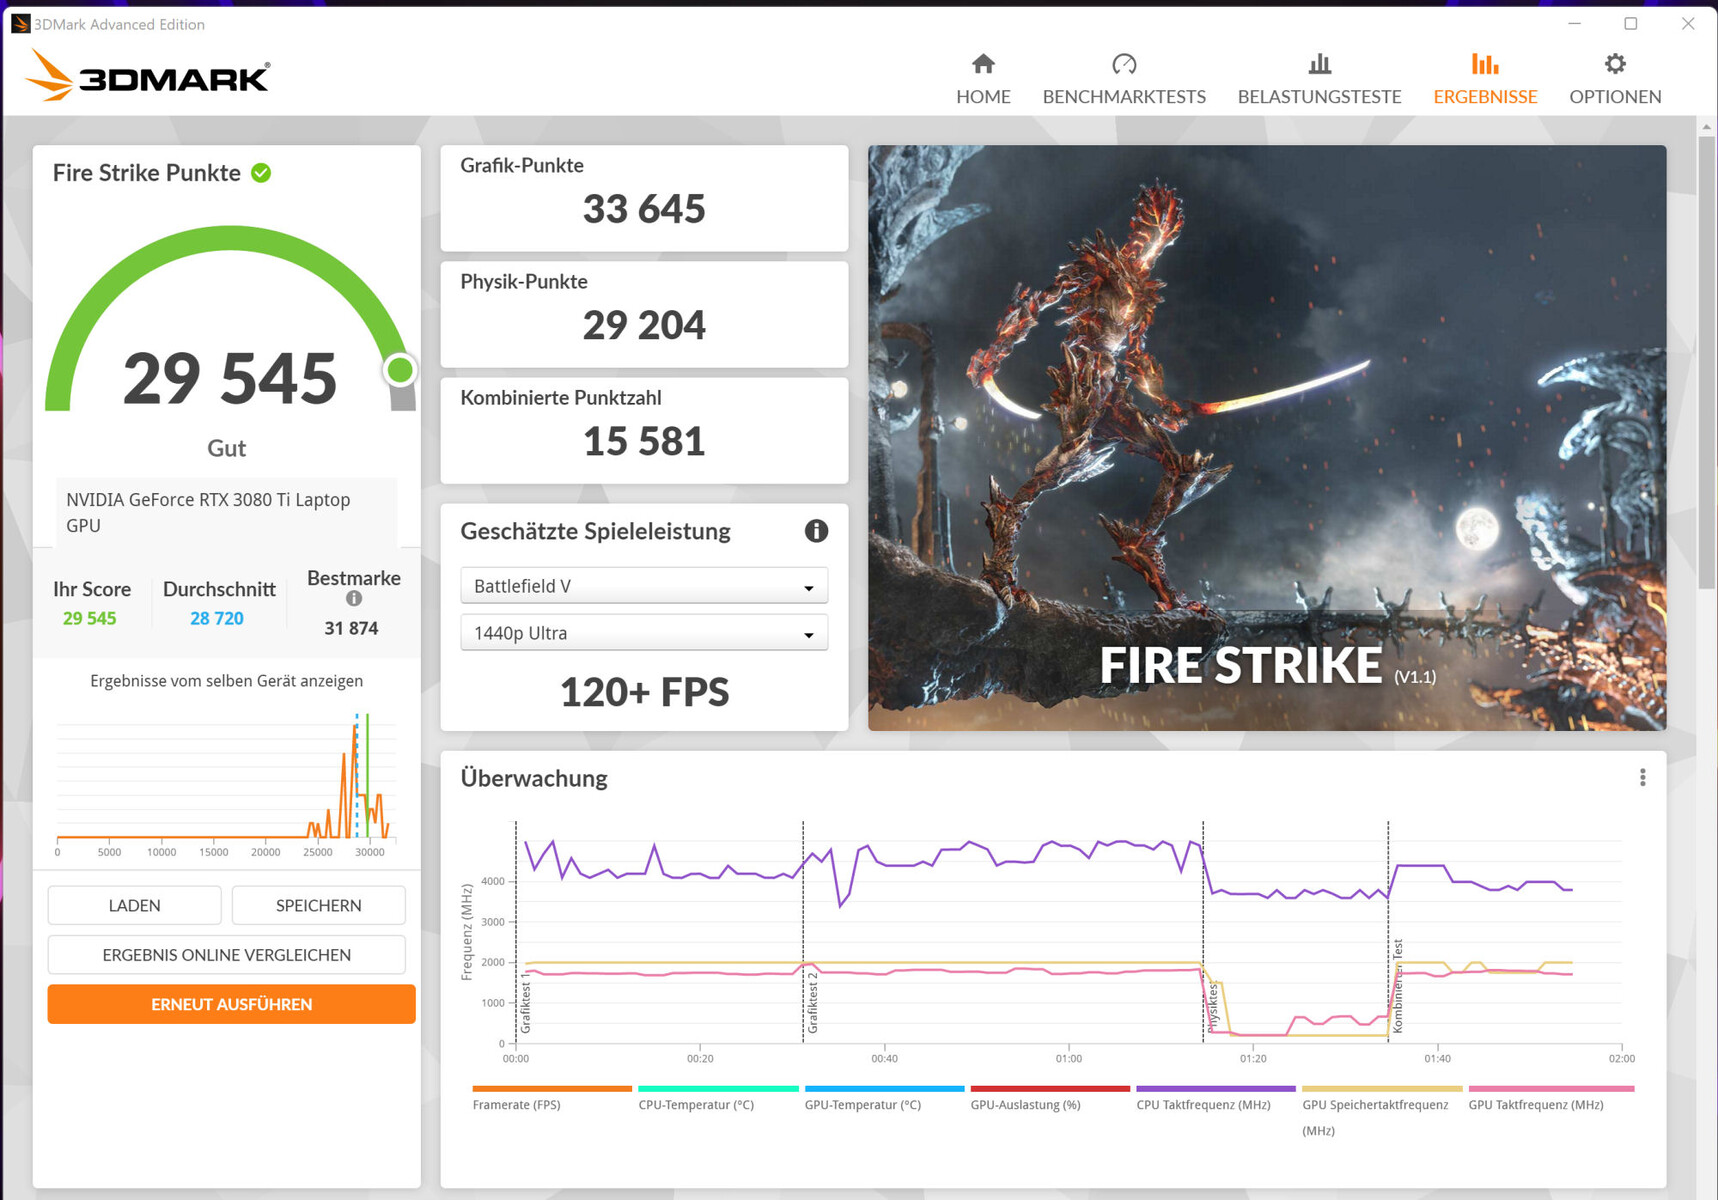
Die Benchmark-Resultate der GeForce-RTX-3080-Ti-Laptop-GPU (TGP: 175 Watt, 16 GB GDDR6-VRAM) zählen mit zu den besten Werten, die wir bisher mit dieser GPU ermitteln konnten. Die TGP wird allerdings nicht voll ausgereizt - das zeigt der Witcher-3-Test. Das Profil "Extreme Leistung" bietet Übertaktungs-Optionen für GPU und Grafikspeicher. Advanced Optimus wird nicht unterstützt. Die Umschaltung zwischen dGPU und Optimus erfordert immer einen Neustart des Rechners.
| 3DMark Performance Rating - Percent | |
| MSI Titan GT77 12UHS | |
| Alienware x17 R2 P48E | |
| MSI Titan GT77 12UHS | |
| MSI Titan GT77 12UHS 4k -1! | |
| Razer Blade 17 Early 2022 | |
| SCHENKER XMG Ultra 17 Rocket Lake | |
| Durchschnitt der Klasse Gaming | |
| Durchschnittliche NVIDIA GeForce RTX 3080 Ti Laptop GPU | |
| 3DMark 11 - 1280x720 Performance GPU | |
| MSI Titan GT77 12UHS | |
| Alienware x17 R2 P48E | |
| MSI Titan GT77 12UHS 4k | |
| Razer Blade 17 Early 2022 | |
| MSI Titan GT77 12UHS (dGPU, Extreme Leistung) | |
| SCHENKER XMG Ultra 17 Rocket Lake | |
| Durchschnitt der Klasse Gaming (1029 - 72070, n=232, der letzten 2 Jahre) | |
| Durchschnittliche NVIDIA GeForce RTX 3080 Ti Laptop GPU (13920 - 45841, n=45) | |
| V-Ray Benchmark Next 4.10 | |
| GPU | |
| Durchschnitt der Klasse Gaming (54 - 1334, n=187, der letzten 2 Jahre) | |
| MSI Titan GT77 12UHS (v4.10.07, dGPU, Extreme Leistung) | |
| MSI Titan GT77 12UHS (v4.10.07 ) | |
| Asus ROG Zephyrus Duo 16 GX650RX (v4.10.07 ) | |
| MSI Titan GT77 12UHS 4k (v4.10.07 ) | |
| Durchschnittliche NVIDIA GeForce RTX 3080 Ti Laptop GPU (311 - 552, n=35) | |
| Razer Blade 17 Early 2022 (v4.10.07 ) | |
| Gigabyte Aero 16 YE5 (v4.10.07 ) | |
| SCHENKER XMG Ultra 17 Rocket Lake (v4.10.07 ) | |
| CPU | |
| MSI Titan GT77 12UHS 4k (v4.10.07 ) | |
| MSI Titan GT77 12UHS (v4.10.07, dGPU, Extreme Leistung) | |
| MSI Titan GT77 12UHS (v4.10.07 ) | |
| Durchschnitt der Klasse Gaming (2741 - 37629, n=187, der letzten 2 Jahre) | |
| Durchschnittliche NVIDIA GeForce RTX 3080 Ti Laptop GPU (5564 - 23947, n=35) | |
| Gigabyte Aero 16 YE5 (v4.10.07 ) | |
| SCHENKER XMG Ultra 17 Rocket Lake (v4.10.07 ) | |
| Asus ROG Zephyrus Duo 16 GX650RX (v4.10.07 ) | |
| Razer Blade 17 Early 2022 (v4.10.07 ) | |
| Blender | |
| v3.3 Classroom CUDA | |
| Durchschnitt der Klasse Gaming (16 - 175, n=187, der letzten 2 Jahre) | |
| MSI Titan GT77 12UHS 4k | |
| MSI Titan GT77 12UHS (dGPU, Extreme Leistung) | |
| Durchschnittliche NVIDIA GeForce RTX 3080 Ti Laptop GPU (32 - 41, n=13) | |
| MSI Titan GT77 12UHS | |
| v3.3 Classroom OPTIX/RTX | |
| MSI Titan GT77 12UHS 4k | |
| Durchschnittliche NVIDIA GeForce RTX 3080 Ti Laptop GPU (20 - 28, n=13) | |
| Durchschnitt der Klasse Gaming (9 - 142, n=180, der letzten 2 Jahre) | |
| MSI Titan GT77 12UHS | |
| MSI Titan GT77 12UHS (dGPU, Extreme Leistung) | |
* ... kleinere Werte sind besser
| 3DMark 11 Performance | 35867 Punkte | |
| 3DMark Cloud Gate Standard Score | 53629 Punkte | |
| 3DMark Fire Strike Score | 27273 Punkte | |
| 3DMark Fire Strike Extreme Score | 15613 Punkte | |
| 3DMark Time Spy Score | 12865 Punkte | |
Hilfe | ||
Gaming Performance
Die Hardware ist auf 4k-Gaming bei hohen bis maximalen Settings ausgelegt. Die Bildwiederholraten bewegen sich oberhalb des RTX-3080-Ti-Durchschnitts. Bei direkter Bildausgabe via GeForce-GPU werden oftmals die bisher besten von uns mit dieser GPU ermittelten Frameraten erzeugt. In jedem Fall liefert der Rechner dauerhaft stabile Werte auf hohem Niveau - das zeigt der Witcher-3-Test.
| The Witcher 3 | |
| 1920x1080 Ultra Graphics & Postprocessing (HBAO+) | |
| MSI Titan GT77 12UHS (dGPU, Extreme Leistung) | |
| MSI Titan GT77 12UHS | |
| Alienware x17 R2 P48E | |
| MSI Titan GT77 12UHS 4k | |
| SCHENKER XMG Ultra 17 Rocket Lake | |
| Razer Blade 17 Early 2022 | |
| Durchschnitt der Klasse Gaming (8.61 - 216, n=227, der letzten 2 Jahre) | |
| Durchschnittliche NVIDIA GeForce RTX 3080 Ti Laptop GPU (30 - 130.6, n=43) | |
| 3840x2160 Ultra Graphics & Postprocessing (HBAO+) | |
| Durchschnitt der Klasse Gaming (42.8 - 107.6, n=16, der letzten 2 Jahre) | |
| MSI Titan GT77 12UHS (dGPU, Extreme Leistung) | |
| MSI Titan GT77 12UHS 4k | |
| Razer Blade 17 Early 2022 | |
| Durchschnittliche NVIDIA GeForce RTX 3080 Ti Laptop GPU (44.8 - 62.7, n=5) | |
| Dota 2 Reborn | |
| 1920x1080 ultra (3/3) best looking | |
| MSI Titan GT77 12UHS | |
| MSI Titan GT77 12UHS (dGPU, Extreme Leistung) | |
| MSI Titan GT77 12UHS 4k | |
| Alienware x17 R2 P48E | |
| SCHENKER XMG Ultra 17 Rocket Lake | |
| Durchschnitt der Klasse Gaming (26.9 - 220, n=238, der letzten 2 Jahre) | |
| Durchschnittliche NVIDIA GeForce RTX 3080 Ti Laptop GPU (29.9 - 170.5, n=45) | |
| Razer Blade 17 Early 2022 | |
| 3840x2160 ultra (3/3) best looking | |
| MSI Titan GT77 12UHS (dGPU, Extreme Leistung) | |
| MSI Titan GT77 12UHS 4k | |
| Durchschnitt der Klasse Gaming (14.2 - 205, n=81, der letzten 2 Jahre) | |
| Durchschnittliche NVIDIA GeForce RTX 3080 Ti Laptop GPU (70.8 - 155.6, n=19) | |
| Razer Blade 17 Early 2022 | |
| X-Plane 11.11 | |
| 3840x2160 high (fps_test=3) | |
| MSI Titan GT77 12UHS (dGPU, Extreme Leistung) | |
| MSI Titan GT77 12UHS 4k | |
| Durchschnitt der Klasse Gaming (12 - 145.5, n=76, der letzten 2 Jahre) | |
| Durchschnittliche NVIDIA GeForce RTX 3080 Ti Laptop GPU (32.9 - 109.5, n=20) | |
| Razer Blade 17 Early 2022 | |
| 1920x1080 high (fps_test=3) | |
| MSI Titan GT77 12UHS | |
| MSI Titan GT77 12UHS (dGPU, Extreme Leistung) | |
| MSI Titan GT77 12UHS 4k | |
| SCHENKER XMG Ultra 17 Rocket Lake | |
| Alienware x17 R2 P48E | |
| Durchschnitt der Klasse Gaming (12.4 - 166.2, n=243, der letzten 2 Jahre) | |
| Durchschnittliche NVIDIA GeForce RTX 3080 Ti Laptop GPU (32.6 - 127, n=45) | |
| Razer Blade 17 Early 2022 | |
| Final Fantasy XV Benchmark | |
| 3840x2160 High Quality | |
| Durchschnitt der Klasse Gaming (32.2 - 94.7, n=68, der letzten 2 Jahre) | |
| MSI Titan GT77 12UHS (1.3, dGPU, Extreme Leistung) | |
| MSI Titan GT77 12UHS 4k (1.3) | |
| Razer Blade 17 Early 2022 (1.3) | |
| Durchschnittliche NVIDIA GeForce RTX 3080 Ti Laptop GPU (35.1 - 61.2, n=18) | |
| 1920x1080 High Quality | |
| MSI Titan GT77 12UHS (1.3, dGPU, Extreme Leistung) | |
| MSI Titan GT77 12UHS (1.3) | |
| MSI Titan GT77 12UHS 4k (1.3) | |
| Alienware x17 R2 P48E (1.3) | |
| Durchschnittliche NVIDIA GeForce RTX 3080 Ti Laptop GPU (30.7 - 140.6, n=42) | |
| Razer Blade 17 Early 2022 (1.3) | |
| Durchschnitt der Klasse Gaming (9.13 - 194.9, n=228, der letzten 2 Jahre) | |
| GTA V | |
| 3840x2160 Highest Settings possible AA:4xMSAA + FX AF:16x | |
| MSI Titan GT77 12UHS (dGPU, Extreme Leistung) | |
| MSI Titan GT77 12UHS 4k | |
| Durchschnitt der Klasse Gaming (33.6 - 90.9, n=49, der letzten 2 Jahre) | |
| Razer Blade 17 Early 2022 | |
| Durchschnittliche NVIDIA GeForce RTX 3080 Ti Laptop GPU (37.7 - 67.2, n=14) | |
| 1920x1080 Highest Settings possible AA:4xMSAA + FX AF:16x | |
| MSI Titan GT77 12UHS 4k | |
| MSI Titan GT77 12UHS (dGPU, Extreme Leistung) | |
| MSI Titan GT77 12UHS | |
| Alienware x17 R2 P48E | |
| Durchschnittliche NVIDIA GeForce RTX 3080 Ti Laptop GPU (30 - 139.2, n=42) | |
| Durchschnitt der Klasse Gaming (6.38 - 167.7, n=218, der letzten 2 Jahre) | |
| Razer Blade 17 Early 2022 | |
| Strange Brigade | |
| 3840x2160 ultra AA:ultra AF:16 | |
| Durchschnitt der Klasse Gaming (54.5 - 298, n=57, der letzten 2 Jahre) | |
| MSI Titan GT77 12UHS (1.47.22.14 D3D12, dGPU, Extreme Leistung) | |
| MSI Titan GT77 12UHS 4k (1.47.22.14 D3D12) | |
| Razer Blade 17 Early 2022 (1.47.22.14 D3D12) | |
| Durchschnittliche NVIDIA GeForce RTX 3080 Ti Laptop GPU (61.7 - 100.7, n=15) | |
| 1920x1080 ultra AA:ultra AF:16 | |
| MSI Titan GT77 12UHS (1.47.22.14 D3D12) | |
| MSI Titan GT77 12UHS (1.47.22.14 D3D12, dGPU, Extreme Leistung) | |
| Alienware x17 R2 P48E (1.47.22.14 D3D12) | |
| Durchschnitt der Klasse Gaming (14.6 - 421, n=226, der letzten 2 Jahre) | |
| MSI Titan GT77 12UHS 4k (1.47.22.14 D3D12) | |
| Razer Blade 17 Early 2022 (1.47.22.14 D3D12) | |
| Durchschnittliche NVIDIA GeForce RTX 3080 Ti Laptop GPU (42.3 - 224, n=41) | |
| F1 2021 | |
| 3840x2160 Ultra High Preset + Raytracing AA:T AF:16x | |
| Durchschnitt der Klasse Gaming (47.6 - 115.1, n=22, der letzten 2 Jahre) | |
| MSI Titan GT77 12UHS (874931, dGPU, Extreme Leistung) | |
| MSI Titan GT77 12UHS 4k (874931) | |
| Razer Blade 17 Early 2022 (874931) | |
| Durchschnittliche NVIDIA GeForce RTX 3080 Ti Laptop GPU (41.1 - 70.2, n=18) | |
| 1920x1080 Ultra High Preset + Raytracing AA:T AF:16x | |
| MSI Titan GT77 12UHS (874931) | |
| MSI Titan GT77 12UHS (874931, dGPU, Extreme Leistung) | |
| Razer Blade 17 Early 2022 (874931) | |
| MSI Titan GT77 12UHS 4k (874931) | |
| Durchschnittliche NVIDIA GeForce RTX 3080 Ti Laptop GPU (30.2 - 160.6, n=30) | |
| Durchschnitt der Klasse Gaming (13.5 - 271, n=63, der letzten 2 Jahre) | |
| Far Cry 5 | |
| 3840x2160 Ultra Preset AA:T | |
| Durchschnitt der Klasse Gaming (39 - 113, n=33, der letzten 2 Jahre) | |
| MSI Titan GT77 12UHS 4k | |
| MSI Titan GT77 12UHS (dGPU, Extreme Leistung) | |
| Razer Blade 17 Early 2022 | |
| Durchschnittliche NVIDIA GeForce RTX 3080 Ti Laptop GPU (45 - 76, n=9) | |
| 1920x1080 Ultra Preset AA:T | |
| MSI Titan GT77 12UHS (dGPU, Extreme Leistung) | |
| MSI Titan GT77 12UHS | |
| MSI Titan GT77 12UHS 4k | |
| SCHENKER XMG Ultra 17 Rocket Lake | |
| Durchschnittliche NVIDIA GeForce RTX 3080 Ti Laptop GPU (111 - 162, n=24) | |
| Durchschnitt der Klasse Gaming (14 - 218, n=126, der letzten 2 Jahre) | |
| Razer Blade 17 Early 2022 | |
Witcher 3 FPS-Diagramm
| min. | mittel | hoch | max. | QHD | 4K | |
| GTA V (2015) | 187.3 | 186.6 | 182.3 | 134.4 | 117.8 | 121.7 |
| The Witcher 3 (2015) | 480 | 379 | 240 | 123.7 | 91.9 | |
| Dota 2 Reborn (2015) | 199.9 | 180.7 | 169.7 | 162.7 | 139.9 | |
| Final Fantasy XV Benchmark (2018) | 220 | 174.1 | 131 | 100.3 | 58.3 | |
| X-Plane 11.11 (2018) | 170.8 | 150.8 | 118.3 | 100.9 | ||
| Far Cry 5 (2018) | 199 | 169 | 161 | 151 | 134 | 76 |
| Strange Brigade (2018) | 519 | 286 | 233 | 206 | 156.2 | 93.7 |
| F1 2021 (2021) | 348 | 237 | 205 | 130.4 | 103.4 | 62.8 |
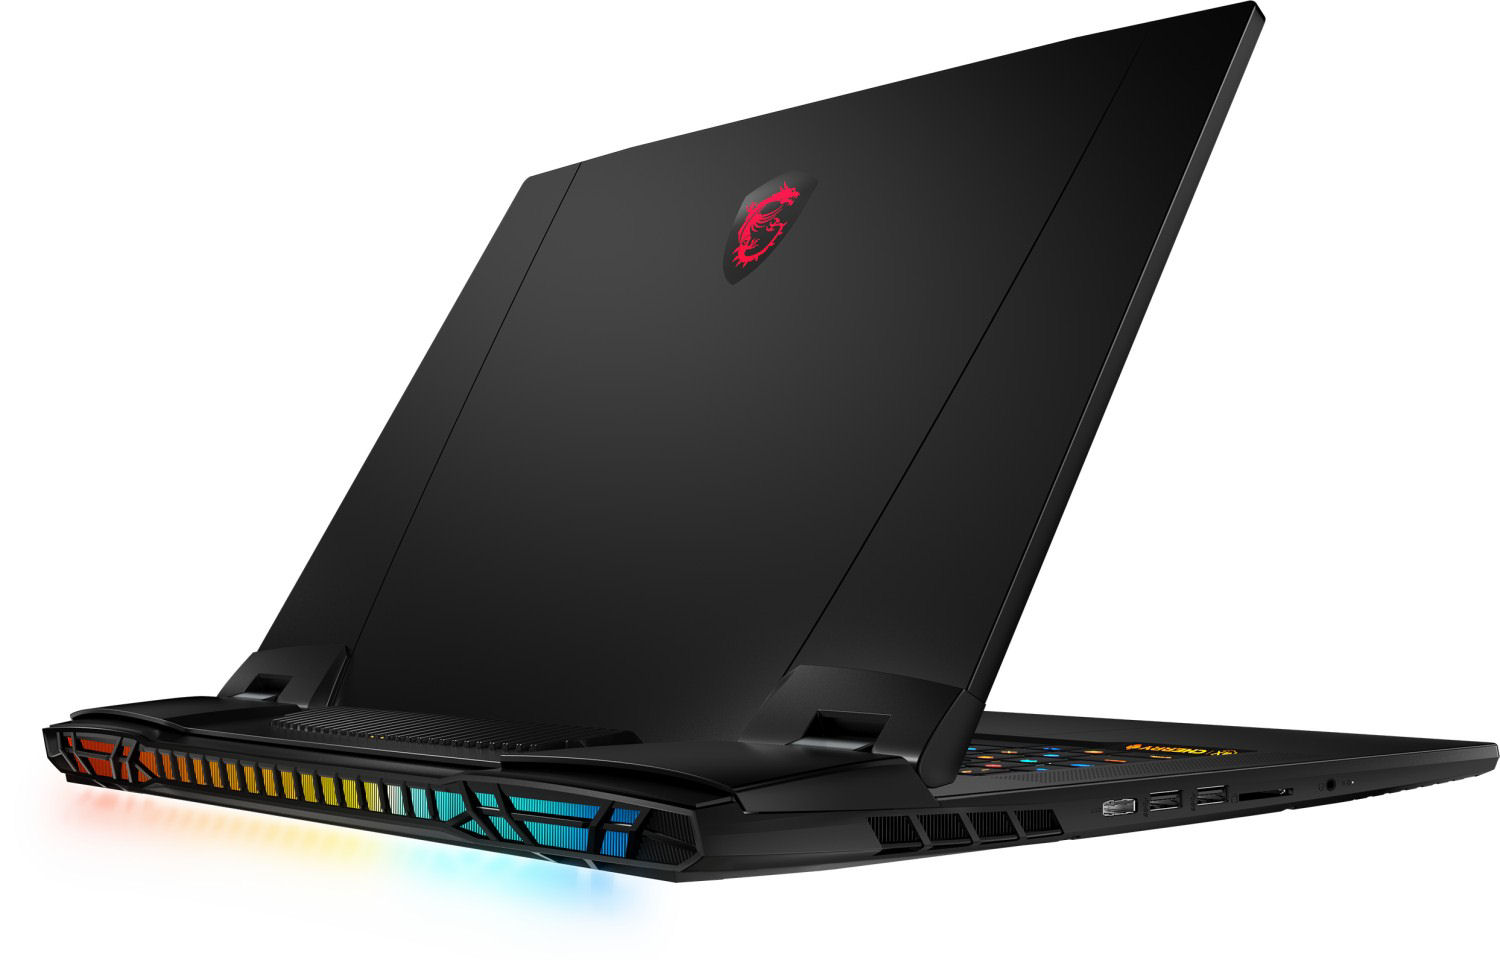
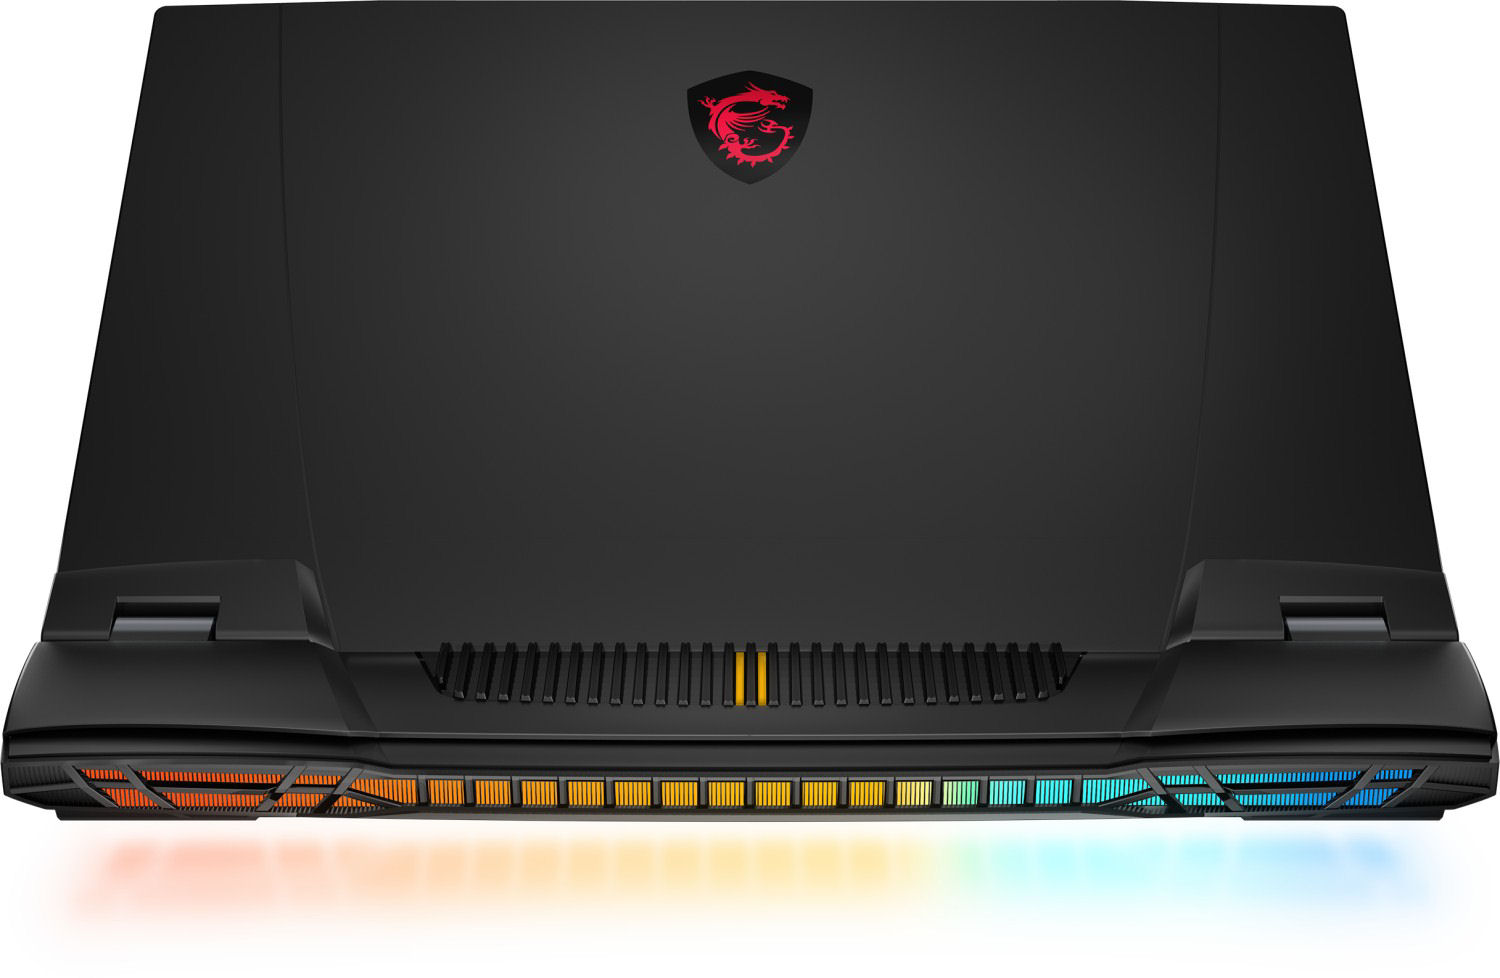
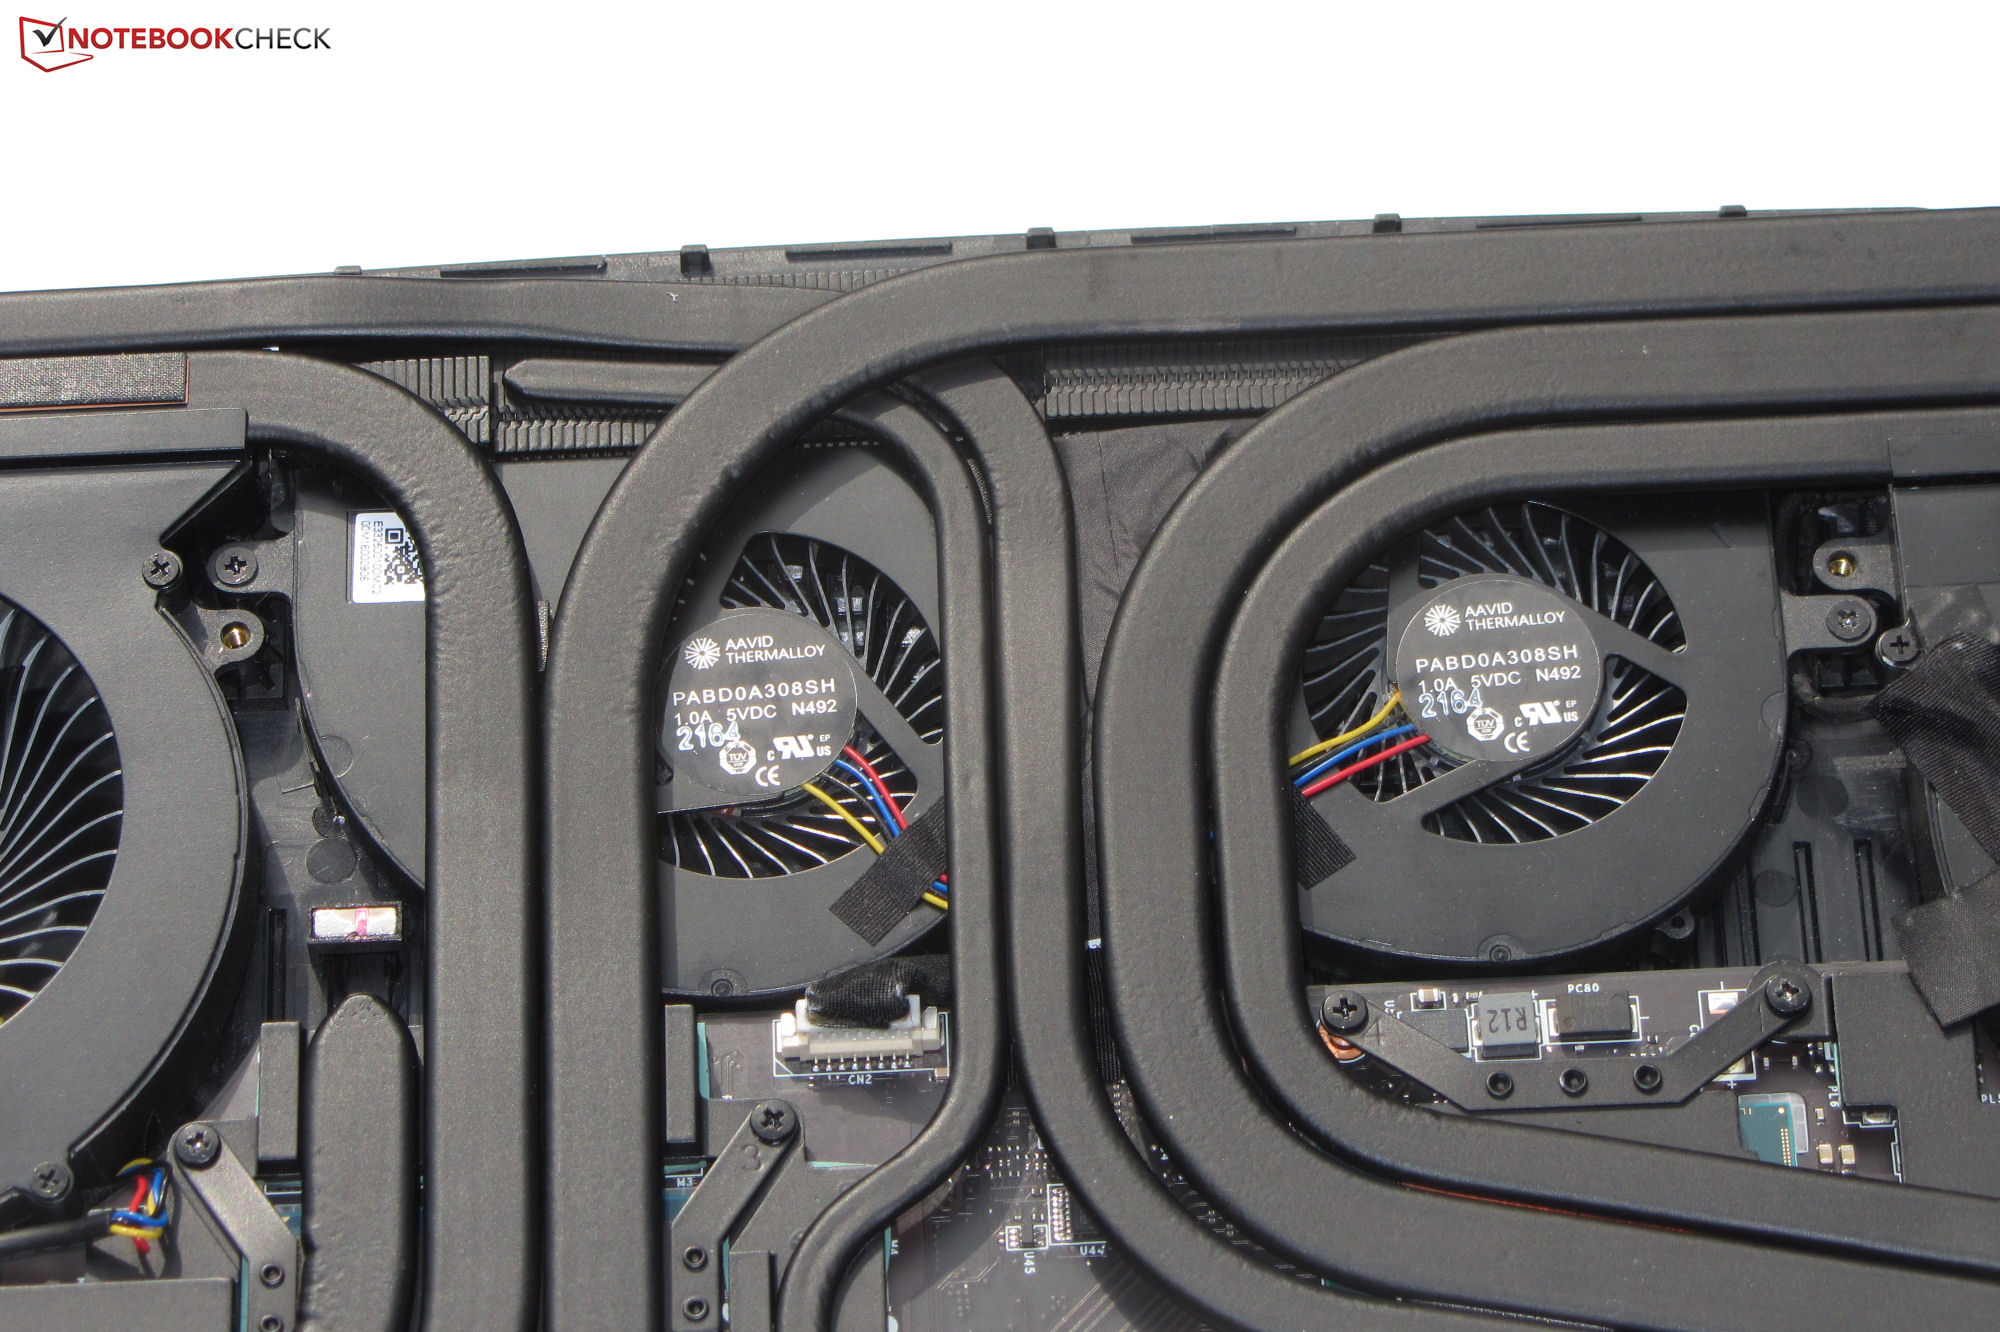
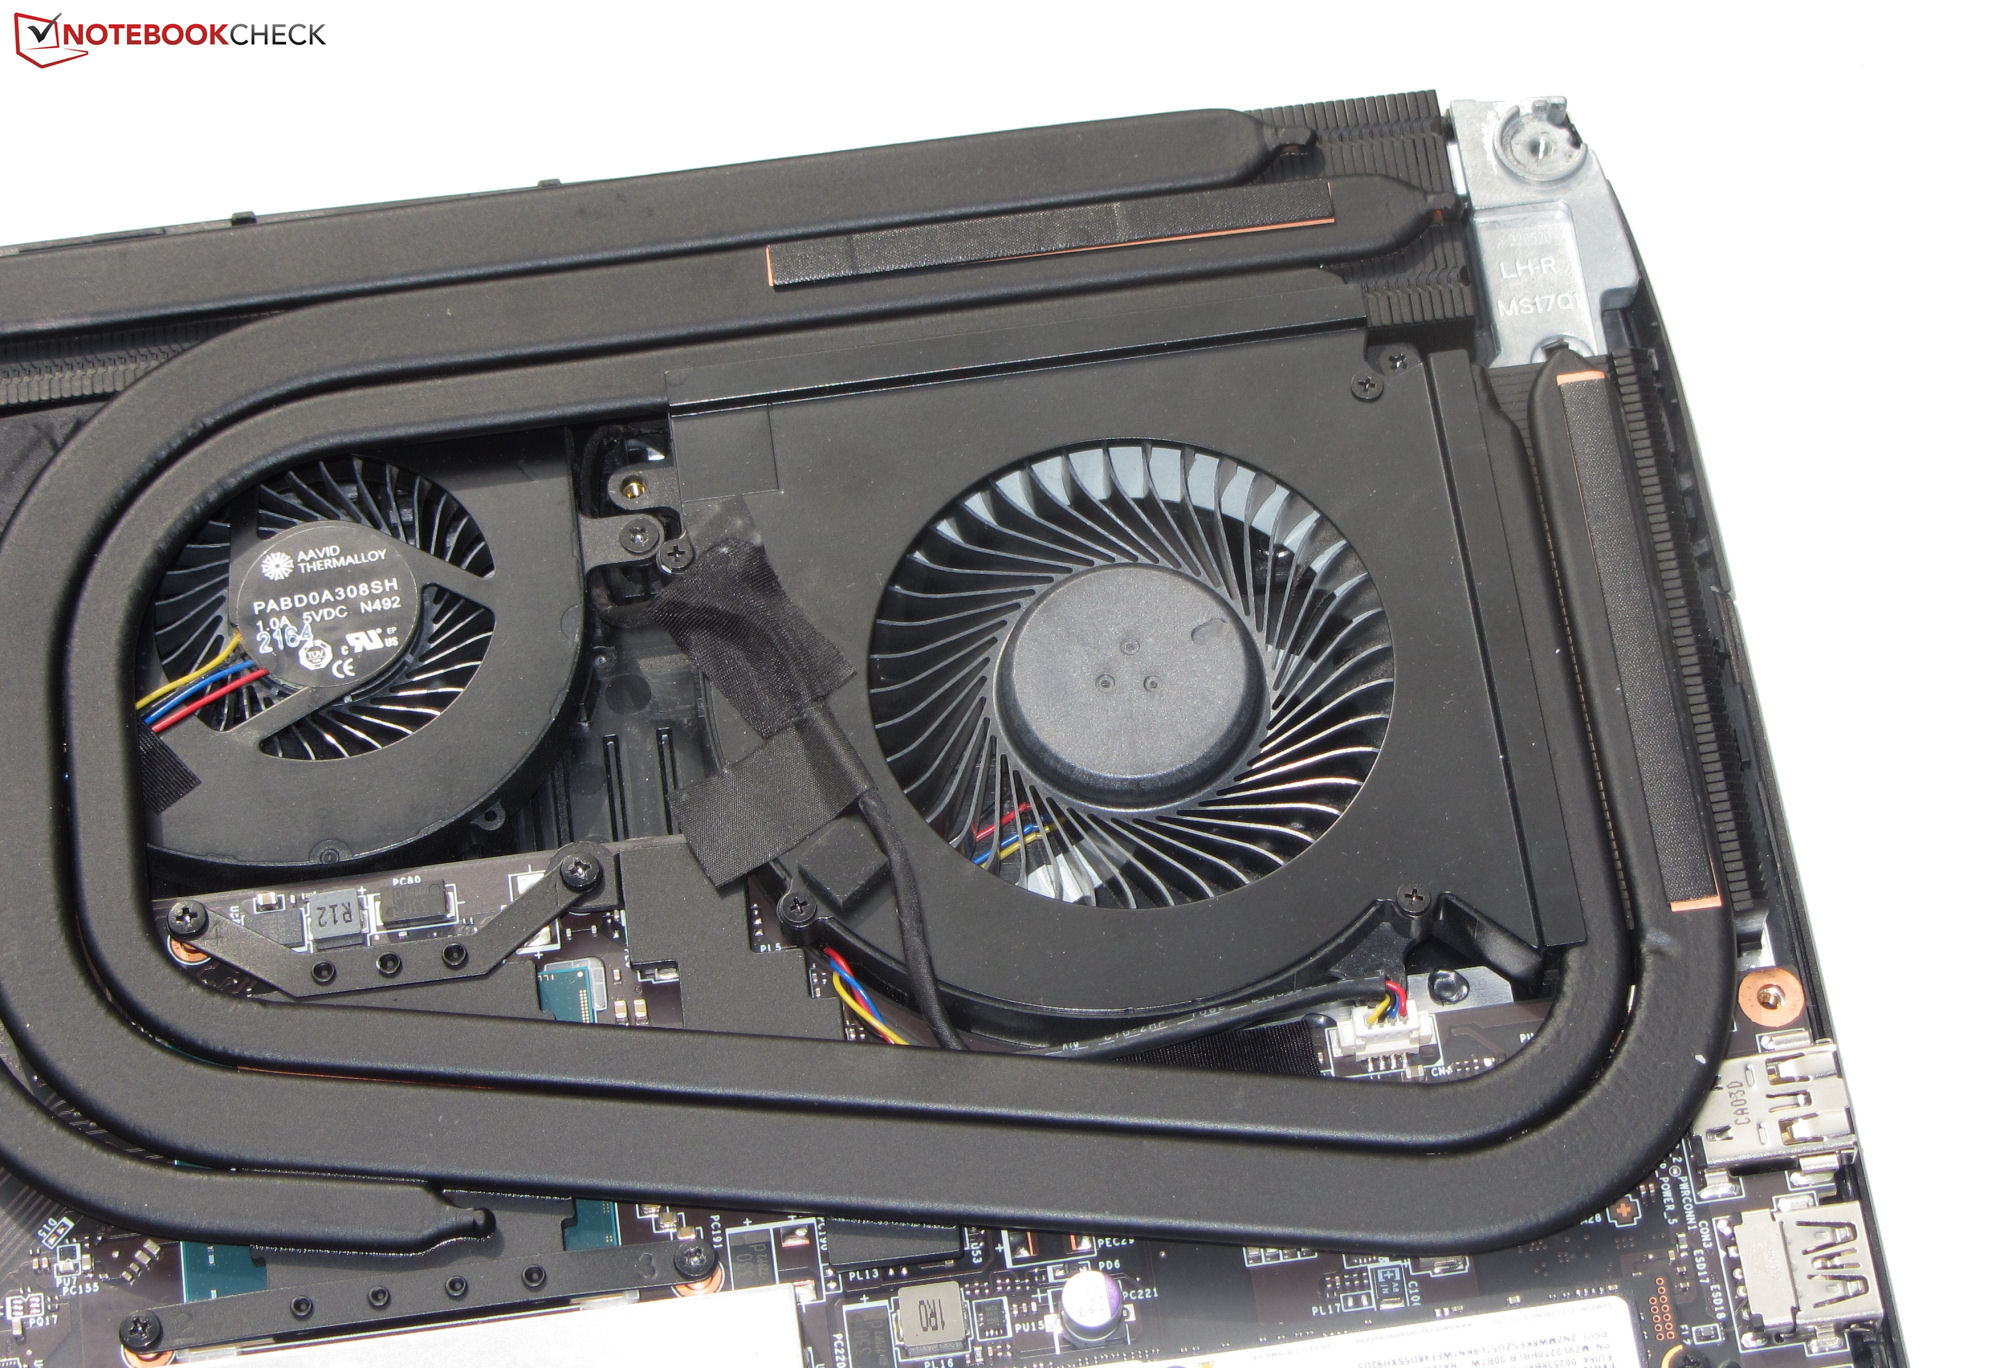
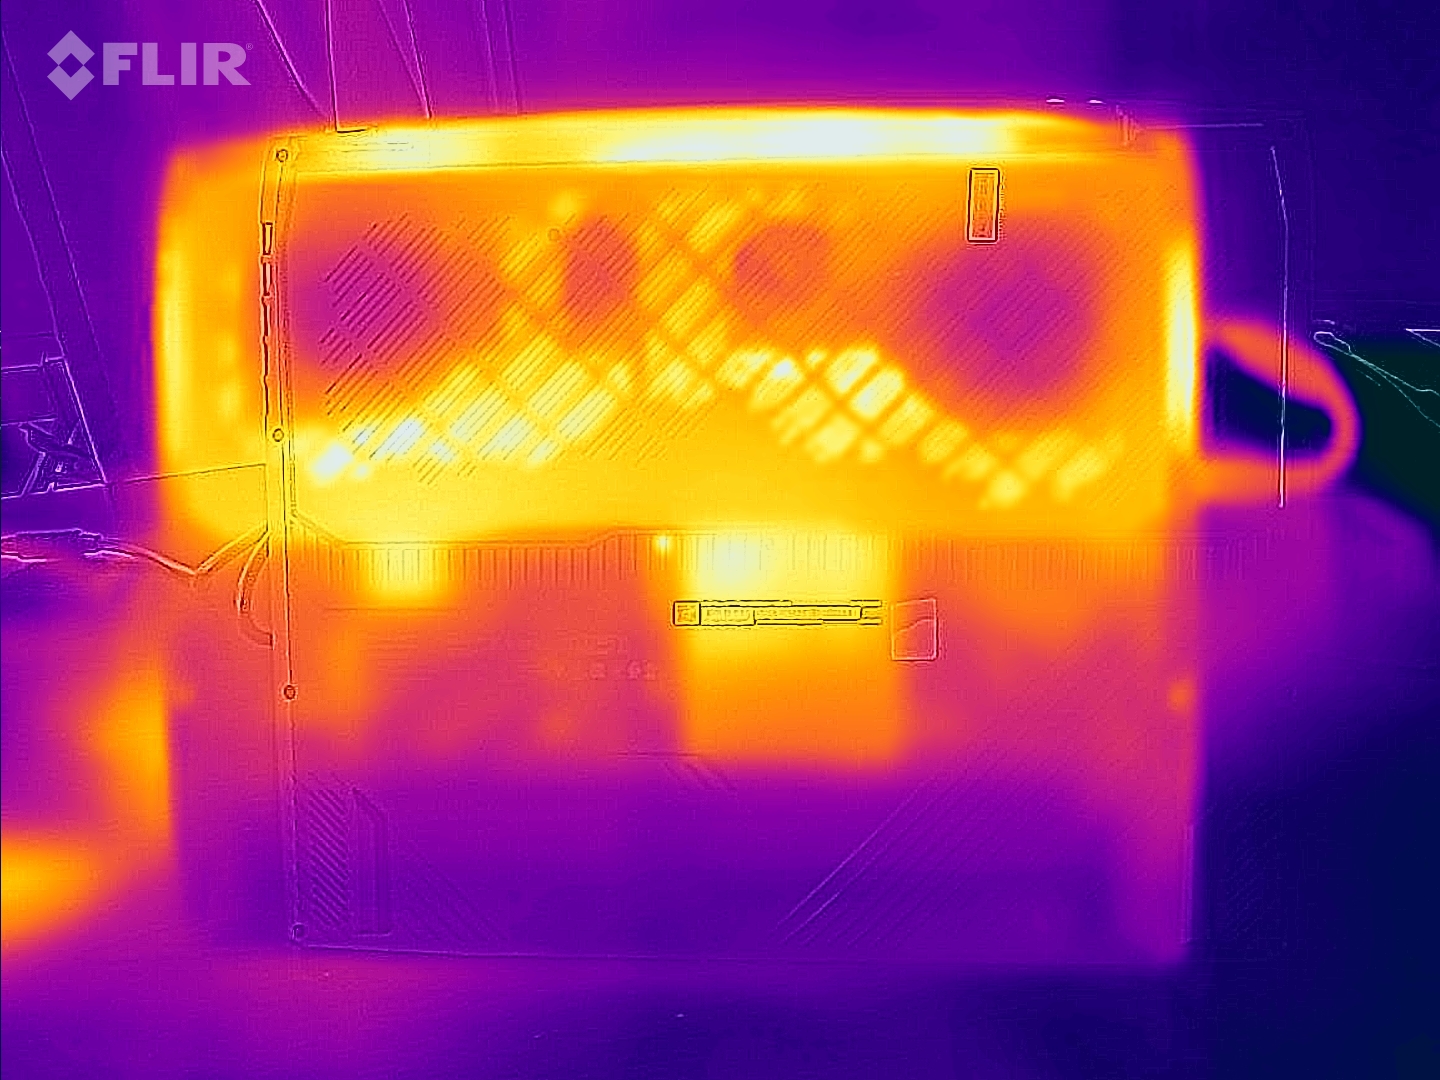
Emissionen - Das MSI GT77 verfügt über vier Lüfter
Geräuschemissionen
Die vier Lüfter erzeugen reichlich Radau: Unter Last steigt der Schalldruckpegel auf bis zu 53 dB(A) (Witcher-3-Test) bzw. 56 dB(A) (Stresstest). Im Leerlauf und bei geringer Last läuft in der Regel mindestens einer der Lüfter. Pegel von bis zu 42 dB(A) sind möglich. Letzteres trifft allerdings nicht auf das FHD-Titan zu. Mögliche Erklärung: Die Lüftersteuerung des 4k-GT77 könnte aufgrund der aktiven "SmartAuto"-Funktion etwas nervöser agieren. Das Profil "Silent-Modus" sorgt für ein niedrigeres Betriebsgeräusch - auf Kosten der Rechenleistung.
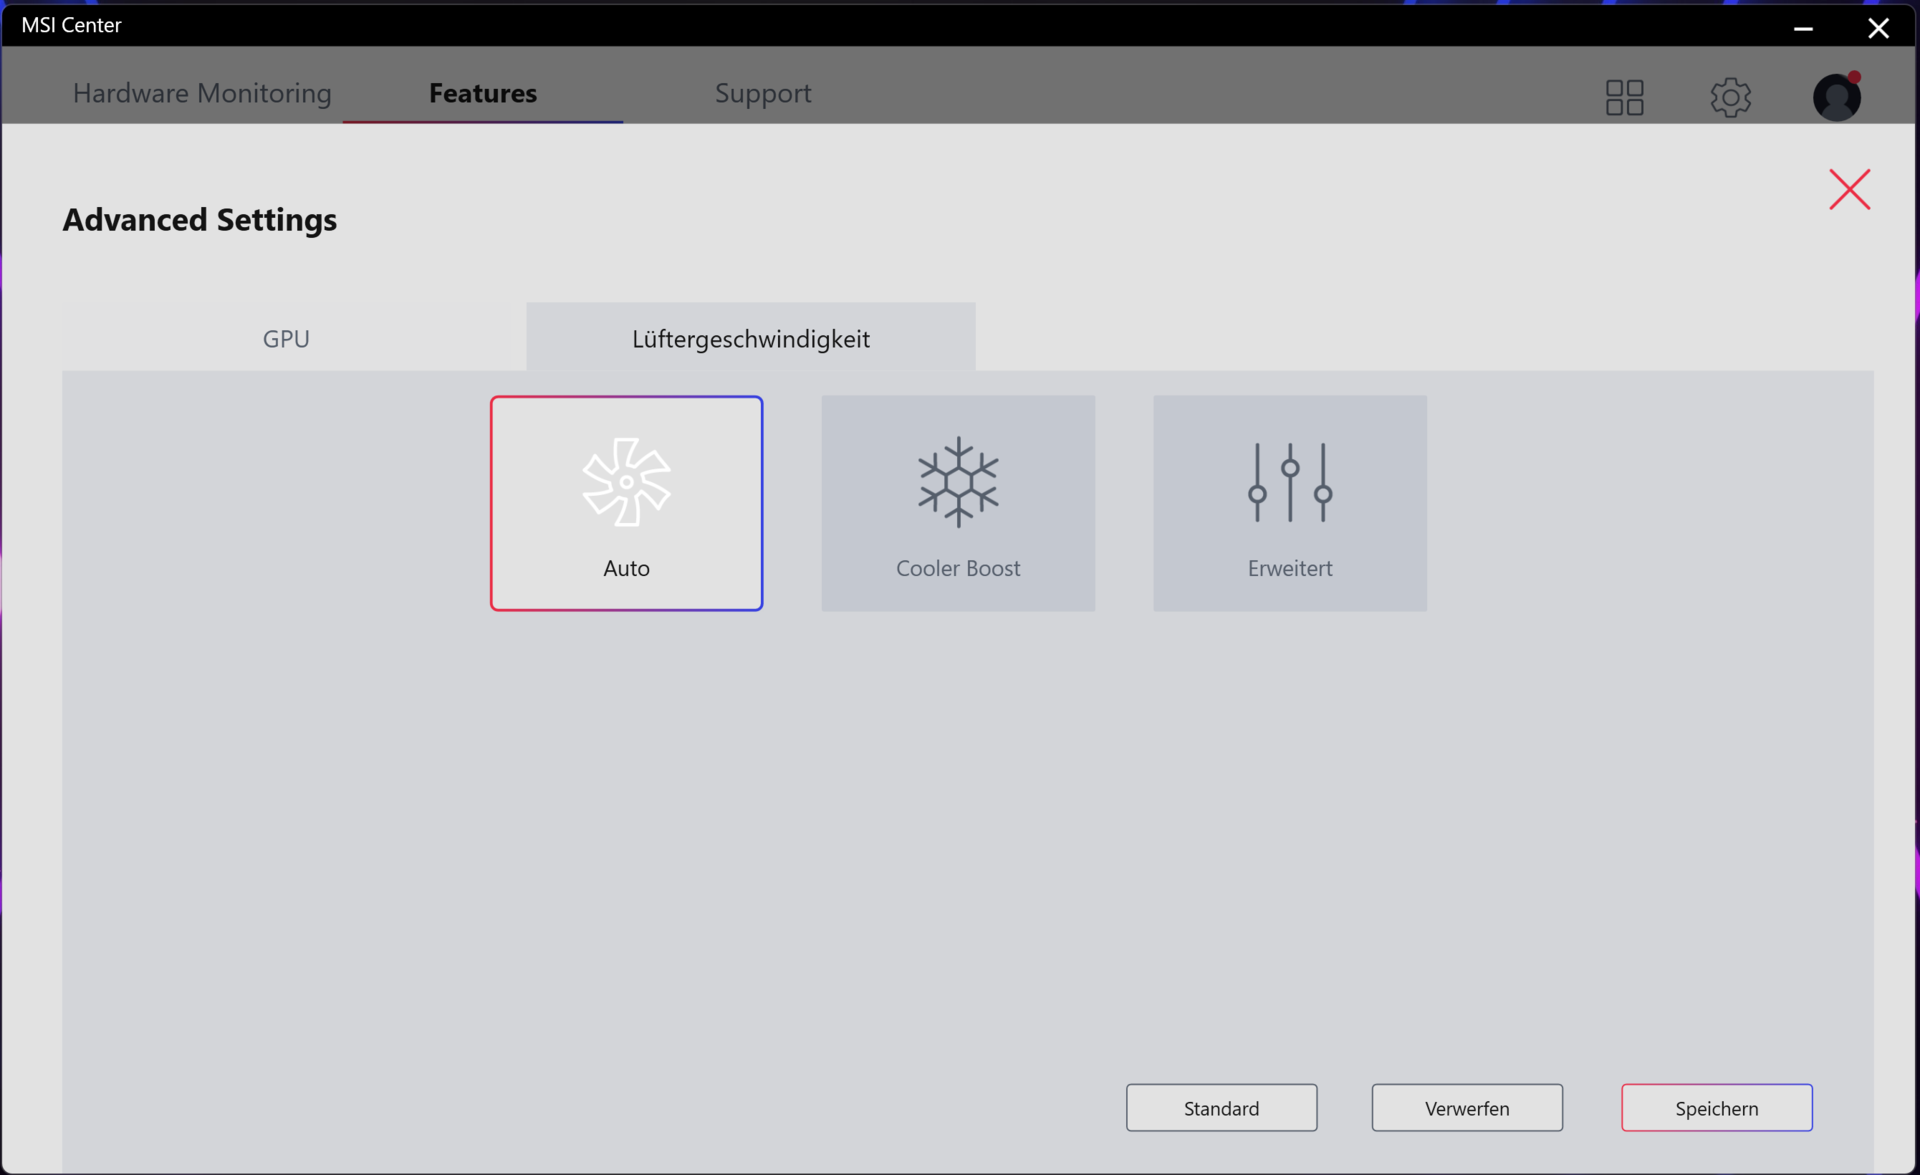
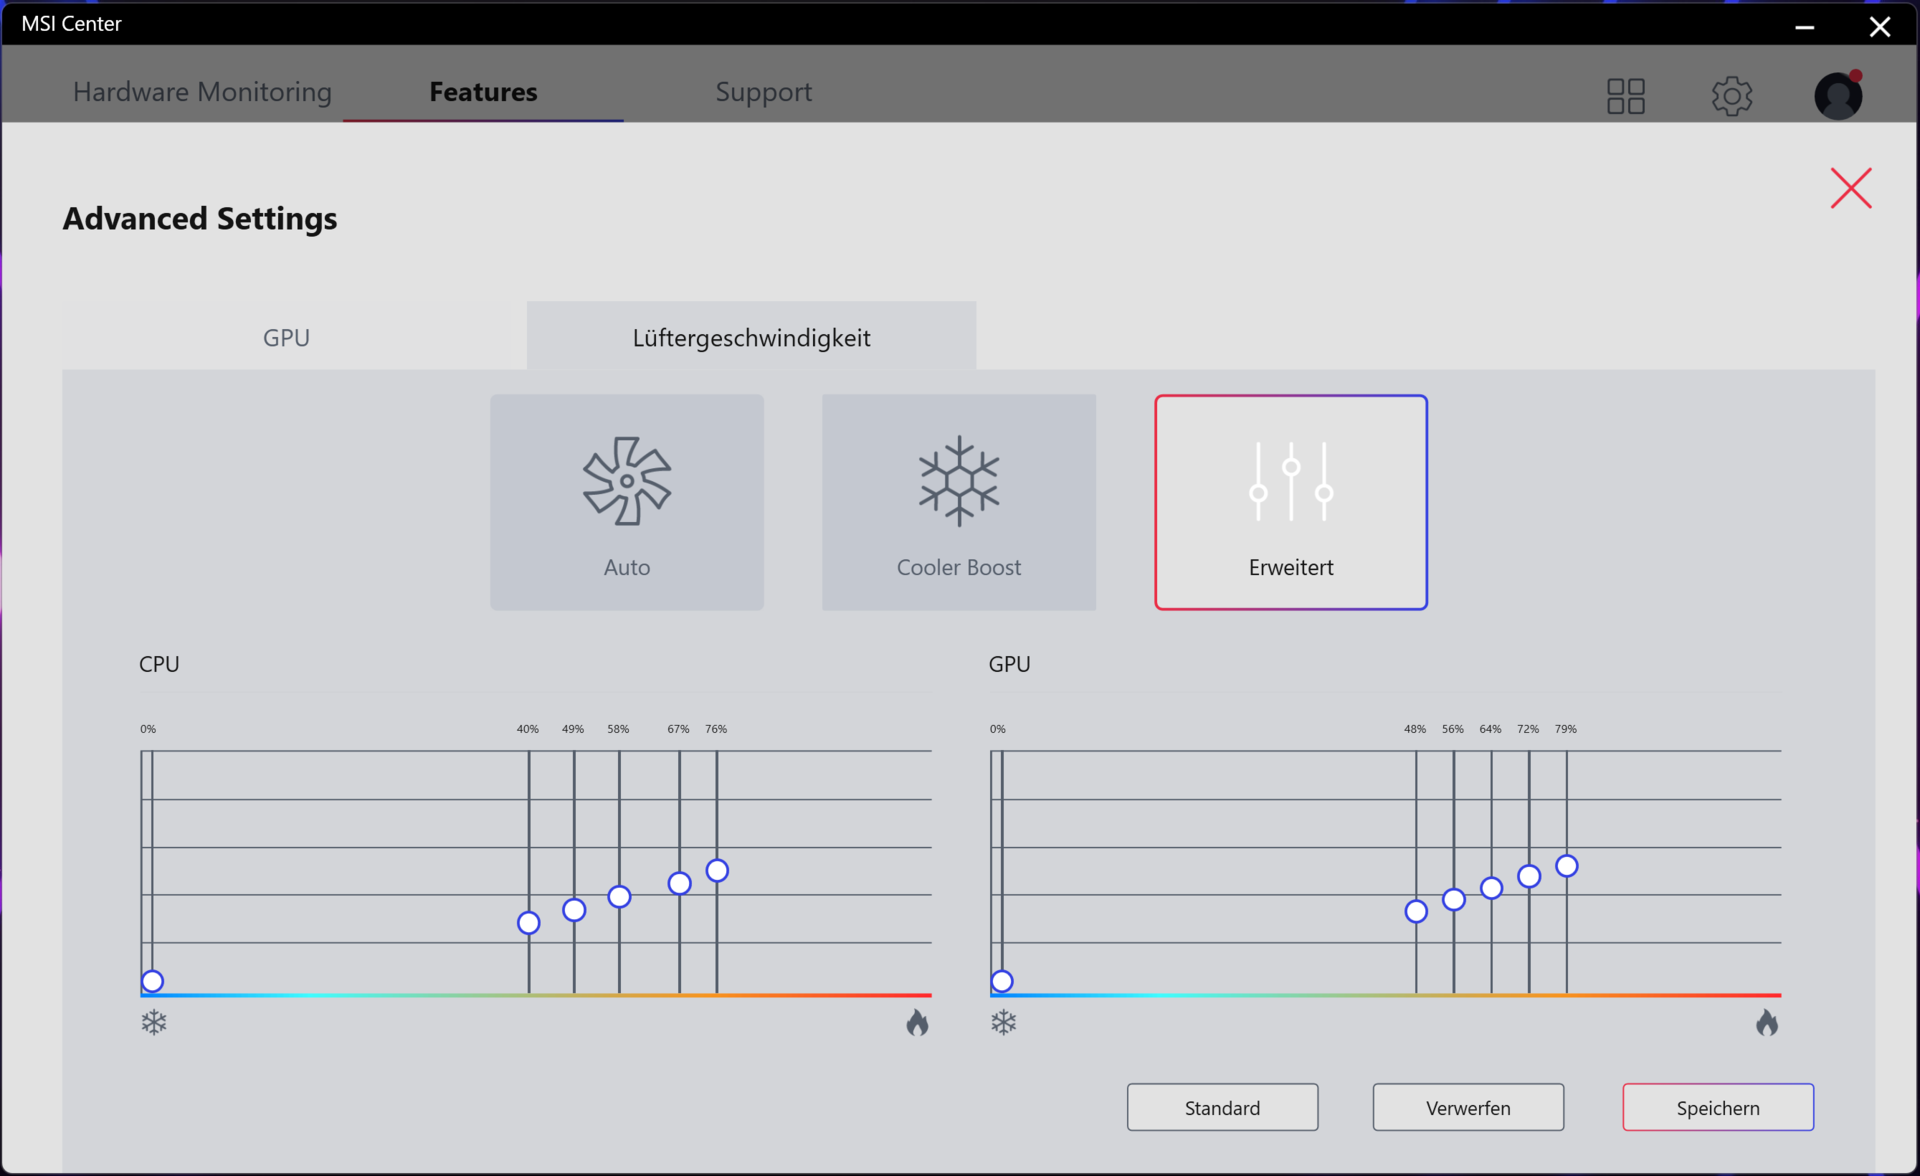
Das Profil "Extreme Leistung" ermöglicht Einfluss auf die Lüftersteuerung. Es stehen die Optionen "Auto", "Cooler Boost" (Lüfter arbeiten mit Maximalgeschwindigkeit) und "Erweitert" (Anpassung der Lüfterkurven) bereit.
Lautstärkediagramm
| Idle |
| 29 / 30 / 42 dB(A) |
| Last |
| 54 / 56 dB(A) |
 | ||
30 dB leise 40 dB(A) deutlich hörbar 50 dB(A) störend |
||
min: | ||
| MSI Titan GT77 12UHS 4k i9-12900HX, GeForce RTX 3080 Ti Laptop GPU | Razer Blade 17 Early 2022 i9-12900H, GeForce RTX 3080 Ti Laptop GPU | Alienware x17 R2 P48E i9-12900HK, GeForce RTX 3080 Ti Laptop GPU | SCHENKER XMG Ultra 17 Rocket Lake i9-11900K, GeForce RTX 3080 Laptop GPU | MSI Titan GT77 12UHS i9-12900HX, GeForce RTX 3080 Ti Laptop GPU | |
|---|---|---|---|---|---|
| Geräuschentwicklung | 9% | 21% | -12% | 14% | |
| aus / Umgebung * | 26 | 26 -0% | 22.7 13% | 24 8% | 21.9 16% |
| Idle min * | 29 | 26 10% | 23.1 20% | 30 -3% | 24.53 15% |
| Idle avg * | 30 | 27 10% | 23.1 23% | 31 -3% | 24.53 18% |
| Idle max * | 42 | 32 24% | 23.1 45% | 57 -36% | 24.53 42% |
| Last avg * | 54 | 50 7% | 31.9 41% | 63 -17% | 46.25 14% |
| Witcher 3 ultra * | 52 | 51 2% | 52.5 -1% | 61 -17% | 56.86 -9% |
| Last max * | 56 | 51 9% | 52.5 6% | 63 -13% | 54.25 3% |
* ... kleinere Werte sind besser
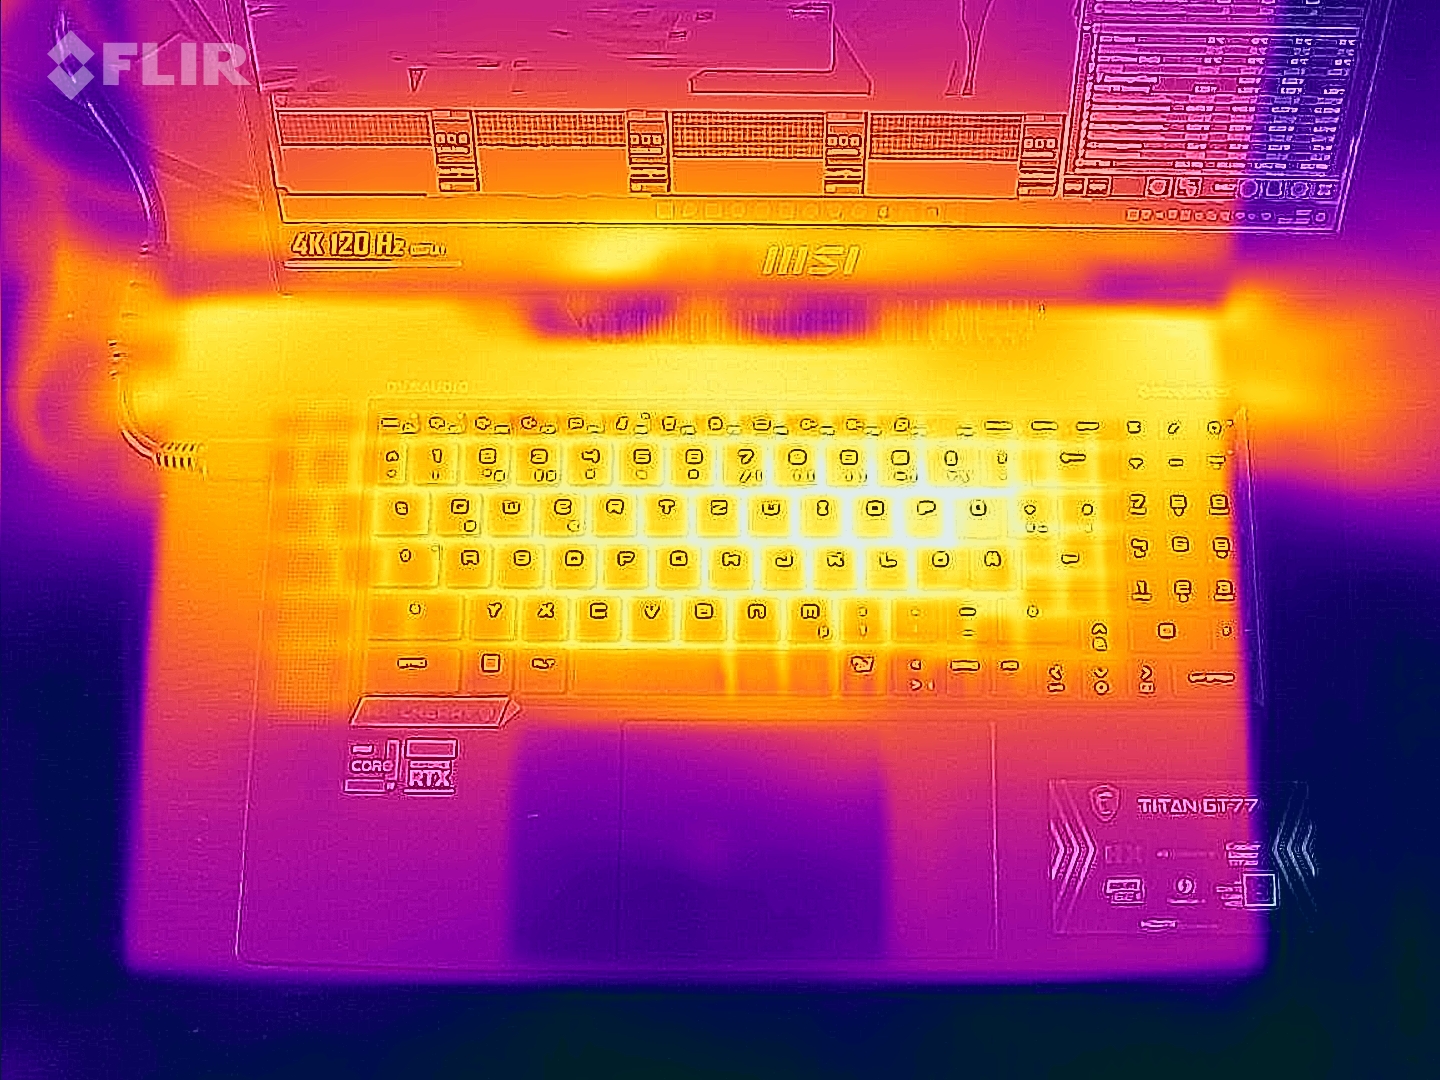
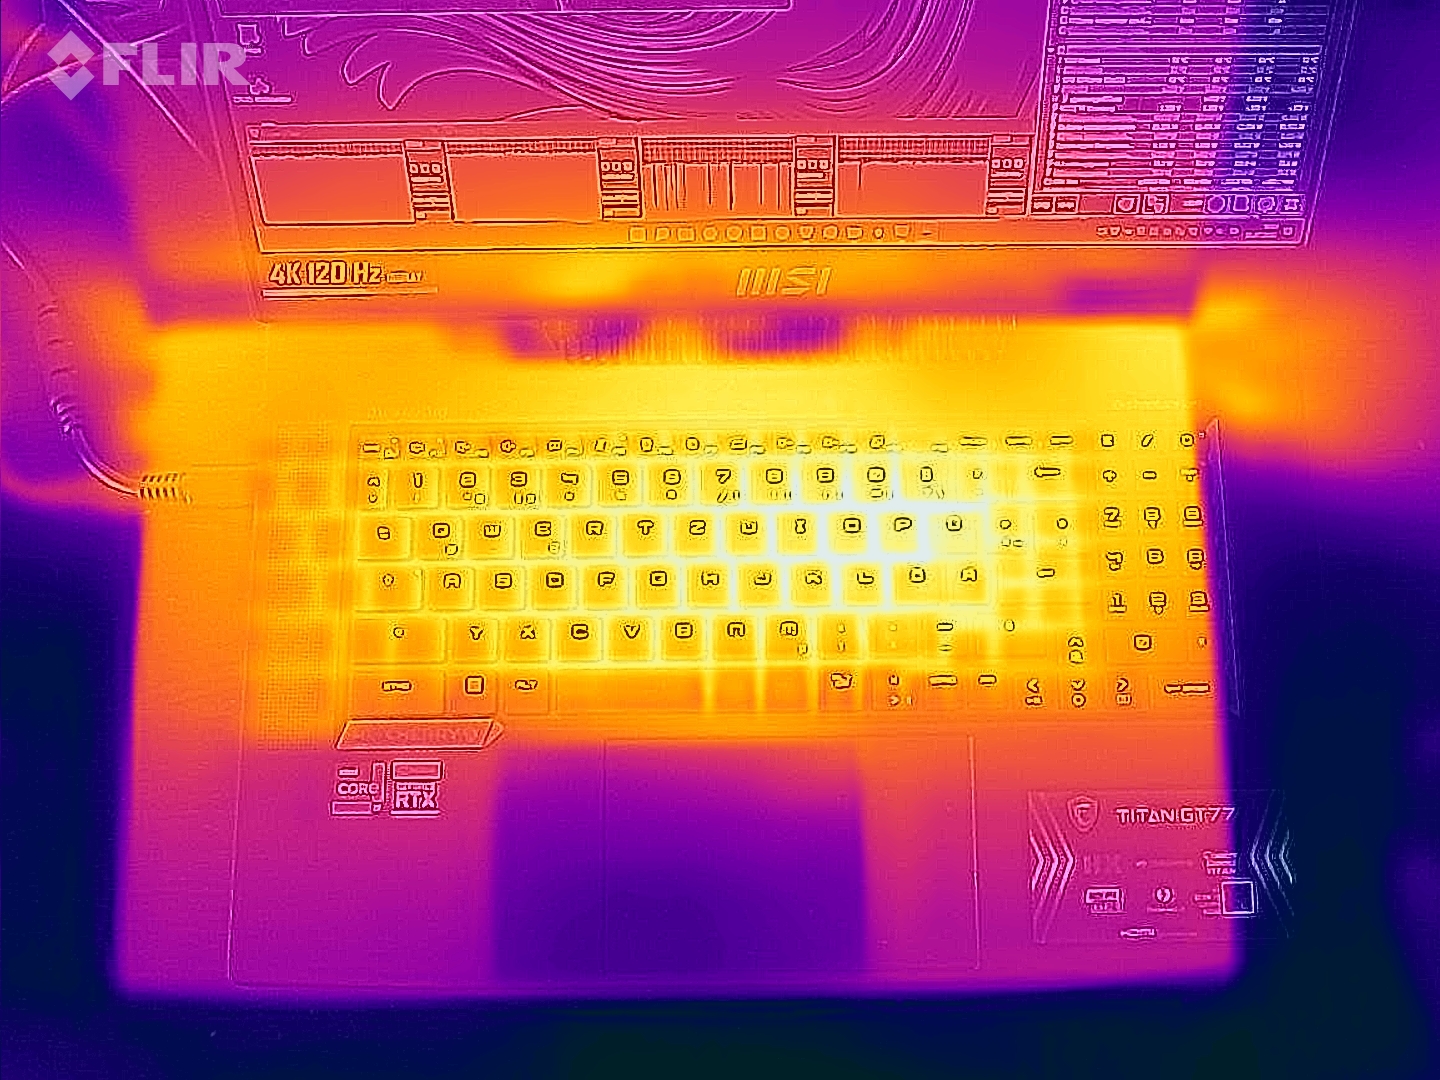
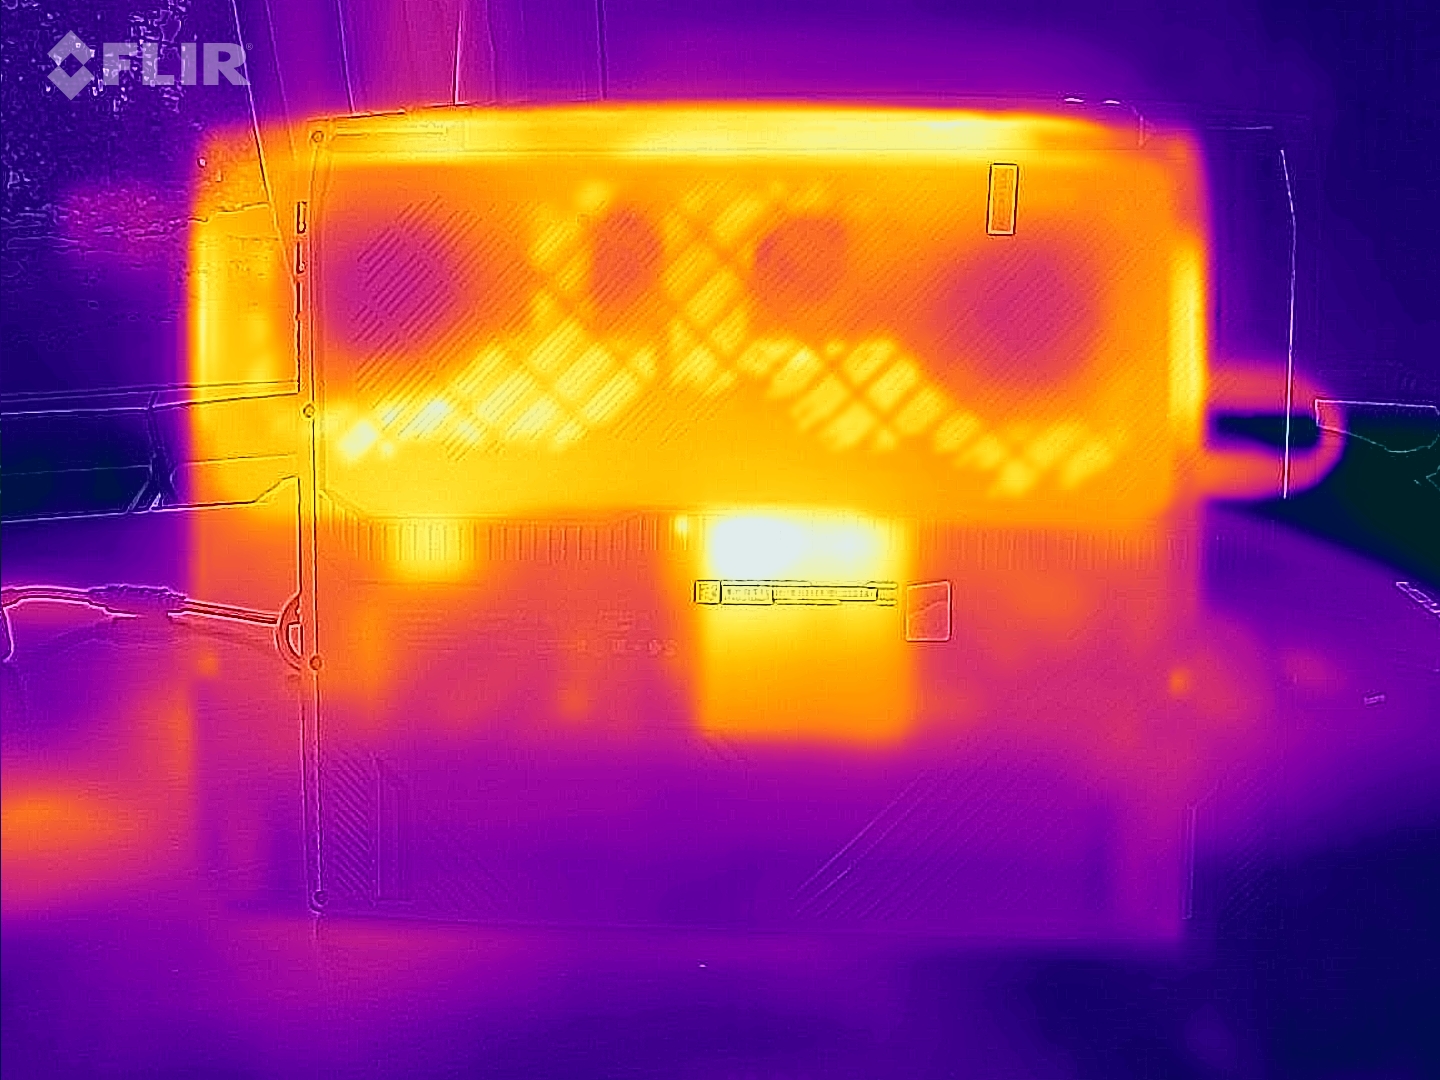
Temperatur
Im Alltagsbetrieb (Office, Internet) verbleiben die Gehäuse-Temperaturen in einem akzeptablen Bereich. Unter Last (Stresstest, Witcher-3-Test) erwärmt sich das Notebook deutlich, aber nicht übermäßig stark. Die CPU-Temperaturen geben keinen Anlass zur Sorge.
(-) Die maximale Temperatur auf der Oberseite ist 49 °C. Im Vergleich liegt der Klassendurchschnitt bei 40.4 °C (von 21.2 bis 68.8 °C für die Klasse Gaming v7).
(-) Auf der Unterseite messen wir eine maximalen Wert von 50 °C (im Vergleich zum Durchschnitt von 43.2 °C).
(±) Ohne Last messen wir eine durchschnittliche Temperatur von 33.2 °C auf der Oberseite. Der Klassendurchschnitt erreicht 33.8 °C.
(-) Beim längeren Spielen von The Witcher 3 erhitzt sich das Gerät durchschnittlich auf 48.1 °C. Der Durchschnitt der Klasse ist derzeit 33.8 °C.
(-) Die Handballen und der Touchpad-Bereich können sehr heiß werden mit maximal 43 °C.
(-) Die durchschnittliche Handballen-Temperatur anderer getesteter Geräte war 28.9 °C (-14.1 °C).
| MSI Titan GT77 12UHS 4k Intel Core i9-12900HX, NVIDIA GeForce RTX 3080 Ti Laptop GPU | Razer Blade 17 Early 2022 Intel Core i9-12900H, NVIDIA GeForce RTX 3080 Ti Laptop GPU | Alienware x17 R2 P48E Intel Core i9-12900HK, NVIDIA GeForce RTX 3080 Ti Laptop GPU | SCHENKER XMG Ultra 17 Rocket Lake Intel Core i9-11900K, NVIDIA GeForce RTX 3080 Laptop GPU | MSI Titan GT77 12UHS Intel Core i9-12900HX, NVIDIA GeForce RTX 3080 Ti Laptop GPU | |
|---|---|---|---|---|---|
| Hitze | -5% | 11% | 8% | 2% | |
| Last oben max * | 49 | 50 -2% | 49.6 -1% | 34 31% | 40.8 17% |
| Last unten max * | 50 | 56 -12% | 42.4 15% | 43 14% | 52.4 -5% |
| Idle oben max * | 34 | 36 -6% | 29.2 14% | 38 -12% | 34.6 -2% |
| Idle unten max * | 38 | 38 -0% | 32 16% | 39 -3% | 38.4 -1% |
* ... kleinere Werte sind besser
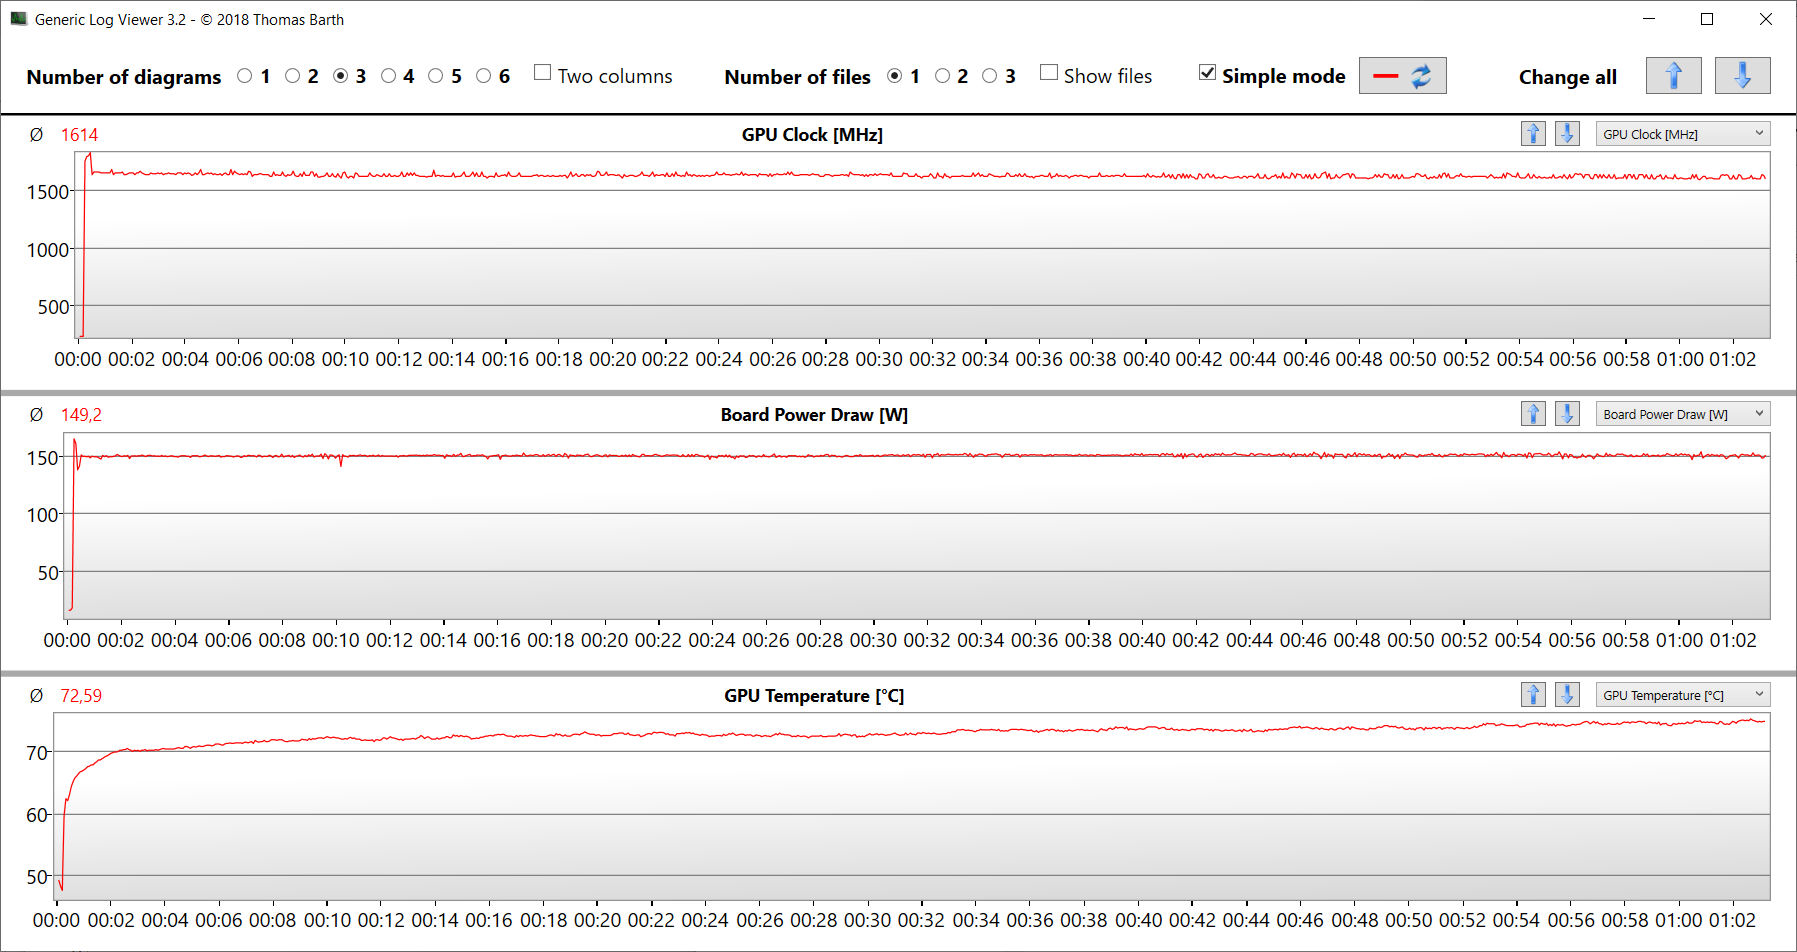
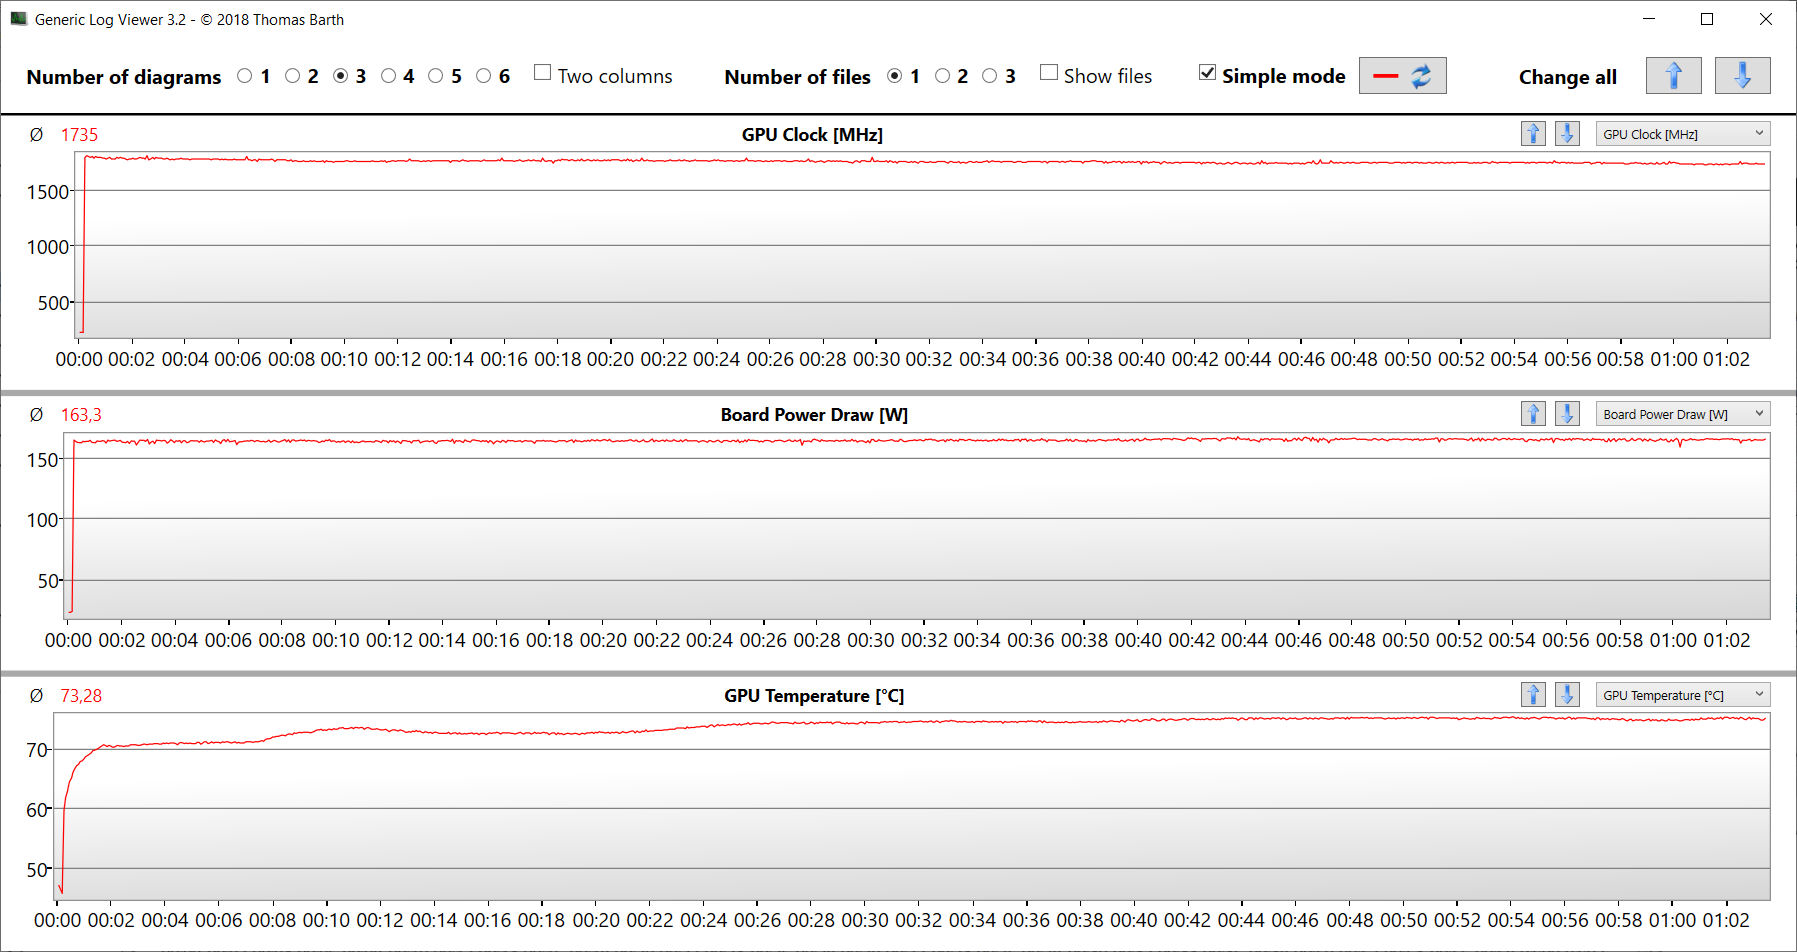
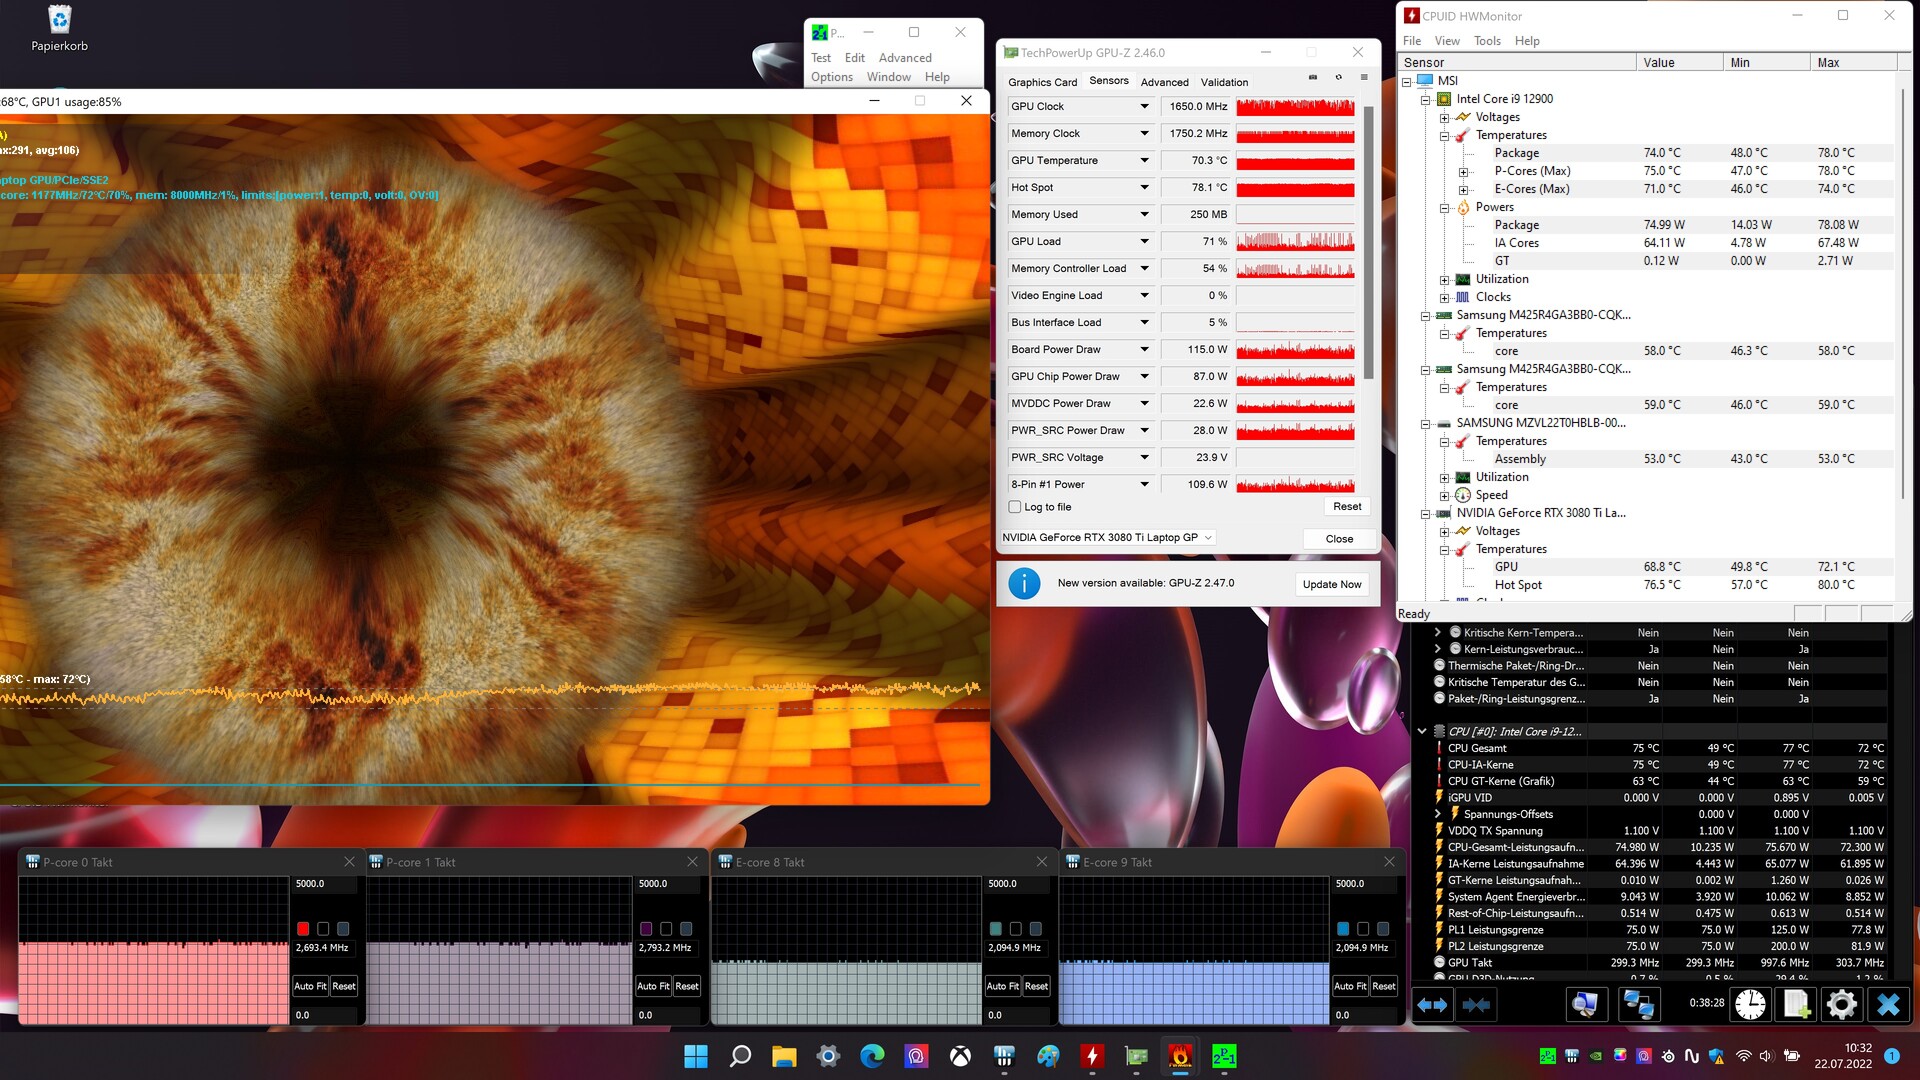
Stresstest
Die CPU durchläuft den Stresstest (Prime95 und Furmark laufen für mindestens eine Stunde) mit mittleren Arbeitsgeschwindigkeiten, die GPU erreicht durchaus ihren Maximaltakt. Der Stresstest stellt ein Extremszenario dar. Wir überprüfen mit diesem Test, ob das System bei voller Auslastung stabil läuft.
Lautsprecher
MSI Titan GT77 12UHS Audio Analyse
(+) | Die Lautsprecher können relativ laut spielen (91 dB)
Bass 100 - 315 Hz
(±) | abgesenkter Bass - 13.9% geringer als der Median
(±) | durchschnittlich lineare Bass-Wiedergabe (9.7% Delta zum Vorgänger)
Mitteltöne 400 - 2000 Hz
(+) | ausgeglichene Mitten, vom Median nur 4% abweichend
(+) | lineare Mitten (3.6% Delta zum Vorgänger)
Hochtöne 2 - 16 kHz
(+) | ausgeglichene Hochtöne, vom Median nur 1.8% abweichend
(+) | sehr lineare Hochtöne (3.9% Delta zum Vorgänger)
Gesamt im hörbaren Bereich 100 - 16.000 Hz
(+) | hörbarer Bereich ist sehr linear (11.4% Abstand zum Median
Im Vergleich zu allen Geräten derselben Klasse
» 8% aller getesteten Geräte dieser Klasse waren besser, 3% vergleichbar, 89% schlechter
» Das beste Gerät hat einen Delta-Wert von 6%, durchschnittlich ist 18%, das schlechteste Gerät hat 132%
Im Vergleich zu allen Geräten im Test
» 5% aller getesteten Geräte waren besser, 2% vergleichbar, 93% schlechter
» Das beste Gerät hat einen Delta-Wert von 4%, durchschnittlich ist 25%, das schlechteste Gerät hat 134%
Alienware x17 R2 P48E Audio Analyse
(+) | Die Lautsprecher können relativ laut spielen (84.3 dB)
Bass 100 - 315 Hz
(±) | abgesenkter Bass - 9.7% geringer als der Median
(+) | lineare Bass-Wiedergabe (5.5% Delta zum Vorgänger)
Mitteltöne 400 - 2000 Hz
(+) | ausgeglichene Mitten, vom Median nur 1.6% abweichend
(+) | lineare Mitten (3% Delta zum Vorgänger)
Hochtöne 2 - 16 kHz
(±) | zu hohe Hochtöne, vom Median nur 5% abweichend
(±) | durchschnittlich lineare Hochtöne (7.6% Delta zum Vorgänger)
Gesamt im hörbaren Bereich 100 - 16.000 Hz
(+) | hörbarer Bereich ist sehr linear (9.3% Abstand zum Median
Im Vergleich zu allen Geräten derselben Klasse
» 2% aller getesteten Geräte dieser Klasse waren besser, 2% vergleichbar, 96% schlechter
» Das beste Gerät hat einen Delta-Wert von 6%, durchschnittlich ist 18%, das schlechteste Gerät hat 132%
Im Vergleich zu allen Geräten im Test
» 2% aller getesteten Geräte waren besser, 1% vergleichbar, 97% schlechter
» Das beste Gerät hat einen Delta-Wert von 4%, durchschnittlich ist 25%, das schlechteste Gerät hat 134%
Energieverwaltung - MSI Rechner liefert ordentliche Akkulaufzeiten
Energieaufnahme
Der Energiebedarf bewegt sich auf einem normalen Niveau für die hier verbaute Hardware. Witcher-3-Test bzw. Stresstest bzw. lassen die Leistungsaufnahme auf durchschnittlich 236 Watt bzw. bis auf 309 Watt steigen. Beide Tests werden mit konstanter Energieaufnahme durchlaufen. Das mitgelieferte Netzteil (330 Watt) ist ausreichend dimensioniert.
Hinweis: Das FHD-Schwestermodell wurde bei aktivem dGPU-Modus getestet. Somit erklärt sich der höhere Bedarf im Leerlauf.
| Aus / Standby | |
| Idle | |
| Last |
|
Legende:
min: Derzeit nutzen wir das Metrahit Energy, ein professionelles TRMS Leistungs-Multimeter und PQ Analysator, für unsere Messungen. Mehr Details zu dem Messgerät finden Sie hier. Alle unsere Testmethoden beschreiben wir in diesem Artikel. | |
| MSI Titan GT77 12UHS i9-12900HX, GeForce RTX 3080 Ti Laptop GPU | Razer Blade 17 Early 2022 i9-12900H, GeForce RTX 3080 Ti Laptop GPU | Alienware x17 R2 P48E i9-12900HK, GeForce RTX 3080 Ti Laptop GPU | SCHENKER XMG Ultra 17 Rocket Lake i9-11900K, GeForce RTX 3080 Laptop GPU | MSI Titan GT77 12UHS i9-12900HX, GeForce RTX 3080 Ti Laptop GPU | Durchschnittliche NVIDIA GeForce RTX 3080 Ti Laptop GPU | Durchschnitt der Klasse Gaming | |
|---|---|---|---|---|---|---|---|
| Stromverbrauch | -7% | -44% | -146% | -41% | -10% | 6% | |
| Idle min * | 12 | 17 -42% | 24.1 -101% | 62 -417% | 30.21 -152% | 17.2 ? -43% | 13.8 ? -15% |
| Idle avg * | 18 | 23 -28% | 28.5 -58% | 64 -256% | 32.42 -80% | 23.3 ? -29% | 19.2 ? -7% |
| Idle max * | 30 | 34 -13% | 60 -100% | 69 -130% | 33.7 -12% | 30.8 ? -3% | 27 ? 10% |
| Last avg * | 141 | 120 15% | 128.7 9% | 183 -30% | 125.09 11% | 121.2 ? 14% | 111.3 ? 21% |
| Witcher 3 ultra * | 236 | 229 3% | 254 -8% | 297 -26% | 256 -8% | ||
| Last max * | 309 | 243 21% | 323 -5% | 368 -19% | 321.88 -4% | 276 ? 11% | 251 ? 19% |
* ... kleinere Werte sind besser
Energieaufnahme Witcher 3 / Stresstest
Energieaufnahme mit externem Monitor
Akkulaufzeit
Der 17,3-Zöller erreicht im WLAN-Test (Aufruf von Webseiten mittels eines Skripts) bzw. Videotest (Kurzfilm Big Buck Bunny (H.264-Kodierung, FHD) in einer Schleife) Laufzeiten von 5:52 h bzw. 6:50 h. Das FHD-Schwestermodell erreicht aufgrund der niedrigeren Bildschirmauflösung etwas längere Laufzeiten.
| MSI Titan GT77 12UHS 4k i9-12900HX, GeForce RTX 3080 Ti Laptop GPU, 99.99 Wh | Razer Blade 17 Early 2022 i9-12900H, GeForce RTX 3080 Ti Laptop GPU, 82 Wh | Alienware x17 R2 P48E i9-12900HK, GeForce RTX 3080 Ti Laptop GPU, 87 Wh | SCHENKER XMG Ultra 17 Rocket Lake i9-11900K, GeForce RTX 3080 Laptop GPU, 97 Wh | MSI Titan GT77 12UHS i9-12900HX, GeForce RTX 3080 Ti Laptop GPU, 99.9 Wh | Durchschnitt der Klasse Gaming | |
|---|---|---|---|---|---|---|
| Akkulaufzeit | -15% | -56% | -58% | 5% | 2% | |
| Idle | 490 | 428 -13% | 234 -52% | 182 -63% | 542 ? 11% | |
| H.264 | 410 | 290 -29% | 115 -72% | 433 6% | 397 ? -3% | |
| WLAN | 352 | 229 -35% | 117 -67% | 110 -69% | 412.1 17% | 368 ? 5% |
| Last | 89 | 103 16% | 46 -48% | 66 -26% | 82 -8% | 84.1 ? -6% |
| Witcher 3 ultra | 90 | 80.6 ? |
Pro
Contra
Fazit - Noch besser mit 4k-Bildschirm
MSI liefert mit dem Titan GT77 ein DTR-Notebook, das zur aktuellen Leistungsspitze zählt. Es ist für rechenintensive und speicherplatzfordernde Anwendungsszenarien gemacht - beispielsweise Rendering und Gaming.
Das MSI Titan GT77 12UHS - eines der aktuell leistungsstärksten Notebooks.
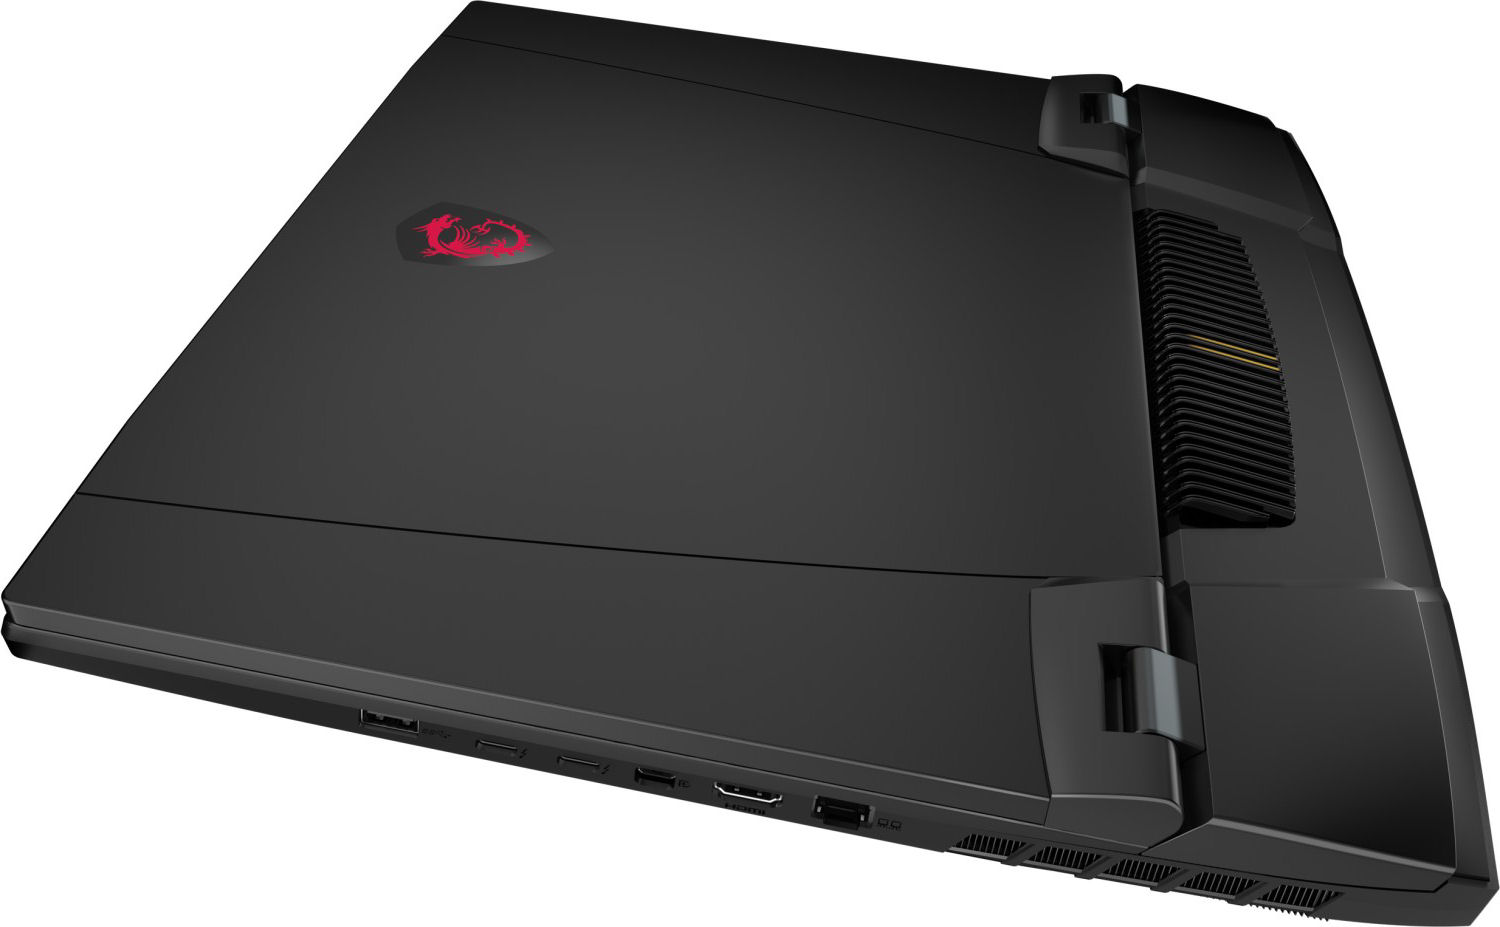
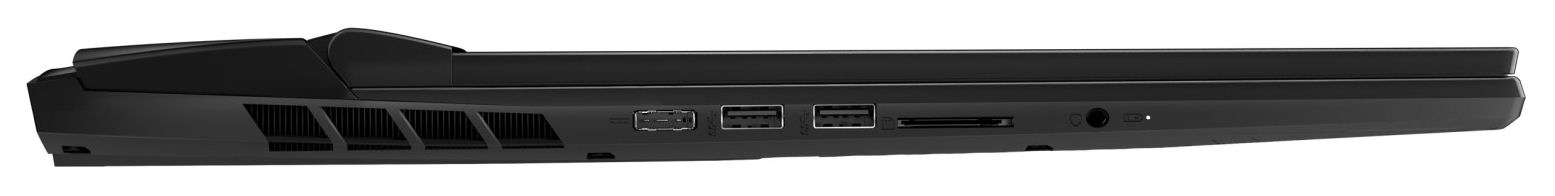
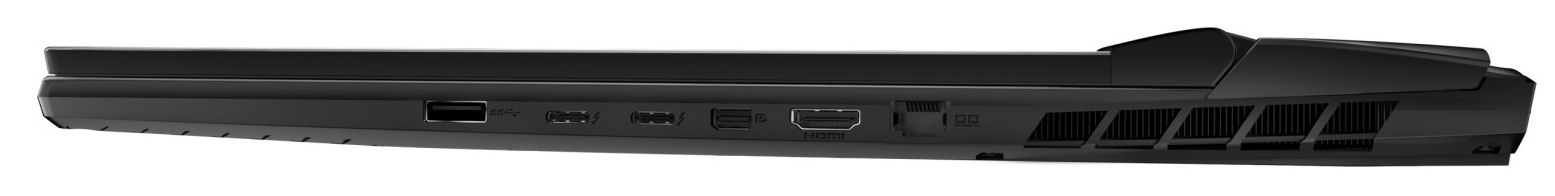
Core i9-12900HX und GeForce RTX 3080 Ti Laptop (175 Watt TGP, 16 GB VRAM) können mit konstant hohen Taktraten arbeiten. Lärm- und Wärmeentwicklung bewegen sich auf klassenüblich hohem Niveau. Zwei Thunderbolt-4-Ports eröffnen Erweiterungsmöglichkeiten (externe GPU, Dockinglösung). Dazu gesellen sich eine gelungene mechanische Tastatur und sehr ordentliche Akkulaufzeiten. Soweit gleicht die vorliegende Variante des Titan dem bereits getesteten Schwestermodell.
Die beiden Titan-Modelle unterschieden sich primär bezüglich der Displays: Das im aktuellen Testgerät verbaute 4k-Panel (120 Hz) ist seinem FHD-Pendant (360 Hz) in Sachen Auflösung, Maximalhelligkeit und Farbraumabdeckung (DCI-P3 nahezu 100 %) überlegen. Es stellt somit die erste Wahl dar, wenn es auf Farbtreue ankommt. Das FHD-Display bietet eine sehr hohe Bildwiederholrate und dürfte daher viele Gamer erfreuen. Leider liefern beide Bildschirme zu geringe Kontraste.
Das Alienware x17 R2 wäre eine leistungsmäßig ebenbürtige Alternative zum Titan. Es bietet allerdings weniger Erweiterungsmöglichkeiten und liefert schlechtere Akkulaufzeiten.
Preis und Verfügbarkeit
Das MSI Titan GT77 12UHS ist in der von uns getesteten Ausstattung (Core i9-12900HX, GeForce RTX 3080 Ti Laptop, 64 GB RAM, 2 TB SSD, 4k-Display) zu einem Preis von etwa 5.600 Euro bei Notebooksbilliger.de und Cyberport.de zu bekommen.
MSI Titan GT77 12UHS
-
28.08.2022 v7
Sascha Mölck


Preisvergleich
