 Deutsch
 English
 Español
 Français
 Italiano
 Nederlands
 Polski
 Português
 Русский
 Türkçe
 Svenska
 Chinese
 Magyar
Palit GeForce RTX 4090 GameRock OC Desktop-GPU im Test: High-End-Leistung zum High-End-Preis

Nvidias neues Topmodell trägt nun den Namen GeForce RTX 4090 und bringt wie zuvor satte 24-GB-VRAM mit. Damit verfestigt sich diese Größe immer mehr als Standard im High-End-Bereich der Consumer-Grafikkarten, denn auch AMDs frisch vorgestellte Radeon RX 7900 XTX zieht hier nach und bekommt ebenfalls 24-GB-VRAM verpasst.
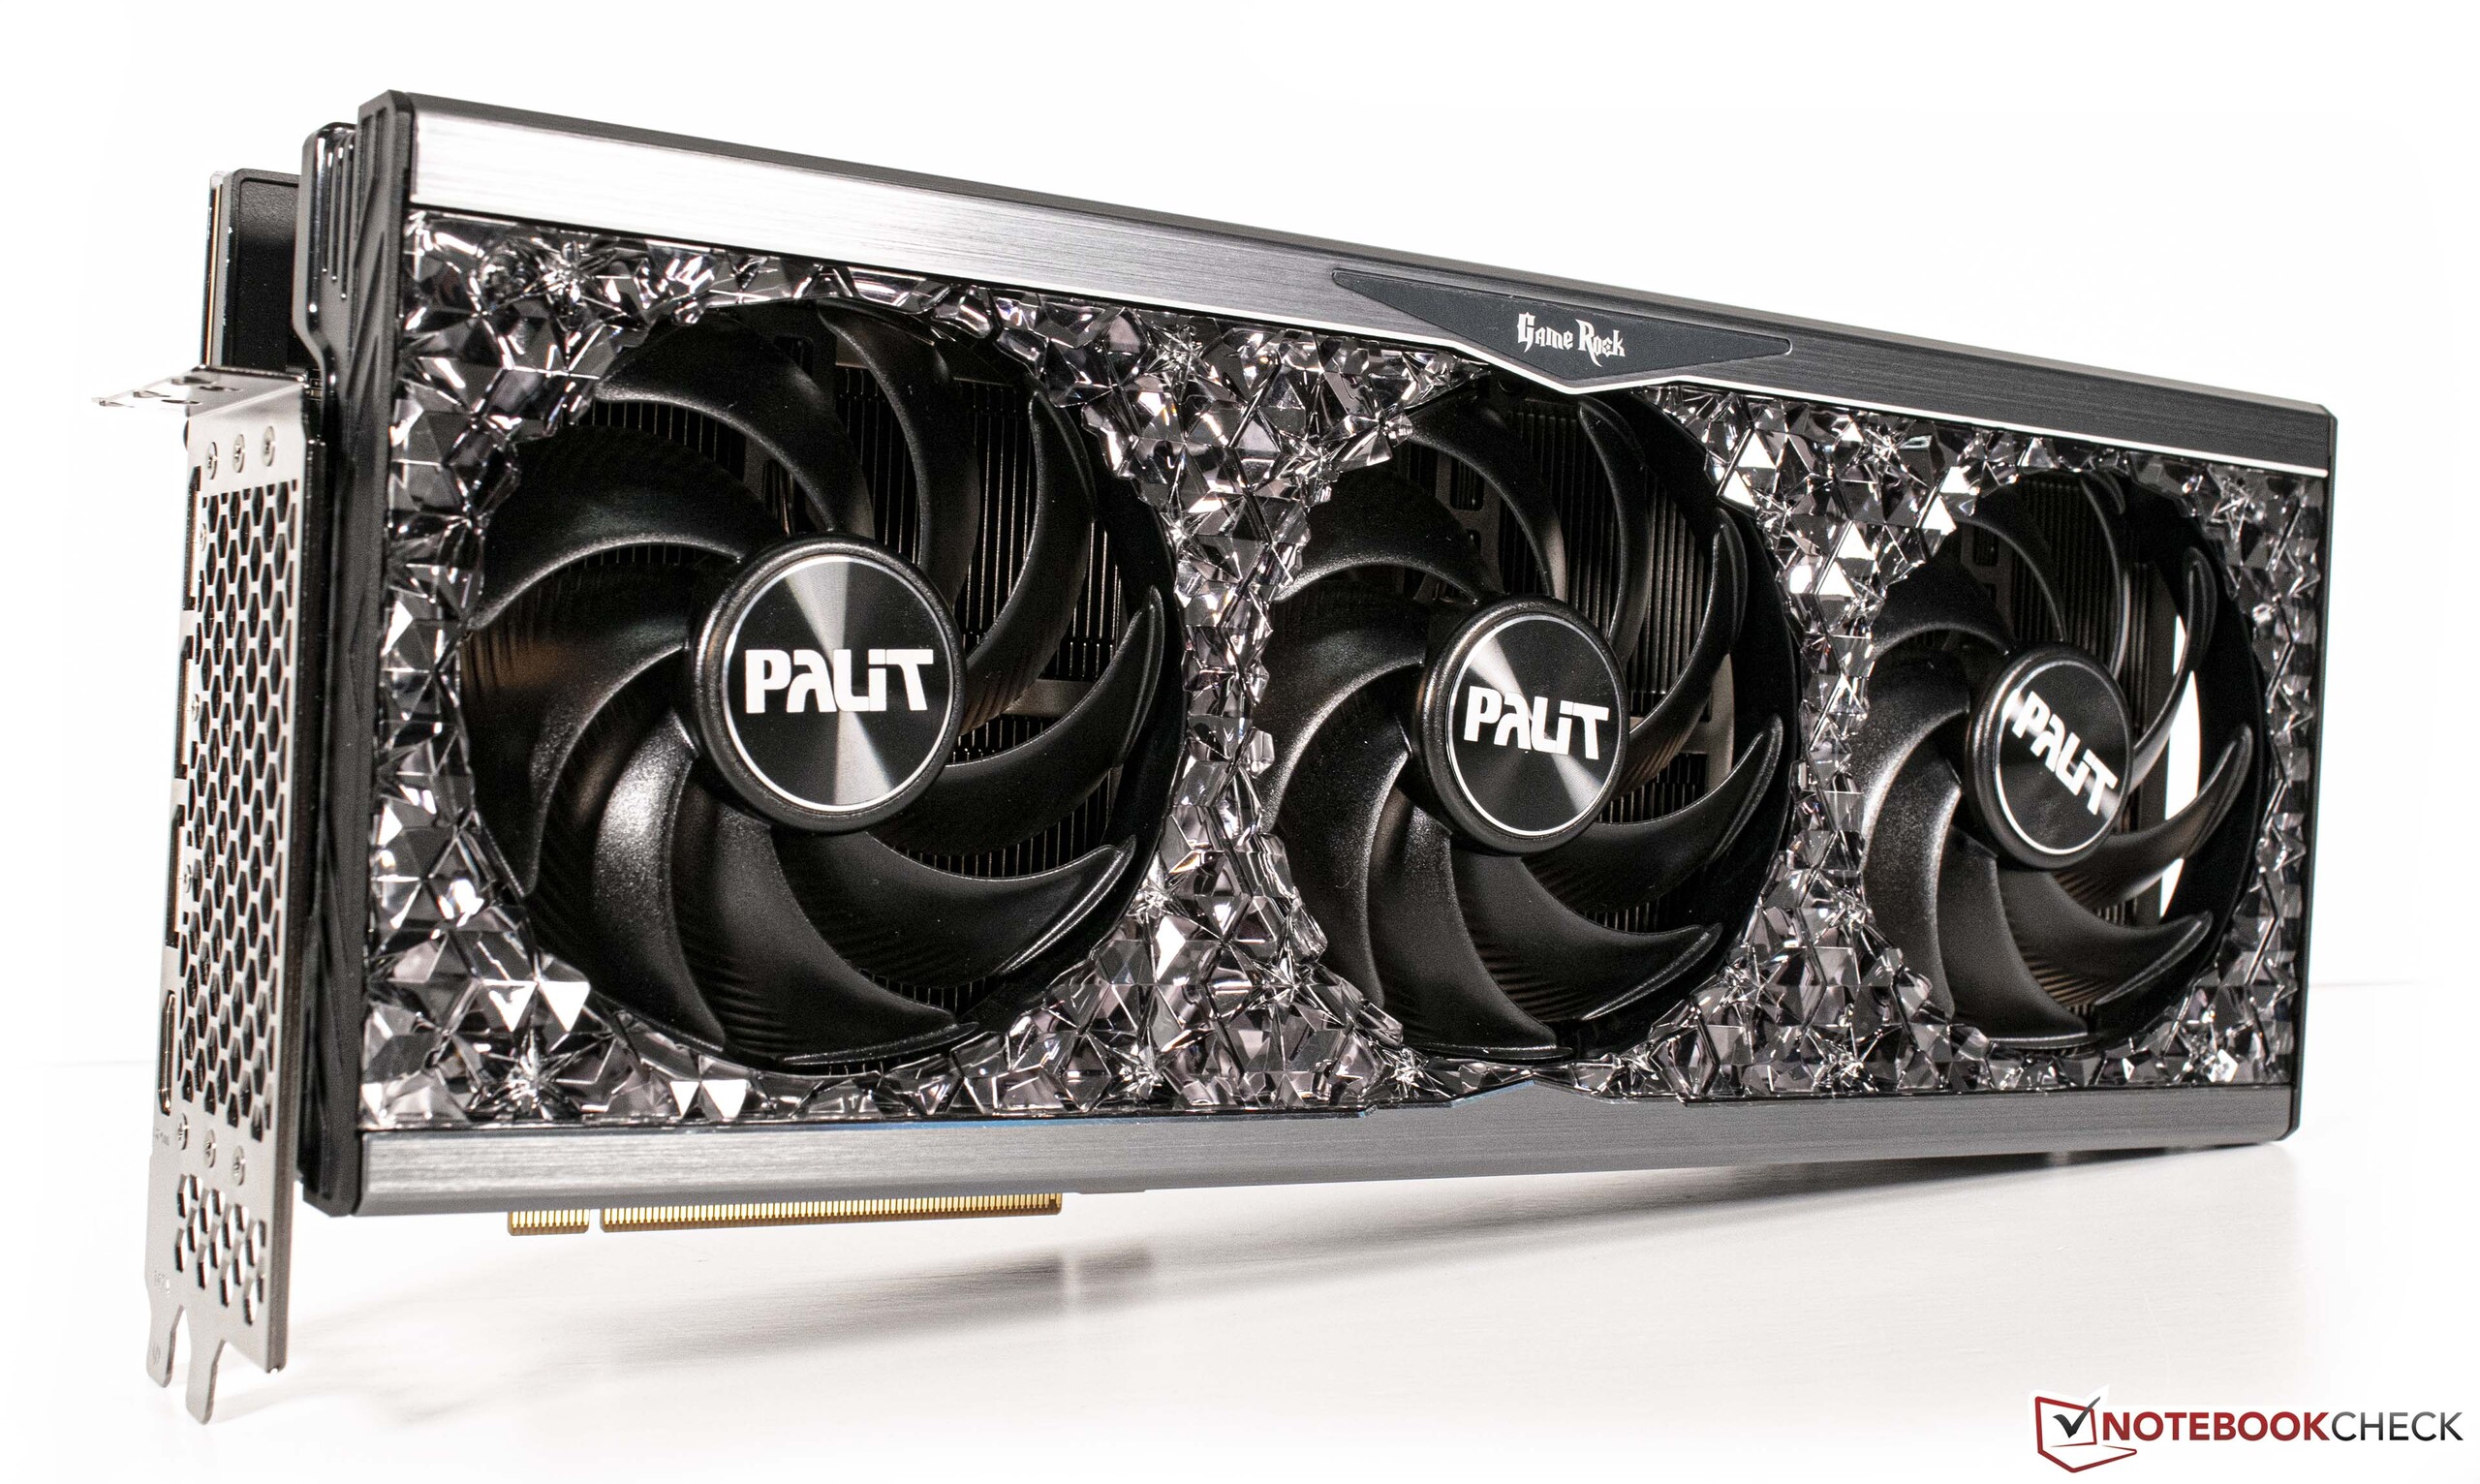
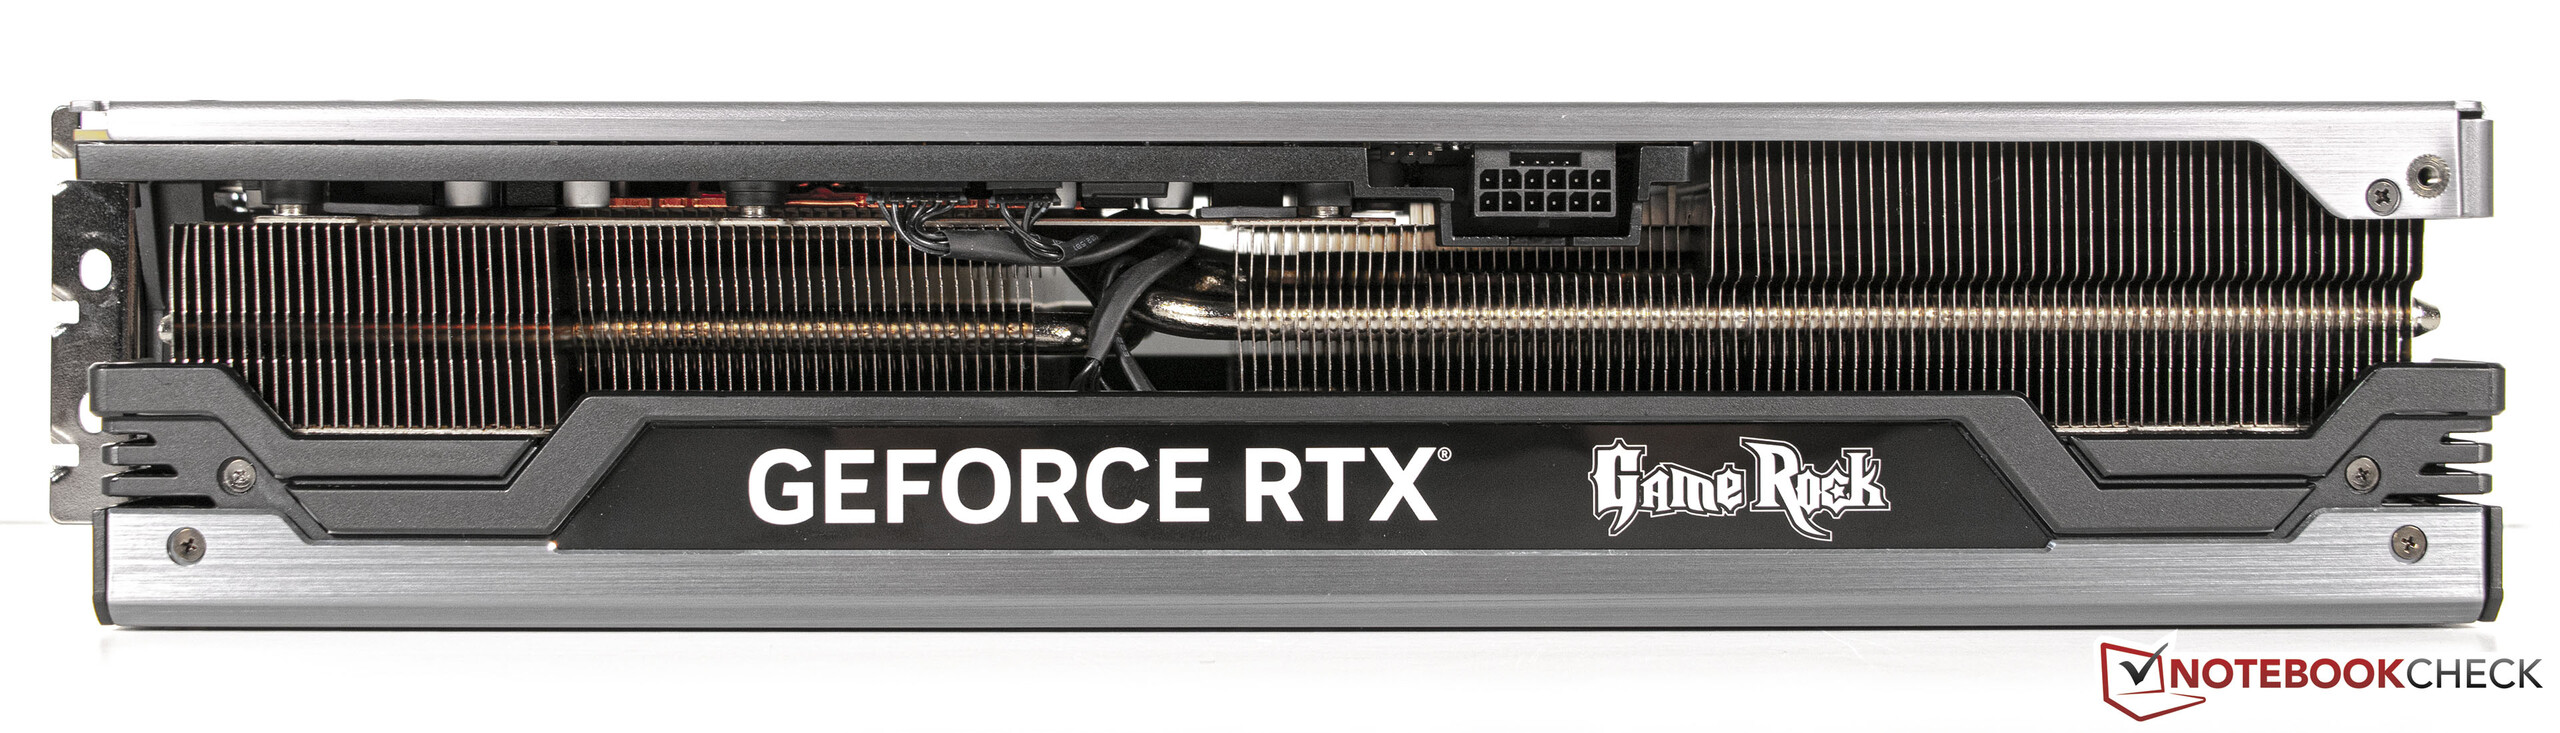
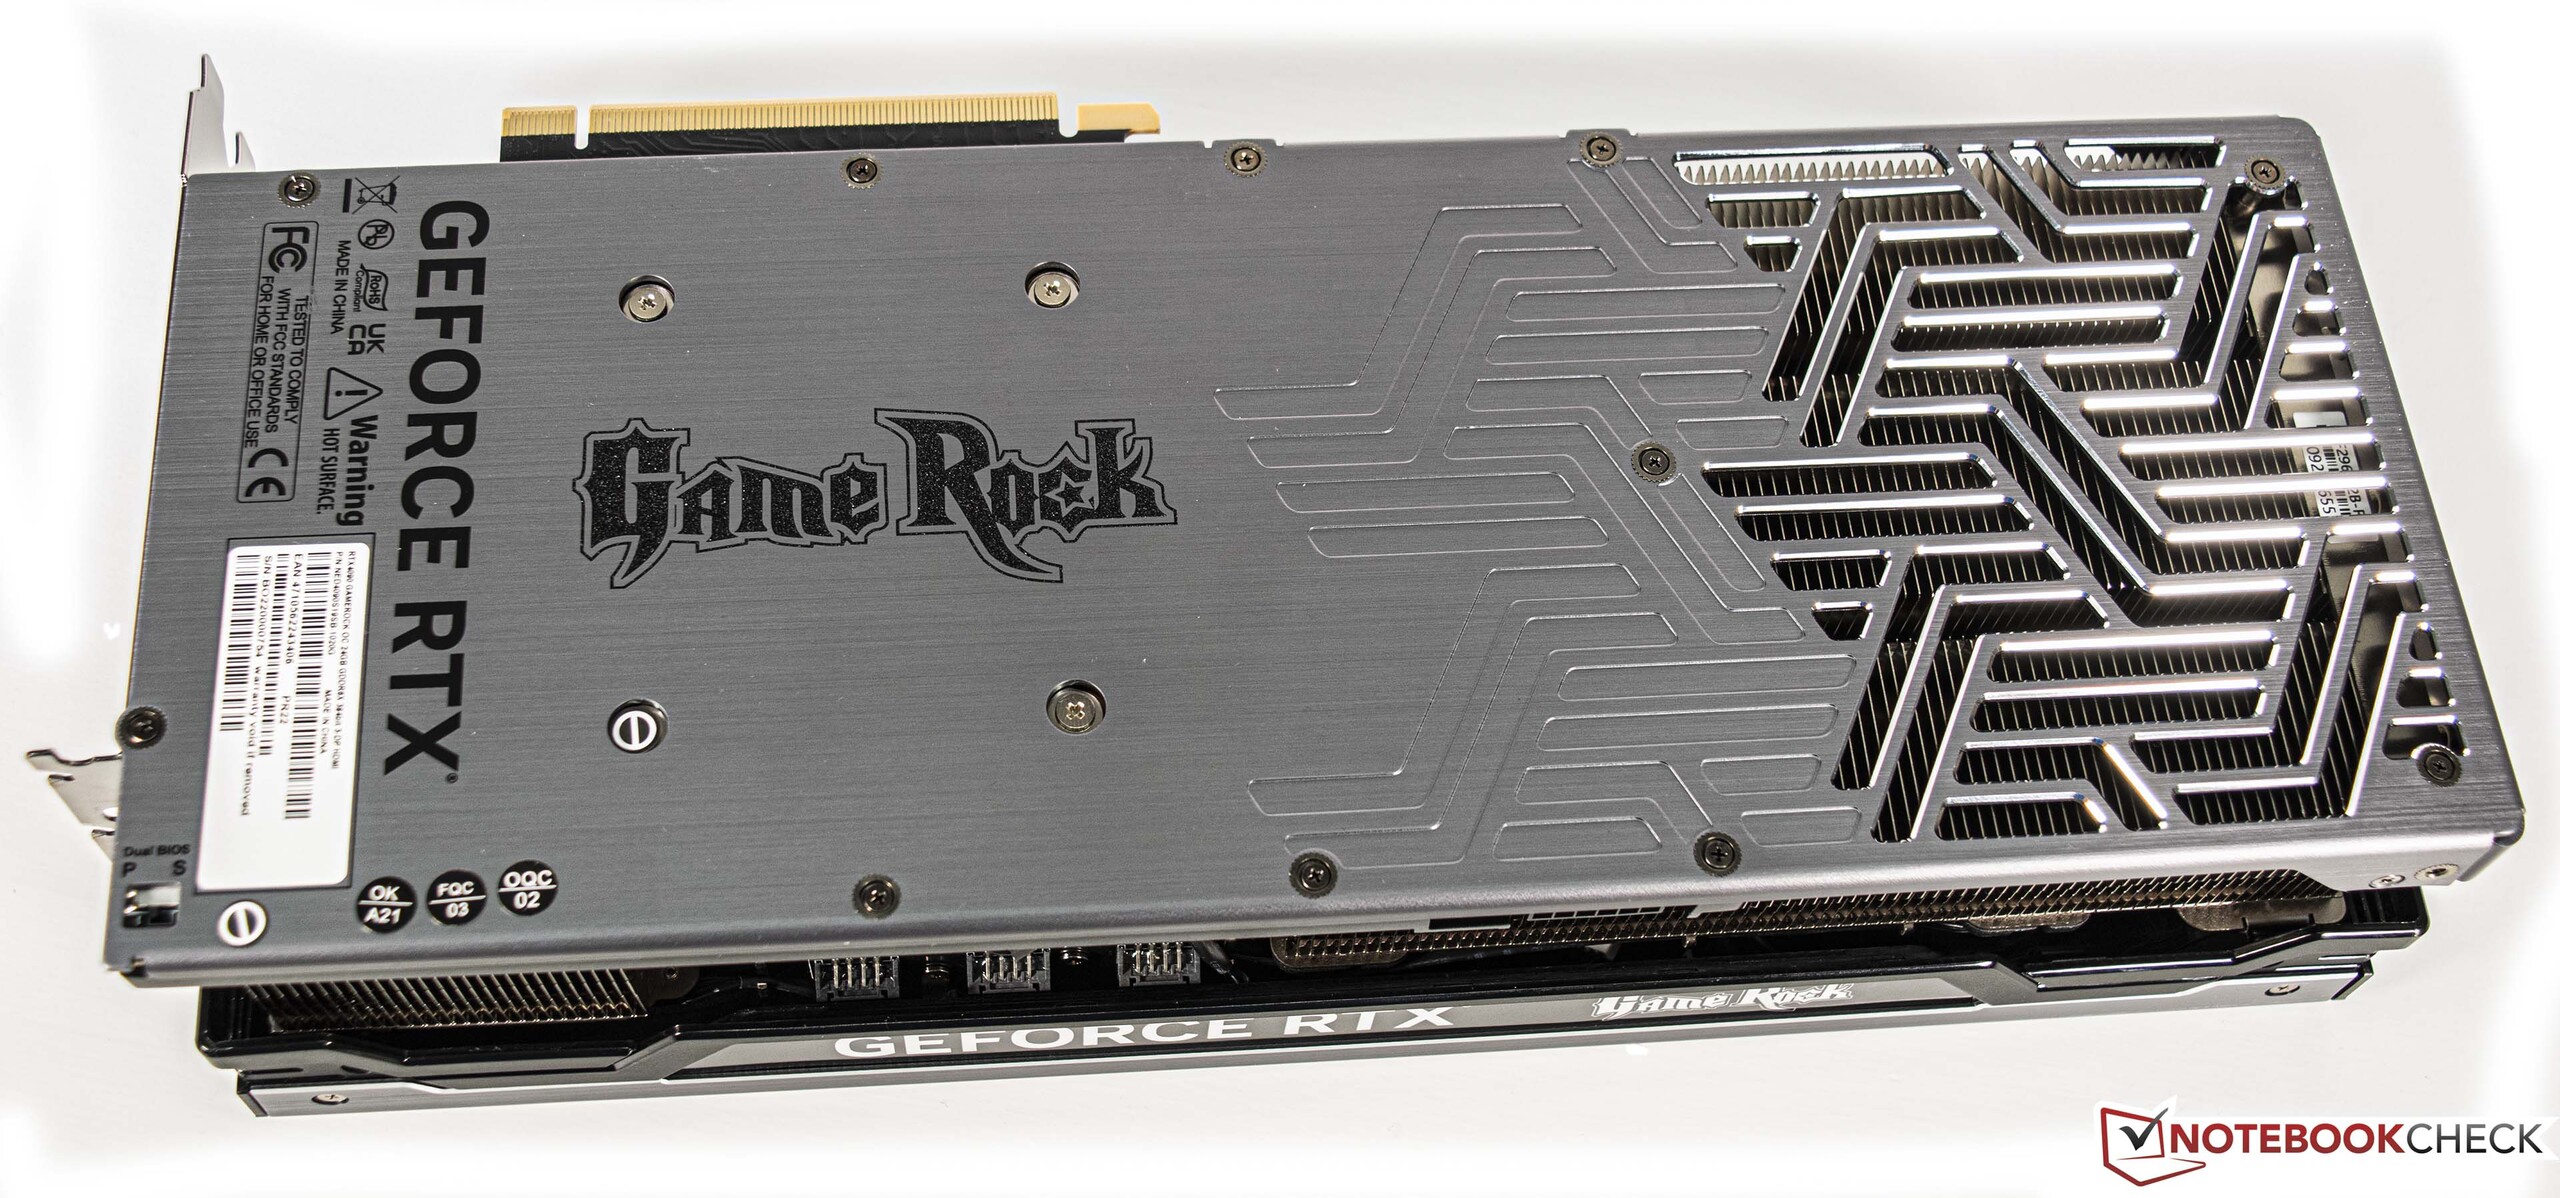
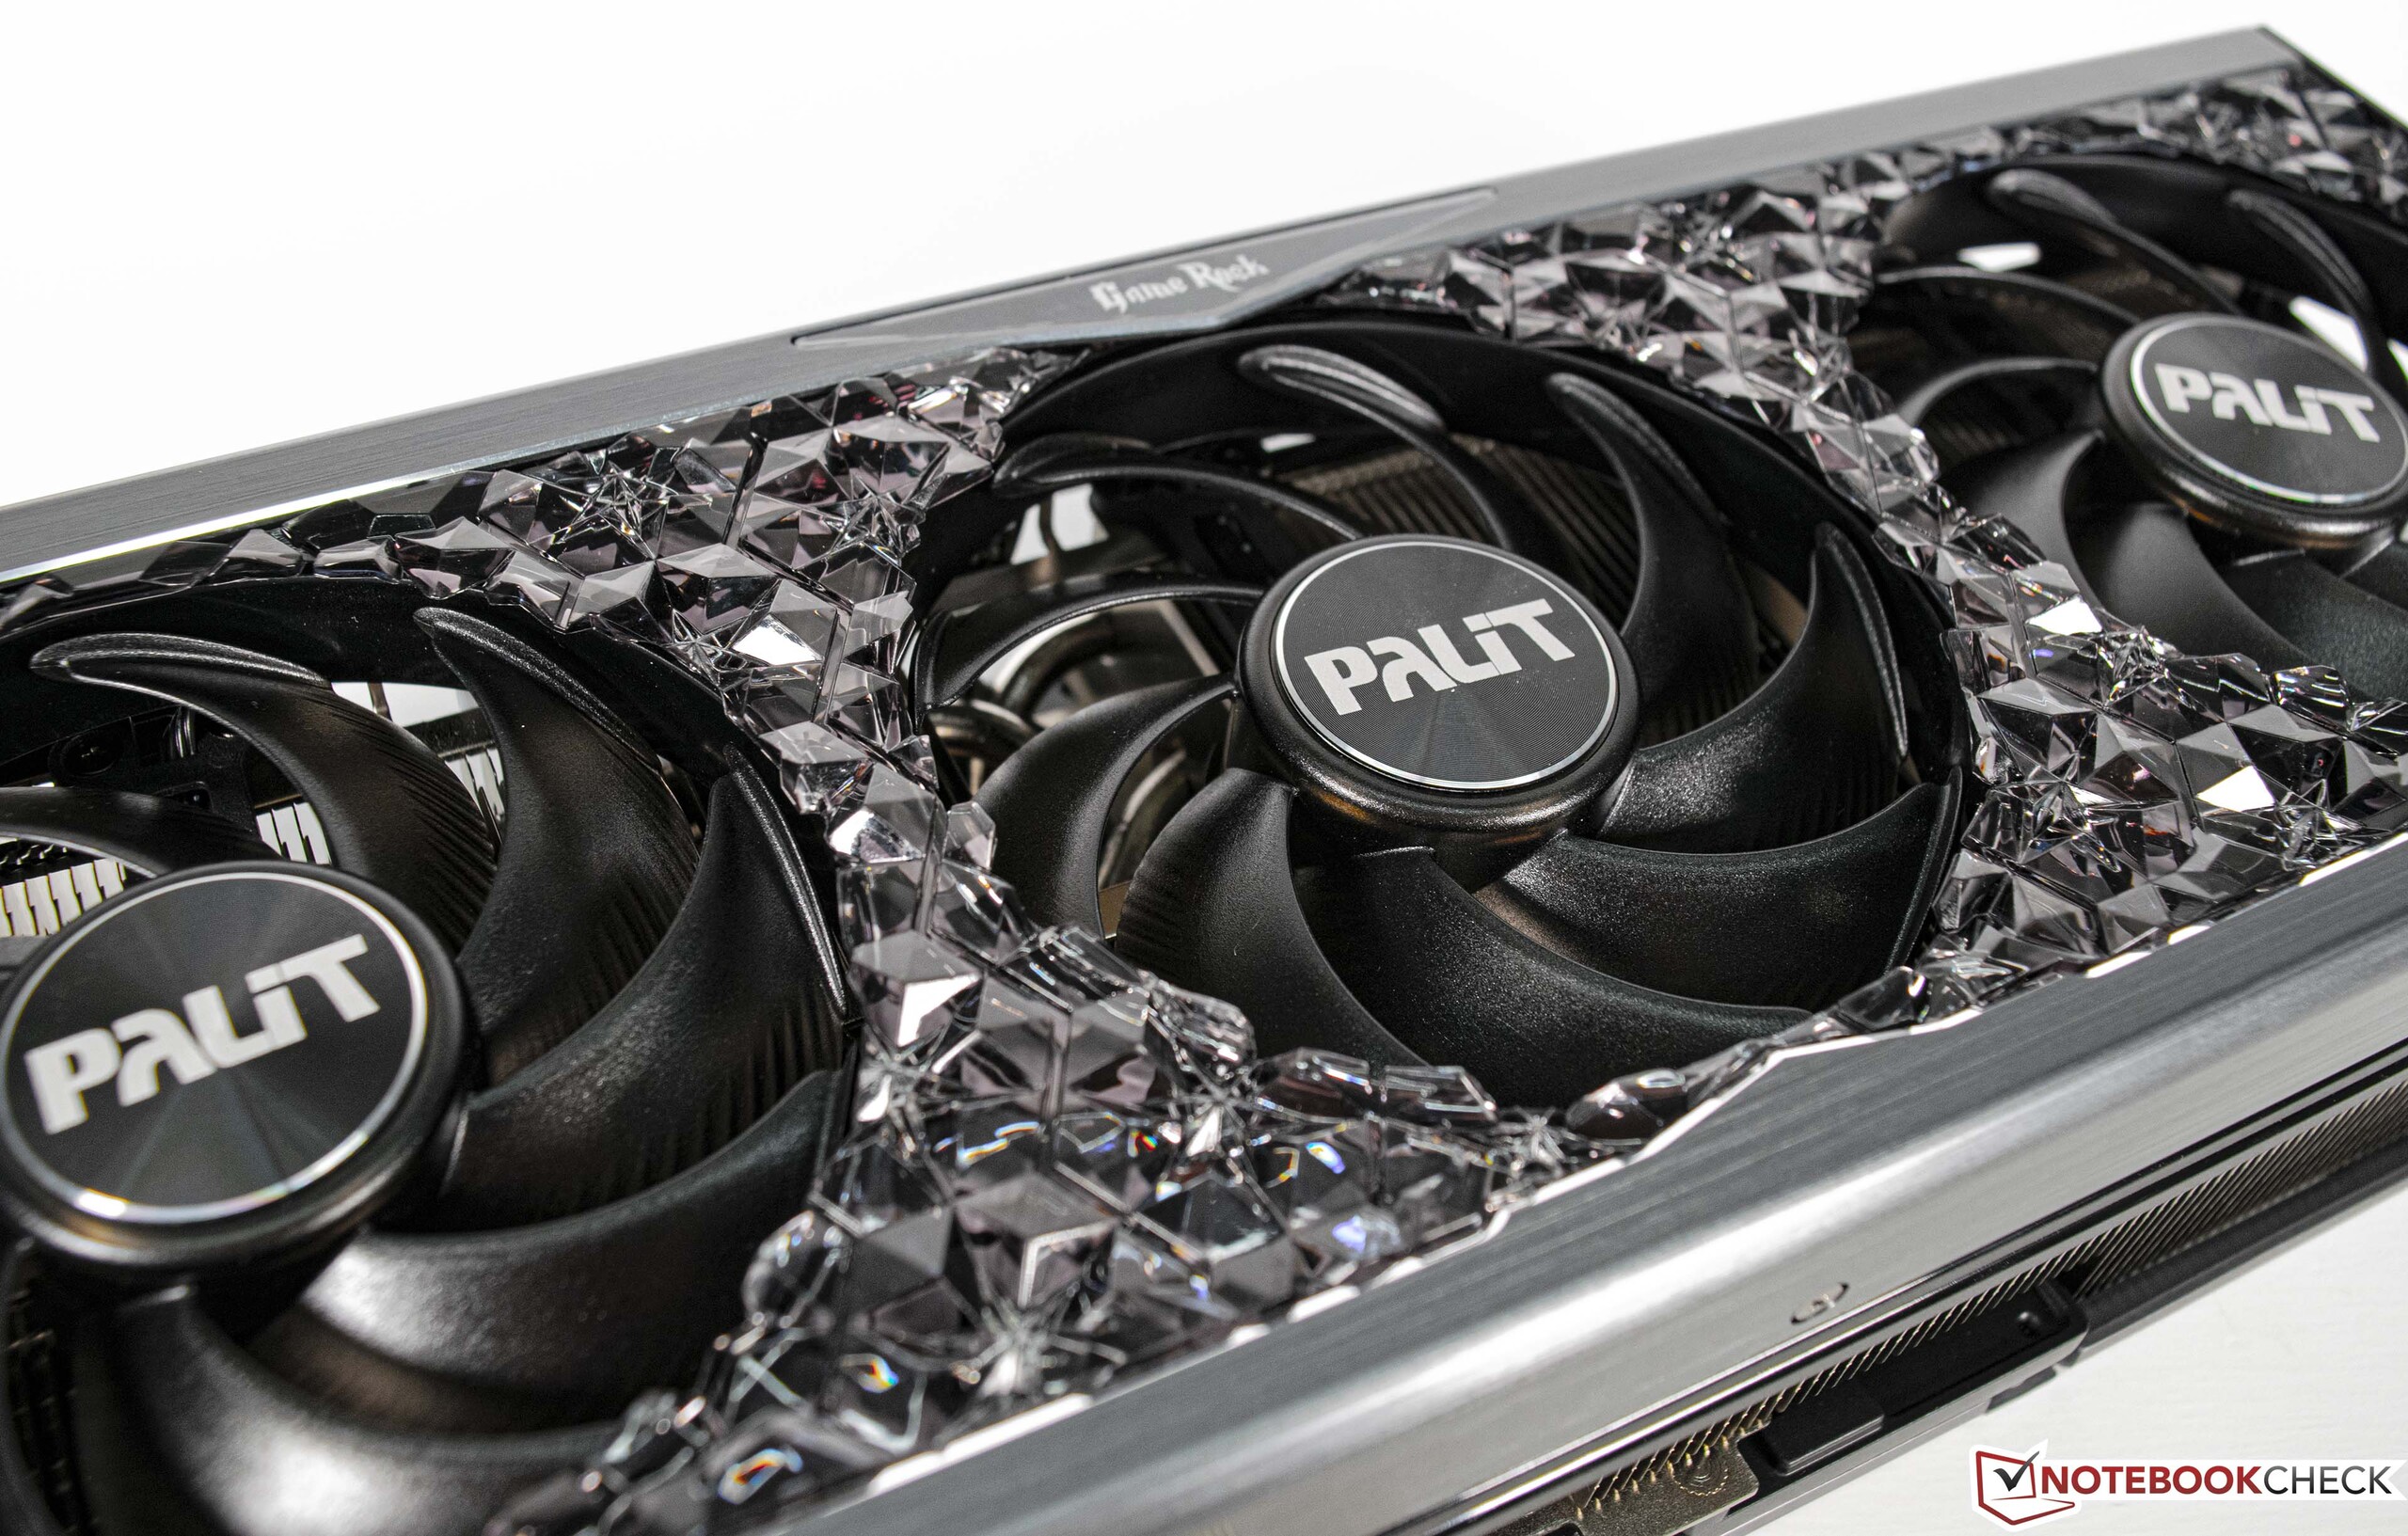
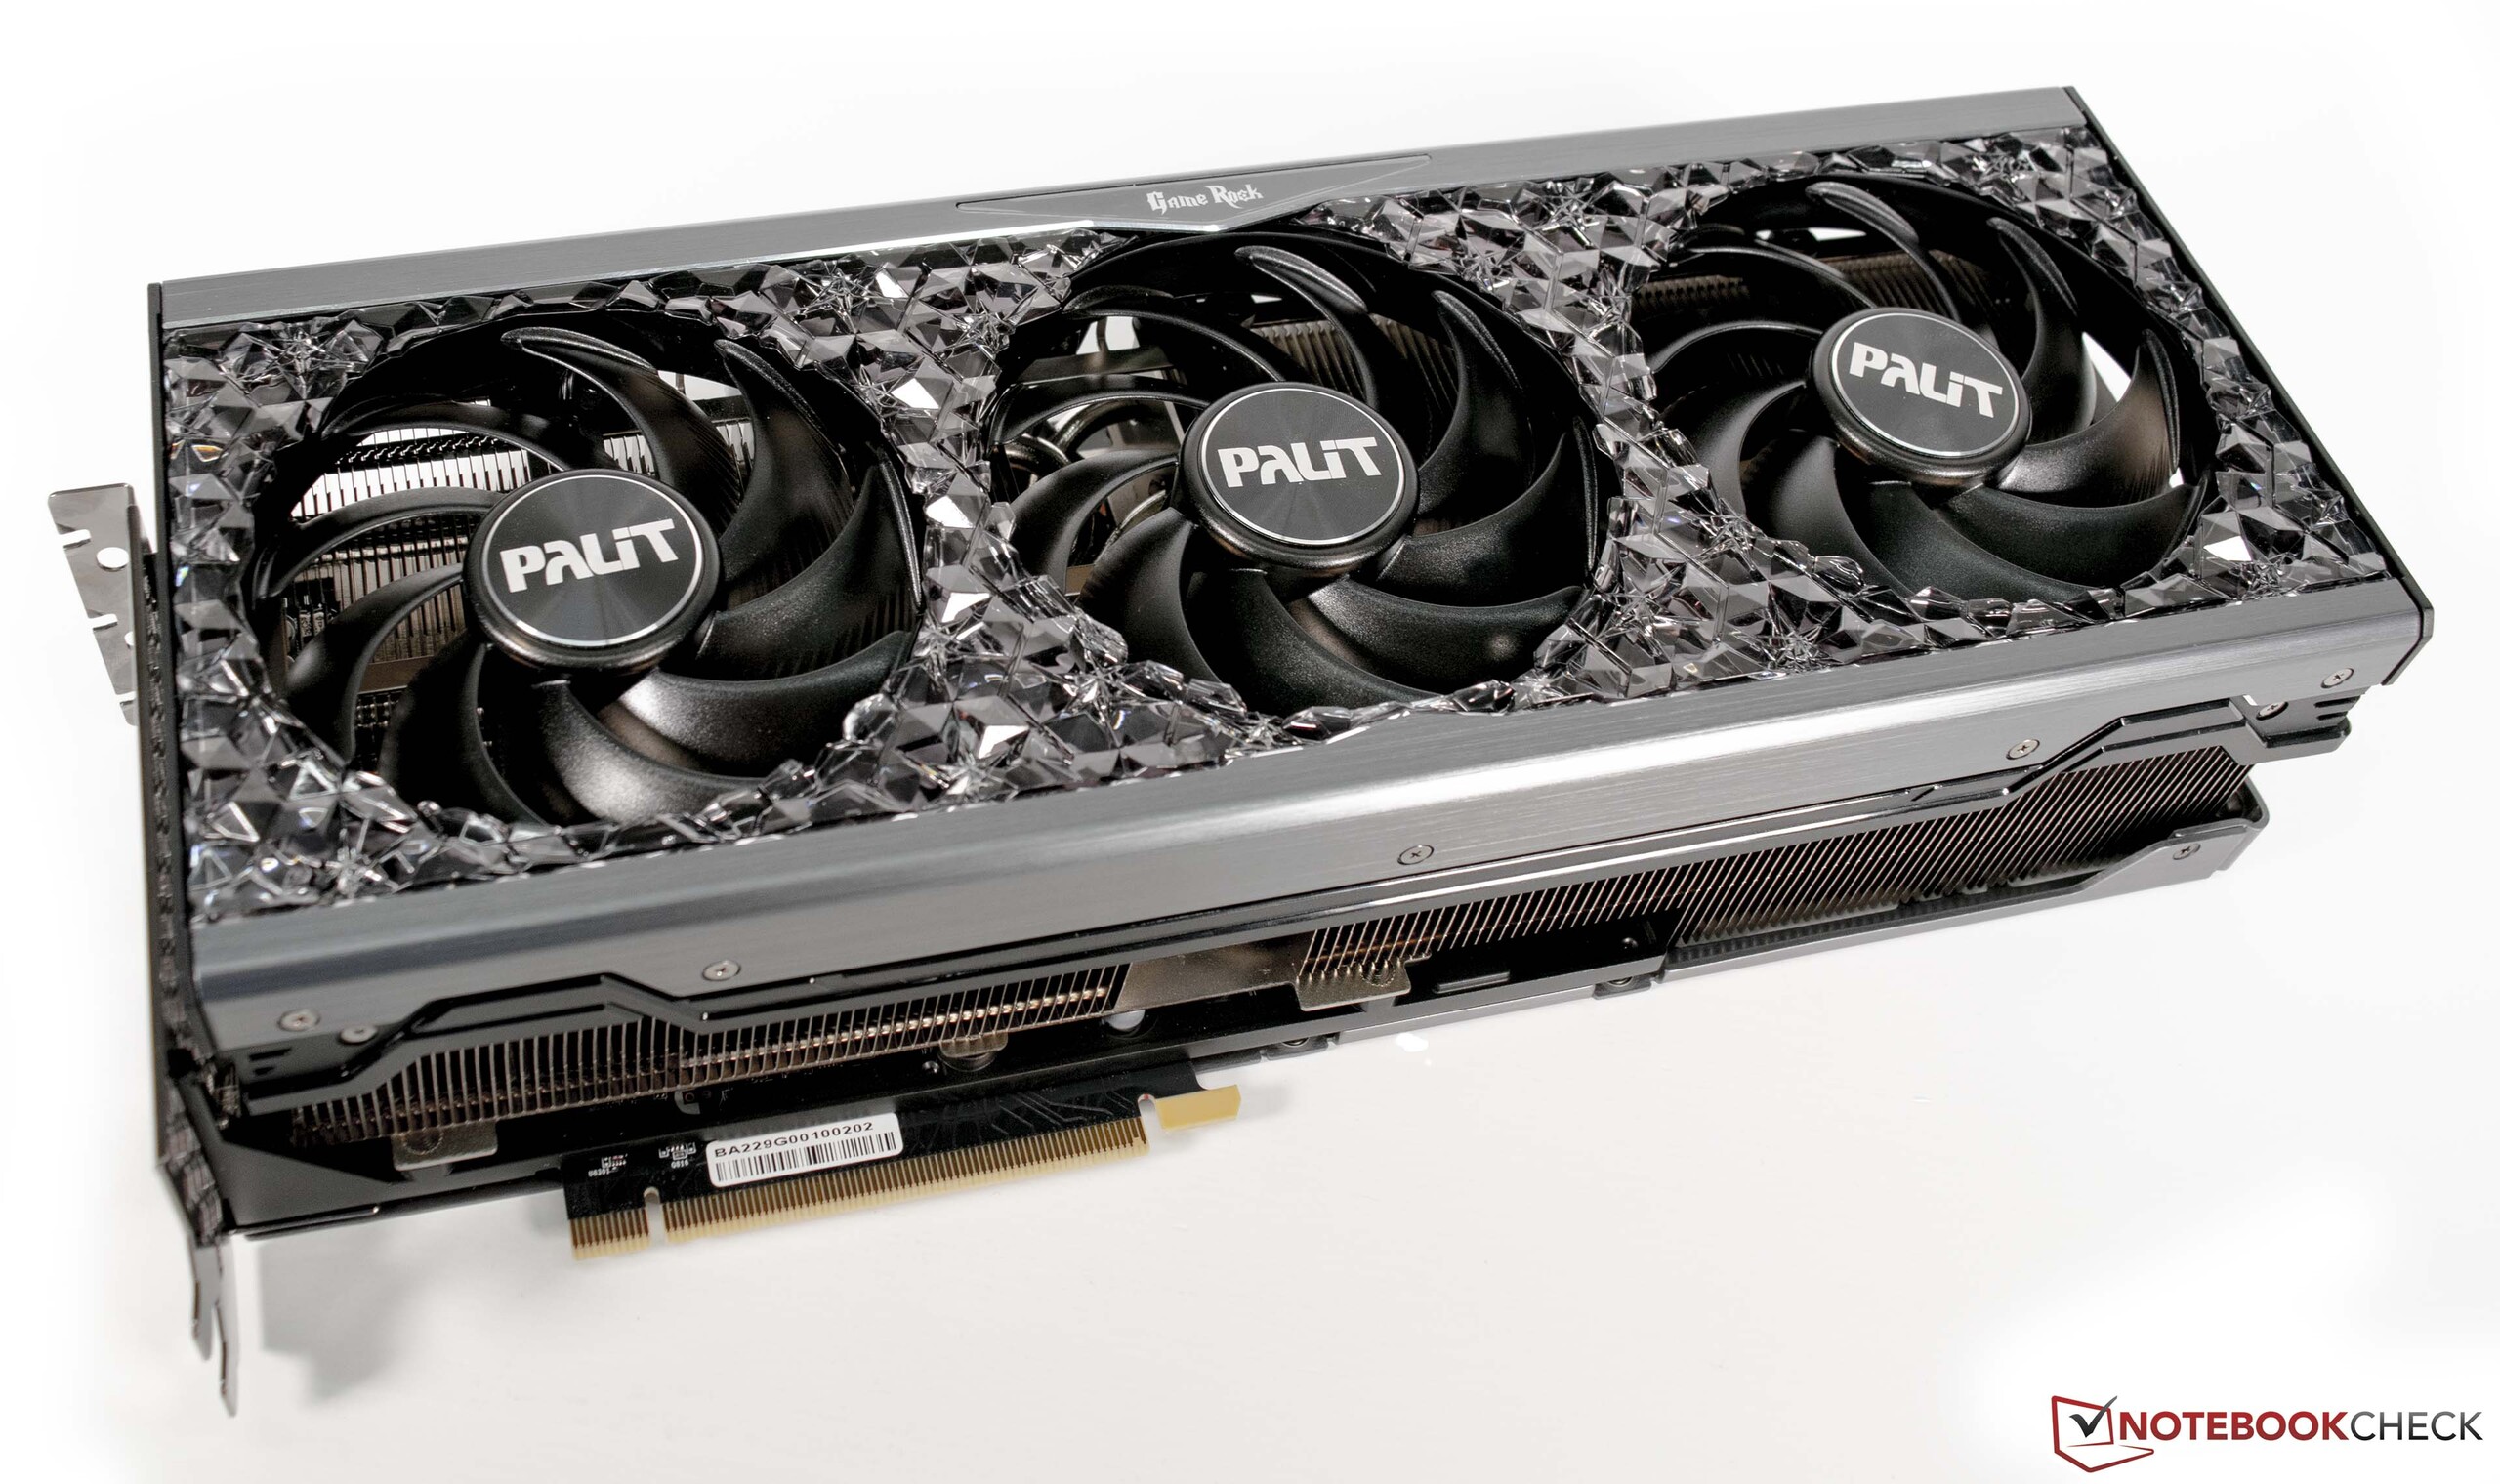
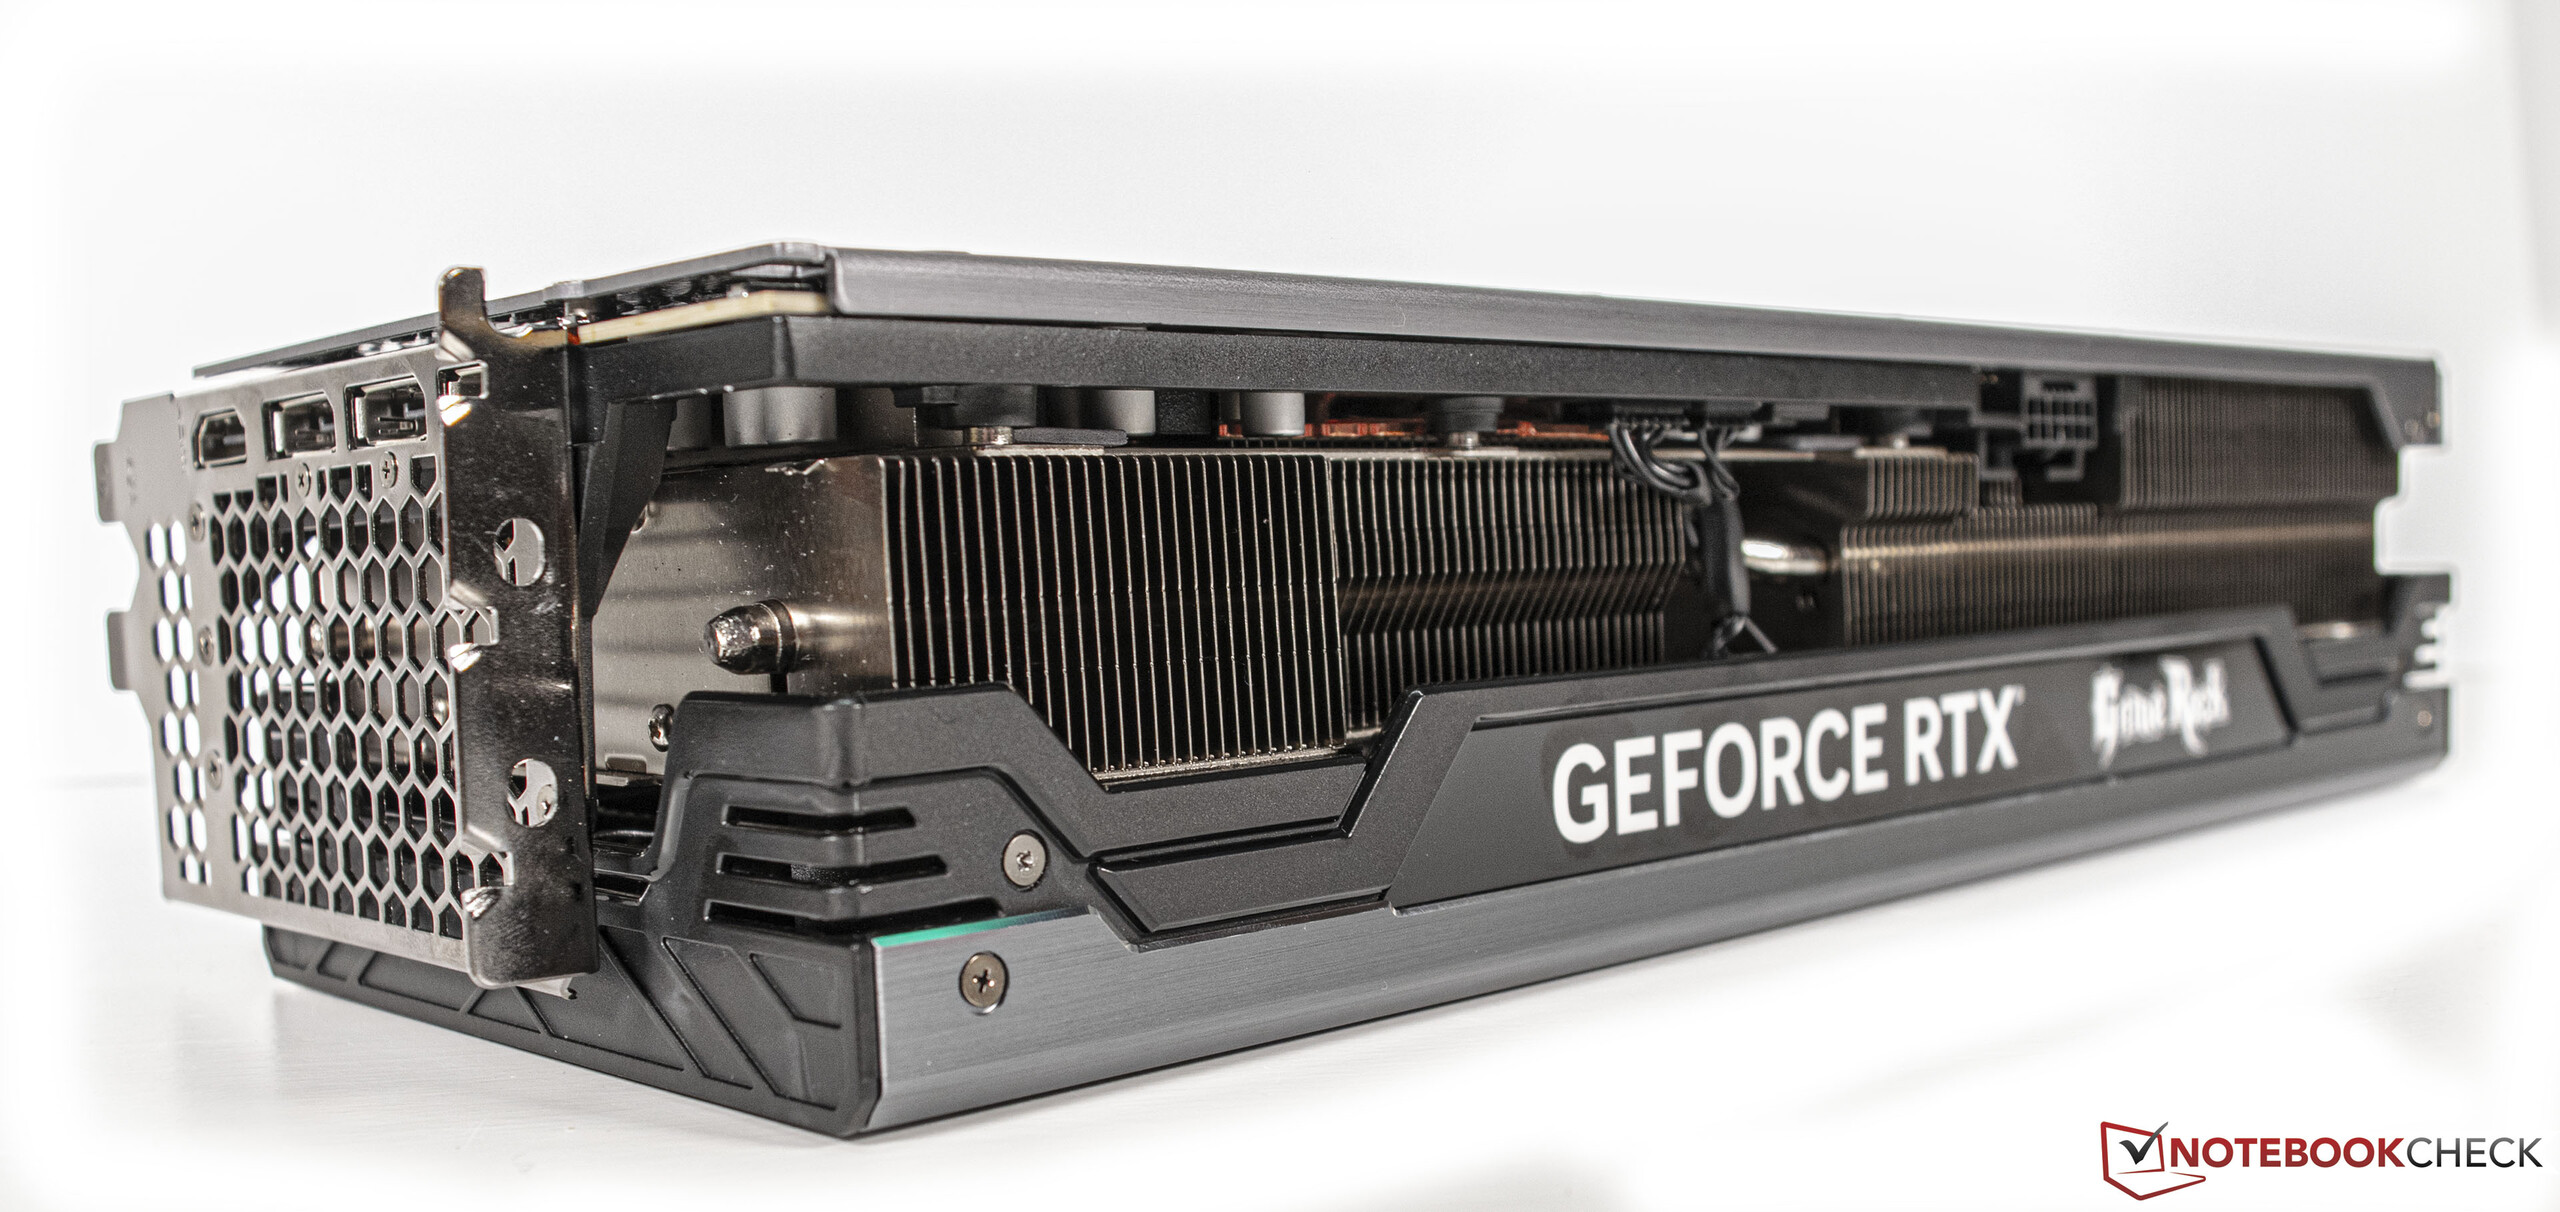
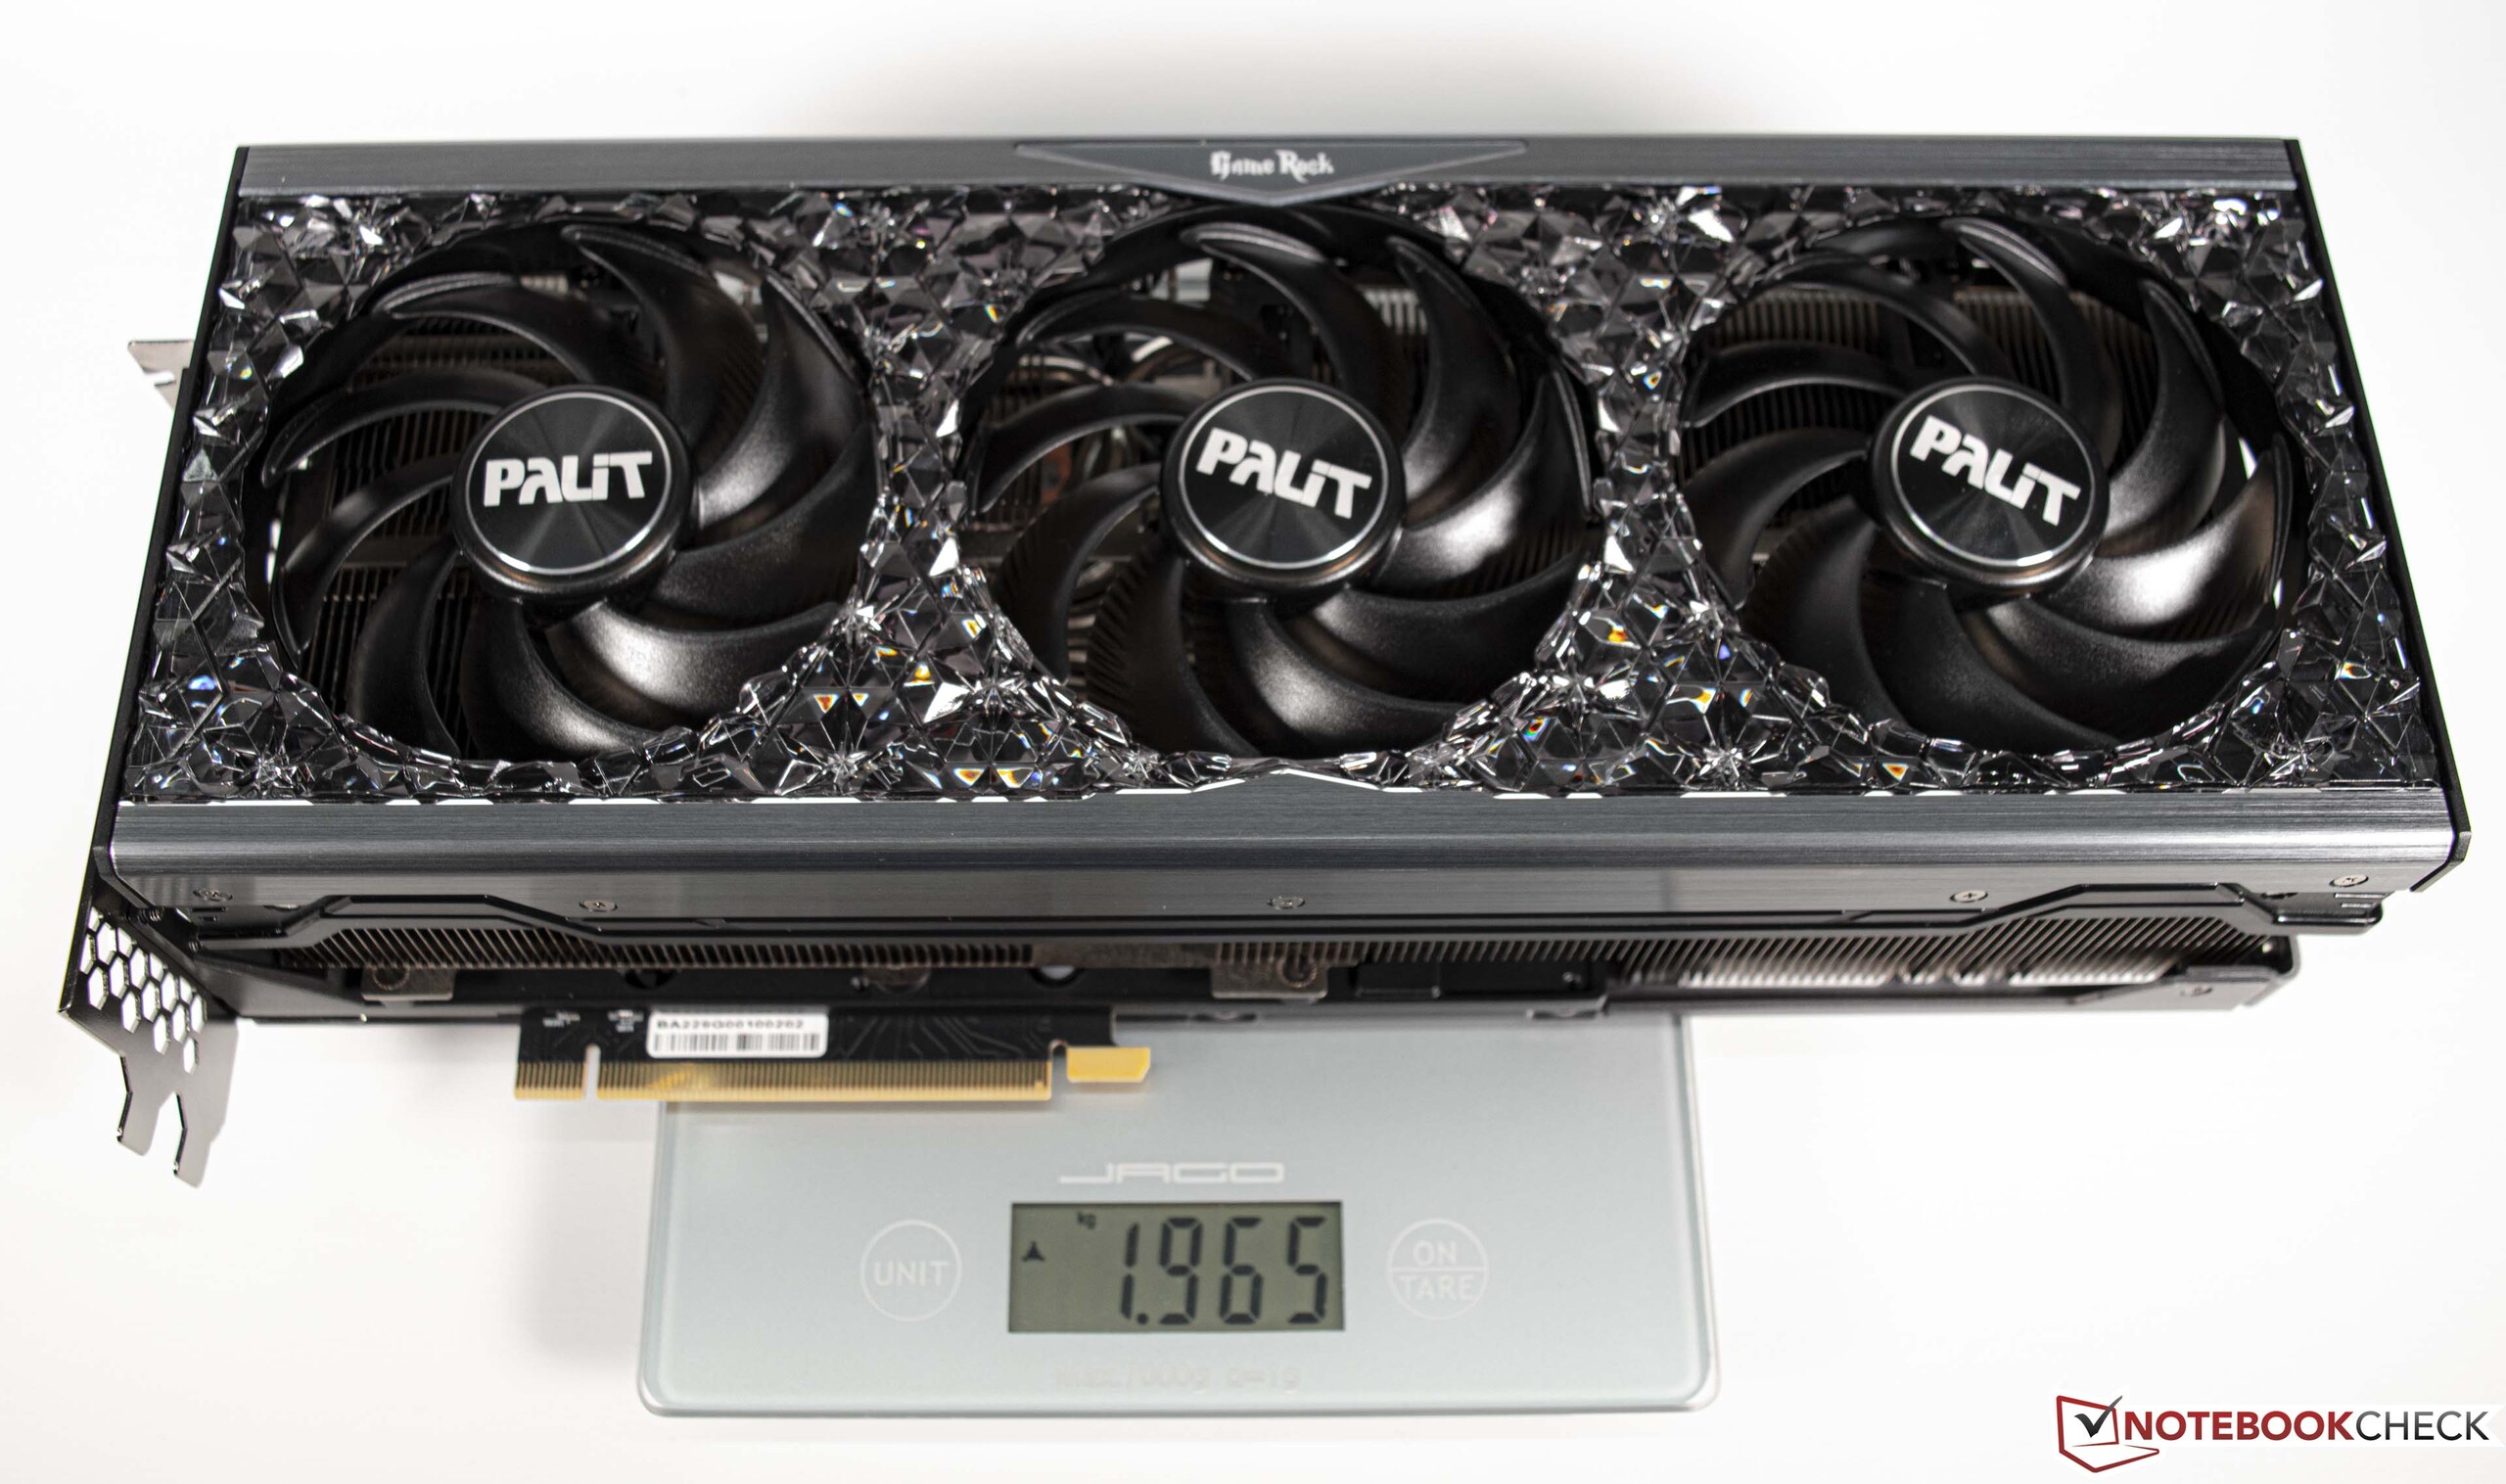
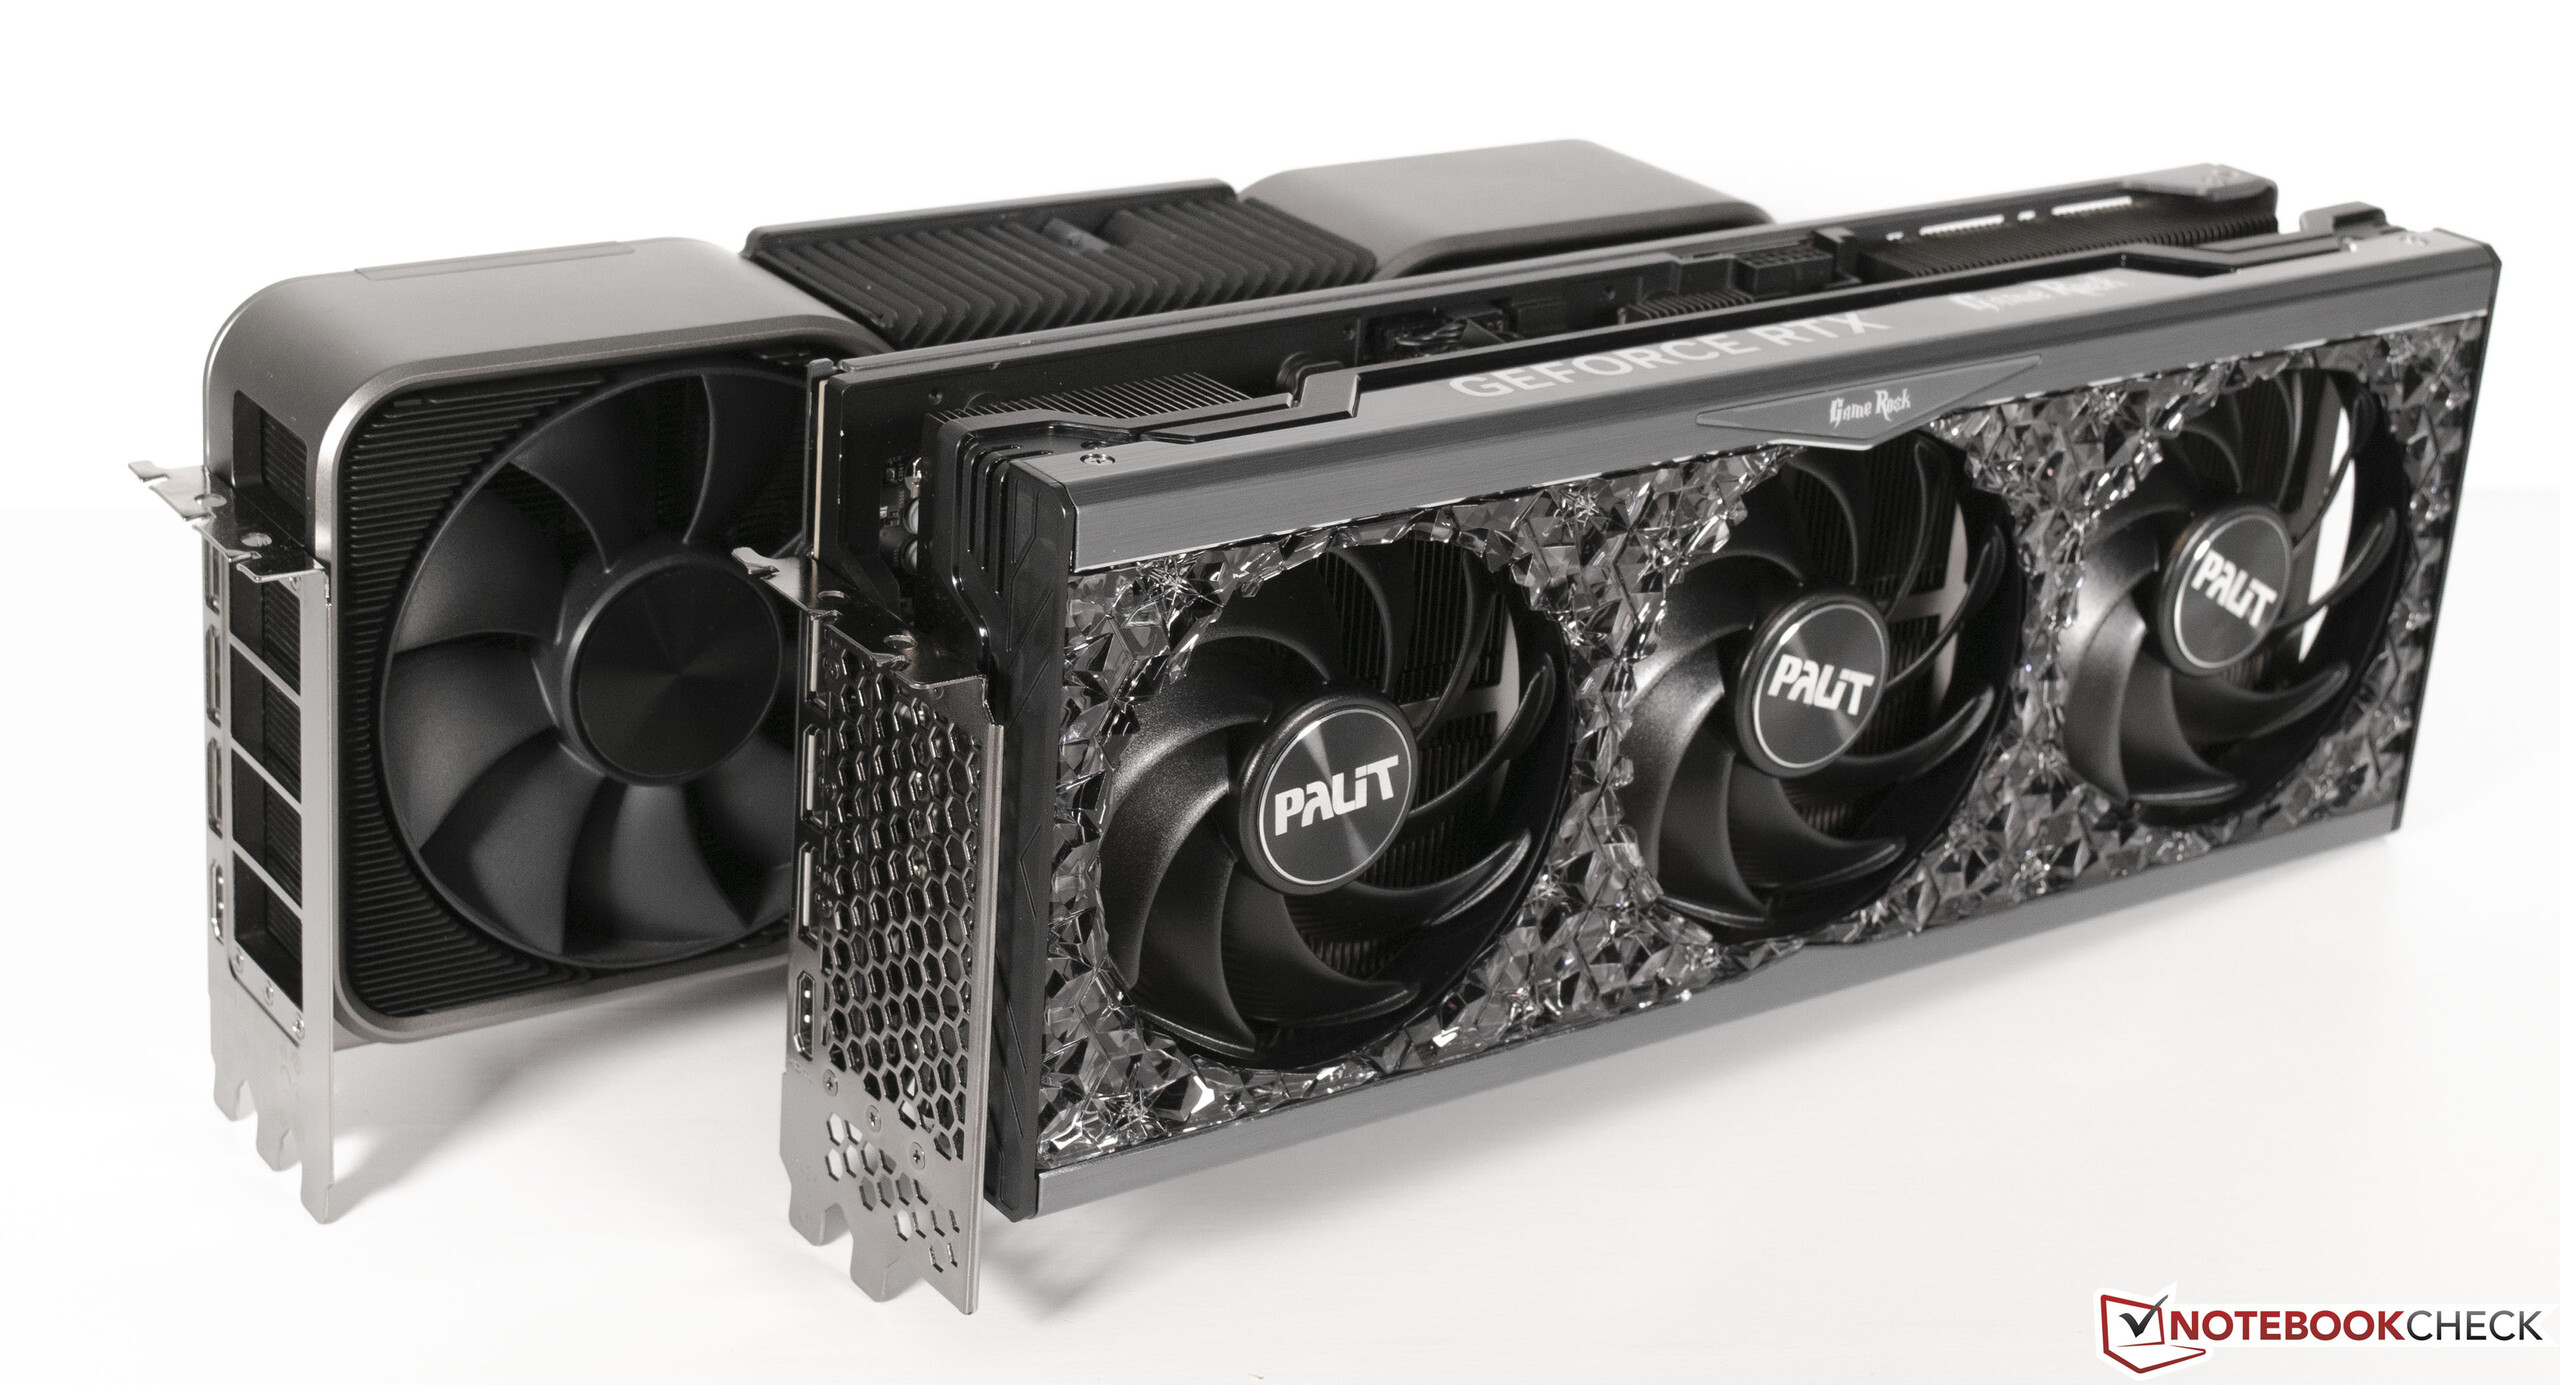
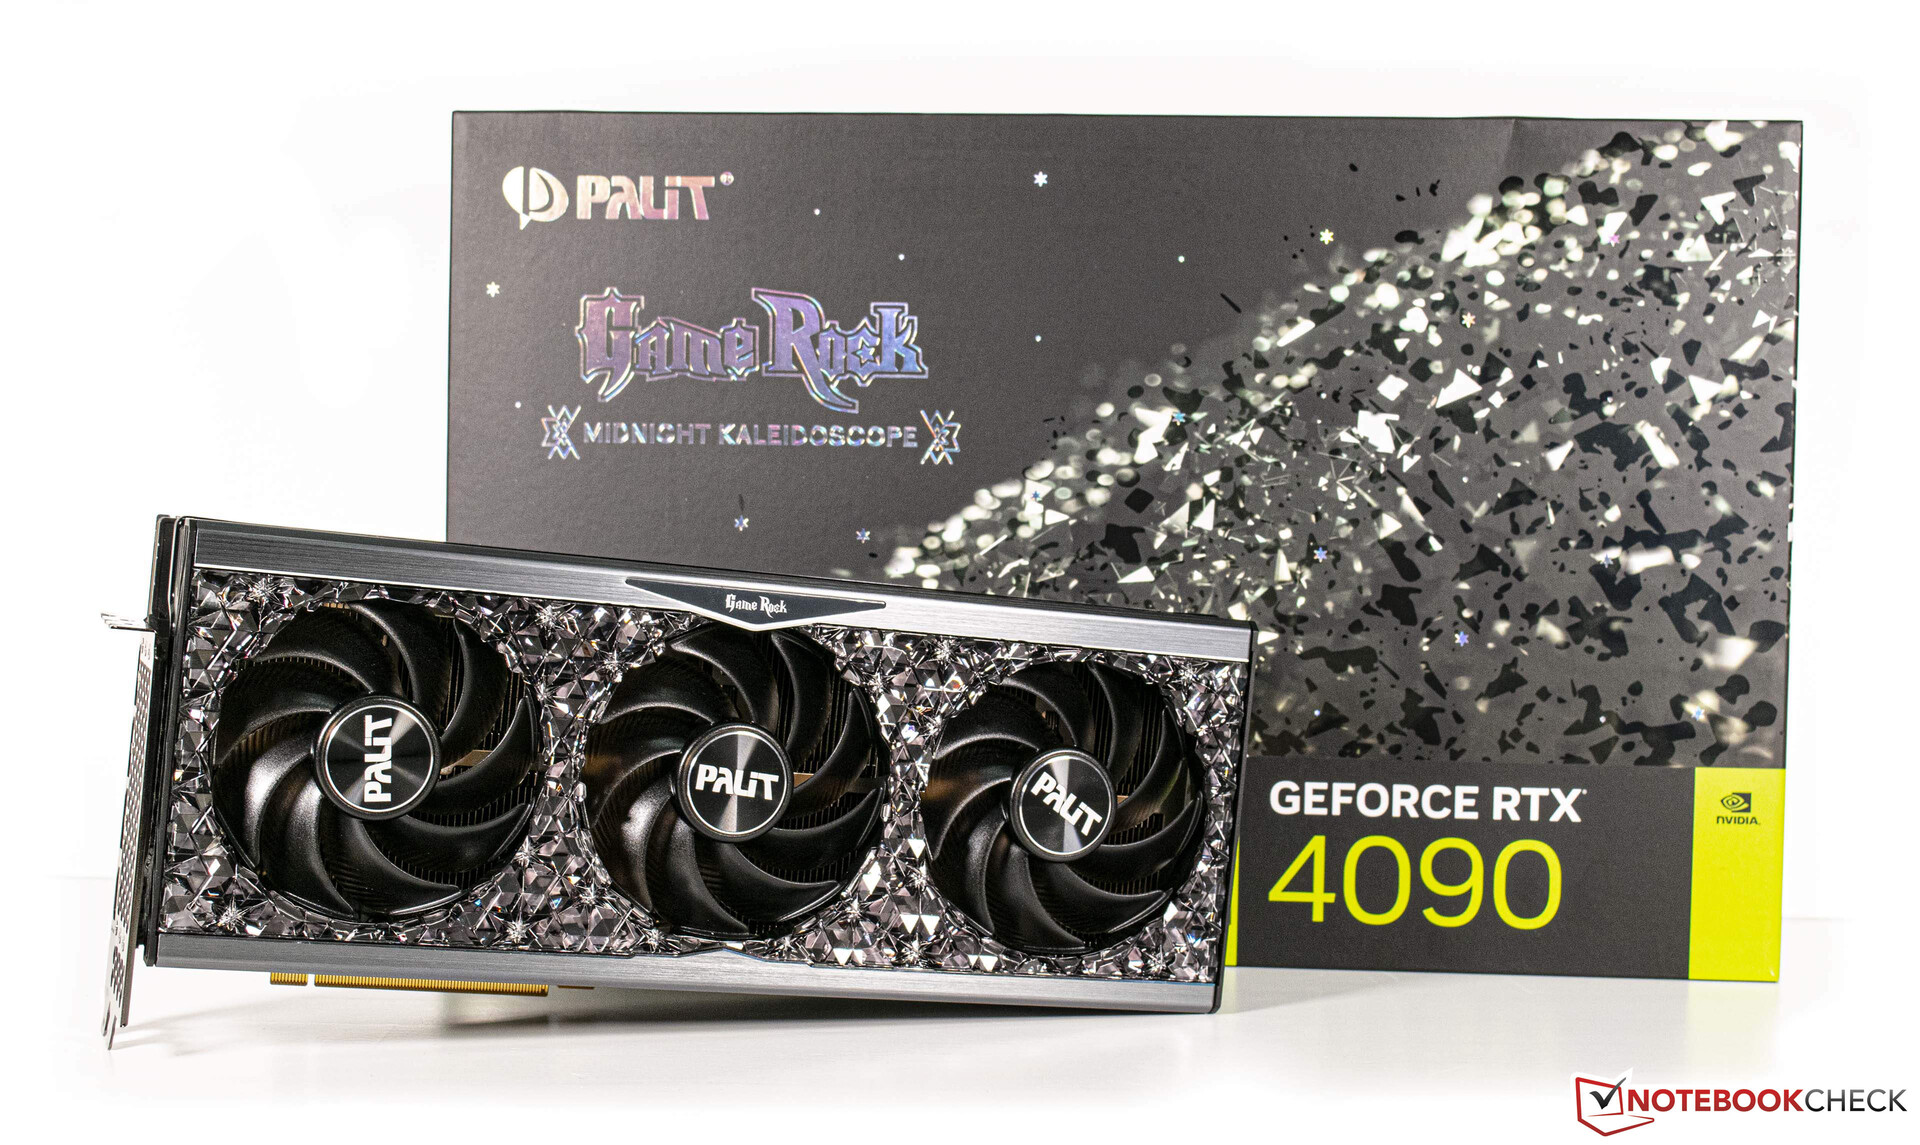
Für diesen Test nutzen wir die Palit GeForce RTX 4090 GameRock OC, welche sich optisch deutlich von der Founders-Edition unterscheidet. Das 3,5-Slot-Kühldesign benötigt viel Platz im Gehäuse und ist mit drei 90-Millimeter-Lüftern ausgestattet. Die im Vorfeld kolportierten 600 Watt Verlustleistung der neuen High-End-Grafikkarten sind der Grund für diese mächtigen Kühlkonstruktionen, welche sich unabhängig vom Hersteller über die komplette Serie der GeForce RTX 4090 Serie erstreckt. Etwas Positives hat das Ganze dadurch aber, denn Temperaturprobleme gibt es weder beim Chip, noch beim VRAM, soviel können wir vorab schon einmal verraten. Schlussendlich liegt die Leistungsaufnahme der Grafikkarte bei 450 Watt.
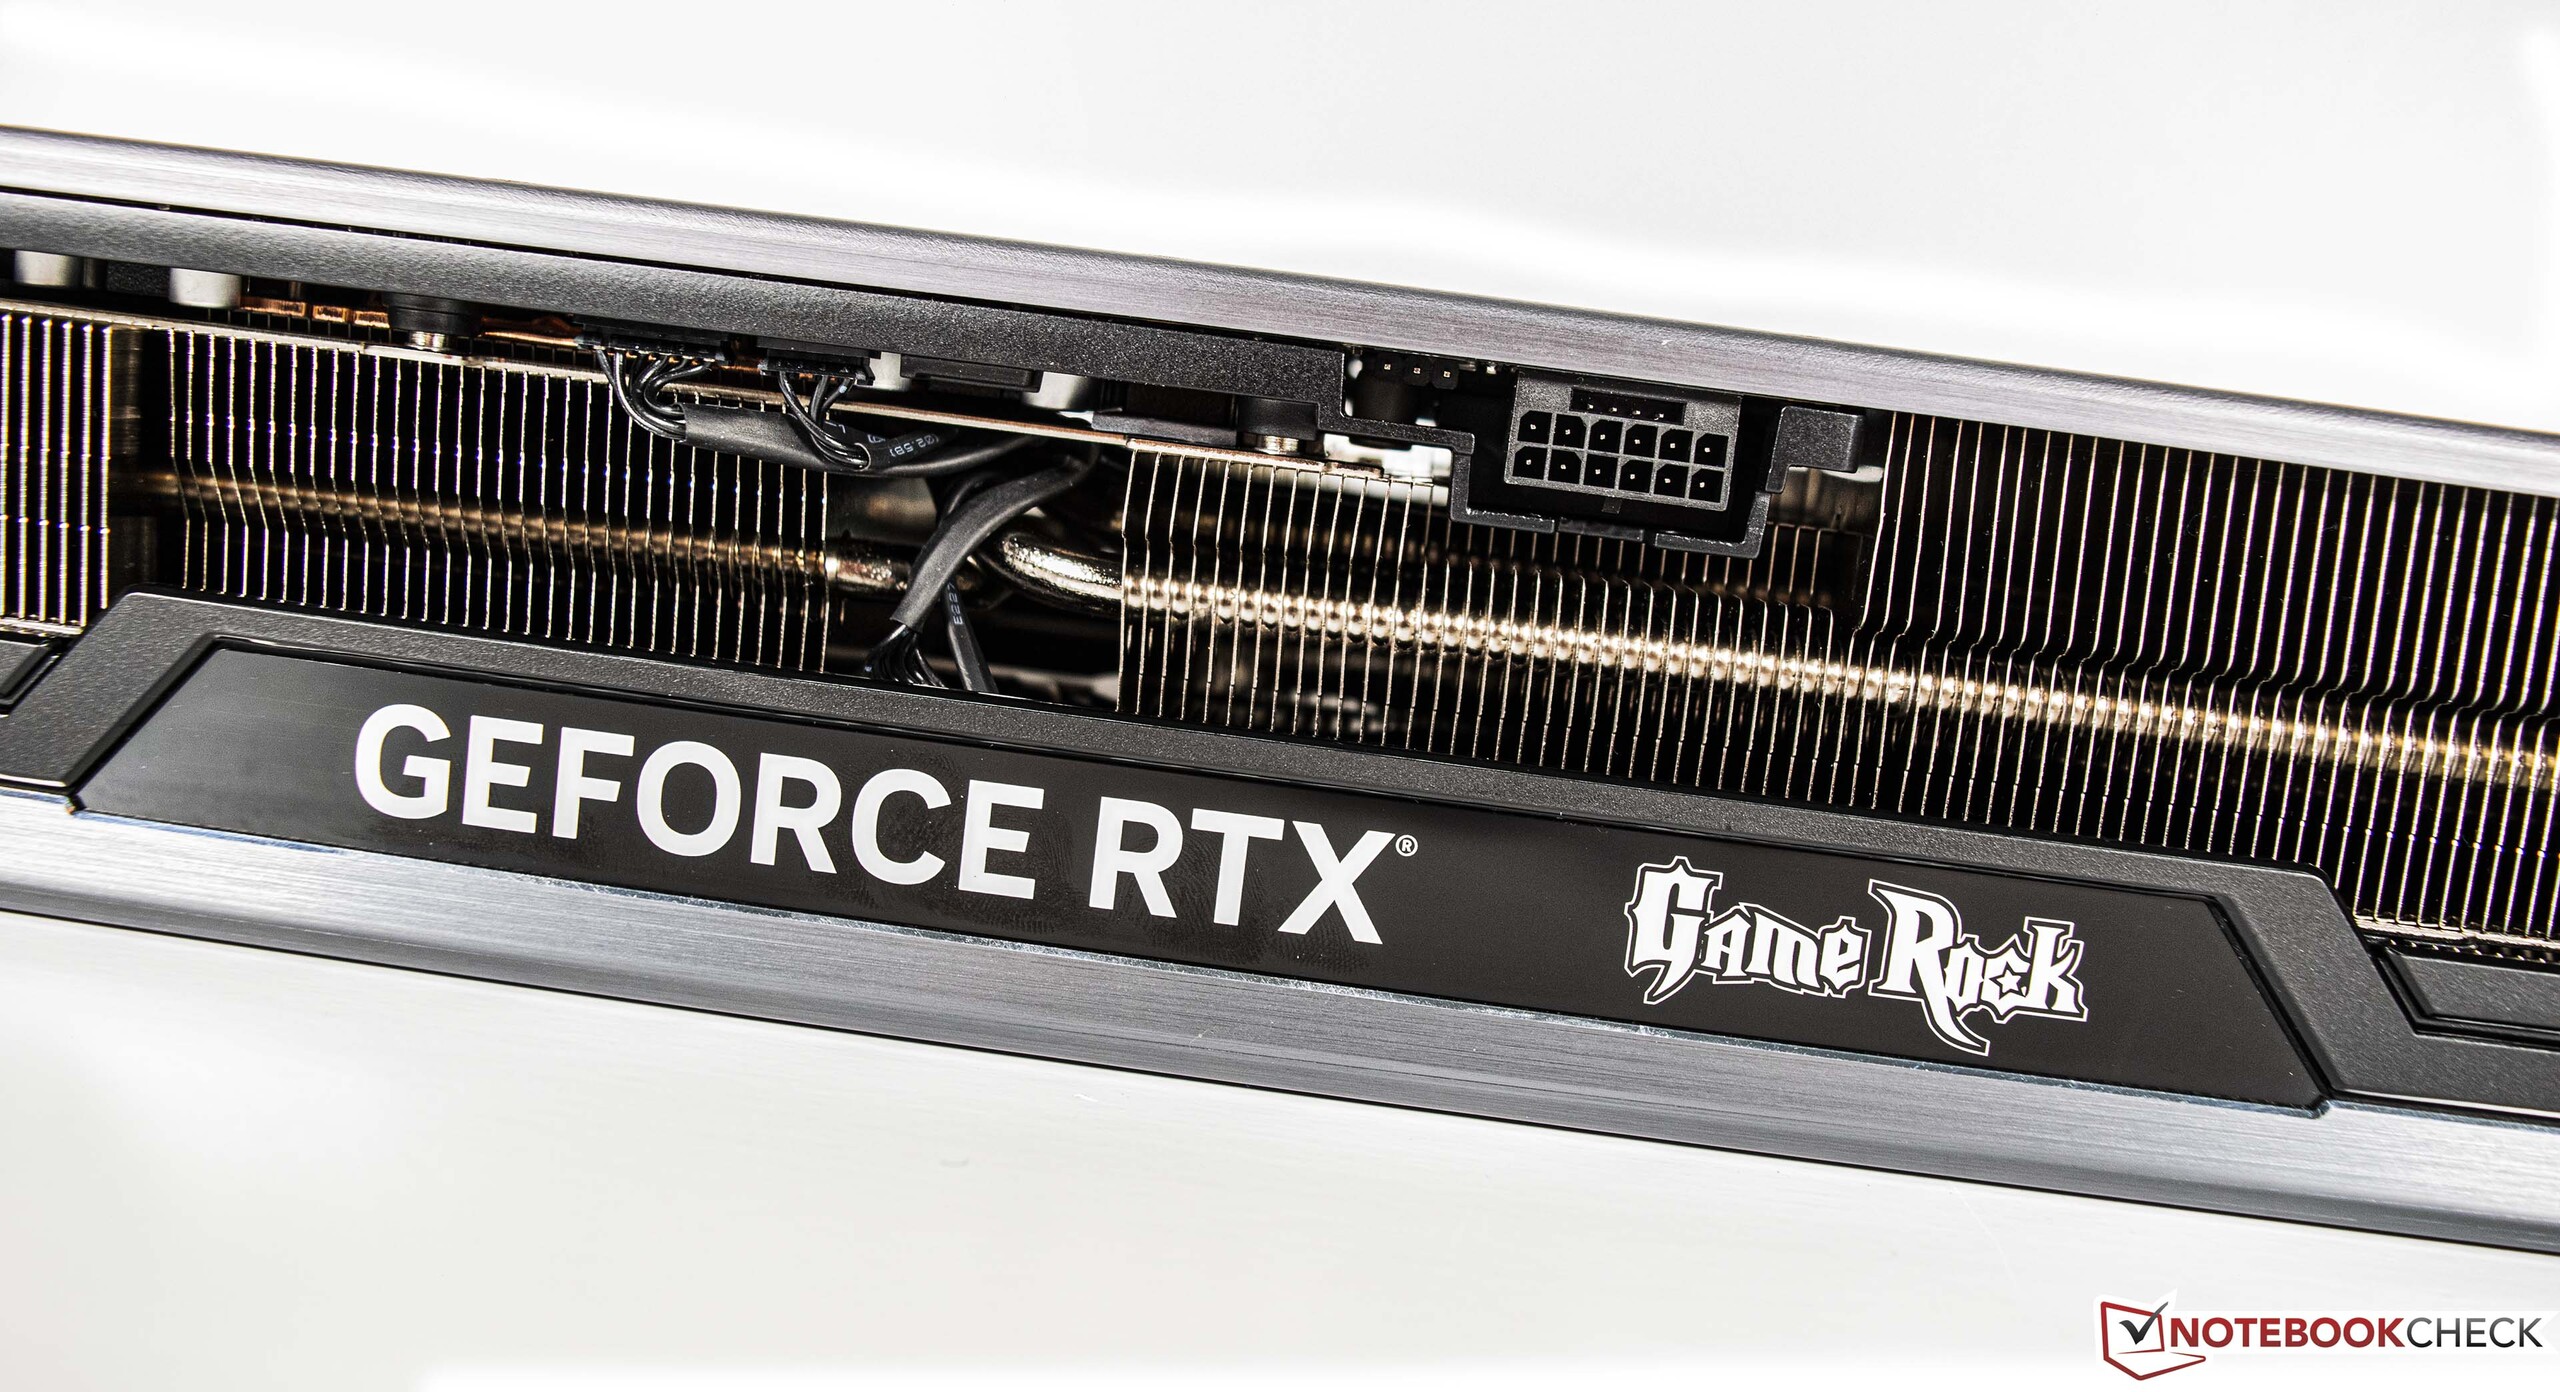
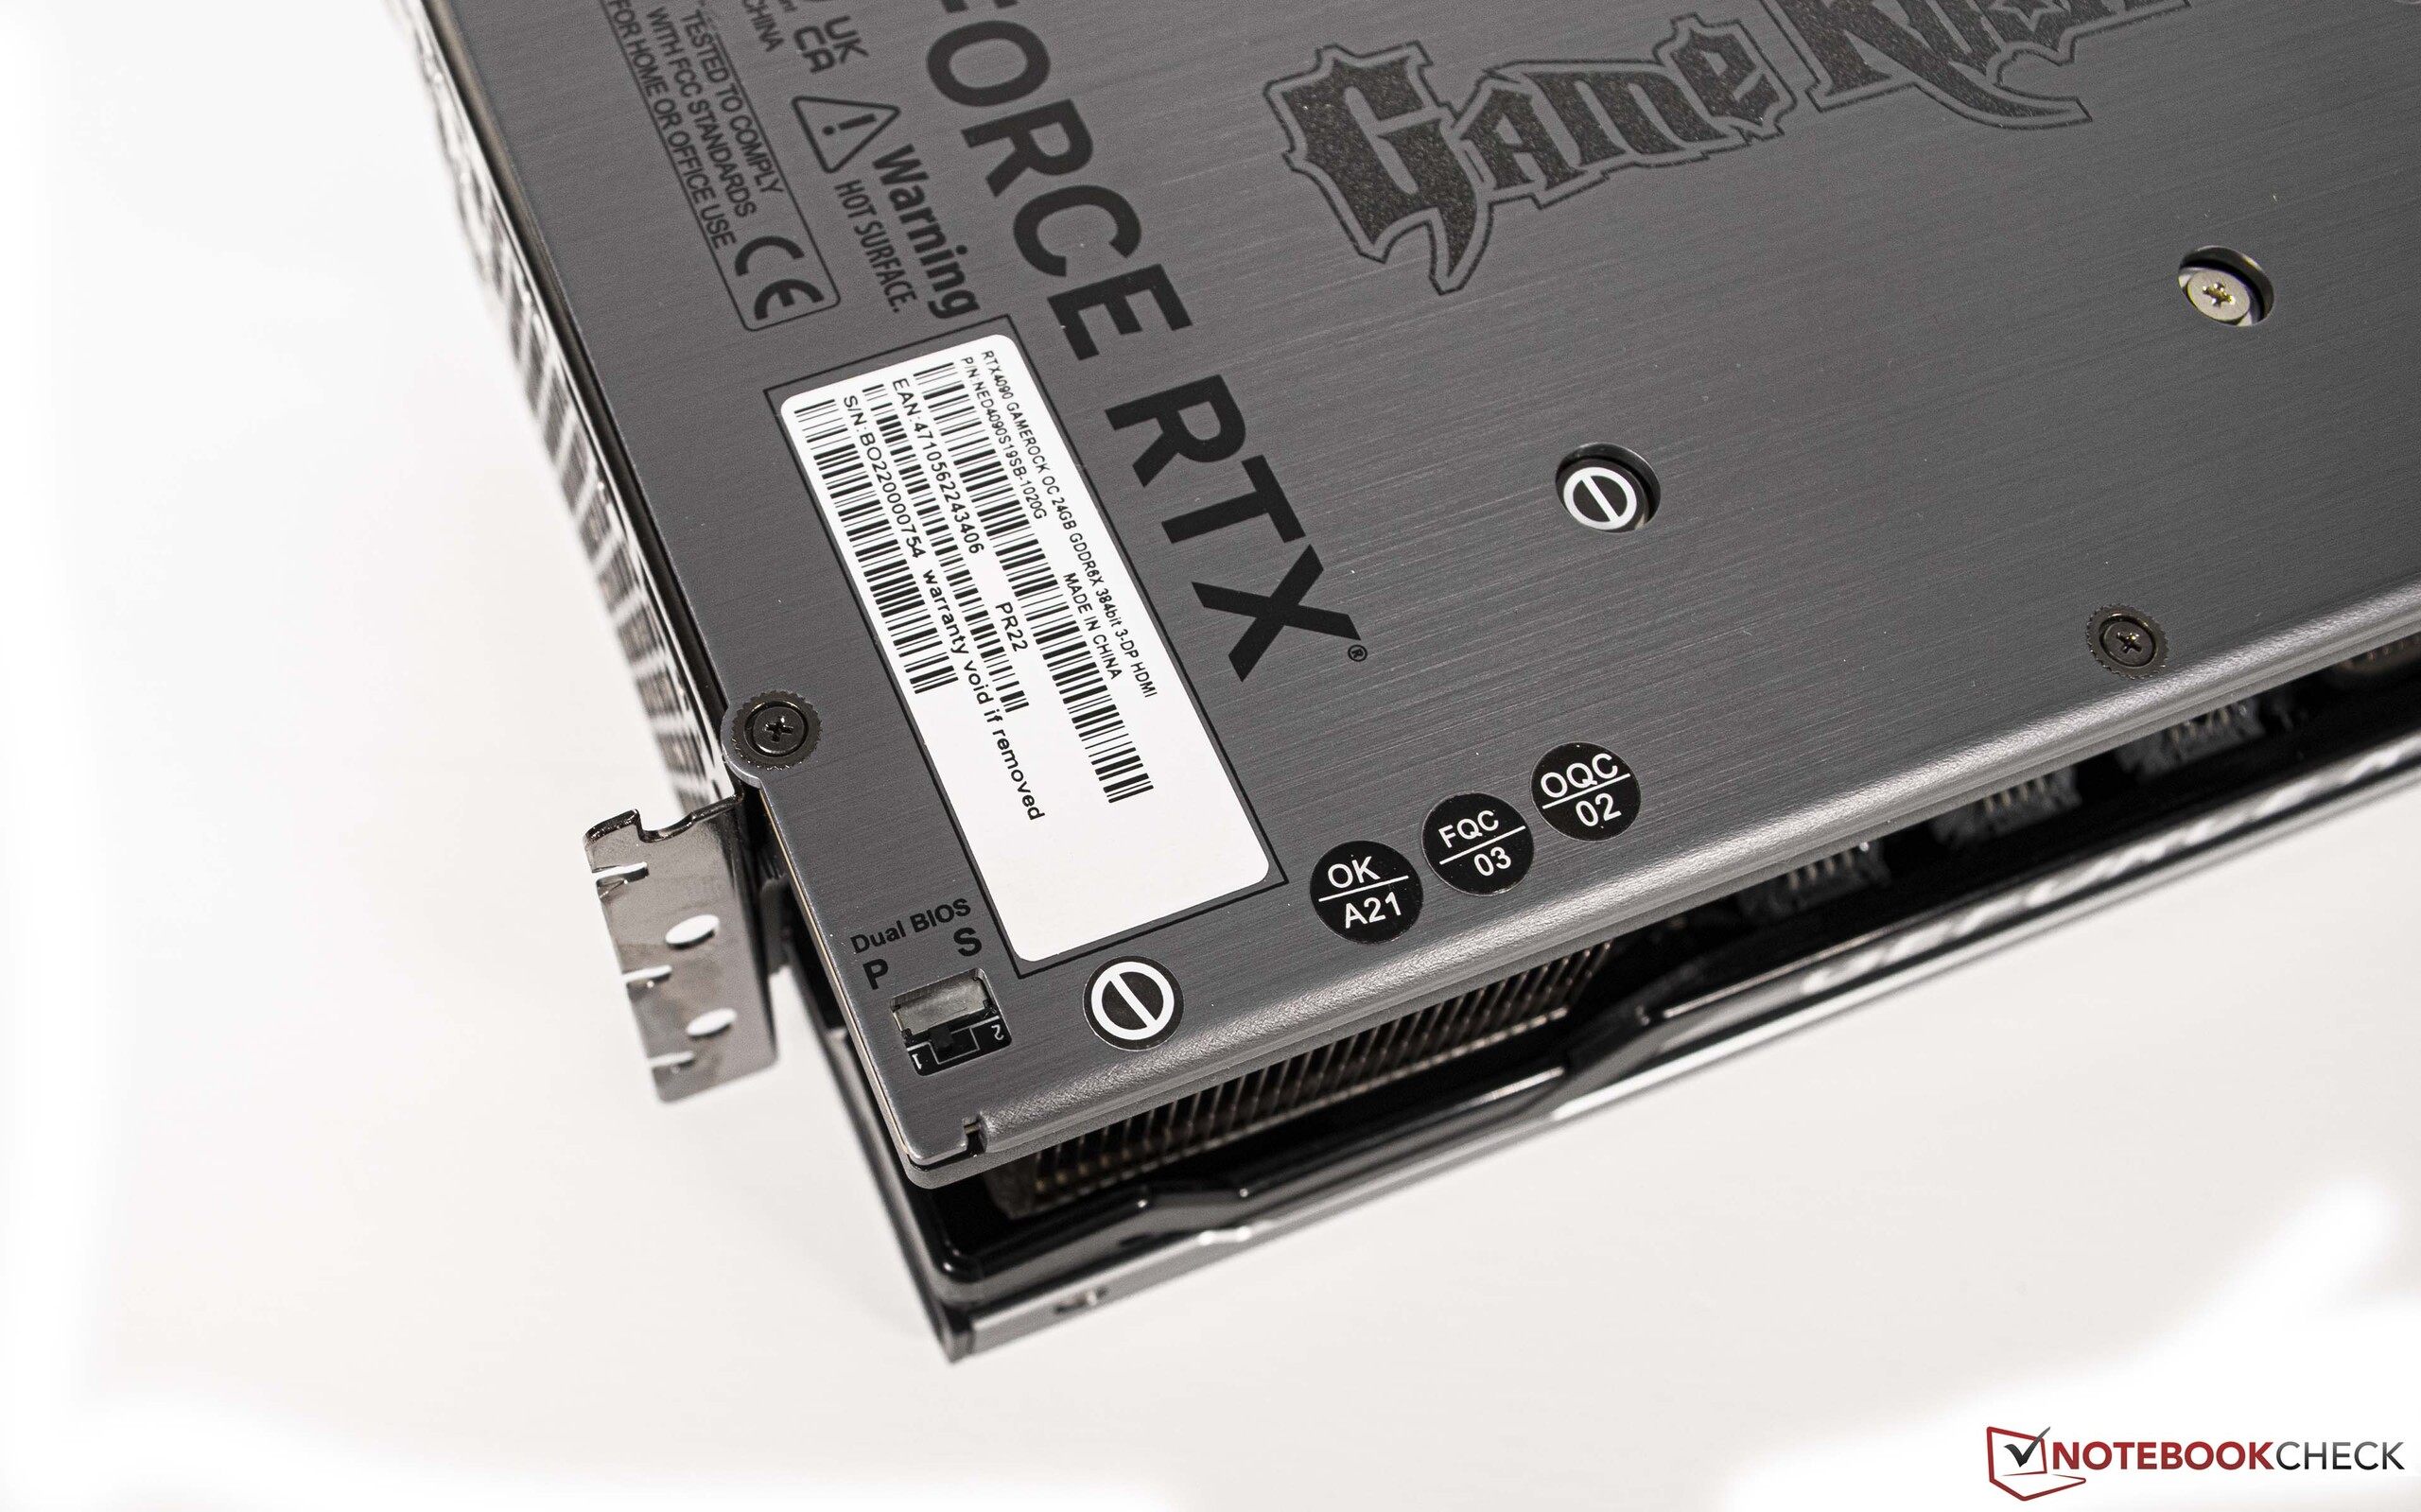
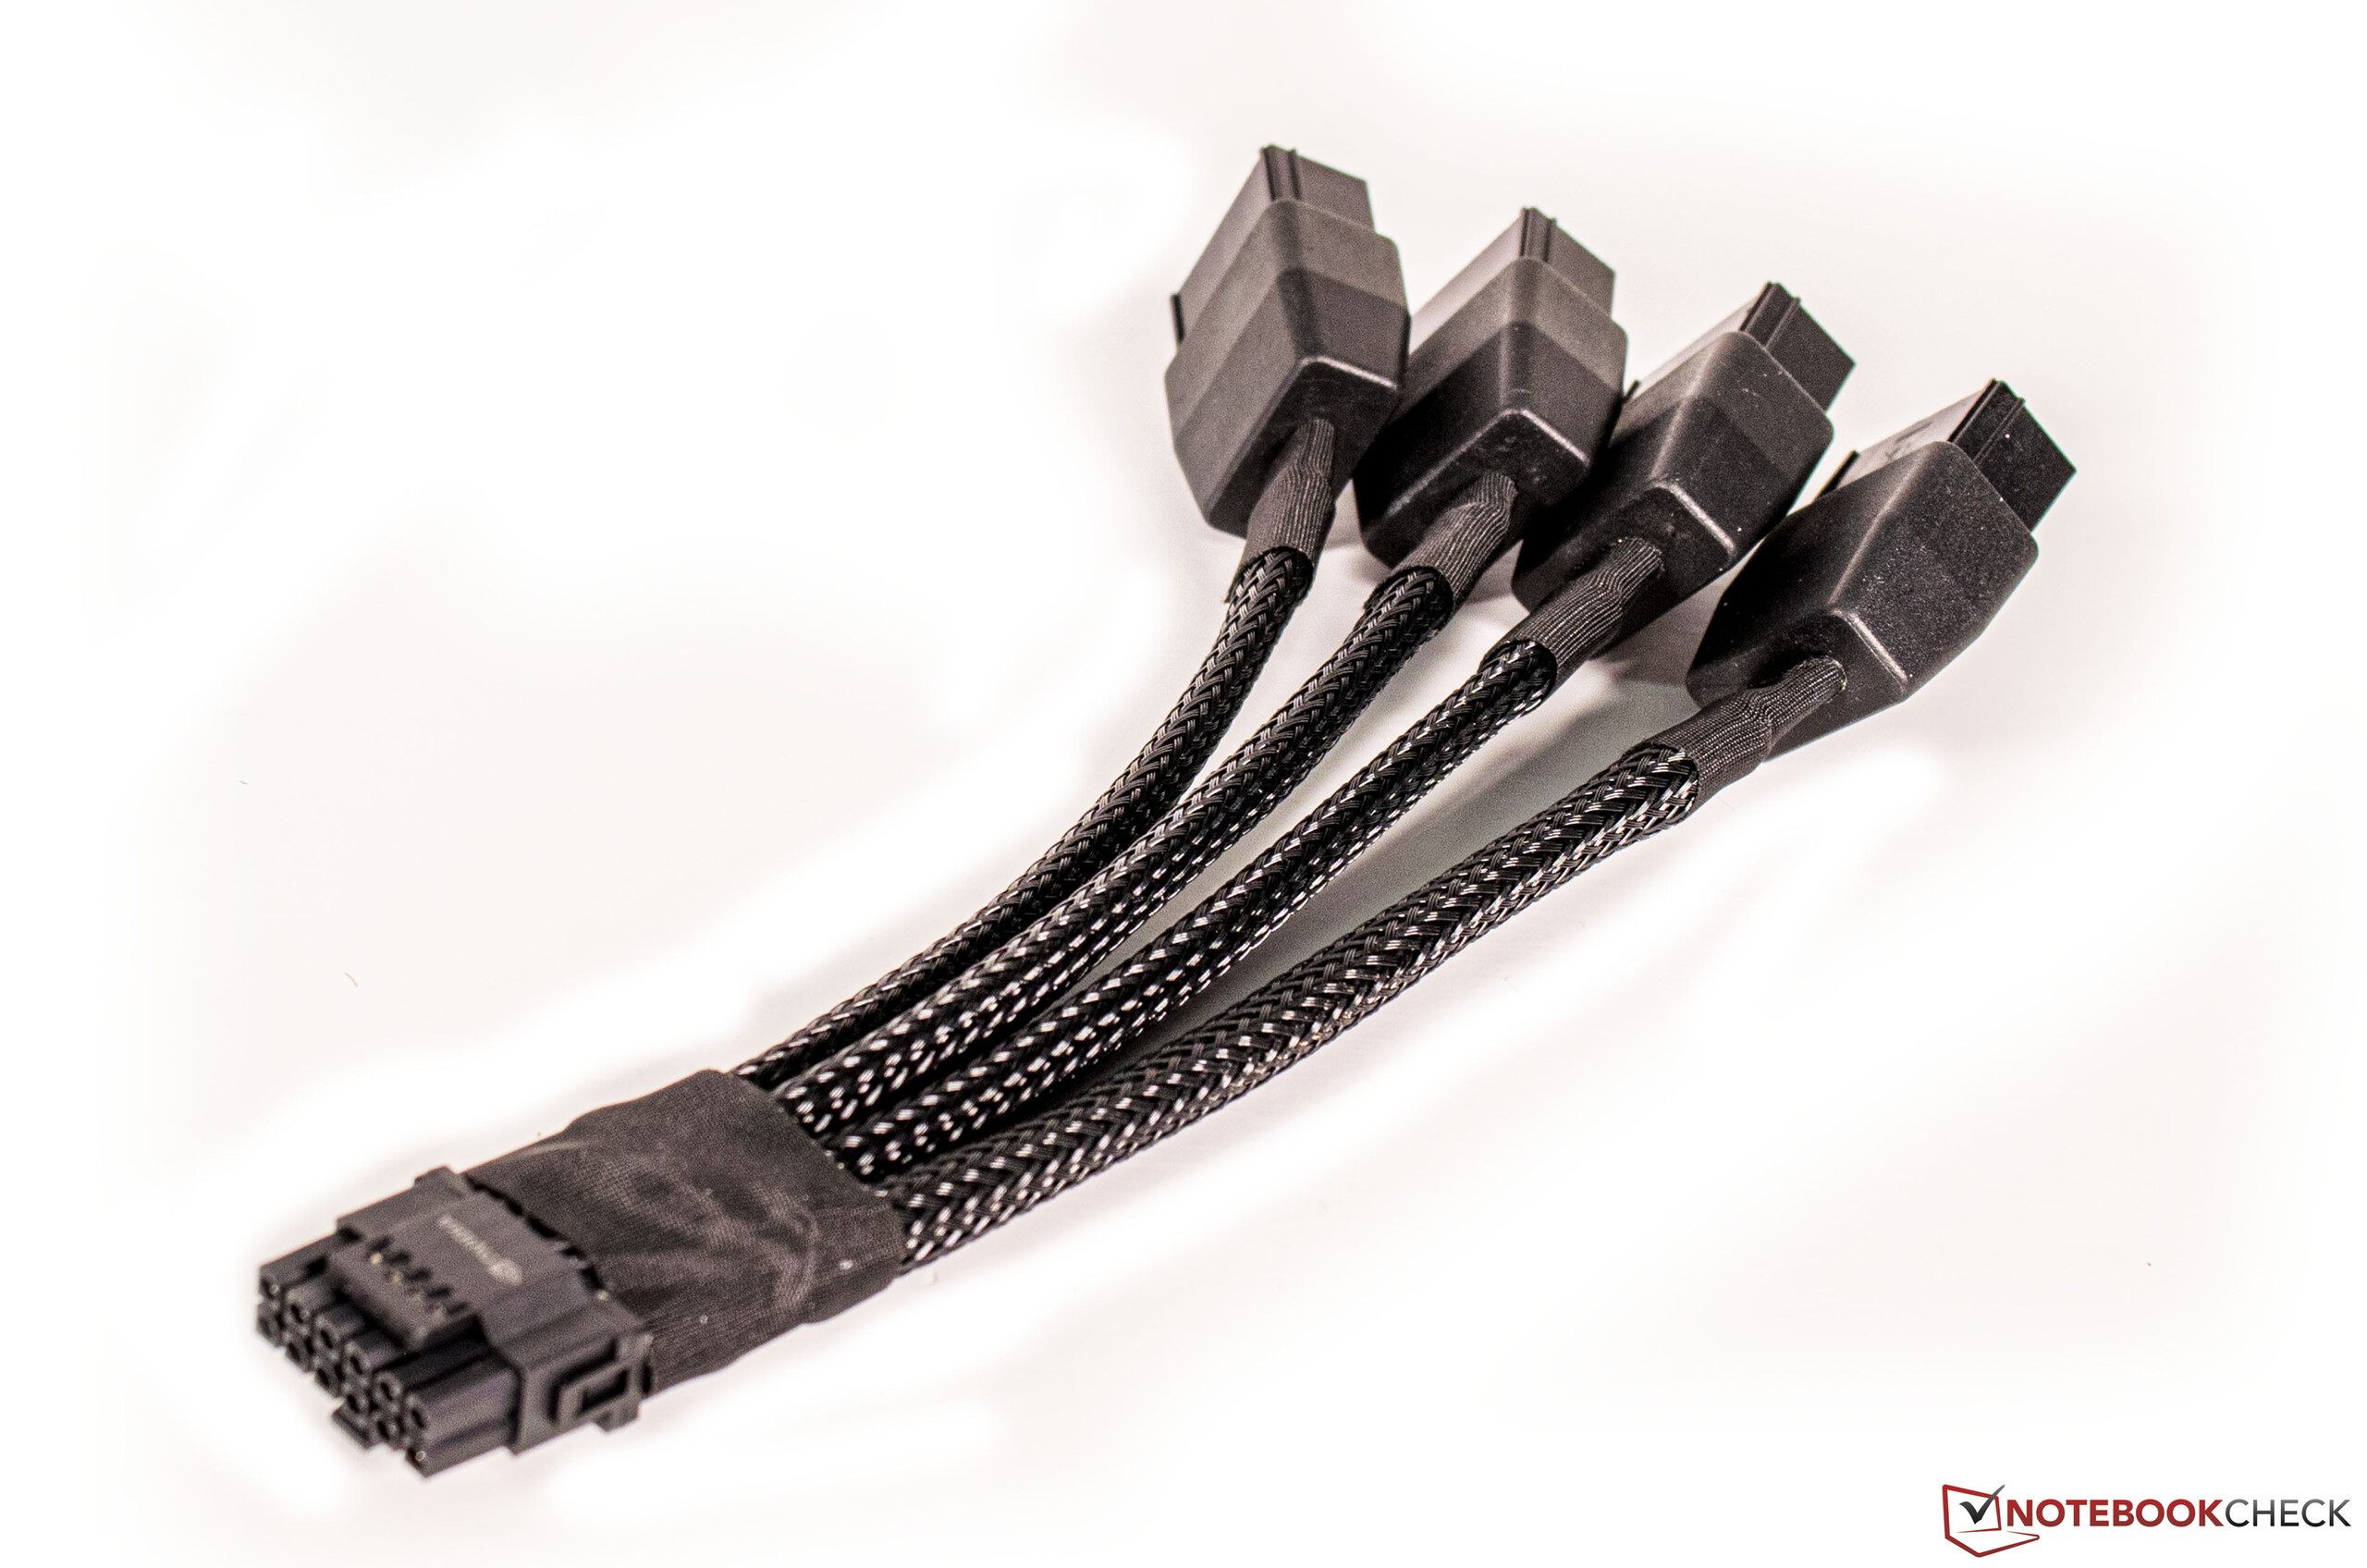
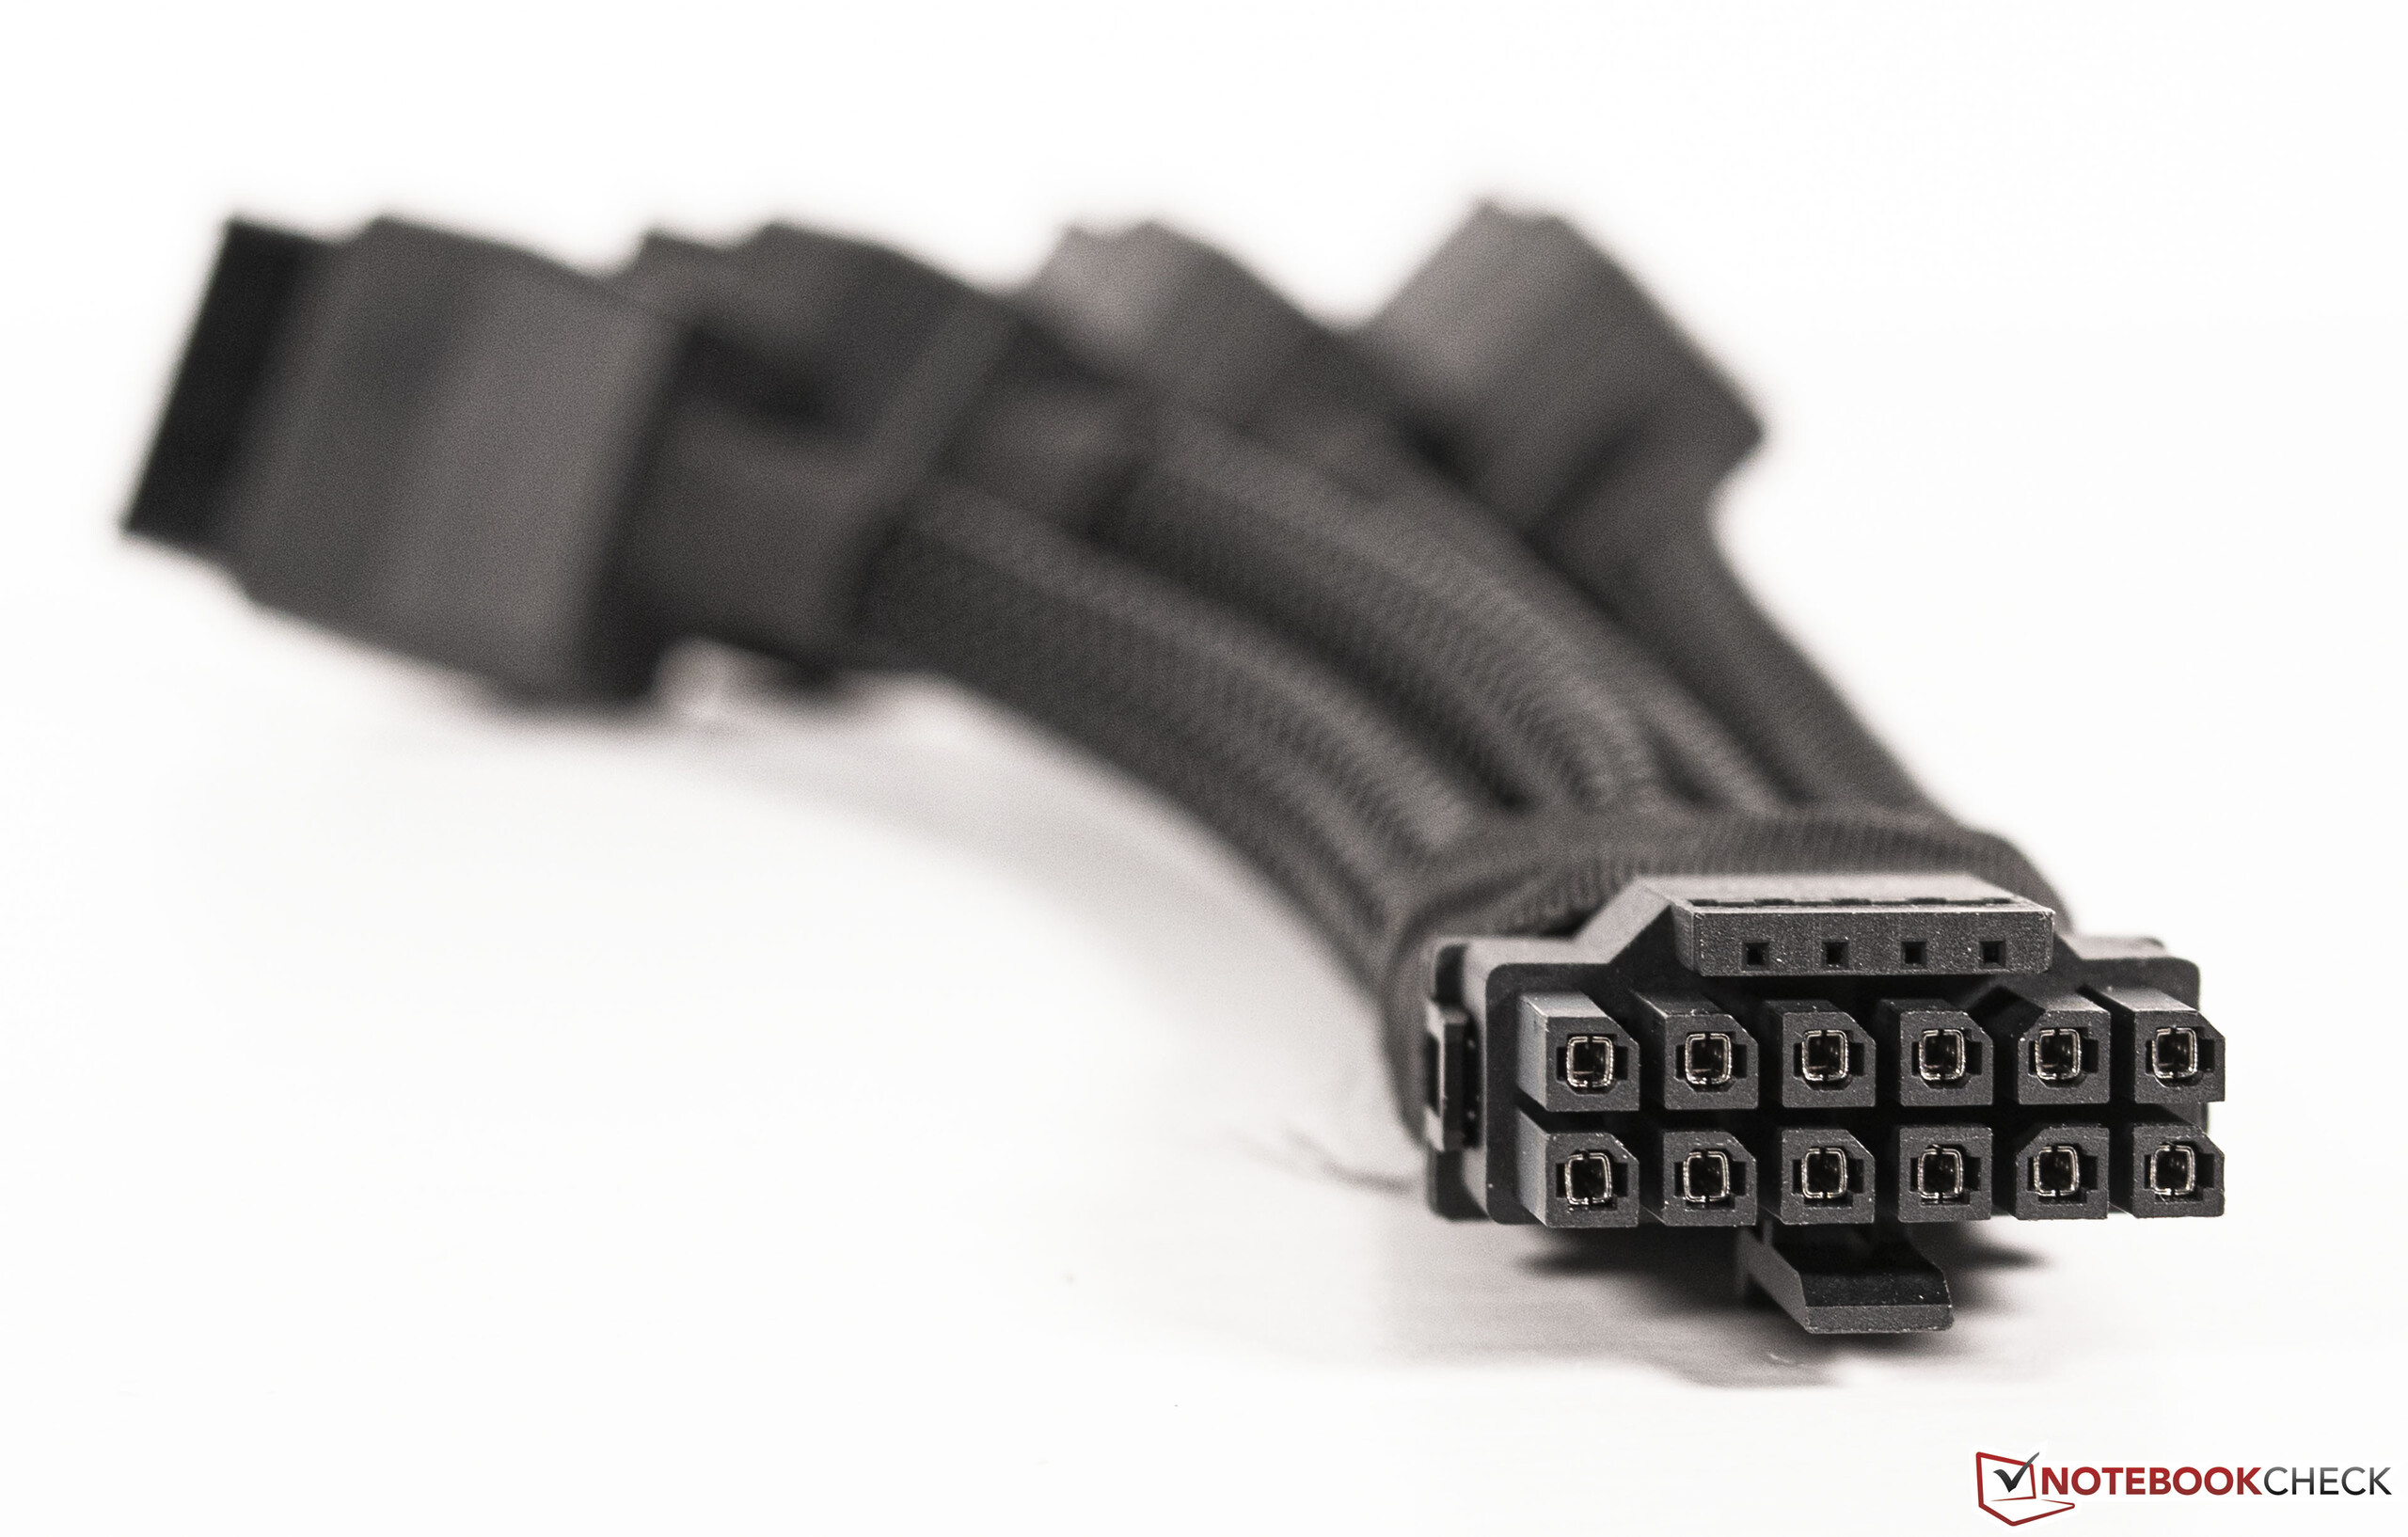
Das Modell der Palit GeForce RTX 4090 GameRock OC ist optisch aufgrund des sogenannten Midnight Kaleidoscope Designs inklusive dezenter RGB-Beleuchtung ein wahrer Hingucker. Mit knapp unter 2 Kilogramm zählt unser Testsample eher zu den Leichtgewichten, wenn man sich auf die RTX-4090-Grafikkarten beschränkt. Dennoch gibt es im Lieferumfang noch eine Grafikkartenhalterung, um die Karte im horizontalen Einbau zu stützen. Außerdem gibt es den inzwischen viel thematisierten Stromadapter, der vier 8-Pin-Stromanschlüsse auf den neuen 12VHPWR-Anschluss der Grafikkarte zusammenführt. Auf den technischen Aufbau und die Korrektheit wollen wir an dieser Stelle nicht weiter eingehen. Dennoch sollte man den Adapter pfleglich behandeln, um eine Fehlfunktion zu vermeiden. Wir empfehlen hier ein passendes Anschlusskabel des Netzteilherstellers zu verwenden. Alle Tests haben wir mit dem zugehörigen Adapter durchgeführt und bislang sind bei uns keine Probleme aufgetreten.
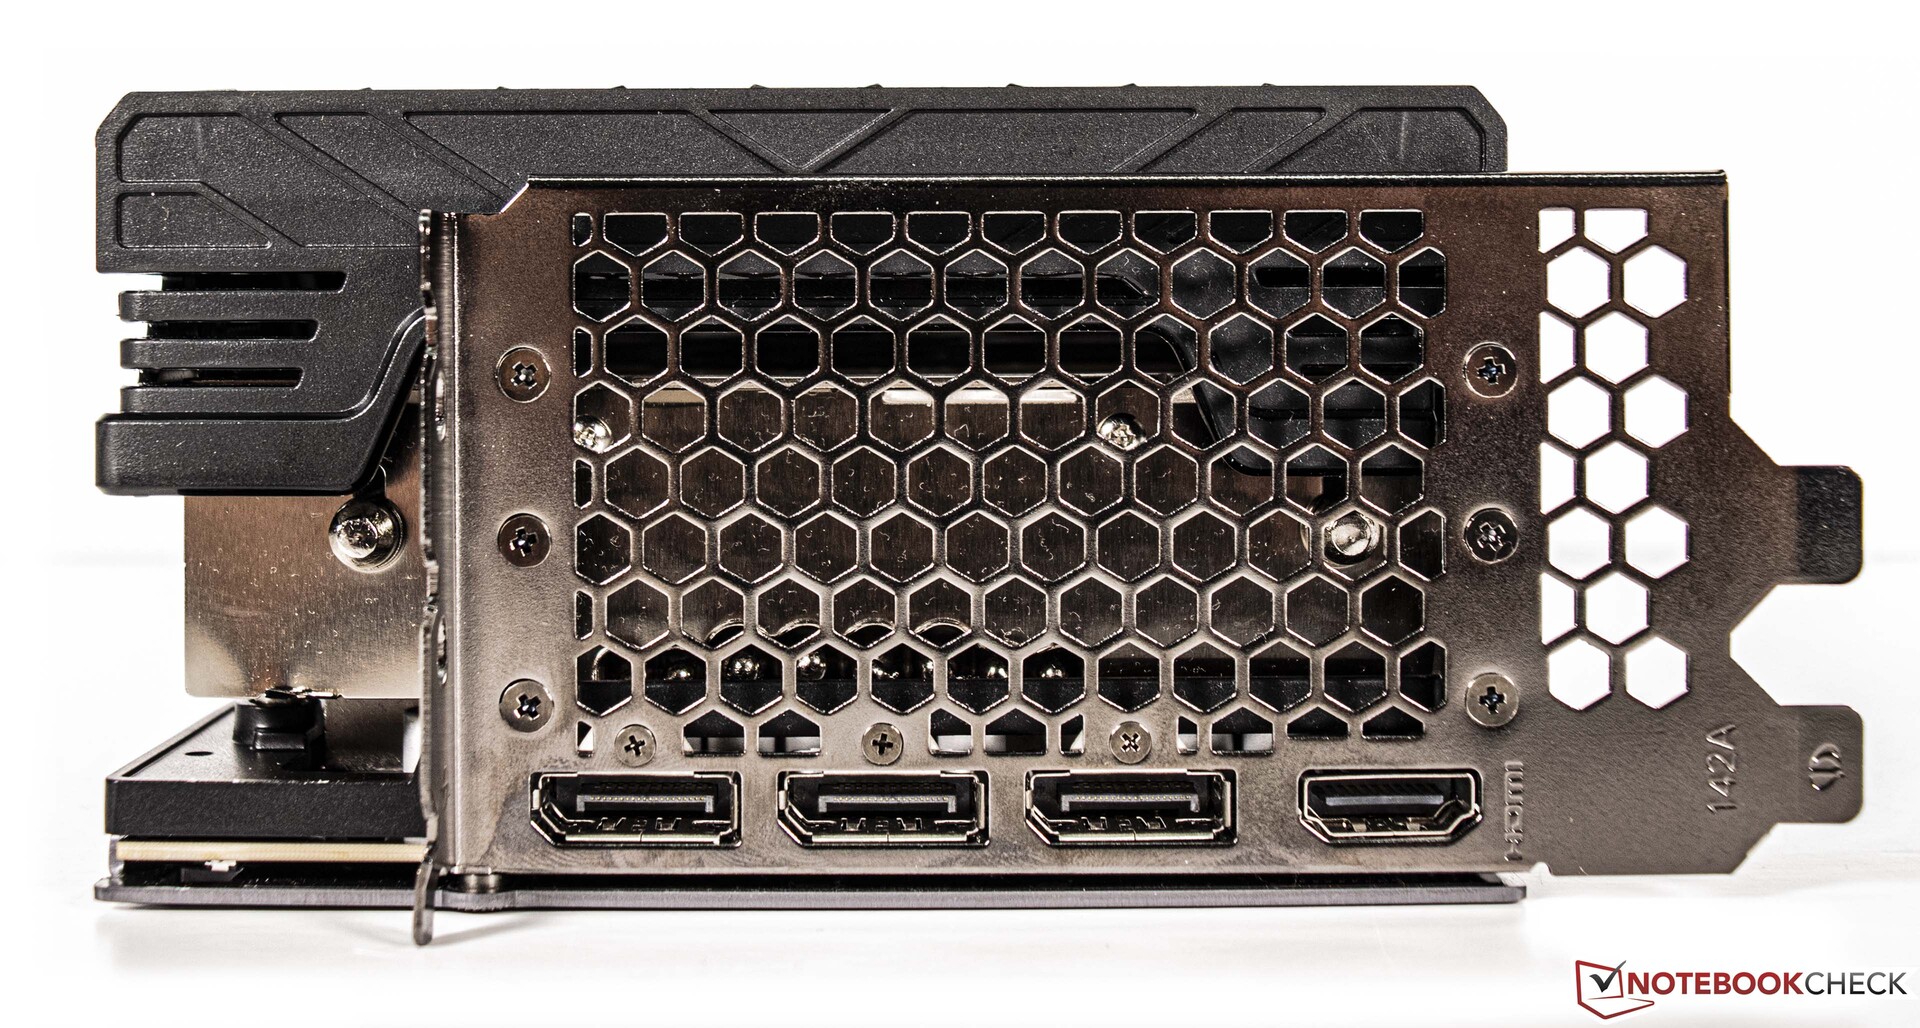
Extern bietet die Palit GeForce RTX 4090 GameRock OC 1x HDMI 2.1a und 3x DisplayPort 1.4a.

Die Specs der GeForce-Grafikkarten im Vergleich
| Ausstattung | RTX 4090 (FE) | RTX 4080 | RTX 3090 Ti | RTX 3090 (FE) | RTX 3080 Ti (FE) | RTX 3080 (FE) | Titan RTX |
| Chip | AD102 | AD103 | GA102 | GA102 | GA102 | GA102 | TU102 |
| FinFET Prozess | 4 nm | 4 nm | 8 nm | 8 nm | 8 nm | 8 nm | 12 nm |
| CUDA Cores | 16384 | 9728 | 10752 | 10,496 | 10240 | 8.704 | 4.608 |
| Texture Units | 512 | 304 | 336 | 328 | 320 | 272 | 288 |
| Tensor Cores | 512 4. Gen. | 304 4. Gen. | 336 3. Gen. | 328 3. Gen. | 320 3. Gen. | 272 3. Gen. | 576 2. Gen. |
| RT Cores | 128 | 76 | 84 | 82 | 80 | 68 | 72 |
| GPU Base Clock | 2.235 MHz | 2.205 | 1.560 MHz | 1.395 MHz | 1.365 MHz | 1.440 MHz | 1.350 MHz |
| GPU Boost Clock | 2.520 MHz | 2.505 | 1.860 MHz | 1.695 MHz | 1.665 MHz | 1.710 MHz | 1.770 MHz |
| Memory Bus | 384 bit | 256 Bit | 384 bit | 384 bit | 384 bit | 320 bit | 384-bit |
| Memory Bandwidth | 1.008 GB/s | 735.7 GB/s | 1.008 GB/s | 936 GB/s | 912.4 GB/s | 760 GB/s | 672 GB/s |
| Video Memory | 24 GB GDDR6X | 16 GB GDDR6X | 24 GB GDDR6X | 24 GB GDDR6X | 12 GB GDDR6X | 10 GB GDDR6X | 24 GB GDDR6 |
| Energieverbrauch | 450 W | 320 W | 450 W | 350 W | 350 W | 320 W | 280 W |
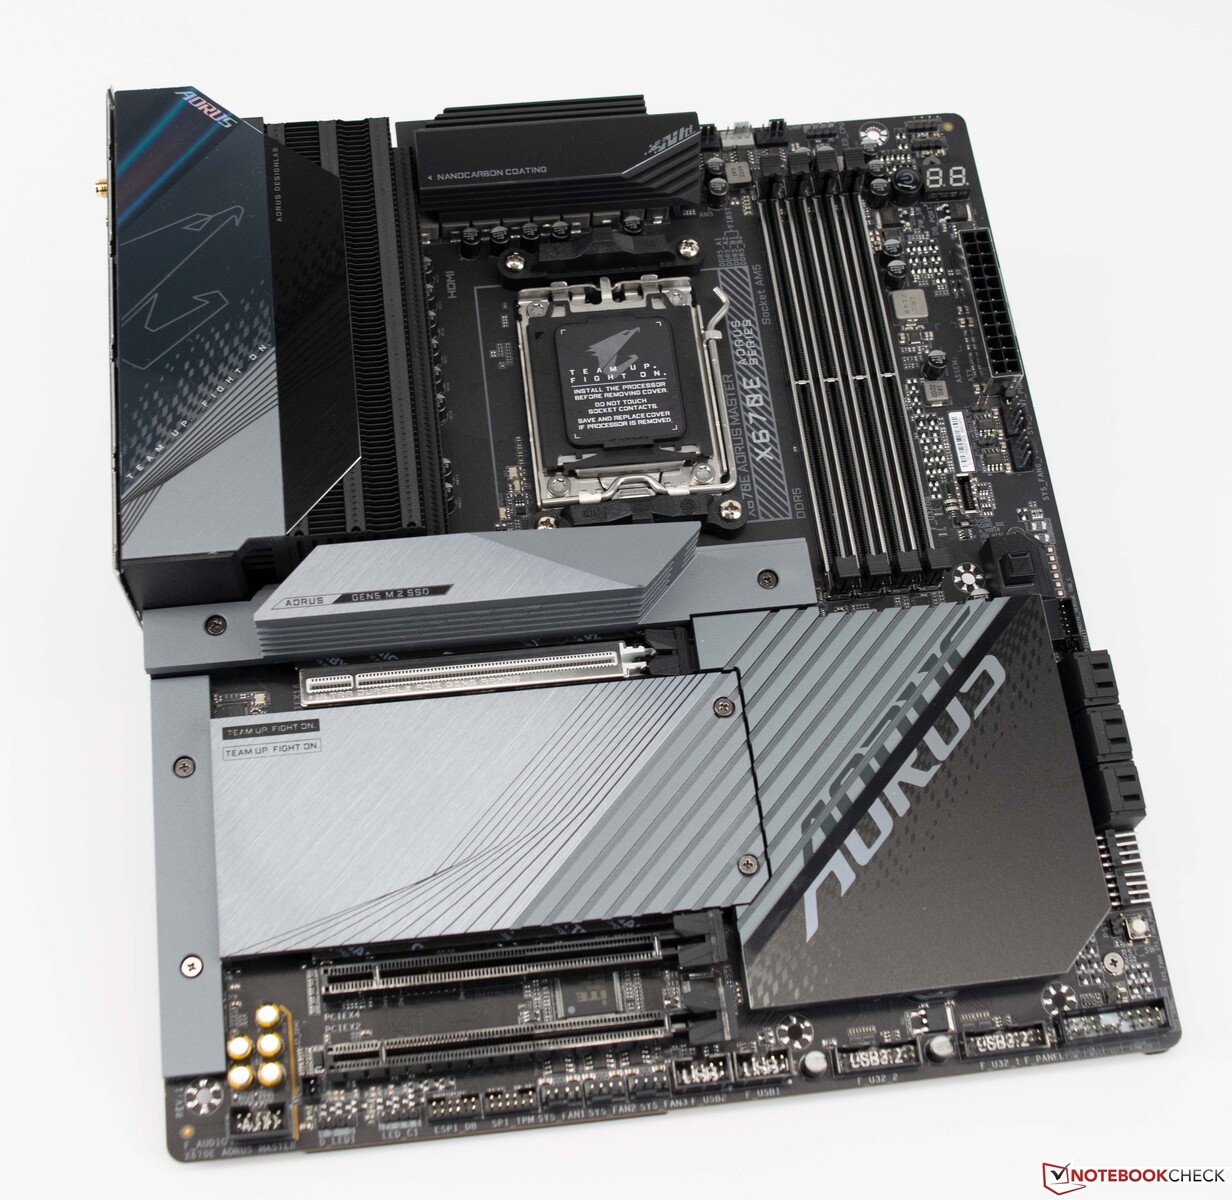
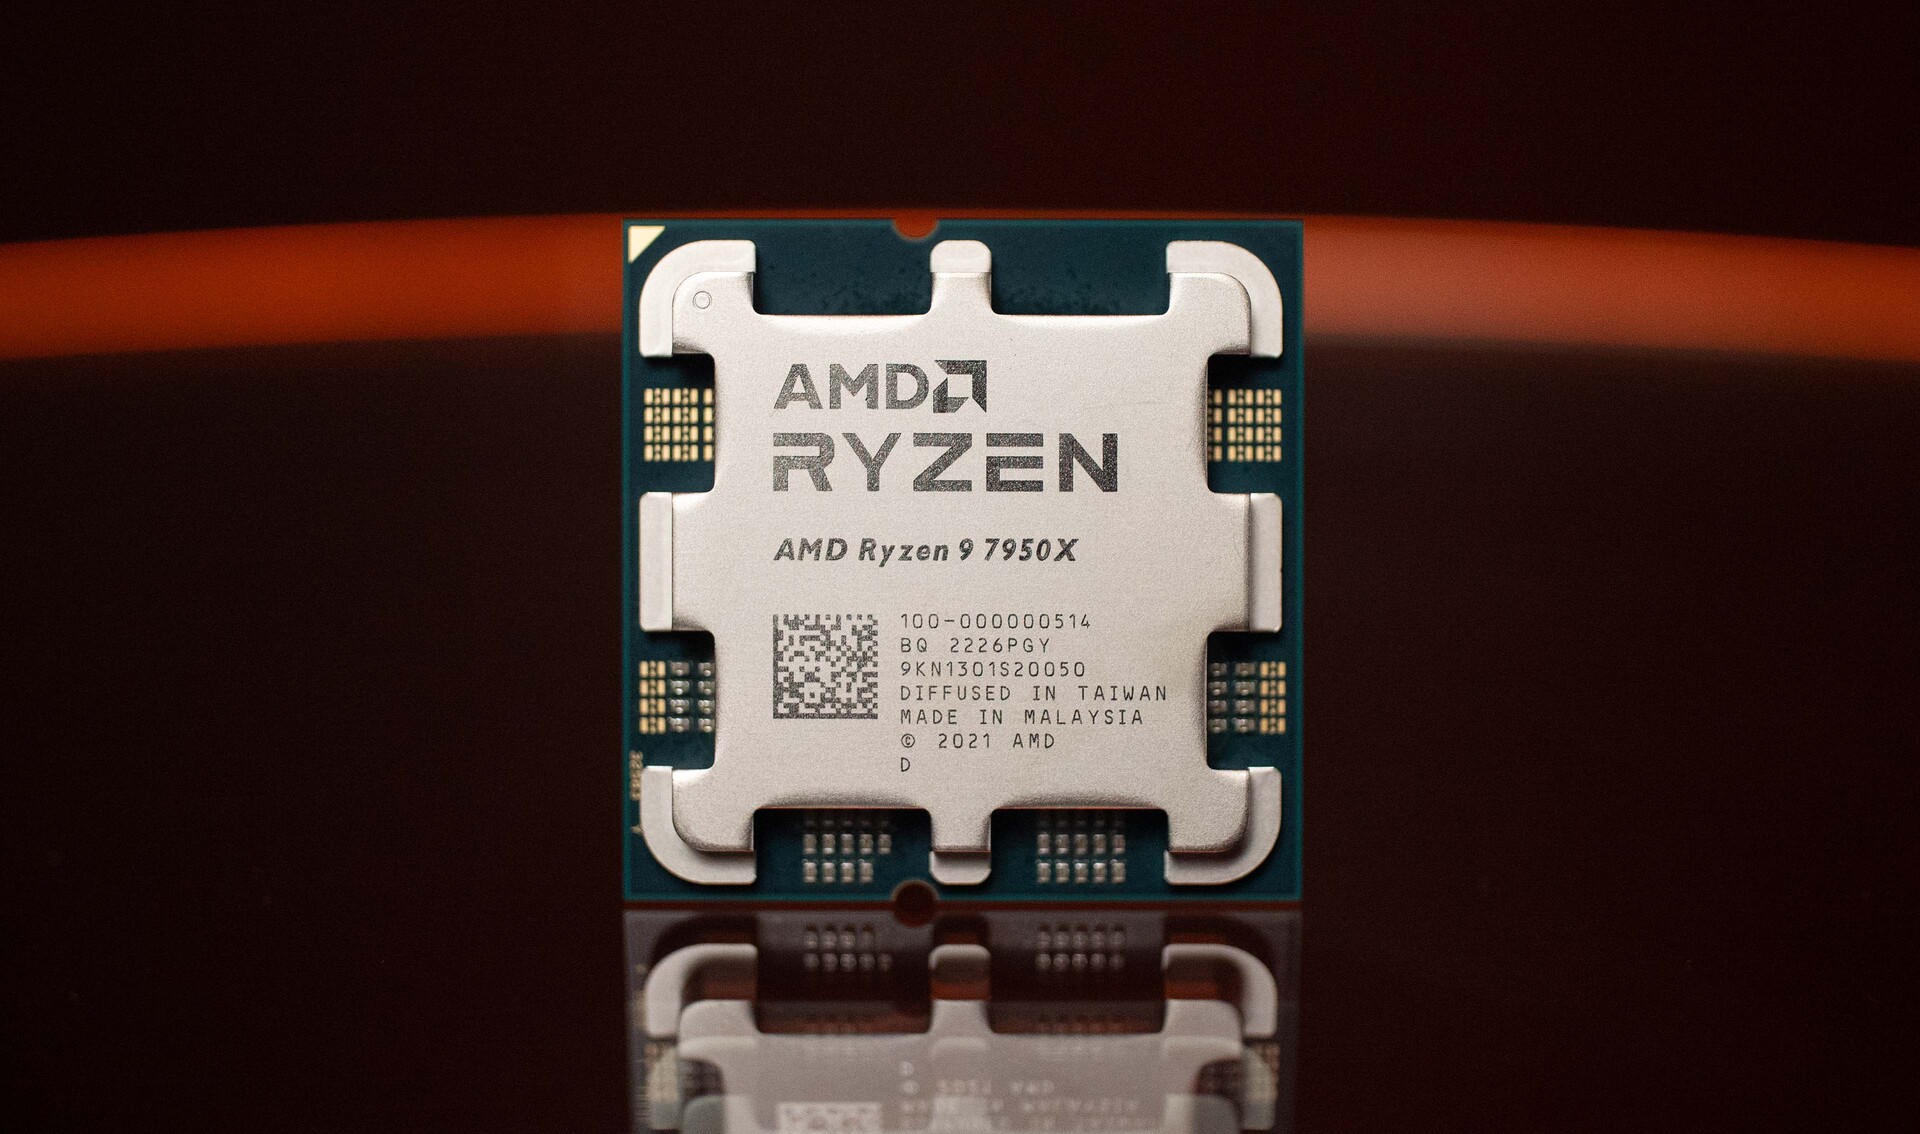
Unser Testsystem mit AMD Ryzen 9 7950X als Basis
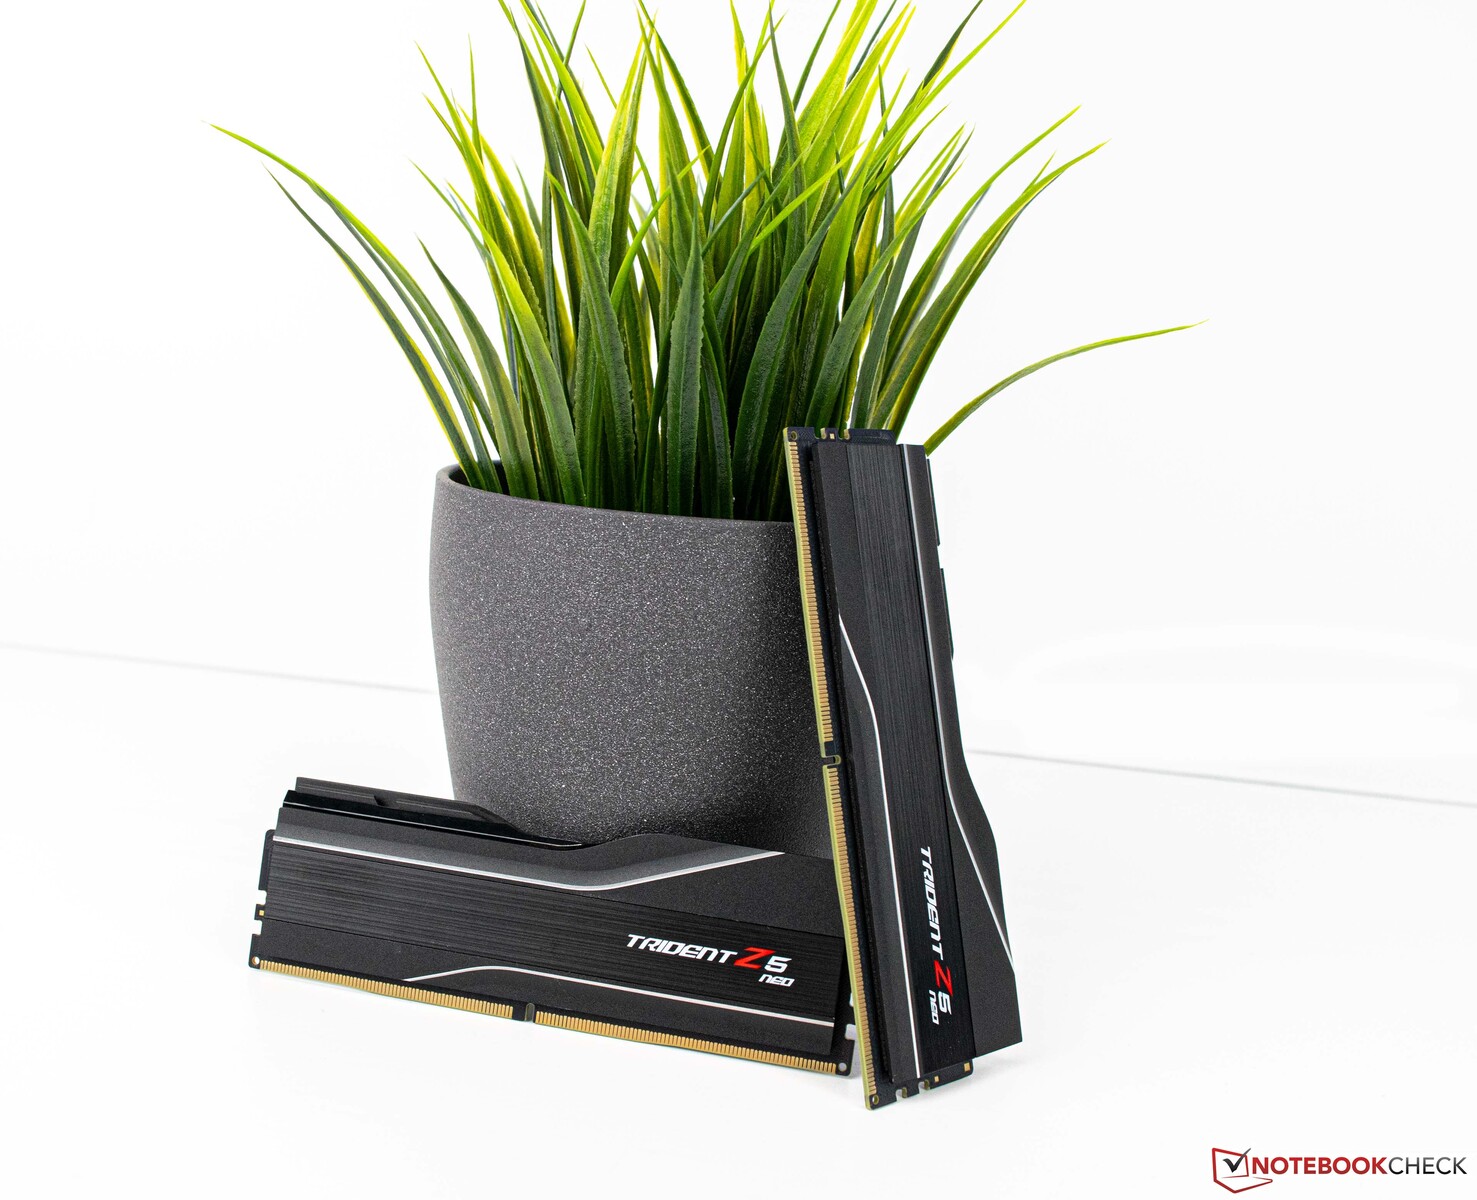
Als Testsystem dient eine aktuelle AMD-Plattform auf Basis des Gigabyte X670E Aorus Master. Die CPU (AMD Ryzen 9 7950X) bietet eine gute CPU-Leistung und als Kühlung nutzen wir eine AiO-Lösung von Alphacool (Alphacool Eisbear Aurora 360 mm). Der 32-GB-Arbeitsspeicher stammt von G.Skill und wird mit dem passenden EXPO-Profil betrieben. Als Monitor nutzen wir den Gigabyte M32U.
Das Testsystem im Detail
Für die folgenden Benchmarks und Tests nutzen wir folgendes System:
- Lian-Li O11 Dynamic
- AMD Ryzen 9 7950X
- Gigabyte X670E Aorus Master, BIOS: F8a
- Alphacool Eisbear 360 AiO
- Corsair RM 1000x Netzteil
- G.Skill Trident Z5 Neo DDR5-6000 2x 16 GB, EXPO (DDR5-6000 CL30-38-38-96)
- Corsair MP600 2 TB
- Crucial MX500 2 TB
- Microsoft Windows 11 Professional 64-Bit (Version 22H2)
Synthetische Benchmarks
Bei den synthetischen Tests bekommen wir schon einmal sehr gut verdeutlicht, wozu die neue Nvidia GeForce RTX 4090 imstande ist. Die Leistung der aktuellen Topmodelle wird nahezu pulverisiert und im gesamten Rating der synthetischen Benchmarks kann die Palit GeForce RTX 4090 GameRock OC die Nvidia GeForce RTX 3090 Ti um 52 Prozent übertreffen. Das bisherige Topmodell von AMD (AMD Radeon RX 6950 XT) muss sich noch weiter hinten einsortieren und landet hinter der Nvidia GeForce RTX 3090 Founders Edition auf dem vierten Platz.
| Performance Rating - Percent | |
| NVIDIA GeForce RTX 4090 | |
| NVIDIA Titan RTX | |
| AMD Radeon RX 6950 XT | |
| NVIDIA GeForce RTX 3090 | |
| NVIDIA GeForce RTX 3090 Ti -8! | |
| AMD Radeon RX 6900 XT | |
| NVIDIA GeForce RTX 3080 12 GB | |
| 3DMark | |
| 2560x1440 Time Spy Graphics | |
| NVIDIA GeForce RTX 4090 | |
| AMD Radeon RX 6950 XT | |
| NVIDIA GeForce RTX 3090 Ti | |
| NVIDIA GeForce RTX 3090 | |
| AMD Radeon RX 6900 XT | |
| NVIDIA GeForce RTX 3080 12 GB | |
| NVIDIA Titan RTX | |
| Fire Strike Extreme Graphics | |
| NVIDIA GeForce RTX 4090 | |
| AMD Radeon RX 6950 XT | |
| NVIDIA GeForce RTX 3090 Ti | |
| AMD Radeon RX 6900 XT | |
| NVIDIA GeForce RTX 3090 | |
| NVIDIA GeForce RTX 3080 12 GB | |
| NVIDIA Titan RTX | |
| 3840x2160 Fire Strike Ultra Graphics | |
| NVIDIA GeForce RTX 4090 | |
| AMD Radeon RX 6950 XT | |
| NVIDIA GeForce RTX 3090 Ti | |
| AMD Radeon RX 6900 XT | |
| NVIDIA GeForce RTX 3090 | |
| NVIDIA GeForce RTX 3080 12 GB | |
| NVIDIA Titan RTX | |
| 1920x1080 Fire Strike Graphics | |
| NVIDIA GeForce RTX 4090 | |
| AMD Radeon RX 6950 XT | |
| NVIDIA GeForce RTX 3090 Ti | |
| AMD Radeon RX 6900 XT | |
| NVIDIA GeForce RTX 3090 | |
| NVIDIA GeForce RTX 3080 12 GB | |
| NVIDIA Titan RTX | |
| Unigine Superposition | |
| 7680x4320 8k Optimized | |
| NVIDIA GeForce RTX 4090 | |
| NVIDIA GeForce RTX 3090 Ti | |
| NVIDIA GeForce RTX 3090 | |
| AMD Radeon RX 6950 XT | |
| NVIDIA GeForce RTX 3080 12 GB | |
| AMD Radeon RX 6900 XT | |
| NVIDIA Titan RTX | |
| 3840x2160 4k Optimized | |
| NVIDIA GeForce RTX 4090 | |
| NVIDIA GeForce RTX 3090 Ti | |
| AMD Radeon RX 6950 XT | |
| NVIDIA GeForce RTX 3090 | |
| NVIDIA GeForce RTX 3080 12 GB | |
| AMD Radeon RX 6900 XT | |
| NVIDIA Titan RTX | |
| 1920x1080 1080p Extreme | |
| NVIDIA GeForce RTX 4090 | |
| NVIDIA GeForce RTX 3090 Ti | |
| AMD Radeon RX 6950 XT | |
| NVIDIA GeForce RTX 3090 | |
| NVIDIA GeForce RTX 3080 12 GB | |
| AMD Radeon RX 6900 XT | |
| NVIDIA Titan RTX | |
| 1920x1080 1080p High | |
| NVIDIA GeForce RTX 4090 | |
| NVIDIA GeForce RTX 3090 Ti | |
| AMD Radeon RX 6950 XT | |
| NVIDIA GeForce RTX 3090 | |
| AMD Radeon RX 6900 XT | |
| NVIDIA GeForce RTX 3080 12 GB | |
| NVIDIA Titan RTX | |
| 1280x720 720p Low | |
| NVIDIA GeForce RTX 4090 | |
| NVIDIA Titan RTX | |
| NVIDIA GeForce RTX 3090 | |
| NVIDIA GeForce RTX 3090 Ti | |
| NVIDIA GeForce RTX 3080 12 GB | |
| AMD Radeon RX 6900 XT | |
| AMD Radeon RX 6950 XT | |
| Unigine Heaven 4.0 | |
| Extreme Preset DX11 | |
| NVIDIA GeForce RTX 4090 | |
| NVIDIA GeForce RTX 3090 | |
| NVIDIA GeForce RTX 3090 Ti | |
| AMD Radeon RX 6950 XT | |
| NVIDIA GeForce RTX 3080 12 GB | |
| AMD Radeon RX 6900 XT | |
| NVIDIA Titan RTX | |
| Extreme Preset OpenGL | |
| NVIDIA GeForce RTX 4090 | |
| NVIDIA GeForce RTX 3090 Ti | |
| NVIDIA GeForce RTX 3090 | |
| NVIDIA GeForce RTX 3080 12 GB | |
| AMD Radeon RX 6950 XT | |
| NVIDIA Titan RTX | |
| AMD Radeon RX 6900 XT | |
| Unigine Valley 1.0 | |
| 1920x1080 Extreme HD DirectX AA:x8 | |
| NVIDIA GeForce RTX 4090 | |
| NVIDIA GeForce RTX 3090 | |
| AMD Radeon RX 6950 XT | |
| NVIDIA GeForce RTX 3080 12 GB | |
| NVIDIA GeForce RTX 3090 Ti | |
| AMD Radeon RX 6900 XT | |
| NVIDIA Titan RTX | |
| 1920x1080 Extreme HD Preset OpenGL AA:x8 | |
| NVIDIA GeForce RTX 4090 | |
| NVIDIA GeForce RTX 3090 Ti | |
| NVIDIA GeForce RTX 3090 | |
| NVIDIA GeForce RTX 3080 12 GB | |
| AMD Radeon RX 6950 XT | |
| AMD Radeon RX 6900 XT | |
| NVIDIA Titan RTX | |
| 3DMark 11 | |
| 1280x720 Performance GPU | |
| NVIDIA GeForce RTX 4090 | |
| AMD Radeon RX 6950 XT | |
| NVIDIA GeForce RTX 3090 Ti | |
| NVIDIA GeForce RTX 3090 | |
| AMD Radeon RX 6900 XT | |
| NVIDIA GeForce RTX 3080 12 GB | |
| NVIDIA Titan RTX | |
| 1280x720 Performance | |
| NVIDIA GeForce RTX 4090 | |
| NVIDIA GeForce RTX 3090 Ti | |
| NVIDIA GeForce RTX 3090 | |
| NVIDIA Titan RTX | |
| AMD Radeon RX 6950 XT | |
| AMD Radeon RX 6900 XT | |
| NVIDIA GeForce RTX 3080 12 GB | |
| ComputeMark v2.1 | |
| 1024x600 Normal, QJuliaRayTrace | |
| NVIDIA GeForce RTX 4090 | |
| NVIDIA GeForce RTX 3090 | |
| NVIDIA GeForce RTX 3080 12 GB | |
| AMD Radeon RX 6950 XT | |
| AMD Radeon RX 6900 XT | |
| NVIDIA Titan RTX | |
| 1024x600 Normal, Mandel Scalar | |
| NVIDIA GeForce RTX 4090 | |
| AMD Radeon RX 6950 XT | |
| NVIDIA GeForce RTX 3090 | |
| AMD Radeon RX 6900 XT | |
| NVIDIA GeForce RTX 3080 12 GB | |
| NVIDIA Titan RTX | |
| 1024x600 Normal, Mandel Vector | |
| NVIDIA GeForce RTX 4090 | |
| NVIDIA GeForce RTX 3090 | |
| AMD Radeon RX 6950 XT | |
| AMD Radeon RX 6900 XT | |
| NVIDIA GeForce RTX 3080 12 GB | |
| NVIDIA Titan RTX | |
| 1024x600 Normal, Fluid 2DTexArr | |
| NVIDIA GeForce RTX 4090 | |
| NVIDIA GeForce RTX 3090 | |
| AMD Radeon RX 6950 XT | |
| NVIDIA GeForce RTX 3080 12 GB | |
| AMD Radeon RX 6900 XT | |
| NVIDIA Titan RTX | |
| 1024x600 Normal, Fluid 3DTex | |
| NVIDIA GeForce RTX 4090 | |
| AMD Radeon RX 6950 XT | |
| NVIDIA GeForce RTX 3090 | |
| AMD Radeon RX 6900 XT | |
| NVIDIA GeForce RTX 3080 12 GB | |
| NVIDIA Titan RTX | |
| 1024x600 Normal, Score | |
| NVIDIA GeForce RTX 4090 | |
| NVIDIA GeForce RTX 3090 | |
| AMD Radeon RX 6950 XT | |
| NVIDIA GeForce RTX 3080 12 GB | |
| AMD Radeon RX 6900 XT | |
| NVIDIA Titan RTX | |
| LuxMark v2.0 64Bit | |
| Sala GPUs-only | |
| AMD Radeon RX 6950 XT | |
| AMD Radeon RX 6900 XT | |
| NVIDIA GeForce RTX 4090 | |
| NVIDIA GeForce RTX 3090 | |
| NVIDIA GeForce RTX 3080 12 GB | |
| NVIDIA Titan RTX | |
| Room GPUs-only | |
| NVIDIA GeForce RTX 4090 | |
| NVIDIA GeForce RTX 3090 | |
| NVIDIA GeForce RTX 3080 12 GB | |
| AMD Radeon RX 6950 XT | |
| AMD Radeon RX 6900 XT | |
| NVIDIA Titan RTX | |
Palit GeForce RTX 4090 GameRock OC mit Ryzen 9 vs. Core i9
| Performance Rating - Percent | |
| NVIDIA GeForce RTX 4090, AMD Ryzen 9 7950X | |
| NVIDIA GeForce RTX 4090, Intel Core i9-13900K | |
| 3DMark | |
| 2560x1440 Time Spy Graphics | |
| NVIDIA GeForce RTX 4090, Intel Core i9-13900K | |
| NVIDIA GeForce RTX 4090, AMD Ryzen 9 7950X | |
| Fire Strike Extreme Graphics | |
| NVIDIA GeForce RTX 4090, AMD Ryzen 9 7950X | |
| NVIDIA GeForce RTX 4090, Intel Core i9-13900K | |
| 3840x2160 Fire Strike Ultra Graphics | |
| NVIDIA GeForce RTX 4090, Intel Core i9-13900K | |
| NVIDIA GeForce RTX 4090, AMD Ryzen 9 7950X | |
| 1920x1080 Fire Strike Graphics | |
| NVIDIA GeForce RTX 4090, AMD Ryzen 9 7950X | |
| NVIDIA GeForce RTX 4090, Intel Core i9-13900K | |
| Unigine Superposition | |
| 7680x4320 8k Optimized | |
| NVIDIA GeForce RTX 4090, AMD Ryzen 9 7950X | |
| NVIDIA GeForce RTX 4090, Intel Core i9-13900K | |
| 3840x2160 4k Optimized | |
| NVIDIA GeForce RTX 4090, Intel Core i9-13900K | |
| NVIDIA GeForce RTX 4090, AMD Ryzen 9 7950X | |
| 1920x1080 1080p Extreme | |
| NVIDIA GeForce RTX 4090, Intel Core i9-13900K | |
| NVIDIA GeForce RTX 4090, AMD Ryzen 9 7950X | |
| 1920x1080 1080p High | |
| NVIDIA GeForce RTX 4090, Intel Core i9-13900K | |
| NVIDIA GeForce RTX 4090, AMD Ryzen 9 7950X | |
| 1280x720 720p Low | |
| NVIDIA GeForce RTX 4090, Intel Core i9-13900K | |
| NVIDIA GeForce RTX 4090, AMD Ryzen 9 7950X | |
| Unigine Heaven 4.0 | |
| Extreme Preset DX11 | |
| NVIDIA GeForce RTX 4090, AMD Ryzen 9 7950X | |
| NVIDIA GeForce RTX 4090, Intel Core i9-13900K | |
| Extreme Preset OpenGL | |
| NVIDIA GeForce RTX 4090, Intel Core i9-13900K | |
| NVIDIA GeForce RTX 4090, AMD Ryzen 9 7950X | |
| Unigine Valley 1.0 | |
| 1920x1080 Extreme HD DirectX AA:x8 | |
| NVIDIA GeForce RTX 4090, Intel Core i9-13900K | |
| NVIDIA GeForce RTX 4090, AMD Ryzen 9 7950X | |
| 1920x1080 Extreme HD Preset OpenGL AA:x8 | |
| NVIDIA GeForce RTX 4090, Intel Core i9-13900K | |
| NVIDIA GeForce RTX 4090, AMD Ryzen 9 7950X | |
| 3DMark 11 | |
| 1280x720 Performance GPU | |
| NVIDIA GeForce RTX 4090, AMD Ryzen 9 7950X | |
| NVIDIA GeForce RTX 4090, Intel Core i9-13900K | |
| 1280x720 Performance | |
| NVIDIA GeForce RTX 4090, AMD Ryzen 9 7950X | |
| NVIDIA GeForce RTX 4090, Intel Core i9-13900K | |
Compute-Benchmarks und professionelle Anwendungen
| ComputeMark v2.1 | |
| 1024x600 Normal, QJuliaRayTrace | |
| NVIDIA GeForce RTX 4090 | |
| NVIDIA GeForce RTX 3090 | |
| NVIDIA GeForce RTX 3080 12 GB | |
| AMD Radeon RX 6950 XT | |
| AMD Radeon RX 6900 XT | |
| NVIDIA Titan RTX | |
| 1024x600 Normal, Mandel Scalar | |
| NVIDIA GeForce RTX 4090 | |
| AMD Radeon RX 6950 XT | |
| NVIDIA GeForce RTX 3090 | |
| AMD Radeon RX 6900 XT | |
| NVIDIA GeForce RTX 3080 12 GB | |
| NVIDIA Titan RTX | |
| 1024x600 Normal, Mandel Vector | |
| NVIDIA GeForce RTX 4090 | |
| NVIDIA GeForce RTX 3090 | |
| AMD Radeon RX 6950 XT | |
| AMD Radeon RX 6900 XT | |
| NVIDIA GeForce RTX 3080 12 GB | |
| NVIDIA Titan RTX | |
| 1024x600 Normal, Fluid 2DTexArr | |
| NVIDIA GeForce RTX 4090 | |
| NVIDIA GeForce RTX 3090 | |
| AMD Radeon RX 6950 XT | |
| NVIDIA GeForce RTX 3080 12 GB | |
| AMD Radeon RX 6900 XT | |
| NVIDIA Titan RTX | |
| 1024x600 Normal, Fluid 3DTex | |
| NVIDIA GeForce RTX 4090 | |
| AMD Radeon RX 6950 XT | |
| NVIDIA GeForce RTX 3090 | |
| AMD Radeon RX 6900 XT | |
| NVIDIA GeForce RTX 3080 12 GB | |
| NVIDIA Titan RTX | |
| 1024x600 Normal, Score | |
| NVIDIA GeForce RTX 4090 | |
| NVIDIA GeForce RTX 3090 | |
| AMD Radeon RX 6950 XT | |
| NVIDIA GeForce RTX 3080 12 GB | |
| AMD Radeon RX 6900 XT | |
| NVIDIA Titan RTX | |
| LuxMark v2.0 64Bit | |
| Sala GPUs-only | |
| AMD Radeon RX 6950 XT | |
| AMD Radeon RX 6900 XT | |
| NVIDIA GeForce RTX 4090 | |
| NVIDIA GeForce RTX 3090 | |
| NVIDIA GeForce RTX 3080 12 GB | |
| NVIDIA Titan RTX | |
| Room GPUs-only | |
| NVIDIA GeForce RTX 4090 | |
| NVIDIA GeForce RTX 3090 | |
| NVIDIA GeForce RTX 3080 12 GB | |
| AMD Radeon RX 6950 XT | |
| AMD Radeon RX 6900 XT | |
| NVIDIA Titan RTX | |
| Blender - v3.3 Classroom CUDA | |
| NVIDIA Titan RTX | |
| Geekbench 5.5 | |
| OpenCL Score | |
| NVIDIA GeForce RTX 4090 | |
| NVIDIA GeForce RTX 3090 Ti | |
| NVIDIA GeForce RTX 3090 | |
| NVIDIA GeForce RTX 3080 12 GB | |
| AMD Radeon RX 6950 XT | |
| AMD Radeon RX 6900 XT | |
| NVIDIA Titan RTX | |
| Vulkan Score | |
| NVIDIA GeForce RTX 3090 Ti | |
| NVIDIA GeForce RTX 4090 | |
| NVIDIA Titan RTX | |
| NVIDIA GeForce RTX 3090 | |
| AMD Radeon RX 6900 XT | |
| AMD Radeon RX 6950 XT | |
| NVIDIA GeForce RTX 3080 12 GB | |
| V-Ray 5 Benchmark | |
| GPU CUDA | |
| NVIDIA GeForce RTX 4090 | |
| NVIDIA GeForce RTX 3090 | |
| NVIDIA GeForce RTX 3080 12 GB | |
| AMD Radeon RX 6950 XT | |
| GPU RTX | |
| NVIDIA GeForce RTX 4090 | |
| NVIDIA GeForce RTX 3090 | |
* ... kleinere Werte sind besser
Spielebenchmarks
Die sehr gute Performance bei den synthetischen Benchmarks kann die Palit GeForce RTX 4090 GameRock OC auch in den Spieletests zeigen. 50 bis 60 Prozent mehr Leistung sind durchaus kein Problem. AMD ist auch hier weit abgeschlagen. Gleichwohl steht die neue AMD Radeon RX 7900 XTX schon in den Startlöchern.
Für einen fairen Vergleich haben wir die Palit GeForce RTX 4090 GameRock OC ebenfalls einmal mit dem Intel Core i9-13900K getestet. Hier kann nochmals etwas mehr Leistung aus der Grafikkarte herausgeholt werden. Das bestätigt noch einmal, dass Intel aktuell mit dem Core i9-13900K die schnellste Gaming-CPU bietet. Dennoch ist die Performance im Zusammenspiel mit dem AMD Ryzen 9 7950X nicht zu vernachlässigen. Wenn man aber alle FPS aus der Grafikkarte quetschen will, kommt man aktuell um eine Intel-Plattform nicht herum.
Aufgrund der enormen Leistung der Palit GeForce RTX 4090 GameRock OC sollte zwingend ein 4K-Display verwendet werden. Und selbst in dieser hohen Auflösung erreichen wir mitunter immer mal wieder das CPU-Limit, was die GPU etwas ausbremst. Aktuell gibt es nur wenige Spiele, wie beispielsweise Cyberpunk 2077, F1 2022 oder The Quarry, welche die GeForce RTX 4090 in 4K richtig ins Schwitzen bringen. Mit Features wie DLSS kann man diesem aber entgegenwirken, sodass auch hier wieder locker dreistellige Frameraten erreicht werden. Alle Benchmarkergebnisse haben wir ohne Nvidias DLSS ermittelt.
Mit der neuen Schnittstelle DLSS 3.0, welche als Basis DLSS 2.0 ist und mit dem Feature Set Frame Generation (FG) erweitert wurde, lassen sich mitunter die Frameraten drastisch steigen. Als bekanntestes Spiel ist hier Cyberpunk 2077 zu nennen. In nativer 4K-Auflösung und dem Raytracing-Ultra-Preset dümpelt selbst die GeForce RTX 4090 nur noch mit knapp 43 FPS im Schnitt herum. Mit aktiviertem DLSS sind dann locker über 100 Bilder pro Sekunde möglich, was die Leistung hier nahezu verdreifacht. DLSS 3.0 setzt hierbei auf die Tensor-Kerne der 4. Generation, welche aktuell ausschließlich bei der RTX-4000-Serie zum Einsatz kommen. Eine Liste mit Spielen, die schon DLSS 3.0 unterstützen oder zukünftig mit diesem Feature ausgestattet werden, finden Sie hier.
| GTA V - 3840x2160 High/On (Advanced Graphics Off) AA:FX AF:8x | |
| NVIDIA GeForce RTX 4090, AMD Ryzen 9 7950X | |
| NVIDIA GeForce RTX 3090 Ti, AMD Ryzen 7 5800X3D | |
| NVIDIA GeForce RTX 3090, AMD Ryzen 9 7950X | |
| AMD Radeon RX 6950 XT, AMD Ryzen 9 5900X | |
| NVIDIA GeForce RTX 3080 12 GB, AMD Ryzen 9 5900X | |
| NVIDIA Titan RTX, AMD Ryzen 9 7950X | |
| The Witcher 3 - 3840x2160 High Graphics & Postprocessing (Nvidia HairWorks Off) | |
| NVIDIA GeForce RTX 4090, AMD Ryzen 9 7950X | |
| NVIDIA GeForce RTX 3090 Ti, AMD Ryzen 7 5800X3D | |
| NVIDIA GeForce RTX 3090, AMD Ryzen 9 7950X | |
| AMD Radeon RX 6950 XT, AMD Ryzen 9 5900X | |
| NVIDIA GeForce RTX 3080 12 GB, AMD Ryzen 9 5900X | |
| AMD Radeon RX 6900 XT, AMD Ryzen 9 5950X | |
| NVIDIA Titan RTX, AMD Ryzen 9 7950X | |
| Final Fantasy XV Benchmark - 3840x2160 High Quality | |
| NVIDIA GeForce RTX 4090, AMD Ryzen 9 7950X | |
| NVIDIA GeForce RTX 3090 Ti, AMD Ryzen 7 5800X3D | |
| NVIDIA GeForce RTX 3090, AMD Ryzen 9 7950X | |
| AMD Radeon RX 6950 XT, AMD Ryzen 9 5900X | |
| NVIDIA GeForce RTX 3080 12 GB, AMD Ryzen 9 5900X | |
| NVIDIA Titan RTX, AMD Ryzen 9 7950X | |
| Strange Brigade - 3840x2160 ultra AA:ultra AF:16 | |
| NVIDIA GeForce RTX 4090, AMD Ryzen 9 7950X | |
| AMD Radeon RX 6950 XT, AMD Ryzen 9 5900X | |
| NVIDIA GeForce RTX 3090, AMD Ryzen 9 7950X | |
| NVIDIA GeForce RTX 3080 12 GB, AMD Ryzen 9 5900X | |
| NVIDIA Titan RTX, AMD Ryzen 9 7950X | |
| Far Cry 5 - 3840x2160 Ultra Preset AA:T | |
| NVIDIA GeForce RTX 4090, AMD Ryzen 9 7950X | |
| AMD Radeon RX 6950 XT, AMD Ryzen 9 5900X | |
| NVIDIA GeForce RTX 3090, AMD Ryzen 9 7950X | |
| NVIDIA GeForce RTX 3080 12 GB, AMD Ryzen 9 5900X | |
| NVIDIA Titan RTX, AMD Ryzen 9 7950X | |
| Far Cry New Dawn - 3840x2160 Ultra Preset | |
| NVIDIA GeForce RTX 4090, AMD Ryzen 9 7950X | |
| AMD Radeon RX 6950 XT, AMD Ryzen 9 5900X | |
| NVIDIA GeForce RTX 3090, AMD Ryzen 9 7950X | |
| AMD Radeon RX 6900 XT, AMD Ryzen 9 5950X | |
| NVIDIA GeForce RTX 3080 12 GB, AMD Ryzen 9 5900X | |
| NVIDIA Titan RTX, AMD Ryzen 9 7950X | |
| Far Cry 6 - 3840x2160 Ultra Graphics Quality + HD Textures AA:T | |
| NVIDIA GeForce RTX 4090, AMD Ryzen 9 7950X | |
| NVIDIA GeForce RTX 3090 Ti, AMD Ryzen 7 5800X3D | |
| AMD Radeon RX 6950 XT, AMD Ryzen 9 5900X | |
| NVIDIA GeForce RTX 3090, AMD Ryzen 9 7950X | |
| NVIDIA Titan RTX, AMD Ryzen 9 7950X | |
| NVIDIA GeForce RTX 3080 12 GB, AMD Ryzen 9 5900X | |
| Metro Exodus - 3840x2160 Ultra Quality AF:16x | |
| NVIDIA GeForce RTX 4090, AMD Ryzen 9 7950X | |
| NVIDIA GeForce RTX 3090 Ti, AMD Ryzen 7 5800X3D | |
| NVIDIA GeForce RTX 3090, AMD Ryzen 9 7950X | |
| AMD Radeon RX 6950 XT, AMD Ryzen 9 5900X | |
| AMD Radeon RX 6900 XT, AMD Ryzen 9 5950X | |
| NVIDIA GeForce RTX 3080 12 GB, AMD Ryzen 9 5900X | |
| NVIDIA Titan RTX, AMD Ryzen 9 7950X | |
| F1 2020 - 3840x2160 Ultra High Preset AA:T AF:16x | |
| NVIDIA GeForce RTX 4090, AMD Ryzen 9 7950X | |
| AMD Radeon RX 6950 XT, AMD Ryzen 9 5900X | |
| NVIDIA GeForce RTX 3090, AMD Ryzen 9 7950X | |
| AMD Radeon RX 6900 XT, AMD Ryzen 9 5950X | |
| AMD Radeon RX 6900 XT, AMD Ryzen 9 5950X | |
| NVIDIA GeForce RTX 3080 12 GB, AMD Ryzen 9 5900X | |
| NVIDIA Titan RTX, AMD Ryzen 9 7950X | |
| F1 2021 - 3840x2160 Ultra High Preset + Raytracing AA:T AF:16x | |
| NVIDIA GeForce RTX 4090, AMD Ryzen 9 7950X | |
| NVIDIA GeForce RTX 3090 Ti, AMD Ryzen 7 5800X3D | |
| NVIDIA GeForce RTX 3090, AMD Ryzen 9 7950X | |
| AMD Radeon RX 6950 XT, AMD Ryzen 9 5900X | |
| NVIDIA GeForce RTX 3080 12 GB, AMD Ryzen 9 5900X | |
| NVIDIA Titan RTX, AMD Ryzen 9 7950X | |
| F1 22 - 3840x2160 Ultra High Preset AA:T AF:16x | |
| NVIDIA GeForce RTX 4090, AMD Ryzen 9 7950X | |
| NVIDIA GeForce RTX 3090, AMD Ryzen 9 7950X | |
| AMD Radeon RX 6950 XT, AMD Ryzen 9 5900X | |
| NVIDIA Titan RTX, AMD Ryzen 9 7950X | |
| Borderlands 3 - 3840x2160 Badass Overall Quality (DX11) | |
| NVIDIA GeForce RTX 4090, AMD Ryzen 9 7950X | |
| NVIDIA GeForce RTX 3090 Ti, AMD Ryzen 7 5800X3D | |
| NVIDIA GeForce RTX 3090, AMD Ryzen 9 7950X | |
| NVIDIA GeForce RTX 3080 12 GB, AMD Ryzen 9 5900X | |
| AMD Radeon RX 6950 XT, AMD Ryzen 9 5900X | |
| AMD Radeon RX 6900 XT, AMD Ryzen 9 5950X | |
| AMD Radeon RX 6900 XT, AMD Ryzen 9 5950X | |
| NVIDIA Titan RTX, AMD Ryzen 9 7950X | |
| Cyberpunk 2077 1.6 - 3840x2160 Ultra Preset | |
| NVIDIA GeForce RTX 4090, AMD Ryzen 9 7950X | |
| NVIDIA GeForce RTX 3090 Ti, AMD Ryzen 7 5800X3D | |
| AMD Radeon RX 6950 XT, AMD Ryzen 9 5900X | |
Palit GeForce RTX 4090 GameRock OC mit Ryzen 9 vs. Core i9
| Performance Rating - Percent | |
| Palit GeForce RTX 4090 GameRock OC -1! | |
| Palit GeForce RTX 4090 GameRock OC | |
| GTA V - 3840x2160 Highest Settings possible AA:4xMSAA + FX AF:16x | |
| Palit GeForce RTX 4090 GameRock OC | |
| Palit GeForce RTX 4090 GameRock OC | |
| The Witcher 3 - 3840x2160 Ultra Graphics & Postprocessing (HBAO+) | |
| Palit GeForce RTX 4090 GameRock OC | |
| Palit GeForce RTX 4090 GameRock OC | |
| Dota 2 Reborn - 3840x2160 ultra (3/3) best looking | |
| Palit GeForce RTX 4090 GameRock OC | |
| Palit GeForce RTX 4090 GameRock OC | |
| Final Fantasy XV Benchmark - 3840x2160 High Quality | |
| Palit GeForce RTX 4090 GameRock OC | |
| Palit GeForce RTX 4090 GameRock OC | |
| X-Plane 11.11 - 3840x2160 high (fps_test=3) | |
| Palit GeForce RTX 4090 GameRock OC | |
| Palit GeForce RTX 4090 GameRock OC | |
| Shadow of the Tomb Raider - 3840x2160 Highest Preset AA:T | |
| Palit GeForce RTX 4090 GameRock OC | |
| Palit GeForce RTX 4090 GameRock OC | |
| Far Cry 5 - 3840x2160 Ultra Preset AA:T | |
| Palit GeForce RTX 4090 GameRock OC | |
| Palit GeForce RTX 4090 GameRock OC | |
| Far Cry New Dawn - 3840x2160 Ultra Preset | |
| Palit GeForce RTX 4090 GameRock OC | |
| Palit GeForce RTX 4090 GameRock OC | |
| Far Cry 6 - 3840x2160 Ultra Graphics Quality + HD Textures AA:T | |
| Palit GeForce RTX 4090 GameRock OC | |
| Palit GeForce RTX 4090 GameRock OC | |
| GRID Legends - 3840x2160 Ultra Preset | |
| Palit GeForce RTX 4090 GameRock OC | |
| Palit GeForce RTX 4090 GameRock OC | |
| Metro Exodus - 3840x2160 Ultra Quality AF:16x | |
| Palit GeForce RTX 4090 GameRock OC | |
| Palit GeForce RTX 4090 GameRock OC | |
| Forza Horizon 5 - 3840x2160 Extreme Preset | |
| Palit GeForce RTX 4090 GameRock OC | |
| F1 2020 - 3840x2160 Ultra High Preset AA:T AF:16x | |
| Palit GeForce RTX 4090 GameRock OC | |
| Palit GeForce RTX 4090 GameRock OC | |
| F1 2021 - 3840x2160 Ultra High Preset + Raytracing AA:T AF:16x | |
| Palit GeForce RTX 4090 GameRock OC | |
| Palit GeForce RTX 4090 GameRock OC | |
| F1 22 - 3840x2160 Ultra High Preset AA:T AF:16x | |
| Palit GeForce RTX 4090 GameRock OC | |
| Palit GeForce RTX 4090 GameRock OC | |
| Borderlands 3 - 3840x2160 Badass Overall Quality (DX11) | |
| Palit GeForce RTX 4090 GameRock OC | |
| Palit GeForce RTX 4090 GameRock OC | |
| Tiny Tina's Wonderlands - 3840x2160 Badass Preset (DX12) | |
| Palit GeForce RTX 4090 GameRock OC | |
| Palit GeForce RTX 4090 GameRock OC | |
| God of War - 3840x2160 Ultra Preset | |
| Palit GeForce RTX 4090 GameRock OC | |
| Palit GeForce RTX 4090 GameRock OC | |
| The Quarry - 3840x2160 Ultra Preset | |
| Palit GeForce RTX 4090 GameRock OC | |
| Palit GeForce RTX 4090 GameRock OC | |
| Cyberpunk 2077 1.6 | |
| 3840x2160 Ray Tracing Ultra Preset (DLSS off) | |
| Palit GeForce RTX 4090 GameRock OC | |
| Palit GeForce RTX 4090 GameRock OC | |
| 3840x2160 Ultra Preset | |
| Palit GeForce RTX 4090 GameRock OC | |
| Palit GeForce RTX 4090 GameRock OC | |
| min. | mittel | hoch | max. | QHD | 4K DLSS | 4K | |
| GTA V (2015) | 188.2 | 187.9 | 187.4 | 162 | 164.8 | 187.5 | |
| The Witcher 3 (2015) | 826 | 747 | 642 | 320 | 284 | ||
| Dota 2 Reborn (2015) | 310.6 | 276 | 262.9 | 239.2 | 234.4 | ||
| Rise of the Tomb Raider (2016) | 494 | 403 | 379 | 378 | 239 | ||
| Final Fantasy XV Benchmark (2018) | 236 | 233 | 233 | 225 | 161.1 | ||
| X-Plane 11.11 (2018) | 223 | 196.3 | 151.6 | 124.5 | |||
| Far Cry 5 (2018) | 238 | 209 | 200 | 188 | 185 | 175 | |
| Strange Brigade (2018) | 698 | 575 | 570 | 565 | 512 | 281 | |
| Shadow of the Tomb Raider (2018) | 332 | 325 | 323 | 304 | 279 | 186 | |
| Far Cry New Dawn (2019) | 200 | 177 | 171 | 154 | 152 | 145 | |
| Metro Exodus (2019) | 300 | 265 | 234 | 201 | 185.8 | 139.7 | |
| Anno 1800 (2019) | 211 | 199.3 | 143.1 | 73.6 | 72.8 | 66.9 | |
| Control (2019) | 240 | 240 | 240 | 219 | 113.3 | ||
| Borderlands 3 (2019) | 242 | 216 | 200 | 186.8 | 186 | 135 | |
| F1 2020 (2020) | 563 | 475 | 471 | 412 | 407 | 286 | |
| Crysis Remastered (2020) | 491 | 446 | 327 | 284 | 231 | 147.3 | |
| Mafia Definitive Edition (2020) | 292 | 266 | 237 | 226 | 162.7 | ||
| Watch Dogs Legion (2020) | 184.6 | 178.7 | 160.3 | 149.7 | 146.5 | 116.7 | |
| Dirt 5 (2020) | 385.7 | 356.1 | 333.8 | 325.7 | 287.4 | 190.4 | |
| F1 2021 (2021) | 677 | 642 | 529 | 271 | 263 | 199.1 | |
| New World (2021) | 215 | 188 | 183.5 | 175.3 | 174.8 | 149.3 | |
| Far Cry 6 (2021) | 209 | 189.4 | 169.5 | 173.9 | 168.4 | 136.9 | |
| Riders Republic (2021) | 318 | 309 | 292 | 279 | 229 | 149 | |
| Forza Horizon 5 (2021) | 411 | 302 | 283 | 208 | 197 | 162 | |
| God of War (2022) | 278 | 276 | 269 | 212 | 179.5 | 130.1 | |
| GRID Legends (2022) | 330 | 297 | 262 | 252 | 244 | 201 | |
| Cyberpunk 2077 1.6 (2022) | 229 | 225 | 215 | 207 | 149.6 | 78 | |
| Ghostwire Tokyo (2022) | 284 | 281 | 280 | 277 | 277 | 163.4 | |
| Tiny Tina's Wonderlands (2022) | 428 | 354 | 311 | 289 | 229 | 130.3 | |
| Vampire Bloodhunt (2022) | 460 | 398 | 394 | 382 | 374 | 254 | |
| F1 22 (2022) | 443 | 414 | 414 | 194.5 | 157.5 | 82.5 | |
| The Quarry (2022) | 427 | 337 | 290 | 256 | 193.8 | 75.4 | |
| FIFA 23 (2022) | 276 | 273 | 270 | 267 | 248 | 245 | |
| A Plague Tale Requiem (2022) | 179.6 | 173.6 | 167.9 | 154.3 | 125.8 | 73.7 | |
| Uncharted Legacy of Thieves Collection (2022) | 146.3 | 145.5 | 144.5 | 143.7 | 143.6 | 100.7 | |
| Call of Duty Modern Warfare 2 2022 (2022) | 304 | 287 | 245 | 240 | 191 | 183 | 128 |
| Spider-Man Miles Morales (2022) | 208 | 198.9 | 174.5 | 175.4 | 174.4 | 130.8 | |
| The Callisto Protocol (2022) | 229 | 222 | 202 | 201 | 183 | 127 | |
| Need for Speed Unbound (2022) | 178.2 | 171.1 | 154.3 | 153.7 | 152.8 | 146.3 | |
| High On Life (2023) | 388 | 357 | 307 | 293 | 224 | 106.6 | |
| The Witcher 3 v4.00 (2023) | 289 | 255 | 229 | 212 | 212 | 164.2 | |
| Dead Space Remake (2023) | 266 | 265 | 246 | 248 | 199.7 | 106.5 | |
| Hogwarts Legacy (2023) | 162.1 | 142.9 | 129.6 | 121.5 | 120.3 | 86 | |
| Returnal (2023) | 214 | 212 | 208 | 201 | 174 | 109 | |
| Atomic Heart (2023) | 316 | 251 | 234 | 223 | 181.6 | 110.9 | |
| Company of Heroes 3 (2023) | 383.1 | 364 | 344.8 | 330.8 | 302.8 | 205.7 | |
| Sons of the Forest (2023) | 133.3 | 126.3 | 122.3 | 120.7 | 118 | 114.2 | |
| Resident Evil 4 Remake (2023) | 287 | 303 | 294 | 213 | 188.9 | 121.8 | |
| The Last of Us (2023) | 169.6 | 163.2 | 163 | 162.8 | 136.9 | 118.1 | 77.4 |
| Dead Island 2 (2023) | 326 | 312 | 280 | 250 | 261 | 165.1 | |
| Star Wars Jedi Survivor (2023) | 170.6 | 166.3 | 160 | 155.4 | 150.3 | 80.4 | |
| Diablo 4 (2023) | 398 | 399 | 399 | 398 | 392 | 239 | 220 |
| F1 23 (2023) | 476 | 509 | 472 | 210 | 154 | 134 | 79.6 |
| Ratchet & Clank Rift Apart (2023) | 231 | 217 | 184.7 | 153.5 | 147.1 | 108.8 | |
| Baldur's Gate 3 (2023) | 323 | 299 | 274 | 265 | 203 | 189.4 | 112.6 |
| Atlas Fallen (2023) | 194.9 | 192.5 | 187 | 185.4 | 184.2 | 168.4 | |
| Immortals of Aveum (2023) | 155.6 | 138.2 | 124.4 | 97.3 | 126.1 | 62.6 | |
| Armored Core 6 (2023) | 119.7 | 119.6 | 119.8 | 119.5 | 119.5 | 119.3 | |
| Starfield (2023) | 138.9 | 139.2 | 130 | 124.5 | 78.1 | ||
| Lies of P (2023) | 330 | 327 | 303 | 286 | 264 | 237 | 166.7 |
| Counter-Strike 2 (2023) | 351 | 340 | 339 | 340 | 312 | 202 | |
| EA Sports FC 24 (2023) | 382 | 323 | 266 | 264 | 263 | 254 | |
| Assassin's Creed Mirage (2023) | 247 | 240 | 230 | 170 | 162 | 144 | 126 |
| Total War Pharaoh (2023) | 565.7 | 348.2 | 231.3 | 187.1 | 186.2 | 158.2 | |
| Lords of the Fallen (2023) | 181.7 | 174.2 | 155 | 116 | 88.6 | 88.6 | 53.2 |
| Alan Wake 2 (2023) | 152.4 | 149.3 | 144.4 | 126.7 | 58.7 | 72.2 | |
| EA Sports WRC (2023) | 255 | 170.6 | 157.8 | 152.6 | 147.4 | 139.6 | 121 |
| Call of Duty Modern Warfare 3 2023 (2023) | 330 | 306 | 265 | 254 | 199 | 129 | |
| Avatar Frontiers of Pandora (2023) | 251 | 234 | 209 | 170 | 124 | 113 | 69 |
| The Finals (2023) | 332 | 309 | 295 | 300 | 256 | 209 | 139.2 |
| Ready or Not (2023) | 336 | 356 | 336 | 323 | 263 | 243 | 132.4 |
Emissionen der Palit GeForce RTX 4090 GameRock OC
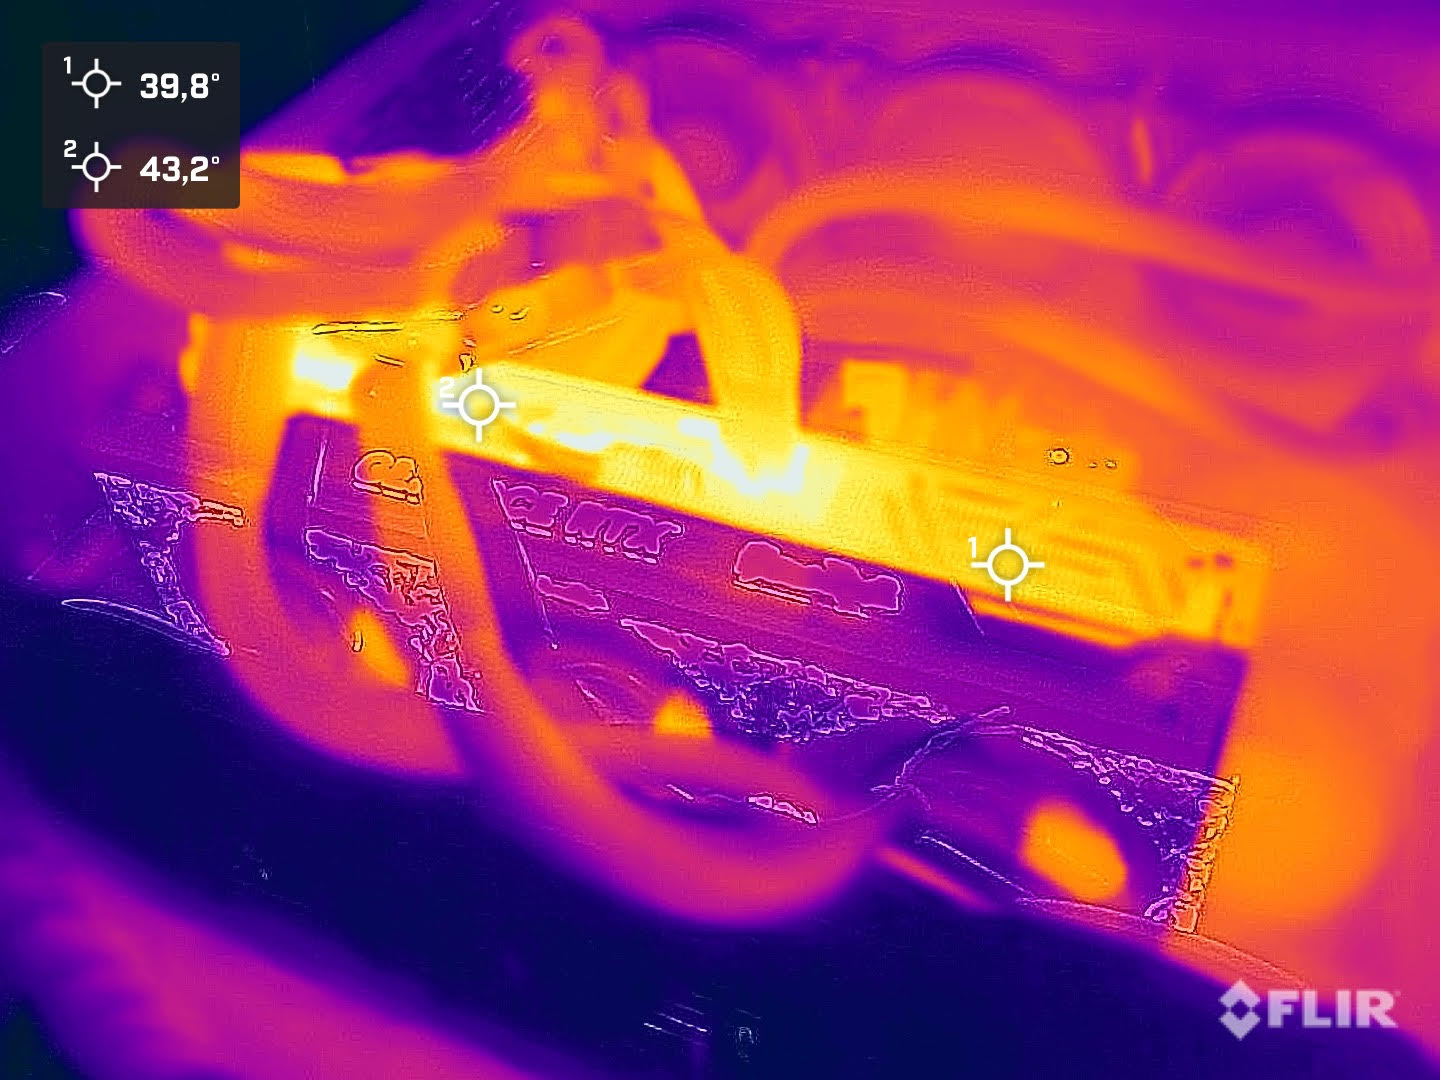
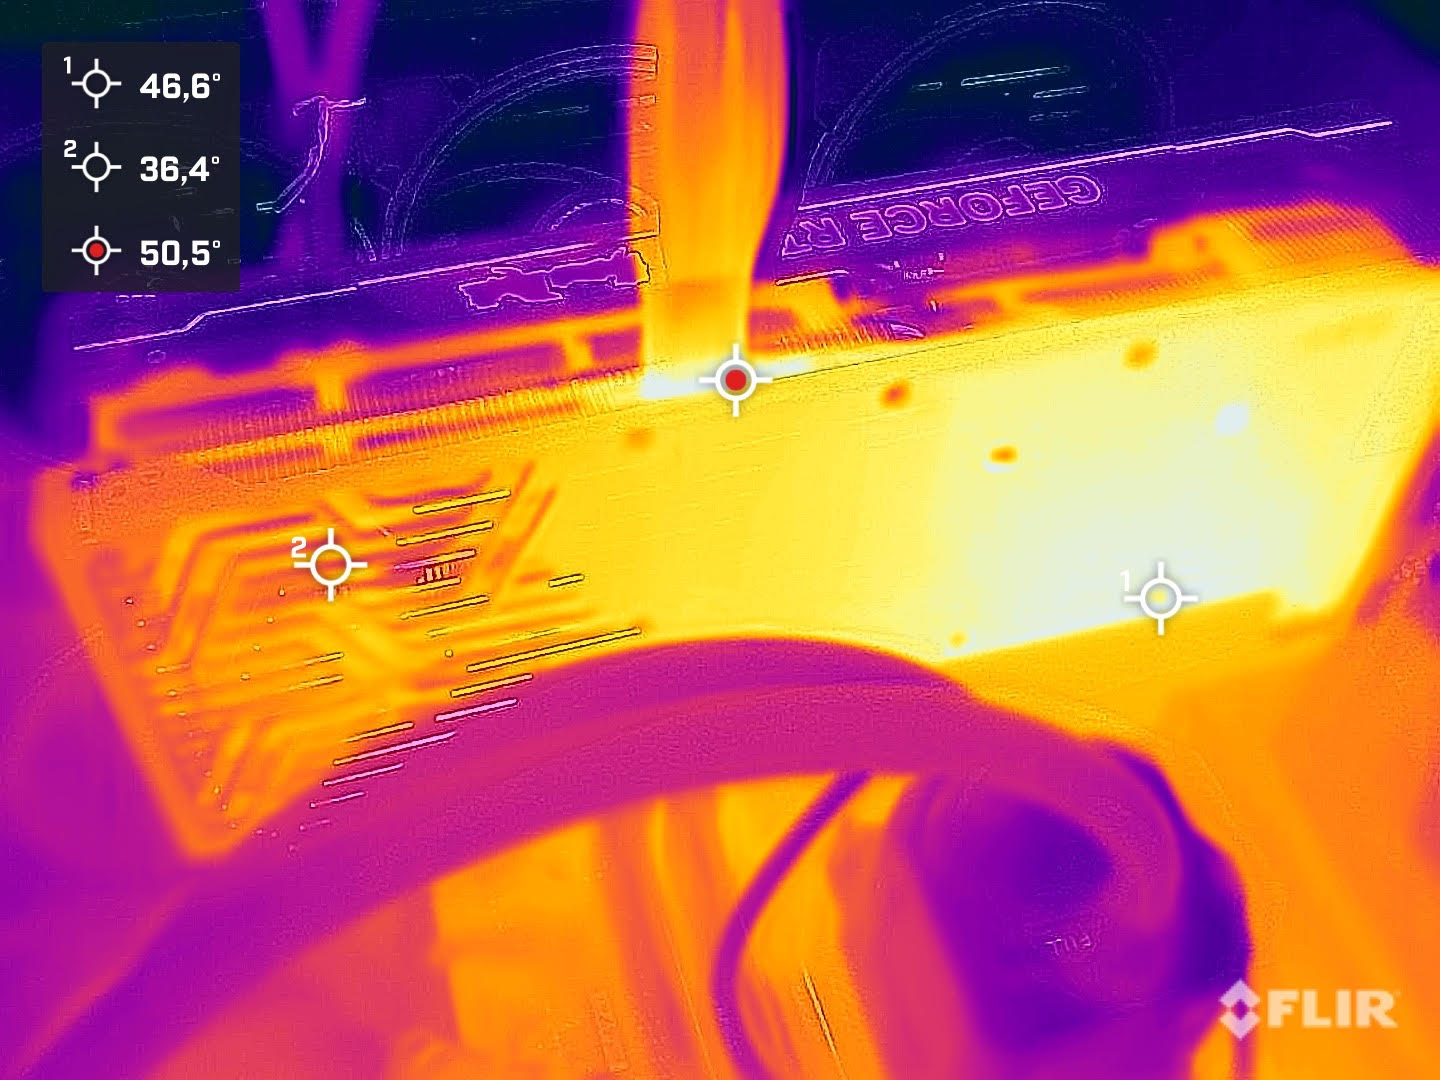
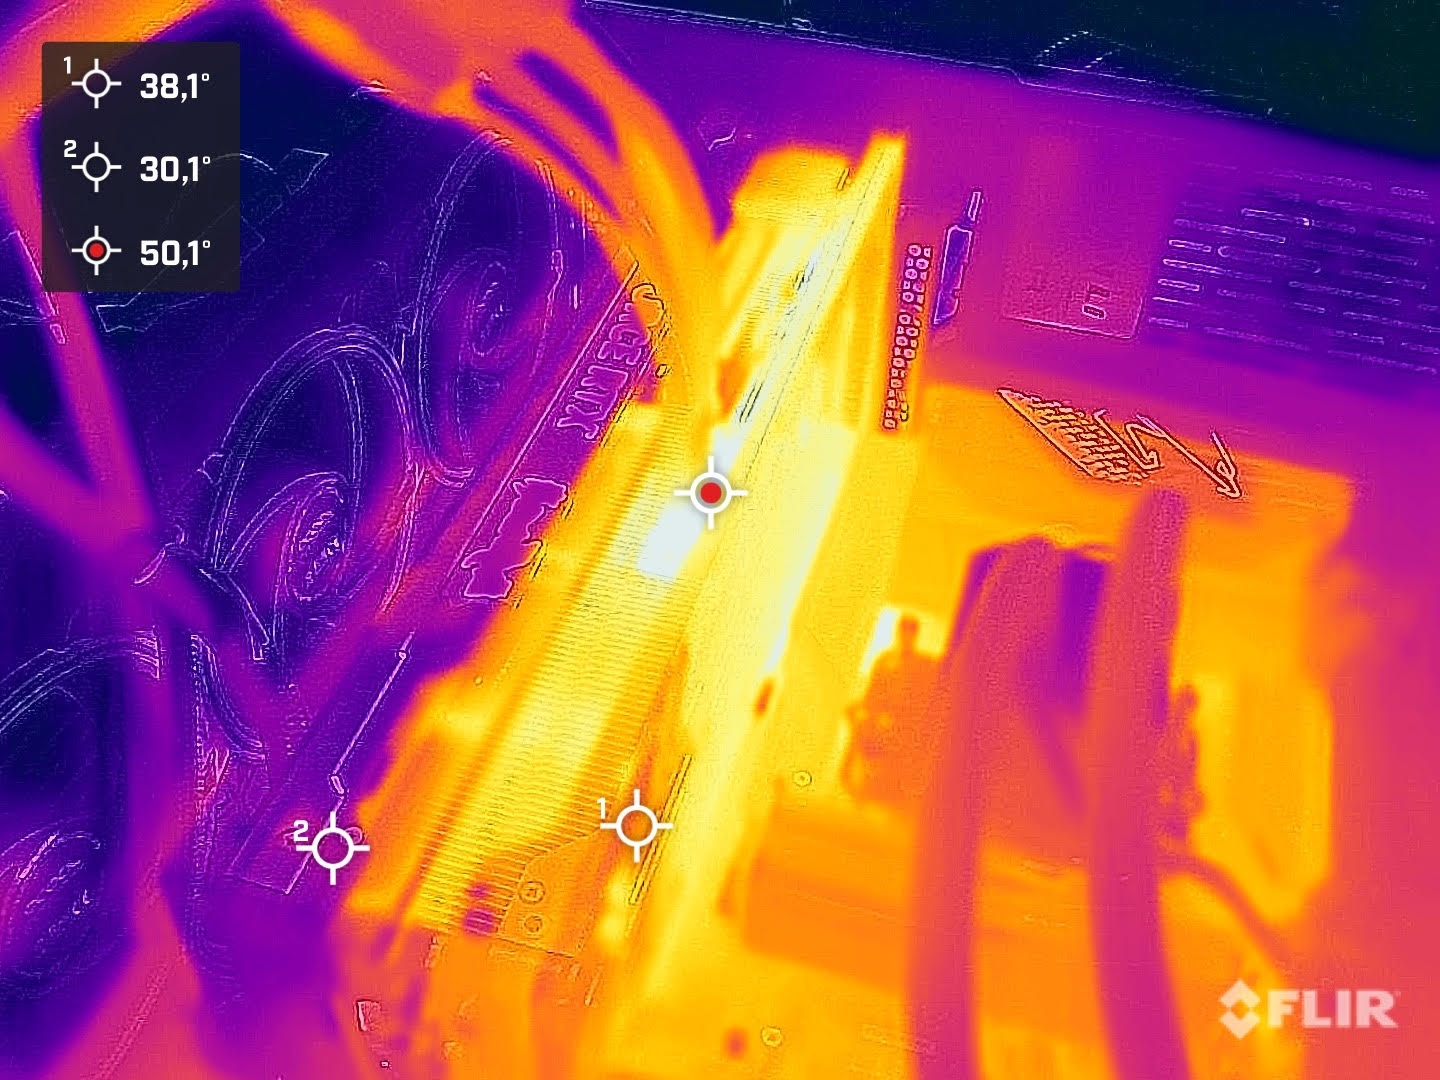
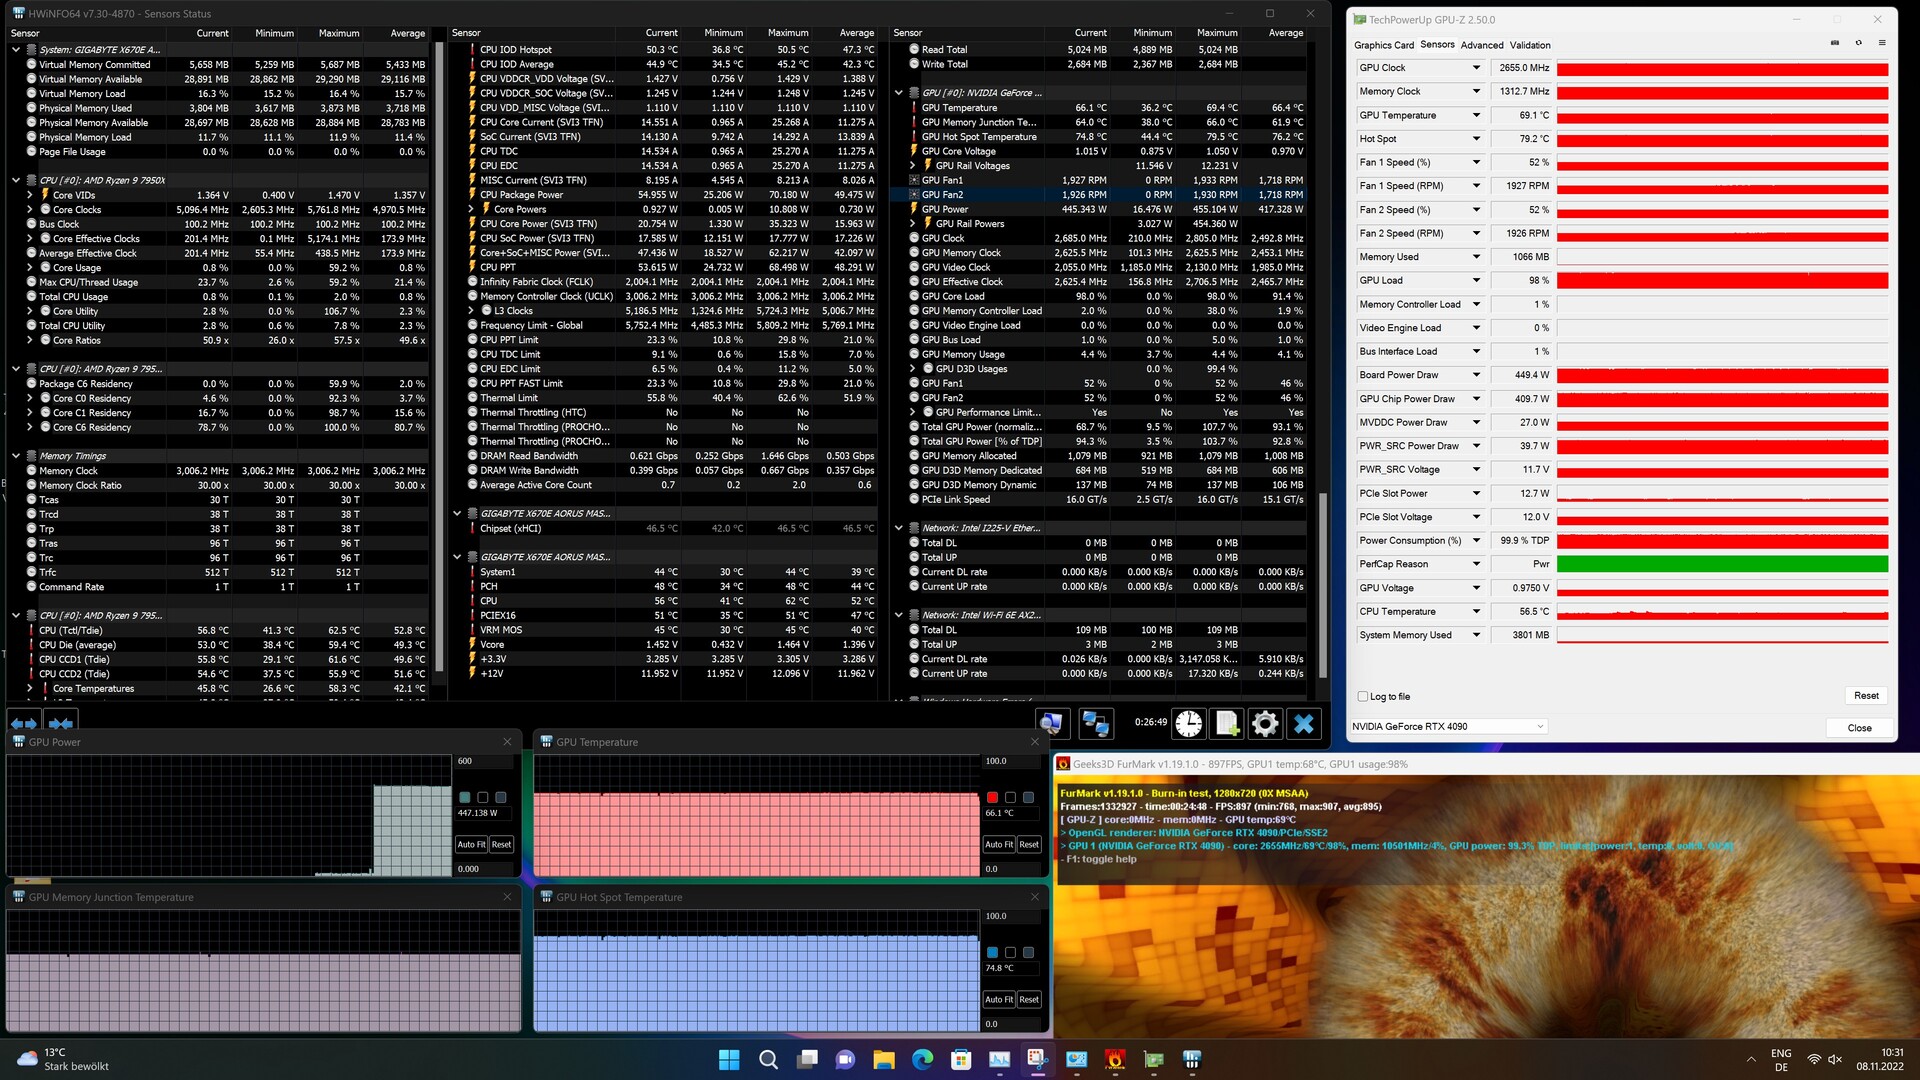
Mit 450 Watt liegt die Nvidia GeForce RTX 4090 auf dem gleichen Niveau wie die Nvidia GeForce RTX 3090 Ti. Gleichwohl steigt der Energiebedarf im Vergleich zur Nvidia GeForce RTX 3090 um genau 100 Watt. Ein Trend, der sich über die letzten Jahre verfestigt hat, und von dem wir nur hoffen können, dass hier aktuell eine Grenze erreicht ist. Wer allerdings die ultimative Leistung wünscht, darf beim Thema Stromverbrauch nicht so genau hinschauen. Die Abwärme der 450 Watt, welche die Palit GeForce RTX 4090 GameRock OC im Stresstest erreicht, kann sehr gut abgeführt werden. Mit knapp 70 °C bleibt der GPU-Chip relativ kühl und auch beim VRAM können wir mit maximal 66 °C keine Temperaturprobleme feststellen. Das Power-Target sowie die Spannung der GPU lässt sich etwas erhöhen, womit die Grafikkarte unter Last maximal 509 W erreicht. Gleichwohl steigt auch die Chip-Temperatur etwas an. Die verbauten Lüfter verrichten gute Arbeit und kühlen die Grafikkarte im Standard-Betrieb bei knapp 2.000 Umdrehungen pro Minute. Aus dem geschlossenen Gehäuse ist die Grafikkarte nur sehr leise wahrnehmbar.
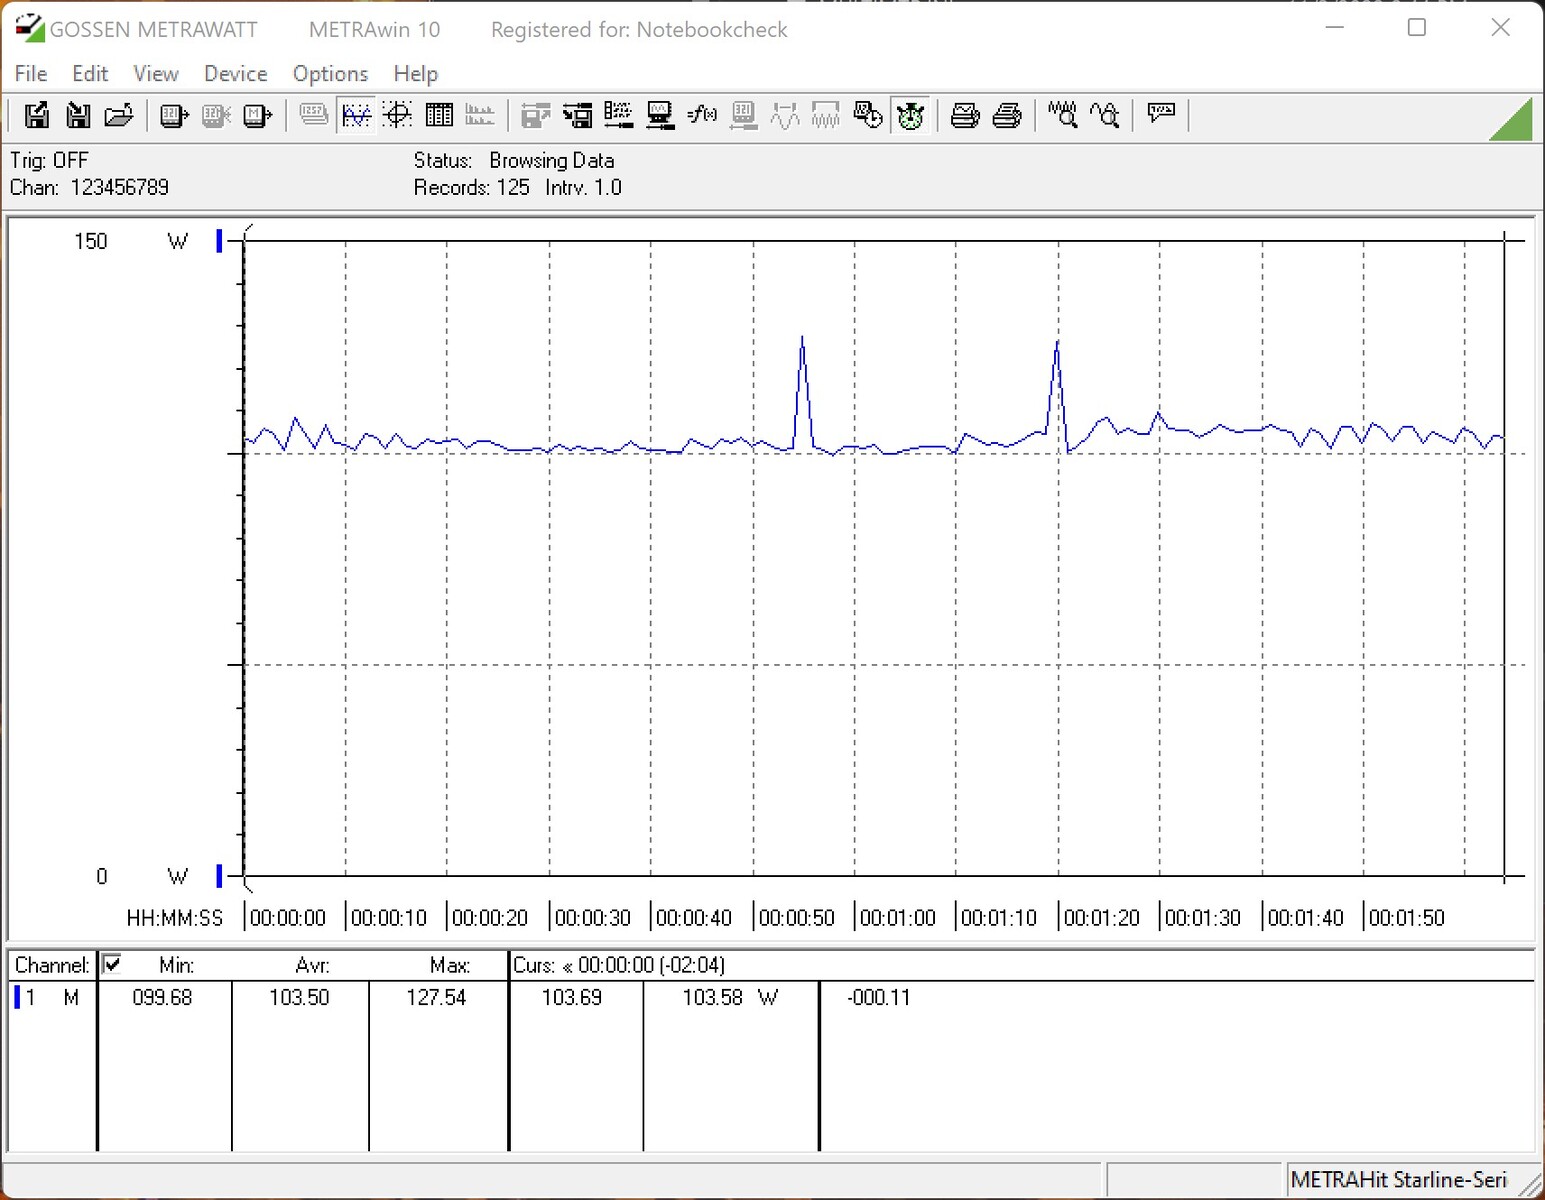
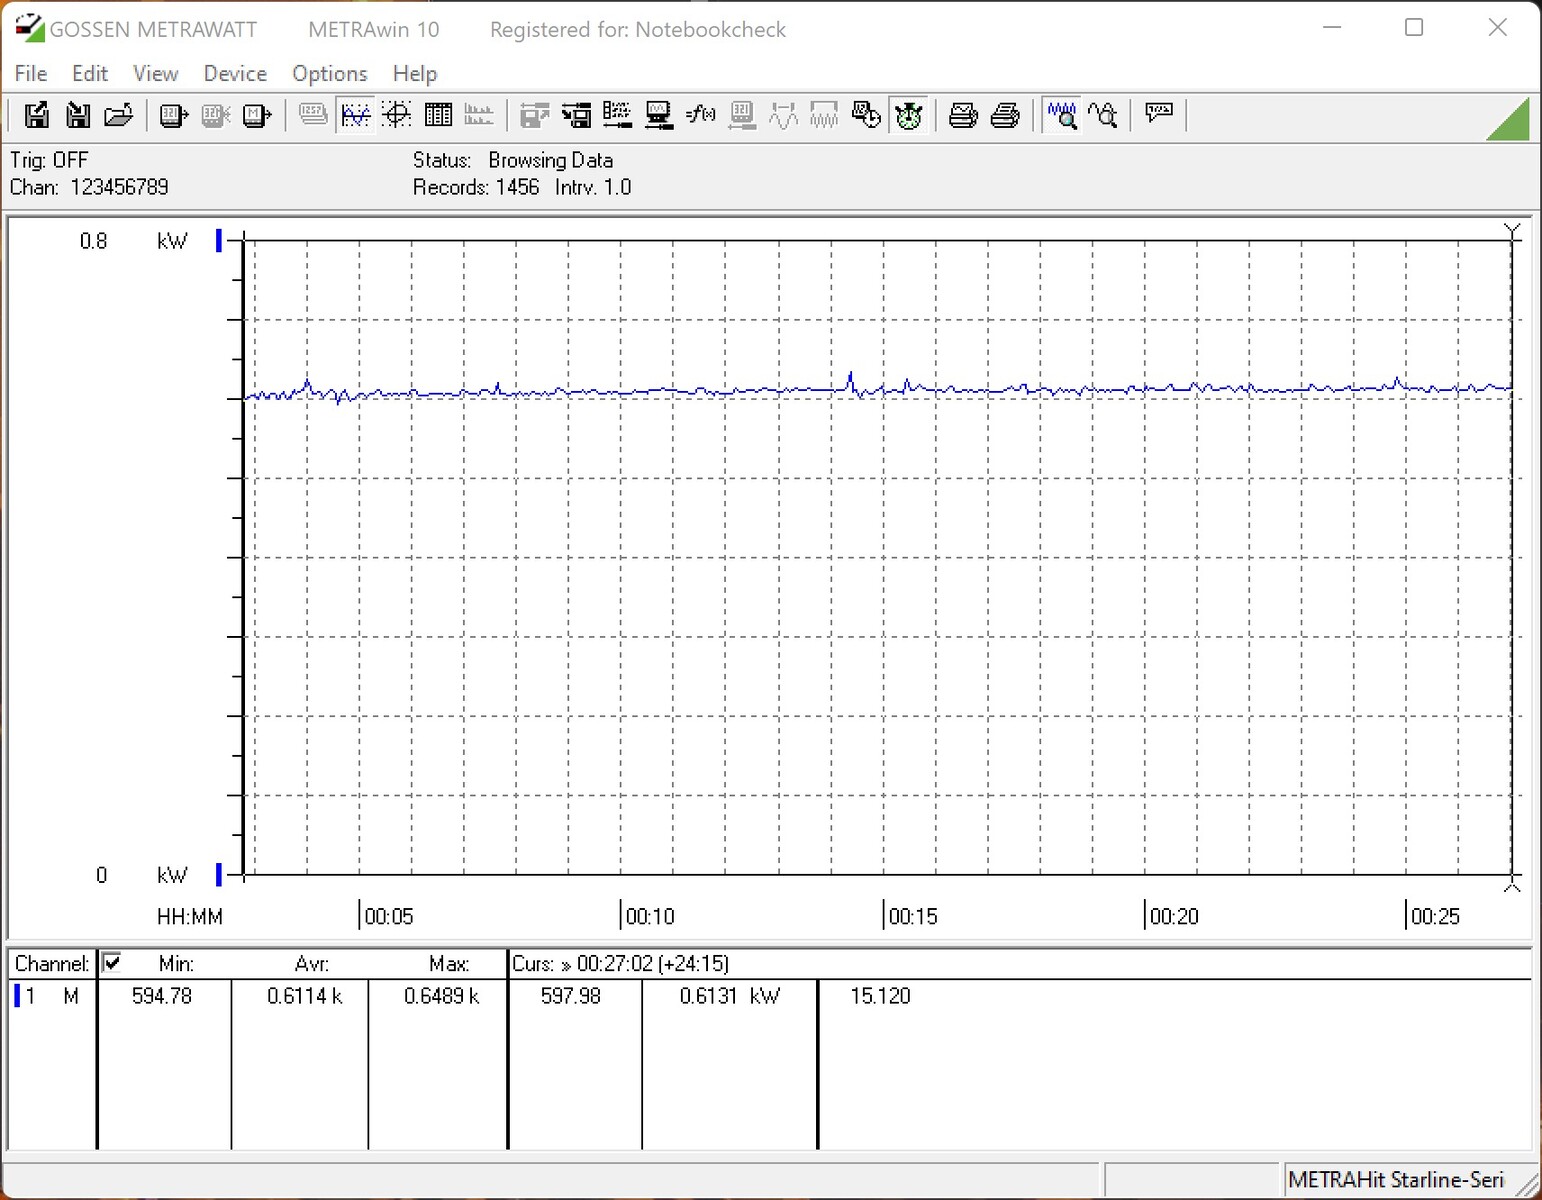
Beim Spielen braucht sich die Palit GeForce RTX 4090 GameRock OC durchaus nicht zu verstecken. Hier benötigten die AMD Radeon RX 6950 XT sowie die Nvidia GeForce RTX 3090 Ti mehr Energie. Allerdings liegen wir bei diesem Test mehr im CPU-Limit, was bedeutet, dass die GPU nicht die volle Leistung erbringen kann. Beim Vergleich mit FurMark wandelt sich das Blatt eindeutig zum Nachteil der Palit GeForce RTX 4090 GameRock OC. Mit durchschnittlich 611 Watt fällt der Energiebedarf der neuen High-End-Grafikkarte sehr hoch aus. Für den Betrieb der Grafikkarte sollte also ein leistungsstarkes Netzteil vorhanden sein. Palit selbst schreibt ein 1000-Watt-Netzteil vor, welches wir auch im Test verwendet haben. In alles Tests und Benchmarks gab es keinerlei Probleme mit der Spannungsversorgung.
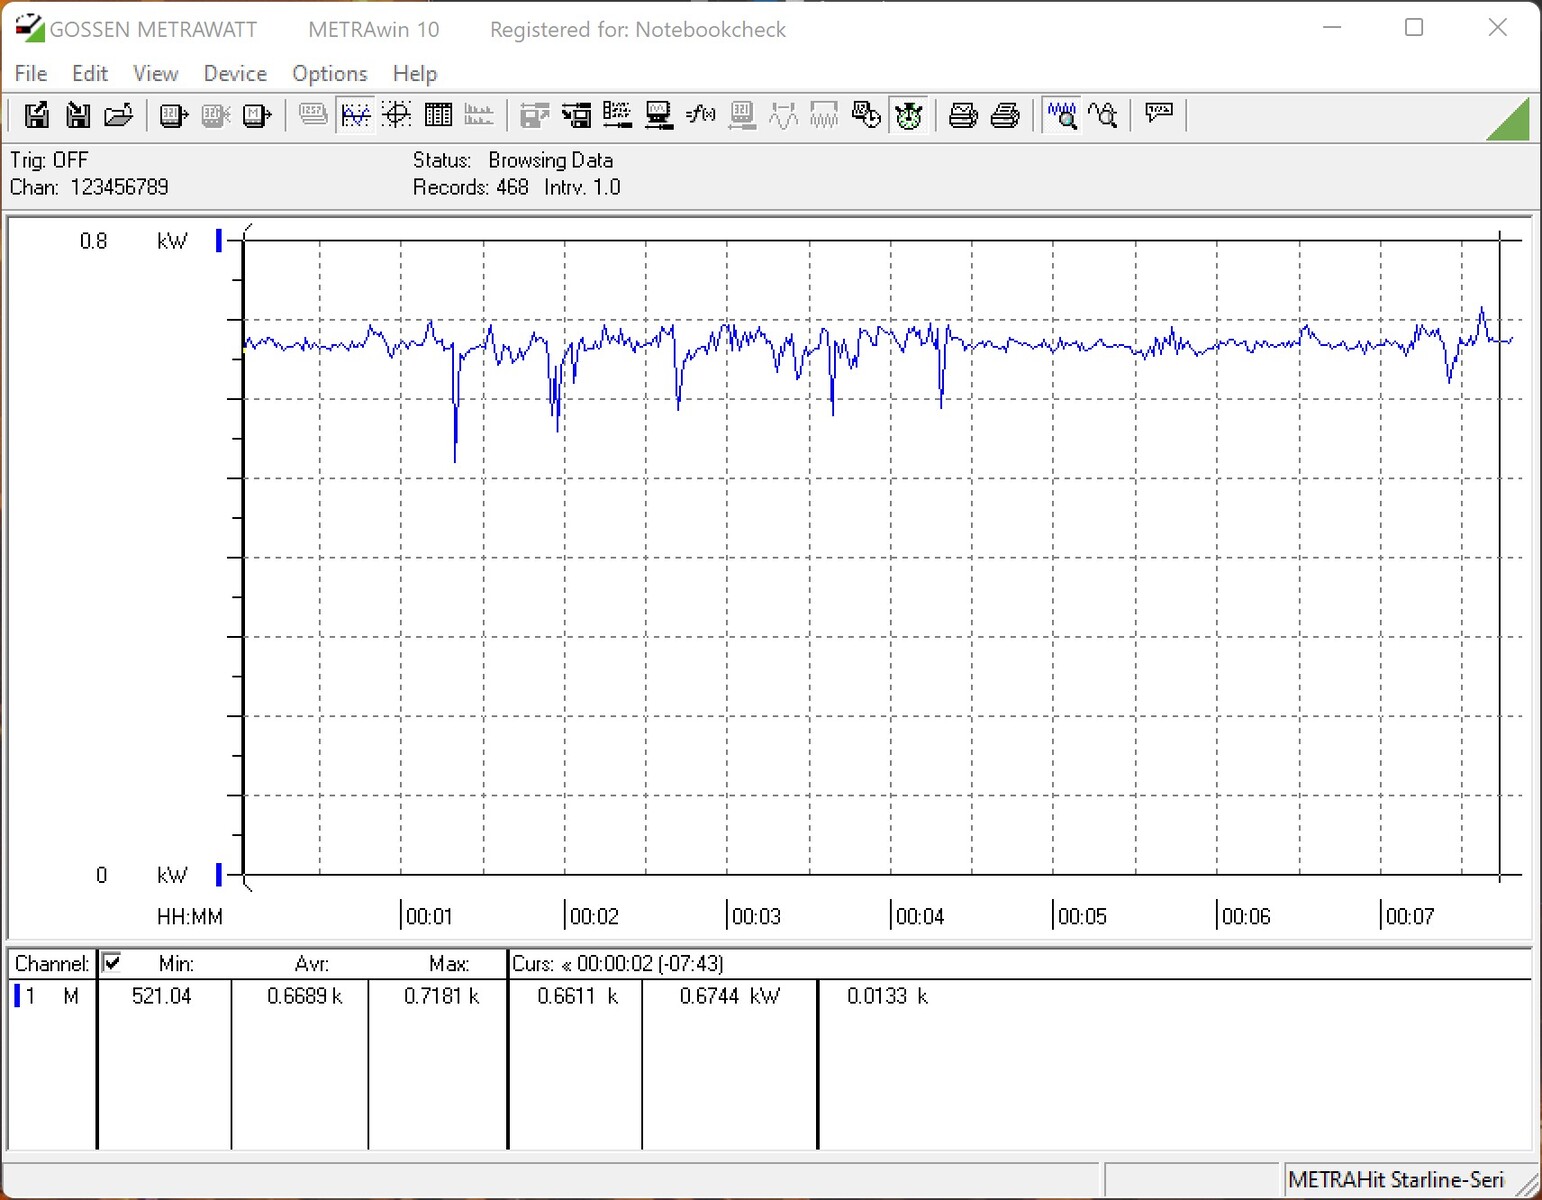
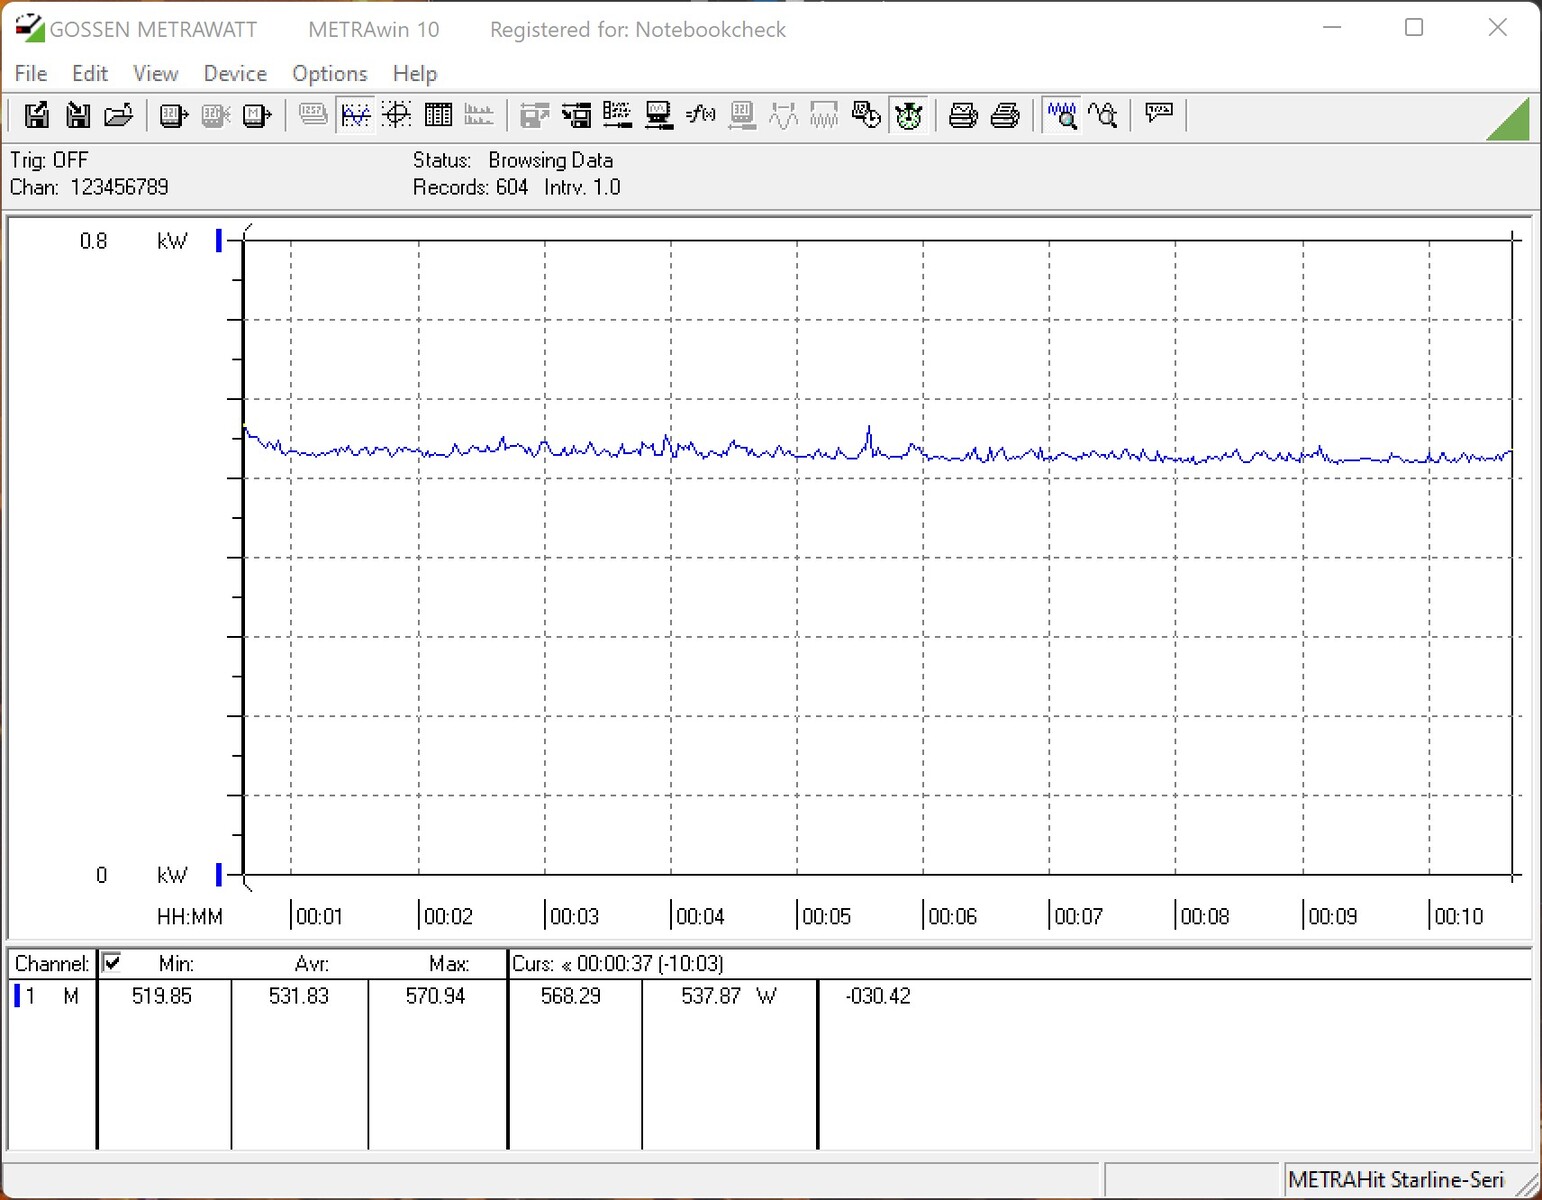

| Power Consumption / The Witcher 3 ultra (external Monitor) | |
| AMD Radeon RX 6950 XT, AMD Ryzen 9 5900X | |
| NVIDIA GeForce RTX 3090 Ti, AMD Ryzen 7 5800X3D (Idle: 102 W) | |
| NVIDIA GeForce RTX 3090, AMD Ryzen 9 7950X | |
| NVIDIA GeForce RTX 4090, AMD Ryzen 9 7950X | |
| NVIDIA GeForce RTX 3080 12 GB, AMD Ryzen 9 5900X | |
| AMD Radeon RX 6900 XT, AMD Ryzen 9 5950X (Idle: 99.15 W) | |
| Power Consumption / FurMark 1.19 GPU Stress Test (external Monitor) | |
| NVIDIA GeForce RTX 4090, AMD Ryzen 9 7950X | |
| AMD Radeon RX 6950 XT, AMD Ryzen 9 5900X | |
| NVIDIA GeForce RTX 3090, AMD Ryzen 9 7950X | |
| NVIDIA GeForce RTX 3080 12 GB, AMD Ryzen 9 5900X | |
| AMD Radeon RX 6900 XT, AMD Ryzen 9 5950X (Idle: 99.15 W) | |
* ... kleinere Werte sind besser
Pro
Contra
Fazit - Brachiale Leistung und keine Temperaturprobleme
Nvidias neuestes Flaggschiff, die GeForce RTX 4090, stellt alles bisher Dagewesene in den Schatten, und zwar deutlich. Der Leistungssprung zur Nvidia GeForce RTX 3090 ist enorm und mitunter ist fast eine Verdoppelung der Frameraten möglich. Im Großen und Ganzen pendelt sich der Leistungszuwachs aber bei 50 - 70 Prozent ein, was immer noch eine Marke ist. AMD hat mit seiner aktuellen Radeon RX 6950 XT ebenfalls nur noch das Nachsehen. Mit der vor wenigen Tagen vorgestellten AMD Radeon RX 7900 XTX versucht man hier aber etwas Paroli zu bieten.
Die Leistung der hier im Test verwendeten Palit GeForce RTX 4090 GameRock OC ist durchweg sehr gut. Mit den bereits bekannten Features wie DLSS und Raytracing hat Nvidia zudem die Leistung hier nochmals deutlich steigern können und mit den Neuerungen, die nur die aktuell nur die RTX-4000-Serie bietet, lockt man die Käufer. Ob AMD hier nachziehen kann, wird sich erst in naher Zukunft zeigen. Dennoch versprechen die Features viel, denn immer mehr Spiele nutzen die Schnittstellen, um die Frameraten bei nahezu gleicher Bildqualität zu verbessern. Aber auch ohne DLSS bietet die GeForce RTX 4090 eine enorme Leistung für nahezu alle aktuellen Spiele in 2.160p und höchsten Details.
Wer über einen Kauf nachdenkt, sollte aber bedenken, dass eine sehr schnelle CPU benötigt wird. Zudem ergibt es keinen Sinn, die Leistung der Grafikkarte nur für 1.080p- oder 1.440p-Gaming zu verpulvern. Hier langweilt sich die Grafikkarte schlichtweg.
Die Palit GeForce RTX 4090 GameRock OC zieht die Blicke mit dem Midnight Kaleidoscope Design auf sich. Dank Ada Lovelace passt auch die Leistung und uneingeschränktes 4K-Gaming ist möglich.
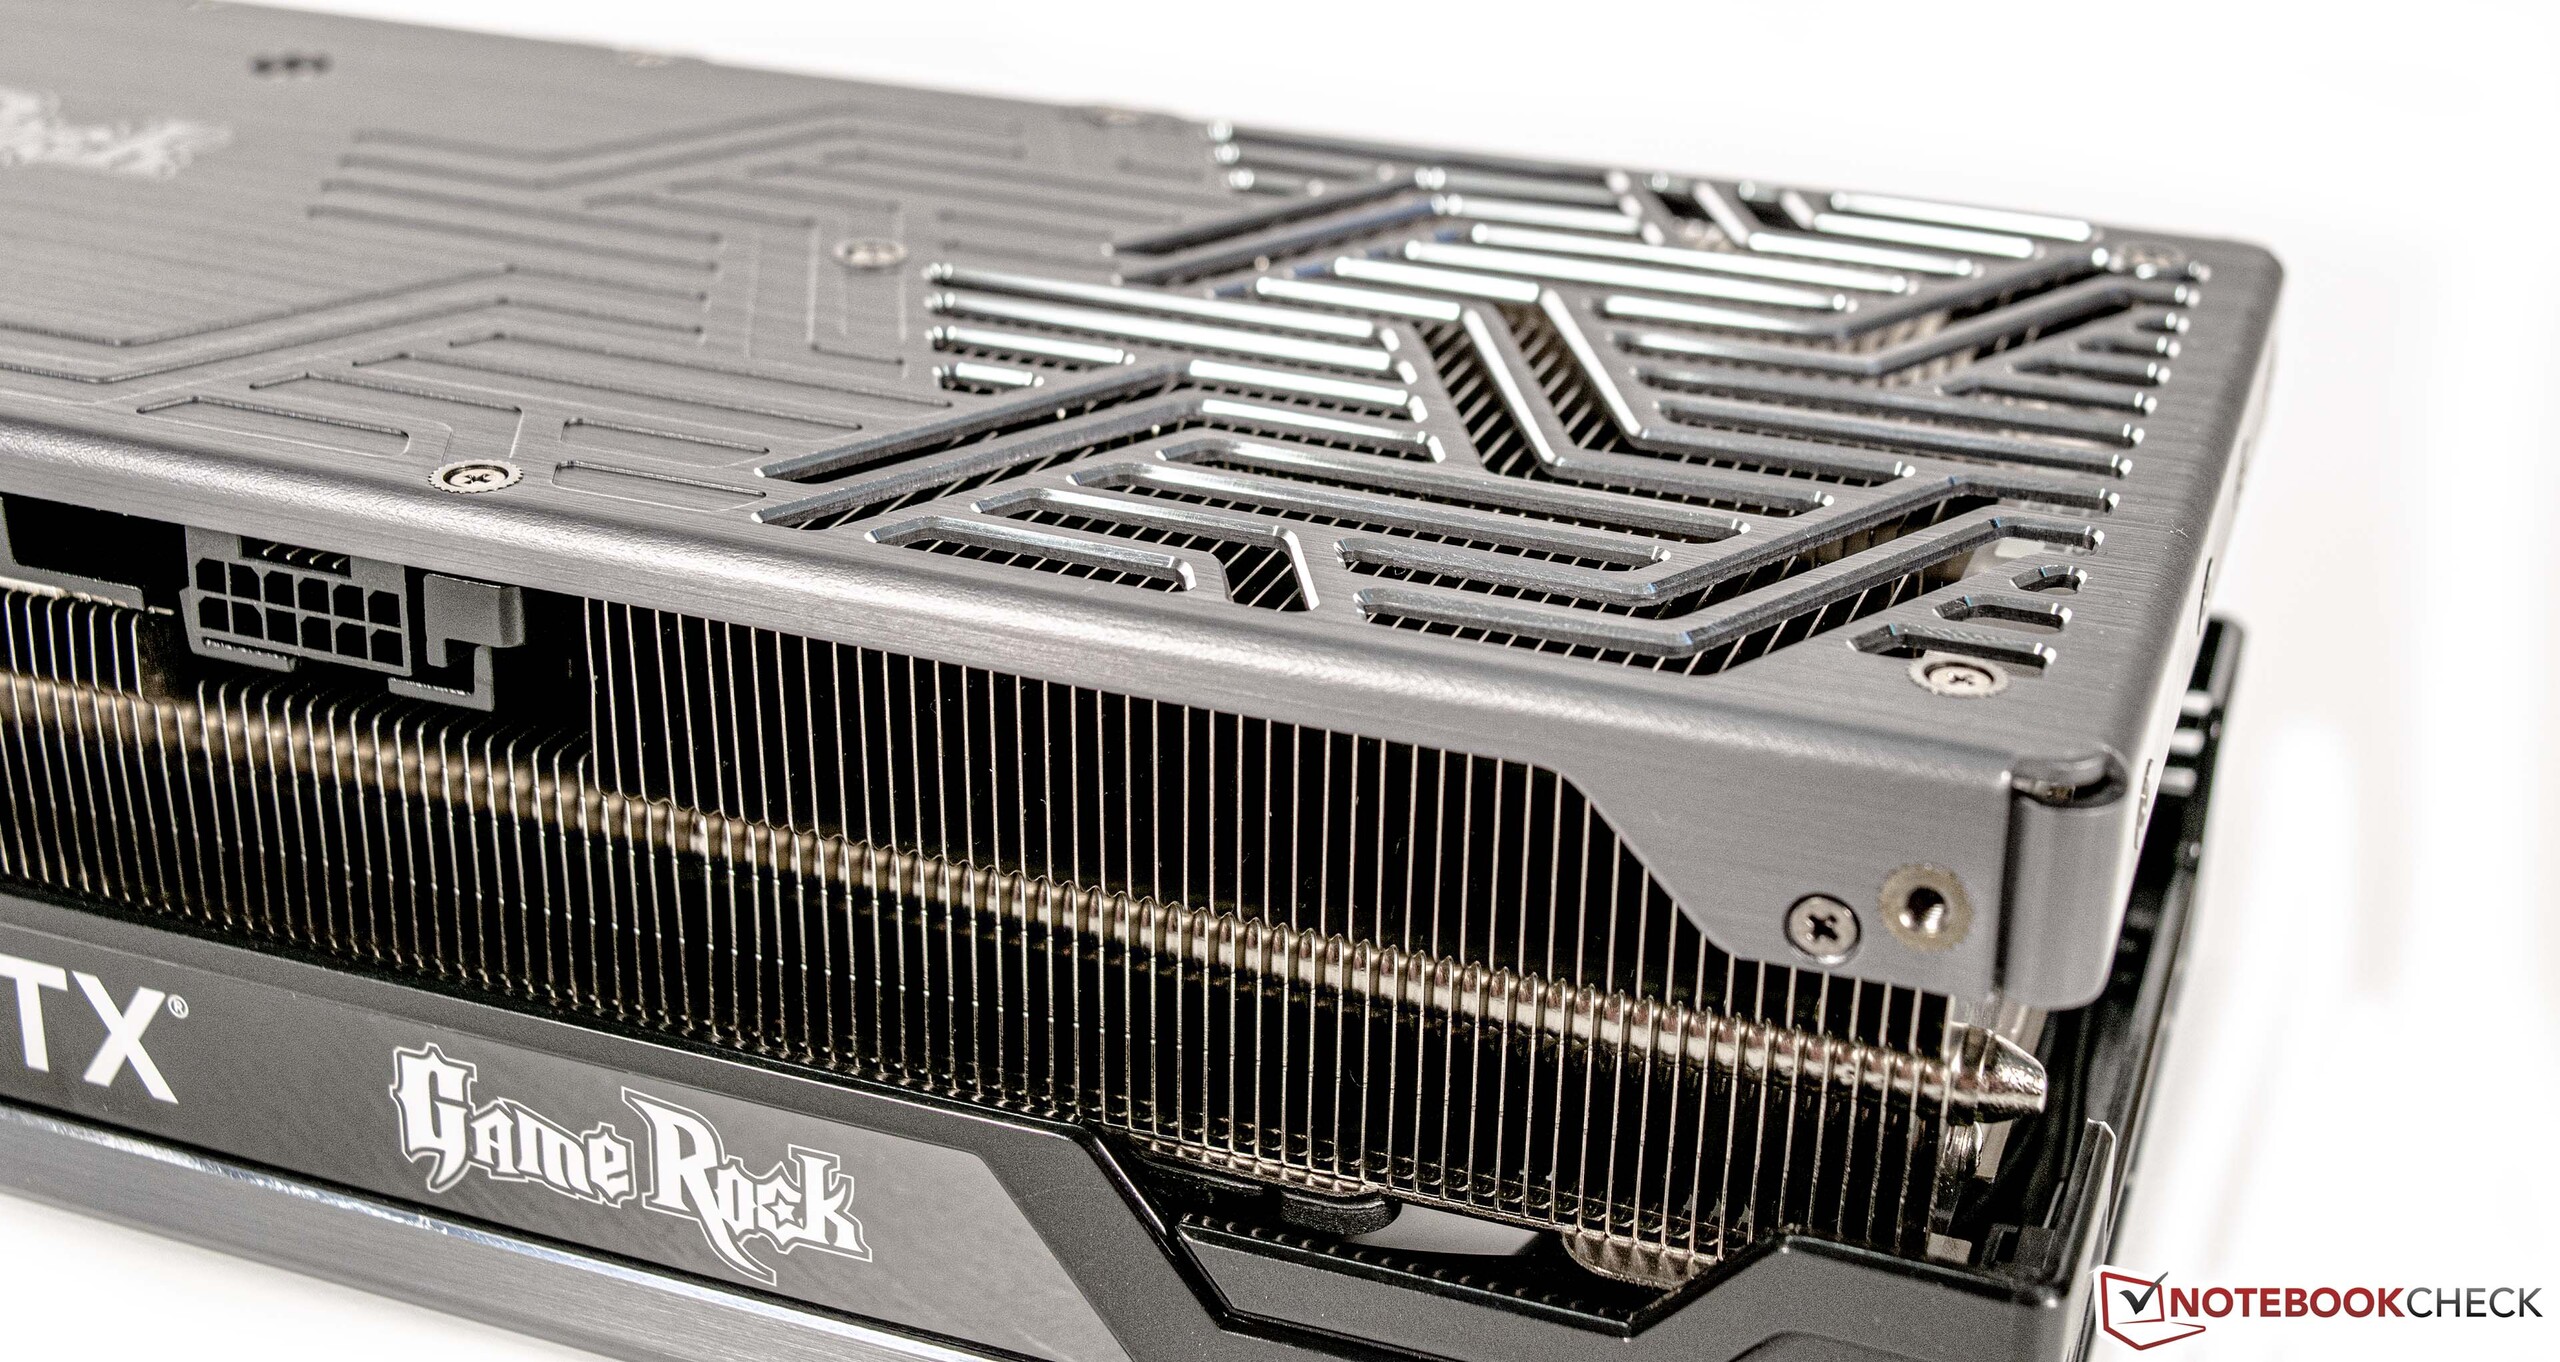
Bei der Leistungsaufnahme sowie dem verwendeten 12VHPWR-Anschluss kann man geteilter Meinung sein. Einerseits sind die 450 Watt noch im Rahmen, wenn wir uns dazu einmal die Nvidia GeForce RTX 3090 Ti ins Gedächtnis rufen. Diese ist mit gleicher TPD angegeben und kann die Leistung der Nvidia GeForce RTX 4090 bei weitem nicht erreichen. Somit steigert Nvidia die Effizienz mit der neuen Ada-Lovelace-Architektur nochmals deutlich. Anderseits musste der Stromanschluss bislang viel Kritik einstecken. Wir haben bislang keine Probleme aufgrund zu hoher Hitzeentwicklung bei unserem Testsample feststellen können, werden dies aber weiter beobachten und Sie auf dem Laufenden halten, sollte auch uns dieses Schicksal heimsuchen. Das Design der Palit GeForce RTX 4090 GameRock OC ist aufgrund der diamantartig gestalteten Oberfläche durchaus gelungen. Die dezente RGB-Beleuchtung rundet das Paket sehr gut ab. Beim verbauten Kühler macht Palit ebenfalls alles richtig, denn unter Last ist die Grafikkarte trotz der sehr hohen Leistungsaufnahme angenehm leise.
Preise und Verfügbarkeit
Die Verfügbarkeit der Grafikkarten ist weiterhin angespannt und wenn es Modelle zu kaufen gibt, muss man oftmals mit einem satten Aufpreis zur UVP von Nvidia (1.949 Euro) rechnen. Aktuell wird unser Testsample für 2.560 Euro bei Amazon gelistet. Allerdings beträgt die Lieferzeit hier 4 bis 6 Wochen. Das non-OC-Modell der Palit GeForce RTX 4090 GameRock ist aktuell für 2.370 Euro zu haben.


Preisvergleich
