Notebookcheck Logo

Apple A5x vs Texas Instruments OMAP 4430 vs Broadcom BCM28155

Apple A5x

► remove from comparison

Der Apple A5x ist ein Dual Core ARM Prozessor mit A9 basierenden Rechenkernen.  Im Kern integriert ist die relativ schnelle PowerVR SGX 543MP4 Quad-Core Grafikkarte. Verwendet wird der Chip ausschließlich im Apple iPad der 3. Generation.

Texas Instruments OMAP 4430

► remove from comparison  OMAP 4430

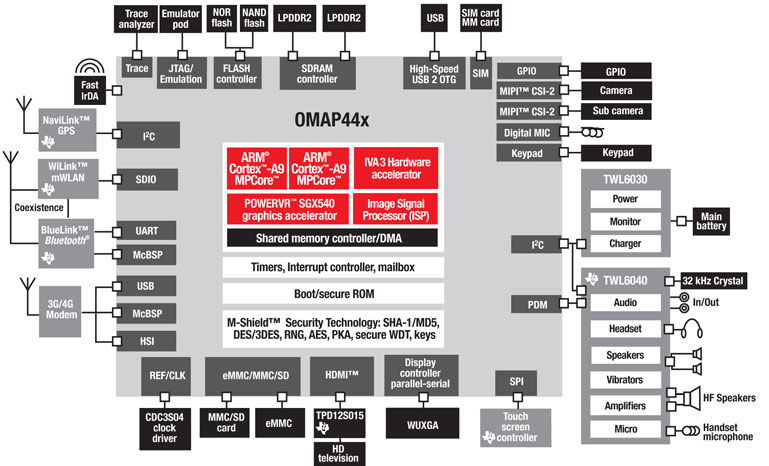
Der Texas Instruments (TI) OMAP 4430 ist ein SoC (System on a Chip) für Handys und Tablet PCs. Er beinhaltet zwei ARM Cortex-A9 (ARM v7 Instruction Set) Rechenkernen mit 1-1.2 GHz und ARMs SIMD Engine NEON. Zusätzlich sind zwei Cortex M3 Kerne für Multimediafunktionen integriert. Die integrierte PowerVR SGX540 Grafikkarte wird mit 304 MHz getaktet und kann wie die zwei Prozessorkerne auf den Dual Channel LPDDR2 Speicherkontroller (max 400MHz) zugreifen.

Die Performance der Rechenkerne liegt auf dem Niveau eines Nvidia Tegra 2 SoCs. Bei der Flash Performance im GUIMark 2 und Linpack Benchmarks unter Android liegen sie in etwas auf einem Level. Im Architektruvergleich fehlt dem Tegra 2 jedoch die SIMD Engine und auch das Speicher Interface ist nur als Single Channel ausgelegt.

Die Grafikperformance ist oft vergleichbar, wobei es Einzeltests gibt (RightWare Basemark ES 2.0) wo sich der SGX 540 deutlich durchsetzen kann.

Der Stromverbrauch ist mit angegebenen 100uW - 600mW relativ gering und eignet sich daher auch für den Einsatz in Smartphones.

Broadcom BCM28155

► remove from comparison Broadcom BCM28155

Der Broadcom BCM28155 ist ein Dual-Core Cortex-A9 SoC mit einer VideoCore-IV Grafikkarte. Mit 1.2 GHz Taktrate findet man den BCM28155 z.B. im Galaxy S II Plus. Das integrierte Modem unterstützt UMTS und HSPA+, jedoch kein LTE.

ModelApple A5xTexas Instruments OMAP 4430Broadcom BCM28155
SeriesApple Broadcom
CodenameCortex A9Cortex A9Cortex A9
Serie: Cortex A9
Texas Instruments OMAP 44701.5 GHz2 / 2 cores Cortex A9
Texas Instruments OMAP 44601.2 GHz2 / 2 cores Cortex A9
Broadcom BCM281551.2 GHz2 / 2 cores Cortex A9
Texas Instruments OMAP 44301 GHz2 / 2 cores Cortex A9
Apple A5x « 1 GHzcores Cortex A9
Apple A51 GHzcores Cortex A9
Texas Instruments OMAP 44701.5 GHz2 / 2 cores Cortex A9
Texas Instruments OMAP 44601.2 GHz2 / 2 cores Cortex A9
Broadcom BCM281551.2 GHz2 / 2 cores Cortex A9
Texas Instruments OMAP 4430 « 1 GHz2 / 2 cores Cortex A9
Apple A5x1 GHzcores Cortex A9
Apple A51 GHzcores Cortex A9
Texas Instruments OMAP 44701.5 GHz2 / 2 cores Cortex A9
Texas Instruments OMAP 44601.2 GHz2 / 2 cores Cortex A9
Broadcom BCM28155 « 1.2 GHz2 / 2 cores Cortex A9
Texas Instruments OMAP 44301 GHz2 / 2 cores Cortex A9
Apple A5x1 GHzcores Cortex A9
Apple A51 GHzcores Cortex A9
Clock1000 MHz1000 MHz1200 MHz
Cores / Threads22 / 22 / 2
Technology32? nm45 nm40 nm
ArchitectureARMARMARM
Announced
L1 Cache1 MB
TDP0.6 Watt
FeaturesDual Channel LPDDR 400MHz Memory Controller, IVA 3 Multimedia Accelerator, PowerVR SGX 540 Graphics Core, Image Signal ProcessorDual Channel LPDDR2 400MHz Memory Controller, VideoCore-IV GPU
Manufacturerwww.ti.comwww.broadcom.com

Benchmarks

3DMark - 3DMark Ice Storm Physics
100%
1 A5x +
2858 Points (2%)
3DMark - 3DMark Ice Storm Extreme Physics
100%
1 A5x +
2865 Points (2%)
Geekbench 4.0 - Geekbench 4.0 64 Bit Single-Core
100%
1 A5x +
330 Points (4%)
Geekbench 4.0 - Geekbench 4.0 64 Bit Multi-Core
100%
1 A5x +
566 Points (1%)
Geekbench 3 - Geekbench 3 32 Bit Multi-Core
100%
1 A5x +
496 Points (1%)
Geekbench 3 - Geekbench 3 32 Bit Single-Core
100%
1 A5x +
262 Points (5%)
Geekbench 2 - 32 Bit - Geekbench Stream
100%
A5x +
333 Points (3%)
191 Points (2%)
min: 149     avg: 240.5     median: 240.5 (2%)     max: 332 Points
Geekbench 2 - 32 Bit - Geekbench Memory
100%
A5x +
818 Points (7%)
923 Points (8%)
min: 731     avg: 738     median: 737.5 (7%)     max: 744 Points
Geekbench 2 - 32 Bit - Geekbench Floating Point
100%
A5x +
920 Points (2%)
183 Points (0%)
min: 555     avg: 930     median: 930 (2%)     max: 1305 Points
Geekbench 2 - 32 Bit - Geekbench Integer
100%
A5x +
687 Points (1%)
449 Points (1%)
min: 324     avg: 533     median: 533 (1%)     max: 742 Points
Geekbench 2 - 32 Bit - Geekbench Total Score
100%
A5x +
759 Points (2%)
424 Points (1%)
min: 468     avg: 679     median: 679 (2%)     max: 890 Points
Linpack Android / IOS - Linpack Multi Thread
100%
A5x +
142 MFLOPS (5%)
min: 38.78     avg: 59.5     median: 63.7 (2%)     max: 71.9 MFLOPS
min: 24.39     avg: 52     median: 52 (2%)     max: 79.7 MFLOPS
Linpack Android / IOS - Linpack Single Thread
100%
A5x +
87.8 MFLOPS (9%)
min: 36.48     avg: 40.8     median: 40.6 (4%)     max: 45.39 MFLOPS
min: 26.08     avg: 36.2     median: 36.2 (4%)     max: 46.3 MFLOPS
Mozilla Kraken 1.1 - Kraken 1.1 Total Score *
100%
1 A5x +
31272 ms (37%)
Sunspider - Sunspider 1.0 Total Score *
100%
1 A5x +
1307 ms (14%)
Sunspider - Sunspider 0.9.1 Total Score *
100%
A5x +
min: 1329     avg: 1595     median: 1594.5 (15%)     max: 1860 ms
min: 1761     avg: 1955     median: 1895.5 (18%)     max: 2269 ms
min: 1434     avg: 1701     median: 1701 (16%)     max: 1968 ms
Quadrant Standard Edition 2.0 - Quadrant Standard 2.0 Total Score
min: 2475     avg: 2571     median: 2571 (6%)     max: 2666 points
3909 points (9%)
AnTuTu v3 - AnTuTu v3 CPU
min: 1169     avg: 1255     median: 1255 (8%)     max: 1341 Points
PassMark PerformanceTest Mobile V1 - PerformanceTest Mobile V1 CPU Tests
100%
1 A5x +
11087 Points (1%)

Average Benchmarks Apple A5x → 100% n=8

Average Benchmarks Texas Instruments OMAP 4430 → 62% n=8

Average Benchmarks Broadcom BCM28155 → 76% n=8

- Bereich der Benchmarkergebnisse für diese Grafikkarte
- Durchschnittliche Benchmarkergebnisse für diese Grafikkarte
* Smaller numbers mean a higher performance
1 This benchmark is not used for the average calculation

v1.26
log 19. 08:55:39

#0 checking url part for id 3094 +0s ... 0s

#1 checking url part for id 3004 +0s ... 0s

#2 checking url part for id 3771 +0s ... 0s

#3 not redirecting to Ajax server +0s ... 0s

#4 did not recreate cache, as it is less than 5 days old! Created at Fri, 19 Apr 2024 05:38:49 +0200 +0.001s ... 0.001s

#5 composed specs +0.175s ... 0.177s

#6 did output specs +0s ... 0.177s

#7 getting avg benchmarks for device 3094 +0.004s ... 0.18s

#8 got single benchmarks 3094 +0.01s ... 0.19s

#9 getting avg benchmarks for device 3004 +0.003s ... 0.193s

#10 got single benchmarks 3004 +0.016s ... 0.209s

#11 getting avg benchmarks for device 3771 +0.003s ... 0.212s

#12 got single benchmarks 3771 +0.008s ... 0.219s

#13 got avg benchmarks for devices +0s ... 0.219s

#14 min, max, avg, median took s +0.101s ... 0.32s

#15 return log +0s ... 0.32s

Teilen Sie diesen Artikel, um uns zu unterstützen. Jeder Link hilft!
> Notebook Test, Laptop Test und News > Benchmarks / Technik > Benchmarks / Technik > Prozessor Vergleich - Head 2 Head
Autor: Klaus Hinum,  8.09.2017 (Update:  1.07.2023)