NVIDIA GeForce GTX 1060 Max-Q vs NVIDIA GeForce GTX 1070 Ti (Desktop)
NVIDIA GeForce GTX 1060 Max-Q ► remove from comparison
Die Nvidia GeForce GTX 1060 mit Max-Q Design ist eine mobile High-End-GPU der Pascal-Serie. Sie ist gedacht für dünne und leichte Notebook und je nach Kühlungsdesign etwa 10-15% langsamer als eine normale GTX 1060 für Laptops . Der Basistakt liegt mit 1063 - 1265 MHz deutlich unterhalb der normalen GTX 1060 (1506 MHz, mind. -16%) und auch der Boost erreicht mit 1341 - 1480 bei weitem nicht die 1708 MHz (mind. -13%) der regulären GTX 1060. Der Speichertakt ist jedoch gleich.
Im Vergleich zur normalen GTX 1060 gibt es noch weitere Unterschiede als den Takt. Der Treiber wurde auf Effizienz (und nicht Leistung) optimiert (nur für die Max-Q Modelle), optimierte Spannungswandler für 1V Betreib, high-end Kühlungsmethoden und eine 40 dB Grenze für die Lüfterlautstärke (mit Taktanpasssungen um dies jederzeit zu gewährleisten) zeichnen die Max-Q Variante aus.
Features
Der GP106-Chip wird in einem 16nm-FinFET-Prozess bei TSMC gefertigt und bietet eine Reihe neuer Features, unter anderem Support für DisplayPort 1.4 (ready), HDMI 2.0b, HDR, Simultaneous Multi-Projection (SMP) sowie verbessertes H.265 Video De- und Encoding (PlayReady 3.0). Eine genaue Auflistung der Verbesserungen und Features der neuen Pascal Desktop-GPUs finden Sie in unserem Pascal-Architektur-Artikel .
Der Stromverbrauch der Max-Q Variante ist deutlich reduziert und beträgt je nach Laptopmodell zwischen 60 und 70 Watt (TGP).
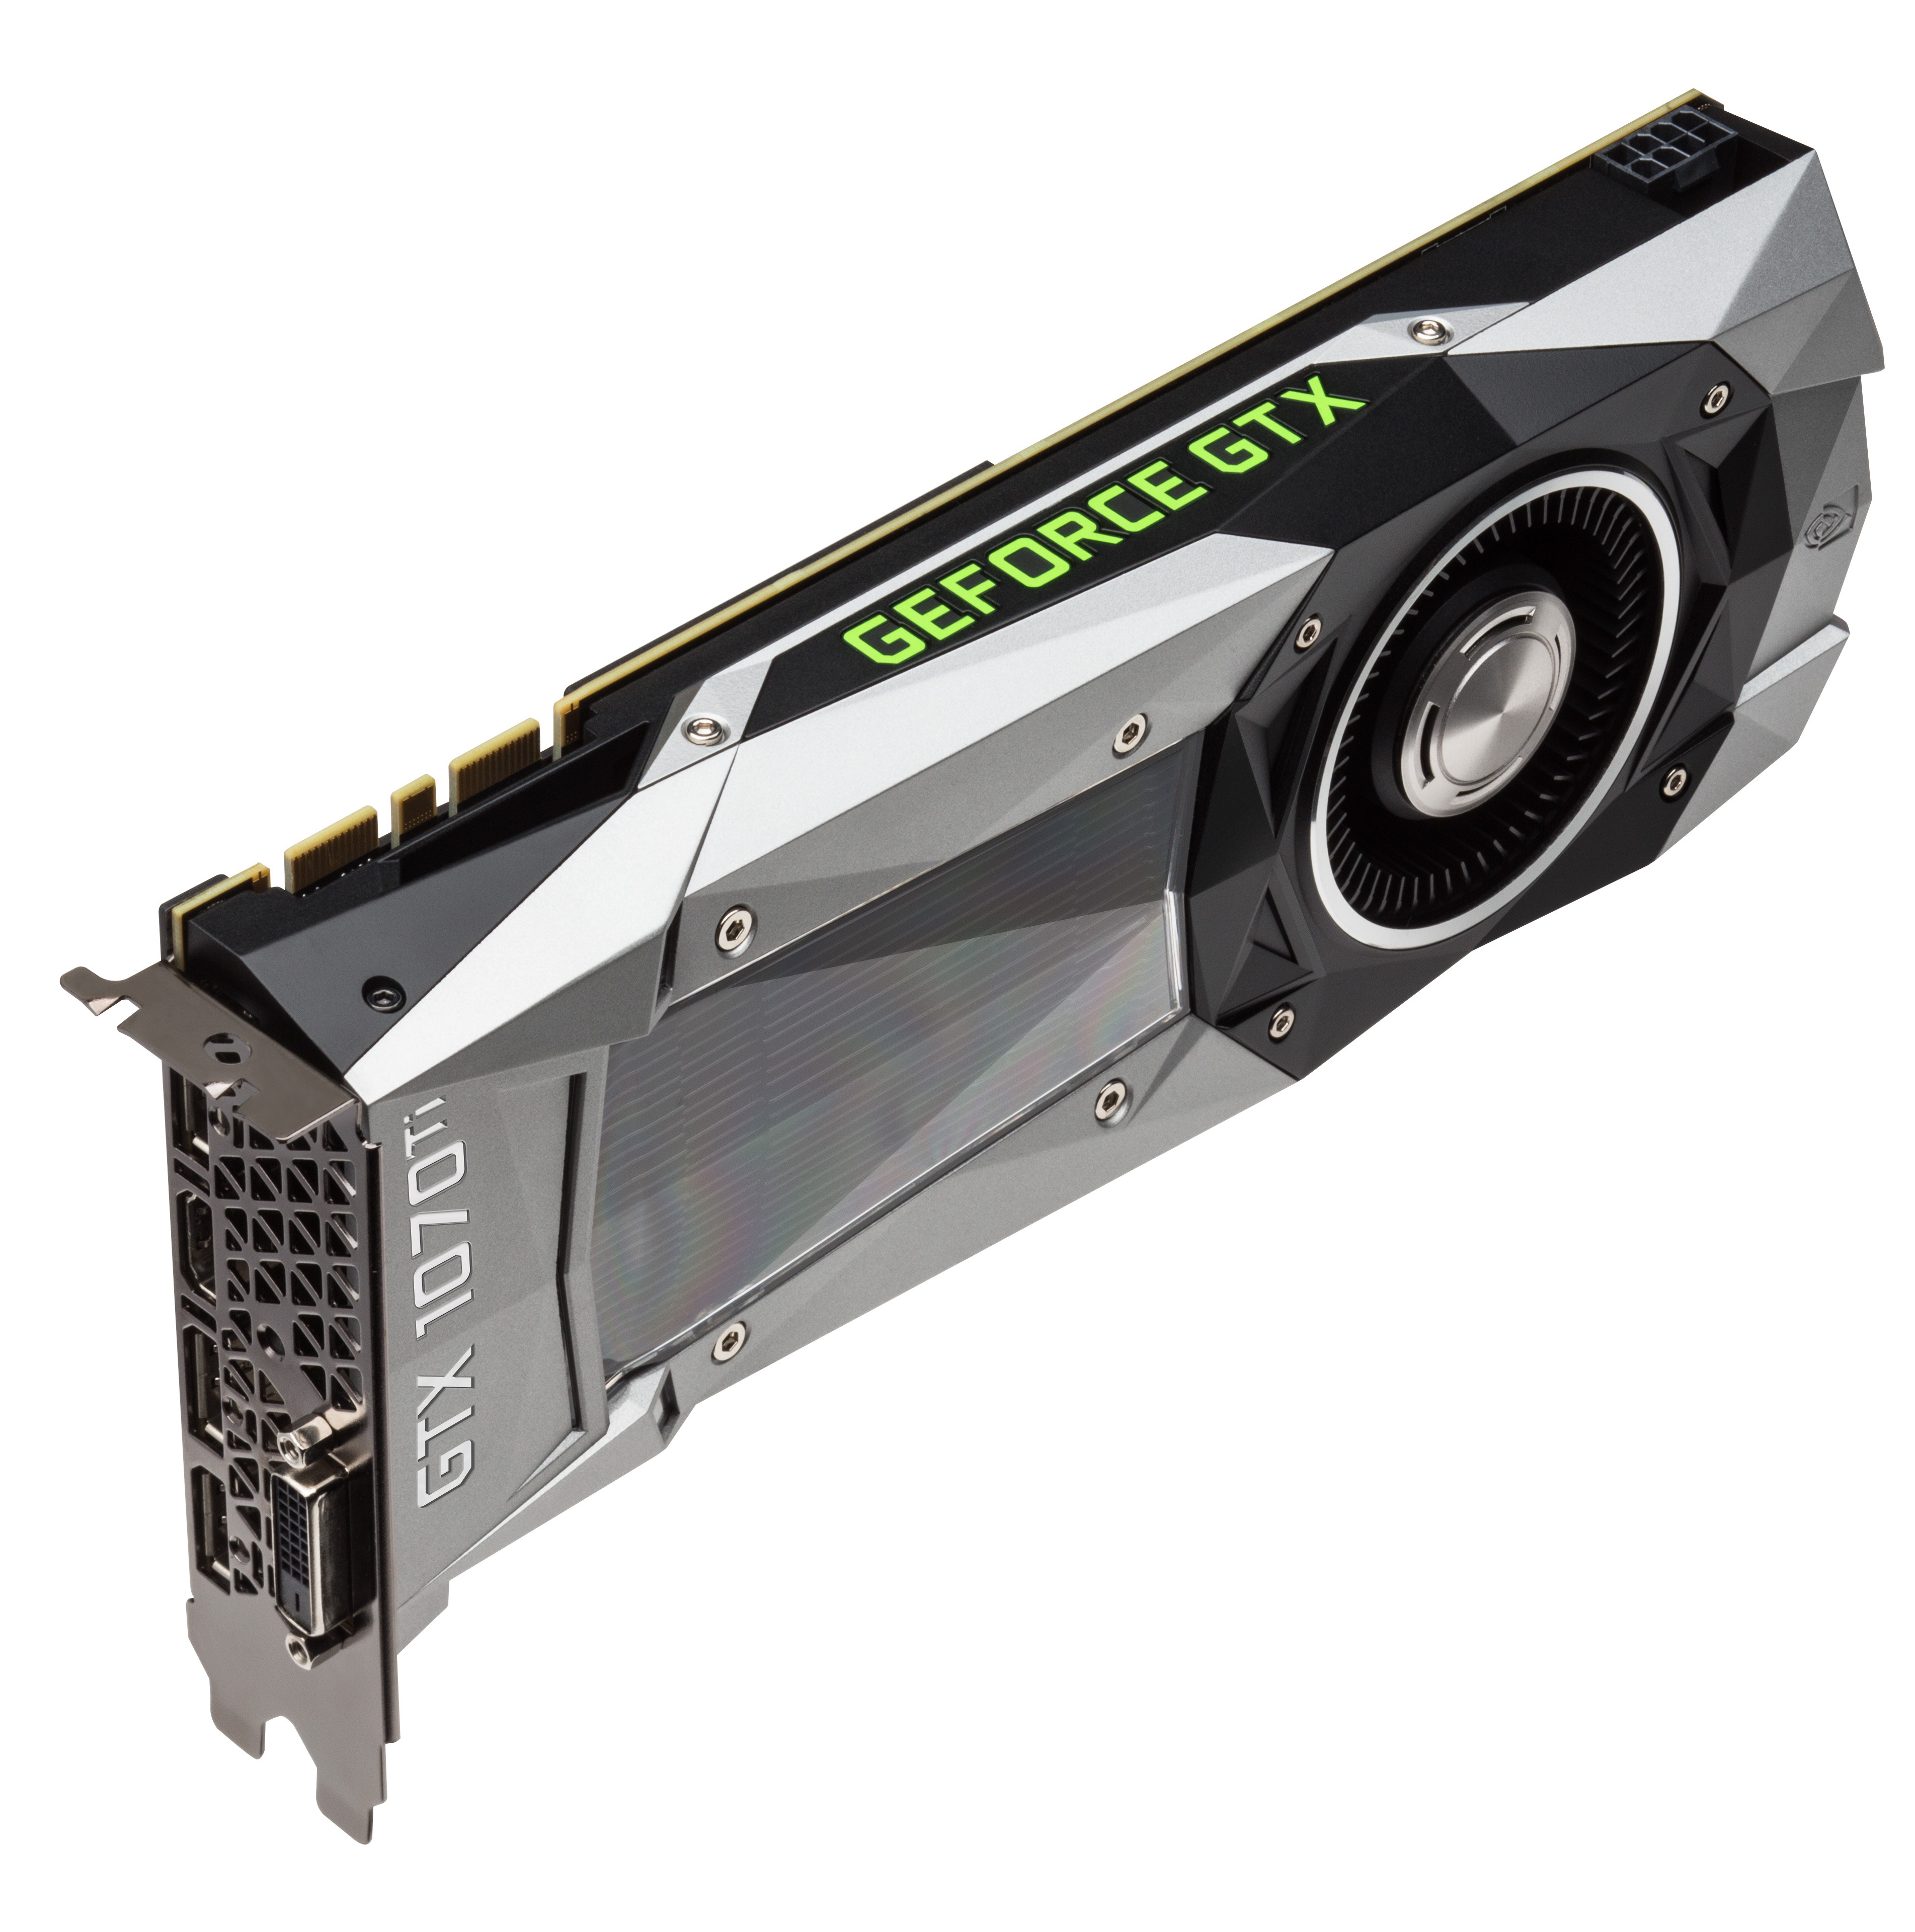
NVIDIA GeForce GTX 1070 Ti (Desktop) ► remove from comparison
Die Nvidia GeForce GTX 1070 Ti ist eine schnelle Desktop Grafikkarte der Pascal Generation. Sie positioniert sich zwischen GTX 1070 und GTX 1080 und wurde als Konter zur Radeon Vega 56 positioniert. Die Vorstellung war im November 2017. Im Vergleich zur GTX 1070 bietet die GTX 1070 Ti mehr Shader (2.432 versus 1.920) bei gleichem Boost Takt. Der 8 GB große Grafikspeicher ist wie bei der GTX 1070 vom Typ GDDR5 und nicht GDDR5X wie bei der GTX 1080.
Features
Der GP104-Chip wird in einem 16nm-FinFET-Prozess bei TSMC gefertigt und bietet eine Reihe neuer Features, unter anderem Support für DisplayPort 1.4 (ready), HDMI 2.0b, HDR, Simultaneous Multi-Projection (SMP) sowie verbessertes H.265 Video De- und Encoding (PlayReady 3.0). Eine genaue Auflistung der Verbesserungen und Features der neuen Pascal Desktop-GPUs finden Sie in unserem Pascal-Architektur-Artikel .
Performance
Die GeForce GTX 1070 Ti positioniert sich wenig überraschend zwischen GTX 1070 und GTX 1080. Damit eignet sich die Grafikkarte am besten für 2560x1440 mit maximalen Details für aktuelle Spiele. Anspruchslosere Spiele können auch in 4K flüssig gespielt werden.
Leistungsaufnahme
Die Leistungsaufnahme der GeForce GTX 1070 Ti wird vom Hersteller mit 180 Watt beziffert und liegt damit in einer ähnlichen Größenordnung wie die GTX 1080. In unseren Tests positioniert sich die Karte leicht darunter aber auch deutlich über der GTX 1070 (150 Watt TDP).
NVIDIA GeForce GTX 1060 Max-Q NVIDIA GeForce GTX 1070 Ti (Desktop) GeForce GTX 1000 Serie Codename N17P-G1 Max-Q Pascal GP104 Architektur Pascal Pascal Pipelines 1280 - unified 2432 - unified Kerntakt 1063 - 1265 - 1341 - 1480 (Boost) MHz 1607 - 1683 (Boost) MHz Speichertakt 8000 MHz 8000 MHz Speicherbandbreite 192 Bit 256 Bit Speichertyp GDDR5 GDDR5 Max. Speichergröße 6.144 MB 8 GB Shared Memory nein nein API DirectX 12_1, OpenGL 4.5 DirectX 12_1, OpenGL 4.5 Stromverbrauch 60 - 70 Watt 180 Watt Transistors 4.4 Billion 7.2 Billion Herstellungsprozess 16 nm 16 nm Features Multi-Projection, VR Ready, G-SYNC, Vulkan, Multi Monitor Multi-Projection, VR Ready, G-SYNC, Vulkan, Multi Monitor Notebookgröße groß (17" z.B.) Erscheinungsdatum 30.05.2017 02.11.2017 Herstellerseite www.nvidia.at
Benchmarks Performance Rating - 3DMark 11 + Fire Strike + Time Spy - GeForce GTX 1060 Max-Q
4.8 pt (14%)
...
NVIDIA GeForce GTX 1060 Max-Q
...
max:
3DMark - 3DMark Time Spy Score
min: 3271 avg: 3415 median: 3415 (10%) max: 3559 Points
6177 Points (18%)
3DMark - 3DMark Time Spy Graphics
min: 3138 avg: 3324 median: 3324 (9%) max: 3510 Points
6531 Points (17%)
3DMark - 3DMark Ice Storm Unlimited Graphics
min: 287286 avg: 346663 median: 367999 (42%) max: 384095 Points
442105 Points (50%)
3DMark - 3DMark Ice Storm Extreme Graphics
min: 71289 avg: 105162 median: 96536 (12%) max: 156285 Points
3DMark - 3DMark Cloud Gate Score
min: 16358 avg: 24167 median: 24154.5 (26%) max: 32658 Points
29364 Points (31%)
3DMark - 3DMark Cloud Gate Graphics
min: 42781 avg: 71376 median: 74101 (19%) max: 81720 Points
88161 Points (23%)
3DMark - 3DMark Fire Strike Standard Score
min: 8292 avg: 9159 median: 9148.5 (16%) max: 9936 Points
15061 Points (27%)
3DMark - 3DMark Fire Strike Standard Graphics
min: 9992 avg: 10659 median: 10430 (12%) max: 11366 Points
18405 Points (21%)
3DMark - 3DMark Ice Storm Graphics
min: 80051 avg: 144686 median: 118989 (14%) max: 265343 Points
3DMark 11 - 3DM11 Performance Score
min: 10176 avg: 11974 median: 11973 (17%) max: 13296 Points
20106 Points (28%)
3DMark 11 - 3DM11 Performance GPU
min: 12970 avg: 13581 median: 13333.5 (11%) max: 14487 Points
27503 Points (24%)
3DMark 06 3DMark 06 - Standard 1280x1024 + NVIDIA GeForce GTX 1060 Max-Q
34189 Points (45%)
3DMark 06 - Standard 1280x1024 + NVIDIA GeForce GTX 1070 Ti (Desktop)
36475 Points (48%)
SPECviewperf 11 + NVIDIA GeForce GTX 1060 Max-Q SPECviewperf 11 - specvp11 snx-01
9.5 fps (6%)
specvp11 tcvis-02 + NVIDIA GeForce GTX 1060 Max-Q SPECviewperf 11 - specvp11 tcvis-02
2.8 fps (2%)
specvp11 sw-02 + NVIDIA GeForce GTX 1060 Max-Q SPECviewperf 11 - specvp11 sw-02
18.4 fps (14%)
specvp11 proe-05 + NVIDIA GeForce GTX 1060 Max-Q SPECviewperf 11 - specvp11 proe-05
2.8 fps (3%)
specvp11 maya-03 + NVIDIA GeForce GTX 1060 Max-Q SPECviewperf 11 - specvp11 maya-03
17.3 fps (13%)
specvp11 lightwave-01 + NVIDIA GeForce GTX 1060 Max-Q SPECviewperf 11 - specvp11 lightwave-01
20.1 fps (22%)
specvp11 ensight-04 + NVIDIA GeForce GTX 1060 Max-Q SPECviewperf 11 - specvp11 ensight-04
109.7 fps (52%)
specvp11 catia-03 + NVIDIA GeForce GTX 1060 Max-Q SPECviewperf 11 - specvp11 catia-03
19.7 fps (10%)
SPECviewperf 12 + NVIDIA GeForce GTX 1060 Max-Q SPECviewperf 12 - specvp12 sw-03
43.9 fps (11%)
specvp12 snx-02 + NVIDIA GeForce GTX 1060 Max-Q SPECviewperf 12 - specvp12 snx-02
5.4 fps (1%)
specvp12 showcase-01 + NVIDIA GeForce GTX 1060 Max-Q SPECviewperf 12 - specvp12 showcase-01
56.2 fps (12%)
specvp12 mediacal-01 + NVIDIA GeForce GTX 1060 Max-Q SPECviewperf 12 - specvp12 mediacal-01
27.5 fps (7%)
specvp12 maya-04 + NVIDIA GeForce GTX 1060 Max-Q SPECviewperf 12 - specvp12 maya-04
92 fps (25%)
specvp12 energy-01 + NVIDIA GeForce GTX 1060 Max-Q SPECviewperf 12 - specvp12 energy-01
5.2 fps (5%)
specvp12 creo-01 + NVIDIA GeForce GTX 1060 Max-Q SPECviewperf 12 - specvp12 creo-01
34.8 fps (14%)
specvp12 catia-04 + NVIDIA GeForce GTX 1060 Max-Q SPECviewperf 12 - specvp12 catia-04
45.4 fps (8%)
Cinebench R10 Cinebench R10 Shading (32bit) + NVIDIA GeForce GTX 1060 Max-Q Cinebench R10 - Cinebench R10 Shading (32bit)
min: 6822 avg: 8146 median: 6829.5 (5%) max: 11275 Points
Cinebench R11.5 Cinebench R11.5 OpenGL 64 Bit + NVIDIA GeForce GTX 1060 Max-Q Cinebench R11.5 - Cinebench R11.5 OpenGL 64 Bit
min: 59.6 avg: 68.9 median: 71.7 (25%) max: 76.2 fps
Cinebench R15 + NVIDIA GeForce GTX 1060 Max-Q Cinebench R15 - Cinebench R15 OpenGL 64 Bit
min: 88.5 avg: 107.1 median: 110.6 (6%) max: 120.1 fps
Cinebench R15 OpenGL Ref. Match 64 Bit + NVIDIA GeForce GTX 1060 Max-Q Cinebench R15 - Cinebench R15 OpenGL Ref. Match 64 Bit
99.6 % (100%)
GFXBench 3.0 - GFXBench 3.0 Manhattan Offscreen
398 fps (23%)
LuxMark v2.0 64Bit - LuxMark v2.0 Room GPU
1614 Samples/s (7%)
2542 Samples/s (11%)
LuxMark v2.0 64Bit - LuxMark v2.0 Sala GPU
2924 Samples/s (5%)
5159 Samples/s (9%)
ComputeMark v2.1 - ComputeMark v2.1 Result
min: 7555 avg: 7747 median: 7653 (8%) max: 8202 Points
15488 Points (17%)
Power Consumption - Furmark Stress Test Power Consumption - external Monitor *
291 Watt (41%)
Power Consumption - The Witcher 3 Power Consumption - external Monitor *
290 Watt (41%)
Power Consumption - Witcher 3 Power Consumption *
min: 89 avg: 105 median: 101.9 (22%) max: 123.1 Watt
Power Consumption - Witcher 3 ultra Power Efficiency
min: 0.3006 avg: 0.3 median: 0.3 (35%) max: 0.3955 fps per Watt
Power Consumption - Witcher 3 ultra Power Efficiency - external Monitor
0.2 fps per Watt (21%)
Emissions Witcher 3 Fan Noise + NVIDIA GeForce GTX 1060 Max-Q Emissions - Witcher 3 Fan Noise
min: 37.6 avg: 44.1 median: 44.1 (71%) max: 51.3 dB(A)
Clock Speed - GPU Clock Witcher 3 ultra
1440 MHz (56%)
1810 MHz (71%)
Clock Speed - GPU Clock Speed Furmark
1677 MHz (66%)
Average Benchmarks NVIDIA GeForce GTX 1060 Max-Q → 100% n=14 Average Benchmarks NVIDIA GeForce GTX 1070 Ti (Desktop) → 159% n=14
- Bereich der Benchmarkergebnisse für diese Grafikkarte
- Durchschnittliche Benchmarkergebnisse für diese Grafikkarte
* Smaller numbers mean a higher performance
1 This benchmark is not used for the average calculation
Spiele-Benchmarks Die folgenden Benchmarks basieren auf unseren Spieletests mit Testnotebooks. Die Performance dieser Grafikkarte bei den gelisteten Spielen ist abhängig von der verwendeten CPU, Speicherausstattung, Treiber und auch Betriebssystem. Dadurch müssen die untenstehenden Werte nicht repräsentativ sein. Detaillierte Informationen über das verwendete System sehen Sie nach einem Klick auf den fps-Wert.
GeForce GTX 1070 Ti (Desktop):
200 [X] i7-7740X Asus X299 Prime Intel Core i7-7740X 4.3GHz
GeForce GTX 1070 Ti (Desktop)
min:
173 fps, max:
219 fps
fps
GeForce GTX 1070 Ti (Desktop):
78 [X] i7-7740X Asus X299 Prime Intel Core i7-7740X 4.3GHz
GeForce GTX 1070 Ti (Desktop)
min:
68 fps, max:
88 fps
fps
GeForce GTX 1070 Ti (Desktop):
58.5 [X] i7-7740X Asus X299 Prime Intel Core i7-7740X 4.3GHz
GeForce GTX 1070 Ti (Desktop)
min:
50 fps, max:
67 fps
fps
GeForce GTX 1070 Ti (Desktop):
37.1 [X] i7-7740X Asus X299 Prime Intel Core i7-7740X 4.3GHz
GeForce GTX 1070 Ti (Desktop)
min:
31 fps, max:
43 fps
fps
GeForce GTX 1070 Ti (Desktop):
17.9 [X] i7-7740X Asus X299 Prime Intel Core i7-7740X 4.3GHz
GeForce GTX 1070 Ti (Desktop)
min:
15 fps, max:
21 fps
fps
GeForce GTX 1070 Ti (Desktop):
244 [X] i7-7740X Asus X299 Prime Intel Core i7-7740X 4.3GHz
GeForce GTX 1070 Ti (Desktop)
min:
195 fps, max:
269 fps
fps
GeForce GTX 1070 Ti (Desktop):
183 [X] i7-7740X Asus X299 Prime Intel Core i7-7740X 4.3GHz
GeForce GTX 1070 Ti (Desktop)
min:
155 fps, max:
196 fps
fps
GeForce GTX 1070 Ti (Desktop):
164 [X] i7-7740X Asus X299 Prime Intel Core i7-7740X 4.3GHz
GeForce GTX 1070 Ti (Desktop)
min:
145 fps, max:
176 fps
fps
GeForce GTX 1070 Ti (Desktop):
120 [X] i7-7740X Asus X299 Prime Intel Core i7-7740X 4.3GHz
GeForce GTX 1070 Ti (Desktop)
min:
112 fps, max:
129 fps
fps
GeForce GTX 1070 Ti (Desktop):
94 [X] i7-7740X Asus X299 Prime Intel Core i7-7740X 4.3GHz
GeForce GTX 1070 Ti (Desktop)
min:
86 fps, max:
98 fps
fps
GeForce GTX 1070 Ti (Desktop):
57 [X] i7-7740X Asus X299 Prime Intel Core i7-7740X 4.3GHz
GeForce GTX 1070 Ti (Desktop)
min:
52 fps, max:
60 fps
fps
GeForce GTX 1070 Ti (Desktop):
271 [X] i7-7740X Asus X299 Prime Intel Core i7-7740X 4.3GHz
GeForce GTX 1070 Ti (Desktop)
min:
209 fps, max:
313 fps
fps
GeForce GTX 1070 Ti (Desktop):
249 [X] i7-7740X Asus X299 Prime Intel Core i7-7740X 4.3GHz
GeForce GTX 1070 Ti (Desktop)
min:
201 fps, max:
284 fps
fps
GeForce GTX 1070 Ti (Desktop):
241 [X] i7-7740X Asus X299 Prime Intel Core i7-7740X 4.3GHz
GeForce GTX 1070 Ti (Desktop)
min:
189 fps, max:
269 fps
fps
GeForce GTX 1070 Ti (Desktop):
219 [X] i7-7740X Asus X299 Prime Intel Core i7-7740X 4.3GHz
GeForce GTX 1070 Ti (Desktop)
min:
159 fps, max:
243 fps
fps
GeForce GTX 1070 Ti (Desktop):
222 [X] i7-7740X Asus X299 Prime Intel Core i7-7740X 4.3GHz
GeForce GTX 1070 Ti (Desktop)
min:
176 fps, max:
250 fps
fps
GeForce GTX 1070 Ti (Desktop):
221 [X] i7-7740X Asus X299 Prime Intel Core i7-7740X 4.3GHz
GeForce GTX 1070 Ti (Desktop)
min:
161 fps, max:
247 fps
fps
GeForce GTX 1070 Ti (Desktop):
86.6 [X] i7-7740X Asus X299 Prime Intel Core i7-7740X 4.3GHz
GeForce GTX 1070 Ti (Desktop)
min:
71 fps, max:
102 fps
fps
GeForce GTX 1070 Ti (Desktop):
63.4 [X] i7-7740X Asus X299 Prime Intel Core i7-7740X 4.3GHz
GeForce GTX 1070 Ti (Desktop)
min:
56 fps, max:
76 fps
fps
GeForce GTX 1070 Ti (Desktop):
41.2 [X] i7-7740X Asus X299 Prime Intel Core i7-7740X 4.3GHz
GeForce GTX 1070 Ti (Desktop)
min:
36 fps, max:
47 fps
fps
GeForce GTX 1070 Ti (Desktop):
20.3 [X] i7-7740X Asus X299 Prime Intel Core i7-7740X 4.3GHz
GeForce GTX 1070 Ti (Desktop)
min:
17 fps, max:
22 fps
fps
GeForce GTX 1070 Ti (Desktop):
46 [X] i7-7740X Asus X299 Prime Intel Core i7-7740X 4.3GHz
GeForce GTX 1070 Ti (Desktop)
min:
39 fps, max:
54 fps
fps
GeForce GTX 1070 Ti (Desktop):
40.4 [X] i7-7740X Asus X299 Prime Intel Core i7-7740X 4.3GHz
GeForce GTX 1070 Ti (Desktop)
min:
34 fps, max:
44 fps
fps
GeForce GTX 1070 Ti (Desktop):
24.1 [X] i7-7740X Asus X299 Prime Intel Core i7-7740X 4.3GHz
GeForce GTX 1070 Ti (Desktop)
min:
22 fps, max:
26 fps
fps
GeForce GTX 1070 Ti (Desktop):
121 [X] i7-7740X Asus X299 Prime Intel Core i7-7740X 4.3GHz
GeForce GTX 1070 Ti (Desktop)
min:
93 fps, max:
174 fps
fps
GeForce GTX 1070 Ti (Desktop):
107 [X] i7-7740X Asus X299 Prime Intel Core i7-7740X 4.3GHz
GeForce GTX 1070 Ti (Desktop)
min:
83 fps, max:
140 fps
fps
GeForce GTX 1070 Ti (Desktop):
103 [X] i7-7740X Asus X299 Prime Intel Core i7-7740X 4.3GHz
GeForce GTX 1070 Ti (Desktop)
min:
84 fps, max:
132 fps
fps
GeForce GTX 1070 Ti (Desktop):
93 [X] i7-7740X Asus X299 Prime Intel Core i7-7740X 4.3GHz
GeForce GTX 1070 Ti (Desktop)
min:
72 fps, max:
127 fps
fps
GeForce GTX 1070 Ti (Desktop):
76 [X] i7-7740X Asus X299 Prime Intel Core i7-7740X 4.3GHz
GeForce GTX 1070 Ti (Desktop)
min:
60 fps, max:
95 fps
fps
GeForce GTX 1070 Ti (Desktop):
42 [X] i7-7740X Asus X299 Prime Intel Core i7-7740X 4.3GHz
GeForce GTX 1070 Ti (Desktop)
min:
34 fps, max:
51 fps
fps
GeForce GTX 1070 Ti (Desktop):
147 [X] i7-7740X Asus X299 Prime Intel Core i7-7740X 4.3GHz
GeForce GTX 1070 Ti (Desktop)
min:
77.86 fps, max:
237.53 fps
fps
GeForce GTX 1070 Ti (Desktop):
83 [X] i7-7740X Asus X299 Prime Intel Core i7-7740X 4.3GHz
GeForce GTX 1070 Ti (Desktop)
min:
40.8 fps, max:
146.74 fps
fps
GeForce GTX 1070 Ti (Desktop):
63 [X] i7-7740X Asus X299 Prime Intel Core i7-7740X 4.3GHz
GeForce GTX 1070 Ti (Desktop)
min:
32.59 fps, max:
112.4 fps
fps
GeForce GTX 1070 Ti (Desktop):
52.3 [X] i7-7740X Asus X299 Prime Intel Core i7-7740X 4.3GHz
GeForce GTX 1070 Ti (Desktop)
min:
28.83 fps, max:
88.2 fps
fps
GeForce GTX 1070 Ti (Desktop):
40.2 [X] i7-7740X Asus X299 Prime Intel Core i7-7740X 4.3GHz
GeForce GTX 1070 Ti (Desktop)
min:
24.15 fps, max:
62.69 fps
fps
GeForce GTX 1070 Ti (Desktop):
24.6 [X] i7-7740X Asus X299 Prime Intel Core i7-7740X 4.3GHz
GeForce GTX 1070 Ti (Desktop)
min:
16.12 fps, max:
36.5 fps
fps
GeForce GTX 1070 Ti (Desktop):
144 [X] i7-7740X Asus X299 Prime Intel Core i7-7740X 4.3GHz
GeForce GTX 1070 Ti (Desktop)
min:
143 fps, max:
145 fps
fps
GeForce GTX 1070 Ti (Desktop):
138 [X] i7-7740X Asus X299 Prime Intel Core i7-7740X 4.3GHz
GeForce GTX 1070 Ti (Desktop)
min:
128 fps, max:
145 fps
fps
GeForce GTX 1070 Ti (Desktop):
123 [X] i7-7740X Asus X299 Prime Intel Core i7-7740X 4.3GHz
GeForce GTX 1070 Ti (Desktop)
min:
110 fps, max:
145 fps
fps
GeForce GTX 1070 Ti (Desktop):
121 [X] i7-7740X Asus X299 Prime Intel Core i7-7740X 4.3GHz
GeForce GTX 1070 Ti (Desktop)
min:
109 fps, max:
145 fps
fps
GeForce GTX 1070 Ti (Desktop):
81 [X] i7-7740X Asus X299 Prime Intel Core i7-7740X 4.3GHz
GeForce GTX 1070 Ti (Desktop)
min:
63 fps, max:
100 fps
fps
GeForce GTX 1070 Ti (Desktop):
42.4 [X] i7-7740X Asus X299 Prime Intel Core i7-7740X 4.3GHz
GeForce GTX 1070 Ti (Desktop)
min:
37 fps, max:
52 fps
fps
GeForce GTX 1070 Ti (Desktop):
88 [X] i7-7740X Asus X299 Prime Intel Core i7-7740X 4.3GHz
GeForce GTX 1070 Ti (Desktop)
min:
82 fps, max:
94 fps
fps
GeForce GTX 1070 Ti (Desktop):
64 [X] i7-7740X Asus X299 Prime Intel Core i7-7740X 4.3GHz
GeForce GTX 1070 Ti (Desktop)
min:
58 fps, max:
68 fps
fps
GeForce GTX 1070 Ti (Desktop):
35.3 [X] i7-7740X Asus X299 Prime Intel Core i7-7740X 4.3GHz
GeForce GTX 1070 Ti (Desktop)
min:
32 fps, max:
38 fps
fps
GeForce GTX 1070 Ti (Desktop):
110 [X] i7-7740X Asus X299 Prime Intel Core i7-7740X 4.3GHz
GeForce GTX 1070 Ti (Desktop)
min:
84 fps, max:
125 fps
fps
GeForce GTX 1070 Ti (Desktop):
74 [X] i7-7740X Asus X299 Prime Intel Core i7-7740X 4.3GHz
GeForce GTX 1070 Ti (Desktop)
min:
62 fps, max:
84 fps
fps
GeForce GTX 1070 Ti (Desktop):
35.4 [X] i7-7740X Asus X299 Prime Intel Core i7-7740X 4.3GHz
GeForce GTX 1070 Ti (Desktop)
min:
27 fps, max:
41 fps
fps
GeForce GTX 1070 Ti (Desktop):
111 [X] i7-7740X Asus X299 Prime Intel Core i7-7740X 4.3GHz
GeForce GTX 1070 Ti (Desktop)
min:
90 fps, max:
162 fps
fps
GeForce GTX 1070 Ti (Desktop):
83 [X] i7-7740X Asus X299 Prime Intel Core i7-7740X 4.3GHz
GeForce GTX 1070 Ti (Desktop)
min:
67 fps, max:
124 fps
fps
GeForce GTX 1070 Ti (Desktop):
47.1 [X] i7-7740X Asus X299 Prime Intel Core i7-7740X 4.3GHz
GeForce GTX 1070 Ti (Desktop)
min:
37 fps, max:
72 fps
fps
GeForce GTX 1070 Ti (Desktop):
120 [X] i7-7740X Asus X299 Prime Intel Core i7-7740X 4.3GHz
GeForce GTX 1070 Ti (Desktop)
min:
94 fps, max:
156 fps
fps
GeForce GTX 1070 Ti (Desktop):
80 [X] i7-7740X Asus X299 Prime Intel Core i7-7740X 4.3GHz
GeForce GTX 1070 Ti (Desktop)
min:
61 fps, max:
105 fps
fps
GeForce GTX 1070 Ti (Desktop):
40.1 [X] i7-7740X Asus X299 Prime Intel Core i7-7740X 4.3GHz
GeForce GTX 1070 Ti (Desktop)
min:
28 fps, max:
53 fps
fps
GeForce GTX 1070 Ti (Desktop):
63 [X] i7-7740X Asus X299 Prime Intel Core i7-7740X 4.3GHz
GeForce GTX 1070 Ti (Desktop)
min:
35 fps, max:
124 fps
fps
GeForce GTX 1070 Ti (Desktop):
48 [X] i7-7740X Asus X299 Prime Intel Core i7-7740X 4.3GHz
GeForce GTX 1070 Ti (Desktop)
min:
24 fps, max:
81 fps
fps
GeForce GTX 1070 Ti (Desktop):
27 [X] i7-7740X Asus X299 Prime Intel Core i7-7740X 4.3GHz
GeForce GTX 1070 Ti (Desktop)
min:
13 fps, max:
63 fps
fps
GeForce GTX 1070 Ti (Desktop):
100 [X] i7-7740X Asus X299 Prime Intel Core i7-7740X 4.3GHz
GeForce GTX 1070 Ti (Desktop)
min:
87 fps, max:
129 fps
fps
GeForce GTX 1070 Ti (Desktop):
81 [X] i7-7740X Asus X299 Prime Intel Core i7-7740X 4.3GHz
GeForce GTX 1070 Ti (Desktop)
min:
73 fps, max:
103 fps
fps
GeForce GTX 1070 Ti (Desktop):
55 [X] i7-7740X Asus X299 Prime Intel Core i7-7740X 4.3GHz
GeForce GTX 1070 Ti (Desktop)
min:
49 fps, max:
68 fps
fps
GeForce GTX 1070 Ti (Desktop):
267 [X] i7-7740X Asus X299 Prime Intel Core i7-7740X 4.3GHz
GeForce GTX 1070 Ti (Desktop)
min:
248 fps, max:
287 fps
fps
GeForce GTX 1070 Ti (Desktop):
141 [X] i7-7740X Asus X299 Prime Intel Core i7-7740X 4.3GHz
GeForce GTX 1070 Ti (Desktop)
min:
114 fps, max:
165 fps
fps
GeForce GTX 1070 Ti (Desktop):
84 [X] i7-7740X Asus X299 Prime Intel Core i7-7740X 4.3GHz
GeForce GTX 1070 Ti (Desktop)
min:
67 fps, max:
142 fps
fps
GeForce GTX 1070 Ti (Desktop):
51 [X] i7-7740X Asus X299 Prime Intel Core i7-7740X 4.3GHz
GeForce GTX 1070 Ti (Desktop)
min:
46 fps, max:
87 fps
fps
GeForce GTX 1070 Ti (Desktop):
28 [X] i7-7740X Asus X299 Prime Intel Core i7-7740X 4.3GHz
GeForce GTX 1070 Ti (Desktop)
min:
24 fps, max:
43 fps
fps
GeForce GTX 1070 Ti (Desktop):
97 [X] i7-7740X Asus X299 Prime Intel Core i7-7740X 4.3GHz
GeForce GTX 1070 Ti (Desktop)
min:
85 fps, max:
102 fps
fps
GeForce GTX 1070 Ti (Desktop):
78 [X] i7-7740X Asus X299 Prime Intel Core i7-7740X 4.3GHz
GeForce GTX 1070 Ti (Desktop)
min:
70 fps, max:
82 fps
fps
GeForce GTX 1070 Ti (Desktop):
49 [X] i7-7740X Asus X299 Prime Intel Core i7-7740X 4.3GHz
GeForce GTX 1070 Ti (Desktop)
min:
44 fps, max:
51 fps
fps
GeForce GTX 1070 Ti (Desktop):
78 [X] i7-7740X Asus X299 Prime Intel Core i7-7740X 4.3GHz
GeForce GTX 1070 Ti (Desktop)
min:
64 fps, max:
99 fps
fps
GeForce GTX 1070 Ti (Desktop):
48.5 [X] i7-7740X Asus X299 Prime Intel Core i7-7740X 4.3GHz
GeForce GTX 1070 Ti (Desktop)
min:
41 fps, max:
59 fps
fps
GeForce GTX 1070 Ti (Desktop):
23.8 [X] i7-7740X Asus X299 Prime Intel Core i7-7740X 4.3GHz
GeForce GTX 1070 Ti (Desktop)
min:
21 fps, max:
28 fps
fps
100%
GeForce GTX 1060 Max-Q:
110 [X] Dell G5 15 5587 Intel Core i5-8300H 2.3GHz
GeForce GTX 1060 Max-Q
min:
89 fps, max:
137 fps
fps
123%
GeForce GTX 1070 Ti (Desktop):
135 [X] i7-7740X Asus X299 Prime Intel Core i7-7740X 4.3GHz
GeForce GTX 1070 Ti (Desktop)
min:
111 fps, max:
171 fps
fps
100%
GeForce GTX 1060 Max-Q:
70 [X] Dell G5 15 5587 Intel Core i5-8300H 2.3GHz
GeForce GTX 1060 Max-Q
min:
5 fps, max:
84 fps
fps
163%
GeForce GTX 1070 Ti (Desktop):
114 [X] i7-7740X Asus X299 Prime Intel Core i7-7740X 4.3GHz
GeForce GTX 1070 Ti (Desktop)
min:
95 fps, max:
132 fps
fps
100%
GeForce GTX 1060 Max-Q:
65 [X] Dell G5 15 5587 Intel Core i5-8300H 2.3GHz
GeForce GTX 1060 Max-Q
min:
58 fps, max:
79 fps
fps
166%
GeForce GTX 1070 Ti (Desktop):
108 [X] i7-7740X Asus X299 Prime Intel Core i7-7740X 4.3GHz
GeForce GTX 1070 Ti (Desktop)
min:
95 fps, max:
122 fps
fps
100%
GeForce GTX 1060 Max-Q:
48 [X] Dell G5 15 5587 Intel Core i5-8300H 2.3GHz
GeForce GTX 1060 Max-Q
min:
4 fps, max:
71 fps
fps
213%
GeForce GTX 1070 Ti (Desktop):
102 [X] i7-7740X Asus X299 Prime Intel Core i7-7740X 4.3GHz
GeForce GTX 1070 Ti (Desktop)
min:
79 fps, max:
116 fps
fps
GeForce GTX 1070 Ti (Desktop):
75 [X] i7-7740X Asus X299 Prime Intel Core i7-7740X 4.3GHz
GeForce GTX 1070 Ti (Desktop)
min:
67 fps, max:
85 fps
fps
100%
GeForce GTX 1060 Max-Q:
20 [X] Dell G5 15 5587 Intel Core i5-8300H 2.3GHz
GeForce GTX 1060 Max-Q
min:
17 fps, max:
24 fps
fps
195%
GeForce GTX 1070 Ti (Desktop):
39 [X] i7-7740X Asus X299 Prime Intel Core i7-7740X 4.3GHz
GeForce GTX 1070 Ti (Desktop)
min:
34 fps, max:
45 fps
fps
GeForce GTX 1070 Ti (Desktop):
101 [X] Intel Core i7-4790K 4GHz
GeForce GTX 1070 Ti (Desktop)
fps
GeForce GTX 1070 Ti (Desktop):
89 [X] Intel Core i7-4790K 4GHz
GeForce GTX 1070 Ti (Desktop)
fps
GeForce GTX 1070 Ti (Desktop):
74.5 [X] Intel Core i7-4790K 4GHz
GeForce GTX 1070 Ti (Desktop)
fps
GeForce GTX 1070 Ti (Desktop):
66.7 [X] Intel Core i7-4790K 4GHz
GeForce GTX 1070 Ti (Desktop)
fps
100%
GeForce GTX 1060 Max-Q:
60 [X] Dell G7 15-7588 Intel Core i7-8750H 2.2GHz
GeForce GTX 1060 Max-Q
110 [X] Dell G5 15 5587 Intel Core i5-8300H 2.3GHz
GeForce GTX 1060 Max-Q
min:
90 fps, max:
131 fps
~ 85 fps
181%
GeForce GTX 1070 Ti (Desktop):
154 [X] Intel Core i7-4790K 4GHz
GeForce GTX 1070 Ti (Desktop)
min:
101 fps, max:
189 fps
fps
100%
GeForce GTX 1060 Max-Q:
58 [X] Dell G7 15-7588 Intel Core i7-8750H 2.2GHz
GeForce GTX 1060 Max-Q
66.8 [X] Dell G5 15 5587 Intel Core i5-8300H 2.3GHz
GeForce GTX 1060 Max-Q
min:
55 fps, max:
74 fps
~ 62 fps
161%
GeForce GTX 1070 Ti (Desktop):
100 [X] Intel Core i7-4790K 4GHz
GeForce GTX 1070 Ti (Desktop)
min:
77 fps, max:
115 fps
fps
100%
GeForce GTX 1060 Max-Q:
52.7 [X] Dell G5 15 5587 Intel Core i5-8300H 2.3GHz
GeForce GTX 1060 Max-Q
min:
45 fps, max:
61 fps
56 [X] Dell G7 15-7588 Intel Core i7-8750H 2.2GHz
GeForce GTX 1060 Max-Q
~ 54 fps
152%
GeForce GTX 1070 Ti (Desktop):
82 [X] Intel Core i7-4790K 4GHz
GeForce GTX 1070 Ti (Desktop)
min:
58 fps, max:
97 fps
fps
100%
GeForce GTX 1060 Max-Q:
38 [X] Dell G5 15 5587 Intel Core i5-8300H 2.3GHz
GeForce GTX 1060 Max-Q
min:
30 fps, max:
45 fps
41 [X] Dell G7 15-7588 Intel Core i7-8750H 2.2GHz
GeForce GTX 1060 Max-Q
~ 40 fps
148%
GeForce GTX 1070 Ti (Desktop):
59.1 [X] Intel Core i7-4790K 4GHz
GeForce GTX 1070 Ti (Desktop)
min:
44 fps, max:
74 fps
fps
GeForce GTX 1070 Ti (Desktop):
42.4 [X] Intel Core i7-4790K 4GHz
GeForce GTX 1070 Ti (Desktop)
min:
33 fps, max:
50 fps
fps
100%
GeForce GTX 1060 Max-Q:
12 [X] Dell G5 15 5587 Intel Core i5-8300H 2.3GHz
GeForce GTX 1060 Max-Q
min:
10 fps, max:
14 fps
fps
189%
GeForce GTX 1070 Ti (Desktop):
22.7 [X] Intel Core i7-4790K 4GHz
GeForce GTX 1070 Ti (Desktop)
min:
18 fps, max:
27 fps
fps
100%
GeForce GTX 1060 Max-Q:
73 [X] Dell Inspiron 15 7000 7577 4K Intel Core i7-7700HQ 2.8GHz
GeForce GTX 1060 Max-Q
109 [X] Dell G7 15-7588 Intel Core i7-8750H 2.2GHz
GeForce GTX 1060 Max-Q
~ 91 fps
160%
GeForce GTX 1070 Ti (Desktop):
146 [X] Intel Core i7-4790K 4GHz
GeForce GTX 1070 Ti (Desktop)
min:
93 fps, max:
194 fps
fps
100%
GeForce GTX 1060 Max-Q:
47.2 [X] Dell Inspiron 15 7000 7577 4K Intel Core i7-7700HQ 2.8GHz
GeForce GTX 1060 Max-Q
59 [X] Dell G7 15-7588 Intel Core i7-8750H 2.2GHz
GeForce GTX 1060 Max-Q
~ 53 fps
164%
GeForce GTX 1070 Ti (Desktop):
87 [X] Intel Core i7-4790K 4GHz
GeForce GTX 1070 Ti (Desktop)
min:
69 fps, max:
110 fps
fps
100%
GeForce GTX 1060 Max-Q:
33.9 [X] Dell Inspiron 15 7000 7577 4K Intel Core i7-7700HQ 2.8GHz
GeForce GTX 1060 Max-Q
43 [X] Dell G7 15-7588 Intel Core i7-8750H 2.2GHz
GeForce GTX 1060 Max-Q
~ 38 fps
166%
GeForce GTX 1070 Ti (Desktop):
63 [X] Intel Core i7-4790K 4GHz
GeForce GTX 1070 Ti (Desktop)
max:
92 fps
fps
100%
GeForce GTX 1060 Max-Q:
14.6 [X] Dell Inspiron 15 7000 7577 4K Intel Core i7-7700HQ 2.8GHz
GeForce GTX 1060 Max-Q
fps
190%
GeForce GTX 1070 Ti (Desktop):
27.7 [X] Intel Core i7-4790K 4GHz
GeForce GTX 1070 Ti (Desktop)
max:
42 fps
fps
100%
GeForce GTX 1060 Max-Q:
178 [X] Dell G5 15 5587 Intel Core i5-8300H 2.3GHz
GeForce GTX 1060 Max-Q
min:
133 fps, max:
220 fps
fps
100%
GeForce GTX 1060 Max-Q:
132.6 [X] Dell G5 15 5587 Intel Core i5-8300H 2.3GHz
GeForce GTX 1060 Max-Q
min:
101 fps, max:
157 fps
fps
100%
GeForce GTX 1060 Max-Q:
115.7 [X] Dell G5 15 5587 Intel Core i5-8300H 2.3GHz
GeForce GTX 1060 Max-Q
min:
101 fps, max:
127 fps
fps
100%
GeForce GTX 1060 Max-Q:
72.8 [X] Dell G5 15 5587 Intel Core i5-8300H 2.3GHz
GeForce GTX 1060 Max-Q
min:
64 fps, max:
79 fps
fps
150%
GeForce GTX 1070 Ti (Desktop):
109 [X] Intel Core i7-4790K 4GHz
GeForce GTX 1070 Ti (Desktop)
min:
78 fps, max:
132 fps
fps
GeForce GTX 1070 Ti (Desktop):
72 [X] Intel Core i7-4790K 4GHz
GeForce GTX 1070 Ti (Desktop)
min:
61 fps, max:
89 fps
fps
GeForce GTX 1070 Ti (Desktop):
36 [X] Intel Core i7-4790K 4GHz
GeForce GTX 1070 Ti (Desktop)
min:
32 fps, max:
39 fps
fps
100%
GeForce GTX 1060 Max-Q:
135.5 [X] Dell G5 15 5587 Intel Core i5-8300H 2.3GHz
GeForce GTX 1060 Max-Q
min:
97 fps, max:
192 fps
fps
100%
GeForce GTX 1060 Max-Q:
93.4 [X] Dell G5 15 5587 Intel Core i5-8300H 2.3GHz
GeForce GTX 1060 Max-Q
min:
66 fps, max:
107 fps
fps
100%
GeForce GTX 1060 Max-Q:
81.5 [X] Dell G5 15 5587 Intel Core i5-8300H 2.3GHz
GeForce GTX 1060 Max-Q
min:
66 fps, max:
95 fps
fps
100%
GeForce GTX 1060 Max-Q:
62.2 [X] Dell G5 15 5587 Intel Core i5-8300H 2.3GHz
GeForce GTX 1060 Max-Q
min:
54 fps, max:
71 fps
fps
188%
GeForce GTX 1070 Ti (Desktop):
117 [X] Intel Core i7-4790K 4GHz
GeForce GTX 1070 Ti (Desktop)
min:
106 fps, max:
130 fps
fps
GeForce GTX 1070 Ti (Desktop):
77 [X] Intel Core i7-4790K 4GHz
GeForce GTX 1070 Ti (Desktop)
min:
70 fps, max:
85 fps
fps
GeForce GTX 1070 Ti (Desktop):
38 [X] Intel Core i7-4790K 4GHz
GeForce GTX 1070 Ti (Desktop)
min:
34 fps, max:
44 fps
fps
100%
GeForce GTX 1060 Max-Q:
117.9 [X] Dell G5 15 5587 Intel Core i5-8300H 2.3GHz
GeForce GTX 1060 Max-Q
min:
76 fps, max:
169 fps
fps
100%
GeForce GTX 1060 Max-Q:
89.1 [X] Dell G5 15 5587 Intel Core i5-8300H 2.3GHz
GeForce GTX 1060 Max-Q
min:
65 fps, max:
113 fps
fps
100%
GeForce GTX 1060 Max-Q:
78.5 [X] Dell G5 15 5587 Intel Core i5-8300H 2.3GHz
GeForce GTX 1060 Max-Q
min:
53 fps, max:
96 fps
fps
100%
GeForce GTX 1060 Max-Q:
66.6 [X] Dell G5 15 5587 Intel Core i5-8300H 2.3GHz
GeForce GTX 1060 Max-Q
min:
42 fps, max:
92 fps
fps
183%
GeForce GTX 1070 Ti (Desktop):
122 [X] Intel Core i7-4790K 4GHz
GeForce GTX 1070 Ti (Desktop)
min:
86 fps, max:
155 fps
fps
GeForce GTX 1070 Ti (Desktop):
85 [X] Intel Core i7-4790K 4GHz
GeForce GTX 1070 Ti (Desktop)
min:
57 fps, max:
102 fps
fps
100%
GeForce GTX 1060 Max-Q:
23.8 [X] Dell G5 15 5587 Intel Core i5-8300H 2.3GHz
GeForce GTX 1060 Max-Q
min:
16 fps, max:
27 fps
fps
189%
GeForce GTX 1070 Ti (Desktop):
45 [X] Intel Core i7-4790K 4GHz
GeForce GTX 1070 Ti (Desktop)
min:
30 fps, max:
52 fps
fps
100%
GeForce GTX 1060 Max-Q:
174.9 [X] Dell G5 15 5587 Intel Core i5-8300H 2.3GHz
GeForce GTX 1060 Max-Q
min:
118 fps, max:
251 fps
fps
100%
GeForce GTX 1060 Max-Q:
163.3 [X] Dell G5 15 5587 Intel Core i5-8300H 2.3GHz
GeForce GTX 1060 Max-Q
min:
110 fps, max:
227 fps
fps
100%
GeForce GTX 1060 Max-Q:
91.9 [X] Dell G5 15 5587 Intel Core i5-8300H 2.3GHz
GeForce GTX 1060 Max-Q
min:
68 fps, max:
112 fps
fps
100%
GeForce GTX 1060 Max-Q:
70.9 [X] Dell G5 15 5587 Intel Core i5-8300H 2.3GHz
GeForce GTX 1060 Max-Q
min:
53 fps, max:
88 fps
fps
100%
GeForce GTX 1060 Max-Q:
31.3 [X] Dell G5 15 5587 Intel Core i5-8300H 2.3GHz
GeForce GTX 1060 Max-Q
min:
24 fps, max:
38 fps
fps
100%
GeForce GTX 1060 Max-Q:
77 fps
134%
GeForce GTX 1070 Ti (Desktop):
103 [X] Intel Core i7-4790K 4GHz
GeForce GTX 1070 Ti (Desktop)
min:
60 fps, max:
143 fps
fps
100%
GeForce GTX 1060 Max-Q:
67 fps
137%
GeForce GTX 1070 Ti (Desktop):
92 [X] Intel Core i7-4790K 4GHz
GeForce GTX 1070 Ti (Desktop)
min:
55 fps, max:
133 fps
fps
100%
GeForce GTX 1060 Max-Q:
62 fps
142%
GeForce GTX 1070 Ti (Desktop):
88 [X] Intel Core i7-4790K 4GHz
GeForce GTX 1070 Ti (Desktop)
min:
53 fps, max:
126 fps
fps
100%
GeForce GTX 1060 Max-Q:
52 fps
144%
GeForce GTX 1070 Ti (Desktop):
75 [X] Intel Core i7-4790K 4GHz
GeForce GTX 1070 Ti (Desktop)
min:
30 fps, max:
117 fps
fps
GeForce GTX 1070 Ti (Desktop):
58 [X] Intel Core i7-4790K 4GHz
GeForce GTX 1070 Ti (Desktop)
min:
33 fps, max:
104 fps
fps
100%
GeForce GTX 1060 Max-Q:
21 fps
162%
GeForce GTX 1070 Ti (Desktop):
34 [X] Intel Core i7-4790K 4GHz
GeForce GTX 1070 Ti (Desktop)
min:
24 fps, max:
51 fps
fps
100%
GeForce GTX 1060 Max-Q:
94.7 [X] Dell Inspiron 15 7000 7577 4K Intel Core i7-7700HQ 2.8GHz
GeForce GTX 1060 Max-Q
fps
100%
GeForce GTX 1060 Max-Q:
85.4 [X] Dell Inspiron 15 7000 7577 4K Intel Core i7-7700HQ 2.8GHz
GeForce GTX 1060 Max-Q
fps
100%
GeForce GTX 1060 Max-Q:
71.4 [X] Dell Inspiron 15 7000 7577 4K Intel Core i7-7700HQ 2.8GHz
GeForce GTX 1060 Max-Q
fps
100%
GeForce GTX 1060 Max-Q:
17.6 [X] Dell Inspiron 15 7000 7577 4K Intel Core i7-7700HQ 2.8GHz
GeForce GTX 1060 Max-Q
fps
100%
GeForce GTX 1060 Max-Q:
108.1 fps
100%
GeForce GTX 1060 Max-Q:
83.5 fps
100%
GeForce GTX 1060 Max-Q:
69.6 fps
100%
GeForce GTX 1060 Max-Q:
57.2 fps
100%
GeForce GTX 1060 Max-Q:
17 fps
100%
GeForce GTX 1060 Max-Q:
128 fps
129%
GeForce GTX 1070 Ti (Desktop):
165 [X] Intel Core i7-4790K 4GHz
GeForce GTX 1070 Ti (Desktop)
min:
76 fps, max:
225 fps
fps
100%
GeForce GTX 1060 Max-Q:
81 82 [X] Dell Inspiron 15 7000 7577 4K Intel Core i7-7700HQ 2.8GHz
GeForce GTX 1060 Max-Q
84 ~ 82 fps
166%
GeForce GTX 1070 Ti (Desktop):
136 [X] Intel Core i7-4790K 4GHz
GeForce GTX 1070 Ti (Desktop)
min:
66 fps, max:
190 fps
fps
100%
GeForce GTX 1060 Max-Q:
60 [X] Dell Inspiron 15 7000 7577 4K Intel Core i7-7700HQ 2.8GHz
GeForce GTX 1060 Max-Q
62 65 ~ 62 fps
176%
GeForce GTX 1070 Ti (Desktop):
109 [X] Intel Core i7-4790K 4GHz
GeForce GTX 1070 Ti (Desktop)
min:
49 fps, max:
169 fps
fps
100%
GeForce GTX 1060 Max-Q:
46 46 [X] Dell Inspiron 15 7000 7577 4K Intel Core i7-7700HQ 2.8GHz
GeForce GTX 1060 Max-Q
48 ~ 47 fps
181%
GeForce GTX 1070 Ti (Desktop):
85 [X] Intel Core i7-4790K 4GHz
GeForce GTX 1070 Ti (Desktop)
min:
43 fps, max:
169 fps
fps
100%
GeForce GTX 1060 Max-Q:
17 [X] Dell Inspiron 15 7000 7577 4K Intel Core i7-7700HQ 2.8GHz
GeForce GTX 1060 Max-Q
27 ~ 22 fps
155%
GeForce GTX 1070 Ti (Desktop):
34 [X] Intel Core i7-4790K 4GHz
GeForce GTX 1070 Ti (Desktop)
min:
21 fps, max:
50 fps
fps
100%
GeForce GTX 1060 Max-Q:
290.6 [X] Dell G5 15 5587 Intel Core i5-8300H 2.3GHz
GeForce GTX 1060 Max-Q
min:
266 fps, max:
334 fps
fps
100%
GeForce GTX 1060 Max-Q:
277.9 [X] Dell G5 15 5587 Intel Core i5-8300H 2.3GHz
GeForce GTX 1060 Max-Q
min:
249 fps, max:
315 fps
fps
100%
GeForce GTX 1060 Max-Q:
252.3 [X] Dell G5 15 5587 Intel Core i5-8300H 2.3GHz
GeForce GTX 1060 Max-Q
min:
217 fps, max:
289 fps
fps
100%
GeForce GTX 1060 Max-Q:
245.7 [X] Dell G5 15 5587 Intel Core i5-8300H 2.3GHz
GeForce GTX 1060 Max-Q
min:
199 fps, max:
279 fps
fps
100%
GeForce GTX 1060 Max-Q:
130 [X] Dell G5 15 5587 Intel Core i5-8300H 2.3GHz
GeForce GTX 1060 Max-Q
min:
113 fps, max:
150 fps
fps
100%
GeForce GTX 1060 Max-Q:
109 fps
100%
GeForce GTX 1060 Max-Q:
48 fps
100%
GeForce GTX 1060 Max-Q:
35.5 fps
100%
GeForce GTX 1060 Max-Q:
25.6 fps
184%
GeForce GTX 1070 Ti (Desktop):
47.1 [X] Intel Core i7-4790K 4GHz
GeForce GTX 1070 Ti (Desktop)
min:
44 fps, max:
51 fps
fps
100%
GeForce GTX 1060 Max-Q:
8.5 fps
204%
GeForce GTX 1070 Ti (Desktop):
17.3 [X] Intel Core i7-4790K 4GHz
GeForce GTX 1070 Ti (Desktop)
min:
16 fps, max:
18 fps
fps
100%
GeForce GTX 1060 Max-Q:
94 fps
100%
GeForce GTX 1060 Max-Q:
77 98 [X] Dell Inspiron 15 7000 7577 4K Intel Core i7-7700HQ 2.8GHz
GeForce GTX 1060 Max-Q
~ 88 fps
100%
GeForce GTX 1060 Max-Q:
56 60 [X] Dell Inspiron 15 7000 7577 4K Intel Core i7-7700HQ 2.8GHz
GeForce GTX 1060 Max-Q
~ 58 fps
183%
GeForce GTX 1070 Ti (Desktop):
106 [X] Intel Core i7-4790K 4GHz
GeForce GTX 1070 Ti (Desktop)
min:
95 fps, max:
113 fps
fps
100%
GeForce GTX 1060 Max-Q:
26 [X] Dell Inspiron 15 7000 7577 4K Intel Core i7-7700HQ 2.8GHz
GeForce GTX 1060 Max-Q
fps
200%
GeForce GTX 1070 Ti (Desktop):
52 [X] Intel Core i7-4790K 4GHz
GeForce GTX 1070 Ti (Desktop)
min:
47 fps, max:
55 fps
fps
100%
GeForce GTX 1060 Max-Q:
141.9 [X] Dell G5 15 5587 Intel Core i5-8300H 2.3GHz
GeForce GTX 1060 Max-Q
min:
126 fps, max:
145 fps
fps
100%
GeForce GTX 1060 Max-Q:
92.5 [X] Dell G5 15 5587 Intel Core i5-8300H 2.3GHz
GeForce GTX 1060 Max-Q
min:
85 fps, max:
101 fps
fps
100%
GeForce GTX 1060 Max-Q:
85.6 [X] Dell G5 15 5587 Intel Core i5-8300H 2.3GHz
GeForce GTX 1060 Max-Q
min:
63 fps, max:
100 fps
fps
100%
GeForce GTX 1060 Max-Q:
63.3 [X] Dell G5 15 5587 Intel Core i5-8300H 2.3GHz
GeForce GTX 1060 Max-Q
min:
53 fps, max:
69 fps
fps
100%
GeForce GTX 1060 Max-Q:
12.9 [X] Dell G5 15 5587 Intel Core i5-8300H 2.3GHz
GeForce GTX 1060 Max-Q
min:
1 fps, max:
25 fps
fps
GeForce GTX 1070 Ti (Desktop):
152 [X] Intel Core i7-4790K 4GHz
GeForce GTX 1070 Ti (Desktop)
min:
130 fps
fps
100%
GeForce GTX 1060 Max-Q:
118 119.5 [X] Dell Inspiron 15 7000 7577 4K Intel Core i7-7700HQ 2.8GHz
GeForce GTX 1060 Max-Q
129 ~ 122 fps
100%
GeForce GTX 1060 Max-Q:
84.9 [X] Dell Inspiron 15 7000 7577 4K Intel Core i7-7700HQ 2.8GHz
GeForce GTX 1060 Max-Q
87.1 93.6 ~ 89 fps
100%
GeForce GTX 1060 Max-Q:
46.5 48.3 [X] Dell Inspiron 15 7000 7577 4K Intel Core i7-7700HQ 2.8GHz
GeForce GTX 1060 Max-Q
49.9 ~ 48 fps
100%
GeForce GTX 1060 Max-Q:
28.8 [X] Dell Inspiron 15 7000 7577 4K Intel Core i7-7700HQ 2.8GHz
GeForce GTX 1060 Max-Q
fps
201%
GeForce GTX 1070 Ti (Desktop):
57.9 [X] Intel Core i7-4790K 4GHz
GeForce GTX 1070 Ti (Desktop)
min:
51 fps, max:
69 fps
fps
100%
GeForce GTX 1060 Max-Q:
250 fps
100%
GeForce GTX 1060 Max-Q:
194 216 ~ 205 fps
100%
GeForce GTX 1060 Max-Q:
134 155 ~ 145 fps
154%
GeForce GTX 1070 Ti (Desktop):
223 [X] Intel Core i7-4790K 4GHz
GeForce GTX 1070 Ti (Desktop)
min:
176 fps, max:
252 fps
fps
100%
GeForce GTX 1060 Max-Q:
56.5 fps
163%
GeForce GTX 1070 Ti (Desktop):
92 [X] Intel Core i7-4790K 4GHz
GeForce GTX 1070 Ti (Desktop)
min:
76 fps, max:
133 fps
fps
100%
GeForce GTX 1060 Max-Q:
116 126 ~ 121 fps
100%
GeForce GTX 1060 Max-Q:
92.9 101 120 [X] Dell Inspiron 15 7000 7577 4K Intel Core i7-7700HQ 2.8GHz
GeForce GTX 1060 Max-Q
~ 105 fps
100%
GeForce GTX 1060 Max-Q:
80.2 84.7 97.1 101 [X] Dell Inspiron 15 7000 7577 4K Intel Core i7-7700HQ 2.8GHz
GeForce GTX 1060 Max-Q
~ 91 fps
100%
GeForce GTX 1060 Max-Q:
27.7 30.7 34.6 [X] Dell Inspiron 15 7000 7577 4K Intel Core i7-7700HQ 2.8GHz
GeForce GTX 1060 Max-Q
~ 31 fps
100%
GeForce GTX 1060 Max-Q:
65 fps
100%
GeForce GTX 1060 Max-Q:
58.7 fps
100%
GeForce GTX 1060 Max-Q:
33.2 fps
163%
GeForce GTX 1070 Ti (Desktop):
54.2 [X] Intel Core i7-4790K 4GHz
GeForce GTX 1070 Ti (Desktop)
min:
47 fps, max:
62 fps
fps
100%
GeForce GTX 1060 Max-Q:
19.4 fps
185%
GeForce GTX 1070 Ti (Desktop):
35.8 [X] Intel Core i7-4790K 4GHz
GeForce GTX 1070 Ti (Desktop)
min:
27 fps, max:
40 fps
fps
100%
GeForce GTX 1060 Max-Q:
92.3 fps
100%
GeForce GTX 1060 Max-Q:
87.8 fps
178%
GeForce GTX 1070 Ti (Desktop):
156 [X] Intel Core i7-4790K 4GHz
GeForce GTX 1070 Ti (Desktop)
min:
92 fps, max:
189 fps
fps
100%
GeForce GTX 1060 Max-Q:
63.9 fps
191%
GeForce GTX 1070 Ti (Desktop):
122 [X] Intel Core i7-4790K 4GHz
GeForce GTX 1070 Ti (Desktop)
min:
75 fps, max:
163 fps
fps
100%
GeForce GTX 1060 Max-Q:
25.7 fps
186%
GeForce GTX 1070 Ti (Desktop):
47.9 [X] Intel Core i7-4790K 4GHz
GeForce GTX 1070 Ti (Desktop)
min:
39 fps, max:
60 fps
fps
100%
GeForce GTX 1060 Max-Q:
169 fps
100%
GeForce GTX 1060 Max-Q:
93 fps
100%
GeForce GTX 1060 Max-Q:
76.1 fps
100%
GeForce GTX 1060 Max-Q:
25.1 fps
100%
GeForce GTX 1060 Max-Q:
101 fps
100%
GeForce GTX 1060 Max-Q:
56.8 fps
100%
GeForce GTX 1060 Max-Q:
39.4 fps
100%
GeForce GTX 1060 Max-Q:
18.9 fps
100%
GeForce GTX 1060 Max-Q:
85.4 fps
100%
GeForce GTX 1060 Max-Q:
64.7 fps
100%
GeForce GTX 1060 Max-Q:
54.8 fps
100%
GeForce GTX 1060 Max-Q:
23.7 fps
100%
GeForce GTX 1060 Max-Q:
124 fps
100%
GeForce GTX 1060 Max-Q:
91.6 fps
100%
GeForce GTX 1060 Max-Q:
81.7 fps
100%
GeForce GTX 1060 Max-Q:
34.6 fps
196%
GeForce GTX 1070 Ti (Desktop):
67.8 [X] Intel Core i7-4790K 4GHz
GeForce GTX 1070 Ti (Desktop)
min:
51 fps, max:
97 fps
fps
100%
GeForce GTX 1060 Max-Q:
144 fps
100%
GeForce GTX 1060 Max-Q:
79 fps
100%
GeForce GTX 1060 Max-Q:
67.3 fps
100%
GeForce GTX 1060 Max-Q:
24.8 fps
GeForce GTX 1070 Ti (Desktop):
80 [X] Intel Core i7-4790K 4GHz
GeForce GTX 1070 Ti (Desktop)
min:
79 fps, max:
81 fps
fps
100%
GeForce GTX 1060 Max-Q:
154 fps
100%
GeForce GTX 1060 Max-Q:
76 fps
100%
GeForce GTX 1060 Max-Q:
67.8 fps
100%
GeForce GTX 1060 Max-Q:
25.3 fps
GeForce GTX 1070 Ti (Desktop):
108 [X] Intel Core i7-4790K 4GHz
GeForce GTX 1070 Ti (Desktop)
min:
86 fps, max:
184 fps
fps
GeForce GTX 1070 Ti (Desktop):
91 [X] Intel Core i7-4790K 4GHz
GeForce GTX 1070 Ti (Desktop)
min:
70 fps, max:
133 fps
fps
100%
GeForce GTX 1060 Max-Q:
55.7 [X] Lenovo Legion Y520-15IKBM 80YY001APB Intel Core i5-7300HQ 2.5GHz
GeForce GTX 1060 Max-Q
fps
100%
GeForce GTX 1060 Max-Q:
36.2 40.7 [X] Lenovo Legion Y520-15IKBM 80YY001APB Intel Core i5-7300HQ 2.5GHz
GeForce GTX 1060 Max-Q
~ 38 fps
100%
GeForce GTX 1060 Max-Q:
330 fps
100%
GeForce GTX 1060 Max-Q:
250 fps
100%
GeForce GTX 1060 Max-Q:
248 fps
100%
GeForce GTX 1060 Max-Q:
95.2 fps
100%
GeForce GTX 1060 Max-Q:
110.3 fps
100%
GeForce GTX 1060 Max-Q:
93 93.8 ~ 93 fps
100%
GeForce GTX 1060 Max-Q:
50.2 52 ~ 51 fps
100%
GeForce GTX 1060 Max-Q:
26.7 27.6 ~ 27 fps
251%
GeForce GTX 1070 Ti (Desktop):
67.9 [X] DX11
Intel Core i7-4790K 4GHz
GeForce GTX 1070 Ti (Desktop)
min:
53 fps, max:
87 fps
fps
100%
GeForce GTX 1060 Max-Q:
15.8 16.3 ~ 16 fps
199%
GeForce GTX 1070 Ti (Desktop):
31.9 [X] DX11
Intel Core i7-4790K 4GHz
GeForce GTX 1070 Ti (Desktop)
min:
27 fps, max:
38 fps
fps
100%
GeForce GTX 1060 Max-Q:
130 fps
100%
GeForce GTX 1060 Max-Q:
66.4 fps
100%
GeForce GTX 1060 Max-Q:
59.6 fps
100%
GeForce GTX 1060 Max-Q:
20.5 fps
100%
GeForce GTX 1060 Max-Q:
299.2 fps
100%
GeForce GTX 1060 Max-Q:
266.2 fps
100%
GeForce GTX 1060 Max-Q:
165 165.8 [X] Dell Inspiron 15 7000 7577 4K Intel Core i7-7700HQ 2.8GHz
GeForce GTX 1060 Max-Q
~ 165 fps
100%
GeForce GTX 1060 Max-Q:
98.4 102 [X] Dell Inspiron 15 7000 7577 4K Intel Core i7-7700HQ 2.8GHz
GeForce GTX 1060 Max-Q
107.3 ~ 103 fps
177%
GeForce GTX 1070 Ti (Desktop):
182 [X] Intel Core i7-4790K 4GHz
GeForce GTX 1070 Ti (Desktop)
min:
149 fps, max:
213 fps
fps
100%
GeForce GTX 1060 Max-Q:
50.3 [X] Dell Inspiron 15 7000 7577 4K Intel Core i7-7700HQ 2.8GHz
GeForce GTX 1060 Max-Q
fps
176%
GeForce GTX 1070 Ti (Desktop):
88.7 [X] Intel Core i7-4790K 4GHz
GeForce GTX 1070 Ti (Desktop)
min:
77 fps, max:
103 fps
fps
100%
GeForce GTX 1060 Max-Q:
127 fps
100%
GeForce GTX 1060 Max-Q:
91.1 fps
100%
GeForce GTX 1060 Max-Q:
86.2 fps
100%
GeForce GTX 1060 Max-Q:
28.4 fps
100%
GeForce GTX 1060 Max-Q:
75.8 fps
100%
GeForce GTX 1060 Max-Q:
59.8 [X] Dell Inspiron 15 7000 7577 4K Intel Core i7-7700HQ 2.8GHz
GeForce GTX 1060 Max-Q
62.2 ~ 61 fps
100%
GeForce GTX 1060 Max-Q:
52.9 [X] Dell Inspiron 15 7000 7577 4K Intel Core i7-7700HQ 2.8GHz
GeForce GTX 1060 Max-Q
53.2 ~ 53 fps
100%
GeForce GTX 1060 Max-Q:
20.8 21 [X] Dell Inspiron 15 7000 7577 4K Intel Core i7-7700HQ 2.8GHz
GeForce GTX 1060 Max-Q
~ 21 fps
100%
GeForce GTX 1060 Max-Q:
127 fps
100%
GeForce GTX 1060 Max-Q:
61.9 fps
100%
GeForce GTX 1060 Max-Q:
48.8 fps
194%
GeForce GTX 1070 Ti (Desktop):
94.6 [X] Intel Core i7-4790K 4GHz
GeForce GTX 1070 Ti (Desktop)
min:
53 fps, max:
133 fps
fps
100%
GeForce GTX 1060 Max-Q:
22.1 fps
206%
GeForce GTX 1070 Ti (Desktop):
45.6 [X] Intel Core i7-4790K 4GHz
GeForce GTX 1070 Ti (Desktop)
min:
21 fps, max:
59 fps
fps
100%
GeForce GTX 1060 Max-Q:
81 fps
100%
GeForce GTX 1060 Max-Q:
71 fps
100%
GeForce GTX 1060 Max-Q:
53 fps
185%
GeForce GTX 1070 Ti (Desktop):
98 [X] Intel Core i7-4790K 4GHz
GeForce GTX 1070 Ti (Desktop)
min:
80 fps, max:
113 fps
fps
100%
GeForce GTX 1060 Max-Q:
22 fps
186%
GeForce GTX 1070 Ti (Desktop):
41 [X] Intel Core i7-4790K 4GHz
GeForce GTX 1070 Ti (Desktop)
min:
39 fps, max:
45 fps
fps
100%
GeForce GTX 1060 Max-Q:
148.1 160.9 [X] Dell G5 15 5587 Intel Core i5-8300H 2.3GHz
GeForce GTX 1060 Max-Q
min:
127 fps, max:
174 fps
168 183.7 203 [X] Dell G7 15-7588 Intel Core i7-8750H 2.2GHz
GeForce GTX 1060 Max-Q
~ 173 fps
100%
GeForce GTX 1060 Max-Q:
111 117.8 124 128.1 [X] Dell G5 15 5587 Intel Core i5-8300H 2.3GHz
GeForce GTX 1060 Max-Q
min:
116 fps, max:
142 fps
130 [X] Dell G7 15-7588 Intel Core i7-8750H 2.2GHz
GeForce GTX 1060 Max-Q
133.3 ~ 124 fps
100%
GeForce GTX 1060 Max-Q:
63 65.6 67.5 67.6 70 [X] Dell G7 15-7588 Intel Core i7-8750H 2.2GHz
GeForce GTX 1060 Max-Q
72.7 [X] Dell G5 15 5587 Intel Core i5-8300H 2.3GHz
GeForce GTX 1060 Max-Q
min:
67 fps, max:
82 fps
73.3 ~ 69 fps
100%
GeForce GTX 1060 Max-Q:
45.3 [X] Dell Inspiron 15 7000 7577 4K Intel Core i7-7700HQ 2.8GHz
GeForce GTX 1060 Max-Q
51.1 54 54.6 55.4 57 [X] Dell G7 15-7588 Intel Core i7-8750H 2.2GHz
GeForce GTX 1060 Max-Q
60.5 [X] Dell G5 15 5587 Intel Core i5-8300H 2.3GHz
GeForce GTX 1060 Max-Q
min:
53 fps, max:
68 fps
66.4 ~ 56 fps
198%
GeForce GTX 1070 Ti (Desktop):
111 [X] DX11
Intel Core i7-4790K 4GHz
GeForce GTX 1070 Ti (Desktop)
min:
101 fps, max:
119 fps
fps
100%
GeForce GTX 1060 Max-Q:
22.8 [X] Dell Inspiron 15 7000 7577 4K Intel Core i7-7700HQ 2.8GHz
GeForce GTX 1060 Max-Q
23.5 24 24.6 [X] Dell G5 15 5587 Intel Core i5-8300H 2.3GHz
GeForce GTX 1060 Max-Q
min:
22 fps, max:
28 fps
~ 24 fps
194%
GeForce GTX 1070 Ti (Desktop):
46.5 [X] DX11
Intel Core i7-4790K 4GHz
GeForce GTX 1070 Ti (Desktop)
min:
41 fps, max:
52 fps
fps
100%
GeForce GTX 1060 Max-Q:
224 fps
100%
GeForce GTX 1060 Max-Q:
126 fps
100%
GeForce GTX 1060 Max-Q:
102 fps
174%
GeForce GTX 1070 Ti (Desktop):
177 [X] Intel Core i7-4790K 4GHz
GeForce GTX 1070 Ti (Desktop)
min:
106 fps, max:
305 fps
fps
100%
GeForce GTX 1060 Max-Q:
37.3 fps
206%
GeForce GTX 1070 Ti (Desktop):
77 [X] Intel Core i7-4790K 4GHz
GeForce GTX 1070 Ti (Desktop)
min:
54 fps, max:
113 fps
fps
100%
GeForce GTX 1060 Max-Q:
188 fps
100%
GeForce GTX 1060 Max-Q:
93 fps
100%
GeForce GTX 1060 Max-Q:
80.9 fps
100%
GeForce GTX 1060 Max-Q:
29.3 fps
100%
GeForce GTX 1060 Max-Q:
82.6 fps
100%
GeForce GTX 1060 Max-Q:
65.8 fps
100%
GeForce GTX 1060 Max-Q:
29.4 fps
100%
GeForce GTX 1060 Max-Q:
22.2 fps
100%
GeForce GTX 1060 Max-Q:
73.9 78.4 [X] Dell Inspiron 15 7000 7577 4K Intel Core i7-7700HQ 2.8GHz
GeForce GTX 1060 Max-Q
~ 76 fps
100%
GeForce GTX 1060 Max-Q:
61.3 64.6 [X] Dell Inspiron 15 7000 7577 4K Intel Core i7-7700HQ 2.8GHz
GeForce GTX 1060 Max-Q
~ 63 fps
100%
GeForce GTX 1060 Max-Q:
25.8 [X] Dell Inspiron 15 7000 7577 4K Intel Core i7-7700HQ 2.8GHz
GeForce GTX 1060 Max-Q
fps
100%
GeForce GTX 1060 Max-Q:
60 [X] Dell Inspiron 15 7000 7577 4K Intel Core i7-7700HQ 2.8GHz
GeForce GTX 1060 Max-Q
fps
100%
GeForce GTX 1060 Max-Q:
60 60 [X] Dell Inspiron 15 7000 7577 4K Intel Core i7-7700HQ 2.8GHz
GeForce GTX 1060 Max-Q
~ 60 fps
100%
GeForce GTX 1060 Max-Q:
42 [X] Dell Inspiron 15 7000 7577 4K Intel Core i7-7700HQ 2.8GHz
GeForce GTX 1060 Max-Q
fps
GeForce GTX 1070 Ti (Desktop):
142.7 [X] Intel Core i7-4790K 4GHz
GeForce GTX 1070 Ti (Desktop)
min:
125.8 fps
fps
GeForce GTX 1070 Ti (Desktop):
134.2 [X] Intel Core i7-4790K 4GHz
GeForce GTX 1070 Ti (Desktop)
min:
115.5 fps
fps
GeForce GTX 1070 Ti (Desktop):
126.6 [X] Intel Core i7-4790K 4GHz
GeForce GTX 1070 Ti (Desktop)
min:
111.1 fps
fps
GeForce GTX 1070 Ti (Desktop):
121.2 [X] Intel Core i7-4790K 4GHz
GeForce GTX 1070 Ti (Desktop)
min:
105.8 fps
fps
GeForce GTX 1070 Ti (Desktop):
105 [X] Intel Core i7-4790K 4GHz
GeForce GTX 1070 Ti (Desktop)
min:
95 fps
fps
100%
GeForce GTX 1060 Max-Q:
129 129 [X] Dell Inspiron 15 7000 7577 4K Intel Core i7-7700HQ 2.8GHz
GeForce GTX 1060 Max-Q
~ 129 fps
100%
GeForce GTX 1060 Max-Q:
72 [X] Lenovo Legion Y520-15IKBM 80YY001APB Intel Core i5-7300HQ 2.5GHz
GeForce GTX 1060 Max-Q
74 81 81 [X] Dell Inspiron 15 7000 7577 4K Intel Core i7-7700HQ 2.8GHz
GeForce GTX 1060 Max-Q
~ 77 fps
100%
GeForce GTX 1060 Max-Q:
48 [X] Lenovo Legion Y520-15IKBM 80YY001APB Intel Core i5-7300HQ 2.5GHz
GeForce GTX 1060 Max-Q
49 53 [X] Dell Inspiron 15 7000 7577 4K Intel Core i7-7700HQ 2.8GHz
GeForce GTX 1060 Max-Q
54 ~ 51 fps
100%
GeForce GTX 1060 Max-Q:
26 26 [X] Dell Inspiron 15 7000 7577 4K Intel Core i7-7700HQ 2.8GHz
GeForce GTX 1060 Max-Q
~ 26 fps
100%
GeForce GTX 1060 Max-Q:
172.2 172.3 189 [X] Dell G7 15-7588 Intel Core i7-8750H 2.2GHz
GeForce GTX 1060 Max-Q
204.9 210.7 ~ 190 fps
154%
GeForce GTX 1070 Ti (Desktop):
293 [X] Intel Core i7-4790K 4GHz
GeForce GTX 1070 Ti (Desktop)
min:
269 fps, max:
321 fps
fps
100%
GeForce GTX 1060 Max-Q:
50 53.2 [X] Lenovo Legion Y520-15IKBM 80YY001APB Intel Core i5-7300HQ 2.5GHz
GeForce GTX 1060 Max-Q
58.3 62 [X] Dell G7 15-7588 Intel Core i7-8750H 2.2GHz
GeForce GTX 1060 Max-Q
63.2 68.5 70.1 [X] Dell Inspiron 15 7000 7577 4K Intel Core i7-7700HQ 2.8GHz
GeForce GTX 1060 Max-Q
71.4 73.4 74.2 ~ 64 fps
100%
GeForce GTX 1060 Max-Q:
34.6 34.9 [X] Dell G5 15 5587 Intel Core i5-8300H 2.3GHz
GeForce GTX 1060 Max-Q
min:
29 fps, max:
39 fps
35 35.1 [X] Lenovo Legion Y520-15IKBM 80YY001APB Intel Core i5-7300HQ 2.5GHz
GeForce GTX 1060 Max-Q
35.2 36.8 [X] Dell Inspiron 15 7000 7577 4K Intel Core i7-7700HQ 2.8GHz
GeForce GTX 1060 Max-Q
37 37 [X] Dell G7 15-7588 Intel Core i7-8750H 2.2GHz
GeForce GTX 1060 Max-Q
38.5 ~ 36 fps
199%
GeForce GTX 1070 Ti (Desktop):
71.8 [X] Intel Core i7-4790K 4GHz
GeForce GTX 1070 Ti (Desktop)
min:
61 fps, max:
80 fps
fps
100%
GeForce GTX 1060 Max-Q:
22.9 23.3 23.7 24.4 [X] Dell Inspiron 15 7000 7577 4K Intel Core i7-7700HQ 2.8GHz
GeForce GTX 1060 Max-Q
~ 24 fps
196%
GeForce GTX 1070 Ti (Desktop):
47.1 [X] Intel Core i7-4790K 4GHz
GeForce GTX 1070 Ti (Desktop)
min:
42 fps, max:
51 fps
fps
100%
GeForce GTX 1060 Max-Q:
156.8 fps
100%
GeForce GTX 1060 Max-Q:
151.6 fps
100%
GeForce GTX 1060 Max-Q:
106.5 fps
100%
GeForce GTX 1060 Max-Q:
61.8 fps
100%
GeForce GTX 1060 Max-Q:
53.7 fps
125%
GeForce GTX 1070 Ti (Desktop):
67 [X] i7-7740X Asus X299 Prime Intel Core i7-7740X 4.3GHz
GeForce GTX 1070 Ti (Desktop)
min:
11.7 fps, P1:
27 fps, max:
202 fps
fps
100%
GeForce GTX 1060 Max-Q:
170.2 fps
100%
GeForce GTX 1060 Max-Q:
139.9 fps
100%
GeForce GTX 1060 Max-Q:
96.7 fps
100%
GeForce GTX 1060 Max-Q:
76.9 fps
100%
GeForce GTX 1060 Max-Q:
117.2 fps
100%
GeForce GTX 1060 Max-Q:
112 fps
100%
GeForce GTX 1060 Max-Q:
107.6 fps
100%
GeForce GTX 1060 Max-Q:
60.2 [X] Lenovo Legion Y520-15IKBM 80YY001APB Intel Core i5-7300HQ 2.5GHz
GeForce GTX 1060 Max-Q
64.6 69 70.4 [X] Dell Inspiron 15 7000 7577 4K Intel Core i7-7700HQ 2.8GHz
GeForce GTX 1060 Max-Q
~ 66 fps
100%
GeForce GTX 1060 Max-Q:
53.7 [X] Lenovo Legion Y520-15IKBM 80YY001APB Intel Core i5-7300HQ 2.5GHz
GeForce GTX 1060 Max-Q
fps
100%
GeForce GTX 1060 Max-Q:
68.9 fps
100%
GeForce GTX 1060 Max-Q:
65.7 fps
100%
GeForce GTX 1060 Max-Q:
63.4 fps
100%
GeForce GTX 1060 Max-Q:
40 fps
100%
GeForce GTX 1060 Max-Q:
210.8 fps
100%
GeForce GTX 1060 Max-Q:
152.8 fps
100%
GeForce GTX 1060 Max-Q:
143.3 fps
100%
GeForce GTX 1060 Max-Q:
116.7 fps
100%
GeForce GTX 1060 Max-Q:
64.3 74 [X] Dell Inspiron 15 7000 7577 4K Intel Core i7-7700HQ 2.8GHz
GeForce GTX 1060 Max-Q
~ 69 fps
100%
GeForce GTX 1060 Max-Q:
159.5 [X] Lenovo Legion Y520-15IKBM 80YY001APB Intel Core i5-7300HQ 2.5GHz
GeForce GTX 1060 Max-Q
180.1 211.6 213.3 213.4 215 ~ 199 fps
100%
GeForce GTX 1060 Max-Q:
87.2 [X] Lenovo Legion Y520-15IKBM 80YY001APB Intel Core i5-7300HQ 2.5GHz
GeForce GTX 1060 Max-Q
95.3 100.4 [X] Dell Inspiron 15 7000 7577 4K Intel Core i7-7700HQ 2.8GHz
GeForce GTX 1060 Max-Q
102 102.4 107.5 109.8 112 ~ 102 fps
129%
GeForce GTX 1070 Ti (Desktop):
132 [X] Intel Core i7-4790K 4GHz
GeForce GTX 1070 Ti (Desktop)
min:
58 fps, max:
235 fps
fps
100%
GeForce GTX 1060 Max-Q:
308.4 fps
100%
GeForce GTX 1060 Max-Q:
277.7 fps
100%
GeForce GTX 1060 Max-Q:
170.5 fps
100%
GeForce GTX 1060 Max-Q:
115.6 fps
100%
GeForce GTX 1060 Max-Q:
105.8 fps
100%
GeForce GTX 1060 Max-Q:
101 fps
100%
GeForce GTX 1060 Max-Q:
88.7 fps
100%
GeForce GTX 1060 Max-Q:
70 fps
100%
GeForce GTX 1060 Max-Q:
45.7 fps
100%
GeForce GTX 1060 Max-Q:
218.4 fps
100%
GeForce GTX 1060 Max-Q:
192.7 fps
100%
GeForce GTX 1060 Max-Q:
164.7 fps
100%
GeForce GTX 1060 Max-Q:
69.5 fps
100%
GeForce GTX 1060 Max-Q:
140.1 fps
100%
GeForce GTX 1060 Max-Q:
126.3 fps
100%
GeForce GTX 1060 Max-Q:
112.2 fps
100%
GeForce GTX 1060 Max-Q:
64.5 fps
Average Gaming NVIDIA GeForce GTX 1060 Max-Q → 100% Average Gaming 30-70 fps → 100%
Average Gaming NVIDIA GeForce GTX 1070 Ti (Desktop) → 175% Average Gaming 30-70 fps → 184%
 Deutsch
 English
 Español
 Français
 Italiano
 Nederlands
 Polski
 Português
 Русский
 Türkçe
 Svenska
 Chinese
 Magyar