NVIDIA GeForce GTX 660 Ti vs NVIDIA GeForce GTX 680
NVIDIA GeForce GTX 660 Ti ► remove from comparison
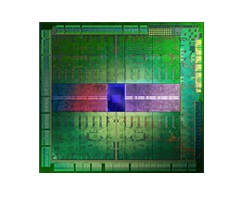
Die NVIDIA GeForce GTX 660 Ti ist eine DirectX-11.1-fähige High-End-Grafikkarte für Desktop-PCs. Sie basiert auf dem im 28-nm-Prozess hergestellten GK104-Chip der Kepler-Architektur . Im Vergleich zur GTX 680 enthält die GTX 660 Ti knapp 13 % weniger Shader-Einheiten (1.344 statt 1.536 CUDA-Cores). Der Kerntakt variiert unter Last zwischen 915 und 980 MHz (GTX 680: 1.006-1.058 MHz). Der Speichertakt des 2.048 MByte großen GDDR5-VRAMs ist wie bei der GTX 680 üppige 1.500 MHz (3.000 MHz I/O, 6.000 MHz effektiv) hoch. Das Interface hat Nvidia von 256 auf 192 Bit verkleinert.
Architektur
Kepler ist der Nachfolger der beliebten Fermi-Architektur, welche unter anderem bei der GeForce-500-Reihe zum Einsatz kam. Der zugrunde liegende GK104-Chip verfügt über sieben SMX-Blöcke mit je 192 CUDA-Cores. Zwei SMX bilden zusammen mit zwei Polymorph-Engines und einer gemeinsamen Raster-Engine einen sogenannten GPC (Graphics Processing Cluster). Da die Shader keine eigene Takt-Domain mehr besitzen (Hot Clock), entspricht die Rechenleistung in etwa der Hälfte der Einheiten der Fermi-Architektur mit doppelter Taktrate. Diese Änderung ist einer der Gründe dafür, dass sich laut Nvidia die Energieeffizienz gegenüber dem Vorgänger verdoppelt hat. Auch die Tessellation-Leistung soll verbessert worden sein.
Als weitere Neuerungen werden PCIe 3.0, der Turbo-Modus GPU Boost und das Kantenglättungsverfahren TXAA genannt. Adaptives VSync soll bei hohen Bildwiederholraten störendes Tearing verhindern.
Leistung
Die Performance der GeForce GTX 660 Ti liegt - trotz der niedrigeren Produktnummer - teils spürbar über der mobilen GTX 680M, wobei sich der Vorsprung manchmal in Grenzen hält. Jedes aktuelle Spiel (Stand 2013) läuft auch in maximalen Einstellungen flüssig . Für hohe Auflösungen im Bereich von 1.920 x 1.080 hat die GPU meist genug Power. Selbiges gilt für mehrfache Kantenglättung.
Features
Das aktualisierte Featureset umfasst nun die Unterstützung von bis zu vier aktiven Displays, die beispielsweise per DisplayPort 1.2 oder HDMI 1.4a mit Bildmaterial versorgt werden. HD-Audio-Formate wie Dolby True HD und DTS-HD lassen sich als Bitstream an einen geeigneten Receiver übertragen.
Der HD-Videoprozessor der fünften Generation (VP5) wurde vom GF119-Chip übernommen. Dieser kann die Formate MPEG-1, MPEG-2, MPEG-4, H.264 und VC1/WMV9 bis zu einer Auflösung von 4k decodieren und somit den Prozessor entlasten. Auch zwei parallele Streams, zum Beispiel für Picture-in-Picture bei Blu-Rays, sind möglich. Eine weitere Neuerung ist die Integration eines dedizierten Videoencoders ähnlich Intels Quick Sync, der über die NVENC-API angesprochen werden kann.
Als TDP gibt Nvidia 150 Watt an. Die Standard-Variante benötigt zwei 6-Pin-Stromstecker.
Hinweis
Für unsere Benchmarks verwenden wir eine leicht übertaktete Version, deren Kern mit 980-1059 statt 915-980 MHz arbeitet. Die Speichergröße (3072 vs. 2048 MByte) weicht ebenfalls vom Referenz-Design ab.
NVIDIA GeForce GTX 680 ► remove from comparison
Bei der NVIDIA GeForce GTX 680 handelt es sich um eine DirectX-11.1-fähige High-End-Grafikkarte für Desktop-PCs. Sie basiert auf dem GK104-Chip der Kepler-Architektur (Strukturbreite: 28 nm) und enthält 1536 Shadereinheiten, auch CUDA-Cores genannt. Der Kerntakt wird unter Last nach Möglichkeit von 1006 auf maximal 1058 MHz erhöht. Der Speichertakt des 2048 MByte großen und mit 256 bit angebundenen GDDR5-VRAMs beträgt 1.500 MHz (I/O-Takt 3.000 MHz, Effektivtakt 6.000 MHz; Durchsatz: 192.2 GB/s).
Architektur
Kepler ist der Nachfolger der beliebten Fermi-Architektur, welche unter anderem bei der GeForce-500-Reihe zum Einsatz kam. Der zugrunde liegende GK104-Chip verfügt über 8 SMX-Blöcke mit je 192 CUDA-Cores. Zwei SMX bilden zusammen mit zwei Polymorph-Engines und einer gemeinsamen Raster-Engine einen sogenannten GPC (Graphics Processing Cluster). Da die Shader keine eigene Takt-Domain mehr besitzen (Hot Clock), entspricht die Rechenleistung in etwa der Hälfte der Einheiten der Fermi-Architektur mit doppelter Taktrate. Diese Änderung ist einer der Gründe dafür, dass sich laut Nvidia die Energieeffizienz gegenüber dem Vorgänger verdoppelt hat. Auch die Tessellation-Leistung soll noch einmal verbessert worden sein.
Als weitere Neuerungen werden PCIe 3.0, der Turbo-Modus GPU Boost und die Kantenglättungsverfahren FXAA und TXAA unterstützt. Adaptive V-Sync soll bei hohen Frameraten nerviges Tearing verhindern.
Leistung
Trotz der Namensverwandtschaft liegt die Performance deutlich über der mobilen GTX 680M . Jedes moderne Spiel (Stand 2013) wird auch in hohen Auflösungen und maximalen Details ruckelfrei dargestellt. Die Grafikpower reicht sogar für die stereoskopische 3D-Wiedergabe (3D Vision) und/oder mehrere Monitore.
Features
Das aktualisierte Featureset umfasst nun die Unterstützung von bis zu 4 aktiven Displays, die beispielsweise per DisplayPort 1.2 oder HDMI 1.4a mit Bildmaterial versorgt werden. HD-Audio-Formate wie Dolby True HD und DTS-HD lassen sich als Bitstream an einen geeigneten Receiver übertragen.
Der HD-Videoprozessor der fünften Generation (VP5) wurde vom GF119-Chip übernommen. Dieser kann die Formate MPEG-1, MPEG-2, MPEG-4, H.264 und VC1/WMV9 bis zu einer Auflösung von 4k decodieren und somit den Prozessor entlasten. Auch zwei parallele Streams, zum Beispiel für Picture-in-Picture bei Blu-Rays, sind möglich. Eine weitere Neuerung ist die Integration eines dedizierten Videoencoders ähnlich Intels Quick Sync, der über die NVENC-API angesprochen werden kann.
Die Leistungsaufnahme gibt Nvidia mit 195 Watt an. Für die normale Variante benötigt man zwei 6-pin-Stromstecker.
NVIDIA GeForce GTX 660 Ti NVIDIA GeForce GTX 680 GeForce GTX 600 Serie GeForce GTX 680 1536 @ 1.01 - 1.06 GHz 256 Bit @ 6000 MHz GeForce GTX 660 Ti 1344 @ 0.92 - 0.98 GHz 192 Bit @ 6000 MHz
GeForce GTX 680 1536 @ 1.01 - 1.06 GHz 256 Bit @ 6000 MHz GeForce GTX 660 Ti 1344 @ 0.92 - 0.98 GHz 192 Bit @ 6000 MHz
Codename GK104 GK104 Architektur Kepler Kepler Pipelines 1344 - unified 1536 - unified Kerntakt 915 - 980 (Boost) MHz 1006 - 1058 (Boost) MHz Speichertakt 6000 MHz 6000 MHz Speicherbandbreite 192 Bit 256 Bit Speichertyp GDDR5 GDDR5 Max. Speichergröße 3 GB 2048 MB Shared Memory nein nein API DirectX 11, Shader 5.1 DirectX 11, Shader 5.1, OpenGL 4.2 Stromverbrauch 150 Watt 195 Watt Transistors 3.5 Billion 3.5 Billion Herstellungsprozess 28 nm 28 nm Features SLI, PhysX, CUDA, 3D Vision , GPU Boost SLI, PhysX, CUDA, 3D Vision, GPU Boost Erscheinungsdatum 16.08.2012 22.03.2012 Herstellerseite www.nvidia.de www.geforce.com
Benchmarks Performance Rating - 3DMark 11 + Fire Strike + Time Spy - GeForce GTX 660 Ti
2.5 pt (7%)
...
NVIDIA GeForce GTX 660 Ti
...
Performance Rating - 3DMark 11 + Fire Strike + Time Spy - GeForce GTX 680
3.5 pt (10%)
...
...
3DMark - 3DMark Time Spy Score
2332 Points (7%)
Modell CPU GPU RAM Wert Desktop PC GeForce GTX 680 1069 / 3104 MHz 2 GB 64 GB 2332
3DMark - 3DMark Time Spy Graphics
2068 Points (5%)
Modell CPU GPU RAM Wert Desktop PC GeForce GTX 680 1069 / 3104 MHz 2 GB 64 GB 2068
3DMark - 3DMark Ice Storm Unlimited Graphics
min: 215624 avg: 247307 median: 247306 (28%) max: 278989 Points
3DMark - 3DMark Ice Storm Extreme Graphics
min: 177730 avg: 202749 median: 202749 (26%) max: 227768 Points
3DMark - 3DMark Cloud Gate Score
13673 Points (15%)
Modell CPU GPU RAM Wert Desktop-PC (GTX 660 Ti) 2400 GeForce GTX 660 Ti 1059 / 3004 MHz 3 GB 8 GB 13673
min: 19275 avg: 23150 median: 23150 (25%) max: 27025 Points
3DMark - 3DMark Cloud Gate Graphics
37758 Points (10%)
Modell CPU GPU RAM Wert Desktop-PC (GTX 660 Ti) 2400 GeForce GTX 660 Ti 1059 / 3004 MHz 3 GB 8 GB 37758
min: 46869 avg: 47130 median: 47130 (12%) max: 47391 Points
3DMark - 3DMark Fire Strike Standard Score
4734 Points (8%)
Modell CPU GPU RAM Wert Desktop-PC (GTX 660 Ti) 2400 GeForce GTX 660 Ti 1059 / 3004 MHz 3 GB 8 GB 4734
min: 6119 avg: 6861 median: 6861 (12%) max: 7603 Points
3DMark - 3DMark Fire Strike Standard Graphics
5432 Points (6%)
Modell CPU GPU RAM Wert Desktop-PC (GTX 660 Ti) 2400 GeForce GTX 660 Ti 1059 / 3004 MHz 3 GB 8 GB 5432
min: 6904 avg: 7587 median: 7587 (9%) max: 8270 Points
3DMark - 3DMark Ice Storm Graphics
227651 Points (27%)
Modell CPU GPU RAM Wert Desktop-PC (GTX 660 Ti) 2400 GeForce GTX 660 Ti 1059 / 3004 MHz 3 GB 8 GB 227651
min: 190182 avg: 235508 median: 235508 (28%) max: 280833 Points
3DMark 11 - 3DM11 Performance Score
7693 Points (11%)
Modell CPU GPU RAM Wert Desktop-PC (GTX 660 Ti) 2400 GeForce GTX 660 Ti 1059 / 3004 MHz 3 GB 8 GB 7693
min: 9255 avg: 10000 median: 10000 (14%) max: 10745 Points
3DMark 11 - 3DM11 Performance GPU
8415 Points (7%)
Modell CPU GPU RAM Wert Desktop-PC (GTX 660 Ti) 2400 GeForce GTX 660 Ti 1059 / 3004 MHz 3 GB 8 GB 8415
min: 9861 avg: 10217 median: 10216.5 (9%) max: 10572 Points
3DMark Vantage + NVIDIA GeForce GTX 660 Ti 3DMark Vantage - 3DM Vant. Perf. total
23726 Points (7%)
Modell CPU GPU RAM Wert Desktop-PC (GTX 660 Ti) 2400 GeForce GTX 660 Ti 1059 / 3004 MHz 3 GB 8 GB 23726
3DM Vant. Perf. total + NVIDIA GeForce GTX 680
29702 Points (9%)
3DM Vant. Perf. GPU no PhysX + NVIDIA GeForce GTX 660 Ti 3DMark Vantage - 3DM Vant. Perf. GPU no PhysX
27687 Points (16%)
Modell CPU GPU RAM Wert Desktop-PC (GTX 660 Ti) 2400 GeForce GTX 660 Ti 1059 / 3004 MHz 3 GB 8 GB 27687
3DM Vant. Perf. GPU no PhysX + NVIDIA GeForce GTX 680
33025 Points (19%)
3DMark 2001SE - 3DMark 2001 - Standard
52955 Points (55%)
3DMark 03 - 3DMark 03 - Standard
87436 Points (46%)
Modell CPU GPU RAM Wert Desktop-PC (GTX 660 Ti) 2400 GeForce GTX 660 Ti 1059 / 3004 MHz 3 GB 8 GB 87436
min: 84572 avg: 91644 median: 91644 (48%) max: 98716 Points
3DMark 05 - 3DMark 05 - Standard
28651 Points (31%)
Modell CPU GPU RAM Wert Desktop-PC (GTX 660 Ti) 2400 GeForce GTX 660 Ti 1059 / 3004 MHz 3 GB 8 GB 28651
min: 24071 avg: 27536 median: 27536 (30%) max: 31001 Points
3DMark 06 3DMark 06 - Standard 1280x1024 + NVIDIA GeForce GTX 660 Ti
22997 Points (30%)
Modell CPU GPU RAM Wert 3DMark 06 - Standard 1280x1024 Desktop-PC (GTX 660 Ti) (3DMark 06 - Standard 1280x1024) 2400 GeForce GTX 660 Ti 1059 / 3004 MHz 3 GB 8 GB 22997
3DMark 06 - Standard 1280x1024 + NVIDIA GeForce GTX 680
min: 21143 avg: 24731 median: 24660 (32%) max: 28391 Points
Modell CPU GPU RAM Wert 3DMark 06 - Standard 1280x1024 Desktop PC (3DMark 06 - Standard 1280x1024) GeForce GTX 680 1069 / 3104 MHz 2 GB 64 GB 21143 Desktop GTX 680 (3DMark 06 - Standard 1280x1024) 2600K GeForce GTX 680 1059 / 1502 MHz 2 GB 8 GB 24660 (3DMark 06 - Standard 1280x1024) 4770K GeForce GTX 680 8 GB 28391
Unigine Valley 1.0 - Unigine Valley 1.0 DX
45.1 fps (15%)
Modell CPU GPU RAM Wert Desktop PC GeForce GTX 680 1069 / 3104 MHz 2 GB 64 GB 45.1
Unigine Heaven 3.0 - Unigine Heaven 3.0 DX 11
78.7 fps (26%)
Modell CPU GPU RAM Wert Desktop-PC (GTX 660 Ti) 2400 GeForce GTX 660 Ti 1059 / 3004 MHz 3 GB 8 GB 78.7
Unigine Heaven 2.1 - Heaven 2.1 high
102.1 fps (19%)
Modell CPU GPU RAM Wert Desktop-PC (GTX 660 Ti) 2400 GeForce GTX 660 Ti 1059 / 3004 MHz 3 GB 8 GB 102.1
139.4 fps (26%)
Windows 7 Experience Index - Win7 Gaming graphics
7.9 Points (100%)
Modell CPU GPU RAM Wert Desktop-PC (GTX 660 Ti) 2400 GeForce GTX 660 Ti 1059 / 3004 MHz 3 GB 8 GB 7.9
Windows 7 Experience Index - Win7 Graphics
7.9 Points (100%)
Modell CPU GPU RAM Wert Desktop-PC (GTX 660 Ti) 2400 GeForce GTX 660 Ti 1059 / 3004 MHz 3 GB 8 GB 7.9
Cinebench R15 + NVIDIA GeForce GTX 680 Cinebench R15 - Cinebench R15 OpenGL 64 Bit
78.2 fps (5%)
Cinebench R15 OpenGL Ref. Match 64 Bit + NVIDIA GeForce GTX 680 Cinebench R15 - Cinebench R15 OpenGL Ref. Match 64 Bit
99.6 % (100%)
GFXBench (DX / GLBenchmark) 2.7 + NVIDIA GeForce GTX 680 GFXBench (DX / GLBenchmark) 2.7 - GFXBench T-Rex HD Offscreen C24Z16
652 fps (5%)
LuxMark v2.0 64Bit - LuxMark v2.0 Room GPU
284 Samples/s (1%)
LuxMark v2.0 64Bit - LuxMark v2.0 Sala GPU
626 Samples/s (1%)
ComputeMark v2.1 - ComputeMark v2.1 Result
5790 Points (6%)
Average Benchmarks NVIDIA GeForce GTX 660 Ti → 100% n=13 Average Benchmarks NVIDIA GeForce GTX 680 → 125% n=13
- Bereich der Benchmarkergebnisse für diese Grafikkarte
- Durchschnittliche Benchmarkergebnisse für diese Grafikkarte
* Smaller numbers mean a higher performance
1 This benchmark is not used for the average calculation
Spiele-Benchmarks Die folgenden Benchmarks basieren auf unseren Spieletests mit Testnotebooks. Die Performance dieser Grafikkarte bei den gelisteten Spielen ist abhängig von der verwendeten CPU, Speicherausstattung, Treiber und auch Betriebssystem. Dadurch müssen die untenstehenden Werte nicht repräsentativ sein. Detaillierte Informationen über das verwendete System sehen Sie nach einem Klick auf den fps-Wert.
GeForce GTX 680:
72.5 [X] Desktop PC GeForce GTX 680
min:
49.3 fps, max:
97.6 fps
fps
GeForce GTX 680:
51.2 [X] Desktop PC GeForce GTX 680
min:
38.3 fps, max:
67.6 fps
fps
GeForce GTX 680:
30.3 [X] Desktop PC GeForce GTX 680
min:
24.2 fps, max:
37.9 fps
fps
GeForce GTX 680:
8.9 [X] Desktop PC GeForce GTX 680
min:
4.5 fps, max:
25.8 fps
fps
GeForce GTX 680:
8.5 [X] Desktop PC GeForce GTX 680
min:
3.9 fps, max:
11.1 fps
fps
GeForce GTX 680:
88.7 [X] Desktop PC GeForce GTX 680
min:
58 fps, max:
109 fps
fps
GeForce GTX 680:
89.8 [X] Desktop PC GeForce GTX 680
min:
51 fps, max:
110 fps
fps
GeForce GTX 680:
47 [X] Desktop PC GeForce GTX 680
min:
26 fps, max:
58 fps
fps
GeForce GTX 680:
19.7 [X] Desktop PC GeForce GTX 680
min:
6 fps, max:
27 fps
fps
GeForce GTX 680:
18.2 [X] Desktop PC GeForce GTX 680
max:
25 fps
fps
GeForce GTX 680:
156.5 [X] Desktop PC GeForce GTX 680
min:
138 fps, max:
179 fps
fps
GeForce GTX 680:
102.9 [X] Desktop PC GeForce GTX 680
min:
94 fps, max:
121 fps
fps
GeForce GTX 680:
47.2 [X] Desktop PC GeForce GTX 680
min:
43 fps, max:
53 fps
fps
GeForce GTX 680:
38.6 [X] Desktop PC GeForce GTX 680
min:
31 fps, max:
50 fps
fps
GeForce GTX 680:
7.1 [X] Desktop PC GeForce GTX 680
min:
5 fps, max:
10 fps
fps
GeForce GTX 680:
299.6 [X] Desktop PC GeForce GTX 680
min:
290 fps, max:
302 fps
fps
GeForce GTX 680:
262.2 [X] Desktop PC GeForce GTX 680
min:
199 fps, max:
302 fps
fps
GeForce GTX 680:
125.4 [X] Desktop PC GeForce GTX 680
min:
99 fps, max:
148 fps
fps
GeForce GTX 680:
77.3 [X] Desktop PC GeForce GTX 680
min:
58 fps, max:
84 fps
fps
GeForce GTX 680:
40 [X] Desktop PC GeForce GTX 680
min:
33 fps, max:
47 fps
fps
GeForce GTX 680:
113.5 [X] Desktop PC GeForce GTX 680
min:
85 fps, max:
169 fps
fps
GeForce GTX 680:
82.2 [X] Desktop PC GeForce GTX 680
min:
58 fps, max:
122 fps
fps
GeForce GTX 680:
46.3 [X] Desktop PC GeForce GTX 680
min:
33 fps, max:
63 fps
fps
GeForce GTX 680:
44.2 [X] Desktop PC GeForce GTX 680
min:
31 fps, max:
62 fps
fps
GeForce GTX 680:
11.8 [X] Desktop PC GeForce GTX 680
min:
4 fps, max:
22 fps
fps
GeForce GTX 680:
75.1 [X] Desktop PC GeForce GTX 680
min:
51 fps, max:
102 fps
fps
GeForce GTX 680:
144.6 [X] Desktop PC GeForce GTX 680
fps
GeForce GTX 680:
91.8 [X] Desktop PC GeForce GTX 680
fps
GeForce GTX 680:
46.3 [X] Desktop PC GeForce GTX 680
fps
GeForce GTX 680:
34.9 [X] Desktop PC GeForce GTX 680
fps
GeForce GTX 680:
16.9 [X] Desktop PC GeForce GTX 680
fps
GeForce GTX 680:
103 [X] Desktop PC GeForce GTX 680
min:
74 fps, max:
122 fps
fps
GeForce GTX 680:
67 [X] Desktop PC GeForce GTX 680
min:
58 fps, max:
75 fps
fps
GeForce GTX 680:
59 [X] Desktop PC GeForce GTX 680
min:
51 fps, max:
66 fps
fps
GeForce GTX 680:
42 [X] Desktop PC GeForce GTX 680
min:
32 fps, max:
52 fps
fps
GeForce GTX 680:
17 [X] Desktop PC GeForce GTX 680
min:
12 fps, max:
20 fps
fps
GeForce GTX 680:
88.5 [X] Desktop PC GeForce GTX 680
min:
76 fps, max:
109 fps
fps
GeForce GTX 680:
47.8 [X] Desktop PC GeForce GTX 680
min:
41 fps, max:
55 fps
fps
GeForce GTX 680:
36.5 [X] Desktop PC GeForce GTX 680
min:
32 fps, max:
41 fps
fps
GeForce GTX 680:
16.4 [X] Desktop PC GeForce GTX 680
min:
12 fps, max:
19 fps
fps
GeForce GTX 680:
9.7 [X] Desktop PC GeForce GTX 680
min:
8 fps, max:
12 fps
fps
GeForce GTX 680:
110.9 [X] Desktop PC GeForce GTX 680
min:
105 fps, max:
124 fps
fps
GeForce GTX 680:
68.9 [X] Desktop PC GeForce GTX 680
min:
65 fps, max:
76 fps
fps
GeForce GTX 680:
46.4 [X] Desktop PC GeForce GTX 680
min:
45 fps, max:
52 fps
fps
GeForce GTX 680:
40.6 [X] Desktop PC GeForce GTX 680
min:
38 fps, max:
45 fps
fps
GeForce GTX 680:
17.2 [X] Desktop PC GeForce GTX 680
min:
14 fps, max:
21 fps
fps
GeForce GTX 680:
271.6 [X] Desktop PC GeForce GTX 680
min:
37 fps, max:
474.5 fps
fps
GeForce GTX 680:
180.6 [X] Desktop PC GeForce GTX 680
min:
25.1 fps, max:
289.7 fps
fps
GeForce GTX 680:
102.9 [X] Desktop PC GeForce GTX 680
min:
64.8 fps, max:
185.5 fps
fps
GeForce GTX 680:
67.4 [X] Desktop PC GeForce GTX 680
min:
27.8 fps, max:
105.4 fps
fps
GeForce GTX 680:
25 [X] Desktop PC GeForce GTX 680
min:
11.9 fps, max:
34.4 fps
fps
GeForce GTX 680:
111 [X] Desktop PC GeForce GTX 680
min:
79 fps, max:
133 fps
fps
GeForce GTX 680:
91.9 [X] Desktop PC GeForce GTX 680
min:
74 fps, max:
110 fps
fps
GeForce GTX 680:
63.5 [X] Desktop PC GeForce GTX 680
min:
42 fps, max:
92 fps
fps
GeForce GTX 680:
49 [X] Desktop PC GeForce GTX 680
min:
34 fps, max:
56 fps
fps
GeForce GTX 680:
15.9 [X] Desktop PC GeForce GTX 680
min:
11 fps, max:
20 fps
fps
GeForce GTX 680:
164 [X] Desktop PC GeForce GTX 680
min:
146 fps, max:
181 fps
fps
GeForce GTX 680:
143.9 [X] Desktop PC GeForce GTX 680
min:
117 fps, max:
169 fps
fps
GeForce GTX 680:
71.3 [X] Desktop PC GeForce GTX 680
min:
60 fps, max:
84 fps
fps
GeForce GTX 680:
61.4 [X] Desktop PC GeForce GTX 680
min:
47 fps, max:
72 fps
fps
GeForce GTX 680:
21.9 [X] Desktop PC GeForce GTX 680
min:
17 fps, max:
27 fps
fps
GeForce GTX 680:
93.4 [X] Desktop PC GeForce GTX 680
min:
80 fps, max:
115 fps
fps
GeForce GTX 680:
79.6 [X] Desktop PC GeForce GTX 680
min:
70 fps, max:
92 fps
fps
GeForce GTX 680:
45.9 [X] Desktop PC GeForce GTX 680
min:
37 fps, max:
60 fps
fps
GeForce GTX 680:
5.6 [X] Desktop PC GeForce GTX 680
min:
4 fps, max:
8 fps
fps
GeForce GTX 680:
14.1 [X] Desktop PC GeForce GTX 680
min:
11 fps, max:
17 fps
fps
GeForce GTX 680:
102.5 [X] Desktop PC GeForce GTX 680
min:
87 fps, max:
119 fps
fps
GeForce GTX 680:
58.2 [X] Desktop PC GeForce GTX 680
min:
48 fps, max:
71 fps
fps
GeForce GTX 680:
53 [X] Desktop PC GeForce GTX 680
min:
48 fps, max:
70 fps
fps
GeForce GTX 680:
47.2 [X] Desktop PC GeForce GTX 680
min:
37 fps, max:
64 fps
fps
GeForce GTX 680:
19.8 [X] Desktop PC GeForce GTX 680
min:
14 fps, max:
25 fps
fps
GeForce GTX 680:
113.8 [X] Desktop PC GeForce GTX 680
min:
107 fps, max:
122 fps
fps
GeForce GTX 680:
101.6 [X] Desktop PC GeForce GTX 680
min:
94 fps, max:
112 fps
fps
GeForce GTX 680:
56.3 [X] Desktop PC GeForce GTX 680
min:
53 fps, max:
60 fps
fps
GeForce GTX 680:
13.8 [X] Desktop PC GeForce GTX 680
min:
12 fps, max:
15 fps
fps
GeForce GTX 680:
23 [X] Desktop PC GeForce GTX 680
min:
21 fps, max:
24 fps
fps
GeForce GTX 680:
296.2 [X] Desktop PC GeForce GTX 680
min:
147 fps, max:
350 fps
fps
GeForce GTX 680:
281.7 [X] Desktop PC GeForce GTX 680
min:
254 fps, max:
318 fps
fps
GeForce GTX 680:
173 [X] Desktop GTX 680, Intel Core i7-2600K Intel Core i7-2600K 3.4GHz
GeForce GTX 680
min:
152 fps, max:
190 fps
212 [X] Desktop PC GeForce GTX 680
min:
94 fps, max:
233 fps
~ 193 fps
GeForce GTX 680:
84 [X] Desktop GTX 680, Intel Core i7-2600K Intel Core i7-2600K 3.4GHz
GeForce GTX 680
min:
77 fps, max:
90 fps
90.2 [X] Desktop PC GeForce GTX 680
min:
36 fps, max:
98 fps
~ 87 fps
GeForce GTX 680:
88 [X] Desktop GTX 680, Intel Core i7-2600K Intel Core i7-2600K 3.4GHz
GeForce GTX 680
min:
64 fps, max:
124 fps
fps
GeForce GTX 680:
78 [X] Desktop GTX 680, Intel Core i7-2600K Intel Core i7-2600K 3.4GHz
GeForce GTX 680
min:
54 fps, max:
108 fps
fps
GeForce GTX 680:
48 [X] Desktop GTX 680, Intel Core i7-2600K Intel Core i7-2600K 3.4GHz
GeForce GTX 680
min:
15 fps, max:
72 fps
fps
GeForce GTX 680:
26 [X] Desktop GTX 680, Intel Core i7-2600K Intel Core i7-2600K 3.4GHz
GeForce GTX 680
min:
7 fps, max:
42 fps
fps
GeForce GTX 680:
14 [X] Desktop GTX 680, Intel Core i7-2600K Intel Core i7-2600K 3.4GHz
GeForce GTX 680
min:
8 fps, max:
24 fps
fps
GeForce GTX 680:
105 [X] Desktop GTX 680, Intel Core i7-2600K Intel Core i7-2600K 3.4GHz
GeForce GTX 680
min:
76 fps, max:
121 fps
125.6 [X] Desktop PC GeForce GTX 680
min:
109 fps, max:
143 fps
~ 115 fps
GeForce GTX 680:
65 [X] Desktop GTX 680, Intel Core i7-2600K Intel Core i7-2600K 3.4GHz
GeForce GTX 680
min:
55 fps, max:
78 fps
79.7 [X] Desktop PC GeForce GTX 680
min:
71 fps, max:
92 fps
~ 72 fps
GeForce GTX 680:
39 [X] Desktop GTX 680, Intel Core i7-2600K Intel Core i7-2600K 3.4GHz
GeForce GTX 680
min:
28 fps, max:
47 fps
44.6 [X] Desktop PC GeForce GTX 680
min:
39 fps, max:
50 fps
~ 42 fps
GeForce GTX 680:
20.5 [X] Desktop GTX 680, Intel Core i7-2600K Intel Core i7-2600K 3.4GHz
GeForce GTX 680
min:
16 fps, max:
25 fps
24.4 [X] Desktop PC GeForce GTX 680
min:
19 fps, max:
31 fps
~ 22 fps
GeForce GTX 680:
14.9 [X] Desktop GTX 680, Intel Core i7-2600K Intel Core i7-2600K 3.4GHz
GeForce GTX 680
min:
12 fps, max:
17 fps
16.6 [X] Desktop PC GeForce GTX 680
min:
14 fps, max:
18 fps
~ 16 fps
GeForce GTX 680:
235.6 [X] Desktop PC GeForce GTX 680
min:
215.1 fps, max:
247.8 fps
fps
GeForce GTX 680:
149.6 [X] Desktop PC GeForce GTX 680
min:
84.2 fps, max:
207.2 fps
fps
GeForce GTX 680:
94.3 [X] Desktop PC GeForce GTX 680
min:
65.3 fps, max:
152.6 fps
fps
GeForce GTX 680:
67 [X] Desktop PC GeForce GTX 680
min:
57.7 fps, max:
93.4 fps
fps
GeForce GTX 680:
60 [X] Desktop PC GeForce GTX 680
min:
49 fps, max:
79.4 fps
fps
GeForce GTX 680:
134 [X] Desktop GTX 680, Intel Core i7-2600K Intel Core i7-2600K 3.4GHz
GeForce GTX 680
min:
45 fps, max:
206 fps
166.6 [X] Desktop PC GeForce GTX 680
min:
4.8 fps, max:
278 fps
~ 150 fps
GeForce GTX 680:
128 [X] Desktop GTX 680, Intel Core i7-2600K Intel Core i7-2600K 3.4GHz
GeForce GTX 680
min:
26 fps, max:
198 fps
159.8 [X] Desktop PC GeForce GTX 680
min:
10.8 fps, max:
226.9 fps
~ 144 fps
GeForce GTX 680:
72 [X] Desktop GTX 680, Intel Core i7-2600K Intel Core i7-2600K 3.4GHz
GeForce GTX 680
min:
21 fps, max:
122 fps
80 [X] Desktop PC GeForce GTX 680
min:
17.3 fps, max:
164.1 fps
~ 76 fps
GeForce GTX 680:
32 [X] Desktop GTX 680, Intel Core i7-2600K Intel Core i7-2600K 3.4GHz
GeForce GTX 680
min:
1 fps, max:
119 fps
40.3 [X] Desktop PC GeForce GTX 680
min:
3.2 fps, max:
87 fps
~ 36 fps
GeForce GTX 680:
20.9 [X] Desktop PC GeForce GTX 680
min:
1.7 fps, max:
126.9 fps
fps
GeForce GTX 680:
173 [X] Desktop GTX 680, Intel Core i7-2600K Intel Core i7-2600K 3.4GHz
GeForce GTX 680
min:
161 fps, max:
185 fps
fps
GeForce GTX 680:
152 [X] Desktop GTX 680, Intel Core i7-2600K Intel Core i7-2600K 3.4GHz
GeForce GTX 680
min:
140 fps, max:
169 fps
fps
GeForce GTX 680:
85 [X] Desktop GTX 680, Intel Core i7-2600K Intel Core i7-2600K 3.4GHz
GeForce GTX 680
min:
78 fps, max:
94 fps
fps
GeForce GTX 680:
54 [X] Desktop GTX 680, Intel Core i7-2600K Intel Core i7-2600K 3.4GHz
GeForce GTX 680
min:
47 fps, max:
62 fps
fps
GeForce GTX 680:
141 [X] Desktop GTX 680, Intel Core i7-2600K Intel Core i7-2600K 3.4GHz
GeForce GTX 680
min:
108 fps
fps
GeForce GTX 680:
120 [X] Desktop GTX 680, Intel Core i7-2600K Intel Core i7-2600K 3.4GHz
GeForce GTX 680
min:
90 fps
fps
GeForce GTX 680:
55.2 [X] Desktop GTX 680, Intel Core i7-2600K Intel Core i7-2600K 3.4GHz
GeForce GTX 680
min:
45.5 fps
fps
GeForce GTX 680:
39.5 [X] Desktop GTX 680, Intel Core i7-2600K Intel Core i7-2600K 3.4GHz
GeForce GTX 680
min:
28.9 fps
fps
GeForce GTX 680:
45 [X] Desktop GTX 680, Intel Core i7-2600K Intel Core i7-2600K 3.4GHz
GeForce GTX 680
min:
33 fps, max:
59 fps
fps
GeForce GTX 680:
183.1 [X] Desktop PC GeForce GTX 680
min:
146 fps, max:
196 fps
191 [X] Desktop GTX 680, Intel Core i7-2600K Intel Core i7-2600K 3.4GHz
GeForce GTX 680
min:
155 fps, max:
201 fps
~ 187 fps
GeForce GTX 680:
129 [X] Desktop GTX 680, Intel Core i7-2600K Intel Core i7-2600K 3.4GHz
GeForce GTX 680
min:
72 fps, max:
200 fps
154.3 [X] Desktop PC GeForce GTX 680
min:
99 fps, max:
192 fps
~ 142 fps
GeForce GTX 680:
104 [X] Desktop GTX 680, Intel Core i7-2600K Intel Core i7-2600K 3.4GHz
GeForce GTX 680
min:
50 fps, max:
164 fps
133.2 [X] Desktop PC GeForce GTX 680
min:
86 fps, max:
192 fps
~ 119 fps
GeForce GTX 680:
96 [X] Desktop GTX 680, Intel Core i7-2600K Intel Core i7-2600K 3.4GHz
GeForce GTX 680
min:
46 fps, max:
174 fps
122.8 [X] Desktop PC GeForce GTX 680
min:
72 fps, max:
189 fps
~ 109 fps
GeForce GTX 680:
64 [X] Desktop GTX 680, Intel Core i7-2600K Intel Core i7-2600K 3.4GHz
GeForce GTX 680
min:
60 fps, max:
67 fps
fps
GeForce GTX 680:
64 [X] Desktop GTX 680, Intel Core i7-2600K Intel Core i7-2600K 3.4GHz
GeForce GTX 680
min:
60 fps, max:
67 fps
fps
GeForce GTX 680:
64 [X] Desktop GTX 680, Intel Core i7-2600K Intel Core i7-2600K 3.4GHz
GeForce GTX 680
min:
59 fps, max:
67 fps
fps
GeForce GTX 680:
63 [X] Desktop GTX 680, Intel Core i7-2600K Intel Core i7-2600K 3.4GHz
GeForce GTX 680
min:
57 fps, max:
67 fps
fps
GeForce GTX 680:
233 [X] Desktop GTX 680, Intel Core i7-2600K Intel Core i7-2600K 3.4GHz
GeForce GTX 680
fps
GeForce GTX 680:
143 [X] Desktop GTX 680, Intel Core i7-2600K Intel Core i7-2600K 3.4GHz
GeForce GTX 680
fps
GeForce GTX 680:
125 [X] Desktop GTX 680, Intel Core i7-2600K Intel Core i7-2600K 3.4GHz
GeForce GTX 680
min:
97 fps, max:
157 fps
fps
GeForce GTX 680:
86 [X] Desktop GTX 680, Intel Core i7-2600K Intel Core i7-2600K 3.4GHz
GeForce GTX 680
min:
70 fps, max:
109 fps
fps
100%
GeForce GTX 660 Ti:
87.3 [X] Desktop-PC Intel Core i7-3770K 3.5GHz
GeForce GTX 660 Ti
min:
70 fps
fps
94%
GeForce GTX 680:
82 [X] Desktop GTX 680, Intel Core i7-2600K Intel Core i7-2600K 3.4GHz
GeForce GTX 680
min:
66 fps, max:
107 fps
fps
100%
GeForce GTX 660 Ti:
76 [X] Desktop-PC Intel Core i7-3770K 3.5GHz
GeForce GTX 660 Ti
min:
61 fps
fps
93%
GeForce GTX 680:
71 [X] Desktop GTX 680, Intel Core i7-2600K Intel Core i7-2600K 3.4GHz
GeForce GTX 680
min:
56 fps, max:
87 fps
fps
100%
GeForce GTX 660 Ti:
43.4 [X] Desktop-PC Intel Core i7-3770K 3.5GHz
GeForce GTX 660 Ti
min:
38 fps
fps
111%
GeForce GTX 680:
48 [X] Desktop GTX 680, Intel Core i7-2600K Intel Core i7-2600K 3.4GHz
GeForce GTX 680
min:
38 fps, max:
56 fps
fps
100%
GeForce GTX 660 Ti:
31.7 [X] Desktop-PC Intel Core i7-3770K 3.5GHz
GeForce GTX 660 Ti
min:
26 fps
fps
91%
GeForce GTX 680:
28.7 [X] Desktop GTX 680, Intel Core i7-2600K Intel Core i7-2600K 3.4GHz
GeForce GTX 680
min:
12 fps, max:
39 fps
fps
100%
GeForce GTX 660 Ti:
60 [X] Desktop-PC Intel Core i7-3770K 3.5GHz
GeForce GTX 660 Ti
min:
59 fps
fps
100%
GeForce GTX 680:
60 [X] Desktop GTX 680, Intel Core i7-2600K Intel Core i7-2600K 3.4GHz
GeForce GTX 680
fps
100%
GeForce GTX 660 Ti:
60 [X] Desktop-PC Intel Core i7-3770K 3.5GHz
GeForce GTX 660 Ti
min:
59 fps
fps
100%
GeForce GTX 680:
60 [X] Desktop GTX 680, Intel Core i7-2600K Intel Core i7-2600K 3.4GHz
GeForce GTX 680
fps
100%
GeForce GTX 660 Ti:
60 [X] Desktop-PC Intel Core i7-3770K 3.5GHz
GeForce GTX 660 Ti
min:
59 fps
fps
100%
GeForce GTX 680:
59.8 [X] Desktop GTX 680, Intel Core i7-2600K Intel Core i7-2600K 3.4GHz
GeForce GTX 680
min:
56 fps, max:
62 fps
fps
100%
GeForce GTX 660 Ti:
57.1 [X] Desktop-PC Intel Core i7-3770K 3.5GHz
GeForce GTX 660 Ti
min:
46 fps
fps
100%
GeForce GTX 660 Ti:
98.4 [X] Desktop-PC Intel Core i7-3770K 3.5GHz
GeForce GTX 660 Ti
fps
101%
GeForce GTX 680:
99 [X] Desktop GTX 680, Intel Core i7-2600K Intel Core i7-2600K 3.4GHz
GeForce GTX 680
min:
88 fps, max:
100 fps
fps
100%
GeForce GTX 660 Ti:
94 [X] Desktop-PC Intel Core i7-3770K 3.5GHz
GeForce GTX 660 Ti
fps
104%
GeForce GTX 680:
98 [X] Desktop GTX 680, Intel Core i7-2600K Intel Core i7-2600K 3.4GHz
GeForce GTX 680
min:
83 fps, max:
100 fps
fps
100%
GeForce GTX 660 Ti:
85.7 [X] Desktop-PC Intel Core i7-3770K 3.5GHz
GeForce GTX 660 Ti
fps
111%
GeForce GTX 680:
95 [X] Desktop GTX 680, Intel Core i7-2600K Intel Core i7-2600K 3.4GHz
GeForce GTX 680
min:
70 fps, max:
100 fps
fps
100%
GeForce GTX 660 Ti:
67.4 [X] Desktop-PC Intel Core i7-3770K 3.5GHz
GeForce GTX 660 Ti
fps
106%
GeForce GTX 680:
71.5 [X] Desktop GTX 680, Intel Core i7-2600K Intel Core i7-2600K 3.4GHz
GeForce GTX 680
min:
47 fps, max:
91 fps
fps
100%
GeForce GTX 660 Ti:
60 [X] Desktop-PC Intel Core i7-3770K 3.5GHz
GeForce GTX 660 Ti
fps
100%
GeForce GTX 680:
60 [X] Desktop GTX 680, Intel Core i7-2600K Intel Core i7-2600K 3.4GHz
GeForce GTX 680
fps
100%
GeForce GTX 660 Ti:
60 [X] Desktop-PC Intel Core i7-3770K 3.5GHz
GeForce GTX 660 Ti
fps
100%
GeForce GTX 680:
60 [X] Desktop GTX 680, Intel Core i7-2600K Intel Core i7-2600K 3.4GHz
GeForce GTX 680
fps
100%
GeForce GTX 660 Ti:
60 [X] Desktop-PC Intel Core i7-3770K 3.5GHz
GeForce GTX 660 Ti
fps
100%
GeForce GTX 680:
60 [X] Desktop GTX 680, Intel Core i7-2600K Intel Core i7-2600K 3.4GHz
GeForce GTX 680
fps
100%
GeForce GTX 660 Ti:
59.5 [X] Desktop-PC Intel Core i7-3770K 3.5GHz
GeForce GTX 660 Ti
fps
99%
GeForce GTX 680:
58.8 [X] Desktop GTX 680, Intel Core i7-2600K Intel Core i7-2600K 3.4GHz
GeForce GTX 680
min:
47 fps, max:
61 fps
fps
100%
GeForce GTX 660 Ti:
72.5 [X] Desktop-PC Intel Core i7-3770K 3.5GHz
GeForce GTX 660 Ti
fps
104%
GeForce GTX 680:
75.5 [X] Desktop GTX 680, Intel Core i7-2600K Intel Core i7-2600K 3.4GHz
GeForce GTX 680
min:
49 fps, max:
153 fps
fps
100%
GeForce GTX 660 Ti:
66.7 [X] Desktop-PC Intel Core i7-3770K 3.5GHz
GeForce GTX 660 Ti
fps
108%
GeForce GTX 680:
71.8 [X] Desktop GTX 680, Intel Core i7-2600K Intel Core i7-2600K 3.4GHz
GeForce GTX 680
min:
48 fps, max:
121 fps
fps
100%
GeForce GTX 660 Ti:
64.8 [X] Desktop-PC Intel Core i7-3770K 3.5GHz
GeForce GTX 660 Ti
fps
107%
GeForce GTX 680:
69.3 [X] Desktop GTX 680, Intel Core i7-2600K Intel Core i7-2600K 3.4GHz
GeForce GTX 680
min:
35 fps, max:
112 fps
fps
100%
GeForce GTX 660 Ti:
40.9 [X] Desktop-PC Intel Core i7-3770K 3.5GHz
GeForce GTX 660 Ti
fps
121%
GeForce GTX 680:
49.3 [X] Desktop GTX 680, Intel Core i7-2600K Intel Core i7-2600K 3.4GHz
GeForce GTX 680
min:
22.4 fps, max:
67 fps
fps
100%
GeForce GTX 660 Ti:
62.1 [X] Desktop-PC Intel Core i7-3770K 3.5GHz
GeForce GTX 660 Ti
fps
98%
GeForce GTX 680:
61 [X] Desktop GTX 680, Intel Core i7-2600K Intel Core i7-2600K 3.4GHz
GeForce GTX 680
min:
48 fps, max:
63 fps
fps
100%
GeForce GTX 660 Ti:
61.8 [X] Desktop-PC Intel Core i7-3770K 3.5GHz
GeForce GTX 660 Ti
fps
97%
GeForce GTX 680:
59.8 [X] Desktop GTX 680, Intel Core i7-2600K Intel Core i7-2600K 3.4GHz
GeForce GTX 680
min:
46 fps, max:
63 fps
fps
100%
GeForce GTX 660 Ti:
61.2 [X] Desktop-PC Intel Core i7-3770K 3.5GHz
GeForce GTX 660 Ti
fps
96%
GeForce GTX 680:
58.9 [X] Desktop GTX 680, Intel Core i7-2600K Intel Core i7-2600K 3.4GHz
GeForce GTX 680
min:
44 fps, max:
63 fps
fps
100%
GeForce GTX 660 Ti:
37.3 [X] Desktop-PC Intel Core i7-3770K 3.5GHz
GeForce GTX 660 Ti
fps
116%
GeForce GTX 680:
43.1 [X] Desktop GTX 680, Intel Core i7-2600K Intel Core i7-2600K 3.4GHz
GeForce GTX 680
min:
34 fps, max:
49 fps
fps
100%
GeForce GTX 660 Ti:
105.7 [X] Desktop-PC Intel Core i7-3770K 3.5GHz
GeForce GTX 660 Ti
fps
90%
GeForce GTX 680:
95 [X] Desktop GTX 680, Intel Core i7-2600K Intel Core i7-2600K 3.4GHz
GeForce GTX 680
fps
100%
GeForce GTX 660 Ti:
46.8 [X] Desktop-PC Intel Core i7-3770K 3.5GHz
GeForce GTX 660 Ti
fps
92%
GeForce GTX 680:
43.1 [X] Desktop GTX 680, Intel Core i7-2600K Intel Core i7-2600K 3.4GHz
GeForce GTX 680
fps
100%
GeForce GTX 660 Ti:
26.4 [X] Desktop-PC Intel Core i7-3770K 3.5GHz
GeForce GTX 660 Ti
fps
91%
GeForce GTX 680:
24.1 [X] Desktop GTX 680, Intel Core i7-2600K Intel Core i7-2600K 3.4GHz
GeForce GTX 680
fps
100%
GeForce GTX 660 Ti:
21.7 [X] Desktop-PC Intel Core i7-3770K 3.5GHz
GeForce GTX 660 Ti
fps
93%
GeForce GTX 680:
20.1 [X] Desktop GTX 680, Intel Core i7-2600K Intel Core i7-2600K 3.4GHz
GeForce GTX 680
fps
GeForce GTX 680:
30 [X] Desktop GTX 680, Intel Core i7-2600K Intel Core i7-2600K 3.4GHz
GeForce GTX 680
fps
GeForce GTX 680:
30 [X] Desktop GTX 680, Intel Core i7-2600K Intel Core i7-2600K 3.4GHz
GeForce GTX 680
fps
GeForce GTX 680:
30 [X] Desktop GTX 680, Intel Core i7-2600K Intel Core i7-2600K 3.4GHz
GeForce GTX 680
fps
GeForce GTX 680:
30 [X] Desktop GTX 680, Intel Core i7-2600K Intel Core i7-2600K 3.4GHz
GeForce GTX 680
min:
28 fps
fps
100%
GeForce GTX 660 Ti:
84.1 [X] Desktop-PC Intel Core i7-3770K 3.5GHz
GeForce GTX 660 Ti
fps
119%
GeForce GTX 680:
99.7 [X] Desktop GTX 680, Intel Core i7-2600K Intel Core i7-2600K 3.4GHz
GeForce GTX 680
min:
54 fps, max:
186 fps
fps
100%
GeForce GTX 660 Ti:
83.4 [X] Desktop-PC Intel Core i7-3770K 3.5GHz
GeForce GTX 660 Ti
fps
105%
GeForce GTX 680:
87.9 [X] Desktop GTX 680, Intel Core i7-2600K Intel Core i7-2600K 3.4GHz
GeForce GTX 680
min:
50 fps, max:
177 fps
fps
100%
GeForce GTX 660 Ti:
70.2 [X] Desktop-PC Intel Core i7-3770K 3.5GHz
GeForce GTX 660 Ti
fps
101%
GeForce GTX 680:
70.8 [X] Desktop GTX 680, Intel Core i7-2600K Intel Core i7-2600K 3.4GHz
GeForce GTX 680
min:
45 fps, max:
106 fps
fps
100%
GeForce GTX 660 Ti:
41.5 [X] Desktop-PC Intel Core i7-3770K 3.5GHz
GeForce GTX 660 Ti
fps
117%
GeForce GTX 680:
48.7 [X] Desktop GTX 680, Intel Core i7-2600K Intel Core i7-2600K 3.4GHz
GeForce GTX 680
min:
27 fps, max:
73 fps
fps
100%
GeForce GTX 660 Ti:
126 [X] Desktop-PC Intel Core i7-3770K 3.5GHz
GeForce GTX 660 Ti
fps
122%
GeForce GTX 680:
108 [X] Desktop GTX 680, Intel Core i7-2600K Intel Core i7-2600K 3.4GHz
GeForce GTX 680
min:
80 fps, max:
190 fps
199.2 [X] Desktop PC GeForce GTX 680
min:
189 fps, max:
201 fps
~ 154 fps
100%
GeForce GTX 660 Ti:
107.2 [X] Desktop-PC Intel Core i7-3770K 3.5GHz
GeForce GTX 660 Ti
fps
130%
GeForce GTX 680:
90 [X] Desktop GTX 680, Intel Core i7-2600K Intel Core i7-2600K 3.4GHz
GeForce GTX 680
min:
67 fps, max:
128 fps
187.7 [X] Desktop PC GeForce GTX 680
min:
175 fps, max:
201 fps
~ 139 fps
100%
GeForce GTX 660 Ti:
90.4 [X] Desktop-PC Intel Core i7-3770K 3.5GHz
GeForce GTX 660 Ti
fps
127%
GeForce GTX 680:
86 [X] Desktop GTX 680, Intel Core i7-2600K Intel Core i7-2600K 3.4GHz
GeForce GTX 680
min:
60 fps, max:
114 fps
143.5 [X] Desktop PC GeForce GTX 680
min:
131 fps, max:
189 fps
~ 115 fps
100%
GeForce GTX 660 Ti:
42 [X] Desktop-PC Intel Core i7-3770K 3.5GHz
GeForce GTX 660 Ti
fps
136%
GeForce GTX 680:
50.6 [X] Desktop GTX 680, Intel Core i7-2600K Intel Core i7-2600K 3.4GHz
GeForce GTX 680
min:
41 fps, max:
69 fps
64.3 [X] Desktop PC GeForce GTX 680
min:
53 fps, max:
87 fps
~ 57 fps
GeForce GTX 680:
32.4 [X] Desktop PC GeForce GTX 680
min:
28 fps, max:
40 fps
fps
100%
GeForce GTX 660 Ti:
343 [X] Desktop-PC Intel Core i7-3770K 3.5GHz
GeForce GTX 660 Ti
fps
97%
GeForce GTX 680:
331 [X] Desktop GTX 680, Intel Core i7-2600K Intel Core i7-2600K 3.4GHz
GeForce GTX 680
fps
100%
GeForce GTX 660 Ti:
250 [X] Desktop-PC Intel Core i7-3770K 3.5GHz
GeForce GTX 660 Ti
fps
98%
GeForce GTX 680:
244 [X] Desktop GTX 680, Intel Core i7-2600K Intel Core i7-2600K 3.4GHz
GeForce GTX 680
fps
100%
GeForce GTX 660 Ti:
147 [X] Desktop-PC Intel Core i7-3770K 3.5GHz
GeForce GTX 660 Ti
fps
117%
GeForce GTX 680:
172 [X] Desktop GTX 680, Intel Core i7-2600K Intel Core i7-2600K 3.4GHz
GeForce GTX 680
min:
64 fps, max:
252 fps
fps
100%
GeForce GTX 660 Ti:
73 [X] Desktop-PC Intel Core i7-3770K 3.5GHz
GeForce GTX 660 Ti
fps
122%
GeForce GTX 680:
89 [X] Desktop GTX 680, Intel Core i7-2600K Intel Core i7-2600K 3.4GHz
GeForce GTX 680
min:
45 fps, max:
139 fps
fps
100%
GeForce GTX 660 Ti:
188 [X] Desktop-PC Intel Core i7-3770K 3.5GHz
GeForce GTX 660 Ti
fps
87%
GeForce GTX 680:
162 [X] Desktop GTX 680 Intel Core i7-2600K 3.4GHz
GeForce GTX 680
165 [X] Desktop GTX 680, Intel Core i7-2600K Intel Core i7-2600K 3.4GHz
GeForce GTX 680
min:
135 fps
~ 164 fps
100%
GeForce GTX 660 Ti:
139 [X] Desktop-PC Intel Core i7-3770K 3.5GHz
GeForce GTX 660 Ti
fps
91%
GeForce GTX 680:
118 [X] Desktop GTX 680 Intel Core i7-2600K 3.4GHz
GeForce GTX 680
133 [X] Desktop GTX 680, Intel Core i7-2600K Intel Core i7-2600K 3.4GHz
GeForce GTX 680
min:
104 fps
~ 126 fps
100%
GeForce GTX 660 Ti:
130 [X] Desktop-PC Intel Core i7-3770K 3.5GHz
GeForce GTX 660 Ti
fps
96%
GeForce GTX 680:
122 [X] Desktop GTX 680, Intel Core i7-2600K Intel Core i7-2600K 3.4GHz
GeForce GTX 680
min:
96 fps
128 [X] Desktop GTX 680 Intel Core i7-2600K 3.4GHz
GeForce GTX 680
~ 125 fps
100%
GeForce GTX 660 Ti:
110 [X] Desktop-PC Intel Core i7-3770K 3.5GHz
GeForce GTX 660 Ti
fps
99%
GeForce GTX 680:
105 [X] Desktop GTX 680, Intel Core i7-2600K Intel Core i7-2600K 3.4GHz
GeForce GTX 680
min:
81 fps
113 [X] Desktop GTX 680 Intel Core i7-2600K 3.4GHz
GeForce GTX 680
min:
78 fps
~ 109 fps
100%
GeForce GTX 660 Ti:
752 [X] Desktop-PC Intel Core i7-3770K 3.5GHz
GeForce GTX 660 Ti
fps
100%
GeForce GTX 660 Ti:
554 [X] Desktop-PC Intel Core i7-3770K 3.5GHz
GeForce GTX 660 Ti
fps
100%
GeForce GTX 660 Ti:
546 [X] Desktop-PC Intel Core i7-3770K 3.5GHz
GeForce GTX 660 Ti
fps
100%
GeForce GTX 660 Ti:
408.9 [X] Desktop-PC Intel Core i7-3770K 3.5GHz
GeForce GTX 660 Ti
fps
108%
GeForce GTX 680:
440 [X] Desktop GTX 680 Intel Core i7-2600K 3.4GHz
GeForce GTX 680
fps
100%
GeForce GTX 660 Ti:
266 [X] Desktop-PC Intel Core i7-3770K 3.5GHz
GeForce GTX 660 Ti
fps
94%
GeForce GTX 680:
249 [X] Desktop GTX 680 Intel Core i7-2600K 3.4GHz
GeForce GTX 680
min:
161 fps
fps
100%
GeForce GTX 660 Ti:
194.8 [X] Desktop-PC Intel Core i7-3770K 3.5GHz
GeForce GTX 660 Ti
fps
86%
GeForce GTX 680:
168 [X] Desktop GTX 680 Intel Core i7-2600K 3.4GHz
GeForce GTX 680
min:
110 fps
fps
100%
GeForce GTX 660 Ti:
141.4 [X] Desktop-PC Intel Core i7-3770K 3.5GHz
GeForce GTX 660 Ti
fps
89%
GeForce GTX 680:
125.6 [X] Desktop GTX 680 Intel Core i7-2600K 3.4GHz
GeForce GTX 680
min:
69 fps
fps
100%
GeForce GTX 660 Ti:
33.8 [X] Desktop-PC Intel Core i7-3770K 3.5GHz
GeForce GTX 660 Ti
fps
114%
GeForce GTX 680:
38.4 [X] Desktop GTX 680 Intel Core i7-2600K 3.4GHz
GeForce GTX 680
min:
18 fps
fps
100%
GeForce GTX 660 Ti:
90.7 [X] Desktop-PC Intel Core i7-3770K 3.5GHz
GeForce GTX 660 Ti
fps
90%
GeForce GTX 680:
82 [X] Desktop GTX 680 Intel Core i7-2600K 3.4GHz
GeForce GTX 680
fps
100%
GeForce GTX 660 Ti:
78.8 [X] Desktop-PC Intel Core i7-3770K 3.5GHz
GeForce GTX 660 Ti
fps
104%
GeForce GTX 680:
82 [X] Desktop GTX 680 Intel Core i7-2600K 3.4GHz
GeForce GTX 680
fps
100%
GeForce GTX 660 Ti:
66.3 [X] Desktop-PC Intel Core i7-3770K 3.5GHz
GeForce GTX 660 Ti
fps
107%
GeForce GTX 680:
71 [X] Desktop GTX 680 Intel Core i7-2600K 3.4GHz
GeForce GTX 680
fps
100%
GeForce GTX 660 Ti:
52.2 [X] Desktop-PC Intel Core i7-3770K 3.5GHz
GeForce GTX 660 Ti
fps
123%
GeForce GTX 680:
63 [X] Desktop GTX 680 Intel Core i7-2600K 3.4GHz
GeForce GTX 680
65 [X] Desktop GTX 680 Intel Core i7-2600K 3.4GHz
GeForce GTX 680
~ 64 fps
100%
GeForce GTX 660 Ti:
121.9 [X] Desktop-PC Intel Core i7-3770K 3.5GHz
GeForce GTX 660 Ti
fps
100%
GeForce GTX 680:
121.8 [X] Desktop GTX 680 Intel Core i7-2600K 3.4GHz
GeForce GTX 680
fps
100%
GeForce GTX 660 Ti:
121.2 [X] Desktop-PC Intel Core i7-3770K 3.5GHz
GeForce GTX 660 Ti
fps
100%
GeForce GTX 680:
121.2 [X] Desktop GTX 680 Intel Core i7-2600K 3.4GHz
GeForce GTX 680
fps
100%
GeForce GTX 660 Ti:
66.3 [X] Desktop-PC Intel Core i7-3770K 3.5GHz
GeForce GTX 660 Ti
fps
137%
GeForce GTX 680:
91.1 [X] Desktop GTX 680 Intel Core i7-2600K 3.4GHz
GeForce GTX 680
fps
100%
GeForce GTX 660 Ti:
34.8 [X] Desktop-PC Intel Core i7-3770K 3.5GHz
GeForce GTX 660 Ti
fps
130%
GeForce GTX 680:
45.4 [X] Desktop GTX 680 Intel Core i7-2600K 3.4GHz
GeForce GTX 680
fps
100%
GeForce GTX 660 Ti:
134.4 [X] Desktop-PC Intel Core i7-3770K 3.5GHz
GeForce GTX 660 Ti
fps
86%
GeForce GTX 680:
115 [X] Desktop GTX 680 Intel Core i7-2600K 3.4GHz
GeForce GTX 680
fps
100%
GeForce GTX 660 Ti:
135.9 [X] Desktop-PC Intel Core i7-3770K 3.5GHz
GeForce GTX 660 Ti
fps
94%
GeForce GTX 680:
128 [X] Desktop GTX 680 Intel Core i7-2600K 3.4GHz
GeForce GTX 680
fps
100%
GeForce GTX 660 Ti:
86 [X] Desktop-PC Intel Core i7-3770K 3.5GHz
GeForce GTX 660 Ti
fps
113%
GeForce GTX 680:
97 [X] Desktop GTX 680 Intel Core i7-2600K 3.4GHz
GeForce GTX 680
fps
100%
GeForce GTX 660 Ti:
42 [X] Desktop-PC Intel Core i7-3770K 3.5GHz
GeForce GTX 660 Ti
fps
123%
GeForce GTX 680:
51.7 [X] Desktop GTX 680 Intel Core i7-2600K 3.4GHz
GeForce GTX 680
fps
100%
GeForce GTX 660 Ti:
113.6 [X] Desktop-PC Intel Core i7-3770K 3.5GHz
GeForce GTX 660 Ti
fps
98%
GeForce GTX 680:
111 [X] Desktop GTX 680 Intel Core i7-2600K 3.4GHz
GeForce GTX 680
fps
100%
GeForce GTX 660 Ti:
103.9 [X] Desktop-PC Intel Core i7-3770K 3.5GHz
GeForce GTX 660 Ti
fps
93%
GeForce GTX 680:
97 [X] Desktop GTX 680 Intel Core i7-2600K 3.4GHz
GeForce GTX 680
fps
100%
GeForce GTX 660 Ti:
96 [X] Desktop-PC Intel Core i7-3770K 3.5GHz
GeForce GTX 660 Ti
fps
96%
GeForce GTX 680:
92 [X] Desktop GTX 680 Intel Core i7-2600K 3.4GHz
GeForce GTX 680
fps
100%
GeForce GTX 660 Ti:
55.9 [X] Desktop-PC Intel Core i7-3770K 3.5GHz
GeForce GTX 660 Ti
fps
100%
GeForce GTX 680:
56.1 [X] Desktop GTX 680 Intel Core i7-2600K 3.4GHz
GeForce GTX 680
fps
100%
GeForce GTX 660 Ti:
51.5 [X] Desktop-PC Intel Core i7-3770K 3.5GHz
GeForce GTX 660 Ti
fps
104%
GeForce GTX 680:
53.7 [X] Desktop GTX 680 Intel Core i7-2600K 3.4GHz
GeForce GTX 680
fps
100%
GeForce GTX 660 Ti:
46.8 [X] Desktop-PC Intel Core i7-3770K 3.5GHz
GeForce GTX 660 Ti
fps
116%
GeForce GTX 680:
54.2 [X] Desktop GTX 680 Intel Core i7-2600K 3.4GHz
GeForce GTX 680
fps
100%
GeForce GTX 660 Ti:
25.3 [X] Desktop-PC Intel Core i7-3770K 3.5GHz
GeForce GTX 660 Ti
fps
113%
GeForce GTX 680:
28.5 [X] Desktop GTX 680 Intel Core i7-2600K 3.4GHz
GeForce GTX 680
fps
100%
GeForce GTX 660 Ti:
167.9 [X] Desktop-PC Intel Core i7-3770K 3.5GHz
GeForce GTX 660 Ti
fps
88%
GeForce GTX 680:
148 [X] Desktop GTX 680 Intel Core i7-2600K 3.4GHz
GeForce GTX 680
fps
100%
GeForce GTX 660 Ti:
119.8 [X] Desktop-PC Intel Core i7-3770K 3.5GHz
GeForce GTX 660 Ti
fps
92%
GeForce GTX 680:
110 [X] Desktop GTX 680 Intel Core i7-2600K 3.4GHz
GeForce GTX 680
fps
100%
GeForce GTX 660 Ti:
111.7 [X] Desktop-PC Intel Core i7-3770K 3.5GHz
GeForce GTX 660 Ti
fps
91%
GeForce GTX 680:
102 [X] Desktop GTX 680 Intel Core i7-2600K 3.4GHz
GeForce GTX 680
fps
100%
GeForce GTX 660 Ti:
70.2 [X] Desktop-PC Intel Core i7-3770K 3.5GHz
GeForce GTX 660 Ti
fps
108%
GeForce GTX 680:
76 [X] Desktop GTX 680 Intel Core i7-2600K 3.4GHz
GeForce GTX 680
fps
100%
GeForce GTX 660 Ti:
122.3 [X] Desktop-PC Intel Core i7-3770K 3.5GHz
GeForce GTX 660 Ti
fps
97%
GeForce GTX 680:
119.1 [X] Desktop GTX 680 Intel Core i7-2600K 3.4GHz
GeForce GTX 680
fps
100%
GeForce GTX 660 Ti:
110 [X] Desktop-PC Intel Core i7-3770K 3.5GHz
GeForce GTX 660 Ti
fps
104%
GeForce GTX 680:
114.8 [X] Desktop GTX 680 Intel Core i7-2600K 3.4GHz
GeForce GTX 680
fps
100%
GeForce GTX 660 Ti:
72.1 [X] Desktop-PC Intel Core i7-3770K 3.5GHz
GeForce GTX 660 Ti
fps
125%
GeForce GTX 680:
90.1 [X] Desktop GTX 680 Intel Core i7-2600K 3.4GHz
GeForce GTX 680
fps
100%
GeForce GTX 660 Ti:
41.1 [X] Desktop-PC Intel Core i7-3770K 3.5GHz
GeForce GTX 660 Ti
fps
121%
GeForce GTX 680:
49.8 [X] Desktop GTX 680 Intel Core i7-2600K 3.4GHz
GeForce GTX 680
fps
100%
GeForce GTX 660 Ti:
200.7 [X] Desktop-PC (GTX 660 Ti) Intel Core i5-2400 3.1GHz
GeForce GTX 660 Ti
fps
100%
GeForce GTX 680:
195 [X] Desktop GTX 680 Intel Core i7-2600K 3.4GHz
GeForce GTX 680
204.8 [X] Desktop PC GeForce GTX 680
min:
30.2 fps, max:
505.6 fps
~ 200 fps
100%
GeForce GTX 660 Ti:
168.8 [X] Desktop-PC (GTX 660 Ti) Intel Core i5-2400 3.1GHz
GeForce GTX 660 Ti
fps
94%
GeForce GTX 680:
150.3 [X] Desktop PC GeForce GTX 680
min:
23 fps, max:
477.3 fps
168 [X] Desktop GTX 680 Intel Core i7-2600K 3.4GHz
GeForce GTX 680
~ 159 fps
100%
GeForce GTX 660 Ti:
151.3 [X] Desktop-PC (GTX 660 Ti) Intel Core i5-2400 3.1GHz
GeForce GTX 660 Ti
fps
96%
GeForce GTX 680:
136.1 [X] Desktop PC GeForce GTX 680
min:
25.7 fps, max:
255.2 fps
153 [X] Desktop GTX 680 Intel Core i7-2600K 3.4GHz
GeForce GTX 680
~ 145 fps
100%
GeForce GTX 660 Ti:
62.9 [X] Desktop-PC (GTX 660 Ti) Intel Core i5-2400 3.1GHz
GeForce GTX 660 Ti
fps
99%
GeForce GTX 680:
55.3 [X] Desktop PC GeForce GTX 680
min:
13.8 fps, max:
172.7 fps
55.8 [X] Desktop GTX 680 Intel Core i7-2600K 3.4GHz
GeForce GTX 680
73.6 [X] Desktop GTX 680 Intel Core i7-2600K 3.4GHz
GeForce GTX 680
~ 62 fps
100%
GeForce GTX 660 Ti:
296.3 [X] Desktop-PC (GTX 660 Ti) Intel Core i5-2400 3.1GHz
GeForce GTX 660 Ti
fps
97%
GeForce GTX 680:
288 [X] Desktop GTX 680 Intel Core i7-2600K 3.4GHz
GeForce GTX 680
fps
100%
GeForce GTX 660 Ti:
121.4 [X] Desktop-PC (GTX 660 Ti) Intel Core i5-2400 3.1GHz
GeForce GTX 660 Ti
fps
102%
GeForce GTX 680:
124 [X] Desktop GTX 680 Intel Core i7-2600K 3.4GHz
GeForce GTX 680
fps
100%
GeForce GTX 660 Ti:
108.9 [X] Desktop-PC (GTX 660 Ti) Intel Core i5-2400 3.1GHz
GeForce GTX 660 Ti
fps
102%
GeForce GTX 680:
111 [X] Desktop GTX 680 Intel Core i7-2600K 3.4GHz
GeForce GTX 680
fps
100%
GeForce GTX 660 Ti:
65.9 [X] Desktop-PC (GTX 660 Ti) Intel Core i5-2400 3.1GHz
GeForce GTX 660 Ti
fps
114%
GeForce GTX 680:
75.2 [X] Desktop GTX 680 Intel Core i7-2600K 3.4GHz
GeForce GTX 680
fps
100%
GeForce GTX 660 Ti:
158.4 [X] Desktop-PC (GTX 660 Ti) Intel Core i5-2400 3.1GHz
GeForce GTX 660 Ti
fps
121%
GeForce GTX 680:
153 [X] Desktop GTX 680 Intel Core i7-2600K 3.4GHz
GeForce GTX 680
228 [X] no model Intel Core i7-4770K 3.5GHz
GeForce GTX 680
~ 191 fps
100%
GeForce GTX 660 Ti:
119.3 [X] Desktop-PC (GTX 660 Ti) Intel Core i5-2400 3.1GHz
GeForce GTX 660 Ti
fps
102%
GeForce GTX 680:
122 [X] Desktop GTX 680 Intel Core i7-2600K 3.4GHz
GeForce GTX 680
fps
100%
GeForce GTX 660 Ti:
95.2 [X] Desktop-PC (GTX 660 Ti) Intel Core i5-2400 3.1GHz
GeForce GTX 660 Ti
fps
107%
GeForce GTX 680:
102 [X] Desktop GTX 680 Intel Core i7-2600K 3.4GHz
GeForce GTX 680
fps
100%
GeForce GTX 660 Ti:
62.9 [X] Desktop-PC (GTX 660 Ti) Intel Core i5-2400 3.1GHz
GeForce GTX 660 Ti
fps
114%
GeForce GTX 680:
71.7 [X] Desktop GTX 680 Intel Core i7-2600K 3.4GHz
GeForce GTX 680
fps
100%
GeForce GTX 660 Ti:
304.4 [X] Desktop-PC (GTX 660 Ti) Intel Core i5-2400 3.1GHz
GeForce GTX 660 Ti
fps
92%
GeForce GTX 680:
280 [X] Desktop GTX 680 Intel Core i7-2600K 3.4GHz
GeForce GTX 680
fps
100%
GeForce GTX 660 Ti:
222.5 [X] Desktop-PC (GTX 660 Ti) Intel Core i5-2400 3.1GHz
GeForce GTX 660 Ti
fps
109%
GeForce GTX 680:
242 [X] Desktop GTX 680 Intel Core i7-2600K 3.4GHz
GeForce GTX 680
fps
100%
GeForce GTX 660 Ti:
135.3 [X] Desktop-PC (GTX 660 Ti) Intel Core i5-2400 3.1GHz
GeForce GTX 660 Ti
fps
128%
GeForce GTX 680:
173.3 [X] Desktop GTX 680 Intel Core i7-2600K 3.4GHz
GeForce GTX 680
fps
100%
GeForce GTX 660 Ti:
48.1 [X] Desktop-PC (GTX 660 Ti) Intel Core i5-2400 3.1GHz
GeForce GTX 660 Ti
fps
121%
GeForce GTX 680:
58 [X] Desktop GTX 680 Intel Core i7-2600K 3.4GHz
GeForce GTX 680
fps
100%
GeForce GTX 660 Ti:
94.1 [X] Desktop-PC (GTX 660 Ti) Intel Core i5-2400 3.1GHz
GeForce GTX 660 Ti
fps
112%
GeForce GTX 680:
105 [X] Desktop GTX 680 Intel Core i7-2600K 3.4GHz
GeForce GTX 680
fps
100%
GeForce GTX 660 Ti:
83 [X] Desktop-PC (GTX 660 Ti) Intel Core i5-2400 3.1GHz
GeForce GTX 660 Ti
fps
112%
GeForce GTX 680:
93 [X] Desktop GTX 680 Intel Core i7-2600K 3.4GHz
GeForce GTX 680
fps
100%
GeForce GTX 660 Ti:
61.9 [X] Desktop-PC (GTX 660 Ti) Intel Core i5-2400 3.1GHz
GeForce GTX 660 Ti
fps
118%
GeForce GTX 680:
73 [X] Desktop GTX 680 Intel Core i7-2600K 3.4GHz
GeForce GTX 680
fps
100%
GeForce GTX 660 Ti:
30.3 [X] Desktop-PC (GTX 660 Ti) Intel Core i5-2400 3.1GHz
GeForce GTX 660 Ti
fps
121%
GeForce GTX 680:
36.8 [X] Desktop GTX 680 Intel Core i7-2600K 3.4GHz
GeForce GTX 680
fps
100%
GeForce GTX 660 Ti:
410.2 [X] Desktop-PC (GTX 660 Ti) Intel Core i5-2400 3.1GHz
GeForce GTX 660 Ti
fps
111%
GeForce GTX 680:
455 [X] Desktop GTX 680 Intel Core i7-2600K 3.4GHz
GeForce GTX 680
fps
100%
GeForce GTX 660 Ti:
319.9 [X] Desktop-PC (GTX 660 Ti) Intel Core i5-2400 3.1GHz
GeForce GTX 660 Ti
fps
111%
GeForce GTX 680:
354 [X] Desktop GTX 680 Intel Core i7-2600K 3.4GHz
GeForce GTX 680
fps
100%
GeForce GTX 660 Ti:
248.6 [X] Desktop-PC (GTX 660 Ti) Intel Core i5-2400 3.1GHz
GeForce GTX 660 Ti
fps
115%
GeForce GTX 680:
287 [X] Desktop GTX 680 Intel Core i7-2600K 3.4GHz
GeForce GTX 680
fps
100%
GeForce GTX 660 Ti:
159.2 [X] Desktop-PC (GTX 660 Ti) Intel Core i5-2400 3.1GHz
GeForce GTX 660 Ti
fps
116%
GeForce GTX 680:
184 [X] Desktop GTX 680 Intel Core i7-2600K 3.4GHz
GeForce GTX 680
fps
100%
GeForce GTX 660 Ti:
109.2 [X] Desktop-PC (GTX 660 Ti) Intel Core i5-2400 3.1GHz
GeForce GTX 660 Ti
fps
110%
GeForce GTX 680:
120 [X] Desktop GTX 680 Intel Core i7-2600K 3.4GHz
GeForce GTX 680
fps
100%
GeForce GTX 660 Ti:
101.8 [X] Desktop-PC (GTX 660 Ti) Intel Core i5-2400 3.1GHz
GeForce GTX 660 Ti
fps
109%
GeForce GTX 680:
111 [X] Desktop GTX 680 Intel Core i7-2600K 3.4GHz
GeForce GTX 680
fps
100%
GeForce GTX 660 Ti:
79.1 [X] Desktop-PC (GTX 660 Ti) Intel Core i5-2400 3.1GHz
GeForce GTX 660 Ti
fps
110%
GeForce GTX 680:
87 [X] Desktop GTX 680 Intel Core i7-2600K 3.4GHz
GeForce GTX 680
fps
100%
GeForce GTX 660 Ti:
32.3 [X] Desktop-PC (GTX 660 Ti) Intel Core i5-2400 3.1GHz
GeForce GTX 660 Ti
fps
116%
GeForce GTX 680:
37.6 [X] Desktop GTX 680 Intel Core i7-2600K 3.4GHz
GeForce GTX 680
fps
100%
GeForce GTX 660 Ti:
76.6 [X] Desktop-PC (GTX 660 Ti) Intel Core i5-2400 3.1GHz
GeForce GTX 660 Ti
fps
85%
GeForce GTX 680:
64.9 [X] Desktop GTX 680 Intel Core i7-2600K 3.4GHz
GeForce GTX 680
fps
100%
GeForce GTX 660 Ti:
73.8 [X] Desktop-PC (GTX 660 Ti) Intel Core i5-2400 3.1GHz
GeForce GTX 660 Ti
fps
83%
GeForce GTX 680:
61.6 [X] Desktop GTX 680 Intel Core i7-2600K 3.4GHz
GeForce GTX 680
fps
100%
GeForce GTX 660 Ti:
43.7 [X] Desktop-PC (GTX 660 Ti) Intel Core i5-2400 3.1GHz
GeForce GTX 660 Ti
fps
108%
GeForce GTX 680:
47.4 [X] Desktop GTX 680 Intel Core i7-2600K 3.4GHz
GeForce GTX 680
fps
100%
GeForce GTX 660 Ti:
67.2 [X] Desktop-PC (GTX 660 Ti) Intel Core i5-2400 3.1GHz
GeForce GTX 660 Ti
fps
109%
GeForce GTX 680:
73.2 [X] Desktop GTX 680 Intel Core i7-2600K 3.4GHz
GeForce GTX 680
fps
100%
GeForce GTX 660 Ti:
62.9 [X] Desktop-PC (GTX 660 Ti) Intel Core i5-2400 3.1GHz
GeForce GTX 660 Ti
fps
109%
GeForce GTX 680:
68.5 [X] Desktop GTX 680 Intel Core i7-2600K 3.4GHz
GeForce GTX 680
fps
100%
GeForce GTX 660 Ti:
55.4 [X] Desktop-PC (GTX 660 Ti) Intel Core i5-2400 3.1GHz
GeForce GTX 660 Ti
fps
112%
GeForce GTX 680:
62 [X] Desktop GTX 680 Intel Core i7-2600K 3.4GHz
GeForce GTX 680
fps
100%
GeForce GTX 660 Ti:
27.8 [X] Desktop-PC (GTX 660 Ti) Intel Core i5-2400 3.1GHz
GeForce GTX 660 Ti
fps
133%
GeForce GTX 680:
36.9 [X] Desktop GTX 680 Intel Core i7-2600K 3.4GHz
GeForce GTX 680
fps
100%
GeForce GTX 660 Ti:
235.5 [X] Desktop-PC (GTX 660 Ti) Intel Core i5-2400 3.1GHz
GeForce GTX 660 Ti
fps
103%
GeForce GTX 680:
242 [X] Desktop GTX 680 Intel Core i7-2600K 3.4GHz
GeForce GTX 680
243 [X] Desktop GTX 680 Intel Core i7-2600K 3.4GHz
GeForce GTX 680
~ 243 fps
100%
GeForce GTX 660 Ti:
206.7 [X] Desktop-PC (GTX 660 Ti) Intel Core i5-2400 3.1GHz
GeForce GTX 660 Ti
fps
107%
GeForce GTX 680:
217 [X] Desktop GTX 680 Intel Core i7-2600K 3.4GHz
GeForce GTX 680
224 [X] Desktop GTX 680 Intel Core i7-2600K 3.4GHz
GeForce GTX 680
~ 221 fps
100%
GeForce GTX 660 Ti:
140.4 [X] Desktop-PC (GTX 660 Ti) Intel Core i5-2400 3.1GHz
GeForce GTX 660 Ti
fps
112%
GeForce GTX 680:
153 [X] Desktop GTX 680 Intel Core i7-2600K 3.4GHz
GeForce GTX 680
161 [X] Desktop GTX 680 Intel Core i7-2600K 3.4GHz
GeForce GTX 680
~ 157 fps
100%
GeForce GTX 660 Ti:
95.4 [X] Desktop-PC (GTX 660 Ti) Intel Core i5-2400 3.1GHz
GeForce GTX 660 Ti
fps
114%
GeForce GTX 680:
102.1 [X] Desktop GTX 680 Intel Core i7-2600K 3.4GHz
GeForce GTX 680
115 [X] Desktop GTX 680 Intel Core i7-2600K 3.4GHz
GeForce GTX 680
~ 109 fps
100%
GeForce GTX 660 Ti:
60 [X] Desktop-PC (GTX 660 Ti) Intel Core i5-2400 3.1GHz
GeForce GTX 660 Ti
fps
100%
GeForce GTX 680:
59.9 [X] Desktop GTX 680 Intel Core i7-2600K 3.4GHz
GeForce GTX 680
fps
100%
GeForce GTX 660 Ti:
59.9 [X] Desktop-PC (GTX 660 Ti) Intel Core i5-2400 3.1GHz
GeForce GTX 660 Ti
fps
100%
GeForce GTX 680:
59.9 [X] Desktop GTX 680 Intel Core i7-2600K 3.4GHz
GeForce GTX 680
fps
100%
GeForce GTX 660 Ti:
57.4 [X] Desktop-PC (GTX 660 Ti) Intel Core i5-2400 3.1GHz
GeForce GTX 660 Ti
fps
104%
GeForce GTX 680:
59.9 [X] Desktop GTX 680 Intel Core i7-2600K 3.4GHz
GeForce GTX 680
fps
100%
GeForce GTX 660 Ti:
56.6 [X] Desktop-PC (GTX 660 Ti) Intel Core i5-2400 3.1GHz
GeForce GTX 660 Ti
fps
105%
GeForce GTX 680:
59.6 [X] Desktop GTX 680 Intel Core i7-2600K 3.4GHz
GeForce GTX 680
min:
55 fps, max:
61 fps
fps
100%
GeForce GTX 660 Ti:
189.7 [X] Desktop-PC (GTX 660 Ti) Intel Core i5-2400 3.1GHz
GeForce GTX 660 Ti
fps
104%
GeForce GTX 680:
197 [X] Desktop GTX 680 Intel Core i7-2600K 3.4GHz
GeForce GTX 680
fps
100%
GeForce GTX 660 Ti:
151.5 [X] Desktop-PC (GTX 660 Ti) Intel Core i5-2400 3.1GHz
GeForce GTX 660 Ti
fps
112%
GeForce GTX 680:
170 [X] Desktop GTX 680 Intel Core i7-2600K 3.4GHz
GeForce GTX 680
fps
100%
GeForce GTX 660 Ti:
128.2 [X] Desktop-PC (GTX 660 Ti) Intel Core i5-2400 3.1GHz
GeForce GTX 660 Ti
fps
117%
GeForce GTX 680:
150 [X] Desktop GTX 680 Intel Core i7-2600K 3.4GHz
GeForce GTX 680
fps
100%
GeForce GTX 660 Ti:
54.1 [X] Desktop-PC (GTX 660 Ti) Intel Core i5-2400 3.1GHz
GeForce GTX 660 Ti
fps
123%
GeForce GTX 680:
66.7 [X] Desktop GTX 680 Intel Core i7-2600K 3.4GHz
GeForce GTX 680
fps
100%
GeForce GTX 660 Ti:
126.5 [X] Desktop-PC (GTX 660 Ti) Intel Core i5-2400 3.1GHz
GeForce GTX 660 Ti
fps
101%
GeForce GTX 680:
127.7 [X] Desktop GTX 680 Intel Core i7-2600K 3.4GHz
GeForce GTX 680
fps
100%
GeForce GTX 660 Ti:
126.5 [X] Desktop-PC (GTX 660 Ti) Intel Core i5-2400 3.1GHz
GeForce GTX 660 Ti
fps
101%
GeForce GTX 680:
127.7 [X] Desktop GTX 680 Intel Core i7-2600K 3.4GHz
GeForce GTX 680
fps
100%
GeForce GTX 660 Ti:
126.8 [X] Desktop-PC (GTX 660 Ti) Intel Core i5-2400 3.1GHz
GeForce GTX 660 Ti
fps
101%
GeForce GTX 680:
127.7 [X] Desktop GTX 680 Intel Core i7-2600K 3.4GHz
GeForce GTX 680
fps
100%
GeForce GTX 660 Ti:
126.2 [X] Desktop-PC (GTX 660 Ti) Intel Core i5-2400 3.1GHz
GeForce GTX 660 Ti
fps
101%
GeForce GTX 680:
127.7 [X] Desktop GTX 680 Intel Core i7-2600K 3.4GHz
GeForce GTX 680
fps
100%
GeForce GTX 660 Ti:
113.8 [X] Desktop-PC (GTX 660 Ti) Intel Core i5-2400 3.1GHz
GeForce GTX 660 Ti
fps
102%
GeForce GTX 680:
116 [X] Desktop GTX 680 Intel Core i7-2600K 3.4GHz
GeForce GTX 680
fps
100%
GeForce GTX 660 Ti:
73.1 [X] Desktop-PC (GTX 660 Ti) Intel Core i5-2400 3.1GHz
GeForce GTX 660 Ti
fps
109%
GeForce GTX 680:
80 [X] Desktop GTX 680 Intel Core i7-2600K 3.4GHz
GeForce GTX 680
fps
100%
GeForce GTX 660 Ti:
66.7 [X] Desktop-PC (GTX 660 Ti) Intel Core i5-2400 3.1GHz
GeForce GTX 660 Ti
fps
117%
GeForce GTX 680:
78 [X] Desktop GTX 680 Intel Core i7-2600K 3.4GHz
GeForce GTX 680
fps
100%
GeForce GTX 660 Ti:
60.5 [X] Desktop-PC (GTX 660 Ti) Intel Core i5-2400 3.1GHz
GeForce GTX 660 Ti
fps
107%
GeForce GTX 680:
65 [X] Desktop GTX 680 Intel Core i7-2600K 3.4GHz
GeForce GTX 680
fps
100%
GeForce GTX 660 Ti:
491.2 [X] Desktop-PC (GTX 660 Ti) Intel Core i5-2400 3.1GHz
GeForce GTX 660 Ti
fps
101%
GeForce GTX 680:
495 [X] Desktop GTX 680 Intel Core i7-2600K 3.4GHz
GeForce GTX 680
fps
100%
GeForce GTX 660 Ti:
382 [X] Desktop-PC (GTX 660 Ti) Intel Core i5-2400 3.1GHz
GeForce GTX 660 Ti
fps
105%
GeForce GTX 680:
400 [X] Desktop GTX 680 Intel Core i7-2600K 3.4GHz
GeForce GTX 680
fps
100%
GeForce GTX 660 Ti:
361.3 [X] Desktop-PC (GTX 660 Ti) Intel Core i5-2400 3.1GHz
GeForce GTX 660 Ti
fps
118%
GeForce GTX 680:
425 [X] Desktop GTX 680 Intel Core i7-2600K 3.4GHz
GeForce GTX 680
fps
100%
GeForce GTX 660 Ti:
322.7 [X] Desktop-PC (GTX 660 Ti) Intel Core i5-2400 3.1GHz
GeForce GTX 660 Ti
fps
124%
GeForce GTX 680:
400 [X] Desktop GTX 680 Intel Core i7-2600K 3.4GHz
GeForce GTX 680
fps
100%
GeForce GTX 660 Ti:
140 [X] Desktop-PC (GTX 660 Ti) Intel Core i5-2400 3.1GHz
GeForce GTX 660 Ti
fps
94%
GeForce GTX 680:
132 [X] Desktop GTX 680 Intel Core i7-2600K 3.4GHz
GeForce GTX 680
min:
112 fps
fps
100%
GeForce GTX 660 Ti:
112 [X] Desktop-PC (GTX 660 Ti) Intel Core i5-2400 3.1GHz
GeForce GTX 660 Ti
fps
96%
GeForce GTX 680:
107 [X] Desktop GTX 680 Intel Core i7-2600K 3.4GHz
GeForce GTX 680
fps
100%
GeForce GTX 660 Ti:
103 [X] Desktop-PC (GTX 660 Ti) Intel Core i5-2400 3.1GHz
GeForce GTX 660 Ti
fps
111%
GeForce GTX 680:
114 [X] Desktop GTX 680 Intel Core i7-2600K 3.4GHz
GeForce GTX 680
fps
100%
GeForce GTX 660 Ti:
79 [X] Desktop-PC (GTX 660 Ti) Intel Core i5-2400 3.1GHz
GeForce GTX 660 Ti
fps
122%
GeForce GTX 680:
96 [X] Desktop GTX 680 Intel Core i7-2600K 3.4GHz
GeForce GTX 680
min:
77 fps
fps
100%
GeForce GTX 660 Ti:
122.7 [X] Desktop-PC (GTX 660 Ti) Intel Core i5-2400 3.1GHz
GeForce GTX 660 Ti
fps
106%
GeForce GTX 680:
130.6 [X] Desktop GTX 680 Intel Core i7-2600K 3.4GHz
GeForce GTX 680
fps
100%
GeForce GTX 660 Ti:
108.7 [X] Desktop-PC (GTX 660 Ti) Intel Core i5-2400 3.1GHz
GeForce GTX 660 Ti
fps
110%
GeForce GTX 680:
119.4 [X] Desktop GTX 680 Intel Core i7-2600K 3.4GHz
GeForce GTX 680
fps
100%
GeForce GTX 660 Ti:
104.3 [X] Desktop-PC (GTX 660 Ti) Intel Core i5-2400 3.1GHz
GeForce GTX 660 Ti
fps
108%
GeForce GTX 680:
113 [X] Desktop GTX 680 Intel Core i7-2600K 3.4GHz
GeForce GTX 680
fps
100%
GeForce GTX 660 Ti:
89.4 [X] Desktop-PC (GTX 660 Ti) Intel Core i5-2400 3.1GHz
GeForce GTX 660 Ti
fps
113%
GeForce GTX 680:
100.7 [X] Desktop GTX 680 Intel Core i7-2600K 3.4GHz
GeForce GTX 680
fps
100%
GeForce GTX 660 Ti:
72.8 [X] Desktop-PC (GTX 660 Ti) Intel Core i5-2400 3.1GHz
GeForce GTX 660 Ti
fps
104%
GeForce GTX 680:
76 [X] Desktop GTX 680 Intel Core i7-2600K 3.4GHz
GeForce GTX 680
fps
100%
GeForce GTX 660 Ti:
44 [X] Desktop-PC (GTX 660 Ti) Intel Core i5-2400 3.1GHz
GeForce GTX 660 Ti
fps
109%
GeForce GTX 680:
48 [X] Desktop GTX 680 Intel Core i7-2600K 3.4GHz
GeForce GTX 680
fps
100%
GeForce GTX 660 Ti:
35.8 [X] Desktop-PC (GTX 660 Ti) Intel Core i5-2400 3.1GHz
GeForce GTX 660 Ti
fps
115%
GeForce GTX 680:
41.2 [X] Desktop GTX 680 Intel Core i7-2600K 3.4GHz
GeForce GTX 680
fps
100%
GeForce GTX 660 Ti:
246.3 [X] Desktop-PC (GTX 660 Ti) Intel Core i5-2400 3.1GHz
GeForce GTX 660 Ti
fps
100%
GeForce GTX 660 Ti:
220.8 [X] Desktop-PC (GTX 660 Ti) Intel Core i5-2400 3.1GHz
GeForce GTX 660 Ti
fps
100%
GeForce GTX 660 Ti:
198.9 [X] Desktop-PC (GTX 660 Ti) Intel Core i5-2400 3.1GHz
GeForce GTX 660 Ti
fps
115%
GeForce GTX 680:
228 [X] Desktop GTX 680 Intel Core i7-2600K 3.4GHz
GeForce GTX 680
fps
100%
GeForce GTX 660 Ti:
191.6 [X] Desktop-PC (GTX 660 Ti) Intel Core i5-2400 3.1GHz
GeForce GTX 660 Ti
fps
117%
GeForce GTX 680:
224 [X] Desktop GTX 680 Intel Core i7-2600K 3.4GHz
GeForce GTX 680
min:
179 fps, max:
258 fps
fps
100%
GeForce GTX 660 Ti:
228.8 [X] Desktop-PC (GTX 660 Ti) Intel Core i5-2400 3.1GHz
GeForce GTX 660 Ti
fps
122%
GeForce GTX 680:
280 [X] Desktop GTX 680 Intel Core i7-2600K 3.4GHz
GeForce GTX 680
fps
100%
GeForce GTX 660 Ti:
142.8 [X] Desktop-PC (GTX 660 Ti) Intel Core i5-2400 3.1GHz
GeForce GTX 660 Ti
fps
123%
GeForce GTX 680:
175 [X] Desktop GTX 680 Intel Core i7-2600K 3.4GHz
GeForce GTX 680
fps
100%
GeForce GTX 660 Ti:
145 [X] Desktop-PC (GTX 660 Ti) Intel Core i5-2400 3.1GHz
GeForce GTX 660 Ti
fps
102%
GeForce GTX 680:
148.6 [X] Desktop GTX 680 Intel Core i7-2600K 3.4GHz
GeForce GTX 680
min:
57.8 fps, max:
391 fps
fps
100%
GeForce GTX 660 Ti:
96.8 [X] Desktop-PC (GTX 660 Ti) Intel Core i5-2400 3.1GHz
GeForce GTX 660 Ti
fps
114%
GeForce GTX 680:
110.2 [X] Desktop GTX 680 Intel Core i7-2600K 3.4GHz
GeForce GTX 680
min:
52.3 fps, max:
267.2 fps
fps
100%
GeForce GTX 660 Ti:
89.9 [X] Desktop-PC (GTX 660 Ti) Intel Core i5-2400 3.1GHz
GeForce GTX 660 Ti
fps
106%
GeForce GTX 680:
95.7 [X] Desktop GTX 680 Intel Core i7-2600K 3.4GHz
GeForce GTX 680
min:
54.7 fps, max:
159.3 fps
fps
100%
GeForce GTX 660 Ti:
33.1 [X] Desktop-PC (GTX 660 Ti) Intel Core i5-2400 3.1GHz
GeForce GTX 660 Ti
fps
119%
GeForce GTX 680:
39.4 [X] Desktop GTX 680 Intel Core i7-2600K 3.4GHz
GeForce GTX 680
min:
26.2 fps, max:
51.8 fps
fps
GeForce GTX 680:
76 [X] Desktop GTX 680 Intel Core i7-2600K 3.4GHz
GeForce GTX 680
fps
GeForce GTX 680:
73 [X] Desktop GTX 680 Intel Core i7-2600K 3.4GHz
GeForce GTX 680
fps
GeForce GTX 680:
64 [X] Desktop GTX 680 Intel Core i7-2600K 3.4GHz
GeForce GTX 680
fps
GeForce GTX 680:
48 [X] Desktop GTX 680 Intel Core i7-2600K 3.4GHz
GeForce GTX 680
fps
100%
GeForce GTX 660 Ti:
62.4 [X] Desktop-PC (GTX 660 Ti) Intel Core i5-2400 3.1GHz
GeForce GTX 660 Ti
fps
100%
GeForce GTX 680:
62.5 [X] Desktop GTX 680 Intel Core i7-2600K 3.4GHz
GeForce GTX 680
fps
100%
GeForce GTX 660 Ti:
61.9 [X] Desktop-PC (GTX 660 Ti) Intel Core i5-2400 3.1GHz
GeForce GTX 660 Ti
fps
101%
GeForce GTX 680:
62.5 [X] Desktop GTX 680 Intel Core i7-2600K 3.4GHz
GeForce GTX 680
fps
100%
GeForce GTX 660 Ti:
56.5 [X] Desktop-PC (GTX 660 Ti) Intel Core i5-2400 3.1GHz
GeForce GTX 660 Ti
fps
110%
GeForce GTX 680:
62 [X] Desktop GTX 680 1.5
Intel Core i7-2600K 3.4GHz
GeForce GTX 680
fps
100%
GeForce GTX 660 Ti:
71.2 [X] Desktop-PC (GTX 660 Ti) Intel Core i5-2400 3.1GHz
GeForce GTX 660 Ti
fps
112%
GeForce GTX 680:
80 [X] Desktop GTX 680 Intel Core i7-2600K 3.4GHz
GeForce GTX 680
fps
100%
GeForce GTX 660 Ti:
69.6 [X] Desktop-PC (GTX 660 Ti) Intel Core i5-2400 3.1GHz
GeForce GTX 660 Ti
fps
112%
GeForce GTX 680:
78 [X] Desktop GTX 680 Intel Core i7-2600K 3.4GHz
GeForce GTX 680
fps
100%
GeForce GTX 660 Ti:
63.1 [X] Desktop-PC (GTX 660 Ti) Intel Core i5-2400 3.1GHz
GeForce GTX 660 Ti
fps
114%
GeForce GTX 680:
72 [X] Desktop GTX 680 Intel Core i7-2600K 3.4GHz
GeForce GTX 680
fps
100%
GeForce GTX 660 Ti:
56.6 [X] Desktop-PC (GTX 660 Ti) Intel Core i5-2400 3.1GHz
GeForce GTX 660 Ti
fps
115%
GeForce GTX 680:
65 [X] Desktop GTX 680 Intel Core i7-2600K 3.4GHz
GeForce GTX 680
fps
100%
GeForce GTX 660 Ti:
90.9 [X] Desktop-PC (GTX 660 Ti) Intel Core i5-2400 3.1GHz
GeForce GTX 660 Ti
fps
112%
GeForce GTX 680:
102 [X] Desktop GTX 680 Intel Core i7-2600K 3.4GHz
GeForce GTX 680
fps
100%
GeForce GTX 660 Ti:
72.9 [X] Desktop-PC (GTX 660 Ti) Intel Core i5-2400 3.1GHz
GeForce GTX 660 Ti
fps
106%
GeForce GTX 680:
77 [X] Desktop GTX 680 Intel Core i7-2600K 3.4GHz
GeForce GTX 680
fps
100%
GeForce GTX 660 Ti:
71.7 [X] Desktop-PC (GTX 660 Ti) Intel Core i5-2400 3.1GHz
GeForce GTX 660 Ti
fps
105%
GeForce GTX 680:
75 [X] Desktop GTX 680 Intel Core i7-2600K 3.4GHz
GeForce GTX 680
fps
100%
GeForce GTX 660 Ti:
62.1 [X] Desktop-PC (GTX 660 Ti) Intel Core i5-2400 3.1GHz
GeForce GTX 660 Ti
fps
121%
GeForce GTX 680:
75 [X] Desktop GTX 680 Intel Core i7-2600K 3.4GHz
GeForce GTX 680
fps
100%
GeForce GTX 660 Ti:
312.8 [X] Desktop-PC (GTX 660 Ti) Intel Core i5-2400 3.1GHz
GeForce GTX 660 Ti
fps
69%
GeForce GTX 680:
216 [X] Desktop GTX 680 1.0.3
Intel Core i7-2600K 3.4GHz
GeForce GTX 680
fps
100%
GeForce GTX 660 Ti:
250.8 [X] Desktop-PC (GTX 660 Ti) Intel Core i5-2400 3.1GHz
GeForce GTX 660 Ti
fps
80%
GeForce GTX 680:
200 [X] Desktop GTX 680 1.0.3
Intel Core i7-2600K 3.4GHz
GeForce GTX 680
fps
100%
GeForce GTX 660 Ti:
246.1 [X] Desktop-PC (GTX 660 Ti) Intel Core i5-2400 3.1GHz
GeForce GTX 660 Ti
fps
81%
GeForce GTX 680:
200 [X] Desktop GTX 680 1.0.3
Intel Core i7-2600K 3.4GHz
GeForce GTX 680
fps
100%
GeForce GTX 660 Ti:
217.7 [X] Desktop-PC (GTX 660 Ti) Intel Core i5-2400 3.1GHz
GeForce GTX 660 Ti
fps
86%
GeForce GTX 680:
188 [X] Desktop GTX 680 1.0.3
Intel Core i7-2600K 3.4GHz
GeForce GTX 680
fps
100%
GeForce GTX 660 Ti:
89.8 [X] Desktop-PC (GTX 660 Ti) Intel Core i5-2400 3.1GHz
GeForce GTX 660 Ti
fps
106%
GeForce GTX 680:
95 [X] Desktop GTX 680 Intel Core i7-2600K 3.4GHz
GeForce GTX 680
fps
100%
GeForce GTX 660 Ti:
96.2 [X] Desktop-PC (GTX 660 Ti) Intel Core i5-2400 3.1GHz
GeForce GTX 660 Ti
fps
103%
GeForce GTX 680:
99 [X] Desktop GTX 680 Intel Core i7-2600K 3.4GHz
GeForce GTX 680
fps
100%
GeForce GTX 660 Ti:
76.9 [X] Desktop-PC (GTX 660 Ti) Intel Core i5-2400 3.1GHz
GeForce GTX 660 Ti
fps
101%
GeForce GTX 680:
78 [X] Desktop GTX 680 Intel Core i7-2600K 3.4GHz
GeForce GTX 680
fps
100%
GeForce GTX 660 Ti:
53.2 [X] Desktop-PC (GTX 660 Ti) Intel Core i5-2400 3.1GHz
GeForce GTX 660 Ti
fps
126%
GeForce GTX 680:
67 [X] Desktop GTX 680 Intel Core i7-2600K 3.4GHz
GeForce GTX 680
fps
100%
GeForce GTX 660 Ti:
60 [X] Desktop-PC (GTX 660 Ti) Intel Core i5-2400 3.1GHz
GeForce GTX 660 Ti
fps
100%
GeForce GTX 680:
60 [X] Desktop GTX 680 Intel Core i7-2600K 3.4GHz
GeForce GTX 680
fps
100%
GeForce GTX 660 Ti:
59.9 [X] Desktop-PC (GTX 660 Ti) Intel Core i5-2400 3.1GHz
GeForce GTX 660 Ti
fps
100%
GeForce GTX 680:
60 [X] Desktop GTX 680 Intel Core i7-2600K 3.4GHz
GeForce GTX 680
fps
100%
GeForce GTX 660 Ti:
59.9 [X] Desktop-PC (GTX 660 Ti) Intel Core i5-2400 3.1GHz
GeForce GTX 660 Ti
fps
100%
GeForce GTX 680:
60 [X] Desktop GTX 680 Intel Core i7-2600K 3.4GHz
GeForce GTX 680
fps
100%
GeForce GTX 660 Ti:
124.6 [X] Desktop-PC (GTX 660 Ti) Intel Core i5-2400 3.1GHz
GeForce GTX 660 Ti
fps
107%
GeForce GTX 680:
133 [X] Desktop GTX 680 Intel Core i7-2600K 3.4GHz
GeForce GTX 680
fps
100%
GeForce GTX 660 Ti:
95.7 [X] Desktop-PC (GTX 660 Ti) Intel Core i5-2400 3.1GHz
GeForce GTX 660 Ti
fps
111%
GeForce GTX 680:
106 [X] Desktop GTX 680 Intel Core i7-2600K 3.4GHz
GeForce GTX 680
fps
100%
GeForce GTX 660 Ti:
54.7 [X] Desktop-PC (GTX 660 Ti) Intel Core i5-2400 3.1GHz
GeForce GTX 660 Ti
fps
130%
GeForce GTX 680:
71 [X] Desktop GTX 680 Intel Core i7-2600K 3.4GHz
GeForce GTX 680
fps
100%
GeForce GTX 660 Ti:
249 [X] Desktop-PC (GTX 660 Ti) Intel Core i5-2400 3.1GHz
GeForce GTX 660 Ti
fps
122%
GeForce GTX 680:
305 [X] Desktop GTX 680 Intel Core i7-2600K 3.4GHz
GeForce GTX 680
fps
100%
GeForce GTX 660 Ti:
192.5 [X] Desktop-PC (GTX 660 Ti) Intel Core i5-2400 3.1GHz
GeForce GTX 660 Ti
fps
113%
GeForce GTX 680:
217 [X] Desktop GTX 680 Intel Core i7-2600K 3.4GHz
GeForce GTX 680
fps
100%
GeForce GTX 660 Ti:
134.3 [X] Desktop-PC (GTX 660 Ti) Intel Core i5-2400 3.1GHz
GeForce GTX 660 Ti
fps
127%
GeForce GTX 680:
171 [X] Desktop GTX 680 Intel Core i7-2600K 3.4GHz
GeForce GTX 680
fps
100%
GeForce GTX 660 Ti:
75.2 [X] Desktop-PC (GTX 660 Ti) Intel Core i5-2400 3.1GHz
GeForce GTX 660 Ti
fps
120%
GeForce GTX 680:
90 [X] Desktop GTX 680 Intel Core i7-2600K 3.4GHz
GeForce GTX 680
fps
100%
GeForce GTX 660 Ti:
90 [X] Desktop-PC (GTX 660 Ti) Intel Core i5-2400 3.1GHz
GeForce GTX 660 Ti
fps
100%
GeForce GTX 660 Ti:
65 [X] Desktop-PC (GTX 660 Ti) Intel Core i5-2400 3.1GHz
GeForce GTX 660 Ti
fps
122%
GeForce GTX 680:
79 [X] Desktop GTX 680 Intel Core i7-2600K 3.4GHz
GeForce GTX 680
fps
100%
GeForce GTX 660 Ti:
228.1 [X] Desktop-PC (GTX 660 Ti) Intel Core i5-2400 3.1GHz
GeForce GTX 660 Ti
fps
100%
GeForce GTX 660 Ti:
152.3 [X] Desktop-PC (GTX 660 Ti) Intel Core i5-2400 3.1GHz
GeForce GTX 660 Ti
fps
100%
GeForce GTX 660 Ti:
145.9 [X] Desktop-PC (GTX 660 Ti) Intel Core i5-2400 3.1GHz
GeForce GTX 660 Ti
fps
100%
GeForce GTX 660 Ti:
128.1 [X] Desktop-PC (GTX 660 Ti) Intel Core i5-2400 3.1GHz
GeForce GTX 660 Ti
fps
108%
GeForce GTX 680:
138 [X] Desktop GTX 680 Intel Core i7-2600K 3.4GHz
GeForce GTX 680
fps
100%
GeForce GTX 660 Ti:
141.2 [X] Desktop-PC (GTX 660 Ti) Intel Core i5-2400 3.1GHz
GeForce GTX 660 Ti
fps
98%
GeForce GTX 680:
138 [X] Desktop GTX 680 Intel Core i7-2600K 3.4GHz
GeForce GTX 680
fps
100%
GeForce GTX 660 Ti:
112.1 [X] Desktop-PC (GTX 660 Ti) Intel Core i5-2400 3.1GHz
GeForce GTX 660 Ti
fps
109%
GeForce GTX 680:
122 [X] Desktop GTX 680 Intel Core i7-2600K 3.4GHz
GeForce GTX 680
fps
100%
GeForce GTX 660 Ti:
99.5 [X] Desktop-PC (GTX 660 Ti) Intel Core i5-2400 3.1GHz
GeForce GTX 660 Ti
fps
114%
GeForce GTX 680:
113 [X] Desktop GTX 680 Intel Core i7-2600K 3.4GHz
GeForce GTX 680
fps
100%
GeForce GTX 660 Ti:
46.4 [X] Desktop-PC (GTX 660 Ti) Intel Core i5-2400 3.1GHz
GeForce GTX 660 Ti
fps
121%
GeForce GTX 680:
56 [X] Desktop GTX 680 Intel Core i7-2600K 3.4GHz
GeForce GTX 680
fps
GeForce GTX 680:
152 [X] Desktop GTX 680 Intel Core i7-2600K 3.4GHz
GeForce GTX 680
fps
GeForce GTX 680:
76 [X] Desktop GTX 680 Intel Core i7-2600K 3.4GHz
GeForce GTX 680
fps
GeForce GTX 680:
69 [X] Desktop GTX 680 Intel Core i7-2600K 3.4GHz
GeForce GTX 680
min:
14 fps, max:
109 fps
fps
GeForce GTX 680:
334 [X] Desktop GTX 680 Intel Core i7-2600K 3.4GHz
GeForce GTX 680
fps
GeForce GTX 680:
86 [X] Desktop GTX 680 Intel Core i7-2600K 3.4GHz
GeForce GTX 680
min:
75 fps
fps
GeForce GTX 680:
74 [X] Desktop GTX 680 Intel Core i7-2600K 3.4GHz
GeForce GTX 680
min:
55 fps
fps
GeForce GTX 680:
134 (!) [X] Desktop GTX 680 Intel Core i7-2600K 3.4GHz
GeForce GTX 680
fps
GeForce GTX 680:
46 [X] Desktop GTX 680 Intel Core i7-2600K 3.4GHz
GeForce GTX 680
fps
GeForce GTX 680:
47 [X] Desktop GTX 680 Intel Core i7-2600K 3.4GHz
GeForce GTX 680
fps
GeForce GTX 680:
45 [X] Desktop GTX 680 Intel Core i7-2600K 3.4GHz
GeForce GTX 680
fps
GeForce GTX 680:
25 [X] Desktop GTX 680 Intel Core i7-2600K 3.4GHz
GeForce GTX 680
fps
GeForce GTX 680:
102 [X] Desktop GTX 680 Intel Core i7-2600K 3.4GHz
GeForce GTX 680
fps
GeForce GTX 680:
102 [X] Desktop GTX 680 Intel Core i7-2600K 3.4GHz
GeForce GTX 680
fps
GeForce GTX 680:
101 [X] Desktop GTX 680 Intel Core i7-2600K 3.4GHz
GeForce GTX 680
fps
GeForce GTX 680:
82.3 [X] Desktop GTX 680 Intel Core i7-2600K 3.4GHz
GeForce GTX 680
fps
GeForce GTX 680:
114.8 [X] Desktop GTX 680 Intel Core i7-2600K 3.4GHz
GeForce GTX 680
fps
GeForce GTX 680:
64.6 [X] Desktop GTX 680 Intel Core i7-2600K 3.4GHz
GeForce GTX 680
fps
GeForce GTX 680:
144.2 [X] Desktop GTX 680 Intel Core i7-2600K 3.4GHz
GeForce GTX 680
fps
GeForce GTX 680:
348 [X] Desktop GTX 680 1.4.3
Intel Core i7-2600K 3.4GHz
GeForce GTX 680
fps
GeForce GTX 680:
127 [X] Desktop GTX 680 1.4.3
Intel Core i7-2600K 3.4GHz
GeForce GTX 680
fps
GeForce GTX 680:
126 [X] Desktop GTX 680 1.4.3
Intel Core i7-2600K 3.4GHz
GeForce GTX 680
fps
GeForce GTX 680:
114 [X] Desktop GTX 680 1.4.3
Intel Core i7-2600K 3.4GHz
GeForce GTX 680
fps
GeForce GTX 680:
72.1 [X] Desktop GTX 680 Intel Core i7-2600K 3.4GHz
GeForce GTX 680
fps
GeForce GTX 680:
37 [X] Desktop GTX 680 Intel Core i7-2600K 3.4GHz
GeForce GTX 680
fps
GeForce GTX 680:
137 [X] Desktop GTX 680 Intel Core i7-2600K 3.4GHz
GeForce GTX 680
fps
GeForce GTX 680:
93 [X] Desktop GTX 680 Intel Core i7-2600K 3.4GHz
GeForce GTX 680
fps
GeForce GTX 680:
85 [X] Desktop GTX 680 Intel Core i7-2600K 3.4GHz
GeForce GTX 680
fps
GeForce GTX 680:
78 [X] Desktop GTX 680 Intel Core i7-2600K 3.4GHz
GeForce GTX 680
fps
GeForce GTX 680:
148 [X] Desktop GTX 680 Intel Core i7-2600K 3.4GHz
GeForce GTX 680
fps
GeForce GTX 680:
176 [X] Desktop GTX 680 Intel Core i7-2600K 3.4GHz
GeForce GTX 680
fps
GeForce GTX 680:
130.5 [X] Desktop GTX 680 Intel Core i7-2600K 3.4GHz
GeForce GTX 680
fps
GeForce GTX 680:
133.8 [X] Desktop GTX 680 Intel Core i7-2600K 3.4GHz
GeForce GTX 680
fps
GeForce GTX 680:
43 [X] Desktop GTX 680 Intel Core i7-2600K 3.4GHz
GeForce GTX 680
fps
GeForce GTX 680:
65 [X] Desktop GTX 680 Intel Core i7-2600K 3.4GHz
GeForce GTX 680
fps
GeForce GTX 680:
50.9 [X] Desktop GTX 680 Intel Core i7-2600K 3.4GHz
GeForce GTX 680
fps
GeForce GTX 680:
66.3 [X] Desktop GTX 680 Intel Core i7-2600K 3.4GHz
GeForce GTX 680
fps
GeForce GTX 680:
70.9 [X] Desktop GTX 680 Intel Core i7-2600K 3.4GHz
GeForce GTX 680
fps
GeForce GTX 680:
390 [X] Desktop GTX 680 Intel Core i7-2600K 3.4GHz
GeForce GTX 680
fps
GeForce GTX 680:
394 [X] Desktop GTX 680 Intel Core i7-2600K 3.4GHz
GeForce GTX 680
fps
GeForce GTX 680:
393 [X] Desktop GTX 680 Intel Core i7-2600K 3.4GHz
GeForce GTX 680
fps
GeForce GTX 680:
386 [X] Desktop GTX 680 Intel Core i7-2600K 3.4GHz
GeForce GTX 680
fps
GeForce GTX 680:
890 [X] Desktop GTX 680 Intel Core i7-2600K 3.4GHz
GeForce GTX 680
fps
Average Gaming NVIDIA GeForce GTX 660 Ti → 100% Average Gaming 30-70 fps → 100%
Average Gaming NVIDIA GeForce GTX 680 → 107% Average Gaming 30-70 fps → 109%
 Deutsch
 English
 Español
 Français
 Italiano
 Nederlands
 Polski
 Português
 Русский
 Türkçe
 Svenska
 Chinese
 Magyar