NVIDIA GeForce RTX 2080 Max-Q vs NVIDIA GeForce RTX 2080 Ti (Desktop) vs NVIDIA GeForce RTX 2070 Super Mobile
NVIDIA GeForce RTX 2080 Max-Q ► remove from comparison
Die Nvidia GeForce RTX 2080 mit Max-Q Design ist eine mobile High-End-Grafikkarte der Turing-Serie. Sie ist gedacht für dünne und relativ leichte Gaming Laptops und wahrscheinlich etwa 10-15% langsamer als eine normale mobile RTX 2080 (wie bei der 10er Generation).
Anscheinend gibt es zwei Varianten der RTX 2080 Max-Q, eine mit 80 Watt TDP und 735 - 1095 MHz und eine schnellere mit 90 Watt TDP mit 990 - 1230 MHz Kerntakt (Basis - Boost). Beide Varianten takten mit 6 GHz den GDDR6 Speicher (im Vergleich zu 7 GHz bei der normalen RTX 2080).
Im Vergleich zur normalen GTX 1080 gibt es noch weitere Unterschiede als den Takt. Der Treiber wurde auf Effizienz (und nicht Leistung) optimiert (nur für die Max-Q Modelle), optimierte Spannungswandler für 1V Betreib, high-end Kühlungsmethoden und eine 40 dB Grenze für die Lüfterlautstärke (mit Taktanpasssungen um dies jederzeit zu gewährleisten) zeichnen die Max-Q Variante aus.
Features
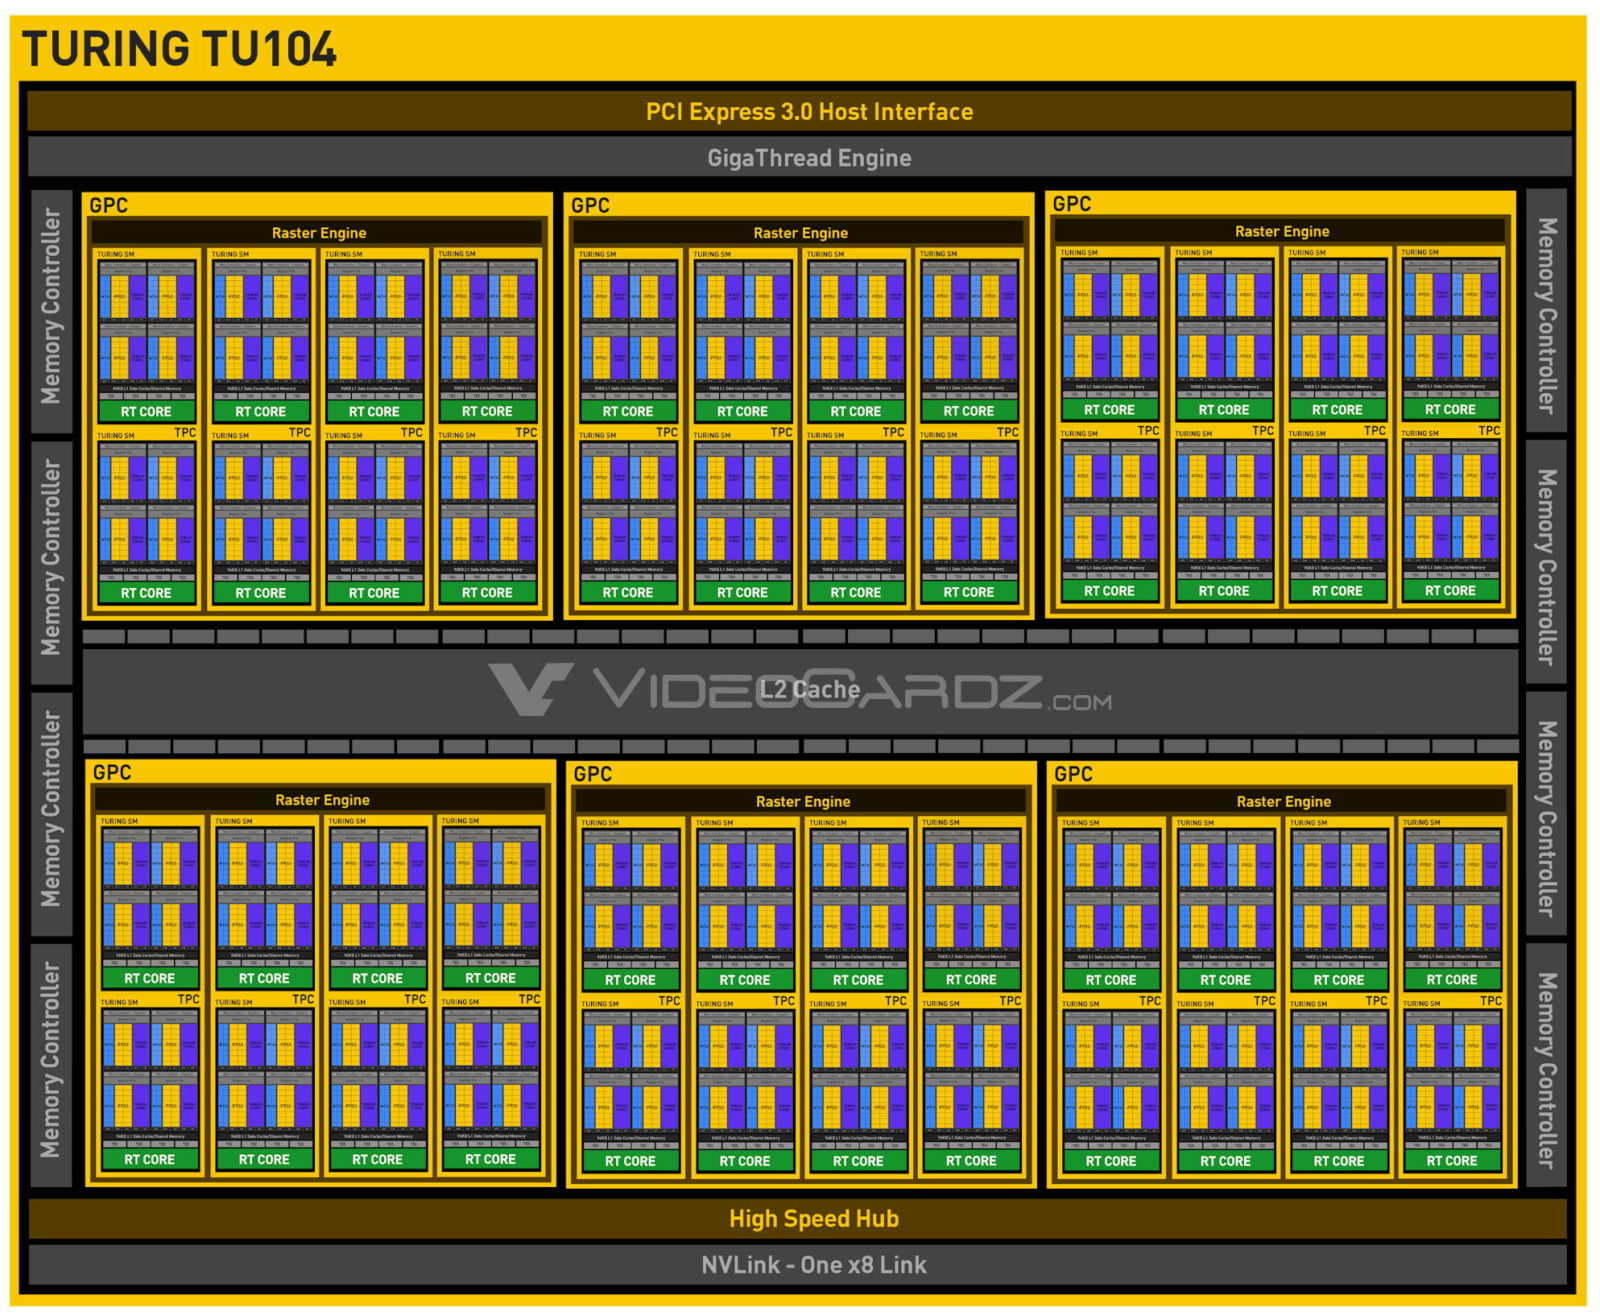
Der TU104-Chip wird in 12nm gefertigt und bietet eine Reihe neuer Features, wie DLSS (Deep Learning Super Sampling) und Real Time Ray Tracing. Dadurch lassen sich vor allem Beleuchtungseffekte sehr viel realistischer darstellen. Weiterhin gibt es Support für DisplayPort 1.4 (ready), HDMI 2.0b, HDR, Simultaneous Multi-Projection (SMP) sowie H.265 Video De- und Encoding (PlayReady 3.0).
Performance
Die Spieleleistung sollte leicht oberhalb der mobilen RTX 2070 liegen und deutlich unterhalb der normalen RTX 2080. Damit ist sie RTX2080 Max-Q die zweitschnellste mobile Grafikkarte und auch für 4K Gaming geeignet.
NVIDIA GeForce RTX 2080 Ti (Desktop) ► remove from comparison
Die Nvidia GeForce RTX 2080 Ti ist das Topmodell der Consumer Turing-Grafikkarten für Desktop-PCs und wurde im August 2018 vorgestellt. Die GPU verfügt über die 4.352 Shadereinheiten, sowie 11 GB GDDR6-Speicher an einem 352-Bit-Interface (14 GHz, 616 GB/s bei der Founders Edition). Zusätzlich integriert die 2080 Ti 544 Tensor-Kerne und 68 Raytracing-Kerne.
Features
Der TU102-Chip wird in 12nm gefertigt und bietet eine Reihe neuer Features, wie DLSS (Deep Learning Super Sampling) und Real Time Ray Tracing. Dadurch lassen sich vor allem Bleuchtungseffekte sehr viel realistischer darstellen. Weiterhin gibt es Support für DisplayPort 1.4 (ready), HDMI 2.0b, HDR, Simultaneous Multi-Projection (SMP) sowie H.265 Video De- und Encoding (PlayReady 3.0). Im Vollausbau bietet der TU102 4.608 Shader, 576 Tensor Kerne und 72 Raytracing Kerne.
Performance
Die Performance der GeForce RTX 2080 Ti liegt in 4K etwa 27% vor einer RTX 2080 und etwa 35% vor der letzjährigen Geforce GTX 1080 Ti. Damit ordnet sich die RTX 2080 Ti im absoluten High-End-Segment ein und kann die meisten Spiele des Jahres 2018 in hohen Einstellungen und 4K-Auflösung flüssig darstellen.
Leistungsaufnahme
Die Leistungsaufnahme der GeForce RTX 2080 TI wird vom Hersteller mit 250 bzw. 260 (Founders Edition) Watt beziffert und liegt damit auf dem Niveau des Vorgängers GeForce GTX 1080 Ti (250 Watt).
NVIDIA GeForce RTX 2070 Super Mobile ► remove from comparison
Die Nvidia GeForce RTX 2070 Super Mobile (für Laptops) ist nach der mobilen RTX 2080 und 2080 Super die drittschnellste mobile Grafikkarte in 2020. Sie basiert auf die Desktop RTX 2070 Super jedoch werden die Shader wahrscheinlich deutlich niedriger getaktet.
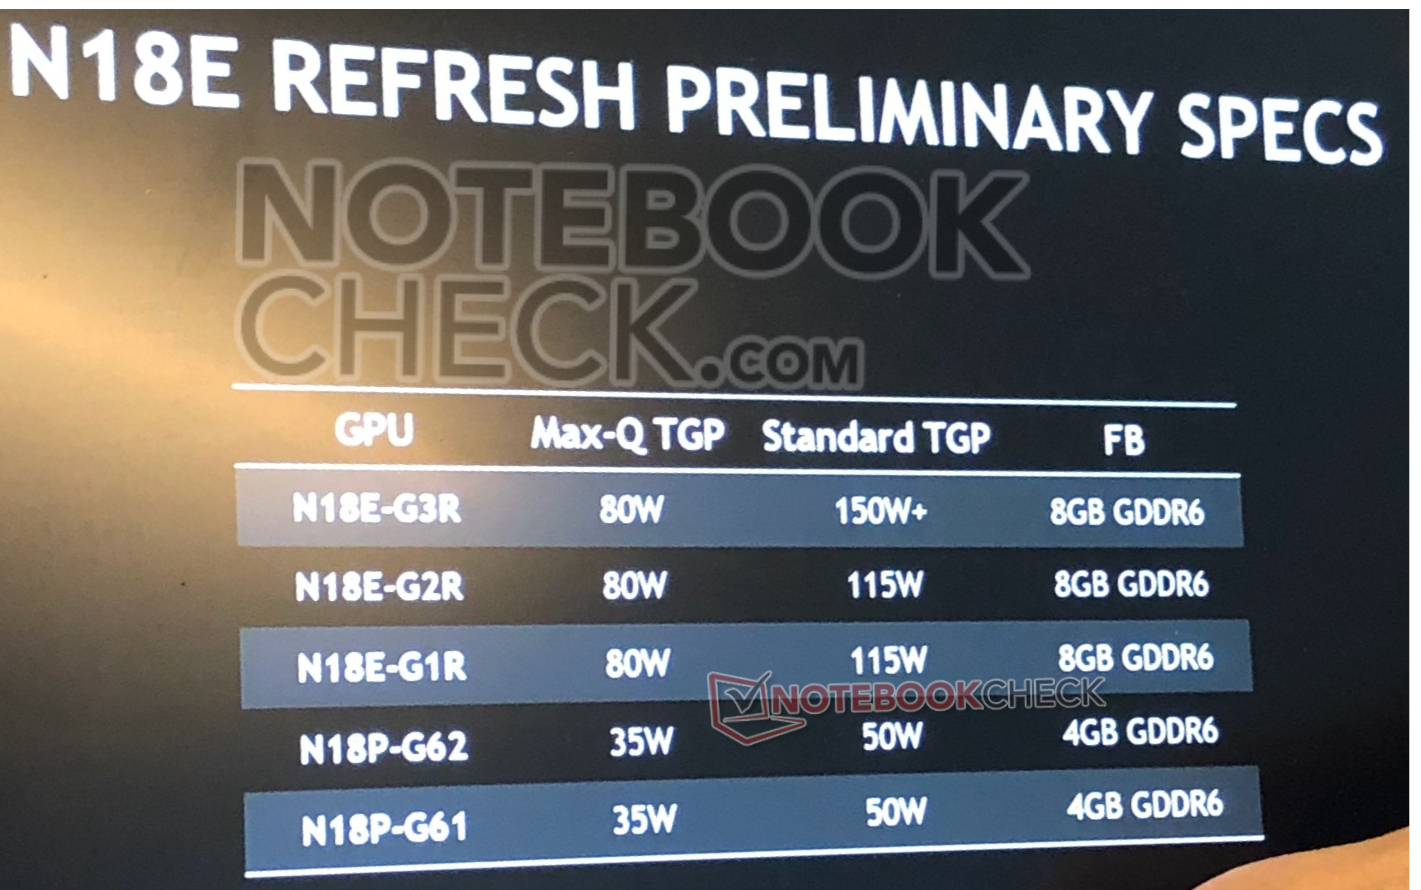
Die GPU trägt den Codenamen N18-G2R (für Refresh) und schafft in ersten Benchmarks eine 10% höhere Leistung als die alte GeForce RTX 2070 Mobile .
Features
Der TU106-Chip wird in 12nm gefertigt und bietet eine Reihe neuer Features, wie DLSS (Deep Learning Super Sampling) und Real Time Ray Tracing. Dadurch lassen sich vor allem Beleuchtungseffekte sehr viel realistischer darstellen. Weiterhin gibt es Support für DisplayPort 1.4 (ready), HDMI 2.0b, HDR, Simultaneous Multi-Projection (SMP) sowie H.265 Video De- und Encoding (PlayReady 3.0).
Performance
Die Performance der mobilen GeForce RTX 2070 Super Mobile sollte etwas unterhalb der Desktop RTX 2070 liegen und in etwa auf dem Niveau der mobilen GTX 1080 . Damit ordnet sich die RTX 2070 Super im absoluten High-End-Segment ein und kann die meisten Spiele des Jahres 2019 in hohen Einstellungen und 4K-Auflösung flüssig darstellen.
Der Stromverbrauch der normalen (Max-P) Notebook-Grafikkarte ist mit 115 Watt von Nvidia spezifiziert und damit 35 Watt höher als bei der Max-Q Version.
NVIDIA GeForce RTX 2080 Max-Q NVIDIA GeForce RTX 2080 Ti (Desktop) NVIDIA GeForce RTX 2070 Super Mobile GeForce RTX 2000 Serie Codename N18E-G3-A1 MAX-Q TU104 Turing TU102 N18E-G2R Architektur Turing Turing Turing Pipelines 2944 - unified 4352 - unified 2560 - unified Kerntakt 735-990 - 1095-1230 (Boost) MHz 1350 - 1545 (Boost) MHz 1140 - 1380 (Boost) MHz Speichertakt 12000 MHz 14000 MHz 14002 MHz Speicherbandbreite 256 Bit 352 Bit 256 Bit Speichertyp GDDR6 GDDR6 GDDR6 Max. Speichergröße 8 GB 11 GB 8 GB Shared Memory nein nein nein API DirectX 12_1, OpenGL 4.6 DirectX 12_1, Shader 6.4, OpenGL 4.6 DirectX 12_1, OpenGL 4.6 Stromverbrauch 80-90 Watt 270 Watt 115 Watt Transistors 13.6 Billion 18.6 Billion Herstellungsprozess 12 nm 12 nm 12 nm Features NVLink, DLSS, Raytraycing, VR Ready, G-SYNC, Vulkan, Multi Monitor, 650 Watt system power recommended NVLink, DLSS, Raytraycing, VR Ready, G-SYNC, Vulkan, Multi Monitor, 650 Watt system power recommended DLSS, Raytraycing, VR Ready, G-SYNC, Vulkan, Multi Monitor, 550 Watt system power recommended Notebookgröße groß (17" z.B.) groß (17" z.B.) Erscheinungsdatum 06.01.2019 27.08.2018 02.04.2020
Benchmarks Performance Rating - 3DMark 11 + Fire Strike + Time Spy - GeForce RTX 2080 Max-Q
9.4 pt (28%)
...
NVIDIA GeForce RTX 2080 Max-Q
...
max:
Performance Rating - 3DMark 11 + Fire Strike + Time Spy - GeForce RTX 2080 Ti (Desktop)
15.6 pt (47%)
...
NVIDIA GeForce RTX 2080 Ti (Desktop)
max:
3DMark - 3DMark Time Spy Score
min: 6399 avg: 7609 median: 7484 (22%) max: 8604 Points
min: 11836 avg: 13233 median: 13518.5 (39%) max: 14057 Points
min: 7943 avg: 8292 median: 8315.5 (24%) max: 8602 Points
GPU TDP ? TDP 113 W TDP 115 W 100% 95% 98%
3DMark - 3DMark Time Spy Graphics
min: 6464 avg: 7903 median: 7923 (21%) max: 8844 Points
min: 13744 avg: 14283 median: 14370.5 (38%) max: 14645 Points
min: 7840 avg: 8238 median: 8272 (22%) max: 8657 Points
GPU TDP ? TDP 113 W TDP 115 W 100% 94% 94%
3DMark - 3DMark Ice Storm Unlimited Graphics
min: 364184 avg: 413236 median: 425550 (48%) max: 444648 Points
min: 515199 avg: 520779 median: 521458 (59%) max: 524999 Points
min: 446705 avg: 471516 median: 481195 (55%) max: 486649 Points
GPU TDP ? TDP 113 W TDP 115 W 94% 99% 100%
3DMark - 3DMark Ice Storm Extreme Graphics
min: 166342 avg: 280059 median: 342495 (44%) max: 377016 Points
min: 383142 avg: 408099 median: 406064 (52%) max: 435092 Points
3DMark - 3DMark Cloud Gate Score
min: 25513 avg: 35405 median: 34287 (37%) max: 50705 Points
min: 38321 avg: 53070 median: 56080.5 (60%) max: 61796 Points
min: 39220 avg: 45009 median: 46745 (50%) max: 50766 Points
GPU TDP ? TDP 113 W TDP 115 W 100% 97% 99%
3DMark - 3DMark Cloud Gate Graphics
min: 38256 avg: 111063 median: 117764 (31%) max: 129506 Points
min: 157746 avg: 167720 median: 165122 (43%) max: 182888 Points
min: 75986 avg: 121959 median: 126287 (33%) max: 141778 Points
GPU TDP ? TDP 113 W TDP 115 W 100% 100% 61%
3DMark - 3DMark Fire Strike Standard Score
min: 15962 avg: 17836 median: 17504 (31%) max: 22184 Points
min: 23710 avg: 25752 median: 26227 (46%) max: 26845 Points
min: 14771 avg: 18634 median: 18919.5 (33%) max: 19884 Points
GPU TDP ? TDP 113 W TDP 115 W 100% 96% 87%
3DMark - 3DMark Fire Strike Standard Graphics
min: 18048 avg: 20658 median: 20703 (23%) max: 23032 Points
min: 32081 avg: 34141 median: 34316 (39%) max: 35851 Points
min: 18662 avg: 21824 median: 22016 (25%) max: 23042 Points
GPU TDP ? TDP 113 W TDP 115 W 100% 94% 88%
3DMark - 3DMark Ice Storm Graphics
min: 69036 avg: 274353 median: 300340 (36%) max: 419228 Points
min: 419359 avg: 444997 median: 442488 (53%) max: 473144 Points
3DMark - 3DMark Wild Life Unlimited
51350 Points (26%)
3DMark - 3DMark Night Raid
39960 Points (38%)
min: 55026 avg: 57757 median: 56160 (53%) max: 62085 Points
3DMark - 3DMark Night Raid Graphics Score
90166 Points (35%)
min: 116953 avg: 125634 median: 124524 (48%) max: 135426 Points
3DMark 11 - 3DM11 Performance Score
min: 19220 avg: 21052 median: 21067 (29%) max: 23774 Points
min: 32762 avg: 33611 median: 33327 (46%) max: 35027 Points
min: 20961 avg: 23775 median: 24028.5 (33%) max: 25360 Points
GPU TDP ? TDP 113 W TDP 115 W 97% 87% 100%
3DMark 11 - 3DM11 Performance GPU
min: 23386 avg: 27852 median: 27973 (24%) max: 30910 Points
min: 43576 avg: 46934 median: 47166 (41%) max: 49828 Points
min: 28207 avg: 29416 median: 29092.5 (25%) max: 31050 Points
GPU TDP ? TDP 113 W TDP 115 W 100% 94% 93%
3DMark Vantage + NVIDIA GeForce RTX 2080 Max-Q 3DMark Vantage - 3DM Vant. Perf. total
51930 Points (15%)
3DM Vant. Perf. total + NVIDIA GeForce RTX 2080 Ti (Desktop)
min: 82093 avg: 83625 median: 83556 (24%) max: 85226 Points
3DM Vant. Perf. total + NVIDIA GeForce RTX 2070 Super Mobile
70601 Points (20%)
3DM Vant. Perf. GPU no PhysX + NVIDIA GeForce RTX 2080 Max-Q 3DMark Vantage - 3DM Vant. Perf. GPU no PhysX
60439 Points (34%)
3DM Vant. Perf. GPU no PhysX + NVIDIA GeForce RTX 2080 Ti (Desktop)
min: 88551 avg: 90060 median: 90616 (51%) max: 91013 Points
3DM Vant. Perf. GPU no PhysX + NVIDIA GeForce RTX 2070 Super Mobile
75429 Points (43%)
3DMark 05 - 3DMark 05 - Standard
min: 42923 avg: 49414 median: 52639 (58%) max: 52681 Points
3DMark 06 3DMark 06 - Standard 1280x1024 + NVIDIA GeForce RTX 2080 Max-Q
min: 36228 avg: 37369 median: 37613 (50%) max: 38435 Points
3DMark 06 - Standard 1280x1024 + NVIDIA GeForce RTX 2080 Ti (Desktop)
min: 44434 avg: 45455 median: 44825 (59%) max: 47106 Points
3DMark 06 - Standard 1280x1024 + NVIDIA GeForce RTX 2070 Super Mobile
43041 Points (57%)
Unigine Valley 1.0 - Unigine Valley 1.0 DX
min: 159.4 avg: 162.2 median: 163 (53%) max: 164.1 fps
SPECviewperf 12 + NVIDIA GeForce RTX 2080 Max-Q SPECviewperf 12 - specvp12 sw-03
69.5 fps (17%)
specvp12 sw-03 + NVIDIA GeForce RTX 2080 Ti (Desktop)
min: 78.4 avg: 80.5 median: 79.3 (20%) max: 83.7 fps
specvp12 snx-02 + NVIDIA GeForce RTX 2080 Max-Q SPECviewperf 12 - specvp12 snx-02
11.4 fps (2%)
specvp12 snx-02 + NVIDIA GeForce RTX 2080 Ti (Desktop)
min: 12.16 avg: 12.4 median: 12.4 (2%) max: 12.72 fps
specvp12 showcase-01 + NVIDIA GeForce RTX 2080 Max-Q SPECviewperf 12 - specvp12 showcase-01
95.6 fps (21%)
specvp12 showcase-01 + NVIDIA GeForce RTX 2080 Ti (Desktop)
min: 175.6 avg: 179 median: 179.2 (39%) max: 182.3 fps
specvp12 mediacal-01 + NVIDIA GeForce RTX 2080 Max-Q SPECviewperf 12 - specvp12 mediacal-01
39.7 fps (10%)
specvp12 mediacal-01 + NVIDIA GeForce RTX 2080 Ti (Desktop)
min: 48.61 avg: 52.1 median: 51.1 (13%) max: 56.6 fps
specvp12 maya-04 + NVIDIA GeForce RTX 2080 Max-Q SPECviewperf 12 - specvp12 maya-04
153.4 fps (42%)
specvp12 maya-04 + NVIDIA GeForce RTX 2080 Ti (Desktop)
min: 177.8 avg: 183.2 median: 180.8 (49%) max: 190.9 fps
specvp12 energy-01 + NVIDIA GeForce RTX 2080 Max-Q SPECviewperf 12 - specvp12 energy-01
8.9 fps (8%)
specvp12 energy-01 + NVIDIA GeForce RTX 2080 Ti (Desktop)
min: 15.86 avg: 16.4 median: 16.7 (15%) max: 16.72 fps
specvp12 creo-01 + NVIDIA GeForce RTX 2080 Max-Q SPECviewperf 12 - specvp12 creo-01
52.2 fps (21%)
specvp12 creo-01 + NVIDIA GeForce RTX 2080 Ti (Desktop)
min: 63.1 avg: 66.2 median: 63.3 (25%) max: 72.2 fps
specvp12 catia-04 + NVIDIA GeForce RTX 2080 Max-Q SPECviewperf 12 - specvp12 catia-04
90.2 fps (15%)
specvp12 catia-04 + NVIDIA GeForce RTX 2080 Ti (Desktop)
min: 118.5 avg: 120 median: 120.6 (20%) max: 120.8 fps
specvp12 3dsmax-05 + NVIDIA GeForce RTX 2080 Max-Q SPECviewperf 12 - specvp12 3dsmax-05
174.7 fps (31%)
specvp12 3dsmax-05 + NVIDIA GeForce RTX 2080 Ti (Desktop)
min: 258.1 avg: 267.5 median: 271.8 (48%) max: 272.7 fps
SPECviewperf 13 specvp13 sw-04 + NVIDIA GeForce RTX 2080 Max-Q SPECviewperf 13 - specvp13 sw-04
89.3 fps (24%)
specvp13 sw-04 + NVIDIA GeForce RTX 2080 Ti (Desktop)
min: 111.8 avg: 113.8 median: 113.2 (30%) max: 116.3 fps
specvp13 sw-04 + NVIDIA GeForce RTX 2070 Super Mobile
91.2 fps (24%)
specvp13 snx-03 + NVIDIA GeForce RTX 2080 Max-Q SPECviewperf 13 - specvp13 snx-03
20.3 fps (2%)
specvp13 snx-03 + NVIDIA GeForce RTX 2080 Ti (Desktop)
min: 21.99 avg: 22.5 median: 22.5 (2%) max: 23.03 fps
specvp13 snx-03 + NVIDIA GeForce RTX 2070 Super Mobile
20.1 fps (2%)
specvp13 showcase-02 + NVIDIA GeForce RTX 2080 Max-Q SPECviewperf 13 - specvp13 showcase-02
95.5 fps (21%)
specvp13 showcase-02 + NVIDIA GeForce RTX 2080 Ti (Desktop)
min: 179.5 avg: 180.8 median: 180.4 (39%) max: 182.6 fps
specvp13 showcase-02 + NVIDIA GeForce RTX 2070 Super Mobile
112.1 fps (24%)
specvp13 medical-02 + NVIDIA GeForce RTX 2080 Max-Q SPECviewperf 13 - specvp13 medical-02
55.9 fps (12%)
specvp13 medical-02 + NVIDIA GeForce RTX 2080 Ti (Desktop)
min: 82.1 avg: 84 median: 84.8 (18%) max: 85 fps
specvp13 medical-02 + NVIDIA GeForce RTX 2070 Super Mobile
56.3 fps (12%)
specvp13 maya-05 + NVIDIA GeForce RTX 2080 Max-Q SPECviewperf 13 - specvp13 maya-05
256 fps (29%)
specvp13 maya-05 + NVIDIA GeForce RTX 2080 Ti (Desktop)
min: 386.6 avg: 393.6 median: 392.1 (45%) max: 402 fps
specvp13 maya-05 + NVIDIA GeForce RTX 2070 Super Mobile
225 fps (26%)
specvp13 energy-02 + NVIDIA GeForce RTX 2080 Max-Q SPECviewperf 13 - specvp13 energy-02
16 fps (5%)
specvp13 energy-02 + NVIDIA GeForce RTX 2080 Ti (Desktop)
min: 31.52 avg: 32.1 median: 31.9 (10%) max: 32.91 fps
specvp13 energy-02 + NVIDIA GeForce RTX 2070 Super Mobile
21.6 fps (7%)
specvp13 creo-02 + NVIDIA GeForce RTX 2080 Max-Q SPECviewperf 13 - specvp13 creo-02
177.1 fps (26%)
specvp13 creo-02 + NVIDIA GeForce RTX 2080 Ti (Desktop)
min: 286.1 avg: 287.9 median: 286.5 (42%) max: 291.1 fps
specvp13 creo-02 + NVIDIA GeForce RTX 2070 Super Mobile
177.5 fps (26%)
specvp13 catia-05 + NVIDIA GeForce RTX 2080 Max-Q SPECviewperf 13 - specvp13 catia-05
128 fps (14%)
specvp13 catia-05 + NVIDIA GeForce RTX 2080 Ti (Desktop)
min: 177.3 avg: 178.8 median: 178.8 (20%) max: 180.3 fps
specvp13 catia-05 + NVIDIA GeForce RTX 2070 Super Mobile
137.6 fps (15%)
specvp13 3dsmax-06 + NVIDIA GeForce RTX 2080 Max-Q SPECviewperf 13 - specvp13 3dsmax-06
176.5 fps (31%)
specvp13 3dsmax-06 + NVIDIA GeForce RTX 2080 Ti (Desktop)
min: 265.9 avg: 269.2 median: 269.4 (47%) max: 272.4 fps
specvp13 3dsmax-06 + NVIDIA GeForce RTX 2070 Super Mobile
188.7 fps (33%)
Cinebench R10 Cinebench R10 Shading (32bit) + NVIDIA GeForce RTX 2080 Max-Q Cinebench R10 - Cinebench R10 Shading (32bit)
min: 6820 avg: 9275 median: 8197.5 (6%) max: 13884 Points
Cinebench R10 Shading (32bit) + NVIDIA GeForce RTX 2080 Ti (Desktop)
6829 Points (5%)
Cinebench R11.5 Cinebench R11.5 OpenGL 64 Bit + NVIDIA GeForce RTX 2080 Max-Q Cinebench R11.5 - Cinebench R11.5 OpenGL 64 Bit
min: 73.1 avg: 77.2 median: 78.4 (27%) max: 80 fps
Cinebench R11.5 OpenGL 64 Bit + NVIDIA GeForce RTX 2080 Ti (Desktop)
95.5 fps (33%)
Cinebench R15 + NVIDIA GeForce RTX 2080 Max-Q Cinebench R15 - Cinebench R15 OpenGL 64 Bit
min: 107.8 avg: 120.4 median: 119.7 (7%) max: 138.6 fps
Cinebench R15 OpenGL 64 Bit + NVIDIA GeForce RTX 2080 Ti (Desktop)
160.9 fps (9%)
Cinebench R15 OpenGL 64 Bit + NVIDIA GeForce RTX 2070 Super Mobile
min: 130 avg: 141 median: 142.1 (8%) max: 154 fps
GPU TDP ? TDP 113 W TDP 115 W 84% 96% 100%
Cinebench R15 OpenGL Ref. Match 64 Bit + NVIDIA GeForce RTX 2080 Max-Q Cinebench R15 - Cinebench R15 OpenGL Ref. Match 64 Bit
99.6 % (100%)
Cinebench R15 OpenGL Ref. Match 64 Bit + NVIDIA GeForce RTX 2080 Ti (Desktop)
99.6 % (100%)
Cinebench R15 OpenGL Ref. Match 64 Bit + NVIDIA GeForce RTX 2070 Super Mobile
99.6 % (100%)
GPU TDP ? TDP 113 W TDP 115 W 100% 100% 100%
GFXBench - GFXBench Car Chase Offscreen
326 fps (37%)
402.6 fps (45%)
LuxMark v2.0 64Bit - LuxMark v2.0 Room GPU
2006 Samples/s (9%)
min: 4425 avg: 4449 median: 4429 (20%) max: 4494 Samples/s
LuxMark v2.0 64Bit - LuxMark v2.0 Sala GPU
5110 Samples/s (9%)
min: 9999 avg: 10156 median: 10178 (18%) max: 10291 Samples/s
ComputeMark v2.1 - ComputeMark v2.1 Result
14673 Points (16%)
min: 26510 avg: 27567 median: 28047 (30%) max: 28145 Points
15586 Points (17%)
Power Consumption - Furmark Stress Test Power Consumption - external Monitor *
129 Watt (18%)
min: 330.4 avg: 390.1 median: 400.8 (57%) max: 439.1 Watt
175 Watt (25%)
GPU TDP ? TDP 115 W 100% 140%
Power Consumption - The Witcher 3 Power Consumption - external Monitor *
131 Watt (18%)
min: 359 avg: 421.5 median: 438.8 (61%) max: 466.7 Watt
Power Consumption - Witcher 3 Power Consumption *
min: 130 avg: 161.4 median: 161 (35%) max: 185.8 Watt
min: 175 avg: 190.3 median: 190.5 (42%) max: 201 Watt
GPU TDP ? TDP 113 W 107% 100%
Power Consumption - Witcher 3 ultra Power Efficiency
min: 0.4198 avg: 0.5 median: 0.5 (48%) max: 0.534 fps per Watt
min: 0.4264 avg: 0.4 median: 0.4 (44%) max: 0.472 fps per Watt
GPU TDP ? TDP 113 W 100% 99%
Power Consumption - Witcher 3 ultra Power Efficiency - external Monitor
0.6 fps per Watt (50%)
min: 0.2914 avg: 0.3 median: 0.3 (25%) max: 0.3649 fps per Watt
Emissions Witcher 3 Fan Noise + NVIDIA GeForce RTX 2080 Max-Q Emissions - Witcher 3 Fan Noise
min: 40.5 avg: 48 median: 48 (77%) max: 56.6 dB(A)
Witcher 3 Fan Noise + NVIDIA GeForce RTX 2070 Super Mobile
min: 50 avg: 53.4 median: 54 (86%) max: 57.5 dB(A)
GPU TDP ? TDP 113 W 99% 100%
Clock Speed - GPU Clock Witcher 3 ultra
min: 915 avg: 1241 median: 1260 (49%) max: 1455 MHz
min: 1425 avg: 1479 median: 1455 (57%) max: 1560 MHz
GPU TDP ? TDP 113 W 87% 100%
Clock Speed - GPU Clock Speed Furmark
1003 MHz (40%)
1473 MHz (58%)
1148 MHz (45%)
GPU TDP ? TDP 115 W 100% 93%
Average Benchmarks NVIDIA GeForce RTX 2080 Max-Q → 100% n=25 Average Benchmarks NVIDIA GeForce RTX 2080 Ti (Desktop) → 153% n=25 Average Benchmarks NVIDIA GeForce RTX 2070 Super Mobile → 111% n=25
- Bereich der Benchmarkergebnisse für diese Grafikkarte
- Durchschnittliche Benchmarkergebnisse für diese Grafikkarte
* Smaller numbers mean a higher performance
1 This benchmark is not used for the average calculation
Spiele-Benchmarks Die folgenden Benchmarks basieren auf unseren Spieletests mit Testnotebooks. Die Performance dieser Grafikkarte bei den gelisteten Spielen ist abhängig von der verwendeten CPU, Speicherausstattung, Treiber und auch Betriebssystem. Dadurch müssen die untenstehenden Werte nicht repräsentativ sein. Detaillierte Informationen über das verwendete System sehen Sie nach einem Klick auf den fps-Wert.
GeForce RTX 2080 Ti (Desktop):
254 [X] MSI GeForce RTX 2080 Ti Intel Core i9-9900K 3.6GHz
GeForce RTX 2080 Ti (Desktop)
min:
183 fps
fps
GeForce RTX 2080 Ti (Desktop):
237 [X] MSI GeForce RTX 2080 Ti Intel Core i9-9900K 3.6GHz
GeForce RTX 2080 Ti (Desktop)
min:
180 fps
fps
GeForce RTX 2080 Ti (Desktop):
147 [X] MSI GeForce RTX 2080 Ti Intel Core i9-9900K 3.6GHz
GeForce RTX 2080 Ti (Desktop)
min:
120 fps
fps
GeForce RTX 2080 Ti (Desktop):
119 [X] MSI GeForce RTX 2080 Ti Intel Core i9-9900K 3.6GHz
GeForce RTX 2080 Ti (Desktop)
min:
103 fps
fps
GeForce RTX 2080 Ti (Desktop):
68 [X] MSI GeForce RTX 2080 Ti Intel Core i9-9900K 3.6GHz
GeForce RTX 2080 Ti (Desktop)
min:
59 fps
fps
GeForce RTX 2080 Ti (Desktop):
163 [X] MSI GeForce RTX 2080 Ti Intel Core i9-9900K 3.6GHz
GeForce RTX 2080 Ti (Desktop)
min:
35.4 fps, P0.1:
56.8 fps, P1:
92.7 fps, max:
257 fps
fps
GeForce RTX 2080 Ti (Desktop):
158 [X] MSI GeForce RTX 2080 Ti Intel Core i9-9900K 3.6GHz
GeForce RTX 2080 Ti (Desktop)
min:
34.9 fps, P0.1:
56.2 fps, P1:
91.4 fps, max:
261 fps
fps
GeForce RTX 2080 Ti (Desktop):
135 [X] MSI GeForce RTX 2080 Ti Intel Core i9-9900K 3.6GHz
GeForce RTX 2080 Ti (Desktop)
min:
37.6 fps, P0.1:
52.5 fps, P1:
85.4 fps, max:
232 fps
fps
GeForce RTX 2080 Ti (Desktop):
105 [X] MSI GeForce RTX 2080 Ti Intel Core i9-9900K 3.6GHz
GeForce RTX 2080 Ti (Desktop)
min:
40.6 fps, P0.1:
46.3 fps, P1:
72 fps, max:
210 fps
fps
GeForce RTX 2080 Ti (Desktop):
63.9 [X] MSI GeForce RTX 2080 Ti Intel Core i9-9900K 3.6GHz
GeForce RTX 2080 Ti (Desktop)
min:
32.8 fps, P0.1:
36.6 fps, P1:
45.4 fps, max:
151 fps
fps
GeForce RTX 2080 Ti (Desktop):
132 [X] MSI GeForce RTX 2080 Ti Intel Core i9-9900K 3.6GHz
GeForce RTX 2080 Ti (Desktop)
min:
23.3 fps, P0.1:
51.2 fps, P1:
72 fps, max:
360 fps
fps
GeForce RTX 2080 Ti (Desktop):
126 [X] MSI GeForce RTX 2080 Ti Intel Core i9-9900K 3.6GHz
GeForce RTX 2080 Ti (Desktop)
min:
26.7 fps, P0.1:
45.8 fps, P1:
69.9 fps, max:
347 fps
fps
GeForce RTX 2080 Ti (Desktop):
125 [X] MSI GeForce RTX 2080 Ti Intel Core i9-9900K 3.6GHz
GeForce RTX 2080 Ti (Desktop)
min:
20.6 fps, P0.1:
48 fps, P1:
68.8 fps, max:
350 fps
fps
GeForce RTX 2080 Ti (Desktop):
115 [X] MSI GeForce RTX 2080 Ti Intel Core i9-9900K 3.6GHz
GeForce RTX 2080 Ti (Desktop)
min:
23.9 fps, P0.1:
42.9 fps, P1:
67.6 fps, max:
319 fps
fps
GeForce RTX 2080 Ti (Desktop):
183 [X] MSI GeForce RTX 2080 Ti Intel Core i9-9900K 3.6GHz
GeForce RTX 2080 Ti (Desktop)
min:
71.3 fps, P0.1:
122 fps, P1:
136 fps, max:
242 fps
fps
GeForce RTX 2080 Ti (Desktop):
181 [X] MSI GeForce RTX 2080 Ti Intel Core i9-9900K 3.6GHz
GeForce RTX 2080 Ti (Desktop)
min:
116 fps, P0.1:
125 fps, P1:
141 fps, max:
230 fps
fps
GeForce RTX 2080 Ti (Desktop):
181 [X] MSI GeForce RTX 2080 Ti Intel Core i9-9900K 3.6GHz
GeForce RTX 2080 Ti (Desktop)
min:
50.3 fps, P0.1:
121 fps, P1:
140 fps, max:
233 fps
fps
GeForce RTX 2080 Ti (Desktop):
147 [X] MSI GeForce RTX 2080 Ti Intel Core i9-9900K 3.6GHz
GeForce RTX 2080 Ti (Desktop)
min:
37.5 fps, P0.1:
117 fps, P1:
123 fps, max:
197 fps
fps
GeForce RTX 2080 Ti (Desktop):
74.3 [X] MSI GeForce RTX 2080 Ti Intel Core i9-9900K 3.6GHz
GeForce RTX 2080 Ti (Desktop)
min:
32.1 fps, P0.1:
34 fps, P1:
38.9 fps, max:
106 fps
fps
GeForce RTX 2080 Ti (Desktop):
135 [X] MSI GeForce RTX 2080 Ti Intel Core i9-9900K 3.6GHz
GeForce RTX 2080 Ti (Desktop)
min:
39.1 fps, P0.1:
44.9 fps, P1:
62 fps, max:
224 fps
fps
GeForce RTX 2080 Ti (Desktop):
135 [X] MSI GeForce RTX 2080 Ti Intel Core i9-9900K 3.6GHz
GeForce RTX 2080 Ti (Desktop)
min:
34.4 fps, P0.1:
49.8 fps, P1:
60.7 fps, max:
218 fps
fps
GeForce RTX 2080 Ti (Desktop):
132 [X] MSI GeForce RTX 2080 Ti Intel Core i9-9900K 3.6GHz
GeForce RTX 2080 Ti (Desktop)
min:
31.6 fps, P0.1:
39.9 fps, P1:
60.7 fps, max:
243 fps
fps
GeForce RTX 2080 Ti (Desktop):
114 [X] MSI GeForce RTX 2080 Ti Intel Core i9-9900K 3.6GHz
GeForce RTX 2080 Ti (Desktop)
min:
41.2 fps, P0.1:
45.2 fps, P1:
56 fps, max:
213 fps
fps
GeForce RTX 2080 Ti (Desktop):
61.8 [X] MSI GeForce RTX 2080 Ti Intel Core i9-9900K 3.6GHz
GeForce RTX 2080 Ti (Desktop)
min:
31.9 fps, P0.1:
34.9 fps, P1:
43 fps, max:
113 fps
fps
GeForce RTX 2080 Ti (Desktop):
171 [X] MSI GeForce RTX 2080 Ti Intel Core i9-9900K 3.6GHz
GeForce RTX 2080 Ti (Desktop)
min:
91 fps
fps
GeForce RTX 2080 Ti (Desktop):
164 [X] MSI GeForce RTX 2080 Ti Intel Core i9-9900K 3.6GHz
GeForce RTX 2080 Ti (Desktop)
min:
83 fps
fps
GeForce RTX 2080 Ti (Desktop):
162 [X] MSI GeForce RTX 2080 Ti Intel Core i9-9900K 3.6GHz
GeForce RTX 2080 Ti (Desktop)
min:
81 fps
fps
GeForce RTX 2080 Ti (Desktop):
147 [X] MSI GeForce RTX 2080 Ti Intel Core i9-9900K 3.6GHz
GeForce RTX 2080 Ti (Desktop)
min:
55 fps
fps
GeForce RTX 2080 Ti (Desktop):
85.2 [X] MSI GeForce RTX 2080 Ti Intel Core i9-9900K 3.6GHz
GeForce RTX 2080 Ti (Desktop)
min:
52 fps
fps
GeForce RTX 2080 Ti (Desktop):
114 [X] MSI GeForce RTX 2080 Ti Intel Core i9-9900K 3.6GHz
GeForce RTX 2080 Ti (Desktop)
min:
20.2 fps, P0.1:
67 fps, P1:
80.3 fps, max:
180 fps
fps
GeForce RTX 2080 Ti (Desktop):
107 [X] MSI GeForce RTX 2080 Ti Intel Core i9-9900K 3.6GHz
GeForce RTX 2080 Ti (Desktop)
min:
19.2 fps, P0.1:
63.9 fps, P1:
77.6 fps, max:
166 fps
fps
GeForce RTX 2080 Ti (Desktop):
95.4 [X] MSI GeForce RTX 2080 Ti Intel Core i9-9900K 3.6GHz
GeForce RTX 2080 Ti (Desktop)
min:
19.7 fps, P0.1:
57.9 fps, P1:
72.2 fps, max:
133 fps
fps
GeForce RTX 2080 Ti (Desktop):
64 [X] MSI GeForce RTX 2080 Ti Intel Core i9-9900K 3.6GHz
GeForce RTX 2080 Ti (Desktop)
min:
20 fps, P0.1:
48.8 fps, P1:
55.3 fps, max:
95.2 fps
fps
GeForce RTX 2080 Ti (Desktop):
32.2 [X] MSI GeForce RTX 2080 Ti Intel Core i9-9900K 3.6GHz
GeForce RTX 2080 Ti (Desktop)
min:
18.4 fps, P0.1:
26.1 fps, P1:
29 fps, max:
76.3 fps
fps
GeForce RTX 2080 Ti (Desktop):
113 [X] MSI GeForce RTX 2080 Ti Intel Core i9-9900K 3.6GHz
GeForce RTX 2080 Ti (Desktop)
min:
37 fps
fps
GeForce RTX 2080 Ti (Desktop):
102 [X] MSI GeForce RTX 2080 Ti Intel Core i9-9900K 3.6GHz
GeForce RTX 2080 Ti (Desktop)
min:
37 fps
fps
GeForce RTX 2080 Ti (Desktop):
93 [X] MSI GeForce RTX 2080 Ti Intel Core i9-9900K 3.6GHz
GeForce RTX 2080 Ti (Desktop)
min:
44 fps
fps
GeForce RTX 2080 Ti (Desktop):
81 [X] MSI GeForce RTX 2080 Ti Intel Core i9-9900K 3.6GHz
GeForce RTX 2080 Ti (Desktop)
min:
40 fps
fps
GeForce RTX 2080 Ti (Desktop):
59 [X] MSI GeForce RTX 2080 Ti Intel Core i9-9900K 3.6GHz
GeForce RTX 2080 Ti (Desktop)
min:
33 fps
fps
GeForce RTX 2070 Super Mobile:
156 fps
GeForce RTX 2080 Ti (Desktop):
161 [X] MSI GeForce RTX 2080 Ti Intel Core i9-9900K 3.6GHz
GeForce RTX 2080 Ti (Desktop)
min:
36 fps, P0.1:
90 fps, P1:
106 fps, max:
194 fps
fps
GeForce RTX 2070 Super Mobile:
105.4 fps
GeForce RTX 2080 Ti (Desktop):
156 [X] MSI GeForce RTX 2080 Ti Intel Core i9-9900K 3.6GHz
GeForce RTX 2080 Ti (Desktop)
min:
47.3 fps, P0.1:
85.4 fps, P1:
103 fps, max:
198 fps
fps
GeForce RTX 2070 Super Mobile:
104.1 fps
GeForce RTX 2080 Ti (Desktop):
139 [X] MSI GeForce RTX 2080 Ti Intel Core i9-9900K 3.6GHz
GeForce RTX 2080 Ti (Desktop)
min:
72.6 fps, P0.1:
84.9 fps, P1:
96.8 fps, max:
180 fps
fps
GeForce RTX 2070 Super Mobile:
92.2 fps
GeForce RTX 2080 Ti (Desktop):
100 [X] MSI GeForce RTX 2080 Ti Intel Core i9-9900K 3.6GHz
GeForce RTX 2080 Ti (Desktop)
min:
31.6 fps, P0.1:
51.5 fps, P1:
60.1 fps, max:
168 fps
fps
GeForce RTX 2070 Super Mobile:
61 fps
GeForce RTX 2080 Ti (Desktop):
53.8 [X] MSI GeForce RTX 2080 Ti Intel Core i9-9900K 3.6GHz
GeForce RTX 2080 Ti (Desktop)
min:
18.1 fps, P0.1:
33.8 fps, P1:
38.4 fps, max:
129 fps
fps
GeForce RTX 2070 Super Mobile:
31.4 fps
GeForce RTX 2070 Super Mobile:
191 fps
GeForce RTX 2080 Ti (Desktop):
155 [X] MSI GeForce RTX 2080 Ti Intel Core i9-9900K 3.6GHz
GeForce RTX 2080 Ti (Desktop)
min:
61.5 fps, P0.1:
91.4 fps, P1:
111 fps, max:
330 fps
fps
GeForce RTX 2070 Super Mobile:
100.5 fps
GeForce RTX 2080 Ti (Desktop):
133 [X] MSI GeForce RTX 2080 Ti Intel Core i9-9900K 3.6GHz
GeForce RTX 2080 Ti (Desktop)
min:
59 fps, P0.1:
80.6 fps, P1:
94.9 fps, max:
292 fps
fps
GeForce RTX 2070 Super Mobile:
93.8 fps
GeForce RTX 2080 Ti (Desktop):
118 [X] MSI GeForce RTX 2080 Ti Intel Core i9-9900K 3.6GHz
GeForce RTX 2080 Ti (Desktop)
min:
58 fps, P0.1:
72.3 fps, P1:
82.2 fps, max:
286 fps
fps
GeForce RTX 2070 Super Mobile:
85.1 fps
GeForce RTX 2080 Ti (Desktop):
89.2 [X] MSI GeForce RTX 2080 Ti Intel Core i9-9900K 3.6GHz
GeForce RTX 2080 Ti (Desktop)
min:
46.4 fps, P0.1:
61.6 fps, P1:
70.5 fps, max:
247 fps
fps
GeForce RTX 2070 Super Mobile:
60.6 fps
GeForce RTX 2080 Ti (Desktop):
54.4 [X] MSI GeForce RTX 2080 Ti Intel Core i9-9900K 3.6GHz
GeForce RTX 2080 Ti (Desktop)
min:
36 fps, P0.1:
39.9 fps, P1:
42 fps, max:
96 fps
fps
GeForce RTX 2070 Super Mobile:
35.3 fps
GeForce RTX 2070 Super Mobile:
122 fps
GeForce RTX 2080 Ti (Desktop):
107 [X] MSI GeForce RTX 2080 Ti Intel Core i9-9900K 3.6GHz
GeForce RTX 2080 Ti (Desktop)
P0.1:
59 fpsP1:
fps
fps
GeForce RTX 2070 Super Mobile:
83 fps
GeForce RTX 2080 Ti (Desktop):
91 [X] MSI GeForce RTX 2080 Ti Intel Core i9-9900K 3.6GHz
GeForce RTX 2080 Ti (Desktop)
P0.1:
49 fpsP1:
fps
fps
GeForce RTX 2070 Super Mobile:
71 fps
GeForce RTX 2080 Ti (Desktop):
80 [X] MSI GeForce RTX 2080 Ti Intel Core i9-9900K 3.6GHz
GeForce RTX 2080 Ti (Desktop)
P0.1:
44 fpsP1:
fps
fps
GeForce RTX 2070 Super Mobile:
60 61 [X] SCHENKER XMG Neo 17 Comet Lake Overboost
Intel Core i7-10875H 2.3GHz
GeForce RTX 2070 Super Mobile
min:
18 fps, P0.1:
29 fps, P1:
42 fps, max:
124 fps
93 [X] SCHENKER Compact 17 Leistungsmodus
Intel Core i7-10875H 2.3GHz
GeForce RTX 2070 Super Mobile
min:
35 fps, P0.1:
40 fps, P1:
60 fps, max:
149 fps
~ 71 fps
GeForce RTX 2080 Ti (Desktop):
67 [X] MSI GeForce RTX 2080 Ti Intel Core i9-9900K 3.6GHz
GeForce RTX 2080 Ti (Desktop)
P0.1:
34 fpsP1:
fps
fps
GeForce RTX 2080 Ti (Desktop):
46 [X] MSI GeForce RTX 2080 Ti Intel Core i9-9900K 3.6GHz
GeForce RTX 2080 Ti (Desktop)
P0.1:
8 fpsP1:
fps
fps
GeForce RTX 2070 Super Mobile:
157 165 [X] SCHENKER Compact 17 Intel Core i7-10875H 2.3GHz
GeForce RTX 2070 Super Mobile
min:
112 fps, P0.1:
123.8 fps, P1:
129.7 fps, max:
233.8 fps
~ 161 fps
GeForce RTX 2080 Ti (Desktop):
134 [X] MSI GeForce RTX 2080 Ti Intel Core i9-9900K 3.6GHz
GeForce RTX 2080 Ti (Desktop)
min:
20.7 fps, P0.1:
93.2 fps, P1:
112.2 fps, max:
161.1 fps
fps
GeForce RTX 2070 Super Mobile:
91 91 95.5 [X] SCHENKER Compact 17 Intel Core i7-10875H 2.3GHz
GeForce RTX 2070 Super Mobile
min:
52.2 fps, P0.1:
65.7 fps, P1:
79.8 fps, max:
128.7 fps
~ 93 fps
GeForce RTX 2080 Ti (Desktop):
112 [X] MSI GeForce RTX 2080 Ti Intel Core i9-9900K 3.6GHz
GeForce RTX 2080 Ti (Desktop)
min:
20.5 fps, P0.1:
87.5 fps, P1:
98.2 fps, max:
146.4 fps
fps
GeForce RTX 2070 Super Mobile:
73.6 78 [X] SCHENKER Compact 17 Intel Core i7-10875H 2.3GHz
GeForce RTX 2070 Super Mobile
min:
52.6 fps, P0.1:
58.3 fps, P1:
66.9 fps, max:
97 fps
~ 76 fps
GeForce RTX 2080 Ti (Desktop):
73.4 [X] MSI GeForce RTX 2080 Ti Intel Core i9-9900K 3.6GHz
GeForce RTX 2080 Ti (Desktop)
min:
19.8 fps, P0.1:
56.9 fps, P1:
62.1 fps, max:
130.6 fps
fps
GeForce RTX 2070 Super Mobile:
45.5 63.8 [X] SCHENKER Compact 17 Intel Core i7-10875H 2.3GHz
GeForce RTX 2070 Super Mobile
min:
40.1 fps, P0.1:
48.9 fps, P1:
53.5 fps, max:
78.2 fps
68.6 [X] SCHENKER Compact 17 Leistungsmodus
Intel Core i7-10875H 2.3GHz
GeForce RTX 2070 Super Mobile
min:
46.8 fps, P0.1:
51.6 fps, P1:
58.2 fps, max:
125.1 fps
~ 59 fps
GeForce RTX 2080 Ti (Desktop):
64.8 [X] MSI GeForce RTX 2080 Ti Intel Core i9-9900K 3.6GHz
GeForce RTX 2080 Ti (Desktop)
min:
19 fps, P0.1:
50.2 fps, P1:
55.2 fps, max:
79.9 fps
fps
GeForce RTX 2070 Super Mobile:
52.3 [X] SCHENKER Compact 17 Intel Core i7-10875H 2.3GHz
GeForce RTX 2070 Super Mobile
min:
36.6 fps, P0.1:
39.1 fps, P1:
44.2 fps, max:
70.7 fps
fps
GeForce RTX 2080 Ti (Desktop):
50 [X] MSI GeForce RTX 2080 Ti Intel Core i9-9900K 3.6GHz
GeForce RTX 2080 Ti (Desktop)
min:
18.8 fps, P0.1:
37.5 fps, P1:
43.5 fps, max:
99.9 fps
fps
GeForce RTX 2070 Super Mobile:
34.9 [X] SCHENKER Compact 17 Intel Core i7-10875H 2.3GHz
GeForce RTX 2070 Super Mobile
min:
21.3 fps, P0.1:
24.1 fps, P1:
30.5 fps, max:
42.3 fps
fps
GeForce RTX 2070 Super Mobile:
112 [X] SCHENKER Compact 17 Intel Core i7-10875H 2.3GHz
GeForce RTX 2070 Super Mobile
min:
46 fps, P0.1:
63 fps, P1:
81 fps, max:
162 fps
112.2 ~ 112 fps
GeForce RTX 2080 Ti (Desktop):
111 [X] MSI GeForce RTX 2080 Ti Intel Core i9-9900K 3.6GHz
GeForce RTX 2080 Ti (Desktop)
min:
41.22 fps, P1:
82.63 fps, max:
158.81 fps
fps
GeForce RTX 2070 Super Mobile:
102.7 105 [X] SCHENKER Compact 17 Intel Core i7-10875H 2.3GHz
GeForce RTX 2070 Super Mobile
min:
49 fps, P0.1:
62 fps, P1:
81 fps, max:
141 fps
~ 104 fps
GeForce RTX 2080 Ti (Desktop):
98.7 [X] MSI GeForce RTX 2080 Ti Intel Core i9-9900K 3.6GHz
GeForce RTX 2080 Ti (Desktop)
min:
39.86 fps, P1:
73.65 fps, max:
141.59 fps
fps
GeForce RTX 2070 Super Mobile:
90.1 92 [X] SCHENKER Compact 17 Intel Core i7-10875H 2.3GHz
GeForce RTX 2070 Super Mobile
min:
48 fps, P0.1:
58 fps, P1:
70 fps, max:
128 fps
~ 91 fps
GeForce RTX 2080 Ti (Desktop):
89.6 [X] MSI GeForce RTX 2080 Ti Intel Core i9-9900K 3.6GHz
GeForce RTX 2080 Ti (Desktop)
min:
38.16 fps, P1:
65.46 fps, max:
128.58 fps
fps
GeForce RTX 2070 Super Mobile:
59.3 60 [X] SCHENKER XMG Neo 17 Comet Lake Overboost
Intel Core i7-10875H 2.3GHz
GeForce RTX 2070 Super Mobile
min:
31 fps, P0.1:
42 fps, P1:
47 fps, max:
112 fps
61 [X] SCHENKER Compact 17 Intel Core i7-10875H 2.3GHz
GeForce RTX 2070 Super Mobile
min:
18 fps, P0.1:
40 fps, P1:
50 fps, max:
99 fps
64 [X] SCHENKER Compact 17 Leistungsmodus
Intel Core i7-10875H 2.3GHz
GeForce RTX 2070 Super Mobile
min:
38 fps, P0.1:
47 fps, P1:
53 fps, max:
98 fps
~ 61 fps
GeForce RTX 2080 Ti (Desktop):
72.9 [X] MSI GeForce RTX 2080 Ti Intel Core i9-9900K 3.6GHz
GeForce RTX 2080 Ti (Desktop)
min:
20.82 fps, P1:
52.94 fps, max:
127.81 fps
fps
GeForce RTX 2070 Super Mobile:
44 [X] SCHENKER Compact 17 Intel Core i7-10875H 2.3GHz
GeForce RTX 2070 Super Mobile
min:
19 fps, P0.1:
20 fps, P1:
22 fps, max:
114 fps
fps
GeForce RTX 2080 Ti (Desktop):
44 [X] MSI GeForce RTX 2080 Ti Intel Core i9-9900K 3.6GHz
GeForce RTX 2080 Ti (Desktop)
min:
15.41 fps, P1:
18.83 fps, max:
109.03 fps
fps
GeForce RTX 2070 Super Mobile:
25 [X] SCHENKER Compact 17 Intel Core i7-10875H 2.3GHz
GeForce RTX 2070 Super Mobile
min:
13 fps, P0.1:
14 fps, P1:
15 fps, max:
85 fps
fps
GeForce RTX 2080 Ti (Desktop):
269 [X] MSI GeForce RTX 2080 Ti 1.5.4.5
Intel Core i9-9900K 3.6GHz
GeForce RTX 2080 Ti (Desktop)
min:
24.3 fps, P1:
186 fps, max:
377 fps
fps
GeForce RTX 2080 Ti (Desktop):
266 [X] MSI GeForce RTX 2080 Ti 1.5.4.5
Intel Core i9-9900K 3.6GHz
GeForce RTX 2080 Ti (Desktop)
min:
57.3 fps, P1:
185 fps, max:
367 fps
fps
GeForce RTX 2080 Ti (Desktop):
255 [X] MSI GeForce RTX 2080 Ti 1.5.4.5
Intel Core i9-9900K 3.6GHz
GeForce RTX 2080 Ti (Desktop)
min:
57.9 fps, P1:
179 fps, max:
354 fps
fps
GeForce RTX 2080 Ti (Desktop):
254 [X] MSI GeForce RTX 2080 Ti 1.5.4.5
Intel Core i9-9900K 3.6GHz
GeForce RTX 2080 Ti (Desktop)
min:
53.4 fps, P1:
181 fps, max:
364 fps
fps
GeForce RTX 2080 Ti (Desktop):
251 [X] MSI GeForce RTX 2080 Ti 1.5.4.5
Intel Core i9-9900K 3.6GHz
GeForce RTX 2080 Ti (Desktop)
min:
26.6 fps, P1:
180 fps, max:
339 fps
fps
GeForce RTX 2080 Ti (Desktop):
247 [X] MSI GeForce RTX 2080 Ti 1.5.4.5
Intel Core i9-9900K 3.6GHz
GeForce RTX 2080 Ti (Desktop)
min:
20.3 fps, P1:
176 fps, max:
326 fps
fps
GeForce RTX 2080 Ti (Desktop):
360 [X] MSI GeForce RTX 2080 Ti 1.5.4.5
Intel Core i9-9900K 3.6GHz
GeForce RTX 2080 Ti (Desktop)
min:
136 fps, P1:
220 fps, max:
559 fps
fps
GeForce RTX 2070 Super Mobile:
263.1 fps
GeForce RTX 2080 Ti (Desktop):
354 [X] MSI GeForce RTX 2080 Ti 1.5.4.5
Intel Core i9-9900K 3.6GHz
GeForce RTX 2080 Ti (Desktop)
min:
112 fps, P1:
238 fps, max:
516 fps
fps
GeForce RTX 2070 Super Mobile:
224.6 fps
GeForce RTX 2080 Ti (Desktop):
331 [X] MSI GeForce RTX 2080 Ti 1.5.4.5
Intel Core i9-9900K 3.6GHz
GeForce RTX 2080 Ti (Desktop)
min:
80.5 fps, P1:
224 fps, max:
491 fps
fps
GeForce RTX 2070 Super Mobile:
211.5 fps
GeForce RTX 2080 Ti (Desktop):
326 [X] MSI GeForce RTX 2080 Ti 1.5.4.5
Intel Core i9-9900K 3.6GHz
GeForce RTX 2080 Ti (Desktop)
min:
113 fps, P1:
227 fps, max:
469 fps
fps
GeForce RTX 2070 Super Mobile:
202.4 fps
GeForce RTX 2080 Ti (Desktop):
246 [X] MSI GeForce RTX 2080 Ti 1.5.4.5
Intel Core i9-9900K 3.6GHz
GeForce RTX 2080 Ti (Desktop)
min:
112 fps, P1:
202 fps, max:
363 fps
fps
GeForce RTX 2080 Ti (Desktop):
144 [X] MSI GeForce RTX 2080 Ti 1.5.4.5
Intel Core i9-9900K 3.6GHz
GeForce RTX 2080 Ti (Desktop)
min:
101 fps, P1:
114 fps, max:
184 fps
fps
GeForce RTX 2080 Ti (Desktop):
131 [X] MSI GeForce RTX 2080 Ti 1.5.4.5
Intel Core i9-9900K 3.6GHz
GeForce RTX 2080 Ti (Desktop)
min:
24.5 fps, P1:
94.3 fps, max:
185 fps
fps
GeForce RTX 2070 Super Mobile:
123.7 149.5 ~ 137 fps
GeForce RTX 2080 Ti (Desktop):
120 [X] MSI GeForce RTX 2080 Ti 1.5.4.5
Intel Core i9-9900K 3.6GHz
GeForce RTX 2080 Ti (Desktop)
min:
60.8 fps, P1:
87 fps, max:
220 fps
fps
GeForce RTX 2070 Super Mobile:
95.2 106 ~ 101 fps
GeForce RTX 2080 Ti (Desktop):
117 [X] MSI GeForce RTX 2080 Ti 1.5.4.5
Intel Core i9-9900K 3.6GHz
GeForce RTX 2080 Ti (Desktop)
min:
61.7 fps, P1:
84.5 fps, max:
175 fps
fps
GeForce RTX 2070 Super Mobile:
92 96.6 ~ 94 fps
GeForce RTX 2080 Ti (Desktop):
105 [X] MSI GeForce RTX 2080 Ti 1.5.4.5
Intel Core i9-9900K 3.6GHz
GeForce RTX 2080 Ti (Desktop)
min:
51 fps, P1:
76.3 fps, max:
165 fps
fps
GeForce RTX 2080 Ti (Desktop):
62.4 [X] MSI GeForce RTX 2080 Ti 1.5.4.5
Intel Core i9-9900K 3.6GHz
GeForce RTX 2080 Ti (Desktop)
min:
43.3 fps, P1:
50.3 fps, max:
109 fps
fps
GeForce RTX 2080 Ti (Desktop):
185 [X] MSI GeForce RTX 2080 Ti Intel Core i9-9900K 3.6GHz
GeForce RTX 2080 Ti (Desktop)
min:
9.28 fps, P1:
115 fps, max:
417 fps
fps
GeForce RTX 2070 Super Mobile:
122 124 143 [X] SCHENKER Compact 17 Intel Core i7-10875H 2.3GHz
GeForce RTX 2070 Super Mobile
min:
7.13 fps, P0.1:
24.4 fps, P1:
82.4 fps, max:
271 fps
~ 130 fps
GeForce RTX 2080 Ti (Desktop):
123 [X] MSI GeForce RTX 2080 Ti Intel Core i9-9900K 3.6GHz
GeForce RTX 2080 Ti (Desktop)
min:
7.84 fps, P1:
79.5 fps, max:
234 fps
fps
GeForce RTX 2070 Super Mobile:
93.7 94 102 [X] SCHENKER Compact 17 Intel Core i7-10875H 2.3GHz
GeForce RTX 2070 Super Mobile
min:
7.57 fps, P0.1:
17.8 fps, P1:
57.4 fps, max:
202 fps
~ 97 fps
GeForce RTX 2080 Ti (Desktop):
117 [X] MSI GeForce RTX 2080 Ti Intel Core i9-9900K 3.6GHz
GeForce RTX 2080 Ti (Desktop)
min:
26.3 fps, P1:
80.8 fps, max:
231 fps
fps
GeForce RTX 2070 Super Mobile:
81.6 86.6 [X] SCHENKER Compact 17 Intel Core i7-10875H 2.3GHz
GeForce RTX 2070 Super Mobile
min:
16.2 fps, P0.1:
22.6 fps, P1:
45.3 fps, max:
185 fps
87.8 ~ 85 fps
GeForce RTX 2080 Ti (Desktop):
108 [X] MSI GeForce RTX 2080 Ti Intel Core i9-9900K 3.6GHz
GeForce RTX 2080 Ti (Desktop)
min:
21 fps, P1:
76.2 fps, max:
196 fps
fps
GeForce RTX 2070 Super Mobile:
71.1 72.5 78 [X] SCHENKER Compact 17 Intel Core i7-10875H 2.3GHz
GeForce RTX 2070 Super Mobile
min:
4.71 fps, P0.1:
24.4 fps, P1:
46.2 fps, max:
153 fps
82.1 [X] SCHENKER Compact 17 Leistungsmodus
Intel Core i7-10875H 2.3GHz
GeForce RTX 2070 Super Mobile
min:
16.4 fps, P0.1:
30.7 fps, P1:
46.6 fps, max:
143 fps
~ 76 fps
GeForce RTX 2080 Ti (Desktop):
107 [X] MSI GeForce RTX 2080 Ti Intel Core i9-9900K 3.6GHz
GeForce RTX 2080 Ti (Desktop)
min:
27.6 fps, P1:
65.8 fps, max:
171 fps
fps
GeForce RTX 2070 Super Mobile:
63.7 [X] SCHENKER Compact 17 Intel Core i7-10875H 2.3GHz
GeForce RTX 2070 Super Mobile
min:
17.5 fps, P0.1:
24.3 fps, P1:
36.7 fps, max:
125 fps
fps
GeForce RTX 2080 Ti (Desktop):
86.3 [X] MSI GeForce RTX 2080 Ti Intel Core i9-9900K 3.6GHz
GeForce RTX 2080 Ti (Desktop)
min:
23.2 fps, P1:
61.3 fps, max:
163 fps
fps
GeForce RTX 2070 Super Mobile:
39.8 [X] SCHENKER Compact 17 Intel Core i7-10875H 2.3GHz
GeForce RTX 2070 Super Mobile
min:
8.15 fps, P0.1:
15.3 fps, P1:
22.5 fps, max:
99.7 fps
fps
GeForce RTX 2080 Ti (Desktop):
179 [X] MSI GeForce RTX 2080 Ti Intel Core i9-9900K 3.6GHz
GeForce RTX 2080 Ti (Desktop)
min:
45.2 fps, P0.1:
70.8 fps, P1:
113 fps, max:
325 fps
fps
GeForce RTX 2080 Ti (Desktop):
106 [X] MSI GeForce RTX 2080 Ti Intel Core i9-9900K 3.6GHz
GeForce RTX 2080 Ti (Desktop)
min:
44.4 fps, P0.1:
47.7 fps, P1:
59.7 fps, max:
213 fps
fps
GeForce RTX 2080 Ti (Desktop):
71.3 [X] MSI GeForce RTX 2080 Ti Intel Core i9-9900K 3.6GHz
GeForce RTX 2080 Ti (Desktop)
min:
37.9 fps, P0.1:
40.7 fps, P1:
45.3 fps, max:
148 fps
fps
GeForce RTX 2080 Ti (Desktop):
57.9 [X] MSI GeForce RTX 2080 Ti Intel Core i9-9900K 3.6GHz
GeForce RTX 2080 Ti (Desktop)
min:
35.1 fps, P0.1:
36 fps, P1:
42.4 fps, max:
75 fps
fps
GeForce RTX 2080 Ti (Desktop):
37.6 [X] MSI GeForce RTX 2080 Ti Intel Core i9-9900K 3.6GHz
GeForce RTX 2080 Ti (Desktop)
min:
18.5 fps, P0.1:
19 fps, P1:
20.3 fps, max:
145 fps
fps
GeForce RTX 2080 Ti (Desktop):
84.4 [X] MSI GeForce RTX 2080 Ti 1.5.4.5
Intel Core i9-9900K 3.6GHz
GeForce RTX 2080 Ti (Desktop)
min:
8.53 fps, P1:
57.199 fps, max:
104 fps
fps
GeForce RTX 2070 Super Mobile:
66.6 71.2 ~ 69 fps
GeForce RTX 2080 Ti (Desktop):
70.8 [X] MSI GeForce RTX 2080 Ti 1.5.4.5
Intel Core i9-9900K 3.6GHz
GeForce RTX 2080 Ti (Desktop)
min:
5.47 fps, P1:
53.536 fps, max:
84.2 fps
fps
GeForce RTX 2070 Super Mobile:
58 61.7 ~ 60 fps
GeForce RTX 2080 Ti (Desktop):
58.6 [X] MSI GeForce RTX 2080 Ti 1.5.4.5
Intel Core i9-9900K 3.6GHz
GeForce RTX 2080 Ti (Desktop)
min:
5.59 fps, P1:
46.184 fps, max:
68.3 fps
fps
GeForce RTX 2070 Super Mobile:
48.8 53.3 ~ 51 fps
GeForce RTX 2080 Ti (Desktop):
47.3 [X] MSI GeForce RTX 2080 Ti 1.5.4.5
Intel Core i9-9900K 3.6GHz
GeForce RTX 2080 Ti (Desktop)
min:
7.17 fps, P1:
38.971 fps, max:
54.8 fps
fps
GeForce RTX 2070 Super Mobile:
37.8 42.1 43.8 [X] SCHENKER XMG Neo 17 Comet Lake Overboost
Intel Core i7-10875H 2.3GHz
GeForce RTX 2070 Super Mobile
~ 41 fps
GeForce RTX 2080 Ti (Desktop):
46.5 [X] MSI GeForce RTX 2080 Ti 1.5.4.5
Intel Core i9-9900K 3.6GHz
GeForce RTX 2080 Ti (Desktop)
min:
7.12 fps, P1:
38.722 fps, max:
53.6 fps
fps
GeForce RTX 2080 Ti (Desktop):
32.7 [X] MSI GeForce RTX 2080 Ti 1.5.4.5
Intel Core i9-9900K 3.6GHz
GeForce RTX 2080 Ti (Desktop)
min:
9.03 fps, P1:
27.997 fps, max:
48.4 fps
fps
GeForce RTX 2080 Ti (Desktop):
159 [X] MSI GeForce RTX 2080 Ti Intel Core i9-9900K 3.6GHz
GeForce RTX 2080 Ti (Desktop)
min:
68 fps
fps
GeForce RTX 2070 Super Mobile:
139 152 ~ 146 fps
GeForce RTX 2080 Ti (Desktop):
146 [X] MSI GeForce RTX 2080 Ti Intel Core i9-9900K 3.6GHz
GeForce RTX 2080 Ti (Desktop)
min:
24 fps
fps
GeForce RTX 2070 Super Mobile:
107 129 ~ 118 fps
GeForce RTX 2080 Ti (Desktop):
133 [X] MSI GeForce RTX 2080 Ti Intel Core i9-9900K 3.6GHz
GeForce RTX 2080 Ti (Desktop)
min:
14 fps
fps
GeForce RTX 2070 Super Mobile:
94 116 ~ 105 fps
GeForce RTX 2080 Ti (Desktop):
115 [X] MSI GeForce RTX 2080 Ti Intel Core i9-9900K 3.6GHz
GeForce RTX 2080 Ti (Desktop)
min:
28 fps
fps
GeForce RTX 2070 Super Mobile:
77 79 [X] Asus Strix G17 G712LWS Turbo
Intel Core i7-10750H 2.6GHz
GeForce RTX 2070 Super Mobile
98 ~ 85 fps
GeForce RTX 2080 Ti (Desktop):
94 [X] MSI GeForce RTX 2080 Ti Intel Core i9-9900K 3.6GHz
GeForce RTX 2080 Ti (Desktop)
min:
32 fps
fps
GeForce RTX 2080 Ti (Desktop):
54 [X] MSI GeForce RTX 2080 Ti Intel Core i9-9900K 3.6GHz
GeForce RTX 2080 Ti (Desktop)
min:
21 fps
fps
GeForce RTX 2080 Ti (Desktop):
174 [X] MSI GeForce RTX 2080 Ti Intel Core i9-9900K 3.6GHz
GeForce RTX 2080 Ti (Desktop)
min:
133 fps
fps
GeForce RTX 2070 Super Mobile:
137.5 145 ~ 141 fps
GeForce RTX 2080 Ti (Desktop):
173 [X] MSI GeForce RTX 2080 Ti Intel Core i9-9900K 3.6GHz
GeForce RTX 2080 Ti (Desktop)
min:
127 fps
fps
GeForce RTX 2070 Super Mobile:
128.2 129.2 ~ 129 fps
GeForce RTX 2080 Ti (Desktop):
170 [X] MSI GeForce RTX 2080 Ti Intel Core i9-9900K 3.6GHz
GeForce RTX 2080 Ti (Desktop)
min:
122 fps
fps
GeForce RTX 2070 Super Mobile:
117.8 119.1 ~ 118 fps
GeForce RTX 2080 Ti (Desktop):
169 [X] MSI GeForce RTX 2080 Ti Intel Core i9-9900K 3.6GHz
GeForce RTX 2080 Ti (Desktop)
min:
122 fps
fps
GeForce RTX 2070 Super Mobile:
116.2 116.8 121.6 [X] SCHENKER Compact 17 Leistungsmodus
Intel Core i7-10875H 2.3GHz
GeForce RTX 2070 Super Mobile
123.8 [X] Asus Strix G17 G712LWS Turbo
Intel Core i7-10750H 2.6GHz
GeForce RTX 2070 Super Mobile
~ 120 fps
GeForce RTX 2080 Ti (Desktop):
133 [X] MSI GeForce RTX 2080 Ti Intel Core i9-9900K 3.6GHz
GeForce RTX 2080 Ti (Desktop)
min:
108 fps
fps
GeForce RTX 2070 Super Mobile:
81.3 fps
GeForce RTX 2080 Ti (Desktop):
78.8 [X] MSI GeForce RTX 2080 Ti Intel Core i9-9900K 3.6GHz
GeForce RTX 2080 Ti (Desktop)
min:
63 fps
fps
GeForce RTX 2070 Super Mobile:
46.9 fps
GeForce RTX 2080 Ti (Desktop):
289 [X] MSI GeForce RTX 2080 Ti Intel Core i9-9900K 3.6GHz
GeForce RTX 2080 Ti (Desktop)
min:
227 fps
fps
GeForce RTX 2070 Super Mobile:
227 fps
GeForce RTX 2080 Ti (Desktop):
247 [X] MSI GeForce RTX 2080 Ti Intel Core i9-9900K 3.6GHz
GeForce RTX 2080 Ti (Desktop)
min:
191 fps
fps
GeForce RTX 2070 Super Mobile:
168 fps
GeForce RTX 2080 Ti (Desktop):
240 [X] MSI GeForce RTX 2080 Ti Intel Core i9-9900K 3.6GHz
GeForce RTX 2080 Ti (Desktop)
min:
190 fps
fps
GeForce RTX 2070 Super Mobile:
147 fps
GeForce RTX 2080 Ti (Desktop):
202 [X] MSI GeForce RTX 2080 Ti Intel Core i9-9900K 3.6GHz
GeForce RTX 2080 Ti (Desktop)
min:
175 fps
fps
GeForce RTX 2070 Super Mobile:
118 124 [X] Asus Strix G17 G712LWS Turbo
Intel Core i7-10750H 2.6GHz
GeForce RTX 2070 Super Mobile
min:
108 fps, max:
143 fps
~ 121 fps
GeForce RTX 2080 Ti (Desktop):
162 [X] MSI GeForce RTX 2080 Ti Intel Core i9-9900K 3.6GHz
GeForce RTX 2080 Ti (Desktop)
min:
136 fps
fps
GeForce RTX 2080 Ti (Desktop):
100 [X] MSI GeForce RTX 2080 Ti Intel Core i9-9900K 3.6GHz
GeForce RTX 2080 Ti (Desktop)
min:
84 fps
fps
GeForce RTX 2080 Ti (Desktop):
290 [X] MSI GeForce RTX 2080 Ti Intel Core i9-9900K 3.6GHz
GeForce RTX 2080 Ti (Desktop)
min:
240 fps
fps
GeForce RTX 2080 Ti (Desktop):
285 [X] MSI GeForce RTX 2080 Ti Intel Core i9-9900K 3.6GHz
GeForce RTX 2080 Ti (Desktop)
min:
222 fps
fps
GeForce RTX 2080 Ti (Desktop):
267 [X] MSI GeForce RTX 2080 Ti Intel Core i9-9900K 3.6GHz
GeForce RTX 2080 Ti (Desktop)
min:
222 fps
fps
GeForce RTX 2080 Ti (Desktop):
266 [X] MSI GeForce RTX 2080 Ti Intel Core i9-9900K 3.6GHz
GeForce RTX 2080 Ti (Desktop)
min:
218 fps
fps
GeForce RTX 2080 Ti (Desktop):
259 [X] MSI GeForce RTX 2080 Ti Intel Core i9-9900K 3.6GHz
GeForce RTX 2080 Ti (Desktop)
min:
205 fps
fps
GeForce RTX 2080 Ti (Desktop):
321 [X] MSI GeForce RTX 2080 Ti Intel Core i9-9900K 3.6GHz
GeForce RTX 2080 Ti (Desktop)
fps
GeForce RTX 2070 Super Mobile:
249.1 fps
GeForce RTX 2080 Ti (Desktop):
243 [X] MSI GeForce RTX 2080 Ti Intel Core i9-9900K 3.6GHz
GeForce RTX 2080 Ti (Desktop)
fps
GeForce RTX 2070 Super Mobile:
172.4 215 ~ 194 fps
GeForce RTX 2080 Ti (Desktop):
166 [X] MSI GeForce RTX 2080 Ti Intel Core i9-9900K 3.6GHz
GeForce RTX 2080 Ti (Desktop)
fps
GeForce RTX 2070 Super Mobile:
122.2 144 ~ 133 fps
GeForce RTX 2080 Ti (Desktop):
126 [X] MSI GeForce RTX 2080 Ti Intel Core i9-9900K 3.6GHz
GeForce RTX 2080 Ti (Desktop)
fps
GeForce RTX 2070 Super Mobile:
90 103 ~ 97 fps
GeForce RTX 2080 Ti (Desktop):
101 [X] MSI GeForce RTX 2080 Ti Intel Core i9-9900K 3.6GHz
GeForce RTX 2080 Ti (Desktop)
fps
GeForce RTX 2070 Super Mobile:
64.5 fps
GeForce RTX 2080 Ti (Desktop):
64.7 [X] MSI GeForce RTX 2080 Ti Intel Core i9-9900K 3.6GHz
GeForce RTX 2080 Ti (Desktop)
fps
GeForce RTX 2070 Super Mobile:
33.3 fps
100%
GeForce RTX 2080 Max-Q:
156 fps
202%
GeForce RTX 2080 Ti (Desktop):
315 [X] MSI GeForce RTX 2080 Ti Intel Core i9-9900K 3.6GHz
GeForce RTX 2080 Ti (Desktop)
min:
137 fps
fps
146%
GeForce RTX 2070 Super Mobile:
219.1 234.1 ~ 227 fps
100%
GeForce RTX 2080 Max-Q:
140 fps
207%
GeForce RTX 2080 Ti (Desktop):
290 [X] MSI GeForce RTX 2080 Ti Intel Core i9-9900K 3.6GHz
GeForce RTX 2080 Ti (Desktop)
min:
136 fps
fps
100%
GeForce RTX 2080 Max-Q:
138 fps
193%
GeForce RTX 2080 Ti (Desktop):
266 [X] MSI GeForce RTX 2080 Ti Intel Core i9-9900K 3.6GHz
GeForce RTX 2080 Ti (Desktop)
min:
133 fps
fps
100%
GeForce RTX 2080 Max-Q:
134 fps
193%
GeForce RTX 2080 Ti (Desktop):
259 [X] MSI GeForce RTX 2080 Ti Intel Core i9-9900K 3.6GHz
GeForce RTX 2080 Ti (Desktop)
min:
131 fps
fps
124%
GeForce RTX 2070 Super Mobile:
151 155.4 163.2 [X] Asus Strix G17 G712LWS Turbo
Intel Core i7-10750H 2.6GHz
GeForce RTX 2070 Super Mobile
170 190.4 ~ 166 fps
GeForce RTX 2080 Ti (Desktop):
204 [X] MSI GeForce RTX 2080 Ti Intel Core i9-9900K 3.6GHz
GeForce RTX 2080 Ti (Desktop)
min:
127 fps
fps
GeForce RTX 2070 Super Mobile:
118 fps
GeForce RTX 2080 Ti (Desktop):
113 [X] MSI GeForce RTX 2080 Ti Intel Core i9-9900K 3.6GHz
GeForce RTX 2080 Ti (Desktop)
min:
92 fps
fps
GeForce RTX 2070 Super Mobile:
61.6 fps
100%
GeForce RTX 2080 Max-Q:
184 fps
128%
GeForce RTX 2080 Ti (Desktop):
235 [X] MSI GeForce RTX 2080 Ti Intel Core i9-9900K 3.6GHz
GeForce RTX 2080 Ti (Desktop)
min:
214 fps
fps
100%
GeForce RTX 2080 Max-Q:
134 fps
149%
GeForce RTX 2080 Ti (Desktop):
200 [X] MSI GeForce RTX 2080 Ti Intel Core i9-9900K 3.6GHz
GeForce RTX 2080 Ti (Desktop)
min:
177 fps
fps
101%
GeForce RTX 2070 Super Mobile:
136 fps
100%
GeForce RTX 2080 Max-Q:
121 fps
140%
GeForce RTX 2080 Ti (Desktop):
170 [X] MSI GeForce RTX 2080 Ti Intel Core i9-9900K 3.6GHz
GeForce RTX 2080 Ti (Desktop)
min:
157 fps
fps
93%
GeForce RTX 2070 Super Mobile:
113 fps
GeForce RTX 2080 Ti (Desktop):
125 [X] MSI GeForce RTX 2080 Ti Intel Core i9-9900K 3.6GHz
GeForce RTX 2080 Ti (Desktop)
min:
118 fps
fps
GeForce RTX 2070 Super Mobile:
74 fps
GeForce RTX 2080 Ti (Desktop):
60.4 [X] MSI GeForce RTX 2080 Ti Intel Core i9-9900K 3.6GHz
GeForce RTX 2080 Ti (Desktop)
min:
58 fps
fps
GeForce RTX 2070 Super Mobile:
34.1 fps
100%
GeForce RTX 2080 Max-Q:
121 fps
100%
GeForce RTX 2080 Ti (Desktop):
121 [X] MSI GeForce RTX 2080 Ti Intel Core i9-9900K 3.6GHz
GeForce RTX 2080 Ti (Desktop)
min:
119 fps
fps
100%
GeForce RTX 2080 Max-Q:
121 fps
100%
GeForce RTX 2080 Ti (Desktop):
121 [X] MSI GeForce RTX 2080 Ti Intel Core i9-9900K 3.6GHz
GeForce RTX 2080 Ti (Desktop)
min:
118 fps
fps
100%
GeForce RTX 2070 Super Mobile:
121 fps
100%
GeForce RTX 2080 Max-Q:
120 fps
101%
GeForce RTX 2080 Ti (Desktop):
121 [X] MSI GeForce RTX 2080 Ti Intel Core i9-9900K 3.6GHz
GeForce RTX 2080 Ti (Desktop)
min:
117 fps
fps
101%
GeForce RTX 2070 Super Mobile:
121 fps
100%
GeForce RTX 2080 Max-Q:
117 fps
103%
GeForce RTX 2080 Ti (Desktop):
121 [X] MSI GeForce RTX 2080 Ti Intel Core i9-9900K 3.6GHz
GeForce RTX 2080 Ti (Desktop)
min:
103 fps
fps
103%
GeForce RTX 2070 Super Mobile:
121 fps
GeForce RTX 2080 Ti (Desktop):
120 [X] MSI GeForce RTX 2080 Ti Intel Core i9-9900K 3.6GHz
GeForce RTX 2080 Ti (Desktop)
min:
82 fps
fps
GeForce RTX 2070 Super Mobile:
81 fps
GeForce RTX 2080 Ti (Desktop):
73.4 [X] MSI GeForce RTX 2080 Ti Intel Core i9-9900K 3.6GHz
GeForce RTX 2080 Ti (Desktop)
min:
64 fps
fps
GeForce RTX 2070 Super Mobile:
41.4 fps
100%
GeForce RTX 2080 Max-Q:
121 fps
105%
GeForce RTX 2080 Ti (Desktop):
127 [X] AMD Ryzen 9 3900X 3.8GHz
GeForce RTX 2080 Ti (Desktop)
min:
25.1 fps, P1:
83.3 fps, max:
211 fps
fps
100%
GeForce RTX 2080 Max-Q:
102.6 fps
116%
GeForce RTX 2080 Ti (Desktop):
119 [X] AMD Ryzen 9 3900X 3.8GHz
GeForce RTX 2080 Ti (Desktop)
min:
14.2 fps, P1:
83.3 fps, max:
194 fps
fps
107%
GeForce RTX 2070 Super Mobile:
110 fps
100%
GeForce RTX 2080 Max-Q:
72.8 fps
141%
GeForce RTX 2080 Ti (Desktop):
103 [X] AMD Ryzen 9 3900X 3.8GHz
GeForce RTX 2080 Ti (Desktop)
min:
10.6 fps, P1:
71.4 fps, max:
178 fps
fps
100%
GeForce RTX 2070 Super Mobile:
73.1 fps
100%
GeForce RTX 2080 Max-Q:
45.6 fps
167%
GeForce RTX 2080 Ti (Desktop):
76 [X] AMD Ryzen 9 3900X 3.8GHz
GeForce RTX 2080 Ti (Desktop)
min:
8.12 fps, P1:
47.6 fps, max:
138 fps
fps
104%
GeForce RTX 2070 Super Mobile:
47.6 fps
GeForce RTX 2080 Ti (Desktop):
63 [X] AMD Ryzen 9 3900X 3.8GHz
GeForce RTX 2080 Ti (Desktop)
min:
5.54 fps, P1:
43.5 fps, max:
111 fps
fps
GeForce RTX 2070 Super Mobile:
38.1 fps
GeForce RTX 2080 Ti (Desktop):
42.3 [X] AMD Ryzen 9 3900X 3.8GHz
GeForce RTX 2080 Ti (Desktop)
min:
6.85 fps, P1:
32.3 fps, max:
121 fps
fps
GeForce RTX 2070 Super Mobile:
24.8 fps
100%
GeForce RTX 2080 Max-Q:
94.5 fps
112%
GeForce RTX 2080 Ti (Desktop):
106 [X] AMD Ryzen 9 3900X 3.8GHz
GeForce RTX 2080 Ti (Desktop)
min:
65 fps, max:
131 fps
fps
126%
GeForce RTX 2070 Super Mobile:
119 fps
100%
GeForce RTX 2080 Max-Q:
84.2 fps
126%
GeForce RTX 2080 Ti (Desktop):
106 [X] AMD Ryzen 9 3900X 3.8GHz
GeForce RTX 2080 Ti (Desktop)
min:
63 fps, max:
126 fps
fps
135%
GeForce RTX 2070 Super Mobile:
114 fps
100%
GeForce RTX 2080 Max-Q:
82.3 fps
126%
GeForce RTX 2080 Ti (Desktop):
104 [X] AMD Ryzen 9 3900X 3.8GHz
GeForce RTX 2080 Ti (Desktop)
min:
61 fps, max:
130 fps
fps
131%
GeForce RTX 2070 Super Mobile:
108 fps
GeForce RTX 2080 Ti (Desktop):
105 [X] AMD Ryzen 9 3900X 3.8GHz
GeForce RTX 2080 Ti (Desktop)
min:
60 fps, max:
130 fps
fps
GeForce RTX 2070 Super Mobile:
84 fps
GeForce RTX 2080 Ti (Desktop):
73 [X] AMD Ryzen 9 3900X 3.8GHz
GeForce RTX 2080 Ti (Desktop)
min:
61 fps, max:
86 fps
fps
GeForce RTX 2070 Super Mobile:
42.5 fps
100%
GeForce RTX 2080 Max-Q:
85.6 fps
100%
GeForce RTX 2080 Max-Q:
66 fps
159%
GeForce RTX 2070 Super Mobile:
105 fps
100%
GeForce RTX 2080 Max-Q:
63.6 fps
153%
GeForce RTX 2070 Super Mobile:
97 fps
100%
GeForce RTX 2080 Max-Q:
57.2 fps
163%
GeForce RTX 2080 Ti (Desktop):
93 [X] MSI GeForce RTX 2080 Ti Gaming X Trio Intel Core i7-7740X 4.3GHz
GeForce RTX 2080 Ti (Desktop)
min:
79 fps, max:
110 fps
fps
162%
GeForce RTX 2070 Super Mobile:
92.4 fps
GeForce RTX 2080 Ti (Desktop):
91 [X] MSI GeForce RTX 2080 Ti Gaming X Trio Intel Core i7-7740X 4.3GHz
GeForce RTX 2080 Ti (Desktop)
min:
75 fps, max:
111 fps
fps
GeForce RTX 2070 Super Mobile:
81.7 fps
GeForce RTX 2080 Ti (Desktop):
67 [X] MSI GeForce RTX 2080 Ti Gaming X Trio Intel Core i7-7740X 4.3GHz
GeForce RTX 2080 Ti (Desktop)
min:
58 fps, max:
76 fps
fps
GeForce RTX 2070 Super Mobile:
48.1 fps
100%
GeForce RTX 2080 Max-Q:
171.5 fps
100%
GeForce RTX 2080 Max-Q:
126.7 fps
111%
GeForce RTX 2070 Super Mobile:
141 fps
100%
GeForce RTX 2080 Max-Q:
104.9 fps
128%
GeForce RTX 2070 Super Mobile:
134 fps
100%
GeForce RTX 2080 Max-Q:
90.6 fps
179%
GeForce RTX 2080 Ti (Desktop):
162 [X] MSI GeForce RTX 2080 Ti Gaming X Trio Intel Core i7-7740X 4.3GHz
GeForce RTX 2080 Ti (Desktop)
P1:
104.2 fps
fps
118%
GeForce RTX 2070 Super Mobile:
107 fps
GeForce RTX 2080 Ti (Desktop):
127 [X] MSI GeForce RTX 2080 Ti Gaming X Trio Intel Core i7-7740X 4.3GHz
GeForce RTX 2080 Ti (Desktop)
P1:
83.3 fps
fps
GeForce RTX 2070 Super Mobile:
75.3 fps
GeForce RTX 2080 Ti (Desktop):
77 [X] MSI GeForce RTX 2080 Ti Gaming X Trio Intel Core i7-7740X 4.3GHz
GeForce RTX 2080 Ti (Desktop)
P1:
54.9 fps
fps
GeForce RTX 2070 Super Mobile:
41.6 fps
100%
GeForce RTX 2080 Max-Q:
213.5 fps
100%
GeForce RTX 2080 Max-Q:
187.6 fps
85%
GeForce RTX 2070 Super Mobile:
160 fps
100%
GeForce RTX 2080 Max-Q:
120.7 fps
99%
GeForce RTX 2070 Super Mobile:
119 fps
100%
GeForce RTX 2080 Max-Q:
81.3 fps
173%
GeForce RTX 2080 Ti (Desktop):
141 [X] MSI GeForce RTX 2080 Ti Gaming X Trio Intel Core i7-7740X 4.3GHz
GeForce RTX 2080 Ti (Desktop)
P1:
101 fps
fps
99%
GeForce RTX 2070 Super Mobile:
80.7 fps
GeForce RTX 2080 Ti (Desktop):
118 [X] MSI GeForce RTX 2080 Ti Gaming X Trio Intel Core i7-7740X 4.3GHz
GeForce RTX 2080 Ti (Desktop)
P1:
84.7 fps
fps
GeForce RTX 2070 Super Mobile:
70.2 fps
GeForce RTX 2080 Ti (Desktop):
77 [X] MSI GeForce RTX 2080 Ti Gaming X Trio Intel Core i7-7740X 4.3GHz
GeForce RTX 2080 Ti (Desktop)
P1:
50.8 fps
fps
GeForce RTX 2070 Super Mobile:
47.2 fps
100%
GeForce RTX 2080 Max-Q:
105 fps
100%
GeForce RTX 2080 Max-Q:
95 fps
121%
GeForce RTX 2070 Super Mobile:
115 fps
100%
GeForce RTX 2080 Max-Q:
92 fps
110%
GeForce RTX 2070 Super Mobile:
101 fps
100%
GeForce RTX 2080 Max-Q:
71 fps
145%
GeForce RTX 2080 Ti (Desktop):
103 [X] MSI GeForce RTX 2080 Ti Gaming X Trio Intel Core i7-7740X 4.3GHz
GeForce RTX 2080 Ti (Desktop)
min:
56 fps, max:
160 fps
fps
106%
GeForce RTX 2070 Super Mobile:
75 fps
GeForce RTX 2080 Ti (Desktop):
82 [X] MSI GeForce RTX 2080 Ti Gaming X Trio Intel Core i7-7740X 4.3GHz
GeForce RTX 2080 Ti (Desktop)
min:
59 fps, max:
118 fps
fps
GeForce RTX 2070 Super Mobile:
55 fps
GeForce RTX 2080 Ti (Desktop):
52 [X] MSI GeForce RTX 2080 Ti Gaming X Trio Intel Core i7-7740X 4.3GHz
GeForce RTX 2080 Ti (Desktop)
min:
40 fps, max:
71 fps
fps
GeForce RTX 2070 Super Mobile:
32 fps
100%
GeForce RTX 2080 Max-Q:
214.6 fps
125%
GeForce RTX 2080 Ti (Desktop):
269 [X] AMD Ryzen 9 3900X 3.8GHz
GeForce RTX 2080 Ti (Desktop)
P1:
196.1 fps
fps
100%
GeForce RTX 2080 Max-Q:
208.1 fps
129%
GeForce RTX 2080 Ti (Desktop):
269 [X] AMD Ryzen 9 3900X 3.8GHz
GeForce RTX 2080 Ti (Desktop)
P1:
196.1 fps
fps
135%
GeForce RTX 2070 Super Mobile:
280 fps
100%
GeForce RTX 2080 Max-Q:
197.7 fps
129%
GeForce RTX 2080 Ti (Desktop):
255 [X] AMD Ryzen 9 3900X 3.8GHz
GeForce RTX 2080 Ti (Desktop)
P1:
188.7 fps
fps
135%
GeForce RTX 2070 Super Mobile:
267 fps
100%
GeForce RTX 2080 Max-Q:
197.1 fps
128%
GeForce RTX 2080 Ti (Desktop):
253 [X] AMD Ryzen 9 3900X 3.8GHz
GeForce RTX 2080 Ti (Desktop)
P1:
185.2 fps
fps
134%
GeForce RTX 2070 Super Mobile:
264 fps
GeForce RTX 2080 Ti (Desktop):
247 [X] AMD Ryzen 9 3900X 3.8GHz
GeForce RTX 2080 Ti (Desktop)
P1:
181.8 fps
fps
GeForce RTX 2070 Super Mobile:
262 fps
GeForce RTX 2080 Ti (Desktop):
249 [X] AMD Ryzen 9 3900X 3.8GHz
GeForce RTX 2080 Ti (Desktop)
P1:
185.2 fps
fps
GeForce RTX 2070 Super Mobile:
211 fps
100%
GeForce RTX 2080 Max-Q:
128.8 fps
120%
GeForce RTX 2080 Ti (Desktop):
147.8 [X] AMD Ryzen 9 3900X 3.8GHz
GeForce RTX 2080 Ti (Desktop)
162 [X] AMD Ryzen 9 3900X 3.8GHz
GeForce RTX 2080 Ti (Desktop)
~ 155 fps
100%
GeForce RTX 2080 Max-Q:
110.8 fps
124%
GeForce RTX 2080 Ti (Desktop):
131.1 [X] AMD Ryzen 9 3900X 3.8GHz
GeForce RTX 2080 Ti (Desktop)
142 [X] AMD Ryzen 9 3900X 3.8GHz
GeForce RTX 2080 Ti (Desktop)
~ 137 fps
115%
GeForce RTX 2070 Super Mobile:
127 fps
100%
GeForce RTX 2080 Max-Q:
84.7 fps
144%
GeForce RTX 2080 Ti (Desktop):
116.5 [X] AMD Ryzen 9 3900X 3.8GHz
GeForce RTX 2080 Ti (Desktop)
127 [X] AMD Ryzen 9 3900X 3.8GHz
GeForce RTX 2080 Ti (Desktop)
~ 122 fps
109%
GeForce RTX 2070 Super Mobile:
92.1 fps
100%
GeForce RTX 2080 Max-Q:
67.1 fps
156%
GeForce RTX 2080 Ti (Desktop):
101.3 [X] AMD Ryzen 9 3900X 3.8GHz
GeForce RTX 2080 Ti (Desktop)
109 [X] AMD Ryzen 9 3900X 3.8GHz
GeForce RTX 2080 Ti (Desktop)
~ 105 fps
105%
GeForce RTX 2070 Super Mobile:
70.6 fps
GeForce RTX 2080 Ti (Desktop):
78 [X] AMD Ryzen 9 3900X 3.8GHz
GeForce RTX 2080 Ti (Desktop)
83 [X] AMD Ryzen 9 3900X 3.8GHz
GeForce RTX 2080 Ti (Desktop)
~ 81 fps
GeForce RTX 2070 Super Mobile:
49.8 fps
GeForce RTX 2080 Ti (Desktop):
43.6 [X] AMD Ryzen 9 3900X 3.8GHz
GeForce RTX 2080 Ti (Desktop)
47 [X] AMD Ryzen 9 3900X 3.8GHz
GeForce RTX 2080 Ti (Desktop)
~ 45 fps
GeForce RTX 2070 Super Mobile:
26.8 fps
100%
GeForce RTX 2080 Max-Q:
231.9 fps
103%
GeForce RTX 2080 Ti (Desktop):
239 [X] AMD Ryzen 9 3900X 3.8GHz
GeForce RTX 2080 Ti (Desktop)
min:
231 fps, max:
243 fps
240 [X] AMD Ryzen 9 3900X 3.8GHz
GeForce RTX 2080 Ti (Desktop)
min:
234 fps, max:
241 fps
~ 240 fps
100%
GeForce RTX 2080 Max-Q:
92.8 fps
179%
GeForce RTX 2080 Ti (Desktop):
163 [X] AMD Ryzen 9 3900X 3.8GHz
GeForce RTX 2080 Ti (Desktop)
min:
143 fps, max:
183 fps
169 [X] AMD Ryzen 9 3900X 3.8GHz
GeForce RTX 2080 Ti (Desktop)
min:
149 fps, max:
197 fps
~ 166 fps
115%
GeForce RTX 2070 Super Mobile:
107 fps
100%
GeForce RTX 2080 Max-Q:
71.9 fps
179%
GeForce RTX 2080 Ti (Desktop):
126 [X] AMD Ryzen 9 3900X 3.8GHz
GeForce RTX 2080 Ti (Desktop)
min:
111 fps, max:
143 fps
132 [X] AMD Ryzen 9 3900X 3.8GHz
GeForce RTX 2080 Ti (Desktop)
min:
117 fps, max:
151 fps
~ 129 fps
112%
GeForce RTX 2070 Super Mobile:
80.8 fps
GeForce RTX 2080 Ti (Desktop):
84 [X] AMD Ryzen 9 3900X 3.8GHz
GeForce RTX 2080 Ti (Desktop)
min:
75 fps, max:
95 fps
89 [X] AMD Ryzen 9 3900X 3.8GHz
GeForce RTX 2080 Ti (Desktop)
min:
79 fps, max:
100 fps
~ 87 fps
GeForce RTX 2070 Super Mobile:
52.6 fps
GeForce RTX 2080 Ti (Desktop):
42.6 [X] AMD Ryzen 9 3900X 3.8GHz
GeForce RTX 2080 Ti (Desktop)
min:
37 fps, max:
49 fps
45.8 [X] AMD Ryzen 9 3900X 3.8GHz
GeForce RTX 2080 Ti (Desktop)
min:
40 fps, max:
52 fps
~ 44 fps
GeForce RTX 2070 Super Mobile:
25.6 fps
100%
GeForce RTX 2080 Max-Q:
188 fps
143%
GeForce RTX 2080 Ti (Desktop):
238 [X] AMD Ryzen 9 3900X 3.8GHz
GeForce RTX 2080 Ti (Desktop)
min:
204 fps, max:
261 fps
283 [X] Corsair One i160 Intel Core i9-9900K 3.6GHz
GeForce RTX 2080 Ti (Desktop)
min:
236 fps, max:
313 fps
287 [X] AMD Ryzen 9 3900X 3.8GHz
GeForce RTX 2080 Ti (Desktop)
~ 269 fps
100%
GeForce RTX 2080 Max-Q:
165 fps
147%
GeForce RTX 2080 Ti (Desktop):
217 [X] AMD Ryzen 9 3900X 3.8GHz
GeForce RTX 2080 Ti (Desktop)
min:
188 fps, max:
238 fps
256 [X] Corsair One i160 Intel Core i9-9900K 3.6GHz
GeForce RTX 2080 Ti (Desktop)
min:
224 fps, max:
291 fps
257 [X] AMD Ryzen 9 3900X 3.8GHz
GeForce RTX 2080 Ti (Desktop)
~ 243 fps
123%
GeForce RTX 2070 Super Mobile:
203 fps
100%
GeForce RTX 2080 Max-Q:
137 fps
140%
GeForce RTX 2080 Ti (Desktop):
178 [X] AMD Ryzen 9 3900X 3.8GHz
GeForce RTX 2080 Ti (Desktop)
min:
158 fps, max:
194 fps
198 [X] Corsair One i160 Intel Core i9-9900K 3.6GHz
GeForce RTX 2080 Ti (Desktop)
min:
171 fps, max:
214 fps
201 [X] AMD Ryzen 9 3900X 3.8GHz
GeForce RTX 2080 Ti (Desktop)
~ 192 fps
130%
GeForce RTX 2070 Super Mobile:
178 fps
100%
GeForce RTX 2080 Max-Q:
114 fps
150%
GeForce RTX 2080 Ti (Desktop):
164 [X] AMD Ryzen 9 3900X 3.8GHz
GeForce RTX 2080 Ti (Desktop)
min:
136 fps, max:
184 fps
174 [X] AMD Ryzen 9 3900X 3.8GHz
GeForce RTX 2080 Ti (Desktop)
176 [X] Corsair One i160 Intel Core i9-9900K 3.6GHz
GeForce RTX 2080 Ti (Desktop)
min:
148 fps, max:
195 fps
~ 171 fps
149%
GeForce RTX 2070 Super Mobile:
170 fps
GeForce RTX 2080 Ti (Desktop):
143 [X] Corsair One i160 Intel Core i9-9900K 3.6GHz
GeForce RTX 2080 Ti (Desktop)
min:
127 fps, max:
161 fps
146 [X] AMD Ryzen 9 3900X 3.8GHz
GeForce RTX 2080 Ti (Desktop)
147 [X] AMD Ryzen 9 3900X 3.8GHz
GeForce RTX 2080 Ti (Desktop)
min:
133 fps, max:
164 fps
~ 145 fps
GeForce RTX 2070 Super Mobile:
116 fps
GeForce RTX 2080 Ti (Desktop):
95 [X] AMD Ryzen 9 3900X 3.8GHz
GeForce RTX 2080 Ti (Desktop)
min:
84 fps, max:
106 fps
97 [X] Corsair One i160 Intel Core i9-9900K 3.6GHz
GeForce RTX 2080 Ti (Desktop)
min:
86 fps, max:
109 fps
97 [X] AMD Ryzen 9 3900X 3.8GHz
GeForce RTX 2080 Ti (Desktop)
~ 96 fps
GeForce RTX 2070 Super Mobile:
73 fps
100%
GeForce RTX 2080 Max-Q:
224.8 [X] SCHENKER Key 16 Intel Core i7-8750H 2.2GHz
GeForce RTX 2080 Max-Q
min:
141 fps, max:
317 fps
fps
100%
GeForce RTX 2080 Max-Q:
126.1 [X] SCHENKER Key 16 Intel Core i7-8750H 2.2GHz
GeForce RTX 2080 Max-Q
min:
89 fps, max:
177 fps
fps
100%
GeForce RTX 2080 Max-Q:
88.8 [X] SCHENKER Key 16 Intel Core i7-8750H 2.2GHz
GeForce RTX 2080 Max-Q
min:
42 fps, max:
109 fps
fps
100%
GeForce RTX 2080 Max-Q:
65.5 [X] SCHENKER Key 16 Intel Core i7-8750H 2.2GHz
GeForce RTX 2080 Max-Q
min:
27 fps, max:
79 fps
fps
147%
GeForce RTX 2080 Ti (Desktop):
96.3 [X] MSI GeForce RTX 2080 Ti Gaming X Trio Intel Core i7-7740X 4.3GHz
GeForce RTX 2080 Ti (Desktop)
min:
63 fps, max:
143 fps
fps
GeForce RTX 2080 Ti (Desktop):
81.1 [X] MSI GeForce RTX 2080 Ti Gaming X Trio Intel Core i7-7740X 4.3GHz
GeForce RTX 2080 Ti (Desktop)
min:
62 fps, max:
97 fps
fps
GeForce RTX 2080 Ti (Desktop):
43.8 [X] MSI GeForce RTX 2080 Ti Gaming X Trio Intel Core i7-7740X 4.3GHz
GeForce RTX 2080 Ti (Desktop)
min:
38 fps, max:
49 fps
fps
140%
GeForce RTX 2080 Ti (Desktop):
212 [X] AMD Ryzen 9 3900X 3.8GHz
GeForce RTX 2080 Ti (Desktop)
P1:
95.2 fps
319 329 [X] AMD Ryzen 9 3900X 3.8GHz
GeForce RTX 2080 Ti (Desktop)
P1:
181.8 fps
~ 287 fps
100%
GeForce RTX 2080 Max-Q:
111 112.2 ~ 112 fps
174%
GeForce RTX 2080 Ti (Desktop):
181 [X] AMD Ryzen 9 3900X 3.8GHz
GeForce RTX 2080 Ti (Desktop)
P1:
95.2 fps
197 207 [X] AMD Ryzen 9 3900X 3.8GHz
GeForce RTX 2080 Ti (Desktop)
P1:
158.7 fps
~ 195 fps
128%
GeForce RTX 2070 Super Mobile:
143 fps
100%
GeForce RTX 2080 Max-Q:
93.5 96.1 ~ 95 fps
180%
GeForce RTX 2080 Ti (Desktop):
164 [X] AMD Ryzen 9 3900X 3.8GHz
GeForce RTX 2080 Ti (Desktop)
P1:
90.1 fps
169 180 [X] AMD Ryzen 9 3900X 3.8GHz
GeForce RTX 2080 Ti (Desktop)
P1:
144.9 fps
~ 171 fps
127%
GeForce RTX 2070 Super Mobile:
121 fps
100%
GeForce RTX 2080 Max-Q:
91.9 93.3 ~ 93 fps
178%
GeForce RTX 2080 Ti (Desktop):
159 [X] AMD Ryzen 9 3900X 3.8GHz
GeForce RTX 2080 Ti (Desktop)
P1:
90.1 fps
164 174 [X] AMD Ryzen 9 3900X 3.8GHz
GeForce RTX 2080 Ti (Desktop)
P1:
126.6 fps
~ 166 fps
128%
GeForce RTX 2070 Super Mobile:
119 fps
GeForce RTX 2080 Ti (Desktop):
110 [X] AMD Ryzen 9 3900X 3.8GHz
GeForce RTX 2080 Ti (Desktop)
P1:
80 fps
112 119 [X] AMD Ryzen 9 3900X 3.8GHz
GeForce RTX 2080 Ti (Desktop)
P1:
103.1 fps
~ 114 fps
GeForce RTX 2070 Super Mobile:
74.2 fps
GeForce RTX 2080 Ti (Desktop):
55.7 [X] AMD Ryzen 9 3900X 3.8GHz
GeForce RTX 2080 Ti (Desktop)
P1:
41.8 fps
57.8 61 [X] AMD Ryzen 9 3900X 3.8GHz
GeForce RTX 2080 Ti (Desktop)
P1:
55.6 fps
~ 58 fps
GeForce RTX 2070 Super Mobile:
36.7 fps
100%
GeForce RTX 2080 Max-Q:
98.5 fps
110%
GeForce RTX 2080 Ti (Desktop):
100 [X] AMD Ryzen 9 3900X 3.8GHz
GeForce RTX 2080 Ti (Desktop)
min:
91 fps, max:
113 fps
102 [X] AMD Ryzen 9 3900X 3.8GHz
GeForce RTX 2080 Ti (Desktop)
min:
95 fps, max:
114 fps
123 [X] Corsair One i160 Intel Core i9-9900K 3.6GHz
GeForce RTX 2080 Ti (Desktop)
min:
112 fps, max:
138 fps
~ 108 fps
100%
GeForce RTX 2080 Max-Q:
93.9 fps
113%
GeForce RTX 2080 Ti (Desktop):
100 [X] AMD Ryzen 9 3900X 3.8GHz
GeForce RTX 2080 Ti (Desktop)
min:
94 fps, max:
113 fps
101 [X] AMD Ryzen 9 3900X 3.8GHz
GeForce RTX 2080 Ti (Desktop)
min:
93 fps, max:
112 fps
117 [X] Corsair One i160 Intel Core i9-9900K 3.6GHz
GeForce RTX 2080 Ti (Desktop)
min:
108 fps, max:
130 fps
~ 106 fps
124%
GeForce RTX 2070 Super Mobile:
116 fps
100%
GeForce RTX 2080 Max-Q:
77.7 fps
104%
GeForce RTX 2080 Ti (Desktop):
75 [X] AMD Ryzen 9 3900X 3.8GHz
GeForce RTX 2080 Ti (Desktop)
min:
70 fps, max:
84 fps
77 [X] AMD Ryzen 9 3900X 3.8GHz
GeForce RTX 2080 Ti (Desktop)
min:
71 fps, max:
88 fps
92 [X] Corsair One i160 Intel Core i9-9900K 3.6GHz
GeForce RTX 2080 Ti (Desktop)
min:
83 fps, max:
104 fps
~ 81 fps
116%
GeForce RTX 2070 Super Mobile:
90.4 fps
100%
GeForce RTX 2080 Max-Q:
41.2 fps
109%
GeForce RTX 2080 Ti (Desktop):
40.7 [X] AMD Ryzen 9 3900X 3.8GHz
GeForce RTX 2080 Ti (Desktop)
min:
34 fps, max:
50 fps
43.3 [X] AMD Ryzen 9 3900X 3.8GHz
GeForce RTX 2080 Ti (Desktop)
min:
38 fps, max:
56 fps
51.7 [X] Corsair One i160 Intel Core i9-9900K 3.6GHz
GeForce RTX 2080 Ti (Desktop)
min:
44 fps, max:
66 fps
~ 45 fps
124%
GeForce RTX 2070 Super Mobile:
51 fps
GeForce RTX 2080 Ti (Desktop):
38.3 [X] AMD Ryzen 9 3900X 3.8GHz
GeForce RTX 2080 Ti (Desktop)
min:
34 fps, max:
45 fps
41.8 [X] AMD Ryzen 9 3900X 3.8GHz
GeForce RTX 2080 Ti (Desktop)
min:
36 fps, max:
57 fps
49.2 [X] Corsair One i160 Intel Core i9-9900K 3.6GHz
GeForce RTX 2080 Ti (Desktop)
min:
38 fps, max:
66 fps
~ 43 fps
GeForce RTX 2070 Super Mobile:
44 fps
GeForce RTX 2080 Ti (Desktop):
36.1 [X] AMD Ryzen 9 3900X 3.8GHz
GeForce RTX 2080 Ti (Desktop)
min:
30 fps, max:
44 fps
37.6 [X] AMD Ryzen 9 3900X 3.8GHz
GeForce RTX 2080 Ti (Desktop)
min:
32 fps, max:
43 fps
46.1 [X] Corsair One i160 Intel Core i9-9900K 3.6GHz
GeForce RTX 2080 Ti (Desktop)
min:
39 fps, max:
54 fps
~ 40 fps
GeForce RTX 2070 Super Mobile:
23.9 fps
100%
GeForce RTX 2080 Max-Q:
132 fps
160%
GeForce RTX 2080 Ti (Desktop):
201 [X] AMD Ryzen 9 3900X 3.8GHz
GeForce RTX 2080 Ti (Desktop)
208 [X] AMD Ryzen 9 3900X 3.8GHz
GeForce RTX 2080 Ti (Desktop)
223 ~ 211 fps
100%
GeForce RTX 2080 Max-Q:
97 fps
186%
GeForce RTX 2080 Ti (Desktop):
172 [X] AMD Ryzen 9 3900X 3.8GHz
GeForce RTX 2080 Ti (Desktop)
172 [X] AMD Ryzen 9 3900X 3.8GHz
GeForce RTX 2080 Ti (Desktop)
196 ~ 180 fps
155%
GeForce RTX 2070 Super Mobile:
150 fps
100%
GeForce RTX 2080 Max-Q:
84 93 ~ 89 fps
162%
GeForce RTX 2080 Ti (Desktop):
124 [X] AMD Ryzen 9 3900X 3.8GHz
GeForce RTX 2080 Ti (Desktop)
147 [X] AMD Ryzen 9 3900X 3.8GHz
GeForce RTX 2080 Ti (Desktop)
162 ~ 144 fps
139%
GeForce RTX 2070 Super Mobile:
124 fps
100%
GeForce RTX 2080 Max-Q:
69 77 ~ 73 fps
174%
GeForce RTX 2080 Ti (Desktop):
123 [X] AMD Ryzen 9 3900X 3.8GHz
GeForce RTX 2080 Ti (Desktop)
125 [X] AMD Ryzen 9 3900X 3.8GHz
GeForce RTX 2080 Ti (Desktop)
133 ~ 127 fps
119%
GeForce RTX 2070 Super Mobile:
87 fps
GeForce RTX 2080 Ti (Desktop):
92 [X] AMD Ryzen 9 3900X 3.8GHz
GeForce RTX 2080 Ti (Desktop)
97 [X] AMD Ryzen 9 3900X 3.8GHz
GeForce RTX 2080 Ti (Desktop)
100 ~ 96 fps
GeForce RTX 2070 Super Mobile:
61 fps
100%
GeForce RTX 2080 Max-Q:
26 fps
212%
GeForce RTX 2080 Ti (Desktop):
53 [X] AMD Ryzen 9 3900X 3.8GHz
GeForce RTX 2080 Ti (Desktop)
56 57 [X] AMD Ryzen 9 3900X 3.8GHz
GeForce RTX 2080 Ti (Desktop)
~ 55 fps
123%
GeForce RTX 2070 Super Mobile:
32 fps
100%
GeForce RTX 2080 Max-Q:
157.8 fps
193%
GeForce RTX 2080 Ti (Desktop):
302 [X] AMD Ryzen 9 3900X 3.8GHz
GeForce RTX 2080 Ti (Desktop)
min:
279 fps, max:
319 fps
306 [X] Corsair One i160 Intel Core i9-9900K 3.6GHz
GeForce RTX 2080 Ti (Desktop)
min:
274 fps, max:
324 fps
~ 304 fps
100%
GeForce RTX 2080 Max-Q:
116.1 fps
196%
GeForce RTX 2080 Ti (Desktop):
212 [X] AMD Ryzen 9 3900X 3.8GHz
GeForce RTX 2080 Ti (Desktop)
min:
171 fps, max:
247 fps
244 [X] Corsair One i160 Intel Core i9-9900K 3.6GHz
GeForce RTX 2080 Ti (Desktop)
min:
185 fps, max:
276 fps
~ 228 fps
182%
GeForce RTX 2070 Super Mobile:
211 fps
100%
GeForce RTX 2080 Max-Q:
101.1 143 ~ 122 fps
180%
GeForce RTX 2080 Ti (Desktop):
200 [X] AMD Ryzen 9 3900X 3.8GHz
GeForce RTX 2080 Ti (Desktop)
min:
156 fps, max:
237 fps
239 [X] Corsair One i160 Intel Core i9-9900K 3.6GHz
GeForce RTX 2080 Ti (Desktop)
min:
207 fps, max:
267 fps
~ 220 fps
146%
GeForce RTX 2070 Super Mobile:
178 fps
100%
GeForce RTX 2080 Max-Q:
66.3 85.1 ~ 76 fps
218%
GeForce RTX 2080 Ti (Desktop):
139 [X] AMD Ryzen 9 3900X 3.8GHz
GeForce RTX 2080 Ti (Desktop)
min:
104 fps, max:
170 fps
192 [X] Corsair One i160 Intel Core i9-9900K 3.6GHz
GeForce RTX 2080 Ti (Desktop)
min:
165 fps, max:
209 fps
~ 166 fps
129%
GeForce RTX 2070 Super Mobile:
97.7 fps
GeForce RTX 2080 Ti (Desktop):
112 [X] AMD Ryzen 9 3900X 3.8GHz
GeForce RTX 2080 Ti (Desktop)
min:
89 fps, max:
135 fps
153 [X] Corsair One i160 Intel Core i9-9900K 3.6GHz
GeForce RTX 2080 Ti (Desktop)
min:
141 fps, max:
166 fps
~ 133 fps
GeForce RTX 2070 Super Mobile:
72.4 fps
100%
GeForce RTX 2080 Max-Q:
31.2 fps
266%
GeForce RTX 2080 Ti (Desktop):
70 [X] AMD Ryzen 9 3900X 3.8GHz
GeForce RTX 2080 Ti (Desktop)
min:
62 fps, max:
82 fps
96 [X] Corsair One i160 Intel Core i9-9900K 3.6GHz
GeForce RTX 2080 Ti (Desktop)
min:
89 fps, max:
107 fps
~ 83 fps
100%
GeForce RTX 2080 Max-Q:
84.5 fps
138%
GeForce RTX 2080 Ti (Desktop):
90 [X] AMD Ryzen 9 3900X 3.8GHz
GeForce RTX 2080 Ti (Desktop)
min:
54 fps, max:
146 fps
127 [X] AMD Ryzen 9 3900X 3.8GHz
GeForce RTX 2080 Ti (Desktop)
min:
103 fps, max:
164 fps
134 [X] Corsair One i160 Intel Core i9-9900K 3.6GHz
GeForce RTX 2080 Ti (Desktop)
min:
80 fps, max:
175 fps
~ 117 fps
100%
GeForce RTX 2080 Max-Q:
73.7 fps
163%
GeForce RTX 2080 Ti (Desktop):
107 [X] AMD Ryzen 9 3900X 3.8GHz
GeForce RTX 2080 Ti (Desktop)
min:
81 fps, max:
142 fps
121 [X] AMD Ryzen 9 3900X 3.8GHz
GeForce RTX 2080 Ti (Desktop)
min:
99 fps, max:
167 fps
132 [X] Corsair One i160 Intel Core i9-9900K 3.6GHz
GeForce RTX 2080 Ti (Desktop)
min:
106 fps, max:
172 fps
~ 120 fps
100%
GeForce RTX 2080 Max-Q:
72.1 86.1 ~ 79 fps
149%
GeForce RTX 2080 Ti (Desktop):
104 [X] AMD Ryzen 9 3900X 3.8GHz
GeForce RTX 2080 Ti (Desktop)
min:
80 fps, max:
140 fps
120 [X] AMD Ryzen 9 3900X 3.8GHz
GeForce RTX 2080 Ti (Desktop)
min:
96 fps, max:
164 fps
129 [X] Corsair One i160 Intel Core i9-9900K 3.6GHz
GeForce RTX 2080 Ti (Desktop)
min:
103 fps, max:
167 fps
~ 118 fps
100%
GeForce RTX 2080 Max-Q:
67.4 78.9 ~ 73 fps
153%
GeForce RTX 2080 Ti (Desktop):
99 [X] AMD Ryzen 9 3900X 3.8GHz
GeForce RTX 2080 Ti (Desktop)
min:
79 fps, max:
121 fps
113 [X] AMD Ryzen 9 3900X 3.8GHz
GeForce RTX 2080 Ti (Desktop)
min:
92 fps, max:
158 fps
125 [X] Corsair One i160 Intel Core i9-9900K 3.6GHz
GeForce RTX 2080 Ti (Desktop)
min:
98 fps, max:
160 fps
~ 112 fps
GeForce RTX 2080 Ti (Desktop):
99 [X] AMD Ryzen 9 3900X 3.8GHz
GeForce RTX 2080 Ti (Desktop)
min:
77 fps, max:
125 fps
105 [X] AMD Ryzen 9 3900X 3.8GHz
GeForce RTX 2080 Ti (Desktop)
min:
77 fps, max:
136 fps
115 [X] Corsair One i160 Intel Core i9-9900K 3.6GHz
GeForce RTX 2080 Ti (Desktop)
min:
65 fps, max:
145 fps
~ 106 fps
100%
GeForce RTX 2080 Max-Q:
26.4 fps
261%
GeForce RTX 2080 Ti (Desktop):
65 [X] AMD Ryzen 9 3900X 3.8GHz
GeForce RTX 2080 Ti (Desktop)
min:
56 fps, max:
81 fps
70 [X] AMD Ryzen 9 3900X 3.8GHz
GeForce RTX 2080 Ti (Desktop)
min:
59 fps, max:
86 fps
71 [X] Corsair One i160 Intel Core i9-9900K 3.6GHz
GeForce RTX 2080 Ti (Desktop)
min:
63 fps, max:
86 fps
~ 69 fps
100%
GeForce RTX 2080 Max-Q:
101 110 116 ~ 109 fps
122%
GeForce RTX 2080 Ti (Desktop):
128 [X] AMD Ryzen 9 3900X 3.8GHz
GeForce RTX 2080 Ti (Desktop)
min:
97 fps, max:
187 fps
130 [X] AMD Ryzen 9 3900X 3.8GHz
GeForce RTX 2080 Ti (Desktop)
min:
99 fps, max:
191 fps
142 [X] Corsair One i160 Intel Core i9-9900K 3.6GHz
GeForce RTX 2080 Ti (Desktop)
min:
105 fps, max:
205 fps
~ 133 fps
100%
GeForce RTX 2080 Max-Q:
88 95 98 ~ 94 fps
121%
GeForce RTX 2080 Ti (Desktop):
108 [X] AMD Ryzen 9 3900X 3.8GHz
GeForce RTX 2080 Ti (Desktop)
min:
84 fps, max:
157 fps
110 [X] AMD Ryzen 9 3900X 3.8GHz
GeForce RTX 2080 Ti (Desktop)
min:
88 fps, max:
161 fps
123 [X] Corsair One i160 Intel Core i9-9900K 3.6GHz
GeForce RTX 2080 Ti (Desktop)
min:
96 fps, max:
183 fps
~ 114 fps
118%
GeForce RTX 2070 Super Mobile:
111 fps
100%
GeForce RTX 2080 Max-Q:
82 90 92 94 ~ 90 fps
122%
GeForce RTX 2080 Ti (Desktop):
104 [X] AMD Ryzen 9 3900X 3.8GHz
GeForce RTX 2080 Ti (Desktop)
min:
82 fps, max:
151 fps
106 [X] AMD Ryzen 9 3900X 3.8GHz
GeForce RTX 2080 Ti (Desktop)
min:
84 fps, max:
156 fps
119 [X] Corsair One i160 Intel Core i9-9900K 3.6GHz
GeForce RTX 2080 Ti (Desktop)
min:
93 fps, max:
173 fps
~ 110 fps
116%
GeForce RTX 2070 Super Mobile:
104 fps
100%
GeForce RTX 2080 Max-Q:
74 81 82 85 ~ 81 fps
123%
GeForce RTX 2080 Ti (Desktop):
95 [X] AMD Ryzen 9 3900X 3.8GHz
GeForce RTX 2080 Ti (Desktop)
min:
67 fps, max:
149 fps
96 [X] AMD Ryzen 9 3900X 3.8GHz
GeForce RTX 2080 Ti (Desktop)
min:
69 fps, max:
151 fps
108 [X] Corsair One i160 Intel Core i9-9900K 3.6GHz
GeForce RTX 2080 Ti (Desktop)
min:
77 fps, max:
169 fps
~ 100 fps
116%
GeForce RTX 2070 Super Mobile:
94 fps
GeForce RTX 2080 Ti (Desktop):
92 [X] AMD Ryzen 9 3900X 3.8GHz
GeForce RTX 2080 Ti (Desktop)
min:
66 fps, max:
147 fps
98 [X] AMD Ryzen 9 3900X 3.8GHz
GeForce RTX 2080 Ti (Desktop)
min:
69 fps, max:
152 fps
104 [X] Corsair One i160 Intel Core i9-9900K 3.6GHz
GeForce RTX 2080 Ti (Desktop)
min:
75 fps, max:
156 fps
~ 98 fps
GeForce RTX 2070 Super Mobile:
89 fps
100%
GeForce RTX 2080 Max-Q:
36 fps
211%
GeForce RTX 2080 Ti (Desktop):
73 [X] AMD Ryzen 9 3900X 3.8GHz
GeForce RTX 2080 Ti (Desktop)
min:
59 fps, max:
92 fps
77 [X] AMD Ryzen 9 3900X 3.8GHz
GeForce RTX 2080 Ti (Desktop)
min:
60 fps, max:
96 fps
79 [X] Corsair One i160 Intel Core i9-9900K 3.6GHz
GeForce RTX 2080 Ti (Desktop)
min:
66 fps, max:
97 fps
~ 76 fps
139%
GeForce RTX 2070 Super Mobile:
50 fps
119%
GeForce RTX 2080 Ti (Desktop):
142 [X] AMD Ryzen 9 3900X 3.8GHz
GeForce RTX 2080 Ti (Desktop)
min:
80 fps, max:
220 fps
143.9 [X] AMD Ryzen 9 3900X 3.8GHz
GeForce RTX 2080 Ti (Desktop)
min:
82 fps, max:
222 fps
174.9 [X] Corsair One i160 Intel Core i9-9900K 3.6GHz
GeForce RTX 2080 Ti (Desktop)
min:
280 fps, max:
94 fps
~ 154 fps
146%
GeForce RTX 2080 Ti (Desktop):
122 [X] AMD Ryzen 9 3900X 3.8GHz
GeForce RTX 2080 Ti (Desktop)
min:
62 fps, max:
184 fps
122.9 [X] AMD Ryzen 9 3900X 3.8GHz
GeForce RTX 2080 Ti (Desktop)
min:
60 fps, max:
186 fps
147.8 [X] Corsair One i160 Intel Core i9-9900K 3.6GHz
GeForce RTX 2080 Ti (Desktop)
min:
238 fps, max:
74 fps
~ 131 fps
124%
GeForce RTX 2070 Super Mobile:
112 fps
160%
GeForce RTX 2080 Ti (Desktop):
104.4 [X] AMD Ryzen 9 3900X 3.8GHz
GeForce RTX 2080 Ti (Desktop)
min:
55 fps, max:
160 fps
105 [X] AMD Ryzen 9 3900X 3.8GHz
GeForce RTX 2080 Ti (Desktop)
min:
55 fps, max:
163 fps
118.5 [X] Corsair One i160 Intel Core i9-9900K 3.6GHz
GeForce RTX 2080 Ti (Desktop)
min:
199 fps, max:
60 fps
~ 109 fps
122%
GeForce RTX 2070 Super Mobile:
82.7 fps
100%
GeForce RTX 2080 Max-Q:
47.8 54 58.4 [X] Lenovo LEGION Y740 Intel Core i7-9750H 2.6GHz
GeForce RTX 2080 Max-Q
59 59 62 [X] Asus ROG GX701G Intel Core i7-9750H 2.6GHz
GeForce RTX 2080 Max-Q
~ 57 fps
165%
GeForce RTX 2080 Ti (Desktop):
89.7 [X] AMD Ryzen 9 3900X 3.8GHz
GeForce RTX 2080 Ti (Desktop)
min:
46 fps, max:
140 fps
93 [X] AMD Ryzen 9 3900X 3.8GHz
GeForce RTX 2080 Ti (Desktop)
min:
48 fps, max:
144 fps
98.6 [X] Corsair One i160 Intel Core i9-9900K 3.6GHz
GeForce RTX 2080 Ti (Desktop)
min:
165 fps, max:
52 fps
~ 94 fps
115%
GeForce RTX 2070 Super Mobile:
65.5 fps
GeForce RTX 2080 Ti (Desktop):
71.9 [X] AMD Ryzen 9 3900X 3.8GHz
GeForce RTX 2080 Ti (Desktop)
min:
40 fps, max:
108 fps
76 [X] AMD Ryzen 9 3900X 3.8GHz
GeForce RTX 2080 Ti (Desktop)
min:
41 fps, max:
119 fps
77.9 [X] Corsair One i160 Intel Core i9-9900K 3.6GHz
GeForce RTX 2080 Ti (Desktop)
min:
123 fps, max:
46 fps
~ 75 fps
GeForce RTX 2070 Super Mobile:
54.4 fps
100%
GeForce RTX 2080 Max-Q:
20.9 fps
239%
GeForce RTX 2080 Ti (Desktop):
47.5 [X] AMD Ryzen 9 3900X 3.8GHz
GeForce RTX 2080 Ti (Desktop)
min:
31 fps, max:
69 fps
50.5 [X] Corsair One i160 Intel Core i9-9900K 3.6GHz
GeForce RTX 2080 Ti (Desktop)
min:
77 fps, max:
33 fps
51 [X] AMD Ryzen 9 3900X 3.8GHz
GeForce RTX 2080 Ti (Desktop)
min:
33 fps, max:
74 fps
~ 50 fps
153%
GeForce RTX 2070 Super Mobile:
31.9 fps
100%
GeForce RTX 2080 Max-Q:
143.7 fps
100%
GeForce RTX 2080 Ti (Desktop):
144 [X] Corsair One i160 Intel Core i9-9900K 3.6GHz
GeForce RTX 2080 Ti (Desktop)
min:
143 fps, max:
145 fps
144 [X] AMD Ryzen 9 3900X 3.8GHz
GeForce RTX 2080 Ti (Desktop)
~ 144 fps
100%
GeForce RTX 2080 Max-Q:
137.1 fps
105%
GeForce RTX 2080 Ti (Desktop):
144 [X] Corsair One i160 Intel Core i9-9900K 3.6GHz
GeForce RTX 2080 Ti (Desktop)
min:
143 fps, max:
145 fps
144 [X] AMD Ryzen 9 3900X 3.8GHz
GeForce RTX 2080 Ti (Desktop)
~ 144 fps
105%
GeForce RTX 2070 Super Mobile:
144 fps
100%
GeForce RTX 2080 Max-Q:
111.8 130 ~ 121 fps
119%
GeForce RTX 2080 Ti (Desktop):
144 [X] Corsair One i160 Intel Core i9-9900K 3.6GHz
GeForce RTX 2080 Ti (Desktop)
min:
143 fps, max:
145 fps
144 [X] AMD Ryzen 9 3900X 3.8GHz
GeForce RTX 2080 Ti (Desktop)
~ 144 fps
119%
GeForce RTX 2070 Super Mobile:
144 fps
100%
GeForce RTX 2080 Max-Q:
109.9 128 ~ 119 fps
121%
GeForce RTX 2080 Ti (Desktop):
144 [X] Corsair One i160 Intel Core i9-9900K 3.6GHz
GeForce RTX 2080 Ti (Desktop)
min:
143 fps, max:
145 fps
144 [X] AMD Ryzen 9 3900X 3.8GHz
GeForce RTX 2080 Ti (Desktop)
~ 144 fps
121%
GeForce RTX 2070 Super Mobile:
144 fps
GeForce RTX 2080 Ti (Desktop):
144 [X] Corsair One i160 Intel Core i9-9900K 3.6GHz
GeForce RTX 2080 Ti (Desktop)
min:
143 fps, max:
145 fps
144 [X] AMD Ryzen 9 3900X 3.8GHz
GeForce RTX 2080 Ti (Desktop)
~ 144 fps
GeForce RTX 2070 Super Mobile:
121 fps
100%
GeForce RTX 2080 Max-Q:
36 fps
308%
GeForce RTX 2080 Ti (Desktop):
109 [X] AMD Ryzen 9 3900X 3.8GHz
GeForce RTX 2080 Ti (Desktop)
112 [X] Corsair One i160 Intel Core i9-9900K 3.6GHz
GeForce RTX 2080 Ti (Desktop)
min:
103 fps, max:
133 fps
~ 111 fps
185%
GeForce RTX 2070 Super Mobile:
66.6 fps
GeForce RTX 2080 Ti (Desktop):
227 [X] AMD Ryzen 9 3900X 3.8GHz
GeForce RTX 2080 Ti (Desktop)
min:
201 fps, max:
244 fps
237 [X] Corsair One i160 Intel Core i9-9900K 3.6GHz
GeForce RTX 2080 Ti (Desktop)
min:
225 fps, max:
252 fps
~ 232 fps
100%
GeForce RTX 2080 Max-Q:
137 140 [X] Acer Triton 500 Intel Core i7-8750H 2.2GHz
GeForce RTX 2080 Max-Q
min:
128 fps
~ 139 fps
142%
GeForce RTX 2080 Ti (Desktop):
195 [X] AMD Ryzen 9 3900X 3.8GHz
GeForce RTX 2080 Ti (Desktop)
min:
183 fps, max:
204 fps
199 [X] Corsair One i160 Intel Core i9-9900K 3.6GHz
GeForce RTX 2080 Ti (Desktop)
min:
186 fps, max:
210 fps
~ 197 fps
117%
GeForce RTX 2070 Super Mobile:
162 fps
100%
GeForce RTX 2080 Max-Q:
103 104 [X] Acer Triton 500 Intel Core i7-8750H 2.2GHz
GeForce RTX 2080 Max-Q
min:
97 fps
~ 104 fps
150%
GeForce RTX 2080 Ti (Desktop):
153 [X] AMD Ryzen 9 3900X 3.8GHz
GeForce RTX 2080 Ti (Desktop)
min:
142 fps, max:
159 fps
158 [X] Corsair One i160 Intel Core i9-9900K 3.6GHz
GeForce RTX 2080 Ti (Desktop)
min:
147 fps, max:
165 fps
~ 156 fps
114%
GeForce RTX 2070 Super Mobile:
119 fps
100%
GeForce RTX 2080 Max-Q:
98.1 [X] Acer Triton 500 Intel Core i7-8750H 2.2GHz
GeForce RTX 2080 Max-Q
min:
89 fps
101 ~ 100 fps
149%
GeForce RTX 2080 Ti (Desktop):
148 [X] AMD Ryzen 9 3900X 3.8GHz
GeForce RTX 2080 Ti (Desktop)
min:
138 fps, max:
154 fps
149 [X] Corsair One i160 Intel Core i9-9900K 3.6GHz
GeForce RTX 2080 Ti (Desktop)
min:
139 fps, max:
157 fps
~ 149 fps
105%
GeForce RTX 2070 Super Mobile:
105 fps
100%
GeForce RTX 2080 Max-Q:
67.6 [X] Acer Triton 500 Intel Core i7-8750H 2.2GHz
GeForce RTX 2080 Max-Q
min:
62 fps
69.9 ~ 69 fps
162%
GeForce RTX 2080 Ti (Desktop):
111 [X] AMD Ryzen 9 3900X 3.8GHz
GeForce RTX 2080 Ti (Desktop)
min:
103 fps, max:
118 fps
112 [X] Corsair One i160 Intel Core i9-9900K 3.6GHz
GeForce RTX 2080 Ti (Desktop)
min:
104 fps, max:
120 fps
~ 112 fps
109%
GeForce RTX 2070 Super Mobile:
75 fps
100%
GeForce RTX 2080 Max-Q:
39.5 [X] Acer Triton 500 Intel Core i7-8750H 2.2GHz
GeForce RTX 2080 Max-Q
min:
36 fps
39.9 ~ 40 fps
165%
GeForce RTX 2080 Ti (Desktop):
65 [X] Corsair One i160 Intel Core i9-9900K 3.6GHz
GeForce RTX 2080 Ti (Desktop)
min:
60 fps, max:
69 fps
67 [X] AMD Ryzen 9 3900X 3.8GHz
GeForce RTX 2080 Ti (Desktop)
min:
63 fps, max:
72 fps
~ 66 fps
103%
GeForce RTX 2070 Super Mobile:
41.2 fps
100%
GeForce RTX 2080 Max-Q:
137 fps
152%
GeForce RTX 2080 Ti (Desktop):
159 [X] AMD Ryzen 9 3900X 3.8GHz
GeForce RTX 2080 Ti (Desktop)
min:
58 fps, max:
212 fps
256 [X] Corsair One i160 Intel Core i9-9900K 3.6GHz
GeForce RTX 2080 Ti (Desktop)
min:
120 fps, max:
332 fps
~ 208 fps
100%
GeForce RTX 2080 Max-Q:
103.5 126 [X] Acer Triton 500 Intel Core i7-8750H 2.2GHz
GeForce RTX 2080 Max-Q
min:
82 fps
130 ~ 120 fps
113%
GeForce RTX 2080 Ti (Desktop):
100 [X] AMD Ryzen 9 3900X 3.8GHz
GeForce RTX 2080 Ti (Desktop)
min:
51 fps, max:
127 fps
170 [X] Corsair One i160 Intel Core i9-9900K 3.6GHz
GeForce RTX 2080 Ti (Desktop)
min:
105 fps, max:
205 fps
~ 135 fps
138%
GeForce RTX 2070 Super Mobile:
166 fps
100%
GeForce RTX 2080 Max-Q:
84.5 [X] Gigabyte Aero 15-Y9 Single-Channel
Intel Core i9-8950HK 2.9GHz
GeForce RTX 2080 Max-Q
94.3 110 [X] Acer Triton 500 Intel Core i7-8750H 2.2GHz
GeForce RTX 2080 Max-Q
min:
77 fps
121 ~ 102 fps
125%
GeForce RTX 2080 Ti (Desktop):
96 [X] AMD Ryzen 9 3900X 3.8GHz
GeForce RTX 2080 Ti (Desktop)
min:
51 fps, max:
124 fps
158 [X] Corsair One i160 Intel Core i9-9900K 3.6GHz
GeForce RTX 2080 Ti (Desktop)
min:
93 fps, max:
199 fps
~ 127 fps
138%
GeForce RTX 2070 Super Mobile:
141 fps
100%
GeForce RTX 2080 Max-Q:
81.4 [X] Gigabyte Aero 15-Y9 Single-Channel
Intel Core i9-8950HK 2.9GHz
GeForce RTX 2080 Max-Q
84.8 103 [X] Acer Triton 500 Intel Core i7-8750H 2.2GHz
GeForce RTX 2080 Max-Q
min:
74 fps
112 ~ 95 fps
127%
GeForce RTX 2080 Ti (Desktop):
91 [X] AMD Ryzen 9 3900X 3.8GHz
GeForce RTX 2080 Ti (Desktop)
min:
43 fps, max:
119 fps
151 [X] Corsair One i160 Intel Core i9-9900K 3.6GHz
GeForce RTX 2080 Ti (Desktop)
min:
89 fps, max:
192 fps
~ 121 fps
134%
GeForce RTX 2070 Super Mobile:
127 fps
100%
GeForce RTX 2080 Max-Q:
75.2 [X] Acer Triton 500 Intel Core i7-8750H 2.2GHz
GeForce RTX 2080 Max-Q
min:
64 fps
82.6 ~ 79 fps
142%
GeForce RTX 2080 Ti (Desktop):
91 [X] AMD Ryzen 9 3900X 3.8GHz
GeForce RTX 2080 Ti (Desktop)
min:
41 fps, max:
119 fps
133 [X] Corsair One i160 Intel Core i9-9900K 3.6GHz
GeForce RTX 2080 Ti (Desktop)
min:
86 fps, max:
153 fps
~ 112 fps
112%
GeForce RTX 2070 Super Mobile:
88.3 fps
100%
GeForce RTX 2080 Max-Q:
29.8 37.8 [X] Acer Triton 500 Intel Core i7-8750H 2.2GHz
GeForce RTX 2080 Max-Q
min:
32 fps
42.7 ~ 37 fps
192%
GeForce RTX 2080 Ti (Desktop):
68 [X] AMD Ryzen 9 3900X 3.8GHz
GeForce RTX 2080 Ti (Desktop)
min:
46 fps, max:
77 fps
73 [X] Corsair One i160 Intel Core i9-9900K 3.6GHz
GeForce RTX 2080 Ti (Desktop)
min:
62 fps, max:
83 fps
~ 71 fps
119%
GeForce RTX 2070 Super Mobile:
44 fps
GeForce RTX 2080 Ti (Desktop):
181 [X] AMD Ryzen 9 3900X 3.8GHz
GeForce RTX 2080 Ti (Desktop)
min:
139 fps, max:
201 fps
196 [X] Corsair One i160 Intel Core i9-9900K 3.6GHz
GeForce RTX 2080 Ti (Desktop)
min:
170 fps, max:
201 fps
~ 189 fps
100%
GeForce RTX 2080 Max-Q:
131 [X] Acer Triton 500 Intel Core i7-8750H 2.2GHz
GeForce RTX 2080 Max-Q
min:
102 fps
143 ~ 137 fps
124%
GeForce RTX 2080 Ti (Desktop):
147 [X] AMD Ryzen 9 3900X 3.8GHz
GeForce RTX 2080 Ti (Desktop)
min:
121 fps, max:
186 fps
193 [X] Corsair One i160 Intel Core i9-9900K 3.6GHz
GeForce RTX 2080 Ti (Desktop)
min:
161 fps, max:
201 fps
~ 170 fps
121%
GeForce RTX 2070 Super Mobile:
166 fps
100%
GeForce RTX 2080 Max-Q:
121 [X] Acer Triton 500 Intel Core i7-8750H 2.2GHz
GeForce RTX 2080 Max-Q
min:
96 fps
130 ~ 126 fps
130%
GeForce RTX 2080 Ti (Desktop):
137 [X] AMD Ryzen 9 3900X 3.8GHz
GeForce RTX 2080 Ti (Desktop)
min:
111 fps, max:
185 fps
190 [X] Corsair One i160 Intel Core i9-9900K 3.6GHz
GeForce RTX 2080 Ti (Desktop)
min:
161 fps, max:
201 fps
~ 164 fps
121%
GeForce RTX 2070 Super Mobile:
152 fps
100%
GeForce RTX 2080 Max-Q:
112 116 [X] Acer Triton 500 Intel Core i7-8750H 2.2GHz
GeForce RTX 2080 Max-Q
min:
88 fps
122 ~ 117 fps
136%
GeForce RTX 2080 Ti (Desktop):
127 [X] AMD Ryzen 9 3900X 3.8GHz
GeForce RTX 2080 Ti (Desktop)
min:
102 fps, max:
175 fps
190 [X] Corsair One i160 Intel Core i9-9900K 3.6GHz
GeForce RTX 2080 Ti (Desktop)
min:
160 fps, max:
201 fps
~ 159 fps
121%
GeForce RTX 2070 Super Mobile:
141 fps
100%
GeForce RTX 2080 Max-Q:
91.2 91.6 [X] Acer Triton 500 Intel Core i7-8750H 2.2GHz
GeForce RTX 2080 Max-Q
min:
72 fps
98.2 ~ 94 fps
143%
GeForce RTX 2080 Ti (Desktop):
108 [X] AMD Ryzen 9 3900X 3.8GHz
GeForce RTX 2080 Ti (Desktop)
min:
87 fps, max:
153 fps
159 [X] Corsair One i160 Intel Core i9-9900K 3.6GHz
GeForce RTX 2080 Ti (Desktop)
min:
126 fps, max:
201 fps
~ 134 fps
117%
GeForce RTX 2070 Super Mobile:
110 fps
100%
GeForce RTX 2080 Max-Q:
52.4 52.5 [X] Acer Triton 500 Intel Core i7-8750H 2.2GHz
GeForce RTX 2080 Max-Q
min:
42 fps
57.8 ~ 54 fps
159%
GeForce RTX 2080 Ti (Desktop):
73 [X] AMD Ryzen 9 3900X 3.8GHz
GeForce RTX 2080 Ti (Desktop)
min:
61 fps, max:
110 fps
99 [X] Corsair One i160 Intel Core i9-9900K 3.6GHz
GeForce RTX 2080 Ti (Desktop)
min:
80 fps, max:
156 fps
~ 86 fps
116%
GeForce RTX 2070 Super Mobile:
62.7 fps
GeForce RTX 2080 Ti (Desktop):
220 [X] AMD Ryzen 9 3900X 3.8GHz
GeForce RTX 2080 Ti (Desktop)
min:
197 fps, max:
288 fps
269 [X] Corsair One i160 Intel Core i9-9900K 3.6GHz
GeForce RTX 2080 Ti (Desktop)
min:
198 fps, max:
378 fps
~ 245 fps
100%
GeForce RTX 2080 Max-Q:
144 [X] Acer Triton 500 Intel Core i7-8750H 2.2GHz
GeForce RTX 2080 Max-Q
min:
123 fps
161 ~ 153 fps
120%
GeForce RTX 2080 Ti (Desktop):
163 [X] AMD Ryzen 9 3900X 3.8GHz
GeForce RTX 2080 Ti (Desktop)
min:
138 fps, max:
215 fps
204 [X] Corsair One i160 Intel Core i9-9900K 3.6GHz
GeForce RTX 2080 Ti (Desktop)
min:
172 fps, max:
280 fps
~ 184 fps
100%
GeForce RTX 2080 Max-Q:
130 [X] Acer Triton 500 Intel Core i7-8750H 2.2GHz
GeForce RTX 2080 Max-Q
min:
112 fps
141 ~ 136 fps
117%
GeForce RTX 2080 Ti (Desktop):
143 [X] AMD Ryzen 9 3900X 3.8GHz
GeForce RTX 2080 Ti (Desktop)
min:
127 fps, max:
186 fps
175 [X] Corsair One i160 Intel Core i9-9900K 3.6GHz
GeForce RTX 2080 Ti (Desktop)
min:
152 fps, max:
251 fps
~ 159 fps
100%
GeForce RTX 2080 Max-Q:
121 [X] Acer Triton 500 Intel Core i7-8750H 2.2GHz
GeForce RTX 2080 Max-Q
min:
101 fps
131 ~ 126 fps
116%
GeForce RTX 2080 Ti (Desktop):
133 [X] AMD Ryzen 9 3900X 3.8GHz
GeForce RTX 2080 Ti (Desktop)
min:
115 fps, max:
173 fps
158 [X] Corsair One i160 Intel Core i9-9900K 3.6GHz
GeForce RTX 2080 Ti (Desktop)
min:
131 fps, max:
219 fps
~ 146 fps
100%
GeForce RTX 2080 Max-Q:
107 [X] Acer Triton 500 Intel Core i7-8750H 2.2GHz
GeForce RTX 2080 Max-Q
min:
89 fps
113 ~ 110 fps
133%
GeForce RTX 2080 Ti (Desktop):
132 [X] AMD Ryzen 9 3900X 3.8GHz
GeForce RTX 2080 Ti (Desktop)
min:
118 fps, max:
178 fps
159 [X] Corsair One i160 Intel Core i9-9900K 3.6GHz
GeForce RTX 2080 Ti (Desktop)
min:
132 fps, max:
226 fps
~ 146 fps
GeForce RTX 2080 Ti (Desktop):
104 [X] AMD Ryzen 9 3900X 3.8GHz
GeForce RTX 2080 Ti (Desktop)
min:
79 fps, max:
170 fps
110 [X] Corsair One i160 Intel Core i9-9900K 3.6GHz
GeForce RTX 2080 Ti (Desktop)
min:
81 fps, max:
200 fps
~ 107 fps
GeForce RTX 2080 Ti (Desktop):
66 [X] AMD Ryzen 9 3900X 3.8GHz
GeForce RTX 2080 Ti (Desktop)
min:
50 fps, max:
86 fps
110 [X] Corsair One i160 Intel Core i9-9900K 3.6GHz
GeForce RTX 2080 Ti (Desktop)
min:
88 fps, max:
139 fps
~ 88 fps
100%
GeForce RTX 2080 Max-Q:
77.9 [X] Acer Triton 500 Intel Core i7-8750H 2.2GHz
GeForce RTX 2080 Max-Q
min:
59 fps
78.8 ~ 78 fps
109%
GeForce RTX 2080 Ti (Desktop):
63 [X] AMD Ryzen 9 3900X 3.8GHz
GeForce RTX 2080 Ti (Desktop)
min:
47 fps, max:
84 fps
106 [X] Corsair One i160 Intel Core i9-9900K 3.6GHz
GeForce RTX 2080 Ti (Desktop)
min:
86 fps, max:
135 fps
~ 85 fps
127%
GeForce RTX 2070 Super Mobile:
98.8 fps
100%
GeForce RTX 2080 Max-Q:
70.3 [X] Acer Triton 500 Intel Core i7-8750H 2.2GHz
GeForce RTX 2080 Max-Q
min:
51 fps
70.9 ~ 71 fps
108%
GeForce RTX 2080 Ti (Desktop):
56.8 [X] AMD Ryzen 9 3900X 3.8GHz
GeForce RTX 2080 Ti (Desktop)
min:
43 fps, max:
84 fps
98 [X] Corsair One i160 Intel Core i9-9900K 3.6GHz
GeForce RTX 2080 Ti (Desktop)
min:
75 fps, max:
134 fps
~ 77 fps
126%
GeForce RTX 2070 Super Mobile:
89.7 fps
100%
GeForce RTX 2080 Max-Q:
67.1 [X] Acer Triton 500 Intel Core i7-8750H 2.2GHz
GeForce RTX 2080 Max-Q
min:
45 fps
69.1 ~ 68 fps
109%
GeForce RTX 2080 Ti (Desktop):
55.8 [X] AMD Ryzen 9 3900X 3.8GHz
GeForce RTX 2080 Ti (Desktop)
min:
41 fps, max:
78 fps
93 [X] Corsair One i160 Intel Core i9-9900K 3.6GHz
GeForce RTX 2080 Ti (Desktop)
min:
71 fps, max:
130 fps
~ 74 fps
121%
GeForce RTX 2070 Super Mobile:
82.5 fps
100%
GeForce RTX 2080 Max-Q:
65.3 [X] Acer Triton 500 Intel Core i7-8750H 2.2GHz
GeForce RTX 2080 Max-Q
min:
44 fps
66 ~ 66 fps
112%
GeForce RTX 2080 Ti (Desktop):
55.1 [X] AMD Ryzen 9 3900X 3.8GHz
GeForce RTX 2080 Ti (Desktop)
min:
40 fps, max:
77 fps
92 [X] Corsair One i160 Intel Core i9-9900K 3.6GHz
GeForce RTX 2080 Ti (Desktop)
min:
71 fps, max:
128 fps
~ 74 fps
119%
GeForce RTX 2070 Super Mobile:
78.8 fps
100%
GeForce RTX 2080 Max-Q:
38.2 [X] Acer Triton 500 Intel Core i7-8750H 2.2GHz
GeForce RTX 2080 Max-Q
min:
32 fps
fps
162%
GeForce RTX 2080 Ti (Desktop):
54.8 [X] AMD Ryzen 9 3900X 3.8GHz
GeForce RTX 2080 Ti (Desktop)
min:
40 fps, max:
79 fps
69 [X] Corsair One i160 Intel Core i9-9900K 3.6GHz
GeForce RTX 2080 Ti (Desktop)
min:
54 fps, max:
79 fps
~ 62 fps
121%
GeForce RTX 2070 Super Mobile:
46.4 fps
GeForce RTX 2080 Ti (Desktop):
281 [X] Corsair One i160 Intel Core i9-9900K 3.6GHz
GeForce RTX 2080 Ti (Desktop)
min:
240 fps, max:
320 fps
288 [X] AMD Ryzen 9 3900X 3.8GHz
GeForce RTX 2080 Ti (Desktop)
min:
253 fps, max:
329 fps
~ 285 fps
100%
GeForce RTX 2080 Max-Q:
140 [X] Asus GX701GX (Optimus-Mode) Intel Core i7-8750H 2.2GHz
GeForce RTX 2080 Max-Q
min:
111 fps
142 [X] Acer Triton 500 Intel Core i7-8750H 2.2GHz
GeForce RTX 2080 Max-Q
min:
102 fps
151 ~ 144 fps
169%
GeForce RTX 2080 Ti (Desktop):
241 [X] AMD Ryzen 9 3900X 3.8GHz
GeForce RTX 2080 Ti (Desktop)
min:
182 fps, max:
279 fps
246 [X] Corsair One i160 Intel Core i9-9900K 3.6GHz
GeForce RTX 2080 Ti (Desktop)
min:
199 fps, max:
286 fps
~ 244 fps
100%
GeForce RTX 2080 Max-Q:
128 [X] Asus GX701GX (Optimus-Mode) Intel Core i7-8750H 2.2GHz
GeForce RTX 2080 Max-Q
min:
106 fps
132 [X] Acer Triton 500 Intel Core i7-8750H 2.2GHz
GeForce RTX 2080 Max-Q
min:
99 fps
138 ~ 133 fps
177%
GeForce RTX 2080 Ti (Desktop):
232 [X] AMD Ryzen 9 3900X 3.8GHz
GeForce RTX 2080 Ti (Desktop)
min:
170 fps, max:
279 fps
238 [X] Corsair One i160 Intel Core i9-9900K 3.6GHz
GeForce RTX 2080 Ti (Desktop)
min:
189 fps, max:
278 fps
~ 235 fps
100%
GeForce RTX 2080 Max-Q:
125 [X] Asus GX701GX (Optimus-Mode) Intel Core i7-8750H 2.2GHz
GeForce RTX 2080 Max-Q
min:
101 fps
128 [X] Acer Triton 500 Intel Core i7-8750H 2.2GHz
GeForce RTX 2080 Max-Q
min:
94 fps
131 ~ 128 fps
166%
GeForce RTX 2080 Ti (Desktop):
203 [X] Corsair One i160 Intel Core i9-9900K 3.6GHz
GeForce RTX 2080 Ti (Desktop)
min:
200 fps, max:
206 fps
223 [X] AMD Ryzen 9 3900X 3.8GHz
GeForce RTX 2080 Ti (Desktop)
min:
176 fps, max:
271 fps
~ 213 fps
100%
GeForce RTX 2080 Max-Q:
83.8 [X] Acer Triton 500 Intel Core i7-8750H 2.2GHz
GeForce RTX 2080 Max-Q
min:
62 fps
91.4 ~ 88 fps
189%
GeForce RTX 2080 Ti (Desktop):
159 [X] AMD Ryzen 9 3900X 3.8GHz
GeForce RTX 2080 Ti (Desktop)
min:
118 fps, max:
198 fps
172 [X] Corsair One i160 Intel Core i9-9900K 3.6GHz
GeForce RTX 2080 Ti (Desktop)
min:
128 fps, max:
212 fps
~ 166 fps
100%
GeForce RTX 2080 Max-Q:
40.4 [X] Acer Triton 500 Intel Core i7-8750H 2.2GHz
GeForce RTX 2080 Max-Q
min:
30 fps
41.6 ~ 41 fps
212%
GeForce RTX 2080 Ti (Desktop):
84 [X] AMD Ryzen 9 3900X 3.8GHz
GeForce RTX 2080 Ti (Desktop)
min:
64 fps, max:
105 fps
89 [X] Corsair One i160 Intel Core i9-9900K 3.6GHz
GeForce RTX 2080 Ti (Desktop)
min:
66 fps, max:
112 fps
~ 87 fps
GeForce RTX 2080 Ti (Desktop):
135 [X] AMD Ryzen 9 3900X 3.8GHz
GeForce RTX 2080 Ti (Desktop)
139 ~ 137 fps
100%
GeForce RTX 2080 Max-Q:
68 [X] Acer Triton 500 Intel Core i7-8750H 2.2GHz
GeForce RTX 2080 Max-Q
min:
39 fps
81 [X] Asus GX701GX (Optimus-Mode) Intel Core i7-8750H 2.2GHz
GeForce RTX 2080 Max-Q
87 ~ 79 fps
158%
GeForce RTX 2080 Ti (Desktop):
121 [X] AMD Ryzen 9 3900X 3.8GHz
GeForce RTX 2080 Ti (Desktop)
129 ~ 125 fps
132%
GeForce RTX 2070 Super Mobile:
104 fps
100%
GeForce RTX 2080 Max-Q:
64 [X] Acer Triton 500 Intel Core i7-8750H 2.2GHz
GeForce RTX 2080 Max-Q
min:
38 fps
72 [X] Asus GX701GX (Optimus-Mode) Intel Core i7-8750H 2.2GHz
GeForce RTX 2080 Max-Q
76 ~ 71 fps
152%
GeForce RTX 2080 Ti (Desktop):
105 [X] AMD Ryzen 9 3900X 3.8GHz
GeForce RTX 2080 Ti (Desktop)
111 ~ 108 fps
127%
GeForce RTX 2070 Super Mobile:
90 fps
100%
GeForce RTX 2080 Max-Q:
53 [X] Acer Triton 500 Intel Core i7-8750H 2.2GHz
GeForce RTX 2080 Max-Q
min:
27 fps
56 [X] Asus GX701GX (Optimus-Mode) Intel Core i7-8750H 2.2GHz
GeForce RTX 2080 Max-Q
59 ~ 56 fps
146%
GeForce RTX 2080 Ti (Desktop):
80 [X] AMD Ryzen 9 3900X 3.8GHz
GeForce RTX 2080 Ti (Desktop)
83 ~ 82 fps
113%
GeForce RTX 2070 Super Mobile:
63 fps
100%
GeForce RTX 2080 Max-Q:
46 [X] Acer Triton 500 Intel Core i7-8750H 2.2GHz
GeForce RTX 2080 Max-Q
min:
19 fps
48 ~ 47 fps
153%
GeForce RTX 2080 Ti (Desktop):
71 [X] AMD Ryzen 9 3900X 3.8GHz
GeForce RTX 2080 Ti (Desktop)
72 ~ 72 fps
119%
GeForce RTX 2070 Super Mobile:
56 fps
100%
GeForce RTX 2080 Max-Q:
30 [X] Acer Triton 500 Intel Core i7-8750H 2.2GHz
GeForce RTX 2080 Max-Q
min:
15 fps
32 ~ 31 fps
161%
GeForce RTX 2080 Ti (Desktop):
46 [X] AMD Ryzen 9 3900X 3.8GHz
GeForce RTX 2080 Ti (Desktop)
53 ~ 50 fps
116%
GeForce RTX 2070 Super Mobile:
36 fps
GeForce RTX 2080 Ti (Desktop):
206 [X] AMD Ryzen 9 3900X 3.8GHz
GeForce RTX 2080 Ti (Desktop)
207 [X] AMD Ryzen 9 3900X 3.8GHz
GeForce RTX 2080 Ti (Desktop)
223 ~ 212 fps
GeForce RTX 2080 Ti (Desktop):
182 [X] AMD Ryzen 9 3900X 3.8GHz
GeForce RTX 2080 Ti (Desktop)
182 [X] AMD Ryzen 9 3900X 3.8GHz
GeForce RTX 2080 Ti (Desktop)
189 ~ 184 fps
GeForce RTX 2080 Ti (Desktop):
180 [X] AMD Ryzen 9 3900X 3.8GHz
GeForce RTX 2080 Ti (Desktop)
181 [X] AMD Ryzen 9 3900X 3.8GHz
GeForce RTX 2080 Ti (Desktop)
184 ~ 182 fps
GeForce RTX 2080 Ti (Desktop):
153 168 [X] AMD Ryzen 9 3900X 3.8GHz
GeForce RTX 2080 Ti (Desktop)
169 [X] AMD Ryzen 9 3900X 3.8GHz
GeForce RTX 2080 Ti (Desktop)
~ 163 fps
GeForce RTX 2080 Ti (Desktop):
131 147 [X] AMD Ryzen 9 3900X 3.8GHz
GeForce RTX 2080 Ti (Desktop)
150 [X] AMD Ryzen 9 3900X 3.8GHz
GeForce RTX 2080 Ti (Desktop)
~ 143 fps
GeForce RTX 2080 Ti (Desktop):
98 107 [X] AMD Ryzen 9 3900X 3.8GHz
GeForce RTX 2080 Ti (Desktop)
111 [X] AMD Ryzen 9 3900X 3.8GHz
GeForce RTX 2080 Ti (Desktop)
~ 105 fps
GeForce RTX 2080 Ti (Desktop):
358 [X] Corsair One i160 Intel Core i9-9900K 3.6GHz
GeForce RTX 2080 Ti (Desktop)
min:
334 fps, max:
393 fps
364 [X] AMD Ryzen 9 3900X 3.8GHz
GeForce RTX 2080 Ti (Desktop)
min:
335 fps, max:
419 fps
~ 361 fps
100%
GeForce RTX 2080 Max-Q:
203 [X] Asus GX701GX (Optimus-Mode) Intel Core i7-8750H 2.2GHz
GeForce RTX 2080 Max-Q
min:
189 fps
271 272 [X] Acer Triton 500 Intel Core i7-8750H 2.2GHz
GeForce RTX 2080 Max-Q
min:
252 fps
~ 249 fps
139%
GeForce RTX 2080 Ti (Desktop):
333 [X] Corsair One i160 Intel Core i9-9900K 3.6GHz
GeForce RTX 2080 Ti (Desktop)
min:
319 fps, max:
358 fps
358 [X] AMD Ryzen 9 3900X 3.8GHz
GeForce RTX 2080 Ti (Desktop)
min:
334 fps, max:
390 fps
~ 346 fps
100%
GeForce RTX 2080 Max-Q:
186 [X] Asus GX701GX (Optimus-Mode) Intel Core i7-8750H 2.2GHz
GeForce RTX 2080 Max-Q
min:
177 fps
223 [X] Acer Triton 500 Intel Core i7-8750H 2.2GHz
GeForce RTX 2080 Max-Q
min:
196 fps
254 ~ 221 fps
145%
GeForce RTX 2080 Ti (Desktop):
312 [X] Corsair One i160 Intel Core i9-9900K 3.6GHz
GeForce RTX 2080 Ti (Desktop)
min:
297 fps, max:
333 fps
330 [X] AMD Ryzen 9 3900X 3.8GHz
GeForce RTX 2080 Ti (Desktop)
min:
302 fps, max:
369 fps
~ 321 fps
100%
GeForce RTX 2080 Max-Q:
182 [X] Asus GX701GX (Optimus-Mode) Intel Core i7-8750H 2.2GHz
GeForce RTX 2080 Max-Q
min:
174 fps
219 [X] Acer Triton 500 Intel Core i7-8750H 2.2GHz
GeForce RTX 2080 Max-Q
min:
192 fps
248 ~ 216 fps
147%
GeForce RTX 2080 Ti (Desktop):
310 [X] Corsair One i160 Intel Core i9-9900K 3.6GHz
GeForce RTX 2080 Ti (Desktop)
min:
296 fps, max:
325 fps
323 [X] AMD Ryzen 9 3900X 3.8GHz
GeForce RTX 2080 Ti (Desktop)
min:
308 fps, max:
367 fps
~ 317 fps
100%
GeForce RTX 2080 Max-Q:
211 [X] Acer Triton 500 Intel Core i7-8750H 2.2GHz
GeForce RTX 2080 Max-Q
min:
187 fps
237 ~ 224 fps
140%
GeForce RTX 2080 Ti (Desktop):
306 [X] Corsair One i160 Intel Core i9-9900K 3.6GHz
GeForce RTX 2080 Ti (Desktop)
min:
279 fps, max:
330 fps
319 [X] AMD Ryzen 9 3900X 3.8GHz
GeForce RTX 2080 Ti (Desktop)
min:
301 fps, max:
348 fps
~ 313 fps
100%
GeForce RTX 2080 Max-Q:
161 [X] Acer Triton 500 Intel Core i7-8750H 2.2GHz
GeForce RTX 2080 Max-Q
min:
135 fps
188 ~ 175 fps
171%
GeForce RTX 2080 Ti (Desktop):
298 [X] AMD Ryzen 9 3900X 3.8GHz
GeForce RTX 2080 Ti (Desktop)
min:
280 fps, max:
319 fps
302 [X] Corsair One i160 Intel Core i9-9900K 3.6GHz
GeForce RTX 2080 Ti (Desktop)
min:
283 fps, max:
332 fps
~ 300 fps
122%
GeForce RTX 2080 Ti (Desktop):
148 [X] AMD Ryzen 9 3900X 3.8GHz
GeForce RTX 2080 Ti (Desktop)
167 ~ 158 fps
105%
GeForce RTX 2070 Super Mobile:
121 153 ~ 137 fps
100%
GeForce RTX 2080 Max-Q:
80 [X] Acer Triton 500 Intel Core i7-8750H 2.2GHz
GeForce RTX 2080 Max-Q
min:
43 fps
84 91 102 103 110 118 ~ 98 fps
147%
GeForce RTX 2080 Ti (Desktop):
138 [X] AMD Ryzen 9 3900X 3.8GHz
GeForce RTX 2080 Ti (Desktop)
150 ~ 144 fps
120%
GeForce RTX 2070 Super Mobile:
110 120 123 ~ 118 fps
100%
GeForce RTX 2080 Max-Q:
78 [X] Acer Triton 500 Intel Core i7-8750H 2.2GHz
GeForce RTX 2080 Max-Q
min:
42 fps
82 89 97 99 105 111 ~ 94 fps
152%
GeForce RTX 2080 Ti (Desktop):
136 [X] AMD Ryzen 9 3900X 3.8GHz
GeForce RTX 2080 Ti (Desktop)
149 ~ 143 fps
120%
GeForce RTX 2070 Super Mobile:
107 115 118 ~ 113 fps
100%
GeForce RTX 2080 Max-Q:
71 [X] Acer Triton 500 Intel Core i7-8750H 2.2GHz
GeForce RTX 2080 Max-Q
min:
39 fps
75 78 84 87 94 99 105 ~ 87 fps
156%
GeForce RTX 2080 Ti (Desktop):
130 [X] AMD Ryzen 9 3900X 3.8GHz
GeForce RTX 2080 Ti (Desktop)
142 ~ 136 fps
120%
GeForce RTX 2070 Super Mobile:
100 104 108 ~ 104 fps
100%
GeForce RTX 2080 Max-Q:
57 [X] Acer Triton 500 Intel Core i7-8750H 2.2GHz
GeForce RTX 2080 Max-Q
min:
37 fps
58 61 ~ 59 fps
186%
GeForce RTX 2080 Ti (Desktop):
108 [X] AMD Ryzen 9 3900X 3.8GHz
GeForce RTX 2080 Ti (Desktop)
112 ~ 110 fps
124%
GeForce RTX 2070 Super Mobile:
73 fps
100%
GeForce RTX 2080 Max-Q:
33 33 [X] Acer Triton 500 Intel Core i7-8750H 2.2GHz
GeForce RTX 2080 Max-Q
min:
17 fps
37 40 ~ 36 fps
169%
GeForce RTX 2080 Ti (Desktop):
60 [X] AMD Ryzen 9 3900X 3.8GHz
GeForce RTX 2080 Ti (Desktop)
61 ~ 61 fps
103%
GeForce RTX 2070 Super Mobile:
37 fps
GeForce RTX 2080 Ti (Desktop):
201 [X] AMD Ryzen 9 3900X 3.8GHz
GeForce RTX 2080 Ti (Desktop)
min:
151 fps, max:
227 fps
295 [X] Corsair One i160 Intel Core i9-9900K 3.6GHz
GeForce RTX 2080 Ti (Desktop)
min:
222 fps, max:
330 fps
~ 248 fps
100%
GeForce RTX 2080 Max-Q:
169 178 [X] Acer Triton 500 Intel Core i7-8750H 2.2GHz
GeForce RTX 2080 Max-Q
min:
112 fps
~ 174 fps
124%
GeForce RTX 2080 Ti (Desktop):
172 [X] AMD Ryzen 9 3900X 3.8GHz
GeForce RTX 2080 Ti (Desktop)
min:
134 fps, max:
197 fps
259 [X] Corsair One i160 Intel Core i9-9900K 3.6GHz
GeForce RTX 2080 Ti (Desktop)
min:
203 fps, max:
306 fps
~ 216 fps
100%
GeForce RTX 2080 Max-Q:
130 136 [X] Acer Triton 500 Intel Core i7-8750H 2.2GHz
GeForce RTX 2080 Max-Q
min:
106 fps
~ 133 fps
126%
GeForce RTX 2080 Ti (Desktop):
143 [X] AMD Ryzen 9 3900X 3.8GHz
GeForce RTX 2080 Ti (Desktop)
min:
111 fps, max:
158 fps
191 [X] Corsair One i160 Intel Core i9-9900K 3.6GHz
GeForce RTX 2080 Ti (Desktop)
min:
153 fps, max:
215 fps
~ 167 fps
100%
GeForce RTX 2080 Max-Q:
102 [X] Acer Triton 500 Intel Core i7-8750H 2.2GHz
GeForce RTX 2080 Max-Q
min:
82 fps
102 ~ 102 fps
138%
GeForce RTX 2080 Ti (Desktop):
116 [X] AMD Ryzen 9 3900X 3.8GHz
GeForce RTX 2080 Ti (Desktop)
min:
93 fps, max:
138 fps
166 [X] Corsair One i160 Intel Core i9-9900K 3.6GHz
GeForce RTX 2080 Ti (Desktop)
min:
137 fps, max:
194 fps
~ 141 fps
100%
GeForce RTX 2080 Max-Q:
86 [X] Acer Triton 500 Intel Core i7-8750H 2.2GHz
GeForce RTX 2080 Max-Q
min:
60 fps
87 ~ 87 fps
153%
GeForce RTX 2080 Ti (Desktop):
114 [X] AMD Ryzen 9 3900X 3.8GHz
GeForce RTX 2080 Ti (Desktop)
min:
90 fps, max:
138 fps
152 [X] Corsair One i160 Intel Core i9-9900K 3.6GHz
GeForce RTX 2080 Ti (Desktop)
min:
132 fps, max:
175 fps
~ 133 fps
100%
GeForce RTX 2080 Max-Q:
51 [X] Acer Triton 500 Intel Core i7-8750H 2.2GHz
GeForce RTX 2080 Max-Q
min:
47 fps
56 ~ 54 fps
180%
GeForce RTX 2080 Ti (Desktop):
95 [X] AMD Ryzen 9 3900X 3.8GHz
GeForce RTX 2080 Ti (Desktop)
min:
62 fps, max:
111 fps
99 [X] Corsair One i160 Intel Core i9-9900K 3.6GHz
GeForce RTX 2080 Ti (Desktop)
min:
89 fps, max:
113 fps
~ 97 fps
GeForce RTX 2080 Ti (Desktop):
188 [X] Corsair One i160 Intel Core i9-9900K 3.6GHz
GeForce RTX 2080 Ti (Desktop)
min:
145 fps, max:
211 fps
fps
100%
GeForce RTX 2080 Max-Q:
117 [X] Acer Triton 500 Intel Core i7-8750H 2.2GHz
GeForce RTX 2080 Max-Q
min:
94 fps
123 ~ 120 fps
152%
GeForce RTX 2080 Ti (Desktop):
182 [X] Corsair One i160 Intel Core i9-9900K 3.6GHz
GeForce RTX 2080 Ti (Desktop)
min:
132 fps, max:
206 fps
fps
108%
GeForce RTX 2070 Super Mobile:
130 fps
100%
GeForce RTX 2080 Max-Q:
105 [X] Acer Triton 500 Intel Core i7-8750H 2.2GHz
GeForce RTX 2080 Max-Q
min:
77 fps
111 ~ 108 fps
166%
GeForce RTX 2080 Ti (Desktop):
179 [X] Corsair One i160 Intel Core i9-9900K 3.6GHz
GeForce RTX 2080 Ti (Desktop)
min:
127 fps, max:
200 fps
fps
111%
GeForce RTX 2070 Super Mobile:
120 fps
100%
GeForce RTX 2080 Max-Q:
84.8 [X] Acer Triton 500 Intel Core i7-8750H 2.2GHz
GeForce RTX 2080 Max-Q
min:
68 fps
90.9 ~ 88 fps
165%
GeForce RTX 2080 Ti (Desktop):
140 [X] MSI GeForce RTX 2080 Ti Gaming X Trio Intel Core i7-7740X 4.3GHz
GeForce RTX 2080 Ti (Desktop)
min:
108 fps, max:
154 fps
150 [X] Corsair One i160 Intel Core i9-9900K 3.6GHz
GeForce RTX 2080 Ti (Desktop)
min:
115 fps, max:
178 fps
~ 145 fps
112%
GeForce RTX 2070 Super Mobile:
98.9 fps
100%
GeForce RTX 2080 Max-Q:
52.5 [X] Acer Triton 500 Intel Core i7-8750H 2.2GHz
GeForce RTX 2080 Max-Q
min:
45 fps
58.4 ~ 55 fps
185%
GeForce RTX 2080 Ti (Desktop):
99 [X] Corsair One i160 Intel Core i9-9900K 3.6GHz
GeForce RTX 2080 Ti (Desktop)
min:
84 fps, max:
114 fps
104 [X] MSI GeForce RTX 2080 Ti Gaming X Trio Intel Core i7-7740X 4.3GHz
GeForce RTX 2080 Ti (Desktop)
min:
85 fps, max:
129 fps
~ 102 fps
116%
GeForce RTX 2070 Super Mobile:
63.9 fps
100%
GeForce RTX 2080 Max-Q:
27.1 [X] Acer Triton 500 Intel Core i7-8750H 2.2GHz
GeForce RTX 2080 Max-Q
min:
23 fps
29.7 ~ 28 fps
175%
GeForce RTX 2080 Ti (Desktop):
47.9 [X] Corsair One i160 Intel Core i9-9900K 3.6GHz
GeForce RTX 2080 Ti (Desktop)
min:
41 fps, max:
54 fps
49.7 [X] MSI GeForce RTX 2080 Ti Gaming X Trio Intel Core i7-7740X 4.3GHz
GeForce RTX 2080 Ti (Desktop)
min:
44 fps, max:
58 fps
~ 49 fps
115%
GeForce RTX 2070 Super Mobile:
32.1 fps
GeForce RTX 2080 Ti (Desktop):
60 60 [X] AMD Ryzen 9 3900X 3.8GHz
GeForce RTX 2080 Ti (Desktop)
~ 60 fps
100%
GeForce RTX 2080 Max-Q:
60 [X] Acer Triton 500 Intel Core i7-8750H 2.2GHz
GeForce RTX 2080 Max-Q
min:
59 fps
60 ~ 60 fps
100%
GeForce RTX 2080 Ti (Desktop):
60 60 [X] AMD Ryzen 9 3900X 3.8GHz
GeForce RTX 2080 Ti (Desktop)
~ 60 fps
100%
GeForce RTX 2080 Max-Q:
60 [X] Acer Triton 500 Intel Core i7-8750H 2.2GHz
GeForce RTX 2080 Max-Q
min:
59 fps
60 ~ 60 fps
100%
GeForce RTX 2080 Ti (Desktop):
60 60 [X] AMD Ryzen 9 3900X 3.8GHz
GeForce RTX 2080 Ti (Desktop)
~ 60 fps
100%
GeForce RTX 2080 Max-Q:
60 [X] Acer Triton 500 Intel Core i7-8750H 2.2GHz
GeForce RTX 2080 Max-Q
min:
58 fps
60 ~ 60 fps
100%
GeForce RTX 2080 Ti (Desktop):
60 60 [X] AMD Ryzen 9 3900X 3.8GHz
GeForce RTX 2080 Ti (Desktop)
~ 60 fps
100%
GeForce RTX 2080 Max-Q:
60 [X] Acer Triton 500 Intel Core i7-8750H 2.2GHz
GeForce RTX 2080 Max-Q
min:
58 fps
60 ~ 60 fps
100%
GeForce RTX 2080 Ti (Desktop):
60 60 [X] AMD Ryzen 9 3900X 3.8GHz
GeForce RTX 2080 Ti (Desktop)
~ 60 fps
100%
GeForce RTX 2080 Max-Q:
37.4 [X] Acer Triton 500 Intel Core i7-8750H 2.2GHz
GeForce RTX 2080 Max-Q
min:
34 fps
39.9 ~ 39 fps
154%
GeForce RTX 2080 Ti (Desktop):
60 60 [X] AMD Ryzen 9 3900X 3.8GHz
GeForce RTX 2080 Ti (Desktop)
~ 60 fps
100%
GeForce RTX 2080 Max-Q:
114 122 123 ~ 120 fps
128%
GeForce RTX 2080 Ti (Desktop):
139 [X] AMD Ryzen 9 3900X 3.8GHz
GeForce RTX 2080 Ti (Desktop)
min:
107 fps, max:
184 fps
154 [X] AMD Ryzen 9 3900X 3.8GHz
GeForce RTX 2080 Ti (Desktop)
min:
122 fps, max:
201 fps
166 [X] Corsair One i160 Intel Core i9-9900K 3.6GHz
GeForce RTX 2080 Ti (Desktop)
min:
89 fps, max:
225 fps
~ 153 fps
100%
GeForce RTX 2080 Max-Q:
94 101 [X] Asus GX701GX (Optimus-Mode) Intel Core i7-8750H 2.2GHz
GeForce RTX 2080 Max-Q
min:
83 fps
103 107 [X] Acer Triton 500 Intel Core i7-8750H 2.2GHz
GeForce RTX 2080 Max-Q
min:
87 fps
109 109 ~ 104 fps
131%
GeForce RTX 2080 Ti (Desktop):
124 [X] AMD Ryzen 9 3900X 3.8GHz
GeForce RTX 2080 Ti (Desktop)
min:
97 fps, max:
165 fps
136 [X] AMD Ryzen 9 3900X 3.8GHz
GeForce RTX 2080 Ti (Desktop)
min:
106 fps, max:
183 fps
148 [X] Corsair One i160 Intel Core i9-9900K 3.6GHz
GeForce RTX 2080 Ti (Desktop)
min:
115 fps, max:
196 fps
~ 136 fps
100%
GeForce RTX 2080 Max-Q:
68 [X] Gigabyte Aero 15-Y9 Single-Channel
Intel Core i9-8950HK 2.9GHz
GeForce RTX 2080 Max-Q
88 97 [X] Asus GX701GX (Optimus-Mode) Intel Core i7-8750H 2.2GHz
GeForce RTX 2080 Max-Q
min:
75 fps
97 99 [X] Acer Triton 500 Intel Core i7-8750H 2.2GHz
GeForce RTX 2080 Max-Q
min:
82 fps
99 106 ~ 93 fps
140%
GeForce RTX 2080 Ti (Desktop):
119 [X] AMD Ryzen 9 3900X 3.8GHz
GeForce RTX 2080 Ti (Desktop)
min:
96 fps, max:
157 fps
130 [X] AMD Ryzen 9 3900X 3.8GHz
GeForce RTX 2080 Ti (Desktop)
min:
102 fps, max:
174 fps
141 [X] Corsair One i160 Intel Core i9-9900K 3.6GHz
GeForce RTX 2080 Ti (Desktop)
min:
112 fps, max:
191 fps
~ 130 fps
100%
GeForce RTX 2080 Max-Q:
66 [X] Gigabyte Aero 15-Y9 Single-Channel
Intel Core i9-8950HK 2.9GHz
GeForce RTX 2080 Max-Q
84 92 [X] Asus GX701GX (Optimus-Mode) Intel Core i7-8750H 2.2GHz
GeForce RTX 2080 Max-Q
min:
74 fps
93 [X] Acer Triton 500 Intel Core i7-8750H 2.2GHz
GeForce RTX 2080 Max-Q
min:
73 fps
93 95 100 ~ 89 fps
136%
GeForce RTX 2080 Ti (Desktop):
111 [X] AMD Ryzen 9 3900X 3.8GHz
GeForce RTX 2080 Ti (Desktop)
min:
84 fps, max:
146 fps
122 [X] AMD Ryzen 9 3900X 3.8GHz
GeForce RTX 2080 Ti (Desktop)
min:
96 fps, max:
160 fps
131 [X] Corsair One i160 Intel Core i9-9900K 3.6GHz
GeForce RTX 2080 Ti (Desktop)
min:
98 fps, max:
174 fps
~ 121 fps
118%
GeForce RTX 2070 Super Mobile:
98 112 ~ 105 fps
100%
GeForce RTX 2080 Max-Q:
72 [X] Acer Triton 500 Intel Core i7-8750H 2.2GHz
GeForce RTX 2080 Max-Q
min:
58 fps
79 ~ 76 fps
153%
GeForce RTX 2080 Ti (Desktop):
109 [X] AMD Ryzen 9 3900X 3.8GHz
GeForce RTX 2080 Ti (Desktop)
min:
85 fps, max:
144 fps
117 [X] AMD Ryzen 9 3900X 3.8GHz
GeForce RTX 2080 Ti (Desktop)
min:
90 fps, max:
154 fps
123 [X] Corsair One i160 Intel Core i9-9900K 3.6GHz
GeForce RTX 2080 Ti (Desktop)
min:
98 fps, max:
155 fps
~ 116 fps
100%
GeForce RTX 2080 Max-Q:
34 40 [X] Acer Triton 500 Intel Core i7-8750H 2.2GHz
GeForce RTX 2080 Max-Q
min:
35 fps
44 ~ 39 fps
197%
GeForce RTX 2080 Ti (Desktop):
74 [X] AMD Ryzen 9 3900X 3.8GHz
GeForce RTX 2080 Ti (Desktop)
min:
65 fps, max:
88 fps
78 [X] Corsair One i160 Intel Core i9-9900K 3.6GHz
GeForce RTX 2080 Ti (Desktop)
min:
69 fps, max:
92 fps
78 [X] AMD Ryzen 9 3900X 3.8GHz
GeForce RTX 2080 Ti (Desktop)
min:
71 fps, max:
92 fps
~ 77 fps
GeForce RTX 2080 Ti (Desktop):
105 [X] MSI GeForce RTX 2080 Ti Gaming X Trio Intel Core i7-7740X 4.3GHz
GeForce RTX 2080 Ti (Desktop)
max:
139 fps
fps
100%
GeForce RTX 2080 Max-Q:
82.9 [X] Gigabyte Aero 15-Y9 Single-Channel
Intel Core i9-8950HK 2.9GHz
GeForce RTX 2080 Max-Q
91 101.9 108 ~ 96 fps
135%
GeForce RTX 2080 Ti (Desktop):
127 [X] AMD Ryzen 9 3900X 3.8GHz
GeForce RTX 2080 Ti (Desktop)
128 [X] AMD Ryzen 9 3900X 3.8GHz
GeForce RTX 2080 Ti (Desktop)
136 ~ 130 fps
119%
GeForce RTX 2070 Super Mobile:
107 113 117 118 ~ 114 fps
100%
GeForce RTX 2080 Max-Q:
68.9 [X] Gigabyte Aero 15-Y9 Single-Channel
Intel Core i9-8950HK 2.9GHz
GeForce RTX 2080 Max-Q
80.5 89.2 97.4 ~ 84 fps
139%
GeForce RTX 2080 Ti (Desktop):
113 [X] AMD Ryzen 9 3900X 3.8GHz
GeForce RTX 2080 Ti (Desktop)
115 [X] AMD Ryzen 9 3900X 3.8GHz
GeForce RTX 2080 Ti (Desktop)
122 ~ 117 fps
100%
GeForce RTX 2080 Max-Q:
55.8 [X] Gigabyte Aero 15-Y9 Single-Channel
Intel Core i9-8950HK 2.9GHz
GeForce RTX 2080 Max-Q
67.2 74.8 81.6 ~ 70 fps
131%
GeForce RTX 2080 Ti (Desktop):
83.5 [X] MSI GeForce RTX 2080 Ti Gaming X Trio Intel Core i7-7740X 4.3GHz
GeForce RTX 2080 Ti (Desktop)
91 [X] AMD Ryzen 9 3900X 3.8GHz
GeForce RTX 2080 Ti (Desktop)
93 [X] AMD Ryzen 9 3900X 3.8GHz
GeForce RTX 2080 Ti (Desktop)
99 ~ 92 fps
100%
GeForce RTX 2080 Max-Q:
36.5 [X] Gigabyte Aero 15-Y9 Single-Channel
Intel Core i9-8950HK 2.9GHz
GeForce RTX 2080 Max-Q
51.8 ~ 44 fps
177%
GeForce RTX 2080 Ti (Desktop):
73.5 [X] MSI GeForce RTX 2080 Ti Gaming X Trio Intel Core i7-7740X 4.3GHz
GeForce RTX 2080 Ti (Desktop)
79 79 [X] AMD Ryzen 9 3900X 3.8GHz
GeForce RTX 2080 Ti (Desktop)
81 [X] AMD Ryzen 9 3900X 3.8GHz
GeForce RTX 2080 Ti (Desktop)
~ 78 fps
GeForce RTX 2080 Ti (Desktop):
175 [X] AMD Ryzen 9 3900X 3.8GHz
GeForce RTX 2080 Ti (Desktop)
min:
135 fps, max:
211 fps
198 [X] Corsair One i160 Intel Core i9-9900K 3.6GHz
GeForce RTX 2080 Ti (Desktop)
min:
157 fps, max:
237 fps
~ 187 fps
100%
GeForce RTX 2080 Max-Q:
115 118 [X] Acer Triton 500 Intel Core i7-8750H 2.2GHz
GeForce RTX 2080 Max-Q
min:
96 fps
~ 117 fps
139%
GeForce RTX 2080 Ti (Desktop):
155 [X] AMD Ryzen 9 3900X 3.8GHz
GeForce RTX 2080 Ti (Desktop)
min:
117 fps, max:
192 fps
171 [X] Corsair One i160 Intel Core i9-9900K 3.6GHz
GeForce RTX 2080 Ti (Desktop)
min:
127 fps, max:
201 fps
~ 163 fps
125%
GeForce RTX 2070 Super Mobile:
146 fps
100%
GeForce RTX 2080 Max-Q:
89.5 90.5 [X] Acer Triton 500 Intel Core i7-8750H 2.2GHz
GeForce RTX 2080 Max-Q
min:
66 fps
~ 90 fps
147%
GeForce RTX 2080 Ti (Desktop):
122 [X] AMD Ryzen 9 3900X 3.8GHz
GeForce RTX 2080 Ti (Desktop)
min:
96 fps, max:
159 fps
141 [X] Corsair One i160 Intel Core i9-9900K 3.6GHz
GeForce RTX 2080 Ti (Desktop)
min:
105 fps, max:
172 fps
~ 132 fps
132%
GeForce RTX 2070 Super Mobile:
119 fps
100%
GeForce RTX 2080 Max-Q:
64.9 [X] Acer Triton 500 Intel Core i7-8750H 2.2GHz
GeForce RTX 2080 Max-Q
min:
42 fps
68.4 ~ 67 fps
136%
GeForce RTX 2080 Ti (Desktop):
85 [X] AMD Ryzen 9 3900X 3.8GHz
GeForce RTX 2080 Ti (Desktop)
min:
62 fps, max:
109 fps
97 [X] Corsair One i160 Intel Core i9-9900K 3.6GHz
GeForce RTX 2080 Ti (Desktop)
min:
72 fps, max:
130 fps
~ 91 fps
123%
GeForce RTX 2070 Super Mobile:
82.5 fps
100%
GeForce RTX 2080 Max-Q:
50.2 52.2 [X] Acer Triton 500 Intel Core i7-8750H 2.2GHz
GeForce RTX 2080 Max-Q
min:
41 fps
~ 51 fps
165%
GeForce RTX 2080 Ti (Desktop):
83 [X] AMD Ryzen 9 3900X 3.8GHz
GeForce RTX 2080 Ti (Desktop)
min:
65 fps, max:
109 fps
84 [X] Corsair One i160 Intel Core i9-9900K 3.6GHz
GeForce RTX 2080 Ti (Desktop)
min:
60 fps, max:
106 fps
~ 84 fps
117%
GeForce RTX 2070 Super Mobile:
59.7 fps
100%
GeForce RTX 2080 Max-Q:
26.7 [X] Acer Triton 500 Intel Core i7-8750H 2.2GHz
GeForce RTX 2080 Max-Q
min:
23 fps
27.5 ~ 27 fps
185%
GeForce RTX 2080 Ti (Desktop):
50 [X] AMD Ryzen 9 3900X 3.8GHz
GeForce RTX 2080 Ti (Desktop)
min:
41 fps, max:
58 fps
50.3 [X] Corsair One i160 Intel Core i9-9900K 3.6GHz
GeForce RTX 2080 Ti (Desktop)
min:
39 fps, max:
57 fps
~ 50 fps
115%
GeForce RTX 2070 Super Mobile:
31.1 fps
157%
GeForce RTX 2080 Ti (Desktop):
185 [X] AMD Ryzen 9 3900X 3.8GHz
GeForce RTX 2080 Ti (Desktop)
min:
113 fps, max:
233 fps
210 [X] Corsair One i160 Intel Core i9-9900K 3.6GHz
GeForce RTX 2080 Ti (Desktop)
min:
120 fps, max:
247 fps
~ 198 fps
100%
GeForce RTX 2080 Max-Q:
100.1 100.7 103 [X] Acer Triton 500 Intel Core i7-8750H 2.2GHz
GeForce RTX 2080 Max-Q
min:
52 fps
103 [X] Asus GX701GX (Optimus-Mode) Intel Core i7-8750H 2.2GHz
GeForce RTX 2080 Max-Q
min:
50 fps
106 ~ 103 fps
157%
GeForce RTX 2080 Ti (Desktop):
155 [X] AMD Ryzen 9 3900X 3.8GHz
GeForce RTX 2080 Ti (Desktop)
min:
94 fps, max:
196 fps
168 [X] Corsair One i160 Intel Core i9-9900K 3.6GHz
GeForce RTX 2080 Ti (Desktop)
min:
130 fps, max:
214 fps
~ 162 fps
117%
GeForce RTX 2070 Super Mobile:
121 fps
100%
GeForce RTX 2080 Max-Q:
74 75.9 77.3 [X] Acer Triton 500 Intel Core i7-8750H 2.2GHz
GeForce RTX 2080 Max-Q
min:
42 fps
79.7 [X] Asus GX701GX (Optimus-Mode) Intel Core i7-8750H 2.2GHz
GeForce RTX 2080 Max-Q
min:
41 fps
81.4 ~ 78 fps
155%
GeForce RTX 2080 Ti (Desktop):
118 [X] AMD Ryzen 9 3900X 3.8GHz
GeForce RTX 2080 Ti (Desktop)
min:
72 fps, max:
186 fps
124 [X] Corsair One i160 Intel Core i9-9900K 3.6GHz
GeForce RTX 2080 Ti (Desktop)
min:
67 fps, max:
197 fps
~ 121 fps
109%
GeForce RTX 2070 Super Mobile:
79.7 91.1 ~ 85 fps
100%
GeForce RTX 2080 Max-Q:
32.7 [X] Acer Triton 500 Intel Core i7-8750H 2.2GHz
GeForce RTX 2080 Max-Q
min:
20 fps
35.9 ~ 34 fps
168%
GeForce RTX 2080 Ti (Desktop):
55.6 [X] AMD Ryzen 9 3900X 3.8GHz
GeForce RTX 2080 Ti (Desktop)
min:
37 fps, max:
83 fps
57.7 [X] Corsair One i160 Intel Core i9-9900K 3.6GHz
GeForce RTX 2080 Ti (Desktop)
min:
39 fps, max:
86 fps
58.5 [X] MSI GeForce RTX 2080 Ti Gaming X Trio Intel Core i7-7740X 4.3GHz
GeForce RTX 2080 Ti (Desktop)
min:
23 fps, max:
85 fps
~ 57 fps
111%
GeForce RTX 2070 Super Mobile:
37.7 fps
GeForce RTX 2080 Ti (Desktop):
349 [X] AMD Ryzen 9 3900X 3.8GHz
GeForce RTX 2080 Ti (Desktop)
min:
216 fps, max:
444 fps
412 [X] Corsair One i160 Intel Core i9-9900K 3.6GHz
GeForce RTX 2080 Ti (Desktop)
min:
260 fps, max:
602 fps
~ 381 fps
100%
GeForce RTX 2080 Max-Q:
139 [X] Asus GX701GX (Optimus-Mode) Intel Core i7-8750H 2.2GHz
GeForce RTX 2080 Max-Q
min:
103 fps
143 147 [X] Acer Triton 500 Intel Core i7-8750H 2.2GHz
GeForce RTX 2080 Max-Q
min:
101 fps
~ 143 fps
211%
GeForce RTX 2080 Ti (Desktop):
290 [X] AMD Ryzen 9 3900X 3.8GHz
GeForce RTX 2080 Ti (Desktop)
min:
120 fps, max:
398 fps
313 [X] Corsair One i160 Intel Core i9-9900K 3.6GHz
GeForce RTX 2080 Ti (Desktop)
min:
195 fps, max:
527 fps
~ 302 fps
115%
GeForce RTX 2070 Super Mobile:
164 fps
100%
GeForce RTX 2080 Max-Q:
128 [X] Asus GX701GX (Optimus-Mode) Intel Core i7-8750H 2.2GHz
GeForce RTX 2080 Max-Q
min:
99 fps
138 140 [X] Acer Triton 500 Intel Core i7-8750H 2.2GHz
GeForce RTX 2080 Max-Q
min:
97 fps
~ 135 fps
172%
GeForce RTX 2080 Ti (Desktop):
218 [X] AMD Ryzen 9 3900X 3.8GHz
GeForce RTX 2080 Ti (Desktop)
min:
161 fps, max:
264 fps
245 [X] Corsair One i160 Intel Core i9-9900K 3.6GHz
GeForce RTX 2080 Ti (Desktop)
min:
194 fps, max:
343 fps
~ 232 fps
116%
GeForce RTX 2070 Super Mobile:
156 fps
100%
GeForce RTX 2080 Max-Q:
116 [X] Asus GX701GX (Optimus-Mode) Intel Core i7-8750H 2.2GHz
GeForce RTX 2080 Max-Q
min:
98 fps
121 [X] Acer Triton 500 Intel Core i7-8750H 2.2GHz
GeForce RTX 2080 Max-Q
min:
90 fps
136 ~ 124 fps
174%
GeForce RTX 2080 Ti (Desktop):
197 [X] AMD Ryzen 9 3900X 3.8GHz
GeForce RTX 2080 Ti (Desktop)
min:
157 fps, max:
232 fps
235 [X] Corsair One i160 Intel Core i9-9900K 3.6GHz
GeForce RTX 2080 Ti (Desktop)
min:
184 fps, max:
306 fps
~ 216 fps
104%
GeForce RTX 2070 Super Mobile:
129 fps
100%
GeForce RTX 2080 Max-Q:
97.7 [X] Acer Triton 500 Intel Core i7-8750H 2.2GHz
GeForce RTX 2080 Max-Q
min:
64 fps
105 ~ 101 fps
150%
GeForce RTX 2080 Ti (Desktop):
141 [X] AMD Ryzen 9 3900X 3.8GHz
GeForce RTX 2080 Ti (Desktop)
min:
125 fps, max:
154 fps
160 [X] Corsair One i160 Intel Core i9-9900K 3.6GHz
GeForce RTX 2080 Ti (Desktop)
min:
145 fps, max:
196 fps
~ 151 fps
92%
GeForce RTX 2070 Super Mobile:
93.4 fps
100%
GeForce RTX 2080 Max-Q:
46.7 [X] Acer Triton 500 Intel Core i7-8750H 2.2GHz
GeForce RTX 2080 Max-Q
min:
42 fps
50.4 ~ 49 fps
161%
GeForce RTX 2080 Ti (Desktop):
76 [X] AMD Ryzen 9 3900X 3.8GHz
GeForce RTX 2080 Ti (Desktop)
min:
69 fps, max:
81 fps
81 [X] Corsair One i160 Intel Core i9-9900K 3.6GHz
GeForce RTX 2080 Ti (Desktop)
min:
76 fps, max:
88 fps
~ 79 fps
98%
GeForce RTX 2070 Super Mobile:
47.9 fps
100%
GeForce RTX 2080 Max-Q:
143 [X] Asus GX701GX (Optimus-Mode) Intel Core i7-8750H 2.2GHz
GeForce RTX 2080 Max-Q
min:
121 fps
145 160 [X] Acer Triton 500 Intel Core i7-8750H 2.2GHz
GeForce RTX 2080 Max-Q
min:
141 fps
~ 149 fps
133%
GeForce RTX 2080 Ti (Desktop):
198 [X] MSI GeForce RTX 2080 Ti Intel Core i9-9900K 3.6GHz
GeForce RTX 2080 Ti (Desktop)
min:
194 fps
fps
100%
GeForce RTX 2080 Max-Q:
129 [X] Asus GX701GX (Optimus-Mode) Intel Core i7-8750H 2.2GHz
GeForce RTX 2080 Max-Q
min:
108 fps
131 140 [X] Acer Triton 500 Intel Core i7-8750H 2.2GHz
GeForce RTX 2080 Max-Q
min:
112 fps
~ 133 fps
143%
GeForce RTX 2080 Ti (Desktop):
190 [X] MSI GeForce RTX 2080 Ti Intel Core i9-9900K 3.6GHz
GeForce RTX 2080 Ti (Desktop)
min:
172 fps
fps
100%
GeForce RTX 2080 Max-Q:
110 [X] Acer Triton 500 Intel Core i7-8750H 2.2GHz
GeForce RTX 2080 Max-Q
min:
103 fps
111 [X] Asus GX701GX (Optimus-Mode) Intel Core i7-8750H 2.2GHz
GeForce RTX 2080 Max-Q
min:
98 fps
117 ~ 113 fps
158%
GeForce RTX 2080 Ti (Desktop):
179 [X] MSI GeForce RTX 2080 Ti Intel Core i9-9900K 3.6GHz
GeForce RTX 2080 Ti (Desktop)
min:
158 fps
fps
100%
GeForce RTX 2080 Max-Q:
76.5 [X] Acer Triton 500 Intel Core i7-8750H 2.2GHz
GeForce RTX 2080 Max-Q
min:
70 fps
80.9 ~ 79 fps
175%
GeForce RTX 2080 Ti (Desktop):
138 [X] MSI GeForce RTX 2080 Ti Intel Core i9-9900K 3.6GHz
GeForce RTX 2080 Ti (Desktop)
min:
132 fps
fps
100%
GeForce RTX 2080 Max-Q:
39.3 [X] Acer Triton 500 Intel Core i7-8750H 2.2GHz
GeForce RTX 2080 Max-Q
min:
36 fps
42.7 ~ 41 fps
188%
GeForce RTX 2080 Ti (Desktop):
76.9 [X] MSI GeForce RTX 2080 Ti Intel Core i9-9900K 3.6GHz
GeForce RTX 2080 Ti (Desktop)
min:
71 fps
fps
100%
GeForce RTX 2080 Max-Q:
111 [X] Acer Triton 500 Intel Core i7-8750H 2.2GHz
GeForce RTX 2080 Max-Q
min:
86 fps
118 [X] Asus GX701GX (Optimus-Mode) Intel Core i7-8750H 2.2GHz
GeForce RTX 2080 Max-Q
min:
89 fps
127 ~ 119 fps
137%
GeForce RTX 2080 Ti (Desktop):
163 [X] MSI GeForce RTX 2080 Ti Intel Core i9-9900K 3.6GHz
GeForce RTX 2080 Ti (Desktop)
min:
126 fps
fps
100%
GeForce RTX 2080 Max-Q:
108 [X] Acer Triton 500 Intel Core i7-8750H 2.2GHz
GeForce RTX 2080 Max-Q
min:
84 fps
112 [X] Asus GX701GX (Optimus-Mode) Intel Core i7-8750H 2.2GHz
GeForce RTX 2080 Max-Q
min:
88 fps
120 ~ 113 fps
139%
GeForce RTX 2080 Ti (Desktop):
157 [X] MSI GeForce RTX 2080 Ti Intel Core i9-9900K 3.6GHz
GeForce RTX 2080 Ti (Desktop)
min:
120 fps
fps
100%
GeForce RTX 2080 Max-Q:
104 [X] Acer Triton 500 Intel Core i7-8750H 2.2GHz
GeForce RTX 2080 Max-Q
min:
79 fps
111 [X] Asus GX701GX (Optimus-Mode) Intel Core i7-8750H 2.2GHz
GeForce RTX 2080 Max-Q
min:
87 fps
115 ~ 110 fps
140%
GeForce RTX 2080 Ti (Desktop):
154 [X] MSI GeForce RTX 2080 Ti Intel Core i9-9900K 3.6GHz
GeForce RTX 2080 Ti (Desktop)
min:
116 fps
fps
100%
GeForce RTX 2080 Max-Q:
88.2 [X] Acer Triton 500 Intel Core i7-8750H 2.2GHz
GeForce RTX 2080 Max-Q
min:
66 fps
95.6 ~ 92 fps
164%
GeForce RTX 2080 Ti (Desktop):
151 [X] MSI GeForce RTX 2080 Ti Intel Core i9-9900K 3.6GHz
GeForce RTX 2080 Ti (Desktop)
min:
113 fps
fps
100%
GeForce RTX 2080 Max-Q:
47.2 [X] Acer Triton 500 Intel Core i7-8750H 2.2GHz
GeForce RTX 2080 Max-Q
min:
34 fps
54.3 ~ 51 fps
187%
GeForce RTX 2080 Ti (Desktop):
95.6 [X] MSI GeForce RTX 2080 Ti Intel Core i9-9900K 3.6GHz
GeForce RTX 2080 Ti (Desktop)
min:
71 fps
fps
GeForce RTX 2080 Ti (Desktop):
305 [X] AMD Ryzen 9 3900X 3.8GHz
GeForce RTX 2080 Ti (Desktop)
min:
180 fps, max:
463 fps
320 [X] Corsair One i160 Intel Core i9-9900K 3.6GHz
GeForce RTX 2080 Ti (Desktop)
min:
198 fps, max:
493 fps
~ 313 fps
GeForce RTX 2080 Ti (Desktop):
302 [X] AMD Ryzen 9 3900X 3.8GHz
GeForce RTX 2080 Ti (Desktop)
min:
163 fps, max:
449 fps
313 [X] Corsair One i160 Intel Core i9-9900K 3.6GHz
GeForce RTX 2080 Ti (Desktop)
min:
191 fps, max:
495 fps
~ 308 fps
GeForce RTX 2080 Ti (Desktop):
221 [X] AMD Ryzen 9 3900X 3.8GHz
GeForce RTX 2080 Ti (Desktop)
min:
144 fps, max:
319 fps
227 [X] Corsair One i160 Intel Core i9-9900K 3.6GHz
GeForce RTX 2080 Ti (Desktop)
min:
144 fps, max:
317 fps
~ 224 fps
GeForce RTX 2080 Ti (Desktop):
200 [X] AMD Ryzen 9 3900X 3.8GHz
GeForce RTX 2080 Ti (Desktop)
min:
139 fps, max:
264 fps
205 [X] Corsair One i160 Intel Core i9-9900K 3.6GHz
GeForce RTX 2080 Ti (Desktop)
min:
138 fps, max:
277 fps
~ 203 fps
GeForce RTX 2080 Ti (Desktop):
166 [X] AMD Ryzen 9 3900X 3.8GHz
GeForce RTX 2080 Ti (Desktop)
min:
126 fps, max:
204 fps
178 [X] Corsair One i160 Intel Core i9-9900K 3.6GHz
GeForce RTX 2080 Ti (Desktop)
min:
120 fps, max:
212 fps
~ 172 fps
GeForce RTX 2080 Ti (Desktop):
110 [X] AMD Ryzen 9 3900X 3.8GHz
GeForce RTX 2080 Ti (Desktop)
min:
93 fps, max:
127 fps
115 [X] Corsair One i160 Intel Core i9-9900K 3.6GHz
GeForce RTX 2080 Ti (Desktop)
min:
97 fps, max:
134 fps
~ 113 fps
GeForce RTX 2080 Ti (Desktop):
145 [X] AMD Ryzen 9 3900X 3.8GHz
GeForce RTX 2080 Ti (Desktop)
147 ~ 146 fps
100%
GeForce RTX 2080 Max-Q:
82 fps
160%
GeForce RTX 2080 Ti (Desktop):
127 [X] AMD Ryzen 9 3900X 3.8GHz
GeForce RTX 2080 Ti (Desktop)
135 ~ 131 fps
100%
GeForce RTX 2080 Max-Q:
65 80 ~ 73 fps
173%
GeForce RTX 2080 Ti (Desktop):
121 [X] AMD Ryzen 9 3900X 3.8GHz
GeForce RTX 2080 Ti (Desktop)
130 ~ 126 fps
100%
GeForce RTX 2080 Max-Q:
62 69 ~ 66 fps
162%
GeForce RTX 2080 Ti (Desktop):
104 [X] AMD Ryzen 9 3900X 3.8GHz
GeForce RTX 2080 Ti (Desktop)
109 ~ 107 fps
100%
GeForce RTX 2080 Max-Q:
61 fps
152%
GeForce RTX 2080 Ti (Desktop):
89 [X] AMD Ryzen 9 3900X 3.8GHz
GeForce RTX 2080 Ti (Desktop)
96 ~ 93 fps
100%
GeForce RTX 2080 Max-Q:
39 fps
164%
GeForce RTX 2080 Ti (Desktop):
62 [X] AMD Ryzen 9 3900X 3.8GHz
GeForce RTX 2080 Ti (Desktop)
65 ~ 64 fps
GeForce RTX 2080 Ti (Desktop):
181 [X] AMD Ryzen 9 3900X 3.8GHz
GeForce RTX 2080 Ti (Desktop)
P1:
135.1 fps
204 ~ 193 fps
GeForce RTX 2080 Ti (Desktop):
178 [X] AMD Ryzen 9 3900X 3.8GHz
GeForce RTX 2080 Ti (Desktop)
P1:
135.1 fps
203 ~ 191 fps
GeForce RTX 2080 Ti (Desktop):
178 [X] AMD Ryzen 9 3900X 3.8GHz
GeForce RTX 2080 Ti (Desktop)
P1:
137 fps
202 ~ 190 fps
GeForce RTX 2080 Ti (Desktop):
178 [X] AMD Ryzen 9 3900X 3.8GHz
GeForce RTX 2080 Ti (Desktop)
P1:
135.1 fps
202 ~ 190 fps
GeForce RTX 2080 Ti (Desktop):
157 [X] AMD Ryzen 9 3900X 3.8GHz
GeForce RTX 2080 Ti (Desktop)
P1:
128.2 fps
167 ~ 162 fps
GeForce RTX 2080 Ti (Desktop):
89 [X] AMD Ryzen 9 3900X 3.8GHz
GeForce RTX 2080 Ti (Desktop)
P1:
78.1 fps
93 ~ 91 fps
100%
GeForce RTX 2080 Max-Q:
117 120 [X] Acer Triton 500 Intel Core i7-8750H 2.2GHz
GeForce RTX 2080 Max-Q
min:
117 fps
~ 119 fps
102%
GeForce RTX 2080 Ti (Desktop):
121 [X] MSI GeForce RTX 2080 Ti Intel Core i9-9900K 3.6GHz
GeForce RTX 2080 Ti (Desktop)
min:
118 fps
fps
100%
GeForce RTX 2080 Max-Q:
112 [X] Acer Triton 500 Intel Core i7-8750H 2.2GHz
GeForce RTX 2080 Max-Q
min:
95 fps
115 ~ 114 fps
106%
GeForce RTX 2080 Ti (Desktop):
121 [X] MSI GeForce RTX 2080 Ti Intel Core i9-9900K 3.6GHz
GeForce RTX 2080 Ti (Desktop)
min:
118 fps
fps
100%
GeForce RTX 2080 Max-Q:
92.7 [X] Acer Triton 500 Intel Core i7-8750H 2.2GHz
GeForce RTX 2080 Max-Q
min:
86 fps
99 ~ 96 fps
126%
GeForce RTX 2080 Ti (Desktop):
121 [X] MSI GeForce RTX 2080 Ti Intel Core i9-9900K 3.6GHz
GeForce RTX 2080 Ti (Desktop)
min:
118 fps
fps
100%
GeForce RTX 2080 Max-Q:
63.2 [X] Acer Triton 500 Intel Core i7-8750H 2.2GHz
GeForce RTX 2080 Max-Q
min:
59 fps
68.1 ~ 66 fps
176%
GeForce RTX 2080 Ti (Desktop):
116 [X] MSI GeForce RTX 2080 Ti Intel Core i9-9900K 3.6GHz
GeForce RTX 2080 Ti (Desktop)
min:
108 fps
fps
100%
GeForce RTX 2080 Max-Q:
33 [X] Acer Triton 500 Intel Core i7-8750H 2.2GHz
GeForce RTX 2080 Max-Q
min:
31 fps
35.7 ~ 34 fps
183%
GeForce RTX 2080 Ti (Desktop):
62.3 [X] MSI GeForce RTX 2080 Ti Intel Core i9-9900K 3.6GHz
GeForce RTX 2080 Ti (Desktop)
min:
58 fps
fps
100%
GeForce RTX 2080 Max-Q:
150 [X] Acer Triton 500 Intel Core i7-8750H 2.2GHz
GeForce RTX 2080 Max-Q
min:
33 fps
157 ~ 154 fps
132%
GeForce RTX 2080 Ti (Desktop):
204 [X] MSI GeForce RTX 2080 Ti Intel Core i9-9900K 3.6GHz
GeForce RTX 2080 Ti (Desktop)
min:
48 fps
fps
100%
GeForce RTX 2080 Max-Q:
119 [X] Acer Triton 500 Intel Core i7-8750H 2.2GHz
GeForce RTX 2080 Max-Q
min:
32 fps
125 ~ 122 fps
148%
GeForce RTX 2080 Ti (Desktop):
180 [X] MSI GeForce RTX 2080 Ti Intel Core i9-9900K 3.6GHz
GeForce RTX 2080 Ti (Desktop)
min:
46 fps
fps
100%
GeForce RTX 2080 Max-Q:
93 [X] Acer Triton 500 Intel Core i7-8750H 2.2GHz
GeForce RTX 2080 Max-Q
min:
30 fps
99 ~ 96 fps
159%
GeForce RTX 2080 Ti (Desktop):
153 [X] MSI GeForce RTX 2080 Ti Intel Core i9-9900K 3.6GHz
GeForce RTX 2080 Ti (Desktop)
min:
43 fps
fps
100%
GeForce RTX 2080 Max-Q:
40 [X] Acer Triton 500 Intel Core i7-8750H 2.2GHz
GeForce RTX 2080 Max-Q
min:
22 fps
44 ~ 42 fps
186%
GeForce RTX 2080 Ti (Desktop):
78 [X] MSI GeForce RTX 2080 Ti Intel Core i9-9900K 3.6GHz
GeForce RTX 2080 Ti (Desktop)
min:
21 fps
fps
100%
GeForce RTX 2080 Max-Q:
160.9 fps
100%
GeForce RTX 2080 Max-Q:
87.9 fps
100%
GeForce RTX 2080 Max-Q:
63.5 fps
100%
GeForce RTX 2080 Max-Q:
43.9 fps
GeForce RTX 2080 Ti (Desktop):
214 [X] AMD Ryzen 9 3900X 3.8GHz
GeForce RTX 2080 Ti (Desktop)
min:
157 fps, max:
262 fps
228 [X] Corsair One i160 Intel Core i9-9900K 3.6GHz
GeForce RTX 2080 Ti (Desktop)
min:
188 fps, max:
274 fps
~ 221 fps
100%
GeForce RTX 2080 Max-Q:
190 [X] Acer Triton 500 Intel Core i7-8750H 2.2GHz
GeForce RTX 2080 Max-Q
min:
133 fps
207 ~ 199 fps
101%
GeForce RTX 2080 Ti (Desktop):
190 [X] AMD Ryzen 9 3900X 3.8GHz
GeForce RTX 2080 Ti (Desktop)
min:
148 fps, max:
244 fps
211 [X] Corsair One i160 Intel Core i9-9900K 3.6GHz
GeForce RTX 2080 Ti (Desktop)
min:
174 fps, max:
277 fps
~ 201 fps
100%
GeForce RTX 2080 Max-Q:
174 [X] Acer Triton 500 Intel Core i7-8750H 2.2GHz
GeForce RTX 2080 Max-Q
min:
130 fps
175 ~ 175 fps
110%
GeForce RTX 2080 Ti (Desktop):
183 [X] AMD Ryzen 9 3900X 3.8GHz
GeForce RTX 2080 Ti (Desktop)
min:
140 fps, max:
256 fps
203 [X] Corsair One i160 Intel Core i9-9900K 3.6GHz
GeForce RTX 2080 Ti (Desktop)
min:
160 fps, max:
259 fps
~ 193 fps
100%
GeForce RTX 2080 Max-Q:
133 [X] Acer Triton 500 Intel Core i7-8750H 2.2GHz
GeForce RTX 2080 Max-Q
min:
106 fps
139 ~ 136 fps
140%
GeForce RTX 2080 Ti (Desktop):
180 [X] AMD Ryzen 9 3900X 3.8GHz
GeForce RTX 2080 Ti (Desktop)
min:
150 fps, max:
225 fps
201 [X] Corsair One i160 Intel Core i9-9900K 3.6GHz
GeForce RTX 2080 Ti (Desktop)
min:
164 fps, max:
232 fps
~ 191 fps
100%
GeForce RTX 2080 Max-Q:
48.4 [X] Acer Triton 500 Intel Core i7-8750H 2.2GHz
GeForce RTX 2080 Max-Q
min:
37 fps
51.5 ~ 50 fps
176%
GeForce RTX 2080 Ti (Desktop):
86 [X] AMD Ryzen 9 3900X 3.8GHz
GeForce RTX 2080 Ti (Desktop)
min:
81 fps, max:
92 fps
89 [X] Corsair One i160 Intel Core i9-9900K 3.6GHz
GeForce RTX 2080 Ti (Desktop)
min:
83 fps, max:
95 fps
~ 88 fps
GeForce RTX 2080 Ti (Desktop):
269 [X] AMD Ryzen 9 3900X 3.8GHz
GeForce RTX 2080 Ti (Desktop)
min:
251 fps, max:
288 fps
459 [X] Corsair One i160 Intel Core i9-9900K 3.6GHz
GeForce RTX 2080 Ti (Desktop)
min:
431 fps, max:
504 fps
~ 364 fps
100%
GeForce RTX 2080 Max-Q:
212 [X] Acer Triton 500 Intel Core i7-8750H 2.2GHz
GeForce RTX 2080 Max-Q
min:
178 fps
225 ~ 219 fps
122%
GeForce RTX 2080 Ti (Desktop):
207 [X] AMD Ryzen 9 3900X 3.8GHz
GeForce RTX 2080 Ti (Desktop)
min:
195 fps, max:
218 fps
328 [X] Corsair One i160 Intel Core i9-9900K 3.6GHz
GeForce RTX 2080 Ti (Desktop)
min:
299 fps, max:
348 fps
~ 268 fps
100%
GeForce RTX 2080 Max-Q:
150 164 [X] Acer Triton 500 Intel Core i7-8750H 2.2GHz
GeForce RTX 2080 Max-Q
min:
109 fps
~ 157 fps
147%
GeForce RTX 2080 Ti (Desktop):
183 [X] AMD Ryzen 9 3900X 3.8GHz
GeForce RTX 2080 Ti (Desktop)
min:
168 fps, max:
193 fps
278 [X] Corsair One i160 Intel Core i9-9900K 3.6GHz
GeForce RTX 2080 Ti (Desktop)
min:
261 fps, max:
293 fps
~ 231 fps
100%
GeForce RTX 2080 Max-Q:
102 105 [X] Acer Triton 500 Intel Core i7-8750H 2.2GHz
GeForce RTX 2080 Max-Q
min:
82 fps
~ 104 fps
176%
GeForce RTX 2080 Ti (Desktop):
170 [X] AMD Ryzen 9 3900X 3.8GHz
GeForce RTX 2080 Ti (Desktop)
min:
161 fps, max:
181 fps
196 [X] Corsair One i160 Intel Core i9-9900K 3.6GHz
GeForce RTX 2080 Ti (Desktop)
min:
168 fps, max:
235 fps
~ 183 fps
GeForce RTX 2080 Ti (Desktop):
123 [X] AMD Ryzen 9 3900X 3.8GHz
GeForce RTX 2080 Ti (Desktop)
min:
111 fps, max:
141 fps
127 [X] Corsair One i160 Intel Core i9-9900K 3.6GHz
GeForce RTX 2080 Ti (Desktop)
min:
109 fps, max:
147 fps
~ 125 fps
100%
GeForce RTX 2080 Max-Q:
248.7 249 ~ 249 fps
100%
GeForce RTX 2080 Ti (Desktop):
250 [X] Corsair One i160 Intel Core i9-9900K 3.6GHz
GeForce RTX 2080 Ti (Desktop)
min:
230 fps, max:
252 fps
250 [X] AMD Ryzen 9 3900X 3.8GHz
GeForce RTX 2080 Ti (Desktop)
min:
226 fps, max:
252 fps
~ 250 fps
100%
GeForce RTX 2080 Max-Q:
239.3 247.7 248 249 [X] Acer Triton 500 Intel Core i7-8750H 2.2GHz
GeForce RTX 2080 Max-Q
min:
234 fps
~ 246 fps
102%
GeForce RTX 2080 Ti (Desktop):
250 [X] Corsair One i160 Intel Core i9-9900K 3.6GHz
GeForce RTX 2080 Ti (Desktop)
min:
226 fps, max:
252 fps
250 [X] AMD Ryzen 9 3900X 3.8GHz
GeForce RTX 2080 Ti (Desktop)
min:
227 fps, max:
252 fps
~ 250 fps
100%
GeForce RTX 2080 Max-Q:
218 218.5 248 [X] Acer Triton 500 Intel Core i7-8750H 2.2GHz
GeForce RTX 2080 Max-Q
min:
230 fps
248.4 ~ 233 fps
107%
GeForce RTX 2080 Ti (Desktop):
248 [X] Corsair One i160 Intel Core i9-9900K 3.6GHz
GeForce RTX 2080 Ti (Desktop)
min:
144 fps, max:
252 fps
249 [X] AMD Ryzen 9 3900X 3.8GHz
GeForce RTX 2080 Ti (Desktop)
min:
219 fps, max:
252 fps
~ 249 fps
100%
GeForce RTX 2080 Max-Q:
112 123 [X] Acer Triton 500 Intel Core i7-8750H 2.2GHz
GeForce RTX 2080 Max-Q
min:
102 fps
~ 118 fps
177%
GeForce RTX 2080 Ti (Desktop):
209 [X] Corsair One i160 Intel Core i9-9900K 3.6GHz
GeForce RTX 2080 Ti (Desktop)
min:
166 fps, max:
252 fps
209 [X] AMD Ryzen 9 3900X 3.8GHz
GeForce RTX 2080 Ti (Desktop)
min:
166 fps, max:
252 fps
~ 209 fps
100%
GeForce RTX 2080 Max-Q:
142 [X] Acer Triton 500 Intel Core i7-8750H 2.2GHz
GeForce RTX 2080 Max-Q
min:
125 fps
142 ~ 142 fps
101%
GeForce RTX 2080 Ti (Desktop):
144 [X] MSI GeForce RTX 2080 Ti Intel Core i9-9900K 3.6GHz
GeForce RTX 2080 Ti (Desktop)
min:
141 fps
fps
100%
GeForce RTX 2080 Max-Q:
140 [X] Acer Triton 500 Intel Core i7-8750H 2.2GHz
GeForce RTX 2080 Max-Q
min:
123 fps
141 ~ 141 fps
102%
GeForce RTX 2080 Ti (Desktop):
144 [X] MSI GeForce RTX 2080 Ti Intel Core i9-9900K 3.6GHz
GeForce RTX 2080 Ti (Desktop)
min:
140 fps
fps
100%
GeForce RTX 2080 Max-Q:
139 [X] Acer Triton 500 Intel Core i7-8750H 2.2GHz
GeForce RTX 2080 Max-Q
min:
122 fps
139 ~ 139 fps
104%
GeForce RTX 2080 Ti (Desktop):
144 [X] MSI GeForce RTX 2080 Ti Intel Core i9-9900K 3.6GHz
GeForce RTX 2080 Ti (Desktop)
min:
139 fps
fps
100%
GeForce RTX 2080 Max-Q:
63.4 [X] Acer Triton 500 Intel Core i7-8750H 2.2GHz
GeForce RTX 2080 Max-Q
min:
55 fps
69.5 ~ 66 fps
186%
GeForce RTX 2080 Ti (Desktop):
123 [X] MSI GeForce RTX 2080 Ti Intel Core i9-9900K 3.6GHz
GeForce RTX 2080 Ti (Desktop)
min:
96 fps
fps
GeForce RTX 2080 Ti (Desktop):
147 [X] AMD Ryzen 9 3900X 3.8GHz
GeForce RTX 2080 Ti (Desktop)
min:
126 fps, max:
166 fps
191.8 [X] Corsair One i160 Intel Core i9-9900K 3.6GHz
GeForce RTX 2080 Ti (Desktop)
min:
171 fps, max:
213 fps
~ 169 fps
100%
GeForce RTX 2080 Max-Q:
89.8 [X] Acer Triton 500 Intel Core i7-8750H 2.2GHz
GeForce RTX 2080 Max-Q
min:
75 fps
94.4 [X] Asus GX701GX (Optimus-Mode) Intel Core i7-8750H 2.2GHz
GeForce RTX 2080 Max-Q
min:
79 fps
105 ~ 96 fps
145%
GeForce RTX 2080 Ti (Desktop):
122 [X] AMD Ryzen 9 3900X 3.8GHz
GeForce RTX 2080 Ti (Desktop)
min:
112 fps, max:
132 fps
156 [X] Corsair One i160 Intel Core i9-9900K 3.6GHz
GeForce RTX 2080 Ti (Desktop)
min:
139 fps, max:
171 fps
~ 139 fps
100%
GeForce RTX 2080 Max-Q:
87 [X] Acer Triton 500 Intel Core i7-8750H 2.2GHz
GeForce RTX 2080 Max-Q
min:
73 fps
89.8 [X] Asus GX701GX (Optimus-Mode) Intel Core i7-8750H 2.2GHz
GeForce RTX 2080 Max-Q
min:
78 fps
98.2 ~ 92 fps
147%
GeForce RTX 2080 Ti (Desktop):
120 [X] AMD Ryzen 9 3900X 3.8GHz
GeForce RTX 2080 Ti (Desktop)
min:
111 fps, max:
131 fps
150 [X] Corsair One i160 Intel Core i9-9900K 3.6GHz
GeForce RTX 2080 Ti (Desktop)
min:
135 fps, max:
168 fps
~ 135 fps
100%
GeForce RTX 2080 Max-Q:
57.2 [X] Asus GX701GX (Optimus-Mode) Intel Core i7-8750H 2.2GHz
GeForce RTX 2080 Max-Q
min:
46 fps
57.7 [X] Acer Triton 500 Intel Core i7-8750H 2.2GHz
GeForce RTX 2080 Max-Q
min:
46 fps
58 ~ 58 fps
148%
GeForce RTX 2080 Ti (Desktop):
82 [X] AMD Ryzen 9 3900X 3.8GHz
GeForce RTX 2080 Ti (Desktop)
min:
71 fps, max:
92 fps
90.9 [X] Corsair One i160 Intel Core i9-9900K 3.6GHz
GeForce RTX 2080 Ti (Desktop)
min:
83 fps, max:
103 fps
~ 86 fps
100%
GeForce RTX 2080 Max-Q:
39.1 [X] Acer Triton 500 Intel Core i7-8750H 2.2GHz
GeForce RTX 2080 Max-Q
min:
29 fps
42 ~ 41 fps
161%
GeForce RTX 2080 Ti (Desktop):
64 [X] AMD Ryzen 9 3900X 3.8GHz
GeForce RTX 2080 Ti (Desktop)
min:
52 fps, max:
72 fps
67.5 [X] Corsair One i160 Intel Core i9-9900K 3.6GHz
GeForce RTX 2080 Ti (Desktop)
min:
54 fps, max:
76 fps
~ 66 fps
100%
GeForce RTX 2080 Max-Q:
267.2 fps
138%
GeForce RTX 2080 Ti (Desktop):
358 [X] AMD Ryzen 9 3900X 3.8GHz
GeForce RTX 2080 Ti (Desktop)
min:
87 fps, max:
501 fps
370 [X] AMD Ryzen 9 3900X 3.8GHz
GeForce RTX 2080 Ti (Desktop)
min:
242 fps, max:
500 fps
378.4 [X] Corsair One i160 Intel Core i9-9900K 3.6GHz
GeForce RTX 2080 Ti (Desktop)
min:
36 fps, max:
511 fps
~ 369 fps
100%
GeForce RTX 2080 Max-Q:
163 [X] Asus GX701GX (Optimus-Mode) Intel Core i7-8750H 2.2GHz
GeForce RTX 2080 Max-Q
min:
129 fps
165.2 166 [X] Acer Triton 500 Intel Core i7-8750H 2.2GHz
GeForce RTX 2080 Max-Q
min:
115 fps
171 ~ 166 fps
163%
GeForce RTX 2080 Ti (Desktop):
257 [X] AMD Ryzen 9 3900X 3.8GHz
GeForce RTX 2080 Ti (Desktop)
min:
79 fps, max:
329 fps
273 [X] AMD Ryzen 9 3900X 3.8GHz
GeForce RTX 2080 Ti (Desktop)
min:
221 fps, max:
351 fps
280.1 [X] Corsair One i160 Intel Core i9-9900K 3.6GHz
GeForce RTX 2080 Ti (Desktop)
min:
101 fps, max:
358 fps
~ 270 fps
100%
GeForce RTX 2080 Max-Q:
156 [X] Acer Triton 500 Intel Core i7-8750H 2.2GHz
GeForce RTX 2080 Max-Q
min:
111 fps
156.5 158 [X] Asus GX701GX (Optimus-Mode) Intel Core i7-8750H 2.2GHz
GeForce RTX 2080 Max-Q
min:
127 fps
164 ~ 159 fps
162%
GeForce RTX 2080 Ti (Desktop):
246 [X] AMD Ryzen 9 3900X 3.8GHz
GeForce RTX 2080 Ti (Desktop)
min:
77 fps, max:
317 fps
262 [X] AMD Ryzen 9 3900X 3.8GHz
GeForce RTX 2080 Ti (Desktop)
min:
216 fps, max:
329 fps
267.3 [X] Corsair One i160 Intel Core i9-9900K 3.6GHz
GeForce RTX 2080 Ti (Desktop)
min:
35 fps, max:
349 fps
~ 258 fps
100%
GeForce RTX 2080 Max-Q:
122 [X] Acer Triton 500 Intel Core i7-8750H 2.2GHz
GeForce RTX 2080 Max-Q
min:
88 fps
123.4 130 [X] Asus GX701GX (Optimus-Mode) Intel Core i7-8750H 2.2GHz
GeForce RTX 2080 Max-Q
min:
93 fps
131 ~ 127 fps
162%
GeForce RTX 2080 Ti (Desktop):
195 [X] AMD Ryzen 9 3900X 3.8GHz
GeForce RTX 2080 Ti (Desktop)
min:
83 fps, max:
278 fps
210 [X] AMD Ryzen 9 3900X 3.8GHz
GeForce RTX 2080 Ti (Desktop)
min:
160 fps, max:
280 fps
212.2 [X] Corsair One i160 Intel Core i9-9900K 3.6GHz
GeForce RTX 2080 Ti (Desktop)
min:
77 fps, max:
286 fps
~ 206 fps
100%
GeForce RTX 2080 Max-Q:
52.9 [X] Acer Triton 500 Intel Core i7-8750H 2.2GHz
GeForce RTX 2080 Max-Q
min:
39 fps
57.2 ~ 55 fps
180%
GeForce RTX 2080 Ti (Desktop):
97 [X] Corsair One i160 Intel Core i9-9900K 3.6GHz
GeForce RTX 2080 Ti (Desktop)
min:
71 fps, max:
116 fps
99 [X] AMD Ryzen 9 3900X 3.8GHz
GeForce RTX 2080 Ti (Desktop)
min:
70 fps, max:
120 fps
100 [X] AMD Ryzen 9 3900X 3.8GHz
GeForce RTX 2080 Ti (Desktop)
min:
78 fps, max:
120 fps
~ 99 fps
100%
GeForce RTX 2080 Max-Q:
352 [X] Acer Triton 500 Intel Core i7-8750H 2.2GHz
GeForce RTX 2080 Max-Q
min:
282 fps
360 ~ 356 fps
168%
GeForce RTX 2080 Ti (Desktop):
599 [X] MSI GeForce RTX 2080 Ti Intel Core i9-9900K 3.6GHz
GeForce RTX 2080 Ti (Desktop)
min:
487 fps
fps
100%
GeForce RTX 2080 Max-Q:
194 [X] Acer Triton 500 Intel Core i7-8750H 2.2GHz
GeForce RTX 2080 Max-Q
min:
164 fps
220 ~ 207 fps
185%
GeForce RTX 2080 Ti (Desktop):
382 [X] MSI GeForce RTX 2080 Ti Intel Core i9-9900K 3.6GHz
GeForce RTX 2080 Ti (Desktop)
min:
334 fps
fps
100%
GeForce RTX 2080 Max-Q:
163 [X] Acer Triton 500 Intel Core i7-8750H 2.2GHz
GeForce RTX 2080 Max-Q
min:
142 fps
182 ~ 173 fps
183%
GeForce RTX 2080 Ti (Desktop):
316 [X] MSI GeForce RTX 2080 Ti Intel Core i9-9900K 3.6GHz
GeForce RTX 2080 Ti (Desktop)
min:
284 fps
fps
100%
GeForce RTX 2080 Max-Q:
58.6 [X] Acer Triton 500 Intel Core i7-8750H 2.2GHz
GeForce RTX 2080 Max-Q
min:
48 fps
65.1 ~ 62 fps
189%
GeForce RTX 2080 Ti (Desktop):
117 [X] MSI GeForce RTX 2080 Ti Intel Core i9-9900K 3.6GHz
GeForce RTX 2080 Ti (Desktop)
min:
99 fps
fps
GeForce RTX 2080 Ti (Desktop):
155 [X] AMD Ryzen 9 3900X 3.8GHz
GeForce RTX 2080 Ti (Desktop)
min:
116 fps, max:
186 fps
176 [X] Corsair One i160 Intel Core i9-9900K 3.6GHz
GeForce RTX 2080 Ti (Desktop)
min:
42 fps, max:
227 fps
~ 166 fps
GeForce RTX 2080 Ti (Desktop):
141 [X] AMD Ryzen 9 3900X 3.8GHz
GeForce RTX 2080 Ti (Desktop)
min:
109 fps, max:
167 fps
170 [X] Corsair One i160 Intel Core i9-9900K 3.6GHz
GeForce RTX 2080 Ti (Desktop)
min:
128 fps, max:
211 fps
~ 156 fps
GeForce RTX 2080 Ti (Desktop):
126 [X] AMD Ryzen 9 3900X 3.8GHz
GeForce RTX 2080 Ti (Desktop)
min:
98 fps, max:
149 fps
144 [X] Corsair One i160 Intel Core i9-9900K 3.6GHz
GeForce RTX 2080 Ti (Desktop)
min:
99 fps, max:
170 fps
~ 135 fps
GeForce RTX 2080 Ti (Desktop):
101 [X] AMD Ryzen 9 3900X 3.8GHz
GeForce RTX 2080 Ti (Desktop)
min:
82 fps, max:
113 fps
113 [X] Corsair One i160 Intel Core i9-9900K 3.6GHz
GeForce RTX 2080 Ti (Desktop)
min:
95 fps, max:
127 fps
~ 107 fps
GeForce RTX 2080 Ti (Desktop):
66 [X] AMD Ryzen 9 3900X 3.8GHz
GeForce RTX 2080 Ti (Desktop)
min:
59 fps, max:
73 fps
70 [X] Corsair One i160 Intel Core i9-9900K 3.6GHz
GeForce RTX 2080 Ti (Desktop)
min:
47 fps, max:
78 fps
~ 68 fps
GeForce RTX 2080 Ti (Desktop):
92 [X] AMD Ryzen 9 3900X 3.8GHz
GeForce RTX 2080 Ti (Desktop)
min:
77 fps, max:
107 fps
120 [X] Corsair One i160 Intel Core i9-9900K 3.6GHz
GeForce RTX 2080 Ti (Desktop)
min:
118 fps, max:
120 fps
~ 106 fps
GeForce RTX 2080 Ti (Desktop):
89 [X] AMD Ryzen 9 3900X 3.8GHz
GeForce RTX 2080 Ti (Desktop)
min:
71 fps, max:
104 fps
120 [X] Corsair One i160 Intel Core i9-9900K 3.6GHz
GeForce RTX 2080 Ti (Desktop)
min:
119 fps, max:
120 fps
~ 105 fps
100%
GeForce RTX 2080 Max-Q:
98.8 [X] Acer Triton 500 Intel Core i7-8750H 2.2GHz
GeForce RTX 2080 Max-Q
min:
85 fps
109 ~ 104 fps
100%
GeForce RTX 2080 Ti (Desktop):
88 [X] AMD Ryzen 9 3900X 3.8GHz
GeForce RTX 2080 Ti (Desktop)
min:
69 fps, max:
102 fps
120 [X] Corsair One i160 Intel Core i9-9900K 3.6GHz
GeForce RTX 2080 Ti (Desktop)
min:
118 fps, max:
120 fps
~ 104 fps
100%
GeForce RTX 2080 Max-Q:
92.8 [X] Acer Triton 500 Intel Core i7-8750H 2.2GHz
GeForce RTX 2080 Max-Q
min:
80 fps
94 ~ 93 fps
109%
GeForce RTX 2080 Ti (Desktop):
82 [X] AMD Ryzen 9 3900X 3.8GHz
GeForce RTX 2080 Ti (Desktop)
min:
63 fps, max:
101 fps
119 [X] Corsair One i160 Intel Core i9-9900K 3.6GHz
GeForce RTX 2080 Ti (Desktop)
min:
114 fps, max:
120 fps
~ 101 fps
100%
GeForce RTX 2080 Max-Q:
54.4 [X] Acer Triton 500 Intel Core i7-8750H 2.2GHz
GeForce RTX 2080 Max-Q
min:
45 fps
61.1 ~ 58 fps
166%
GeForce RTX 2080 Ti (Desktop):
86 [X] AMD Ryzen 9 3900X 3.8GHz
GeForce RTX 2080 Ti (Desktop)
min:
69 fps, max:
100 fps
105 [X] Corsair One i160 Intel Core i9-9900K 3.6GHz
GeForce RTX 2080 Ti (Desktop)
min:
88 fps, max:
120 fps
~ 96 fps
GeForce RTX 2080 Ti (Desktop):
200 [X] Corsair One i160 Intel Core i9-9900K 3.6GHz
GeForce RTX 2080 Ti (Desktop)
min:
197 fps, max:
201 fps
200 [X] AMD Ryzen 9 3900X 3.8GHz
GeForce RTX 2080 Ti (Desktop)
min:
196 fps, max:
201 fps
~ 200 fps
GeForce RTX 2080 Ti (Desktop):
196 [X] AMD Ryzen 9 3900X 3.8GHz
GeForce RTX 2080 Ti (Desktop)
min:
186 fps, max:
201 fps
200 [X] Corsair One i160 Intel Core i9-9900K 3.6GHz
GeForce RTX 2080 Ti (Desktop)
min:
197 fps, max:
201 fps
~ 198 fps
100%
GeForce RTX 2080 Max-Q:
134 146 ~ 140 fps
137%
GeForce RTX 2080 Ti (Desktop):
184 [X] AMD Ryzen 9 3900X 3.8GHz
GeForce RTX 2080 Ti (Desktop)
min:
169 fps, max:
193 fps
200 [X] Corsair One i160 Intel Core i9-9900K 3.6GHz
GeForce RTX 2080 Ti (Desktop)
min:
197 fps, max:
201 fps
~ 192 fps
100%
GeForce RTX 2080 Max-Q:
129 134 ~ 132 fps
140%
GeForce RTX 2080 Ti (Desktop):
171 [X] AMD Ryzen 9 3900X 3.8GHz
GeForce RTX 2080 Ti (Desktop)
min:
156 fps, max:
191 fps
199 [X] Corsair One i160 Intel Core i9-9900K 3.6GHz
GeForce RTX 2080 Ti (Desktop)
min:
186 fps, max:
201 fps
~ 185 fps
100%
GeForce RTX 2080 Max-Q:
65 fps
177%
GeForce RTX 2080 Ti (Desktop):
112 [X] AMD Ryzen 9 3900X 3.8GHz
GeForce RTX 2080 Ti (Desktop)
min:
103 fps, max:
117 fps
118 [X] Corsair One i160 Intel Core i9-9900K 3.6GHz
GeForce RTX 2080 Ti (Desktop)
min:
104 fps, max:
123 fps
~ 115 fps
GeForce RTX 2080 Ti (Desktop):
167 [X] AMD Ryzen 9 3900X 3.8GHz
GeForce RTX 2080 Ti (Desktop)
min:
104 fps, max:
257 fps
186.6 [X] Corsair One i160 Intel Core i9-9900K 3.6GHz
GeForce RTX 2080 Ti (Desktop)
min:
103 fps, max:
170 fps
~ 177 fps
GeForce RTX 2080 Ti (Desktop):
156 [X] AMD Ryzen 9 3900X 3.8GHz
GeForce RTX 2080 Ti (Desktop)
min:
101 fps, max:
238 fps
173.6 [X] Corsair One i160 Intel Core i9-9900K 3.6GHz
GeForce RTX 2080 Ti (Desktop)
min:
27 fps, max:
257 fps
~ 165 fps
100%
GeForce RTX 2080 Max-Q:
103 [X] Acer Triton 500 Intel Core i7-8750H 2.2GHz
GeForce RTX 2080 Max-Q
min:
76 fps
107 ~ 105 fps
136%
GeForce RTX 2080 Ti (Desktop):
135 [X] AMD Ryzen 9 3900X 3.8GHz
GeForce RTX 2080 Ti (Desktop)
min:
91 fps, max:
193 fps
151.6 [X] Corsair One i160 Intel Core i9-9900K 3.6GHz
GeForce RTX 2080 Ti (Desktop)
min:
105 fps, max:
203 fps
~ 143 fps
100%
GeForce RTX 2080 Max-Q:
59.7 [X] Acer Triton 500 Intel Core i7-8750H 2.2GHz
GeForce RTX 2080 Max-Q
min:
46 fps
63.5 ~ 62 fps
166%
GeForce RTX 2080 Ti (Desktop):
100 [X] AMD Ryzen 9 3900X 3.8GHz
GeForce RTX 2080 Ti (Desktop)
min:
76 fps, max:
133 fps
106.5 [X] Corsair One i160 Intel Core i9-9900K 3.6GHz
GeForce RTX 2080 Ti (Desktop)
min:
81 fps, max:
140 fps
~ 103 fps
100%
GeForce RTX 2080 Max-Q:
37.4 [X] Acer Triton 500 Intel Core i7-8750H 2.2GHz
GeForce RTX 2080 Max-Q
min:
31 fps
40.6 ~ 39 fps
177%
GeForce RTX 2080 Ti (Desktop):
67 [X] AMD Ryzen 9 3900X 3.8GHz
GeForce RTX 2080 Ti (Desktop)
min:
56 fps, max:
84 fps
70.2 [X] Corsair One i160 Intel Core i9-9900K 3.6GHz
GeForce RTX 2080 Ti (Desktop)
min:
59 fps, max:
88 fps
~ 69 fps
100%
GeForce RTX 2080 Max-Q:
120 [X] Asus GX701GX (Optimus-Mode) Intel Core i7-8750H 2.2GHz
GeForce RTX 2080 Max-Q
min:
87 fps
121 [X] Acer Triton 500 Intel Core i7-8750H 2.2GHz
GeForce RTX 2080 Max-Q
min:
106 fps
135 ~ 125 fps
100%
GeForce RTX 2080 Max-Q:
110 [X] Acer Triton 500 Intel Core i7-8750H 2.2GHz
GeForce RTX 2080 Max-Q
min:
98 fps
113 [X] Asus GX701GX (Optimus-Mode) Intel Core i7-8750H 2.2GHz
GeForce RTX 2080 Max-Q
min:
86 fps
123 ~ 115 fps
100%
GeForce RTX 2080 Max-Q:
45.6 [X] Acer Triton 500 Intel Core i7-8750H 2.2GHz
GeForce RTX 2080 Max-Q
min:
42 fps
50.2 ~ 48 fps
GeForce RTX 2080 Ti (Desktop):
300 [X] Corsair One i160 Intel Core i9-9900K 3.6GHz
GeForce RTX 2080 Ti (Desktop)
min:
299 fps, max:
301 fps
300 [X] AMD Ryzen 9 3900X 3.8GHz
GeForce RTX 2080 Ti (Desktop)
min:
299 fps, max:
301 fps
~ 300 fps
GeForce RTX 2080 Ti (Desktop):
300 [X] Corsair One i160 Intel Core i9-9900K 3.6GHz
GeForce RTX 2080 Ti (Desktop)
min:
299 fps, max:
301 fps
300 [X] AMD Ryzen 9 3900X 3.8GHz
GeForce RTX 2080 Ti (Desktop)
min:
299 fps, max:
301 fps
~ 300 fps
100%
GeForce RTX 2080 Max-Q:
238 [X] Asus GX701GX (Optimus-Mode) Intel Core i7-8750H 2.2GHz
GeForce RTX 2080 Max-Q
min:
206 fps
289 [X] Acer Triton 500 Intel Core i7-8750H 2.2GHz
GeForce RTX 2080 Max-Q
min:
245 fps
292 ~ 273 fps
110%
GeForce RTX 2080 Ti (Desktop):
300 [X] Corsair One i160 Intel Core i9-9900K 3.6GHz
GeForce RTX 2080 Ti (Desktop)
min:
299 fps, max:
301 fps
300 [X] AMD Ryzen 9 3900X 3.8GHz
GeForce RTX 2080 Ti (Desktop)
min:
297 fps, max:
302 fps
~ 300 fps
100%
GeForce RTX 2080 Max-Q:
178 [X] Acer Triton 500 Intel Core i7-8750H 2.2GHz
GeForce RTX 2080 Max-Q
min:
148 fps
179 [X] Asus GX701GX (Optimus-Mode) Intel Core i7-8750H 2.2GHz
GeForce RTX 2080 Max-Q
min:
157 fps
196 ~ 184 fps
161%
GeForce RTX 2080 Ti (Desktop):
295 [X] AMD Ryzen 9 3900X 3.8GHz
GeForce RTX 2080 Ti (Desktop)
min:
258 fps, max:
302 fps
299 [X] Corsair One i160 Intel Core i9-9900K 3.6GHz
GeForce RTX 2080 Ti (Desktop)
min:
279 fps, max:
302 fps
~ 297 fps
100%
GeForce RTX 2080 Max-Q:
102 [X] Acer Triton 500 Intel Core i7-8750H 2.2GHz
GeForce RTX 2080 Max-Q
min:
85 fps
111 ~ 107 fps
180%
GeForce RTX 2080 Ti (Desktop):
188 [X] AMD Ryzen 9 3900X 3.8GHz
GeForce RTX 2080 Ti (Desktop)
min:
158 fps, max:
218 fps
198 [X] Corsair One i160 Intel Core i9-9900K 3.6GHz
GeForce RTX 2080 Ti (Desktop)
min:
167 fps, max:
226 fps
~ 193 fps
GeForce RTX 2080 Ti (Desktop):
187 [X] Corsair One i160 Intel Core i9-9900K 3.6GHz
GeForce RTX 2080 Ti (Desktop)
min:
135 fps, max:
201 fps
194 [X] AMD Ryzen 9 3900X 3.8GHz
GeForce RTX 2080 Ti (Desktop)
min:
136 fps, max:
201 fps
~ 191 fps
GeForce RTX 2080 Ti (Desktop):
173 [X] Corsair One i160 Intel Core i9-9900K 3.6GHz
GeForce RTX 2080 Ti (Desktop)
min:
137 fps, max:
201 fps
178 [X] AMD Ryzen 9 3900X 3.8GHz
GeForce RTX 2080 Ti (Desktop)
min:
135 fps, max:
201 fps
~ 176 fps
100%
GeForce RTX 2080 Max-Q:
131 [X] Acer Triton 500 Intel Core i7-8750H 2.2GHz
GeForce RTX 2080 Max-Q
min:
113 fps
134 ~ 133 fps
123%
GeForce RTX 2080 Ti (Desktop):
163 [X] AMD Ryzen 9 3900X 3.8GHz
GeForce RTX 2080 Ti (Desktop)
min:
110 fps, max:
201 fps
164 [X] Corsair One i160 Intel Core i9-9900K 3.6GHz
GeForce RTX 2080 Ti (Desktop)
min:
126 fps, max:
201 fps
~ 164 fps
100%
GeForce RTX 2080 Max-Q:
127 [X] Acer Triton 500 Intel Core i7-8750H 2.2GHz
GeForce RTX 2080 Max-Q
min:
106 fps
129 ~ 128 fps
127%
GeForce RTX 2080 Ti (Desktop):
156 [X] Corsair One i160 Intel Core i9-9900K 3.6GHz
GeForce RTX 2080 Ti (Desktop)
min:
116 fps, max:
201 fps
167 [X] AMD Ryzen 9 3900X 3.8GHz
GeForce RTX 2080 Ti (Desktop)
min:
129 fps, max:
201 fps
~ 162 fps
100%
GeForce RTX 2080 Max-Q:
71.1 [X] Acer Triton 500 Intel Core i7-8750H 2.2GHz
GeForce RTX 2080 Max-Q
min:
62 fps
79.3 ~ 75 fps
184%
GeForce RTX 2080 Ti (Desktop):
131 [X] AMD Ryzen 9 3900X 3.8GHz
GeForce RTX 2080 Ti (Desktop)
min:
102 fps, max:
167 fps
144 [X] Corsair One i160 Intel Core i9-9900K 3.6GHz
GeForce RTX 2080 Ti (Desktop)
min:
113 fps, max:
177 fps
~ 138 fps
100%
GeForce RTX 2080 Max-Q:
82.5 fps
100%
GeForce RTX 2080 Max-Q:
80.7 fps
100%
GeForce RTX 2080 Max-Q:
81.3 fps
110%
GeForce RTX 2080 Ti (Desktop):
89.4 [X] MSI GeForce RTX 2080 Ti Gaming X Trio Intel Core i7-7740X 4.3GHz
GeForce RTX 2080 Ti (Desktop)
fps
GeForce RTX 2080 Ti (Desktop):
83.4 [X] MSI GeForce RTX 2080 Ti Gaming X Trio Intel Core i7-7740X 4.3GHz
GeForce RTX 2080 Ti (Desktop)
fps
GeForce RTX 2080 Ti (Desktop):
328 [X] AMD Ryzen 9 3900X 3.8GHz
GeForce RTX 2080 Ti (Desktop)
354.3 ~ 341 fps
GeForce RTX 2080 Ti (Desktop):
279 [X] AMD Ryzen 9 3900X 3.8GHz
GeForce RTX 2080 Ti (Desktop)
285.1 ~ 282 fps
100%
GeForce RTX 2080 Max-Q:
113 [X] Asus GX701GX (Optimus-Mode) Intel Core i7-8750H 2.2GHz
GeForce RTX 2080 Max-Q
min:
81 fps
117 [X] Acer Triton 500 Intel Core i7-8750H 2.2GHz
GeForce RTX 2080 Max-Q
min:
63 fps
127 ~ 119 fps
165%
GeForce RTX 2080 Ti (Desktop):
196 [X] AMD Ryzen 9 3900X 3.8GHz
GeForce RTX 2080 Ti (Desktop)
196.9 ~ 196 fps
100%
GeForce RTX 2080 Max-Q:
93 [X] Acer Triton 500 Intel Core i7-8750H 2.2GHz
GeForce RTX 2080 Max-Q
min:
61 fps
93.9 [X] Asus GX701GX (Optimus-Mode) Intel Core i7-8750H 2.2GHz
GeForce RTX 2080 Max-Q
min:
67 fps
100 ~ 96 fps
165%
GeForce RTX 2080 Ti (Desktop):
155.2 160 [X] AMD Ryzen 9 3900X 3.8GHz
GeForce RTX 2080 Ti (Desktop)
~ 158 fps
100%
GeForce RTX 2080 Max-Q:
45.6 [X] Acer Triton 500 Intel Core i7-8750H 2.2GHz
GeForce RTX 2080 Max-Q
min:
20 fps
51.7 ~ 49 fps
184%
GeForce RTX 2080 Ti (Desktop):
86 [X] AMD Ryzen 9 3900X 3.8GHz
GeForce RTX 2080 Ti (Desktop)
93.1 ~ 90 fps
GeForce RTX 2080 Ti (Desktop):
129 [X] AMD Ryzen 9 3900X 3.8GHz
GeForce RTX 2080 Ti (Desktop)
min:
103 fps, max:
148 fps
149 [X] Corsair One i160 Intel Core i9-9900K 3.6GHz
GeForce RTX 2080 Ti (Desktop)
min:
119 fps, max:
174 fps
~ 139 fps
GeForce RTX 2080 Ti (Desktop):
116 [X] AMD Ryzen 9 3900X 3.8GHz
GeForce RTX 2080 Ti (Desktop)
min:
91 fps, max:
134 fps
135 [X] Corsair One i160 Intel Core i9-9900K 3.6GHz
GeForce RTX 2080 Ti (Desktop)
min:
103 fps, max:
159 fps
~ 126 fps
GeForce RTX 2080 Ti (Desktop):
107 [X] AMD Ryzen 9 3900X 3.8GHz
GeForce RTX 2080 Ti (Desktop)
min:
83 fps, max:
123 fps
124 [X] Corsair One i160 Intel Core i9-9900K 3.6GHz
GeForce RTX 2080 Ti (Desktop)
min:
90 fps, max:
145 fps
~ 116 fps
GeForce RTX 2080 Ti (Desktop):
100 [X] AMD Ryzen 9 3900X 3.8GHz
GeForce RTX 2080 Ti (Desktop)
min:
73 fps, max:
118 fps
114 [X] Corsair One i160 Intel Core i9-9900K 3.6GHz
GeForce RTX 2080 Ti (Desktop)
min:
72 fps, max:
141 fps
~ 107 fps
GeForce RTX 2080 Ti (Desktop):
88 [X] AMD Ryzen 9 3900X 3.8GHz
GeForce RTX 2080 Ti (Desktop)
min:
79 fps, max:
97 fps
92 [X] Corsair One i160 Intel Core i9-9900K 3.6GHz
GeForce RTX 2080 Ti (Desktop)
min:
83 fps, max:
101 fps
~ 90 fps
146%
GeForce RTX 2080 Ti (Desktop):
324 [X] AMD Ryzen 9 3900X 3.8GHz
GeForce RTX 2080 Ti (Desktop)
min:
307 fps, max:
338 fps
346 [X] Corsair One i160 Intel Core i9-9900K 3.6GHz
GeForce RTX 2080 Ti (Desktop)
min:
301 fps, max:
379 fps
~ 335 fps
132%
GeForce RTX 2080 Ti (Desktop):
223 [X] AMD Ryzen 9 3900X 3.8GHz
GeForce RTX 2080 Ti (Desktop)
min:
216 fps, max:
234 fps
239 [X] Corsair One i160 Intel Core i9-9900K 3.6GHz
GeForce RTX 2080 Ti (Desktop)
min:
228 fps, max:
254 fps
~ 231 fps
155%
GeForce RTX 2080 Ti (Desktop):
212 [X] AMD Ryzen 9 3900X 3.8GHz
GeForce RTX 2080 Ti (Desktop)
min:
205 fps, max:
224 fps
222 [X] Corsair One i160 Intel Core i9-9900K 3.6GHz
GeForce RTX 2080 Ti (Desktop)
min:
202 fps, max:
234 fps
~ 217 fps
169%
GeForce RTX 2080 Ti (Desktop):
198 [X] AMD Ryzen 9 3900X 3.8GHz
GeForce RTX 2080 Ti (Desktop)
min:
183 fps, max:
211 fps
201 [X] Corsair One i160 Intel Core i9-9900K 3.6GHz
GeForce RTX 2080 Ti (Desktop)
min:
187 fps, max:
213 fps
~ 200 fps
100%
GeForce RTX 2080 Max-Q:
52.4 fps
181%
GeForce RTX 2080 Ti (Desktop):
93 [X] AMD Ryzen 9 3900X 3.8GHz
GeForce RTX 2080 Ti (Desktop)
min:
86 fps, max:
104 fps
97 [X] Corsair One i160 Intel Core i9-9900K 3.6GHz
GeForce RTX 2080 Ti (Desktop)
min:
88 fps, max:
107 fps
~ 95 fps
GeForce RTX 2080 Ti (Desktop):
425.1 [X] Corsair One i160 Intel Core i9-9900K 3.6GHz
GeForce RTX 2080 Ti (Desktop)
min:
54 fps, max:
724 fps
470 [X] AMD Ryzen 9 3900X 3.8GHz
GeForce RTX 2080 Ti (Desktop)
min:
226 fps, max:
874 fps
~ 448 fps
GeForce RTX 2080 Ti (Desktop):
360.4 [X] Corsair One i160 Intel Core i9-9900K 3.6GHz
GeForce RTX 2080 Ti (Desktop)
min:
149 fps, max:
643 fps
379 [X] AMD Ryzen 9 3900X 3.8GHz
GeForce RTX 2080 Ti (Desktop)
min:
170 fps, max:
689 fps
~ 370 fps
100%
GeForce RTX 2080 Max-Q:
152 [X] Asus GX701GX (Optimus-Mode) Intel Core i7-8750H 2.2GHz
GeForce RTX 2080 Max-Q
min:
85 fps
210 [X] Acer Triton 500 Intel Core i7-8750H 2.2GHz
GeForce RTX 2080 Max-Q
min:
46 fps
230 ~ 197 fps
172%
GeForce RTX 2080 Ti (Desktop):
332 [X] AMD Ryzen 9 3900X 3.8GHz
GeForce RTX 2080 Ti (Desktop)
min:
170 fps, max:
589 fps
343.5 [X] Corsair One i160 Intel Core i9-9900K 3.6GHz
GeForce RTX 2080 Ti (Desktop)
min:
108 fps, max:
592 fps
~ 338 fps
100%
GeForce RTX 2080 Max-Q:
148 [X] Asus GX701GX (Optimus-Mode) Intel Core i7-8750H 2.2GHz
GeForce RTX 2080 Max-Q
min:
77 fps
201 [X] Acer Triton 500 Intel Core i7-8750H 2.2GHz
GeForce RTX 2080 Max-Q
min:
41 fps
217 ~ 189 fps
169%
GeForce RTX 2080 Ti (Desktop):
313 [X] AMD Ryzen 9 3900X 3.8GHz
GeForce RTX 2080 Ti (Desktop)
min:
20 fps, max:
489 fps
327 [X] Corsair One i160 Intel Core i9-9900K 3.6GHz
GeForce RTX 2080 Ti (Desktop)
min:
58 fps, max:
489 fps
~ 320 fps
100%
GeForce RTX 2080 Max-Q:
90.8 [X] Acer Triton 500 Intel Core i7-8750H 2.2GHz
GeForce RTX 2080 Max-Q
min:
36 fps
98.2 ~ 95 fps
189%
GeForce RTX 2080 Ti (Desktop):
173 [X] AMD Ryzen 9 3900X 3.8GHz
GeForce RTX 2080 Ti (Desktop)
min:
102 fps, max:
284 fps
187.4 [X] Corsair One i160 Intel Core i9-9900K 3.6GHz
GeForce RTX 2080 Ti (Desktop)
min:
95 fps, max:
227 fps
~ 180 fps
GeForce RTX 2080 Ti (Desktop):
168 [X] MSI GeForce RTX 2080 Ti Gaming X Trio Intel Core i7-7740X 4.3GHz
GeForce RTX 2080 Ti (Desktop)
min:
108 fps, max:
226 fps
fps
100%
GeForce RTX 2080 Max-Q:
144.9 fps
106%
GeForce RTX 2080 Ti (Desktop):
129.5 [X] AMD Ryzen 9 3900X 3.8GHz
GeForce RTX 2080 Ti (Desktop)
min:
87.5 fps
163.7 [X] AMD Ryzen 9 3900X 3.8GHz
GeForce RTX 2080 Ti (Desktop)
min:
144.7 fps
167.6 ~ 154 fps
107%
GeForce RTX 2070 Super Mobile:
154 155 156 156 ~ 155 fps
100%
GeForce RTX 2080 Max-Q:
132.2 fps
110%
GeForce RTX 2080 Ti (Desktop):
134.5 [X] AMD Ryzen 9 3900X 3.8GHz
GeForce RTX 2080 Ti (Desktop)
min:
110.7 fps
148.9 [X] AMD Ryzen 9 3900X 3.8GHz
GeForce RTX 2080 Ti (Desktop)
min:
131.1 fps
152.9 ~ 145 fps
106%
GeForce RTX 2070 Super Mobile:
136 137 141 145 ~ 140 fps
100%
GeForce RTX 2080 Max-Q:
126.4 fps
116%
GeForce RTX 2080 Ti (Desktop):
143.9 [X] AMD Ryzen 9 3900X 3.8GHz
GeForce RTX 2080 Ti (Desktop)
min:
124.8 fps
146.2 [X] AMD Ryzen 9 3900X 3.8GHz
GeForce RTX 2080 Ti (Desktop)
min:
126.1 fps
149 ~ 146 fps
100%
GeForce RTX 2070 Super Mobile:
111 127 133 135 ~ 127 fps
100%
GeForce RTX 2080 Max-Q:
119.6 fps
117%
GeForce RTX 2080 Ti (Desktop):
136.4 [X] AMD Ryzen 9 3900X 3.8GHz
GeForce RTX 2080 Ti (Desktop)
min:
118.9 fps
141.2 [X] AMD Ryzen 9 3900X 3.8GHz
GeForce RTX 2080 Ti (Desktop)
min:
119.4 fps
142.7 ~ 140 fps
100%
GeForce RTX 2070 Super Mobile:
104 122 126 129 ~ 120 fps
GeForce RTX 2080 Ti (Desktop):
133.4 [X] AMD Ryzen 9 3900X 3.8GHz
GeForce RTX 2080 Ti (Desktop)
min:
114.8 fps
139.3 139.6 [X] AMD Ryzen 9 3900X 3.8GHz
GeForce RTX 2080 Ti (Desktop)
min:
115.5 fps
~ 137 fps
100%
GeForce RTX 2080 Max-Q:
172 fps
100%
GeForce RTX 2080 Max-Q:
161 fps
100%
GeForce RTX 2080 Max-Q:
134 fps
100%
GeForce RTX 2080 Max-Q:
92 fps
138%
GeForce RTX 2080 Ti (Desktop):
380 [X] AMD Ryzen 9 3900X 3.8GHz
GeForce RTX 2080 Ti (Desktop)
min:
343 fps, max:
436 fps
403 [X] AMD Ryzen 9 3900X 3.8GHz
GeForce RTX 2080 Ti (Desktop)
min:
355 fps, max:
475 fps
415 [X] Corsair One i160 Intel Core i9-9900K 3.6GHz
GeForce RTX 2080 Ti (Desktop)
min:
370 fps, max:
463 fps
~ 399 fps
151%
GeForce RTX 2080 Ti (Desktop):
335 [X] AMD Ryzen 9 3900X 3.8GHz
GeForce RTX 2080 Ti (Desktop)
min:
312 fps, max:
373 fps
341 [X] AMD Ryzen 9 3900X 3.8GHz
GeForce RTX 2080 Ti (Desktop)
min:
321 fps, max:
400 fps
349 [X] Corsair One i160 Intel Core i9-9900K 3.6GHz
GeForce RTX 2080 Ti (Desktop)
min:
320 fps, max:
393 fps
~ 342 fps
172%
GeForce RTX 2080 Ti (Desktop):
245 [X] AMD Ryzen 9 3900X 3.8GHz
GeForce RTX 2080 Ti (Desktop)
min:
224 fps, max:
266 fps
247 [X] AMD Ryzen 9 3900X 3.8GHz
GeForce RTX 2080 Ti (Desktop)
min:
224 fps, max:
270 fps
248 [X] Corsair One i160 Intel Core i9-9900K 3.6GHz
GeForce RTX 2080 Ti (Desktop)
min:
220 fps, max:
266 fps
~ 247 fps
170%
GeForce RTX 2080 Ti (Desktop):
131 [X] Corsair One i160 Intel Core i9-9900K 3.6GHz
GeForce RTX 2080 Ti (Desktop)
min:
110 fps, max:
147 fps
135 [X] AMD Ryzen 9 3900X 3.8GHz
GeForce RTX 2080 Ti (Desktop)
min:
118 fps, max:
158 fps
136 [X] AMD Ryzen 9 3900X 3.8GHz
GeForce RTX 2080 Ti (Desktop)
min:
119 fps, max:
154 fps
~ 134 fps
100%
GeForce RTX 2080 Max-Q:
39.6 50.6 53 53.3 [X] Acer Triton 500 Intel Core i7-8750H 2.2GHz
GeForce RTX 2080 Max-Q
min:
43 fps
57.6 65.5 ~ 53 fps
185%
GeForce RTX 2080 Ti (Desktop):
96 [X] AMD Ryzen 9 3900X 3.8GHz
GeForce RTX 2080 Ti (Desktop)
min:
87 fps, max:
109 fps
98 [X] Corsair One i160 Intel Core i9-9900K 3.6GHz
GeForce RTX 2080 Ti (Desktop)
min:
88 fps, max:
106 fps
101 [X] AMD Ryzen 9 3900X 3.8GHz
GeForce RTX 2080 Ti (Desktop)
min:
91 fps, max:
109 fps
~ 98 fps
111%
GeForce RTX 2070 Super Mobile:
57.6 59.8 ~ 59 fps
100%
GeForce RTX 2080 Max-Q:
140 171 ~ 156 fps
115%
GeForce RTX 2080 Ti (Desktop):
177 [X] AMD Ryzen 9 3900X 3.8GHz
GeForce RTX 2080 Ti (Desktop)
min:
3.82 fps, P1:
125 fps, max:
284 fps
182 [X] Corsair One i160 Intel Core i9-9900K 3.6GHz
GeForce RTX 2080 Ti (Desktop)
min:
2.72 fps, P1:
125 fps, max:
270 fps
~ 180 fps
117%
GeForce RTX 2070 Super Mobile:
182 [X] MSI GE66 Raider 10SFS Intel Core i9-10980HK 2.4GHz
GeForce RTX 2070 Super Mobile
min:
2.06 fps, P1:
143 fps, max:
272 fps
fps
100%
GeForce RTX 2080 Max-Q:
135.3 166 ~ 151 fps
115%
GeForce RTX 2080 Ti (Desktop):
172 [X] AMD Ryzen 9 3900X 3.8GHz
GeForce RTX 2080 Ti (Desktop)
min:
5.17 fps, P1:
125 fps, max:
288 fps
175 [X] Corsair One i160 Intel Core i9-9900K 3.6GHz
GeForce RTX 2080 Ti (Desktop)
min:
3.3 fps, P1:
125 fps, max:
298 fps
~ 174 fps
117%
GeForce RTX 2070 Super Mobile:
177 [X] MSI GE66 Raider 10SFS Intel Core i9-10980HK 2.4GHz
GeForce RTX 2070 Super Mobile
min:
3.28 fps, P1:
143 fps, max:
351 fps
fps
100%
GeForce RTX 2080 Max-Q:
115.4 144 ~ 130 fps
127%
GeForce RTX 2080 Ti (Desktop):
162 [X] AMD Ryzen 9 3900X 3.8GHz
GeForce RTX 2080 Ti (Desktop)
min:
3.95 fps, P1:
100 fps, max:
274 fps
168 [X] Corsair One i160 Intel Core i9-9900K 3.6GHz
GeForce RTX 2080 Ti (Desktop)
min:
4.39 fps, P1:
111 fps, max:
262 fps
~ 165 fps
125%
GeForce RTX 2070 Super Mobile:
163 [X] MSI GE66 Raider 10SFS Intel Core i9-10980HK 2.4GHz
GeForce RTX 2070 Super Mobile
min:
5.5 fps, P1:
100 fps, max:
300 fps
fps
100%
GeForce RTX 2080 Max-Q:
62.6 77.2 ~ 70 fps
147%
GeForce RTX 2080 Ti (Desktop):
99 [X] AMD Ryzen 9 3900X 3.8GHz
GeForce RTX 2080 Ti (Desktop)
min:
7.42 fps, P1:
71.4 fps, max:
180 fps
106 [X] Corsair One i160 Intel Core i9-9900K 3.6GHz
GeForce RTX 2080 Ti (Desktop)
min:
8.15 fps, P1:
76.9 fps, max:
201 fps
~ 103 fps
134%
GeForce RTX 2070 Super Mobile:
94 [X] MSI GE66 Raider 10SFS Intel Core i9-10980HK 2.4GHz
GeForce RTX 2070 Super Mobile
min:
22.9 fps, P1:
62.5 fps, max:
186 fps
fps
100%
GeForce RTX 2080 Max-Q:
74 fps
192%
GeForce RTX 2080 Ti (Desktop):
138 [X] AMD Ryzen 9 3900X 3.8GHz
GeForce RTX 2080 Ti (Desktop)
min:
18.4 fps, P1:
100 fps, max:
269 fps
145 [X] Corsair One i160 Intel Core i9-9900K 3.6GHz
GeForce RTX 2080 Ti (Desktop)
min:
16.6 fps, P1:
111 fps, max:
265 fps
~ 142 fps
GeForce RTX 2080 Ti (Desktop):
200 [X] Corsair One i160 Intel Core i9-9900K 3.6GHz
GeForce RTX 2080 Ti (Desktop)
min:
195 fps, max:
202 fps
200 [X] AMD Ryzen 9 3900X 3.8GHz
GeForce RTX 2080 Ti (Desktop)
~ 200 fps
GeForce RTX 2080 Ti (Desktop):
200 [X] Corsair One i160 Intel Core i9-9900K 3.6GHz
GeForce RTX 2080 Ti (Desktop)
min:
195 fps, max:
201 fps
200 [X] AMD Ryzen 9 3900X 3.8GHz
GeForce RTX 2080 Ti (Desktop)
~ 200 fps
GeForce RTX 2080 Ti (Desktop):
200 [X] Corsair One i160 Intel Core i9-9900K 3.6GHz
GeForce RTX 2080 Ti (Desktop)
min:
198 fps, max:
202 fps
200 [X] AMD Ryzen 9 3900X 3.8GHz
GeForce RTX 2080 Ti (Desktop)
~ 200 fps
GeForce RTX 2080 Ti (Desktop):
200 [X] Corsair One i160 Intel Core i9-9900K 3.6GHz
GeForce RTX 2080 Ti (Desktop)
min:
199 fps, max:
201 fps
200 [X] AMD Ryzen 9 3900X 3.8GHz
GeForce RTX 2080 Ti (Desktop)
~ 200 fps
GeForce RTX 2080 Ti (Desktop):
148.5 [X] AMD Ryzen 9 3900X 3.8GHz
GeForce RTX 2080 Ti (Desktop)
155 [X] Corsair One i160 Intel Core i9-9900K 3.6GHz
GeForce RTX 2080 Ti (Desktop)
min:
139 fps, max:
184 fps
~ 152 fps
131%
GeForce RTX 2080 Ti (Desktop):
394 [X] AMD Ryzen 9 3900X 3.8GHz
GeForce RTX 2080 Ti (Desktop)
min:
59 fps, max:
1116 fps
443.2 ~ 419 fps
116%
GeForce RTX 2070 Super Mobile:
371.8 fps
137%
GeForce RTX 2080 Ti (Desktop):
349 [X] AMD Ryzen 9 3900X 3.8GHz
GeForce RTX 2080 Ti (Desktop)
min:
60 fps, max:
965 fps
419.1 ~ 384 fps
110%
GeForce RTX 2070 Super Mobile:
308.3 fps
140%
GeForce RTX 2080 Ti (Desktop):
325 [X] AMD Ryzen 9 3900X 3.8GHz
GeForce RTX 2080 Ti (Desktop)
min:
60 fps, max:
928 fps
385.6 ~ 355 fps
118%
GeForce RTX 2070 Super Mobile:
299 fps
150%
GeForce RTX 2080 Ti (Desktop):
233 [X] AMD Ryzen 9 3900X 3.8GHz
GeForce RTX 2080 Ti (Desktop)
min:
33 fps, max:
538 fps
259.5 ~ 246 fps
106%
GeForce RTX 2070 Super Mobile:
173.4 fps
GeForce RTX 2080 Ti (Desktop):
270 [X] MSI GeForce RTX 2080 Ti Gaming X Trio Intel Core i7-7740X 4.3GHz
GeForce RTX 2080 Ti (Desktop)
fps
Average Gaming NVIDIA GeForce RTX 2080 Max-Q → 100% Average Gaming 30-70 fps → 100%
Average Gaming NVIDIA GeForce RTX 2080 Ti (Desktop) → 150% Average Gaming 30-70 fps → 162%
Average Gaming NVIDIA GeForce RTX 2070 Super Mobile → 120% Average Gaming 30-70 fps → 120%
 Deutsch
 English
 Español
 Français
 Italiano
 Nederlands
 Polski
 Português
 Русский
 Türkçe
 Svenska
 Chinese
 Magyar