NVIDIA GeForce RTX 3050 Ti Laptop GPU vs NVIDIA GeForce RTX 3070 vs NVIDIA GeForce RTX 3060 Ti
NVIDIA GeForce RTX 3050 Ti Laptop GPU ► remove from comparison
Die Nvidia GeForce RTX 3050 Ti Mobile (NVIDIA_DEV.2583, GN20-P1) ist die zweit-kleinste Variante der RTX 3000 Serie und basiert auf den GA107 Ampere Chip. Sie bietet 2560 CUDA-, 20 Raytracing und 80 Tensor-Kerne. Der Speicherbus ist 128 Bit breit und unterstützt 4 GB GDDR6 dedizierten Grafikspeicher. Die Taktung und damit Leistung ist abhängig von der Variante (35 - 80 Watt TGP).
Vorläufige Taktraten TGP (Power Consumption) 35 W 40 W 45 W 50 W 60 W 70 W 80 W Base Clock Speed (MHz) 735 915 1043 1140 1223 1350 1463 Boost Clock Speed (MHz) 1035 1185 1290 1410 1485 1598 1695
Die Leistung liegt nach ersten Informationen zwischen GTX 1660 Ti Max-Q und GTX 1660 Ti. Damit reicht die Performance für Full HD Gaming und hohe Detailstufen in anspruchsvollen Spielen. Für Raytracing Effekte reicht die Leistung kaum aus, jedoch können die Tensor-Kerne via DLSS in manchen Spielen zu einer höheren Leistung helfen.
Der GA107 Chip bietet 3.072 FP32 ALUs wovon die Hälfte auch INT32 Befehle ausführen können (also 1.536 INT32 ALUs). Bei Turing konnten noch alle Shader FP32 oder INT32 ausführen. Die Raytracing und Tensor Kerne auf dem Chip wurden laut Nvidia ebenfalls verbessert. Weiters integriert der Ampere Chip einen Hardware Video-Encoder (NVENC 5. Generation für H.264 und H.265) und Decoder (7. Generation für zahlreiche Formate inklusive AV1).
Der GA107 Chip wird bei Samsung im 8nm (8N) Verfahren welches mit dem 7nm Verfahren von TSMC nicht ganz mithalten kann (z.B. von AMD genutzt, aber auch für den professionellen GA100 Ampere Chip).
NVIDIA GeForce RTX 3070 ► remove from comparison
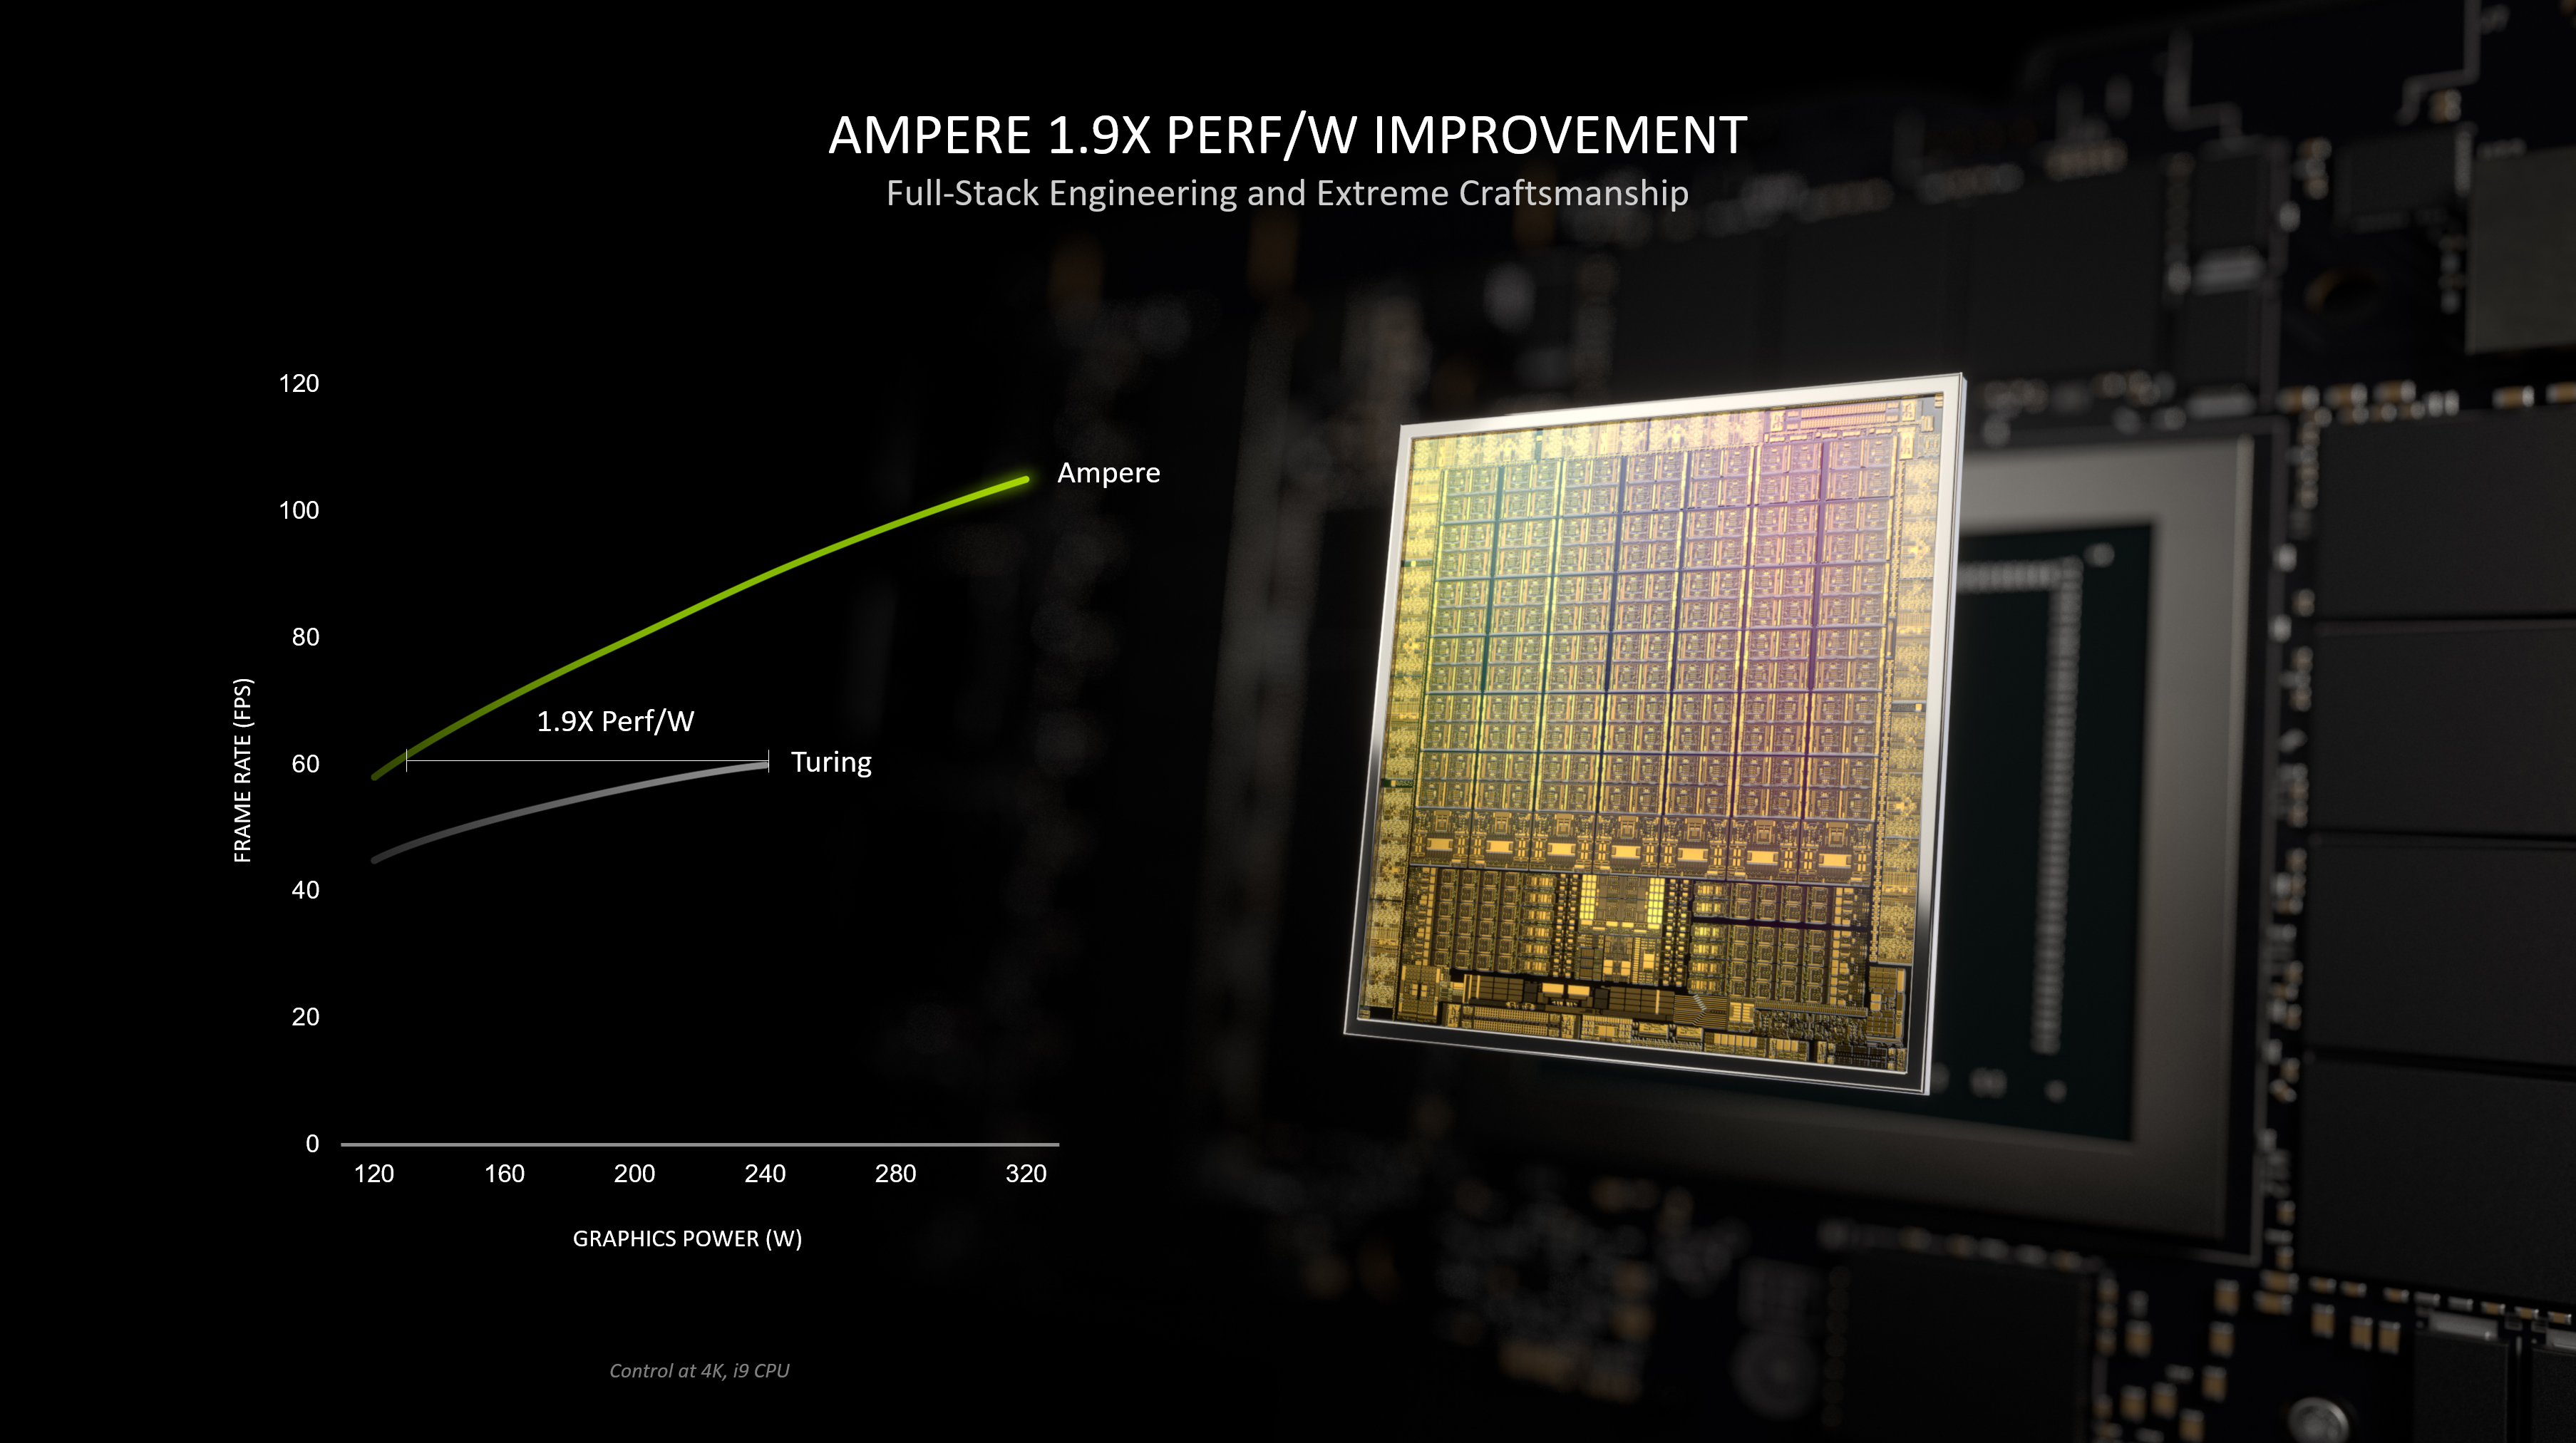
Die Nvidia GeForce RTX 3070 ist eine schnelle Desktop-Grafikkarte der Ampere-Generation und Quasi-Nachfolger der GeForce RTX 2070 Super. Sie nutzt den großen GA104-Chip mit 5.888 Shader und 8 GB GDDR6 Grafikspeicher. Mit einer Leistungsaufnahme von 220 Watt braucht die GPU zwar viel Strom unter Last, die Energieeffizienz (Leistung pro Watt) konnte mit Ampere aber gesteigert werden.
NVIDIA GeForce RTX 3060 Ti ► remove from comparison
Die Nvidia GeForce RTX 3060 Ti ist eine schnelle Desktop-Grafikkarte der Ampere-Generation. Sie nutzt den großen GA104-Chip jedoch nur mit 4.864 Shader und 8 GB GDDR6 Grafikspeicher. Mit einer Leistungsaufnahme von 200 Watt braucht die GPU zwar viel Strom unter Last, die Energieeffizienz (Leistung pro Watt) konnte mit Ampere aber gesteigert werden. Die Spieleperformance in QHD sollte etwas oberhalb einer alten GeForce RTX 2080 Super liegen.
NVIDIA GeForce RTX 3050 Ti Laptop GPU NVIDIA GeForce RTX 3070 NVIDIA GeForce RTX 3060 Ti GeForce RTX 3000 Serie Codename GN20-P1 Ampere GA104 Ampere GA104 Architektur Ampere Ampere Ampere Pipelines 2560 - unified 5888 - unified 4864 - unified TMUs 80 ROPs 32 Raytracing Cores 20 Tensor / AI Cores 80 Kerntakt 1222 - 1485 (Boost) MHz 1500 - 1725 (Boost) MHz 1410 - 1665 (Boost) MHz Speichertakt 12000 effective = 1500 MHz 14000 MHz 14000 MHz Speicherbandbreite 128 Bit 256 Bit 256 Bit Speichertyp GDDR6 GDDR6 GDDR6 Max. Speichergröße 4 GB 8 GB 8 GB Shared Memory nein nein nein Memory Bandwidth 195 GB/s API DirectX 12_2, Shader 6.7, OpenGL 4.6 DirectX 12_2, Shader 6.7, OpenGL 4.6 DirectX 12_2, Shader 6.7, OpenGL 4.6 Stromverbrauch 60 Watt (35 - 80 Watt TGP) 220 Watt 220 Watt Herstellungsprozess 8 nm 8 nm 8 nm PCIe 4.0 Displays HDMI 2.1, DisplayPort 1.4a Features NVIDIA DLSS, NVIDIA Reflex, NVIDIA Broadcast, Resizable BAR, NVIDIA Ansel, NVIDIA FreeStyle, NVIDIA ShadowPlay®, NVIDIA G-SYNC® Notebookgröße groß (17" z.B.) Erscheinungsdatum 10.05.2021 16.09.2020 01.12.2020 Transistors 17.4 Billion 17.4 Billion
Benchmarks Performance Rating - 3DMark 11 + Fire Strike + Time Spy - GeForce RTX 3050 Ti Laptop GPU
6.1 pt (18%)
...
NVIDIA GeForce RTX 3050 Ti Laptop GPU
...
max:
Performance Rating - 3DMark 11 + Fire Strike + Time Spy - NVIDIA GeForce RTX 3070
14.1 pt (42%)
...
max:
Performance Rating - 3DMark 11 + Fire Strike + Time Spy - NVIDIA GeForce RTX 3060 Ti
12.2 pt (37%)
...
NVIDIA GeForce RTX 3060 Ti
...
max:
3DMark - 3DMark Time Spy Score
min: 4013 avg: 5436 median: 5341 (15%) max: 6417 Points
GPU TDP 35 W TDP 40 W TDP 45 W TDP 50 W TDP 60 W TDP 65 W TDP 75 W TDP 80 W TDP 85 W TDP 90 W TDP 95 W 79% 73% 78% 81% 87% 84% 93% 83% 97% 90% 100%
min: 8113 avg: 11690 median: 12665 (37%) max: 12937 Points
GPU TDP ? TDP 35 W TDP 40 W TDP 45 W TDP 50 W TDP 60 W TDP 65 W TDP 75 W TDP 80 W TDP 85 W TDP 90 W TDP 95 W 100% 43% 40% 43% 44% 48% 46% 51% 45% 53% 50% 55%
min: 4499 avg: 10267 median: 11205 (32%) max: 12416 Points
GPU TDP ? TDP 35 W TDP 40 W TDP 45 W TDP 50 W TDP 60 W TDP 65 W TDP 75 W TDP 80 W TDP 85 W TDP 90 W TDP 95 W 100% 46% 43% 45% 47% 51% 49% 54% 48% 56% 52% 58%
3DMark - 3DMark Time Spy Graphics
min: 3744 avg: 5177 median: 5170 (14%) max: 6122 Points
GPU TDP 35 W TDP 40 W TDP 45 W TDP 50 W TDP 60 W TDP 65 W TDP 75 W TDP 80 W TDP 85 W TDP 90 W TDP 95 W 79% 70% 76% 80% 88% 81% 92% 94% 97% 93% 100%
min: 11043 avg: 12616 median: 12892 (34%) max: 13579 Points
GPU TDP ? TDP 35 W TDP 40 W TDP 45 W TDP 50 W TDP 60 W TDP 65 W TDP 75 W TDP 80 W TDP 85 W TDP 90 W TDP 95 W 100% 38% 34% 37% 39% 43% 39% 45% 46% 47% 45% 49%
min: 4463 avg: 10294 median: 11311 (30%) max: 11855 Points
GPU TDP ? TDP 35 W TDP 40 W TDP 45 W TDP 50 W TDP 60 W TDP 65 W TDP 75 W TDP 80 W TDP 85 W TDP 90 W TDP 95 W 100% 42% 37% 40% 42% 47% 43% 49% 50% 52% 49% 53%
3DMark - 3DMark Ice Storm Unlimited Graphics
min: 411501 avg: 428028 median: 422757 (48%) max: 449825 Points
GPU TDP 50 W TDP 60 W TDP 90 W 100% 91% 94%
min: 479404 avg: 544126 median: 502470 (57%) max: 650505 Points
GPU TDP ? TDP 50 W TDP 60 W TDP 90 W 100% 83% 76% 78%
min: 334256 avg: 587746 median: 611392 (69%) max: 790184 Points
GPU TDP ? TDP 50 W TDP 60 W TDP 90 W 100% 79% 72% 74%
3DMark - 3DMark Ice Storm Extreme Graphics
min: 40206 avg: 80000 median: 85995 (11%) max: 113799 Points
GPU TDP 50 W TDP 60 W TDP 90 W 35% 76% 100%
min: 284001 avg: 364250 median: 328616 (42%) max: 515764 Points
GPU TDP ? TDP 50 W TDP 60 W TDP 90 W 100% 11% 24% 31%
min: 6902 avg: 344108 median: 333736 (43%) max: 532495 Points
GPU TDP ? TDP 50 W TDP 60 W TDP 90 W 100% 11% 24% 32%
3DMark - 3DMark Cloud Gate Score
min: 21679 avg: 36252 median: 39980 (43%) max: 50957 Points
GPU TDP 35 W TDP 40 W TDP 45 W TDP 50 W TDP 60 W TDP 65 W TDP 75 W TDP 80 W TDP 85 W TDP 90 W TDP 95 W 46% 66% 68% 68% 68% 88% 86% 46% 100% 72% 88%
min: 17089 avg: 48505 median: 53317.5 (57%) max: 63741 Points
GPU TDP ? TDP 35 W TDP 40 W TDP 45 W TDP 50 W TDP 60 W TDP 65 W TDP 75 W TDP 80 W TDP 85 W TDP 90 W TDP 95 W 99% 46% 66% 68% 68% 68% 88% 86% 46% 100% 72% 88%
min: 7158 avg: 53551 median: 58174 (62%) max: 78660 Points
GPU TDP ? TDP 35 W TDP 40 W TDP 45 W TDP 50 W TDP 60 W TDP 65 W TDP 75 W TDP 80 W TDP 85 W TDP 90 W TDP 95 W 100% 44% 63% 65% 65% 65% 84% 83% 44% 96% 69% 84%
3DMark - 3DMark Cloud Gate Graphics
min: 30158 avg: 67913 median: 72925 (19%) max: 102432 Points
GPU TDP 35 W TDP 40 W TDP 45 W TDP 50 W TDP 60 W TDP 65 W TDP 75 W TDP 80 W TDP 85 W TDP 90 W TDP 95 W 35% 51% 56% 53% 73% 73% 83% 48% 100% 67% 72%
min: 89061 avg: 141234 median: 154864 (41%) max: 175713 Points
GPU TDP ? TDP 35 W TDP 40 W TDP 45 W TDP 50 W TDP 60 W TDP 65 W TDP 75 W TDP 80 W TDP 85 W TDP 90 W TDP 95 W 100% 25% 37% 40% 39% 53% 53% 61% 35% 73% 48% 52%
min: 6901 avg: 125069 median: 138278 (36%) max: 172965 Points
GPU TDP ? TDP 35 W TDP 40 W TDP 45 W TDP 50 W TDP 60 W TDP 65 W TDP 75 W TDP 80 W TDP 85 W TDP 90 W TDP 95 W 100% 27% 39% 43% 41% 56% 56% 64% 37% 77% 51% 55%
3DMark - 3DMark Fire Strike Standard Score
min: 6670 avg: 11709 median: 11894 (21%) max: 14086 Points
GPU TDP 35 W TDP 40 W TDP 45 W TDP 50 W TDP 60 W TDP 65 W TDP 75 W TDP 80 W TDP 85 W TDP 90 W TDP 95 W 77% 67% 78% 76% 88% 86% 94% 85% 100% 89% 97%
min: 14069 avg: 23482 median: 25739 (45%) max: 29648 Points
GPU TDP ? TDP 35 W TDP 40 W TDP 45 W TDP 50 W TDP 60 W TDP 65 W TDP 75 W TDP 80 W TDP 85 W TDP 90 W TDP 95 W 100% 46% 40% 47% 45% 53% 51% 56% 51% 60% 54% 58%
min: 6665 avg: 22359 median: 24153.5 (43%) max: 29350 Points
GPU TDP ? TDP 35 W TDP 40 W TDP 45 W TDP 50 W TDP 60 W TDP 65 W TDP 75 W TDP 80 W TDP 85 W TDP 90 W TDP 95 W 100% 47% 41% 48% 46% 54% 52% 58% 52% 61% 55% 59%
3DMark - 3DMark Fire Strike Standard Graphics
min: 7917 avg: 13090 median: 13359.5 (15%) max: 15611 Points
GPU TDP 35 W TDP 40 W TDP 45 W TDP 50 W TDP 60 W TDP 65 W TDP 75 W TDP 80 W TDP 85 W TDP 90 W TDP 95 W 77% 67% 78% 76% 89% 84% 94% 93% 100% 91% 95%
min: 20357 avg: 28949 median: 31020 (35%) max: 33270 Points
GPU TDP ? TDP 35 W TDP 40 W TDP 45 W TDP 50 W TDP 60 W TDP 65 W TDP 75 W TDP 80 W TDP 85 W TDP 90 W TDP 95 W 100% 41% 36% 42% 41% 48% 45% 50% 50% 54% 49% 51%
min: 6500 avg: 24297 median: 26883 (30%) max: 30347 Points
GPU TDP ? TDP 35 W TDP 40 W TDP 45 W TDP 50 W TDP 60 W TDP 65 W TDP 75 W TDP 80 W TDP 85 W TDP 90 W TDP 95 W 100% 45% 39% 46% 44% 52% 49% 55% 54% 58% 53% 55%
3DMark - 3DMark Ice Storm Graphics
min: 40465 avg: 100758 median: 107156 (13%) max: 145883 Points
GPU TDP 50 W TDP 60 W TDP 75 W TDP 80 W TDP 90 W 28% 73% 100% 40% 100%
min: 286573 avg: 382547 median: 358123 (43%) max: 527368 Points
GPU TDP ? TDP 50 W TDP 60 W TDP 75 W TDP 80 W TDP 90 W 100% 11% 28% 38% 15% 38%
min: 6902 avg: 399563 median: 380563 (46%) max: 626287 Points
GPU TDP ? TDP 50 W TDP 60 W TDP 75 W TDP 80 W TDP 90 W 100% 10% 27% 37% 15% 37%
3DMark - 3DMark Wild Life Unlimited
79787 Points (40%)
73015 Points (37%)
3DMark - 3DMark Wild Life Extreme Unlimited
min: 9340 avg: 9453 median: 9452.5 (11%) max: 9565 Points
GPU TDP 45 W TDP 50 W 98% 100%
3DMark - 3DMark Night Raid
min: 52206 avg: 57993 median: 59613 (56%) max: 61129 Points
59387 Points (56%)
3DMark - 3DMark Night Raid Graphics Score
min: 114931 avg: 124203 median: 124547 (48%) max: 134906 Points
117899 Points (45%)
3DMark 11 - 3DM11 Performance Score
min: 8322 avg: 16441 median: 16439 (23%) max: 19254 Points
GPU TDP 35 W TDP 40 W TDP 45 W TDP 50 W TDP 60 W TDP 65 W TDP 75 W TDP 80 W TDP 85 W TDP 90 W TDP 95 W 84% 73% 77% 84% 87% 91% 97% 68% 100% 88% 97%
min: 15985 avg: 30067 median: 31876 (44%) max: 36663 Points
GPU TDP ? TDP 35 W TDP 40 W TDP 45 W TDP 50 W TDP 60 W TDP 65 W TDP 75 W TDP 80 W TDP 85 W TDP 90 W TDP 95 W 100% 54% 47% 49% 54% 55% 58% 62% 43% 64% 56% 62%
min: 18541 avg: 30351 median: 30426 (42%) max: 39081 Points
GPU TDP ? TDP 35 W TDP 40 W TDP 45 W TDP 50 W TDP 60 W TDP 65 W TDP 75 W TDP 80 W TDP 85 W TDP 90 W TDP 95 W 100% 54% 47% 49% 53% 55% 58% 62% 43% 64% 56% 62%
3DMark 11 - 3DM11 Performance GPU
min: 7952 avg: 17562 median: 18057 (16%) max: 20905 Points
GPU TDP 35 W TDP 40 W TDP 45 W TDP 50 W TDP 60 W TDP 65 W TDP 75 W TDP 80 W TDP 85 W TDP 90 W TDP 95 W 81% 66% 73% 81% 91% 84% 93% 96% 100% 94% 100%
min: 26812 avg: 40835 median: 43005 (37%) max: 46878 Points
GPU TDP ? TDP 35 W TDP 40 W TDP 45 W TDP 50 W TDP 60 W TDP 65 W TDP 75 W TDP 80 W TDP 85 W TDP 90 W TDP 95 W 100% 42% 34% 37% 42% 46% 43% 48% 49% 51% 48% 51%
min: 24790 avg: 35320 median: 35683 (31%) max: 41388 Points
GPU TDP ? TDP 35 W TDP 40 W TDP 45 W TDP 50 W TDP 60 W TDP 65 W TDP 75 W TDP 80 W TDP 85 W TDP 90 W TDP 95 W 100% 44% 36% 39% 44% 49% 46% 50% 52% 54% 51% 54%
3DMark Vantage + NVIDIA GeForce RTX 3070 3DMark Vantage - 3DM Vant. Perf. total
min: 85505 avg: 88420 median: 88744 (26%) max: 91011 Points
3DM Vant. Perf. total + NVIDIA GeForce RTX 3060 Ti
min: 57627 avg: 88179 median: 78597 (23%) max: 113553 Points
3DM Vant. Perf. GPU no PhysX + NVIDIA GeForce RTX 3070 3DMark Vantage - 3DM Vant. Perf. GPU no PhysX
min: 89062 avg: 95270 median: 93032 (53%) max: 103716 Points
3DM Vant. Perf. GPU no PhysX + NVIDIA GeForce RTX 3060 Ti
min: 74784 avg: 96343 median: 87507 (50%) max: 117677 Points
3DMark 05 - 3DMark 05 - Standard
min: 51451 avg: 54279 median: 52819 (58%) max: 58568 Points
min: 43238 avg: 68614 median: 65073 (71%) max: 90522 Points
3DMark 06 3DMark 06 - Standard 1280x1024 + NVIDIA GeForce RTX 3050 Ti Laptop GPU
45370 Points (60%)
3DMark 06 - Standard 1280x1024 + NVIDIA GeForce RTX 3070
min: 42108 avg: 48490 median: 44229 (58%) max: 59134 Points
GPU TDP ? TDP 65 W 100% 94%
3DMark 06 - Standard 1280x1024 + NVIDIA GeForce RTX 3060 Ti
min: 40809 avg: 50811 median: 48121.5 (63%) max: 66193 Points
GPU TDP ? TDP 65 W 100% 91%
3DMark 06 - Standard 1280X854 + NVIDIA GeForce RTX 3060 Ti
70290 Points (93%)
Modell CPU GPU RAM Wert 3DMark 06 - Standard 1280X854 Nvidia GeForce RTX 3060 Ti FE (3DMark 06 - Standard 1280X854) R9 7900X 230 W / 170 W NVIDIA GeForce RTX 3060 Ti 1665 / 1750 MHz 8 GB 32 GB 70290
Unigine Valley 1.0 - Unigine Valley 1.0 DX
min: 155.1 avg: 161.2 median: 157.5 (52%) max: 168.5 fps
min: 131.1 avg: 146.8 median: 147.9 (48%) max: 157.4 fps
Blender - Blender 3.3 Classroom CUDA *
min: 83 avg: 90 median: 91 (13%) max: 104 Seconds
GPU TDP 40 W TDP 45 W TDP 65 W TDP 75 W TDP 85 W 100% 101% 102% 103% 103%
44 Seconds (7%)
GPU TDP ? TDP 40 W TDP 45 W TDP 65 W TDP 75 W TDP 85 W 109% 100% 101% 102% 103% 103%
Blender - Blender 3.3 Classroom OPTIX *
min: 48 avg: 52.3 median: 53 (20%) max: 60 Seconds
GPU TDP 40 W TDP 45 W TDP 65 W TDP 75 W TDP 85 W 100% 102% 103% 104% 104%
SPECviewperf 12 + NVIDIA GeForce RTX 3050 Ti Laptop GPU SPECviewperf 12 - specvp12 sw-03
52.6 fps (13%)
specvp12 sw-03 + NVIDIA GeForce RTX 3070
min: 61.7 avg: 75.6 median: 76.1 (19%) max: 88.6 fps
GPU TDP ? TDP 60 W 100% 70%
specvp12 sw-03 + NVIDIA GeForce RTX 3060 Ti
min: 43.2 avg: 69.3 median: 71.1 (18%) max: 93.5 fps
GPU TDP ? TDP 60 W 100% 72%
specvp12 snx-02 + NVIDIA GeForce RTX 3050 Ti Laptop GPU SPECviewperf 12 - specvp12 snx-02
7.3 fps (1%)
specvp12 snx-02 + NVIDIA GeForce RTX 3070
min: 12 avg: 12.8 median: 12.8 (2%) max: 13.5 fps
GPU TDP ? TDP 60 W 100% 57%
specvp12 snx-02 + NVIDIA GeForce RTX 3060 Ti
min: 8.77 avg: 11.6 median: 12.3 (2%) max: 13.6 fps
GPU TDP ? TDP 60 W 100% 59%
specvp12 showcase-01 + NVIDIA GeForce RTX 3050 Ti Laptop GPU SPECviewperf 12 - specvp12 showcase-01
69 fps (15%)
specvp12 showcase-01 + NVIDIA GeForce RTX 3070
min: 153.9 avg: 161.2 median: 160 (35%) max: 171 fps
GPU TDP ? TDP 60 W 100% 43%
specvp12 showcase-01 + NVIDIA GeForce RTX 3060 Ti
min: 62.4 avg: 118.8 median: 144 (31%) max: 150 fps
GPU TDP ? TDP 60 W 100% 48%
specvp12 mediacal-01 + NVIDIA GeForce RTX 3050 Ti Laptop GPU SPECviewperf 12 - specvp12 mediacal-01
32.2 fps (8%)
specvp12 mediacal-01 + NVIDIA GeForce RTX 3070
min: 36.68 avg: 47.7 median: 43.6 (11%) max: 66.9 fps
GPU TDP ? TDP 60 W 100% 67%
specvp12 mediacal-01 + NVIDIA GeForce RTX 3060 Ti
min: 30.1 avg: 51.7 median: 59.4 (15%) max: 65.6 fps
GPU TDP ? TDP 60 W 100% 65%
specvp12 maya-04 + NVIDIA GeForce RTX 3050 Ti Laptop GPU SPECviewperf 12 - specvp12 maya-04
88.6 fps (24%)
specvp12 maya-04 + NVIDIA GeForce RTX 3070
min: 166 avg: 193.9 median: 188.2 (51%) max: 233 fps
GPU TDP ? TDP 60 W 100% 46%
specvp12 maya-04 + NVIDIA GeForce RTX 3060 Ti
min: 51.2 avg: 166.4 median: 197 (54%) max: 251 fps
GPU TDP ? TDP 60 W 100% 49%
specvp12 energy-01 + NVIDIA GeForce RTX 3050 Ti Laptop GPU SPECviewperf 12 - specvp12 energy-01
6.6 fps (6%)
specvp12 energy-01 + NVIDIA GeForce RTX 3070
min: 12.42 avg: 13.1 median: 12.8 (11%) max: 14.3 fps
GPU TDP ? TDP 60 W 100% 50%
specvp12 energy-01 + NVIDIA GeForce RTX 3060 Ti
min: 10.9 avg: 13.1 median: 13.9 (12%) max: 14.4 fps
GPU TDP ? TDP 60 W 100% 50%
specvp12 creo-01 + NVIDIA GeForce RTX 3050 Ti Laptop GPU SPECviewperf 12 - specvp12 creo-01
42.7 fps (17%)
specvp12 creo-01 + NVIDIA GeForce RTX 3070
min: 57.5 avg: 62.1 median: 60.7 (24%) max: 69.4 fps
GPU TDP ? TDP 60 W 100% 69%
specvp12 creo-01 + NVIDIA GeForce RTX 3060 Ti
min: 41.3 avg: 54.8 median: 57.8 (23%) max: 65.2 fps
GPU TDP ? TDP 60 W 100% 72%
specvp12 catia-04 + NVIDIA GeForce RTX 3050 Ti Laptop GPU SPECviewperf 12 - specvp12 catia-04
58.8 fps (10%)
specvp12 catia-04 + NVIDIA GeForce RTX 3070
min: 111.2 avg: 115.6 median: 114.5 (19%) max: 122 fps
GPU TDP ? TDP 60 W 100% 51%
specvp12 catia-04 + NVIDIA GeForce RTX 3060 Ti
min: 60.5 avg: 94.5 median: 109 (18%) max: 114 fps
GPU TDP ? TDP 60 W 100% 55%
specvp12 3dsmax-05 + NVIDIA GeForce RTX 3050 Ti Laptop GPU SPECviewperf 12 - specvp12 3dsmax-05
133 fps (23%)
specvp12 3dsmax-05 + NVIDIA GeForce RTX 3070
min: 213 avg: 256.3 median: 266 (47%) max: 280 fps
GPU TDP ? TDP 60 W 100% 52%
specvp12 3dsmax-05 + NVIDIA GeForce RTX 3060 Ti
min: 84.5 avg: 211.2 median: 252 (44%) max: 297 fps
GPU TDP ? TDP 60 W 100% 56%
SPECviewperf 13 specvp13 sw-04 + NVIDIA GeForce RTX 3050 Ti Laptop GPU SPECviewperf 13 - specvp13 sw-04
79.5 fps (21%)
specvp13 sw-04 + NVIDIA GeForce RTX 3070
min: 84.8 avg: 106.6 median: 105.7 (28%) max: 130 fps
GPU TDP ? TDP 60 W 100% 75%
specvp13 sw-04 + NVIDIA GeForce RTX 3060 Ti
min: 62.6 avg: 99.1 median: 99.6 (27%) max: 135 fps
GPU TDP ? TDP 60 W 100% 77%
specvp13 snx-03 + NVIDIA GeForce RTX 3050 Ti Laptop GPU SPECviewperf 13 - specvp13 snx-03
13.3 fps (1%)
specvp13 snx-03 + NVIDIA GeForce RTX 3070
min: 21.9 avg: 23 median: 22.8 (3%) max: 24.3 fps
GPU TDP ? TDP 60 W 100% 58%
specvp13 snx-03 + NVIDIA GeForce RTX 3060 Ti
min: 15.8 avg: 20.8 median: 22.3 (2%) max: 24.4 fps
GPU TDP ? TDP 60 W 100% 60%
specvp13 showcase-02 + NVIDIA GeForce RTX 3050 Ti Laptop GPU SPECviewperf 13 - specvp13 showcase-02
68.9 fps (15%)
specvp13 showcase-02 + NVIDIA GeForce RTX 3070
min: 145.5 avg: 159.9 median: 161.5 (35%) max: 171 fps
GPU TDP ? TDP 60 W 100% 43%
specvp13 showcase-02 + NVIDIA GeForce RTX 3060 Ti
min: 63.1 avg: 119.4 median: 145 (32%) max: 150 fps
GPU TDP ? TDP 60 W 100% 48%
specvp13 medical-02 + NVIDIA GeForce RTX 3050 Ti Laptop GPU SPECviewperf 13 - specvp13 medical-02
42.2 fps (9%)
specvp13 medical-02 + NVIDIA GeForce RTX 3070
min: 78.3 avg: 80.2 median: 80.4 (17%) max: 81.8 fps
GPU TDP ? TDP 60 W 100% 53%
specvp13 medical-02 + NVIDIA GeForce RTX 3060 Ti
min: 51.6 avg: 66 median: 72.2 (15%) max: 74.3 fps
GPU TDP ? TDP 60 W 100% 57%
specvp13 maya-05 + NVIDIA GeForce RTX 3050 Ti Laptop GPU SPECviewperf 13 - specvp13 maya-05
157 fps (18%)
specvp13 maya-05 + NVIDIA GeForce RTX 3070
min: 256.5 avg: 348.6 median: 365 (41%) max: 408 fps
GPU TDP ? TDP 60 W 100% 45%
specvp13 maya-05 + NVIDIA GeForce RTX 3060 Ti
min: 136 avg: 284 median: 344 (39%) max: 372 fps
GPU TDP ? TDP 60 W 100% 49%
specvp13 energy-02 + NVIDIA GeForce RTX 3050 Ti Laptop GPU SPECviewperf 13 - specvp13 energy-02
12.8 fps (4%)
specvp13 energy-02 + NVIDIA GeForce RTX 3070
min: 20.6 avg: 26.7 median: 28.5 (9%) max: 29.12 fps
GPU TDP ? TDP 60 W 100% 48%
specvp13 energy-02 + NVIDIA GeForce RTX 3060 Ti
min: 22.8 avg: 24.8 median: 25.6 (8%) max: 26.1 fps
GPU TDP ? TDP 60 W 100% 49%
specvp13 creo-02 + NVIDIA GeForce RTX 3050 Ti Laptop GPU SPECviewperf 13 - specvp13 creo-02
120 fps (18%)
specvp13 creo-02 + NVIDIA GeForce RTX 3070
min: 227.7 avg: 243.2 median: 240.5 (35%) max: 264 fps
GPU TDP ? TDP 60 W 100% 49%
specvp13 creo-02 + NVIDIA GeForce RTX 3060 Ti
min: 110 avg: 192.7 median: 225 (33%) max: 243 fps
GPU TDP ? TDP 60 W 100% 54%
specvp13 catia-05 + NVIDIA GeForce RTX 3050 Ti Laptop GPU SPECviewperf 13 - specvp13 catia-05
82.8 fps (9%)
specvp13 catia-05 + NVIDIA GeForce RTX 3070
min: 168.7 avg: 172.7 median: 173 (19%) max: 176 fps
GPU TDP ? TDP 60 W 100% 48%
specvp13 catia-05 + NVIDIA GeForce RTX 3060 Ti
min: 90.6 avg: 139.5 median: 161 (18%) max: 167 fps
GPU TDP ? TDP 60 W 100% 52%
specvp13 3dsmax-06 + NVIDIA GeForce RTX 3050 Ti Laptop GPU SPECviewperf 13 - specvp13 3dsmax-06
133 fps (23%)
specvp13 3dsmax-06 + NVIDIA GeForce RTX 3070
min: 213 avg: 253.3 median: 260.6 (45%) max: 279 fps
GPU TDP ? TDP 60 W 100% 53%
specvp13 3dsmax-06 + NVIDIA GeForce RTX 3060 Ti
min: 84.4 avg: 211.1 median: 252 (44%) max: 297 fps
GPU TDP ? TDP 60 W 100% 57%
SPECviewperf 2020 specvp2020 solidworks-05 4k + NVIDIA GeForce RTX 3050 Ti Laptop GPU SPECviewperf 2020 - specvp2020 solidworks-05 4k
113 fps (33%)
specvp2020 solidworks-05 4k + NVIDIA GeForce RTX 3070
min: 122 avg: 125.8 median: 125.5 (37%) max: 130 fps
GPU TDP ? TDP 60 W 100% 90%
specvp2020 solidworks-05 4k + NVIDIA GeForce RTX 3060 Ti
min: 41.4 avg: 89.8 median: 109 (32%) max: 119 fps
GPU TDP ? TDP 60 W 98% 100%
specvp2020 snx-04 4k + NVIDIA GeForce RTX 3050 Ti Laptop GPU SPECviewperf 2020 - specvp2020 snx-04 4k
13.2 fps (1%)
specvp2020 snx-04 4k + NVIDIA GeForce RTX 3070
min: 18.4 avg: 19.4 median: 19.3 (2%) max: 20.6 fps
GPU TDP ? TDP 60 W 100% 68%
specvp2020 snx-04 4k + NVIDIA GeForce RTX 3060 Ti
min: 12 avg: 16.6 median: 18.2 (2%) max: 19.6 fps
GPU TDP ? TDP 60 W 100% 73%
specvp2020 medical-03 4k + NVIDIA GeForce RTX 3050 Ti Laptop GPU SPECviewperf 2020 - specvp2020 medical-03 4k
20.2 fps (19%)
specvp2020 medical-03 4k + NVIDIA GeForce RTX 3070
min: 13.1 avg: 13.5 median: 13.5 (13%) max: 14.06 fps
GPU TDP ? TDP 60 W 67% 100%
specvp2020 medical-03 4k + NVIDIA GeForce RTX 3060 Ti
min: 9.82 avg: 11 median: 11.4 (11%) max: 11.9 fps
GPU TDP ? TDP 60 W 62% 100%
specvp2020 maya-06 4k + NVIDIA GeForce RTX 3050 Ti Laptop GPU SPECviewperf 2020 - specvp2020 maya-06 4k
180 fps (29%)
specvp2020 maya-06 4k + NVIDIA GeForce RTX 3070
min: 237 avg: 246.5 median: 248.1 (40%) max: 253 fps
GPU TDP ? TDP 60 W 100% 73%
specvp2020 maya-06 4k + NVIDIA GeForce RTX 3060 Ti
min: 49.8 avg: 166.6 median: 215 (35%) max: 235 fps
GPU TDP ? TDP 60 W 100% 85%
specvp2020 energy-03 4k + NVIDIA GeForce RTX 3050 Ti Laptop GPU SPECviewperf 2020 - specvp2020 energy-03 4k
12.8 fps (3%)
specvp2020 energy-03 4k + NVIDIA GeForce RTX 3070
min: 25.3 avg: 28.9 median: 26.1 (6%) max: 37.99 fps
GPU TDP ? TDP 60 W 100% 44%
specvp2020 energy-03 4k + NVIDIA GeForce RTX 3060 Ti
min: 14.5 avg: 21.2 median: 17.9 (4%) max: 31.2 fps
GPU TDP ? TDP 60 W 100% 50%
specvp2020 creo-03 4k + NVIDIA GeForce RTX 3050 Ti Laptop GPU SPECviewperf 2020 - specvp2020 creo-03 4k
69.2 fps (33%)
specvp2020 creo-03 4k + NVIDIA GeForce RTX 3070
min: 74.3 avg: 80.1 median: 78.7 (37%) max: 88.7 fps
GPU TDP ? TDP 60 W 100% 86%
specvp2020 creo-03 4k + NVIDIA GeForce RTX 3060 Ti
min: 31.5 avg: 66.4 median: 76.6 (36%) max: 91.2 fps
GPU TDP ? TDP 60 W 100% 93%
specvp2020 catia-06 4k + NVIDIA GeForce RTX 3050 Ti Laptop GPU SPECviewperf 2020 - specvp2020 catia-06 4k
37.6 fps (25%)
specvp2020 catia-06 4k + NVIDIA GeForce RTX 3070
min: 41.9 avg: 43.1 median: 43.2 (28%) max: 44.3 fps
GPU TDP ? TDP 60 W 100% 87%
specvp2020 catia-06 4k + NVIDIA GeForce RTX 3060 Ti
min: 26.6 avg: 35 median: 37.9 (25%) max: 40.5 fps
GPU TDP ? TDP 60 W 100% 95%
specvp2020 3dsmax-07 4k + NVIDIA GeForce RTX 3050 Ti Laptop GPU SPECviewperf 2020 - specvp2020 3dsmax-07 4k
58.9 fps (25%)
specvp2020 3dsmax-07 4k + NVIDIA GeForce RTX 3070
min: 71.6 avg: 82.2 median: 85.2 (36%) max: 86.8 fps
GPU TDP ? TDP 60 W 100% 72%
specvp2020 3dsmax-07 4k + NVIDIA GeForce RTX 3060 Ti
min: 27 avg: 64.7 median: 80.1 (33%) max: 87 fps
GPU TDP ? TDP 60 W 100% 79%
Cinebench R10 Cinebench R10 Shading (32bit) + NVIDIA GeForce RTX 3050 Ti Laptop GPU Cinebench R10 - Cinebench R10 Shading (32bit)
min: 13319 avg: 13439 median: 13438.5 (10%) max: 13558 Points
GPU TDP 40 W TDP 60 W 100% 98%
Cinebench R10 Shading (32bit) + NVIDIA GeForce RTX 3070
min: 6817 avg: 6823 median: 6823 (5%) max: 6829 Points
GPU TDP ? TDP 40 W TDP 60 W 50% 100% 98%
Cinebench R11.5 Cinebench R11.5 OpenGL 64 Bit + NVIDIA GeForce RTX 3050 Ti Laptop GPU Cinebench R11.5 - Cinebench R11.5 OpenGL 64 Bit
min: 95.6 avg: 132.5 median: 132.5 (46%) max: 169.3 fps
GPU TDP 40 W TDP 60 W 100% 56%
Cinebench R11.5 OpenGL 64 Bit + NVIDIA GeForce RTX 3070
min: 93 avg: 137.4 median: 137.4 (48%) max: 181.7 fps
GPU TDP ? TDP 40 W TDP 60 W 81% 100% 56%
Cinebench R15 + NVIDIA GeForce RTX 3050 Ti Laptop GPU Cinebench R15 - Cinebench R15 OpenGL 64 Bit
min: 95.1 avg: 169.1 median: 166 (10%) max: 221 fps
GPU TDP 35 W TDP 40 W TDP 45 W TDP 50 W TDP 60 W TDP 65 W TDP 75 W TDP 80 W TDP 85 W TDP 90 W TDP 95 W 82% 86% 95% 76% 68% 100% 87% 45% 78% 59% 75%
Cinebench R15 OpenGL 64 Bit + NVIDIA GeForce RTX 3070
min: 174 avg: 213.5 median: 213.5 (12%) max: 253 fps
GPU TDP ? TDP 35 W TDP 40 W TDP 45 W TDP 50 W TDP 60 W TDP 65 W TDP 75 W TDP 80 W TDP 85 W TDP 90 W TDP 95 W 100% 80% 84% 93% 75% 67% 98% 86% 45% 76% 58% 74%
Cinebench R15 OpenGL Ref. Match 64 Bit + NVIDIA GeForce RTX 3050 Ti Laptop GPU Cinebench R15 - Cinebench R15 OpenGL Ref. Match 64 Bit
99.6 % (100%)
GPU TDP 35 W TDP 40 W TDP 45 W TDP 50 W TDP 60 W TDP 65 W TDP 75 W TDP 80 W TDP 85 W TDP 90 W TDP 95 W 100% 100% 100% 100% 100% 100% 100% 100% 100% 100% 100%
Cinebench R15 OpenGL Ref. Match 64 Bit + NVIDIA GeForce RTX 3070
99.6 % (100%)
GPU TDP ? TDP 35 W TDP 40 W TDP 45 W TDP 50 W TDP 60 W TDP 65 W TDP 75 W TDP 80 W TDP 85 W TDP 90 W TDP 95 W 100% 100% 100% 100% 100% 100% 100% 100% 100% 100% 100% 100%
GFXBench - GFXBench 5.0 Aztec Ruins High Tier Offscreen
108 fps (20%)
GFXBench - GFXBench 5.0 Aztec Ruins Normal Tier Offscreen
255 fps (19%)
GFXBench - GFXBench Car Chase Offscreen
252 fps (28%)
GFXBench 3.1 - GFXBench Manhattan ES 3.1 Offscreen
336 fps (7%)
GFXBench 3.0 - GFXBench 3.0 Manhattan Offscreen
454 fps (27%)
GFXBench (DX / GLBenchmark) 2.7 + NVIDIA GeForce RTX 3050 Ti Laptop GPU GFXBench (DX / GLBenchmark) 2.7 - GFXBench T-Rex HD Offscreen C24Z16
1053 fps (8%)
Basemark GPU 1.2 - Basemark GPU 1.2 Vulkan Official Medium Offscreen 1080
302 fps (2%)
Basemark GPU 1.2 - Basemark GPU 1.2 Vulkan Official High Offscreen 2160
100.7 fps (23%)
LuxMark v2.0 64Bit - LuxMark v2.0 Room GPU
min: 2187 avg: 3588 median: 4284 (19%) max: 4293 Samples/s
min: 508 avg: 2277 median: 2277 (10%) max: 4046 Samples/s
LuxMark v2.0 64Bit - LuxMark v2.0 Sala GPU
min: 10096 avg: 10107 median: 10111 (18%) max: 10115 Samples/s
min: 2188 avg: 5599 median: 5599 (10%) max: 9010 Samples/s
ComputeMark v2.1 - ComputeMark v2.1 Result
min: 29330 avg: 30004 median: 30100 (33%) max: 30581 Points
min: 25991 avg: 26985 median: 27046 (29%) max: 27858 Points
Power Consumption - Furmark Stress Test Power Consumption - external Monitor *
min: 50.2 avg: 92.3 median: 90.3 (13%) max: 138 Watt
GPU TDP 35 W TDP 40 W TDP 45 W TDP 50 W TDP 60 W TDP 65 W TDP 75 W TDP 80 W TDP 85 W TDP 90 W TDP 95 W 108% 110% 110% 110% 106% 105% 104% 101% 101% 101% 100%
min: 281 avg: 348.1 median: 355.8 (51%) max: 393 Watt
GPU TDP ? TDP 35 W TDP 40 W TDP 45 W TDP 50 W TDP 60 W TDP 65 W TDP 75 W TDP 80 W TDP 85 W TDP 90 W TDP 95 W 100% 174% 179% 178% 178% 171% 170% 168% 163% 163% 163% 162%
min: 338 avg: 344 median: 344 (49%) max: 350 Watt
GPU TDP ? TDP 35 W TDP 40 W TDP 45 W TDP 50 W TDP 60 W TDP 65 W TDP 75 W TDP 80 W TDP 85 W TDP 90 W TDP 95 W TDP 200 W 100% 174% 179% 178% 178% 172% 170% 168% 163% 163% 163% 162% 103%
Power Consumption - The Witcher 3 Power Consumption - external Monitor *
min: 49.7 avg: 97.3 median: 91.7 (13%) max: 141.4 Watt
GPU TDP 35 W TDP 40 W TDP 45 W TDP 50 W TDP 60 W TDP 65 W TDP 75 W TDP 80 W TDP 85 W TDP 90 W TDP 95 W 112% 112% 111% 111% 109% 105% 104% 104% 100% 104% 101%
min: 316.5 avg: 401 median: 394.5 (55%) max: 550 Watt
GPU TDP ? TDP 35 W TDP 40 W TDP 45 W TDP 50 W TDP 60 W TDP 65 W TDP 75 W TDP 80 W TDP 85 W TDP 90 W TDP 95 W 100% 203% 205% 202% 202% 199% 192% 191% 189% 182% 189% 185%
min: 371 avg: 375 median: 375 (52%) max: 379 Watt
GPU TDP ? TDP 35 W TDP 40 W TDP 45 W TDP 50 W TDP 60 W TDP 65 W TDP 75 W TDP 80 W TDP 85 W TDP 90 W TDP 95 W TDP 200 W 100% 201% 202% 199% 200% 197% 189% 188% 187% 180% 187% 183% 108%
Power Consumption - Witcher 3 Power Consumption *
min: 45.7 avg: 102.3 median: 103 (23%) max: 144.6 Watt
GPU TDP 35 W TDP 40 W TDP 45 W TDP 50 W TDP 60 W TDP 65 W TDP 75 W TDP 80 W TDP 85 W TDP 90 W TDP 95 W 116% 124% 120% 120% 115% 109% 106% 105% 100% 108% 103%
338.1 Watt (74%)
GPU TDP ? TDP 35 W TDP 40 W TDP 45 W TDP 50 W TDP 60 W TDP 65 W TDP 75 W TDP 80 W TDP 85 W TDP 90 W TDP 95 W 100% 309% 330% 320% 319% 306% 291% 281% 279% 266% 286% 273%
Power Consumption - Witcher 3 ultra Power Efficiency
min: 0.3958 avg: 0.5 median: 0.5 (48%) max: 0.732 fps per Watt
GPU TDP 35 W TDP 40 W TDP 45 W TDP 50 W TDP 60 W TDP 65 W TDP 75 W TDP 80 W TDP 85 W TDP 90 W TDP 95 W 83% 86% 85% 100% 88% 85% 72% 71% 68% 72% 72%
0.4 fps per Watt (39%)
GPU TDP ? TDP 35 W TDP 40 W TDP 45 W TDP 50 W TDP 60 W TDP 65 W TDP 75 W TDP 80 W TDP 85 W TDP 90 W TDP 95 W 66% 83% 86% 85% 100% 88% 85% 72% 71% 68% 72% 72%
Power Consumption - Witcher 3 ultra Power Efficiency - external Monitor
min: 0.4026 avg: 0.5 median: 0.5 (41%) max: 0.742 fps per Watt
GPU TDP 35 W TDP 40 W TDP 45 W TDP 50 W TDP 60 W TDP 65 W TDP 75 W TDP 80 W TDP 85 W TDP 90 W TDP 95 W 100% 79% 80% 96% 90% 81% 75% 71% 65% 68% 69%
min: 0.22 avg: 0.3 median: 0.3 (26%) max: 0.3911 fps per Watt
GPU TDP ? TDP 35 W TDP 40 W TDP 45 W TDP 50 W TDP 60 W TDP 65 W TDP 75 W TDP 80 W TDP 85 W TDP 90 W TDP 95 W 50% 100% 79% 80% 96% 90% 81% 75% 71% 65% 68% 69%
0.3 fps per Watt (24%)
GPU TDP ? TDP 35 W TDP 40 W TDP 45 W TDP 50 W TDP 60 W TDP 65 W TDP 75 W TDP 80 W TDP 85 W TDP 90 W TDP 95 W 50% 100% 79% 80% 96% 90% 81% 75% 71% 65% 68% 69%
Emissions Witcher 3 Fan Noise + NVIDIA GeForce RTX 3050 Ti Laptop GPU Emissions - Witcher 3 Fan Noise
min: 0 avg: 43.7 median: 44.6 (71%) max: 56 dB(A)
GPU TDP 35 W TDP 40 W TDP 45 W TDP 50 W TDP 60 W TDP 65 W TDP 75 W TDP 85 W TDP 90 W TDP 95 W 97% 82% 81% 90% 88% 98% 100% 91% 87% 99%
Clock Speed - GPU Clock Witcher 3 ultra
min: 1274 avg: 1618 median: 1673 (66%) max: 1815 MHz
GPU TDP 35 W TDP 50 W TDP 60 W TDP 75 W TDP 90 W 72% 79% 92% 100% 94%
Clock Speed - GPU Clock Speed Furmark
min: 1092 avg: 1281 median: 1185 (47%) max: 1567 MHz
GPU TDP 35 W TDP 50 W TDP 90 W 70% 76% 100%
min: 1440 avg: 1466 median: 1465.5 (58%) max: 1491 MHz
GPU TDP ? TDP 35 W TDP 50 W TDP 90 W 94% 70% 76% 100%
Average Benchmarks NVIDIA GeForce RTX 3050 Ti Laptop GPU → 100% n=38 Average Benchmarks NVIDIA GeForce RTX 3070 → 187% n=38 Average Benchmarks NVIDIA GeForce RTX 3060 Ti → 178% n=38
- Bereich der Benchmarkergebnisse für diese Grafikkarte
- Durchschnittliche Benchmarkergebnisse für diese Grafikkarte
* Smaller numbers mean a higher performance
1 This benchmark is not used for the average calculation
Spiele-Benchmarks Die folgenden Benchmarks basieren auf unseren Spieletests mit Testnotebooks. Die Performance dieser Grafikkarte bei den gelisteten Spielen ist abhängig von der verwendeten CPU, Speicherausstattung, Treiber und auch Betriebssystem. Dadurch müssen die untenstehenden Werte nicht repräsentativ sein. Detaillierte Informationen über das verwendete System sehen Sie nach einem Klick auf den fps-Wert.
NVIDIA GeForce RTX 3060 Ti:
76.4 [X] Nvidia GeForce RTX 3060 Ti FE Intel Core i9-14900K 3.2GHz
NVIDIA GeForce RTX 3060 Ti
min:
49.5 fps, P0.1:
54.4 fps, P1:
59.1 fps, max:
106.6 fps
fps
NVIDIA GeForce RTX 3060 Ti:
60.8 [X] Nvidia GeForce RTX 3060 Ti FE Intel Core i9-14900K 3.2GHz
NVIDIA GeForce RTX 3060 Ti
min:
36 fps, P0.1:
43.2 fps, P1:
50.4 fps, max:
95.2 fps
fps
NVIDIA GeForce RTX 3060 Ti:
51 [X] Nvidia GeForce RTX 3060 Ti FE Intel Core i9-14900K 3.2GHz
NVIDIA GeForce RTX 3060 Ti
min:
39.9 fps, P0.1:
41.1 fps, P1:
44.4 fps, max:
61.1 fps
fps
NVIDIA GeForce RTX 3060 Ti:
31.8 [X] Nvidia GeForce RTX 3060 Ti FE Intel Core i9-14900K 3.2GHz
NVIDIA GeForce RTX 3060 Ti
min:
26.3 fps, P0.1:
26.4 fps, P1:
26.8 fps, max:
40.3 fps
fps
NVIDIA GeForce RTX 3060 Ti:
35.1 [X] Nvidia GeForce RTX 3060 Ti FE Intel Core i9-14900K 3.2GHz
NVIDIA GeForce RTX 3060 Ti
min:
5.7 fps, P0.1:
9.95 fps, P1:
30.9 fps, max:
41.9 fps
fps
NVIDIA GeForce RTX 3060 Ti:
33.1 [X] Nvidia GeForce RTX 3060 Ti FE Intel Core i9-14900K 3.2GHz
NVIDIA GeForce RTX 3060 Ti
min:
10.5 fps, P0.1:
12.1 fps, P1:
29.3 fps, max:
39.8 fps
fps
NVIDIA GeForce RTX 3060 Ti:
130.1 [X] Nvidia GeForce RTX 3060 Ti FE Intel Core i9-14900K 3.2GHz
NVIDIA GeForce RTX 3060 Ti
min:
79.3 fps, P0.1:
98.1 fps, P1:
108.1 fps, max:
223 fps
fps
NVIDIA GeForce RTX 3060 Ti:
119.1 [X] Nvidia GeForce RTX 3060 Ti FE Intel Core i9-14900K 3.2GHz
NVIDIA GeForce RTX 3060 Ti
min:
91.5 fps, P0.1:
93.5 fps, P1:
99.4 fps, max:
202 fps
fps
NVIDIA GeForce RTX 3060 Ti:
79.9 [X] Nvidia GeForce RTX 3060 Ti FE Intel Core i9-14900K 3.2GHz
NVIDIA GeForce RTX 3060 Ti
min:
63.4 fps, P0.1:
64.3 fps, P1:
66.1 fps, max:
110.9 fps
fps
NVIDIA GeForce RTX 3060 Ti:
77.7 [X] Nvidia GeForce RTX 3060 Ti FE Intel Core i9-14900K 3.2GHz
NVIDIA GeForce RTX 3060 Ti
min:
62.6 fps, P0.1:
63.9 fps, P1:
65.9 fps, max:
113.6 fps
fps
NVIDIA GeForce RTX 3060 Ti:
58.8 [X] Nvidia GeForce RTX 3060 Ti FE Intel Core i9-14900K 3.2GHz
NVIDIA GeForce RTX 3060 Ti
min:
48.7 fps, P0.1:
50.2 fps, P1:
51.4 fps, max:
84.7 fps
fps
NVIDIA GeForce RTX 3060 Ti:
34.6 [X] Nvidia GeForce RTX 3060 Ti FE Intel Core i9-14900K 3.2GHz
NVIDIA GeForce RTX 3060 Ti
min:
29.9 fps, P0.1:
30.2 fps, P1:
31 fps, max:
43.6 fps
fps
NVIDIA GeForce RTX 3060 Ti:
50.7 [X] Nvidia GeForce RTX 3060 Ti FE Intel Core i9-14900K 3.2GHz
NVIDIA GeForce RTX 3060 Ti
min:
41.2 fps, P0.1:
41.6 fps, P1:
44 fps, max:
63.8 fps
fps
NVIDIA GeForce RTX 3060 Ti:
46.3 [X] Nvidia GeForce RTX 3060 Ti FE Intel Core i9-14900K 3.2GHz
NVIDIA GeForce RTX 3060 Ti
min:
28.6 fps, P0.1:
28.9 fps, P1:
37.9 fps, max:
63.7 fps
fps
NVIDIA GeForce RTX 3060 Ti:
306 [X] Nvidia GeForce RTX 3060 Ti FE Intel Core i9-14900K 3.2GHz
NVIDIA GeForce RTX 3060 Ti
min:
40.6 fps, P0.1:
165.1 fps, P1:
224 fps, max:
627 fps
fps
NVIDIA GeForce RTX 3060 Ti:
259 [X] Nvidia GeForce RTX 3060 Ti FE Intel Core i9-14900K 3.2GHz
NVIDIA GeForce RTX 3060 Ti
min:
18.1 fps, P0.1:
102.7 fps, P1:
192.8 fps, max:
478 fps
fps
NVIDIA GeForce RTX 3060 Ti:
221 [X] Nvidia GeForce RTX 3060 Ti FE Intel Core i9-14900K 3.2GHz
NVIDIA GeForce RTX 3060 Ti
min:
51.7 fps, P0.1:
106.1 fps, P1:
161 fps, max:
474 fps
fps
NVIDIA GeForce RTX 3060 Ti:
132.3 [X] Nvidia GeForce RTX 3060 Ti FE Intel Core i9-14900K 3.2GHz
NVIDIA GeForce RTX 3060 Ti
min:
52.7 fps, P0.1:
77.9 fps, P1:
107.5 fps, max:
377 fps
fps
NVIDIA GeForce RTX 3060 Ti:
67.1 [X] Nvidia GeForce RTX 3060 Ti FE Intel Core i9-14900K 3.2GHz
NVIDIA GeForce RTX 3060 Ti
min:
34.2 fps, P0.1:
35.4 fps, P1:
37.5 fps, max:
92.3 fps
fps
NVIDIA GeForce RTX 3060 Ti:
14.1 [X] Nvidia GeForce RTX 3060 Ti FE Intel Core i9-14900K 3.2GHz
NVIDIA GeForce RTX 3060 Ti
min:
2.63 fps, P0.1:
3.31 fps, P1:
12.4 fps, max:
17.4 fps
fps
NVIDIA GeForce RTX 3060 Ti:
36.5 [X] Nvidia GeForce RTX 3060 Ti FE Intel Core i9-14900K 3.2GHz
NVIDIA GeForce RTX 3060 Ti
min:
18.5 fps, P0.1:
18.7 fps, P1:
19.9 fps, max:
88.9 fps
fps
NVIDIA GeForce RTX 3060 Ti:
62.3 [X] Nvidia GeForce RTX 3060 Ti FE Intel Core i9-14900K 3.2GHz
NVIDIA GeForce RTX 3060 Ti
min:
28.7 fps, P0.1:
28.9 fps, P1:
32.4 fps, max:
176 fps
fps
NVIDIA GeForce RTX 3060 Ti:
296 [X] Nvidia GeForce RTX 3060 Ti FE Intel Core i9-14900K 3.2GHz
NVIDIA GeForce RTX 3060 Ti
min:
28.4 fps, P0.1:
181.2 fps, P1:
250 fps, max:
398 fps
fps
NVIDIA GeForce RTX 3060 Ti:
252 [X] Nvidia GeForce RTX 3060 Ti FE Intel Core i9-14900K 3.2GHz
NVIDIA GeForce RTX 3060 Ti
min:
32 fps, P0.1:
171.5 fps, P1:
181.6 fps, max:
404 fps
fps
NVIDIA GeForce RTX 3060 Ti:
211 [X] Nvidia GeForce RTX 3060 Ti FE Intel Core i9-14900K 3.2GHz
NVIDIA GeForce RTX 3060 Ti
min:
28.8 fps, P0.1:
139 fps, P1:
155.4 fps, max:
719 fps
fps
NVIDIA GeForce RTX 3060 Ti:
174.2 [X] Nvidia GeForce RTX 3060 Ti FE Intel Core i9-14900K 3.2GHz
NVIDIA GeForce RTX 3060 Ti
min:
30.6 fps, P0.1:
124.3 fps, P1:
131.2 fps, max:
382 fps
fps
NVIDIA GeForce RTX 3060 Ti:
115 [X] Nvidia GeForce RTX 3060 Ti FE Intel Core i9-14900K 3.2GHz
NVIDIA GeForce RTX 3060 Ti
min:
30.4 fps, P0.1:
87 fps, P1:
90.7 fps, max:
297 fps
fps
NVIDIA GeForce RTX 3060 Ti:
57.6 [X] Nvidia GeForce RTX 3060 Ti FE Intel Core i9-14900K 3.2GHz
NVIDIA GeForce RTX 3060 Ti
min:
31.4 fps, P0.1:
40 fps, P1:
47.4 fps, max:
175.4 fps
fps
NVIDIA GeForce RTX 3060 Ti:
130 [X] Nvidia GeForce RTX 3060 Ti FE Intel Core i9-14900K 3.2GHz
NVIDIA GeForce RTX 3060 Ti
fps
NVIDIA GeForce RTX 3060 Ti:
122 [X] Nvidia GeForce RTX 3060 Ti FE Intel Core i9-14900K 3.2GHz
NVIDIA GeForce RTX 3060 Ti
fps
NVIDIA GeForce RTX 3060 Ti:
100 [X] Nvidia GeForce RTX 3060 Ti FE Intel Core i9-14900K 3.2GHz
NVIDIA GeForce RTX 3060 Ti
fps
NVIDIA GeForce RTX 3060 Ti:
72 [X] Nvidia GeForce RTX 3060 Ti FE Intel Core i9-14900K 3.2GHz
NVIDIA GeForce RTX 3060 Ti
fps
NVIDIA GeForce RTX 3060 Ti:
59 [X] Nvidia GeForce RTX 3060 Ti FE Intel Core i9-14900K 3.2GHz
NVIDIA GeForce RTX 3060 Ti
fps
NVIDIA GeForce RTX 3060 Ti:
37 [X] Nvidia GeForce RTX 3060 Ti FE Intel Core i9-14900K 3.2GHz
NVIDIA GeForce RTX 3060 Ti
fps
NVIDIA GeForce RTX 3060 Ti:
55 [X] Nvidia GeForce RTX 3060 Ti FE Intel Core i9-14900K 3.2GHz
NVIDIA GeForce RTX 3060 Ti
fps
NVIDIA GeForce RTX 3060 Ti:
50 [X] Nvidia GeForce RTX 3060 Ti FE Intel Core i9-14900K 3.2GHz
NVIDIA GeForce RTX 3060 Ti
fps
NVIDIA GeForce RTX 3060 Ti:
168.2 [X] Nvidia GeForce RTX 3060 Ti FE Intel Core i9-14900K 3.2GHz
NVIDIA GeForce RTX 3060 Ti
min:
59 fps, P0.1:
145.6 fps, P1:
152.4 fps, max:
211 fps
fps
NVIDIA GeForce RTX 3060 Ti:
129.8 [X] Nvidia GeForce RTX 3060 Ti FE Intel Core i9-14900K 3.2GHz
NVIDIA GeForce RTX 3060 Ti
min:
59 fps, P0.1:
102.4 fps, P1:
119.3 fps, max:
211 fps
fps
NVIDIA GeForce RTX 3060 Ti:
117.1 [X] Nvidia GeForce RTX 3060 Ti FE Intel Core i9-14900K 3.2GHz
NVIDIA GeForce RTX 3060 Ti
min:
63 fps, P0.1:
103.7 fps, P1:
105.8 fps, max:
185 fps
fps
NVIDIA GeForce RTX 3060 Ti:
115 [X] Nvidia GeForce RTX 3060 Ti FE Intel Core i9-14900K 3.2GHz
NVIDIA GeForce RTX 3060 Ti
min:
52.8 fps, P0.1:
70.8 fps, P1:
104.1 fps, max:
210 fps
fps
NVIDIA GeForce RTX 3060 Ti:
82.7 [X] Nvidia GeForce RTX 3060 Ti FE Intel Core i9-14900K 3.2GHz
NVIDIA GeForce RTX 3060 Ti
min:
73.9 fps, P0.1:
74.4 fps, P1:
75.1 fps, max:
98.7 fps
fps
NVIDIA GeForce RTX 3060 Ti:
42.6 [X] Nvidia GeForce RTX 3060 Ti FE Intel Core i9-14900K 3.2GHz
NVIDIA GeForce RTX 3060 Ti
min:
18.2 fps, P0.1:
18.9 fps, P1:
36.4 fps, max:
51.8 fps
fps
NVIDIA GeForce RTX 3060 Ti:
88.8 [X] Nvidia GeForce RTX 3060 Ti FE Intel Core i9-14900K 3.2GHz
NVIDIA GeForce RTX 3060 Ti
min:
64.2 fps, P0.1:
65.4 fps, P1:
69 fps, max:
148.2 fps
fps
NVIDIA GeForce RTX 3070:
81.6 [X] Desktop-PC Intel Core i9-13900K 3GHz
NVIDIA GeForce RTX 3070
min:
56.7 fps, P0.1:
59.7 fps, P1:
63.6 fps, max:
149.2 fps
fps
NVIDIA GeForce RTX 3060 Ti:
77.7 [X] Nvidia GeForce RTX 3060 Ti FE Intel Core i9-14900K 3.2GHz
NVIDIA GeForce RTX 3060 Ti
min:
57.5 fps, P0.1:
59.7 fps, P1:
62.3 fps, max:
132.1 fps
fps
NVIDIA GeForce RTX 3070:
68.1 [X] Desktop-PC Intel Core i9-13900K 3GHz
NVIDIA GeForce RTX 3070
min:
48.8 fps, P0.1:
50.2 fps, P1:
53.4 fps, max:
110.7 fps
fps
NVIDIA GeForce RTX 3060 Ti:
65.5 [X] Nvidia GeForce RTX 3060 Ti FE Intel Core i9-14900K 3.2GHz
NVIDIA GeForce RTX 3060 Ti
min:
50.3 fps, P0.1:
51.6 fps, P1:
53 fps, max:
112.3 fps
fps
NVIDIA GeForce RTX 3070:
56.7 [X] Desktop-PC Intel Core i9-13900K 3GHz
NVIDIA GeForce RTX 3070
min:
40.9 fps, P0.1:
41.9 fps, P1:
44.4 fps, max:
96.8 fps
fps
NVIDIA GeForce RTX 3060 Ti:
55.3 [X] Nvidia GeForce RTX 3060 Ti FE Intel Core i9-14900K 3.2GHz
NVIDIA GeForce RTX 3060 Ti
min:
41.7 fps, P0.1:
41.9 fps, P1:
43.3 fps, max:
85.3 fps
fps
NVIDIA GeForce RTX 3070:
44.9 [X] Desktop-PC Intel Core i9-13900K 3GHz
NVIDIA GeForce RTX 3070
min:
33.9 fps, P0.1:
34.7 fps, P1:
35.9 fps, max:
65.1 fps
fps
NVIDIA GeForce RTX 3060 Ti:
43.4 [X] Nvidia GeForce RTX 3060 Ti FE Intel Core i9-14900K 3.2GHz
NVIDIA GeForce RTX 3060 Ti
min:
33.5 fps, P0.1:
33.6 fps, P1:
35.3 fps, max:
57.1 fps
fps
NVIDIA GeForce RTX 3070:
28.2 [X] Desktop-PC Intel Core i9-13900K 3GHz
NVIDIA GeForce RTX 3070
min:
22.8 fps, P0.1:
23.3 fps, P1:
24.2 fps, max:
37.6 fps
fps
NVIDIA GeForce RTX 3060 Ti:
26.6 [X] Nvidia GeForce RTX 3060 Ti FE Intel Core i9-14900K 3.2GHz
NVIDIA GeForce RTX 3060 Ti
min:
15.5 fps, P0.1:
15.5 fps, P1:
22.6 fps, max:
268 fps
fps
NVIDIA GeForce RTX 3060 Ti:
39 [X] Nvidia GeForce RTX 3060 Ti FE Intel Core i9-14900K 3.2GHz
NVIDIA GeForce RTX 3060 Ti
min:
29.9 fps, P0.1:
30 fps, P1:
31.9 fps, max:
51.3 fps
fps
NVIDIA GeForce RTX 3060 Ti:
32.9 [X] Nvidia GeForce RTX 3060 Ti FE Intel Core i9-14900K 3.2GHz
NVIDIA GeForce RTX 3060 Ti
min:
18.5 fps, P0.1:
25.8 fps, P1:
27.3 fps, max:
231 fps
fps
NVIDIA GeForce RTX 3060 Ti:
185.7 [X] Nvidia GeForce RTX 3060 Ti FE Intel Core i9-14900K 3.2GHz
NVIDIA GeForce RTX 3060 Ti
min:
60.2 fps, P0.1:
110.2 fps, P1:
139.8 fps, max:
304 fps
fps
NVIDIA GeForce RTX 3070:
173.9 [X] Desktop-PC Intel Core i9-13900K 3GHz
NVIDIA GeForce RTX 3070
min:
72.7 fps, P0.1:
90.2 fps, P1:
136.7 fps, max:
300 fps
fps
NVIDIA GeForce RTX 3060 Ti:
156.9 [X] Nvidia GeForce RTX 3060 Ti FE Intel Core i9-14900K 3.2GHz
NVIDIA GeForce RTX 3060 Ti
min:
63.3 fps, P0.1:
98.9 fps, P1:
129.5 fps, max:
280 fps
fps
NVIDIA GeForce RTX 3070:
138.8 [X] Desktop-PC Intel Core i9-13900K 3GHz
NVIDIA GeForce RTX 3070
min:
55 fps, P0.1:
64.5 fps, P1:
107.1 fps, max:
215 fps
fps
NVIDIA GeForce RTX 3060 Ti:
121.6 [X] Nvidia GeForce RTX 3060 Ti FE Intel Core i9-14900K 3.2GHz
NVIDIA GeForce RTX 3060 Ti
min:
34 fps, P0.1:
77.9 fps, P1:
99.4 fps, max:
245 fps
fps
NVIDIA GeForce RTX 3070:
124.6 [X] Desktop-PC Intel Core i9-13900K 3GHz
NVIDIA GeForce RTX 3070
min:
37.3 fps, P0.1:
71.4 fps, P1:
103.6 fps, max:
202 fps
fps
NVIDIA GeForce RTX 3060 Ti:
109.3 [X] Nvidia GeForce RTX 3060 Ti FE Intel Core i9-14900K 3.2GHz
NVIDIA GeForce RTX 3060 Ti
min:
9.6 fps, P0.1:
76.2 fps, P1:
86.7 fps, max:
196.9 fps
fps
NVIDIA GeForce RTX 3070:
91.4 [X] Desktop-PC Intel Core i9-13900K 3GHz
NVIDIA GeForce RTX 3070
min:
38.7 fps, P0.1:
46.3 fps, P1:
80.1 fps, max:
175.5 fps
fps
NVIDIA GeForce RTX 3060 Ti:
81.5 [X] Nvidia GeForce RTX 3060 Ti FE Intel Core i9-14900K 3.2GHz
NVIDIA GeForce RTX 3060 Ti
min:
34 fps, P0.1:
62.2 fps, P1:
72.1 fps, max:
184 fps
fps
NVIDIA GeForce RTX 3070:
51.8 [X] Desktop-PC Intel Core i9-13900K 3GHz
NVIDIA GeForce RTX 3070
min:
24.8 fps, P0.1:
38.2 fps, P1:
47.3 fps, max:
127.3 fps
fps
NVIDIA GeForce RTX 3060 Ti:
43.7 [X] Nvidia GeForce RTX 3060 Ti FE Intel Core i9-14900K 3.2GHz
NVIDIA GeForce RTX 3060 Ti
min:
21.8 fps, P0.1:
23.4 fps, P1:
25.4 fps, max:
265 fps
fps
NVIDIA GeForce RTX 3060 Ti:
61.1 [X] Nvidia GeForce RTX 3060 Ti FE Intel Core i9-14900K 3.2GHz
NVIDIA GeForce RTX 3060 Ti
min:
28.8 fps, P0.1:
34 fps, P1:
53.3 fps, max:
171.9 fps
fps
NVIDIA GeForce RTX 3070:
359 [X] Desktop-PC Intel Core i9-13900K 3GHz
NVIDIA GeForce RTX 3070
min:
29 fps, P0.1:
231 fps, P1:
332 fps, max:
1054 fps
fps
NVIDIA GeForce RTX 3060 Ti:
358 [X] Nvidia GeForce RTX 3060 Ti FE Intel Core i9-14900K 3.2GHz
NVIDIA GeForce RTX 3060 Ti
min:
27.7 fps, P0.1:
225 fps, P1:
327 fps, max:
1420 fps
fps
NVIDIA GeForce RTX 3070:
359 [X] Desktop-PC Intel Core i9-13900K 3GHz
NVIDIA GeForce RTX 3070
min:
28.7 fps, P0.1:
288 fps, P1:
328 fps, max:
1043 fps
fps
NVIDIA GeForce RTX 3060 Ti:
359 [X] Nvidia GeForce RTX 3060 Ti FE Intel Core i9-14900K 3.2GHz
NVIDIA GeForce RTX 3060 Ti
min:
27.7 fps, P0.1:
267 fps, P1:
327 fps, max:
1083 fps
fps
NVIDIA GeForce RTX 3070:
359 [X] Desktop-PC Intel Core i9-13900K 3GHz
NVIDIA GeForce RTX 3070
min:
28.2 fps, P0.1:
265 fps, P1:
328 fps, max:
1047 fps
fps
NVIDIA GeForce RTX 3060 Ti:
359 [X] Nvidia GeForce RTX 3060 Ti FE Intel Core i9-14900K 3.2GHz
NVIDIA GeForce RTX 3060 Ti
min:
30.3 fps, P0.1:
270 fps, P1:
327 fps, max:
986 fps
fps
NVIDIA GeForce RTX 3070:
359 [X] Desktop-PC Intel Core i9-13900K 3GHz
NVIDIA GeForce RTX 3070
min:
29 fps, P0.1:
255 fps, P1:
325 fps, max:
1082 fps
fps
NVIDIA GeForce RTX 3060 Ti:
358 [X] Nvidia GeForce RTX 3060 Ti FE Intel Core i9-14900K 3.2GHz
NVIDIA GeForce RTX 3060 Ti
min:
29 fps, P0.1:
257 fps, P1:
326 fps, max:
1088 fps
fps
NVIDIA GeForce RTX 3070:
230 [X] Desktop-PC Intel Core i9-13900K 3GHz
NVIDIA GeForce RTX 3070
min:
27.9 fps, P0.1:
98 fps, P1:
183.2 fps, max:
676 fps
fps
NVIDIA GeForce RTX 3060 Ti:
206 [X] Nvidia GeForce RTX 3060 Ti FE Intel Core i9-14900K 3.2GHz
NVIDIA GeForce RTX 3060 Ti
min:
24.4 fps, P0.1:
145.6 fps, P1:
166.7 fps, max:
604 fps
fps
NVIDIA GeForce RTX 3060 Ti:
271 [X] Nvidia GeForce RTX 3060 Ti FE AMD Ryzen 9 7950X 4.5GHz
NVIDIA GeForce RTX 3060 Ti
min:
12.8 fps, P0.1:
16.9 fps, P1:
53.9 fps, max:
544 fps
fps
NVIDIA GeForce RTX 3070:
294 [X] Desktop-PC Intel Core i9-13900K 3GHz
NVIDIA GeForce RTX 3070
min:
29 fps, P0.1:
105.5 fps, P1:
143.5 fps, max:
642 fps
fps
NVIDIA GeForce RTX 3060 Ti:
260 [X] Nvidia GeForce RTX 3060 Ti FE AMD Ryzen 9 7950X 4.5GHz
NVIDIA GeForce RTX 3060 Ti
min:
46.7 fps, P0.1:
122.1 fps, P1:
138.6 fps, max:
508 fps
fps
NVIDIA GeForce RTX 3070:
259 [X] Desktop-PC Intel Core i9-13900K 3GHz
NVIDIA GeForce RTX 3070
min:
51.5 fps, P0.1:
122.8 fps, P1:
130.8 fps, max:
588 fps
fps
NVIDIA GeForce RTX 3060 Ti:
228 [X] Nvidia GeForce RTX 3060 Ti FE AMD Ryzen 9 7950X 4.5GHz
NVIDIA GeForce RTX 3060 Ti
min:
15.7 fps, P0.1:
55.5 fps, P1:
117.2 fps, max:
446 fps
fps
NVIDIA GeForce RTX 3070:
187 [X] Desktop-PC Intel Core i9-13900K 3GHz
NVIDIA GeForce RTX 3070
min:
48.1 fps, P0.1:
102 fps, P1:
109.8 fps, max:
514 fps
fps
NVIDIA GeForce RTX 3060 Ti:
164.3 [X] Nvidia GeForce RTX 3060 Ti FE AMD Ryzen 9 7950X 4.5GHz
NVIDIA GeForce RTX 3060 Ti
min:
20.5 fps, P0.1:
47.6 fps, P1:
98.5 fps, max:
404 fps
fps
NVIDIA GeForce RTX 3070:
115.6 [X] Desktop-PC Intel Core i9-13900K 3GHz
NVIDIA GeForce RTX 3070
min:
43.6 fps, P0.1:
64.5 fps, P1:
67.5 fps, max:
499 fps
fps
NVIDIA GeForce RTX 3060 Ti:
99.6 [X] Nvidia GeForce RTX 3060 Ti FE AMD Ryzen 9 7950X 4.5GHz
NVIDIA GeForce RTX 3060 Ti
min:
25.8 fps, P0.1:
36.7 fps, P1:
55 fps, max:
361 fps
fps
NVIDIA GeForce RTX 3070:
53.6 [X] Desktop-PC Intel Core i9-13900K 3GHz
NVIDIA GeForce RTX 3070
min:
27.2 fps, P0.1:
27.4 fps, P1:
28.5 fps, max:
433 fps
fps
NVIDIA GeForce RTX 3060 Ti:
33.2 [X] Nvidia GeForce RTX 3060 Ti FE AMD Ryzen 9 7950X 4.5GHz
NVIDIA GeForce RTX 3060 Ti
min:
10 fps, P0.1:
10.3 fps, P1:
11.3 fps, max:
331 fps
fps
NVIDIA GeForce RTX 3060 Ti:
92.3 [X] Nvidia GeForce RTX 3060 Ti FE AMD Ryzen 9 7950X 4.5GHz
NVIDIA GeForce RTX 3060 Ti
min:
30.4 fps, P0.1:
45.2 fps, P1:
52 fps, max:
360 fps
fps
NVIDIA GeForce RTX 3060 Ti:
318 [X] Nvidia GeForce RTX 3060 Ti FE AMD Ryzen 9 7950X 4.5GHz
NVIDIA GeForce RTX 3060 Ti
min:
68.1 fps, P0.1:
184.3 fps, P1:
215 fps, max:
518 fps
fps
NVIDIA GeForce RTX 3070:
269 [X] Desktop-PC Intel Core i9-13900K 3GHz
NVIDIA GeForce RTX 3070
min:
154.8 fps, P0.1:
182.4 fps, P1:
202 fps, max:
472 fps
fps
NVIDIA GeForce RTX 3060 Ti:
234 [X] Nvidia GeForce RTX 3060 Ti FE AMD Ryzen 9 7950X 4.5GHz
NVIDIA GeForce RTX 3060 Ti
min:
56.6 fps, P0.1:
136.9 fps, P1:
157.8 fps, max:
542 fps
fps
NVIDIA GeForce RTX 3070:
228 [X] Desktop-PC Intel Core i9-13900K 3GHz
NVIDIA GeForce RTX 3070
min:
130.5 fps, P0.1:
150.8 fps, P1:
173.2 fps, max:
361 fps
fps
NVIDIA GeForce RTX 3060 Ti:
206 [X] Nvidia GeForce RTX 3060 Ti FE AMD Ryzen 9 7950X 4.5GHz
NVIDIA GeForce RTX 3060 Ti
min:
90.5 fps, P0.1:
121.1 fps, P1:
140.3 fps, max:
399 fps
fps
NVIDIA GeForce RTX 3070:
174.1 [X] Desktop-PC Intel Core i9-13900K 3GHz
NVIDIA GeForce RTX 3070
min:
114.5 fps, P0.1:
121.6 fps, P1:
133.4 fps, max:
273 fps
fps
NVIDIA GeForce RTX 3060 Ti:
154.8 [X] Nvidia GeForce RTX 3060 Ti FE AMD Ryzen 9 7950X 4.5GHz
NVIDIA GeForce RTX 3060 Ti
min:
85.2 fps, P0.1:
102.3 fps, P1:
110.5 fps, max:
291 fps
fps
NVIDIA GeForce RTX 3070:
112 [X] Desktop-PC Intel Core i9-13900K 3GHz
NVIDIA GeForce RTX 3070
min:
84 fps, P0.1:
85.3 fps, P1:
89.2 fps, max:
156.2 fps
fps
NVIDIA GeForce RTX 3060 Ti:
96.7 [X] Nvidia GeForce RTX 3060 Ti FE AMD Ryzen 9 7950X 4.5GHz
NVIDIA GeForce RTX 3060 Ti
min:
65.7 fps, P0.1:
69 fps, P1:
72.5 fps, max:
248 fps
fps
NVIDIA GeForce RTX 3070:
53.9 [X] Desktop-PC Intel Core i9-13900K 3GHz
NVIDIA GeForce RTX 3070
min:
40.8 fps, P0.1:
42 fps, P1:
44.3 fps, max:
66 fps
fps
NVIDIA GeForce RTX 3060 Ti:
46.3 [X] Nvidia GeForce RTX 3060 Ti FE AMD Ryzen 9 7950X 4.5GHz
NVIDIA GeForce RTX 3060 Ti
min:
32.1 fps, P0.1:
33.2 fps, P1:
35.3 fps, max:
59.1 fps
fps
NVIDIA GeForce RTX 3060 Ti:
92 [X] Nvidia GeForce RTX 3060 Ti FE AMD Ryzen 9 7950X 4.5GHz
NVIDIA GeForce RTX 3060 Ti
min:
76 fps, max:
117 fps
fps
NVIDIA GeForce RTX 3070:
96 [X] Desktop-PC Intel Core i9-13900K 3GHz
NVIDIA GeForce RTX 3070
min:
76 fps
fps
NVIDIA GeForce RTX 3060 Ti:
84 [X] Nvidia GeForce RTX 3060 Ti FE AMD Ryzen 9 7950X 4.5GHz
NVIDIA GeForce RTX 3060 Ti
min:
66 fps, max:
109 fps
fps
NVIDIA GeForce RTX 3070:
83 [X] Desktop-PC Intel Core i9-13900K 3GHz
NVIDIA GeForce RTX 3070
min:
64 fps
fps
NVIDIA GeForce RTX 3060 Ti:
65 [X] Nvidia GeForce RTX 3060 Ti FE AMD Ryzen 9 7950X 4.5GHz
NVIDIA GeForce RTX 3060 Ti
min:
46 fps, max:
82 fps
fps
NVIDIA GeForce RTX 3070:
64 [X] Desktop-PC Intel Core i9-13900K 3GHz
NVIDIA GeForce RTX 3070
min:
49 fps
fps
NVIDIA GeForce RTX 3060 Ti:
56 [X] Nvidia GeForce RTX 3060 Ti FE AMD Ryzen 9 7950X 4.5GHz
NVIDIA GeForce RTX 3060 Ti
min:
41 fps, max:
76 fps
fps
NVIDIA GeForce RTX 3070:
43 [X] Desktop-PC Intel Core i9-13900K 3GHz
NVIDIA GeForce RTX 3070
min:
34 fps
fps
NVIDIA GeForce RTX 3060 Ti:
37 [X] Nvidia GeForce RTX 3060 Ti FE AMD Ryzen 9 7950X 4.5GHz
NVIDIA GeForce RTX 3060 Ti
min:
30 fps, max:
50 fps
fps
NVIDIA GeForce RTX 3070:
23 [X] Desktop-PC Intel Core i9-13900K 3GHz
NVIDIA GeForce RTX 3070
min:
19 fps
fps
NVIDIA GeForce RTX 3060 Ti:
18 [X] Nvidia GeForce RTX 3060 Ti FE AMD Ryzen 9 7950X 4.5GHz
NVIDIA GeForce RTX 3060 Ti
min:
15 fps, max:
24 fps
fps
NVIDIA GeForce RTX 3060 Ti:
31 [X] Nvidia GeForce RTX 3060 Ti FE AMD Ryzen 9 7950X 4.5GHz
NVIDIA GeForce RTX 3060 Ti
min:
25 fps, max:
40 fps
fps
NVIDIA GeForce RTX 3060 Ti:
187 [X] Nvidia GeForce RTX 3060 Ti FE AMD Ryzen 9 7950X 4.5GHz
NVIDIA GeForce RTX 3060 Ti
fps
NVIDIA GeForce RTX 3060 Ti:
160 [X] Nvidia GeForce RTX 3060 Ti FE AMD Ryzen 9 7950X 4.5GHz
NVIDIA GeForce RTX 3060 Ti
fps
NVIDIA GeForce RTX 3060 Ti:
124 [X] Nvidia GeForce RTX 3060 Ti FE AMD Ryzen 9 7950X 4.5GHz
NVIDIA GeForce RTX 3060 Ti
fps
NVIDIA GeForce RTX 3060 Ti:
123 [X] Nvidia GeForce RTX 3060 Ti FE AMD Ryzen 9 7950X 4.5GHz
NVIDIA GeForce RTX 3060 Ti
fps
NVIDIA GeForce RTX 3060 Ti:
86 [X] Nvidia GeForce RTX 3060 Ti FE AMD Ryzen 9 7950X 4.5GHz
NVIDIA GeForce RTX 3060 Ti
fps
NVIDIA GeForce RTX 3060 Ti:
65 [X] Nvidia GeForce RTX 3060 Ti FE AMD Ryzen 9 7950X 4.5GHz
NVIDIA GeForce RTX 3060 Ti
fps
NVIDIA GeForce RTX 3060 Ti:
164.2 [X] Nvidia GeForce RTX 3060 Ti FE AMD Ryzen 9 7950X 4.5GHz
NVIDIA GeForce RTX 3060 Ti
min:
21.9 fps, P0.1:
96.7 fps, P1:
111.2 fps, max:
295 fps
fps
NVIDIA GeForce RTX 3070:
137.4 [X] Desktop-PC Intel Core i9-13900K 3GHz
NVIDIA GeForce RTX 3070
min:
52.4 fps, P0.1:
104 fps, P1:
113.9 fps, max:
220 fps
fps
NVIDIA GeForce RTX 3060 Ti:
122.3 [X] Nvidia GeForce RTX 3060 Ti FE AMD Ryzen 9 7950X 4.5GHz
NVIDIA GeForce RTX 3060 Ti
min:
21.3 fps, P0.1:
91 fps, P1:
100.8 fps, max:
194.6 fps
fps
NVIDIA GeForce RTX 3070:
126.8 [X] Desktop-PC Intel Core i9-13900K 3GHz
NVIDIA GeForce RTX 3070
min:
14 fps, P0.1:
86.2 fps, P1:
108.5 fps, max:
184.5 fps
fps
NVIDIA GeForce RTX 3060 Ti:
113.4 [X] Nvidia GeForce RTX 3060 Ti FE AMD Ryzen 9 7950X 4.5GHz
NVIDIA GeForce RTX 3060 Ti
min:
46.4 fps, P0.1:
84.7 fps, P1:
96.6 fps, max:
166.6 fps
fps
NVIDIA GeForce RTX 3070:
118.3 [X] Desktop-PC Intel Core i9-13900K 3GHz
NVIDIA GeForce RTX 3070
min:
21.3 fps, P0.1:
81.1 fps, P1:
100 fps, max:
232 fps
fps
NVIDIA GeForce RTX 3060 Ti:
105.2 [X] Nvidia GeForce RTX 3060 Ti FE AMD Ryzen 9 7950X 4.5GHz
NVIDIA GeForce RTX 3060 Ti
min:
55.2 fps, P0.1:
81.5 fps, P1:
90.3 fps, max:
153.5 fps
fps
NVIDIA GeForce RTX 3070:
84.5 [X] Desktop-PC Intel Core i9-13900K 3GHz
NVIDIA GeForce RTX 3070
min:
10.6 fps, P0.1:
55.4 fps, P1:
72.8 fps, max:
174.1 fps
fps
NVIDIA GeForce RTX 3060 Ti:
75.5 [X] Nvidia GeForce RTX 3060 Ti FE AMD Ryzen 9 7950X 4.5GHz
NVIDIA GeForce RTX 3060 Ti
min:
43.6 fps, P0.1:
61.2 fps, P1:
65.4 fps, max:
142.4 fps
fps
NVIDIA GeForce RTX 3070:
48.6 [X] Desktop-PC Intel Core i9-13900K 3GHz
NVIDIA GeForce RTX 3070
min:
12.9 fps, P0.1:
27 fps, P1:
43.5 fps, max:
174.8 fps
fps
NVIDIA GeForce RTX 3060 Ti:
41.7 [X] Nvidia GeForce RTX 3060 Ti FE AMD Ryzen 9 7950X 4.5GHz
NVIDIA GeForce RTX 3060 Ti
min:
35.4 fps, P0.1:
36 fps, P1:
37.3 fps, max:
60.2 fps
fps
NVIDIA GeForce RTX 3060 Ti:
62.2 [X] Nvidia GeForce RTX 3060 Ti FE AMD Ryzen 9 7950X 4.5GHz
NVIDIA GeForce RTX 3060 Ti
min:
44.8 fps, P0.1:
52.3 fps, P1:
55.3 fps, max:
106.5 fps
fps
NVIDIA GeForce RTX 3060 Ti:
68.6 [X] Nvidia GeForce RTX 3060 Ti FE AMD Ryzen 9 7950X 4.5GHz
NVIDIA GeForce RTX 3060 Ti
min:
37.5 fps, P0.1:
39.5 fps, P1:
42.9 fps, max:
156.9 fps
fps
NVIDIA GeForce RTX 3060 Ti:
61.2 [X] Nvidia GeForce RTX 3060 Ti FE AMD Ryzen 9 7950X 4.5GHz
NVIDIA GeForce RTX 3060 Ti
min:
33.3 fps, P0.1:
33.8 fps, P1:
41.8 fps, max:
159 fps
fps
NVIDIA GeForce RTX 3060 Ti:
58.6 [X] Nvidia GeForce RTX 3060 Ti FE AMD Ryzen 9 7950X 4.5GHz
NVIDIA GeForce RTX 3060 Ti
min:
32.7 fps, P0.1:
34.8 fps, P1:
39.6 fps, max:
152.5 fps
fps
NVIDIA GeForce RTX 3060 Ti:
43.8 [X] Nvidia GeForce RTX 3060 Ti FE AMD Ryzen 9 7950X 4.5GHz
NVIDIA GeForce RTX 3060 Ti
min:
25 fps, P0.1:
27.3 fps, P1:
31.9 fps, max:
104.9 fps
fps
NVIDIA GeForce RTX 3060 Ti:
19.8 [X] Nvidia GeForce RTX 3060 Ti FE AMD Ryzen 9 7950X 4.5GHz
NVIDIA GeForce RTX 3060 Ti
min:
14.3 fps, P0.1:
15.1 fps, P1:
16.2 fps, max:
29 fps
fps
NVIDIA GeForce RTX 3060 Ti:
109.6 [X] Nvidia GeForce RTX 3060 Ti FE AMD Ryzen 9 7950X 4.5GHz
NVIDIA GeForce RTX 3060 Ti
min:
44.2 fps, P0.1:
61.5 fps, P1:
85.6 fps, max:
211 fps
fps
NVIDIA GeForce RTX 3070:
97.4 [X] Desktop-PC Intel Core i9-13900K 3GHz
NVIDIA GeForce RTX 3070
min:
73.2 fps, P0.1:
75.8 fps, P1:
83.4 fps, max:
151.9 fps
fps
NVIDIA GeForce RTX 3060 Ti:
91.9 [X] Nvidia GeForce RTX 3060 Ti FE AMD Ryzen 9 7950X 4.5GHz
NVIDIA GeForce RTX 3060 Ti
min:
41.1 fps, P0.1:
58.6 fps, P1:
75 fps, max:
197.2 fps
fps
NVIDIA GeForce RTX 3070:
71.5 [X] Desktop-PC Intel Core i9-13900K 3GHz
NVIDIA GeForce RTX 3070
min:
23.2 fps, P0.1:
48 fps, P1:
62.4 fps, max:
202 fps
fps
NVIDIA GeForce RTX 3060 Ti:
67.7 [X] Nvidia GeForce RTX 3060 Ti FE AMD Ryzen 9 7950X 4.5GHz
NVIDIA GeForce RTX 3060 Ti
min:
40.3 fps, P0.1:
52.4 fps, P1:
57.9 fps, max:
147.4 fps
fps
NVIDIA GeForce RTX 3070:
50.3 [X] Desktop-PC Intel Core i9-13900K 3GHz
NVIDIA GeForce RTX 3070
min:
16 fps, P0.1:
31.6 fps, P1:
44.1 fps, max:
196.7 fps
fps
NVIDIA GeForce RTX 3060 Ti:
46.7 [X] Nvidia GeForce RTX 3060 Ti FE AMD Ryzen 9 7950X 4.5GHz
NVIDIA GeForce RTX 3060 Ti
min:
28.8 fps, P0.1:
32.3 fps, P1:
40.5 fps, max:
101 fps
fps
NVIDIA GeForce RTX 3070:
35 [X] Desktop-PC Intel Core i9-13900K 3GHz
NVIDIA GeForce RTX 3070
min:
28.2 fps, P0.1:
28.2 fps, P1:
30.9 fps, max:
41.8 fps
fps
NVIDIA GeForce RTX 3060 Ti:
31.8 [X] Nvidia GeForce RTX 3060 Ti FE AMD Ryzen 9 7950X 4.5GHz
NVIDIA GeForce RTX 3060 Ti
min:
25.4 fps, P0.1:
26.2 fps, P1:
27.8 fps, max:
45.1 fps
fps
NVIDIA GeForce RTX 3070:
18.9 [X] Desktop-PC Intel Core i9-13900K 3GHz
NVIDIA GeForce RTX 3070
min:
15 fps, P0.1:
15 fps, P1:
15.4 fps, max:
27.3 fps
fps
NVIDIA GeForce RTX 3060 Ti:
16.8 [X] Nvidia GeForce RTX 3060 Ti FE AMD Ryzen 9 7950X 4.5GHz
NVIDIA GeForce RTX 3060 Ti
min:
14.4 fps, P0.1:
14.4 fps, P1:
14.7 fps, max:
21.4 fps
fps
NVIDIA GeForce RTX 3060 Ti:
31.9 [X] Nvidia GeForce RTX 3060 Ti FE AMD Ryzen 9 7950X 4.5GHz
NVIDIA GeForce RTX 3060 Ti
min:
22 fps, P0.1:
26.2 fps, P1:
27.5 fps, max:
45.8 fps
fps
NVIDIA GeForce RTX 3060 Ti:
444 [X] Nvidia GeForce RTX 3060 Ti FE AMD Ryzen 9 7950X 4.5GHz
NVIDIA GeForce RTX 3060 Ti
fps
NVIDIA GeForce RTX 3070:
334 [X] Desktop-PC Intel Core i9-13900K 3GHz
NVIDIA GeForce RTX 3070
min:
213 fps
fps
NVIDIA GeForce RTX 3060 Ti:
283.9 [X] Nvidia GeForce RTX 3060 Ti FE AMD Ryzen 9 7950X 4.5GHz
NVIDIA GeForce RTX 3060 Ti
fps
NVIDIA GeForce RTX 3070:
200 [X] Desktop-PC Intel Core i9-13900K 3GHz
NVIDIA GeForce RTX 3070
min:
157 fps
fps
NVIDIA GeForce RTX 3060 Ti:
175.8 [X] Nvidia GeForce RTX 3060 Ti FE AMD Ryzen 9 7950X 4.5GHz
NVIDIA GeForce RTX 3060 Ti
fps
NVIDIA GeForce RTX 3070:
159 [X] Desktop-PC Intel Core i9-13900K 3GHz
NVIDIA GeForce RTX 3070
min:
122 fps
fps
NVIDIA GeForce RTX 3060 Ti:
139.6 [X] Nvidia GeForce RTX 3060 Ti FE AMD Ryzen 9 7950X 4.5GHz
NVIDIA GeForce RTX 3060 Ti
fps
NVIDIA GeForce RTX 3070:
111 [X] Desktop-PC Intel Core i9-13900K 3GHz
NVIDIA GeForce RTX 3070
min:
86 fps
fps
NVIDIA GeForce RTX 3060 Ti:
97.1 [X] Nvidia GeForce RTX 3060 Ti FE AMD Ryzen 9 7950X 4.5GHz
NVIDIA GeForce RTX 3060 Ti
fps
NVIDIA GeForce RTX 3070:
57.7 [X] Desktop-PC Intel Core i9-13900K 3GHz
NVIDIA GeForce RTX 3070
min:
45 fps
fps
NVIDIA GeForce RTX 3060 Ti:
49.8 [X] Nvidia GeForce RTX 3060 Ti FE AMD Ryzen 9 7950X 4.5GHz
NVIDIA GeForce RTX 3060 Ti
fps
NVIDIA GeForce RTX 3060 Ti:
145 [X] Nvidia GeForce RTX 3060 Ti FE AMD Ryzen 9 7950X 4.5GHz
NVIDIA GeForce RTX 3060 Ti
min:
73 fps, P0.1:
96 fps, P1:
122 fps, max:
176 fps
fps
NVIDIA GeForce RTX 3070:
142 [X] Desktop-PC Intel Core i9-13900K 3GHz
NVIDIA GeForce RTX 3070
P0.1:
84 fpsP1:
fps
fps
NVIDIA GeForce RTX 3060 Ti:
134 [X] Nvidia GeForce RTX 3060 Ti FE AMD Ryzen 9 7950X 4.5GHz
NVIDIA GeForce RTX 3060 Ti
min:
72 fps, P0.1:
84 fps, P1:
106 fps, max:
220 fps
fps
NVIDIA GeForce RTX 3070:
135 [X] Desktop-PC Intel Core i9-13900K 3GHz
NVIDIA GeForce RTX 3070
P0.1:
74 fpsP1:
fps
fps
NVIDIA GeForce RTX 3060 Ti:
127 [X] Nvidia GeForce RTX 3060 Ti FE AMD Ryzen 9 7950X 4.5GHz
NVIDIA GeForce RTX 3060 Ti
min:
36 fps, P0.1:
80 fps, P1:
99 fps, max:
230 fps
fps
NVIDIA GeForce RTX 3070:
107 [X] Desktop-PC Intel Core i9-13900K 3GHz
NVIDIA GeForce RTX 3070
P0.1:
47 fpsP1:
fps
fps
NVIDIA GeForce RTX 3060 Ti:
98 [X] Nvidia GeForce RTX 3060 Ti FE AMD Ryzen 9 7950X 4.5GHz
NVIDIA GeForce RTX 3060 Ti
min:
8 fps, P0.1:
52 fps, P1:
71 fps, max:
159 fps
fps
NVIDIA GeForce RTX 3070:
85 [X] Desktop-PC Intel Core i9-13900K 3GHz
NVIDIA GeForce RTX 3070
P0.1:
46 fpsP1:
fps
fps
NVIDIA GeForce RTX 3060 Ti:
77 [X] Nvidia GeForce RTX 3060 Ti FE AMD Ryzen 9 7950X 4.5GHz
NVIDIA GeForce RTX 3060 Ti
min:
34 fps, P0.1:
49 fps, P1:
61 fps, max:
107 fps
fps
NVIDIA GeForce RTX 3070:
51 [X] Desktop-PC Intel Core i9-13900K 3GHz
NVIDIA GeForce RTX 3070
P0.1:
34 fpsP1:
fps
fps
NVIDIA GeForce RTX 3060 Ti:
48 [X] Nvidia GeForce RTX 3060 Ti FE AMD Ryzen 9 7950X 4.5GHz
NVIDIA GeForce RTX 3060 Ti
min:
29 fps, P0.1:
32 fps, P1:
38 fps, max:
59 fps
fps
NVIDIA GeForce RTX 3060 Ti:
64 [X] Nvidia GeForce RTX 3060 Ti FE AMD Ryzen 9 7950X 4.5GHz
NVIDIA GeForce RTX 3060 Ti
min:
37 fps, P0.1:
41 fps, P1:
50 fps, max:
79 fps
fps
NVIDIA GeForce RTX 3060 Ti:
310 [X] Nvidia GeForce RTX 3060 Ti FE AMD Ryzen 9 7950X 4.5GHz
NVIDIA GeForce RTX 3060 Ti
min:
26.9 fps, P0.1:
89 fps, P1:
215 fps, max:
446 fps
fps
NVIDIA GeForce RTX 3060 Ti:
280 [X] Nvidia GeForce RTX 3060 Ti FE AMD Ryzen 9 7950X 4.5GHz
NVIDIA GeForce RTX 3060 Ti
min:
65.3 fps, P0.1:
83 fps, P1:
192.9 fps, max:
384 fps
fps
NVIDIA GeForce RTX 3060 Ti:
230 [X] Nvidia GeForce RTX 3060 Ti FE AMD Ryzen 9 7950X 4.5GHz
NVIDIA GeForce RTX 3060 Ti
min:
45.1 fps, P0.1:
93.4 fps, P1:
145.4 fps, max:
333 fps
fps
NVIDIA GeForce RTX 3060 Ti:
193.6 [X] Nvidia GeForce RTX 3060 Ti FE AMD Ryzen 9 7950X 4.5GHz
NVIDIA GeForce RTX 3060 Ti
min:
55.7 fps, P0.1:
66.5 fps, P1:
128 fps, max:
296 fps
fps
NVIDIA GeForce RTX 3060 Ti:
148.2 [X] Nvidia GeForce RTX 3060 Ti FE AMD Ryzen 9 7950X 4.5GHz
NVIDIA GeForce RTX 3060 Ti
min:
45 fps, P0.1:
78.1 fps, P1:
111.7 fps, max:
277 fps
fps
NVIDIA GeForce RTX 3060 Ti:
90.6 [X] Nvidia GeForce RTX 3060 Ti FE AMD Ryzen 9 7950X 4.5GHz
NVIDIA GeForce RTX 3060 Ti
min:
52.1 fps, P0.1:
61.9 fps, P1:
76.5 fps, max:
225 fps
fps
NVIDIA GeForce RTX 3060 Ti:
344 [X] Nvidia GeForce RTX 3060 Ti FE AMD Ryzen 9 7950X 4.5GHz
NVIDIA GeForce RTX 3060 Ti
min:
63 fps, P0.1:
115.7 fps, P1:
147.5 fps, max:
1271 fps
fps
NVIDIA GeForce RTX 3070:
330 [X] Desktop-PC Intel Core i9-13900K 3GHz
NVIDIA GeForce RTX 3070
min:
109.8 fps, P0.1:
135.1 fps, P1:
148.7 fps, max:
867 fps
fps
NVIDIA GeForce RTX 3060 Ti:
330 [X] Nvidia GeForce RTX 3060 Ti FE AMD Ryzen 9 7950X 4.5GHz
NVIDIA GeForce RTX 3060 Ti
min:
46.7 fps, P0.1:
106 fps, P1:
147.3 fps, max:
1548 fps
fps
NVIDIA GeForce RTX 3070:
288 [X] Desktop-PC Intel Core i9-13900K 3GHz
NVIDIA GeForce RTX 3070
min:
65.9 fps, P0.1:
92.7 fps, P1:
141 fps, max:
767 fps
fps
NVIDIA GeForce RTX 3060 Ti:
267 [X] Nvidia GeForce RTX 3060 Ti FE AMD Ryzen 9 7950X 4.5GHz
NVIDIA GeForce RTX 3060 Ti
min:
61.3 fps, P0.1:
101.9 fps, P1:
123.7 fps, max:
1193 fps
fps
NVIDIA GeForce RTX 3070:
225 [X] Desktop-PC Intel Core i9-13900K 3GHz
NVIDIA GeForce RTX 3070
min:
68.5 fps, P0.1:
78.9 fps, P1:
123.4 fps, max:
719 fps
fps
NVIDIA GeForce RTX 3060 Ti:
180.7 [X] Nvidia GeForce RTX 3060 Ti FE AMD Ryzen 9 7950X 4.5GHz
NVIDIA GeForce RTX 3060 Ti
min:
22.4 fps, P0.1:
56.6 fps, P1:
96.8 fps, max:
1028 fps
fps
NVIDIA GeForce RTX 3070:
166.9 [X] Desktop-PC Intel Core i9-13900K 3GHz
NVIDIA GeForce RTX 3070
min:
75.2 fps, P0.1:
81.7 fps, P1:
114.5 fps, max:
760 fps
fps
NVIDIA GeForce RTX 3060 Ti:
145.5 [X] Nvidia GeForce RTX 3060 Ti FE AMD Ryzen 9 7950X 4.5GHz
NVIDIA GeForce RTX 3060 Ti
min:
54.5 fps, P0.1:
65.6 fps, P1:
78.9 fps, max:
954 fps
fps
NVIDIA GeForce RTX 3070:
86.2 [X] Desktop-PC Intel Core i9-13900K 3GHz
NVIDIA GeForce RTX 3070
min:
34.7 fps, P0.1:
43.8 fps, P1:
60 fps, max:
321 fps
fps
NVIDIA GeForce RTX 3060 Ti:
72.8 [X] Nvidia GeForce RTX 3060 Ti FE AMD Ryzen 9 7950X 4.5GHz
NVIDIA GeForce RTX 3060 Ti
min:
35.4 fps, P0.1:
40.7 fps, P1:
44.4 fps, max:
196.6 fps
fps
NVIDIA GeForce RTX 3060 Ti:
160.6 [X] Nvidia GeForce RTX 3060 Ti FE 2.0
AMD Ryzen 9 7950X 4.5GHz
NVIDIA GeForce RTX 3060 Ti
min:
62.9 fps, max:
234 fps
fps
NVIDIA GeForce RTX 3070:
137 [X] Desktop-PC Intel Core i9-13900K 3GHz
NVIDIA GeForce RTX 3070
min:
69 fps
fps
NVIDIA GeForce RTX 3060 Ti:
123.6 [X] Nvidia GeForce RTX 3060 Ti FE 2.0
AMD Ryzen 9 7950X 4.5GHz
NVIDIA GeForce RTX 3060 Ti
min:
61.1 fps, max:
206 fps
fps
NVIDIA GeForce RTX 3070:
119 [X] Desktop-PC Intel Core i9-13900K 3GHz
NVIDIA GeForce RTX 3070
min:
92 fps
fps
NVIDIA GeForce RTX 3060 Ti:
105.9 [X] Nvidia GeForce RTX 3060 Ti FE 2.0
AMD Ryzen 9 7950X 4.5GHz
NVIDIA GeForce RTX 3060 Ti
min:
53.1 fps, max:
187.7 fps
fps
NVIDIA GeForce RTX 3070:
107 [X] Desktop-PC Intel Core i9-13900K 3GHz
NVIDIA GeForce RTX 3070
min:
83 fps
fps
NVIDIA GeForce RTX 3060 Ti:
96.8 [X] Nvidia GeForce RTX 3060 Ti FE 2.0
AMD Ryzen 9 7950X 4.5GHz
NVIDIA GeForce RTX 3060 Ti
min:
48.7 fps, max:
183.6 fps
fps
NVIDIA GeForce RTX 3070:
71 [X] Desktop-PC Intel Core i9-13900K 3GHz
NVIDIA GeForce RTX 3070
min:
59 fps
fps
NVIDIA GeForce RTX 3060 Ti:
61.5 [X] Nvidia GeForce RTX 3060 Ti FE 2.0
AMD Ryzen 9 7950X 4.5GHz
NVIDIA GeForce RTX 3060 Ti
min:
46.8 fps, max:
91.1 fps
fps
NVIDIA GeForce RTX 3070:
34.3 [X] Desktop-PC Intel Core i9-13900K 3GHz
NVIDIA GeForce RTX 3070
min:
29 fps
fps
NVIDIA GeForce RTX 3060 Ti:
29.4 [X] Nvidia GeForce RTX 3060 Ti FE 2.0
AMD Ryzen 9 7950X 4.5GHz
NVIDIA GeForce RTX 3060 Ti
min:
24.3 fps, max:
37.4 fps
fps
NVIDIA GeForce RTX 3060 Ti:
219 [X] Nvidia GeForce RTX 3060 Ti FE AMD Ryzen 9 7950X 4.5GHz
NVIDIA GeForce RTX 3060 Ti
min:
66.8 fps, P0.1:
94 fps, P1:
136.5 fps, max:
415 fps
fps
NVIDIA GeForce RTX 3070:
217 [X] Desktop-PC Intel Core i9-13900K 3GHz
NVIDIA GeForce RTX 3070
min:
21.1 fps, P0.1:
114.3 fps, P1:
138.1 fps, max:
435 fps
fps
NVIDIA GeForce RTX 3060 Ti:
189.1 [X] Nvidia GeForce RTX 3060 Ti FE AMD Ryzen 9 7950X 4.5GHz
NVIDIA GeForce RTX 3060 Ti
min:
63.5 fps, P0.1:
84.7 fps, P1:
118.7 fps, max:
411 fps
fps
NVIDIA GeForce RTX 3070:
185.4 [X] Desktop-PC Intel Core i9-13900K 3GHz
NVIDIA GeForce RTX 3070
min:
94.8 fps, P0.1:
104.2 fps, P1:
119.1 fps, max:
380 fps
fps
NVIDIA GeForce RTX 3060 Ti:
163.5 [X] Nvidia GeForce RTX 3060 Ti FE AMD Ryzen 9 7950X 4.5GHz
NVIDIA GeForce RTX 3060 Ti
min:
56.5 fps, P0.1:
71.1 fps, P1:
103.5 fps, max:
363 fps
fps
NVIDIA GeForce RTX 3070:
167 [X] Desktop-PC Intel Core i9-13900K 3GHz
NVIDIA GeForce RTX 3070
min:
83.5 fps, P0.1:
90.5 fps, P1:
105.4 fps, max:
387 fps
fps
NVIDIA GeForce RTX 3060 Ti:
145.6 [X] Nvidia GeForce RTX 3060 Ti FE AMD Ryzen 9 7950X 4.5GHz
NVIDIA GeForce RTX 3060 Ti
min:
62.7 fps, P0.1:
77 fps, P1:
89.9 fps, max:
313 fps
fps
NVIDIA GeForce RTX 3070:
112.7 [X] Desktop-PC Intel Core i9-13900K 3GHz
NVIDIA GeForce RTX 3070
min:
53 fps, P0.1:
58.9 fps, P1:
64 fps, max:
352 fps
fps
NVIDIA GeForce RTX 3060 Ti:
99.4 [X] Nvidia GeForce RTX 3060 Ti FE AMD Ryzen 9 7950X 4.5GHz
NVIDIA GeForce RTX 3060 Ti
min:
46.2 fps, P0.1:
50.7 fps, P1:
54.8 fps, max:
283 fps
fps
NVIDIA GeForce RTX 3070:
59.2 [X] Desktop-PC Intel Core i9-13900K 3GHz
NVIDIA GeForce RTX 3070
min:
26.5 fps, P0.1:
27.9 fps, P1:
29.9 fps, max:
312 fps
fps
NVIDIA GeForce RTX 3060 Ti:
51.1 [X] Nvidia GeForce RTX 3060 Ti FE AMD Ryzen 9 7950X 4.5GHz
NVIDIA GeForce RTX 3060 Ti
min:
23.1 fps, P0.1:
24.9 fps, P1:
25.8 fps, max:
235 fps
fps
NVIDIA GeForce RTX 3060 Ti:
80.3 [X] Nvidia GeForce RTX 3060 Ti FE AMD Ryzen 9 7950X 4.5GHz
NVIDIA GeForce RTX 3060 Ti
min:
39.7 fps, P0.1:
41.2 fps, P1:
43.5 fps, max:
285 fps
fps
NVIDIA GeForce RTX 3070:
60 [X] Desktop-PC Intel Core i9-13900K 3GHz
NVIDIA GeForce RTX 3070
min:
59 fps
fps
NVIDIA GeForce RTX 3070:
60 [X] Desktop-PC Intel Core i9-13900K 3GHz
NVIDIA GeForce RTX 3070
min:
59 fps
fps
NVIDIA GeForce RTX 3070:
60 [X] Desktop-PC Intel Core i9-13900K 3GHz
NVIDIA GeForce RTX 3070
min:
59 fps
fps
NVIDIA GeForce RTX 3070:
60 [X] Desktop-PC Intel Core i9-13900K 3GHz
NVIDIA GeForce RTX 3070
min:
59 fps
fps
NVIDIA GeForce RTX 3070:
46 [X] Desktop-PC Intel Core i9-13900K 3GHz
NVIDIA GeForce RTX 3070
min:
39 fps
fps
NVIDIA GeForce RTX 3060 Ti:
78.4 [X] Nvidia GeForce RTX 3060 Ti FE AMD Ryzen 9 7950X 4.5GHz
NVIDIA GeForce RTX 3060 Ti
min:
33.1 fps, P0.1:
55 fps, P1:
64.8 fps, max:
130.6 fps
fps
NVIDIA GeForce RTX 3070:
87.1 [X] Desktop-PC Intel Core i9-13900K 3GHz
NVIDIA GeForce RTX 3070
min:
69.8 fps, P0.1:
70.4 fps, P1:
73.4 fps, max:
124.4 fps
fps
NVIDIA GeForce RTX 3060 Ti:
68.6 [X] Nvidia GeForce RTX 3060 Ti FE AMD Ryzen 9 7950X 4.5GHz
NVIDIA GeForce RTX 3060 Ti
min:
50.8 fps, P0.1:
52.1 fps, P1:
55.7 fps, max:
104.4 fps
fps
NVIDIA GeForce RTX 3070:
66.9 [X] Desktop-PC Intel Core i9-13900K 3GHz
NVIDIA GeForce RTX 3070
min:
22.1 fps, P0.1:
36.9 fps, P1:
53.5 fps, max:
263 fps
fps
NVIDIA GeForce RTX 3060 Ti:
55.7 [X] Nvidia GeForce RTX 3060 Ti FE AMD Ryzen 9 7950X 4.5GHz
NVIDIA GeForce RTX 3060 Ti
min:
40 fps, P0.1:
41.3 fps, P1:
44 fps, max:
90.8 fps
fps
NVIDIA GeForce RTX 3070:
59.5 [X] Desktop-PC Intel Core i9-13900K 3GHz
NVIDIA GeForce RTX 3070
min:
45.5 fps, P0.1:
46 fps, P1:
47.9 fps, max:
75.2 fps
fps
NVIDIA GeForce RTX 3060 Ti:
50.4 [X] Nvidia GeForce RTX 3060 Ti FE AMD Ryzen 9 7950X 4.5GHz
NVIDIA GeForce RTX 3060 Ti
min:
36.5 fps, P0.1:
36.8 fps, P1:
39 fps, max:
84.5 fps
fps
NVIDIA GeForce RTX 3070:
47.9 [X] Desktop-PC Intel Core i9-13900K 3GHz
NVIDIA GeForce RTX 3070
min:
35.1 fps, P0.1:
35.7 fps, P1:
37.5 fps, max:
59.8 fps
fps
NVIDIA GeForce RTX 3060 Ti:
41.2 [X] Nvidia GeForce RTX 3060 Ti FE AMD Ryzen 9 7950X 4.5GHz
NVIDIA GeForce RTX 3060 Ti
min:
31.8 fps, P0.1:
32.3 fps, P1:
33.8 fps, max:
59.2 fps
fps
NVIDIA GeForce RTX 3070:
31.6 [X] Desktop-PC Intel Core i9-13900K 3GHz
NVIDIA GeForce RTX 3070
min:
25.2 fps, P0.1:
25.4 fps, P1:
26.1 fps, max:
40.1 fps
fps
NVIDIA GeForce RTX 3060 Ti:
27 [X] Nvidia GeForce RTX 3060 Ti FE AMD Ryzen 9 7950X 4.5GHz
NVIDIA GeForce RTX 3060 Ti
min:
22 fps, P0.1:
22.2 fps, P1:
22.7 fps, max:
32.6 fps
fps
NVIDIA GeForce RTX 3060 Ti:
119.6 [X] Nvidia GeForce RTX 3060 Ti FE AMD Ryzen 9 7950X 4.5GHz
NVIDIA GeForce RTX 3060 Ti
min:
37.3 fps, P0.1:
93.3 fps, P1:
97.3 fps, max:
195.4 fps
fps
NVIDIA GeForce RTX 3070:
119.9 [X] Desktop-PC Intel Core i9-13900K 3GHz
NVIDIA GeForce RTX 3070
min:
51.4 fps, P0.1:
89.4 fps, P1:
101.9 fps, max:
193.9 fps
fps
NVIDIA GeForce RTX 3060 Ti:
119.3 [X] Nvidia GeForce RTX 3060 Ti FE AMD Ryzen 9 7950X 4.5GHz
NVIDIA GeForce RTX 3060 Ti
min:
35.9 fps, P0.1:
82.3 fps, P1:
95.1 fps, max:
205 fps
fps
NVIDIA GeForce RTX 3070:
119.8 [X] Desktop-PC Intel Core i9-13900K 3GHz
NVIDIA GeForce RTX 3070
min:
88.8 fps, P0.1:
95.9 fps, P1:
103.6 fps, max:
174.3 fps
fps
NVIDIA GeForce RTX 3060 Ti:
119.5 [X] Nvidia GeForce RTX 3060 Ti FE AMD Ryzen 9 7950X 4.5GHz
NVIDIA GeForce RTX 3060 Ti
min:
75.9 fps, P0.1:
89.3 fps, P1:
96.4 fps, max:
180.5 fps
fps
NVIDIA GeForce RTX 3070:
119.8 [X] Desktop-PC Intel Core i9-13900K 3GHz
NVIDIA GeForce RTX 3070
min:
31 fps, P0.1:
94 fps, P1:
105.6 fps, max:
174.8 fps
fps
NVIDIA GeForce RTX 3060 Ti:
118 [X] Nvidia GeForce RTX 3060 Ti FE AMD Ryzen 9 7950X 4.5GHz
NVIDIA GeForce RTX 3060 Ti
min:
81.9 fps, P0.1:
90.5 fps, P1:
95.8 fps, max:
184.8 fps
fps
NVIDIA GeForce RTX 3070:
98.2 [X] Desktop-PC Intel Core i9-13900K 3GHz
NVIDIA GeForce RTX 3070
min:
63.2 fps, P0.1:
73.2 fps, P1:
82.3 fps, max:
146.9 fps
fps
NVIDIA GeForce RTX 3060 Ti:
92.5 [X] Nvidia GeForce RTX 3060 Ti FE AMD Ryzen 9 7950X 4.5GHz
NVIDIA GeForce RTX 3060 Ti
min:
59.8 fps, P0.1:
69.8 fps, P1:
74.6 fps, max:
148.3 fps
fps
NVIDIA GeForce RTX 3070:
58.3 [X] Desktop-PC Intel Core i9-13900K 3GHz
NVIDIA GeForce RTX 3070
min:
33.6 fps, P0.1:
43.6 fps, P1:
47.8 fps, max:
120.4 fps
fps
NVIDIA GeForce RTX 3060 Ti:
53.2 [X] Nvidia GeForce RTX 3060 Ti FE AMD Ryzen 9 7950X 4.5GHz
NVIDIA GeForce RTX 3060 Ti
min:
40 fps, P0.1:
41.6 fps, P1:
45 fps, max:
72 fps
fps
NVIDIA GeForce RTX 3060 Ti:
72.2 [X] Nvidia GeForce RTX 3060 Ti FE AMD Ryzen 9 7950X 4.5GHz
NVIDIA GeForce RTX 3060 Ti
min:
32.2 fps, P0.1:
46.7 fps, P1:
51.5 fps, max:
151.4 fps
fps
NVIDIA GeForce RTX 3060 Ti:
62.8 [X] Nvidia GeForce RTX 3060 Ti FE AMD Ryzen 9 7950X 4.5GHz
NVIDIA GeForce RTX 3060 Ti
min:
32.6 fps, P0.1:
42 fps, P1:
47.2 fps, max:
138.8 fps
fps
NVIDIA GeForce RTX 3060 Ti:
50 [X] Nvidia GeForce RTX 3060 Ti FE AMD Ryzen 9 7950X 4.5GHz
NVIDIA GeForce RTX 3060 Ti
min:
31.6 fps, P0.1:
32.9 fps, P1:
36.9 fps, max:
72.5 fps
fps
NVIDIA GeForce RTX 3060 Ti:
34 [X] Nvidia GeForce RTX 3060 Ti FE AMD Ryzen 9 7950X 4.5GHz
NVIDIA GeForce RTX 3060 Ti
min:
22.4 fps, P0.1:
23.4 fps, P1:
25.7 fps, max:
50.6 fps
fps
NVIDIA GeForce RTX 3060 Ti:
18.9 [X] Nvidia GeForce RTX 3060 Ti FE AMD Ryzen 9 7950X 4.5GHz
NVIDIA GeForce RTX 3060 Ti
min:
14.4 fps, P0.1:
14.6 fps, P1:
15.3 fps, max:
25.2 fps
fps
NVIDIA GeForce RTX 3060 Ti:
174.1 [X] Nvidia GeForce RTX 3060 Ti FE AMD Ryzen 9 7950X 4.5GHz
NVIDIA GeForce RTX 3060 Ti
min:
90.5 fps, P0.1:
122.8 fps, P1:
138.2 fps, max:
244 fps
fps
NVIDIA GeForce RTX 3070:
190.1 [X] Desktop-PC Intel Core i9-13900K 3GHz
NVIDIA GeForce RTX 3070
min:
106 fps, P0.1:
137.5 fps, P1:
151.1 fps, max:
288 fps
fps
NVIDIA GeForce RTX 3060 Ti:
166.2 [X] Nvidia GeForce RTX 3060 Ti FE AMD Ryzen 9 7950X 4.5GHz
NVIDIA GeForce RTX 3060 Ti
min:
78.8 fps, P0.1:
113.3 fps, P1:
128.9 fps, max:
248 fps
fps
NVIDIA GeForce RTX 3070:
171.9 [X] Desktop-PC Intel Core i9-13900K 3GHz
NVIDIA GeForce RTX 3070
min:
105.8 fps, P0.1:
132 fps, P1:
139 fps, max:
248 fps
fps
NVIDIA GeForce RTX 3060 Ti:
156.6 [X] Nvidia GeForce RTX 3060 Ti FE AMD Ryzen 9 7950X 4.5GHz
NVIDIA GeForce RTX 3060 Ti
min:
83.3 fps, P0.1:
106.5 fps, P1:
119.9 fps, max:
253 fps
fps
NVIDIA GeForce RTX 3070:
145 [X] Desktop-PC Intel Core i9-13900K 3GHz
NVIDIA GeForce RTX 3070
min:
91.2 fps, P0.1:
110.7 fps, P1:
119 fps, max:
217 fps
fps
NVIDIA GeForce RTX 3060 Ti:
129.9 [X] Nvidia GeForce RTX 3060 Ti FE AMD Ryzen 9 7950X 4.5GHz
NVIDIA GeForce RTX 3060 Ti
min:
90.1 fps, P0.1:
93.9 fps, P1:
109.1 fps, max:
202 fps
fps
NVIDIA GeForce RTX 3070:
101.9 [X] Desktop-PC Intel Core i9-13900K 3GHz
NVIDIA GeForce RTX 3070
min:
82.1 fps, P0.1:
83.3 fps, P1:
86.4 fps, max:
127.8 fps
fps
NVIDIA GeForce RTX 3060 Ti:
90.1 [X] Nvidia GeForce RTX 3060 Ti FE AMD Ryzen 9 7950X 4.5GHz
NVIDIA GeForce RTX 3060 Ti
min:
69 fps, P0.1:
70.6 fps, P1:
76.2 fps, max:
131.9 fps
fps
NVIDIA GeForce RTX 3070:
58.3 [X] Desktop-PC Intel Core i9-13900K 3GHz
NVIDIA GeForce RTX 3070
min:
46 fps, P0.1:
46.2 fps, P1:
50.1 fps, max:
71.3 fps
fps
NVIDIA GeForce RTX 3060 Ti:
50.3 [X] Nvidia GeForce RTX 3060 Ti FE AMD Ryzen 9 7950X 4.5GHz
NVIDIA GeForce RTX 3060 Ti
min:
40.5 fps, P0.1:
41.5 fps, P1:
42.1 fps, max:
67.6 fps
fps
NVIDIA GeForce RTX 3060 Ti:
145.3 [X] Nvidia GeForce RTX 3060 Ti FE AMD Ryzen 9 7950X 4.5GHz
NVIDIA GeForce RTX 3060 Ti
min:
86.2 fps, P0.1:
106.3 fps, P1:
125.2 fps, max:
346 fps
fps
NVIDIA GeForce RTX 3070:
145.6 [X] Desktop-PC Intel Core i9-13900K 3GHz
NVIDIA GeForce RTX 3070
min:
82.9 fps, P0.1:
121.4 fps, P1:
130.4 fps, max:
249 fps
fps
NVIDIA GeForce RTX 3060 Ti:
117.2 [X] Nvidia GeForce RTX 3060 Ti FE AMD Ryzen 9 7950X 4.5GHz
NVIDIA GeForce RTX 3060 Ti
min:
15.6 fps, P0.1:
86.6 fps, P1:
104.3 fps, max:
173 fps
fps
NVIDIA GeForce RTX 3070:
121.6 [X] Desktop-PC Intel Core i9-13900K 3GHz
NVIDIA GeForce RTX 3070
min:
71.8 fps, P0.1:
105.9 fps, P1:
109.2 fps, max:
193.3 fps
fps
NVIDIA GeForce RTX 3060 Ti:
98.1 [X] Nvidia GeForce RTX 3060 Ti FE AMD Ryzen 9 7950X 4.5GHz
NVIDIA GeForce RTX 3060 Ti
min:
30.9 fps, P0.1:
74.7 fps, P1:
86.2 fps, max:
195.2 fps
fps
NVIDIA GeForce RTX 3070:
120.8 [X] Desktop-PC Intel Core i9-13900K 3GHz
NVIDIA GeForce RTX 3070
min:
68.1 fps, P0.1:
105.2 fps, P1:
108.9 fps, max:
172.4 fps
fps
NVIDIA GeForce RTX 3060 Ti:
98.2 [X] Nvidia GeForce RTX 3060 Ti FE AMD Ryzen 9 7950X 4.5GHz
NVIDIA GeForce RTX 3060 Ti
min:
64.7 fps, P0.1:
80.2 fps, P1:
88.3 fps, max:
169.3 fps
fps
NVIDIA GeForce RTX 3070:
82.3 [X] Desktop-PC Intel Core i9-13900K 3GHz
NVIDIA GeForce RTX 3070
min:
71.5 fps, P0.1:
72.4 fps, P1:
73.9 fps, max:
98.6 fps
fps
NVIDIA GeForce RTX 3060 Ti:
63.9 [X] Nvidia GeForce RTX 3060 Ti FE AMD Ryzen 9 7950X 4.5GHz
NVIDIA GeForce RTX 3060 Ti
min:
40.6 fps, P0.1:
45.4 fps, P1:
54.4 fps, max:
123.7 fps
fps
NVIDIA GeForce RTX 3070:
44.6 [X] Desktop-PC Intel Core i9-13900K 3GHz
NVIDIA GeForce RTX 3070
min:
39.1 fps, P0.1:
39.4 fps, P1:
40.1 fps, max:
51.4 fps
fps
NVIDIA GeForce RTX 3060 Ti:
34.6 [X] Nvidia GeForce RTX 3060 Ti FE AMD Ryzen 9 7950X 4.5GHz
NVIDIA GeForce RTX 3060 Ti
min:
28.4 fps, P0.1:
29.1 fps, P1:
29.3 fps, max:
45.4 fps
fps
NVIDIA GeForce RTX 3060 Ti:
119.4 [X] Nvidia GeForce RTX 3060 Ti FE AMD Ryzen 9 7950X 4.5GHz
NVIDIA GeForce RTX 3060 Ti
min:
81.2 fps, P0.1:
94.4 fps, P1:
96.2 fps, max:
153.9 fps
fps
NVIDIA GeForce RTX 3070:
110.7 [X] Desktop-PC Intel Core i9-13900K 3GHz
NVIDIA GeForce RTX 3070
min:
84.5 fps, P0.1:
88.7 fps, P1:
91 fps, max:
151.6 fps
fps
NVIDIA GeForce RTX 3060 Ti:
103.2 [X] Nvidia GeForce RTX 3060 Ti FE AMD Ryzen 9 7950X 4.5GHz
NVIDIA GeForce RTX 3060 Ti
min:
71.4 fps, P0.1:
82.6 fps, P1:
85.2 fps, max:
136.5 fps
fps
NVIDIA GeForce RTX 3070:
87.2 [X] Desktop-PC Intel Core i9-13900K 3GHz
NVIDIA GeForce RTX 3070
min:
55 fps, P0.1:
55.9 fps, P1:
57.7 fps, max:
132.5 fps
fps
NVIDIA GeForce RTX 3060 Ti:
82.7 [X] Nvidia GeForce RTX 3060 Ti FE AMD Ryzen 9 7950X 4.5GHz
NVIDIA GeForce RTX 3060 Ti
min:
48.6 fps, P0.1:
51.9 fps, P1:
54.6 fps, max:
114.8 fps
fps
NVIDIA GeForce RTX 3070:
78.8 [X] Desktop-PC Intel Core i9-13900K 3GHz
NVIDIA GeForce RTX 3070
min:
44.6 fps, P0.1:
49.9 fps, P1:
53.3 fps, max:
109.9 fps
fps
NVIDIA GeForce RTX 3060 Ti:
73.4 [X] Nvidia GeForce RTX 3060 Ti FE AMD Ryzen 9 7950X 4.5GHz
NVIDIA GeForce RTX 3060 Ti
min:
38.3 fps, P0.1:
39.7 fps, P1:
43.4 fps, max:
104.6 fps
fps
NVIDIA GeForce RTX 3070:
64.5 [X] Desktop-PC Intel Core i9-13900K 3GHz
NVIDIA GeForce RTX 3070
min:
41.3 fps, P0.1:
42.2 fps, P1:
43.9 fps, max:
93.6 fps
fps
NVIDIA GeForce RTX 3060 Ti:
60.8 [X] Nvidia GeForce RTX 3060 Ti FE AMD Ryzen 9 7950X 4.5GHz
NVIDIA GeForce RTX 3060 Ti
min:
34.8 fps, P0.1:
35.3 fps, P1:
38.8 fps, max:
89.5 fps
fps
NVIDIA GeForce RTX 3070:
41.7 [X] Desktop-PC Intel Core i9-13900K 3GHz
NVIDIA GeForce RTX 3070
min:
15.5 fps, P0.1:
15.5 fps, P1:
29.4 fps, max:
65.2 fps
fps
NVIDIA GeForce RTX 3060 Ti:
37.3 [X] Nvidia GeForce RTX 3060 Ti FE AMD Ryzen 9 7950X 4.5GHz
NVIDIA GeForce RTX 3060 Ti
min:
17.8 fps, P0.1:
20.2 fps, P1:
24.1 fps, max:
58.7 fps
fps
NVIDIA GeForce RTX 3060 Ti:
391 [X] Nvidia GeForce RTX 3060 Ti FE 1021115
AMD Ryzen 9 7950X 4.5GHz
NVIDIA GeForce RTX 3060 Ti
min:
330 fps, P1:
283 fps, max:
455 fps
fps
NVIDIA GeForce RTX 3070:
366 [X] Desktop-PC Intel Core i9-13900K 3GHz
NVIDIA GeForce RTX 3070
min:
324 fps
fps
NVIDIA GeForce RTX 3060 Ti:
346 [X] Nvidia GeForce RTX 3060 Ti FE 1021115
AMD Ryzen 9 7950X 4.5GHz
NVIDIA GeForce RTX 3060 Ti
min:
301 fps, P1:
276 fps, max:
399 fps
fps
NVIDIA GeForce RTX 3070:
261 [X] Desktop-PC Intel Core i9-13900K 3GHz
NVIDIA GeForce RTX 3070
min:
232 fps
fps
NVIDIA GeForce RTX 3060 Ti:
236 [X] Nvidia GeForce RTX 3060 Ti FE 1021115
AMD Ryzen 9 7950X 4.5GHz
NVIDIA GeForce RTX 3060 Ti
min:
205 fps, P1:
200 fps, max:
263 fps
fps
NVIDIA GeForce RTX 3070:
83 [X] Desktop-PC Intel Core i9-13900K 3GHz
NVIDIA GeForce RTX 3070
min:
66 fps
fps
NVIDIA GeForce RTX 3060 Ti:
72.2 [X] Nvidia GeForce RTX 3060 Ti FE 1021115
AMD Ryzen 9 7950X 4.5GHz
NVIDIA GeForce RTX 3060 Ti
min:
56 fps, P1:
56 fps, max:
84 fps
fps
NVIDIA GeForce RTX 3070:
53 [X] Desktop-PC Intel Core i9-13900K 3GHz
NVIDIA GeForce RTX 3070
min:
41 fps
fps
NVIDIA GeForce RTX 3060 Ti:
45.7 [X] Nvidia GeForce RTX 3060 Ti FE 1021115
AMD Ryzen 9 7950X 4.5GHz
NVIDIA GeForce RTX 3060 Ti
min:
35 fps, P1:
35 fps, max:
54 fps
fps
NVIDIA GeForce RTX 3070:
25 [X] Desktop-PC Intel Core i9-13900K 3GHz
NVIDIA GeForce RTX 3070
min:
19 fps
fps
NVIDIA GeForce RTX 3060 Ti:
21.8 [X] Nvidia GeForce RTX 3060 Ti FE 1021115
AMD Ryzen 9 7950X 4.5GHz
NVIDIA GeForce RTX 3060 Ti
min:
16 fps, P1:
16 fps, max:
25 fps
fps
NVIDIA GeForce RTX 3060 Ti:
38.8 [X] Nvidia GeForce RTX 3060 Ti FE 1021115
AMD Ryzen 9 7950X 4.5GHz
NVIDIA GeForce RTX 3060 Ti
min:
30 fps, P1:
30 fps, max:
45 fps
fps
100%
GeForce RTX 3050 Ti Laptop GPU:
113.1 [X] Asus ROG Flow Z13 GZ301ZE Intel Core i9-12900H 1.8GHz
GeForce RTX 3050 Ti Laptop GPU
min:
44.7 fps, P0.1:
50.5 fps, P1:
76.2 fps, max:
256 fps
fps
285%
NVIDIA GeForce RTX 3060 Ti:
322 [X] Nvidia GeForce RTX 3060 Ti FE AMD Ryzen 9 7950X 4.5GHz
NVIDIA GeForce RTX 3060 Ti
min:
72.4 fps, P0.1:
180 fps, P1:
243 fps, max:
547 fps
fps
100%
GeForce RTX 3050 Ti Laptop GPU:
94.6 [X] Asus ROG Flow Z13 GZ301ZE Intel Core i9-12900H 1.8GHz
GeForce RTX 3050 Ti Laptop GPU
min:
26.8 fps, P0.1:
30.4 fps, P1:
52.9 fps, max:
286 fps
fps
289%
NVIDIA GeForce RTX 3060 Ti:
273 [X] Nvidia GeForce RTX 3060 Ti FE AMD Ryzen 9 7950X 4.5GHz
NVIDIA GeForce RTX 3060 Ti
min:
67.3 fps, P0.1:
147.5 fps, P1:
204 fps, max:
577 fps
fps
100%
GeForce RTX 3050 Ti Laptop GPU:
83.8 [X] Asus ROG Flow Z13 GZ301ZE Intel Core i9-12900H 1.8GHz
GeForce RTX 3050 Ti Laptop GPU
min:
30.5 fps, P0.1:
37.3 fps, P1:
52 fps, max:
211 fps
fps
289%
NVIDIA GeForce RTX 3060 Ti:
242 [X] Nvidia GeForce RTX 3060 Ti FE AMD Ryzen 9 7950X 4.5GHz
NVIDIA GeForce RTX 3060 Ti
min:
65.2 fps, P0.1:
136.7 fps, P1:
177.3 fps, max:
570 fps
fps
100%
GeForce RTX 3050 Ti Laptop GPU:
68.8 [X] Asus ROG Flow Z13 GZ301ZE Intel Core i9-12900H 1.8GHz
GeForce RTX 3050 Ti Laptop GPU
min:
11 fps, P0.1:
14 fps, P1:
38.1 fps, max:
311 fps
fps
292%
NVIDIA GeForce RTX 3060 Ti:
201 [X] Nvidia GeForce RTX 3060 Ti FE AMD Ryzen 9 7950X 4.5GHz
NVIDIA GeForce RTX 3060 Ti
min:
83.9 fps, P0.1:
121 fps, P1:
148.6 fps, max:
566 fps
fps
NVIDIA GeForce RTX 3060 Ti:
126 [X] Nvidia GeForce RTX 3060 Ti FE AMD Ryzen 9 7950X 4.5GHz
NVIDIA GeForce RTX 3060 Ti
min:
16.2 fps, P0.1:
35.7 fps, P1:
88.1 fps, max:
359 fps
fps
NVIDIA GeForce RTX 3060 Ti:
69.7 [X] Nvidia GeForce RTX 3060 Ti FE AMD Ryzen 9 7950X 4.5GHz
NVIDIA GeForce RTX 3060 Ti
min:
21.3 fps, P0.1:
25.7 fps, P1:
54.9 fps, max:
98.6 fps
fps
100%
GeForce RTX 3050 Ti Laptop GPU:
36.9 [X] Asus VivoBook Pro 16 Intel Core i7-12700H 1.7GHz
GeForce RTX 3050 Ti Laptop GPU
min:
19.4 fps, P0.1:
21.8 fps, P1:
24.9 fps, max:
71.1 fps
fps
273%
NVIDIA GeForce RTX 3060 Ti:
100.7 [X] Nvidia GeForce RTX 3060 Ti FE AMD Ryzen 9 7950X 4.5GHz
NVIDIA GeForce RTX 3060 Ti
min:
33.9 fps, P0.1:
44.2 fps, P1:
71.5 fps, max:
179.3 fps
fps
100%
GeForce RTX 3050 Ti Laptop GPU:
31 [X] Asus VivoBook Pro 16 Intel Core i7-12700H 1.7GHz
GeForce RTX 3050 Ti Laptop GPU
min:
6.19 fps, P0.1:
7.05 fps, P1:
15.3 fps, max:
91.5 fps
fps
265%
NVIDIA GeForce RTX 3060 Ti:
82 [X] Nvidia GeForce RTX 3060 Ti FE AMD Ryzen 9 7950X 4.5GHz
NVIDIA GeForce RTX 3060 Ti
min:
28.1 fps, P0.1:
39 fps, P1:
61 fps, max:
155.6 fps
fps
100%
GeForce RTX 3050 Ti Laptop GPU:
28.9 [X] Asus VivoBook Pro 16 Intel Core i7-12700H 1.7GHz
GeForce RTX 3050 Ti Laptop GPU
min:
8.73 fps, P0.1:
10.6 fps, P1:
15.9 fps, max:
84.1 fps
fps
302%
NVIDIA GeForce RTX 3060 Ti:
87.4 [X] Nvidia GeForce RTX 3060 Ti FE AMD Ryzen 9 7950X 4.5GHz
NVIDIA GeForce RTX 3060 Ti
min:
30.8 fps, P0.1:
44.8 fps, P1:
64.8 fps, max:
163.7 fps
fps
100%
GeForce RTX 3050 Ti Laptop GPU:
25.8 [X] Asus VivoBook Pro 16 Intel Core i7-12700H 1.7GHz
GeForce RTX 3050 Ti Laptop GPU
min:
5.53 fps, P0.1:
6.75 fps, P1:
12.9 fps, max:
79.3 fps
fps
302%
NVIDIA GeForce RTX 3060 Ti:
78 [X] Nvidia GeForce RTX 3060 Ti FE AMD Ryzen 9 7950X 4.5GHz
NVIDIA GeForce RTX 3060 Ti
min:
22.6 fps, P0.1:
36.6 fps, P1:
57.6 fps, max:
138.8 fps
fps
100%
GeForce RTX 3050 Ti Laptop GPU:
15.4 [X] Asus VivoBook Pro 16 Intel Core i7-12700H 1.7GHz
GeForce RTX 3050 Ti Laptop GPU
min:
6.16 fps, P0.1:
6.5 fps, P1:
10.1 fps, max:
35 fps
fps
318%
NVIDIA GeForce RTX 3060 Ti:
49 [X] Nvidia GeForce RTX 3060 Ti FE AMD Ryzen 9 7950X 4.5GHz
NVIDIA GeForce RTX 3060 Ti
min:
18.7 fps, P0.1:
28.7 fps, P1:
37.8 fps, max:
120.7 fps
fps
NVIDIA GeForce RTX 3060 Ti:
23.8 [X] Nvidia GeForce RTX 3060 Ti FE AMD Ryzen 9 7950X 4.5GHz
NVIDIA GeForce RTX 3060 Ti
min:
16.4 fps, P0.1:
16.5 fps, P1:
17.6 fps, max:
33.6 fps
fps
100%
GeForce RTX 3050 Ti Laptop GPU:
95.7 [X] Asus VivoBook Pro 16 Intel Core i7-12700H 1.7GHz
GeForce RTX 3050 Ti Laptop GPU
min:
19.7 fps, P0.1:
29.2 fps, P1:
62.2 fps, max:
209 fps
fps
340%
NVIDIA GeForce RTX 3060 Ti:
325 [X] Nvidia GeForce RTX 3060 Ti FE AMD Ryzen 9 7950X 4.5GHz
NVIDIA GeForce RTX 3060 Ti
min:
77.7 fps, P0.1:
163.6 fps, P1:
215 fps, max:
477 fps
fps
100%
GeForce RTX 3050 Ti Laptop GPU:
75.7 [X] Asus VivoBook Pro 16 Intel Core i7-12700H 1.7GHz
GeForce RTX 3050 Ti Laptop GPU
min:
8.59 fps, P0.1:
15.4 fps, P1:
36.6 fps, max:
177.8 fps
fps
375%
NVIDIA GeForce RTX 3060 Ti:
284 [X] Nvidia GeForce RTX 3060 Ti FE AMD Ryzen 9 7950X 4.5GHz
NVIDIA GeForce RTX 3060 Ti
min:
29.4 fps, P0.1:
161.8 fps, P1:
180.3 fps, max:
460 fps
fps
100%
GeForce RTX 3050 Ti Laptop GPU:
64.1 [X] Asus VivoBook Pro 16 Intel Core i7-12700H 1.7GHz
GeForce RTX 3050 Ti Laptop GPU
min:
10.3 fps, P0.1:
16.5 fps, P1:
28.8 fps, max:
143.4 fps
fps
328%
NVIDIA GeForce RTX 3060 Ti:
210 [X] Nvidia GeForce RTX 3060 Ti FE AMD Ryzen 9 7950X 4.5GHz
NVIDIA GeForce RTX 3060 Ti
min:
93.7 fps, P0.1:
124.8 fps, P1:
141.6 fps, max:
372 fps
fps
100%
GeForce RTX 3050 Ti Laptop GPU:
58 [X] Asus VivoBook Pro 16 Intel Core i7-12700H 1.7GHz
GeForce RTX 3050 Ti Laptop GPU
min:
11.8 fps, P0.1:
14.4 fps, P1:
19.5 fps, max:
135.8 fps
fps
274%
NVIDIA GeForce RTX 3060 Ti:
159.1 [X] Nvidia GeForce RTX 3060 Ti FE AMD Ryzen 9 7950X 4.5GHz
NVIDIA GeForce RTX 3060 Ti
min:
24.1 fps, P0.1:
31.2 fps, P1:
103.9 fps, max:
346 fps
fps
100%
GeForce RTX 3050 Ti Laptop GPU:
45.9 [X] Asus VivoBook Pro 16 Intel Core i7-12700H 1.7GHz
GeForce RTX 3050 Ti Laptop GPU
min:
23.6 fps, P0.1:
23.8 fps, P1:
29.5 fps, max:
134.4 fps
fps
238%
NVIDIA GeForce RTX 3060 Ti:
109.1 [X] Nvidia GeForce RTX 3060 Ti FE AMD Ryzen 9 7950X 4.5GHz
NVIDIA GeForce RTX 3060 Ti
min:
61.2 fps, P0.1:
64.8 fps, P1:
70.1 fps, max:
307 fps
fps
NVIDIA GeForce RTX 3060 Ti:
55.1 [X] Nvidia GeForce RTX 3060 Ti FE AMD Ryzen 9 7950X 4.5GHz
NVIDIA GeForce RTX 3060 Ti
min:
20.6 fps, P0.1:
25.1 fps, P1:
31.7 fps, max:
289 fps
fps
100%
GeForce RTX 3050 Ti Laptop GPU:
44.9 [X] Asus VivoBook Pro 16 Intel Core i7-12700H 1.7GHz
GeForce RTX 3050 Ti Laptop GPU
min:
26.5 fps, P0.1:
30 fps, P1:
35.1 fps, max:
70.7 fps
fps
282%
NVIDIA GeForce RTX 3070:
126.7 [X] Desktop-PC Intel Core i9-12900K 3.2GHz
NVIDIA GeForce RTX 3070
min:
57.3 fps, P0.1:
70.1 fps, P1:
91.6 fps, max:
182.6 fps
fps
265%
NVIDIA GeForce RTX 3060 Ti:
119.1 [X] Nvidia GeForce RTX 3060 Ti FE AMD Ryzen 9 7950X 4.5GHz
NVIDIA GeForce RTX 3060 Ti
min:
67.4 fps, P0.1:
77.9 fps, P1:
99.4 fps, max:
161.1 fps
fps
100%
GeForce RTX 3050 Ti Laptop GPU:
32.9 [X] Asus VivoBook Pro 16 Intel Core i7-12700H 1.7GHz
GeForce RTX 3050 Ti Laptop GPU
min:
1.493 fps, P0.1:
17.5 fps, P1:
26.4 fps, max:
53.6 fps
fps
326%
NVIDIA GeForce RTX 3070:
107.2 [X] Desktop-PC Intel Core i9-12900K 3.2GHz
NVIDIA GeForce RTX 3070
min:
58 fps, P0.1:
67.5 fps, P1:
84.7 fps, max:
150.8 fps
fps
292%
NVIDIA GeForce RTX 3060 Ti:
96.2 [X] Nvidia GeForce RTX 3060 Ti FE AMD Ryzen 9 7950X 4.5GHz
NVIDIA GeForce RTX 3060 Ti
min:
55.9 fps, P0.1:
68.2 fps, P1:
81.6 fps, max:
129.1 fps
fps
100%
GeForce RTX 3050 Ti Laptop GPU:
25.6 [X] Asus VivoBook Pro 16 Intel Core i7-12700H 1.7GHz
GeForce RTX 3050 Ti Laptop GPU
min:
1.341 fps, P0.1:
17.3 fps, P1:
19.1 fps, max:
43 fps
fps
381%
NVIDIA GeForce RTX 3070:
97.5 [X] Desktop-PC Intel Core i9-12900K 3.2GHz
NVIDIA GeForce RTX 3070
min:
52.9 fps, P0.1:
71.2 fps, P1:
81.7 fps, max:
136.6 fps
fps
340%
NVIDIA GeForce RTX 3060 Ti:
87 [X] Nvidia GeForce RTX 3060 Ti FE AMD Ryzen 9 7950X 4.5GHz
NVIDIA GeForce RTX 3060 Ti
min:
54.7 fps, P0.1:
63.2 fps, P1:
74.4 fps, max:
116.8 fps
fps
NVIDIA GeForce RTX 3070:
79.1 [X] Desktop-PC Intel Core i9-12900K 3.2GHz
NVIDIA GeForce RTX 3070
min:
8.14 fps, P0.1:
20.6 fps, P1:
60.2 fps, max:
120.7 fps
fps
NVIDIA GeForce RTX 3060 Ti:
66.1 [X] Nvidia GeForce RTX 3060 Ti FE AMD Ryzen 9 7950X 4.5GHz
NVIDIA GeForce RTX 3060 Ti
min:
3.1 fps, P0.1:
8.2 fps, P1:
44.8 fps, max:
96.1 fps
fps
NVIDIA GeForce RTX 3070:
48.8 [X] Desktop-PC Intel Core i9-12900K 3.2GHz
NVIDIA GeForce RTX 3070
min:
14.5 fps, P0.1:
18.5 fps, P1:
33.1 fps, max:
78.4 fps
fps
NVIDIA GeForce RTX 3060 Ti:
40.2 [X] Nvidia GeForce RTX 3060 Ti FE AMD Ryzen 9 7950X 4.5GHz
NVIDIA GeForce RTX 3060 Ti
min:
1.797 fps, P0.1:
13.1 fps, P1:
27.1 fps, max:
61 fps
fps
NVIDIA GeForce RTX 3070:
21.6 [X] Desktop-PC Intel Core i9-12900K 3.2GHz
NVIDIA GeForce RTX 3070
min:
3.55 fps, P0.1:
3.78 fps, P1:
6.25 fps, max:
36.1 fps
fps
NVIDIA GeForce RTX 3060 Ti:
13.9 [X] Nvidia GeForce RTX 3060 Ti FE AMD Ryzen 9 7950X 4.5GHz
NVIDIA GeForce RTX 3060 Ti
min:
1.219 fps, P0.1:
1.416 fps, P1:
1.867 fps, max:
29.1 fps
fps
NVIDIA GeForce RTX 3070:
37.9 [X] Desktop-PC Intel Core i9-12900K 3.2GHz
NVIDIA GeForce RTX 3070
min:
12.2 fps, P0.1:
13.9 fps, P1:
25.2 fps, max:
63.4 fps
fps
NVIDIA GeForce RTX 3060 Ti:
5.5 [X] Nvidia GeForce RTX 3060 Ti FE AMD Ryzen 9 7950X 4.5GHz
NVIDIA GeForce RTX 3060 Ti
min:
1.527 fps, P0.1:
1.772 fps, P1:
2.87 fps, max:
12.8 fps
fps
100%
GeForce RTX 3050 Ti Laptop GPU:
74.6 [X] Asus VivoBook Pro 16 Intel Core i7-12700H 1.7GHz
GeForce RTX 3050 Ti Laptop GPU
min:
2.02 fps, P0.1:
4.69 fps, P1:
46.5 fps, max:
137.5 fps
fps
265%
NVIDIA GeForce RTX 3070:
197.8 [X] Desktop-PC Intel Core i9-12900K 3.2GHz
NVIDIA GeForce RTX 3070
min:
35.6 fps, P0.1:
120.2 fps, P1:
170.5 fps, max:
265 fps
fps
230%
NVIDIA GeForce RTX 3060 Ti:
171.9 [X] Nvidia GeForce RTX 3060 Ti FE AMD Ryzen 9 7950X 4.5GHz
NVIDIA GeForce RTX 3060 Ti
min:
17.5 fps, P0.1:
95.7 fps, P1:
148.3 fps, max:
267 fps
fps
100%
GeForce RTX 3050 Ti Laptop GPU:
47.4 [X] Asus VivoBook Pro 16 Intel Core i7-12700H 1.7GHz
GeForce RTX 3050 Ti Laptop GPU
min:
16.8 fps, P0.1:
31.5 fps, P1:
35.9 fps, max:
85.3 fps
fps
293%
NVIDIA GeForce RTX 3070:
138.9 [X] Desktop-PC Intel Core i9-12900K 3.2GHz
NVIDIA GeForce RTX 3070
min:
36.1 fps, P0.1:
95.6 fps, P1:
118 fps, max:
197 fps
fps
303%
NVIDIA GeForce RTX 3060 Ti:
143.4 [X] Nvidia GeForce RTX 3060 Ti FE AMD Ryzen 9 7950X 4.5GHz
NVIDIA GeForce RTX 3060 Ti
min:
36 fps, P0.1:
94 fps, P1:
120 fps, max:
189.7 fps
fps
100%
GeForce RTX 3050 Ti Laptop GPU:
41 [X] Asus VivoBook Pro 16 Intel Core i7-12700H 1.7GHz
GeForce RTX 3050 Ti Laptop GPU
min:
11 fps, P0.1:
15.7 fps, P1:
28.4 fps, max:
64.7 fps
fps
316%
NVIDIA GeForce RTX 3070:
129.4 [X] Desktop-PC Intel Core i9-12900K 3.2GHz
NVIDIA GeForce RTX 3070
min:
40.7 fps, P0.1:
82.1 fps, P1:
109.6 fps, max:
187.9 fps
fps
296%
NVIDIA GeForce RTX 3060 Ti:
121.4 [X] Nvidia GeForce RTX 3060 Ti FE AMD Ryzen 9 7950X 4.5GHz
NVIDIA GeForce RTX 3060 Ti
min:
35.7 fps, P0.1:
59.5 fps, P1:
105.8 fps, max:
225 fps
fps
100%
GeForce RTX 3050 Ti Laptop GPU:
9 [X] Asus VivoBook Pro 16 Intel Core i7-12700H 1.7GHz
GeForce RTX 3050 Ti Laptop GPU
min:
5.12 fps, P0.1:
5.38 fps, P1:
6.07 fps, max:
18.7 fps
fps
1059%
NVIDIA GeForce RTX 3070:
95 [X] Desktop-PC Intel Core i9-12900K 3.2GHz
NVIDIA GeForce RTX 3070
min:
33.5 fps, P0.1:
50.2 fps, P1:
70.5 fps, max:
117.7 fps
fps
100%
GeForce RTX 3050 Ti Laptop GPU:
7.8 [X] Asus VivoBook Pro 16 Intel Core i7-12700H 1.7GHz
GeForce RTX 3050 Ti Laptop GPU
min:
3.67 fps, P0.1:
3.79 fps, P1:
5.06 fps, max:
12.8 fps
fps
913%
NVIDIA GeForce RTX 3070:
71.4 [X] Desktop-PC Intel Core i9-12900K 3.2GHz
NVIDIA GeForce RTX 3070
min:
21.5 fps, P0.1:
43 fps, P1:
55.1 fps, max:
89.6 fps
fps
100%
GeForce RTX 3050 Ti Laptop GPU:
106.2 fps
236%
NVIDIA GeForce RTX 3060 Ti:
251.1 [X] Nvidia GeForce RTX 3060 Ti FE AMD Ryzen 9 7950X 4.5GHz
NVIDIA GeForce RTX 3060 Ti
fps
100%
GeForce RTX 3050 Ti Laptop GPU:
91.1 fps
257%
NVIDIA GeForce RTX 3070:
234 [X] Desktop-PC Intel Core i9-12900K 3.2GHz
NVIDIA GeForce RTX 3070
min:
62 fps
fps
238%
NVIDIA GeForce RTX 3060 Ti:
217.1 [X] Nvidia GeForce RTX 3060 Ti FE AMD Ryzen 9 7950X 4.5GHz
NVIDIA GeForce RTX 3060 Ti
fps
100%
GeForce RTX 3050 Ti Laptop GPU:
68.4 fps
265%
NVIDIA GeForce RTX 3070:
181 [X] Desktop-PC Intel Core i9-12900K 3.2GHz
NVIDIA GeForce RTX 3070
min:
75 fps
fps
233%
NVIDIA GeForce RTX 3060 Ti:
159.7 [X] Nvidia GeForce RTX 3060 Ti FE AMD Ryzen 9 7950X 4.5GHz
NVIDIA GeForce RTX 3060 Ti
fps
100%
GeForce RTX 3050 Ti Laptop GPU:
68.5 fps
261%
NVIDIA GeForce RTX 3070:
179 [X] Desktop-PC Intel Core i9-12900K 3.2GHz
NVIDIA GeForce RTX 3070
min:
69 fps
fps
231%
NVIDIA GeForce RTX 3060 Ti:
158.4 [X] Nvidia GeForce RTX 3060 Ti FE AMD Ryzen 9 7950X 4.5GHz
NVIDIA GeForce RTX 3060 Ti
fps
100%
GeForce RTX 3050 Ti Laptop GPU:
48.8 fps
277%
NVIDIA GeForce RTX 3070:
135 [X] Desktop-PC Intel Core i9-12900K 3.2GHz
NVIDIA GeForce RTX 3070
min:
69 fps
fps
246%
NVIDIA GeForce RTX 3060 Ti:
120 [X] Nvidia GeForce RTX 3060 Ti FE AMD Ryzen 9 7950X 4.5GHz
NVIDIA GeForce RTX 3060 Ti
fps
NVIDIA GeForce RTX 3070:
76.9 [X] Desktop-PC Intel Core i9-12900K 3.2GHz
NVIDIA GeForce RTX 3070
min:
41 fps
fps
NVIDIA GeForce RTX 3060 Ti:
70.5 [X] Nvidia GeForce RTX 3060 Ti FE AMD Ryzen 9 7950X 4.5GHz
NVIDIA GeForce RTX 3060 Ti
fps
100%
GeForce RTX 3050 Ti Laptop GPU:
54.9 [X] Asus VivoBook Pro 16 Intel Core i7-12700H 1.7GHz
GeForce RTX 3050 Ti Laptop GPU
min:
12.3 fps, P0.1:
17.7 fps, P1:
20.9 fps, max:
91.6 fps
fps
209%
NVIDIA GeForce RTX 3070:
114.7 [X] Desktop-PC Intel Core i9-12900K 3.2GHz
NVIDIA GeForce RTX 3070
min:
47 fps, P0.1:
57.8 fps, P1:
85.7 fps, max:
158.1 fps
fps
225%
NVIDIA GeForce RTX 3060 Ti:
123.7 [X] Nvidia GeForce RTX 3060 Ti FE AMD Ryzen 9 7950X 4.5GHz
NVIDIA GeForce RTX 3060 Ti
min:
55.3 fps, P0.1:
79 fps, P1:
91.4 fps, max:
196.6 fps
fps
100%
GeForce RTX 3050 Ti Laptop GPU:
38.8 [X] Asus VivoBook Pro 16 Intel Core i7-12700H 1.7GHz
GeForce RTX 3050 Ti Laptop GPU
min:
4.42 fps, P0.1:
7.25 fps, P1:
17.8 fps, max:
67.5 fps
fps
269%
NVIDIA GeForce RTX 3070:
104.4 [X] Desktop-PC Intel Core i9-12900K 3.2GHz
NVIDIA GeForce RTX 3070
min:
51.6 fps, P0.1:
63.1 fps, P1:
75.9 fps, max:
169.8 fps
fps
262%
NVIDIA GeForce RTX 3060 Ti:
101.5 [X] Nvidia GeForce RTX 3060 Ti FE AMD Ryzen 9 7950X 4.5GHz
NVIDIA GeForce RTX 3060 Ti
min:
50.2 fps, P0.1:
58.6 fps, P1:
75.4 fps, max:
154.8 fps
fps
100%
GeForce RTX 3050 Ti Laptop GPU:
35.4 [X] Asus VivoBook Pro 16 Intel Core i7-12700H 1.7GHz
GeForce RTX 3050 Ti Laptop GPU
min:
10.1 fps, P0.1:
12.2 fps, P1:
18.5 fps, max:
75.7 fps
fps
292%
NVIDIA GeForce RTX 3070:
103.3 [X] Desktop-PC Intel Core i9-12900K 3.2GHz
NVIDIA GeForce RTX 3070
min:
47 fps, P0.1:
69.7 fps, P1:
76.1 fps, max:
144.8 fps
fps
269%
NVIDIA GeForce RTX 3060 Ti:
95.1 [X] Nvidia GeForce RTX 3060 Ti FE AMD Ryzen 9 7950X 4.5GHz
NVIDIA GeForce RTX 3060 Ti
min:
61.9 fps, P0.1:
65.5 fps, P1:
70.7 fps, max:
148.4 fps
fps
100%
GeForce RTX 3050 Ti Laptop GPU:
33.3 [X] Asus VivoBook Pro 16 Intel Core i7-12700H 1.7GHz
GeForce RTX 3050 Ti Laptop GPU
min:
6.24 fps, P0.1:
12.9 fps, P1:
17 fps, max:
57.1 fps
fps
306%
NVIDIA GeForce RTX 3070:
102 [X] Desktop-PC Intel Core i9-12900K 3.2GHz
NVIDIA GeForce RTX 3070
min:
37.4 fps, P0.1:
57.8 fps, P1:
70.5 fps, max:
148 fps
fps
283%
NVIDIA GeForce RTX 3060 Ti:
94.1 [X] Nvidia GeForce RTX 3060 Ti FE AMD Ryzen 9 7950X 4.5GHz
NVIDIA GeForce RTX 3060 Ti
min:
30.4 fps, P0.1:
67.5 fps, P1:
70.3 fps, max:
142.2 fps
fps
100%
GeForce RTX 3050 Ti Laptop GPU:
25.6 [X] Asus VivoBook Pro 16 Intel Core i7-12700H 1.7GHz
GeForce RTX 3050 Ti Laptop GPU
min:
10.6 fps, P0.1:
13.2 fps, P1:
15.4 fps, max:
47.8 fps
fps
321%
NVIDIA GeForce RTX 3070:
82.3 [X] Desktop-PC Intel Core i9-12900K 3.2GHz
NVIDIA GeForce RTX 3070
min:
45.7 fps, P0.1:
54.5 fps, P1:
61.1 fps, max:
123.6 fps
fps
288%
NVIDIA GeForce RTX 3060 Ti:
73.7 [X] Nvidia GeForce RTX 3060 Ti FE AMD Ryzen 9 7950X 4.5GHz
NVIDIA GeForce RTX 3060 Ti
min:
49.4 fps, P0.1:
55.6 fps, P1:
58.6 fps, max:
127.5 fps
fps
NVIDIA GeForce RTX 3070:
50.5 [X] Desktop-PC Intel Core i9-12900K 3.2GHz
NVIDIA GeForce RTX 3070
min:
33.1 fps, P0.1:
35.4 fps, P1:
40.7 fps, max:
97.9 fps
fps
NVIDIA GeForce RTX 3060 Ti:
45.1 [X] Nvidia GeForce RTX 3060 Ti FE AMD Ryzen 9 7950X 4.5GHz
NVIDIA GeForce RTX 3060 Ti
min:
29.2 fps, P0.1:
35 fps, P1:
37.2 fps, max:
56.2 fps
fps
100%
GeForce RTX 3050 Ti Laptop GPU:
94.3 [X] Asus VivoBook Pro 16 Intel Core i7-12700H 1.7GHz
GeForce RTX 3050 Ti Laptop GPU
min:
55.1 fps, P0.1:
64.8 fps, P1:
72.9 fps, max:
151.3 fps
fps
279%
NVIDIA GeForce RTX 3070:
263 [X] Desktop-PC Intel Core i9-12900K 3.2GHz
NVIDIA GeForce RTX 3070
min:
95.3 fps, P0.1:
185.8 fps, P1:
211 fps, max:
346 fps
fps
250%
NVIDIA GeForce RTX 3060 Ti:
236 [X] Nvidia GeForce RTX 3060 Ti FE AMD Ryzen 9 7950X 4.5GHz
NVIDIA GeForce RTX 3060 Ti
min:
75.4 fps, P0.1:
161 fps, P1:
197.6 fps, max:
325 fps
fps
100%
GeForce RTX 3050 Ti Laptop GPU:
71.4 [X] Asus VivoBook Pro 16 Intel Core i7-12700H 1.7GHz
GeForce RTX 3050 Ti Laptop GPU
min:
26 fps, P0.1:
50.9 fps, P1:
56.1 fps, max:
109.7 fps
fps
274%
NVIDIA GeForce RTX 3070:
195.9 [X] Desktop-PC Intel Core i9-12900K 3.2GHz
NVIDIA GeForce RTX 3070
min:
113.3 fps, P0.1:
145.6 fps, P1:
161.5 fps, max:
276 fps
fps
252%
NVIDIA GeForce RTX 3060 Ti:
179.7 [X] Nvidia GeForce RTX 3060 Ti FE AMD Ryzen 9 7950X 4.5GHz
NVIDIA GeForce RTX 3060 Ti
min:
12.9 fps, P0.1:
126.5 fps, P1:
154.4 fps, max:
272 fps
fps
100%
GeForce RTX 3050 Ti Laptop GPU:
41.6 [X] Asus VivoBook Pro 16 Intel Core i7-12700H 1.7GHz
GeForce RTX 3050 Ti Laptop GPU
min:
8.93 fps, P0.1:
31.7 fps, P1:
34.8 fps, max:
74.5 fps
fps
271%
NVIDIA GeForce RTX 3070:
112.9 [X] Desktop-PC Intel Core i9-12900K 3.2GHz
NVIDIA GeForce RTX 3070
min:
69.7 fps, P0.1:
92.3 fps, P1:
97.4 fps, max:
160.9 fps
fps
248%
NVIDIA GeForce RTX 3060 Ti:
103.1 [X] Nvidia GeForce RTX 3060 Ti FE AMD Ryzen 9 7950X 4.5GHz
NVIDIA GeForce RTX 3060 Ti
min:
51.7 fps, P0.1:
86 fps, P1:
92.3 fps, max:
169.5 fps
fps
100%
GeForce RTX 3050 Ti Laptop GPU:
32.3 [X] Asus VivoBook Pro 16 Intel Core i7-12700H 1.7GHz
GeForce RTX 3050 Ti Laptop GPU
min:
10.5 fps, P0.1:
26 fps, P1:
27.1 fps, max:
86.3 fps
fps
284%
NVIDIA GeForce RTX 3070:
91.7 [X] Desktop-PC Intel Core i9-12900K 3.2GHz
NVIDIA GeForce RTX 3070
min:
69.3 fps, P0.1:
73.4 fps, P1:
78.7 fps, max:
129.2 fps
fps
255%
NVIDIA GeForce RTX 3060 Ti:
82.4 [X] Nvidia GeForce RTX 3060 Ti FE AMD Ryzen 9 7950X 4.5GHz
NVIDIA GeForce RTX 3060 Ti
min:
54.3 fps, P0.1:
71.3 fps, P1:
73.2 fps, max:
149.1 fps
fps
100%
GeForce RTX 3050 Ti Laptop GPU:
24.5 [X] Asus VivoBook Pro 16 Intel Core i7-12700H 1.7GHz
GeForce RTX 3050 Ti Laptop GPU
min:
19.3 fps, P0.1:
19.7 fps, P1:
20.8 fps, max:
32.3 fps
fps
292%
NVIDIA GeForce RTX 3070:
71.6 [X] Desktop-PC Intel Core i9-12900K 3.2GHz
NVIDIA GeForce RTX 3070
min:
58.8 fps, P0.1:
60.3 fps, P1:
62.5 fps, max:
87.5 fps
fps
260%
NVIDIA GeForce RTX 3060 Ti:
63.6 [X] Nvidia GeForce RTX 3060 Ti FE AMD Ryzen 9 7950X 4.5GHz
NVIDIA GeForce RTX 3060 Ti
min:
51.1 fps, P0.1:
55.7 fps, P1:
57.2 fps, max:
84.9 fps
fps
NVIDIA GeForce RTX 3070:
43.8 [X] Desktop-PC Intel Core i9-12900K 3.2GHz
NVIDIA GeForce RTX 3070
min:
37.5 fps, P0.1:
38.2 fps, P1:
39.8 fps, max:
53.2 fps
fps
NVIDIA GeForce RTX 3060 Ti:
38.4 [X] Nvidia GeForce RTX 3060 Ti FE AMD Ryzen 9 7950X 4.5GHz
NVIDIA GeForce RTX 3060 Ti
min:
33.8 fps, P0.1:
34.6 fps, P1:
35.3 fps, max:
43.6 fps
fps
100%
GeForce RTX 3050 Ti Laptop GPU:
52 fps
229%
NVIDIA GeForce RTX 3060 Ti:
119 [X] Nvidia GeForce RTX 3060 Ti FE AMD Ryzen 9 7950X 4.5GHz
NVIDIA GeForce RTX 3060 Ti
fps
100%
GeForce RTX 3050 Ti Laptop GPU:
50 fps
254%
NVIDIA GeForce RTX 3070:
127 [X] Desktop-PC Intel Core i9-12900K 3.2GHz
NVIDIA GeForce RTX 3070
min:
65 fps
fps
230%
NVIDIA GeForce RTX 3060 Ti:
115 [X] Nvidia GeForce RTX 3060 Ti FE AMD Ryzen 9 7950X 4.5GHz
NVIDIA GeForce RTX 3060 Ti
fps
100%
GeForce RTX 3050 Ti Laptop GPU:
45 fps
260%
NVIDIA GeForce RTX 3070:
117 [X] Desktop-PC Intel Core i9-12900K 3.2GHz
NVIDIA GeForce RTX 3070
min:
56 fps
fps
233%
NVIDIA GeForce RTX 3060 Ti:
105 [X] Nvidia GeForce RTX 3060 Ti FE AMD Ryzen 9 7950X 4.5GHz
NVIDIA GeForce RTX 3060 Ti
fps
100%
GeForce RTX 3050 Ti Laptop GPU:
34 fps
300%
NVIDIA GeForce RTX 3070:
102 [X] Desktop-PC Intel Core i9-12900K 3.2GHz
NVIDIA GeForce RTX 3070
min:
53 fps
fps
271%
NVIDIA GeForce RTX 3060 Ti:
92 [X] Nvidia GeForce RTX 3060 Ti FE AMD Ryzen 9 7950X 4.5GHz
NVIDIA GeForce RTX 3060 Ti
fps
100%
GeForce RTX 3050 Ti Laptop GPU:
27 fps
289%
NVIDIA GeForce RTX 3070:
78 [X] Desktop-PC Intel Core i9-12900K 3.2GHz
NVIDIA GeForce RTX 3070
min:
40 fps
fps
256%
NVIDIA GeForce RTX 3060 Ti:
69 [X] Nvidia GeForce RTX 3060 Ti FE AMD Ryzen 9 7950X 4.5GHz
NVIDIA GeForce RTX 3060 Ti
fps
NVIDIA GeForce RTX 3070:
46 [X] Desktop-PC Intel Core i9-12900K 3.2GHz
NVIDIA GeForce RTX 3070
min:
29 fps
fps
NVIDIA GeForce RTX 3060 Ti:
40 [X] Nvidia GeForce RTX 3060 Ti FE AMD Ryzen 9 7950X 4.5GHz
NVIDIA GeForce RTX 3060 Ti
fps
100%
GeForce RTX 3050 Ti Laptop GPU:
63.9 [X] Asus VivoBook Pro 16 Intel Core i7-12700H 1.7GHz
GeForce RTX 3050 Ti Laptop GPU
min:
25.3 fps, P0.1:
26 fps, P1:
37.2 fps, max:
98.1 fps
fps
244%
NVIDIA GeForce RTX 3060 Ti:
156.2 [X] Nvidia GeForce RTX 3060 Ti FE AMD Ryzen 9 7950X 4.5GHz
NVIDIA GeForce RTX 3060 Ti
min:
51.6 fps, P0.1:
94.7 fps, P1:
122.9 fps, max:
202 fps
fps
100%
GeForce RTX 3050 Ti Laptop GPU:
50 [X] Asus VivoBook Pro 16 Intel Core i7-12700H 1.7GHz
GeForce RTX 3050 Ti Laptop GPU
min:
5.89 fps, P0.1:
13.7 fps, P1:
28.7 fps, max:
87.2 fps
fps
250%
NVIDIA GeForce RTX 3070:
125.2 [X] Desktop-PC Intel Core i9-12900K 3.2GHz
NVIDIA GeForce RTX 3070
min:
41.3 fps, P0.1:
57 fps, P1:
83.7 fps, max:
174.2 fps
fps
253%
NVIDIA GeForce RTX 3060 Ti:
126.5 [X] Nvidia GeForce RTX 3060 Ti FE AMD Ryzen 9 7950X 4.5GHz
NVIDIA GeForce RTX 3060 Ti
min:
49.8 fps, P0.1:
53.7 fps, P1:
83.7 fps, max:
173.8 fps
fps
100%
GeForce RTX 3050 Ti Laptop GPU:
40.2 [X] Asus VivoBook Pro 16 Intel Core i7-12700H 1.7GHz
GeForce RTX 3050 Ti Laptop GPU
min:
19.1 fps, P0.1:
19.3 fps, P1:
23.5 fps, max:
71.6 fps
fps
260%
NVIDIA GeForce RTX 3070:
104.6 [X] Desktop-PC Intel Core i9-12900K 3.2GHz
NVIDIA GeForce RTX 3070
min:
47.4 fps, P0.1:
51.4 fps, P1:
73.2 fps, max:
158.6 fps
fps
247%
NVIDIA GeForce RTX 3060 Ti:
99.3 [X] Nvidia GeForce RTX 3060 Ti FE AMD Ryzen 9 7950X 4.5GHz
NVIDIA GeForce RTX 3060 Ti
min:
32.3 fps, P0.1:
63.7 fps, P1:
76.8 fps, max:
143.2 fps
fps
100%
GeForce RTX 3050 Ti Laptop GPU:
32.8 [X] Asus VivoBook Pro 16 Intel Core i7-12700H 1.7GHz
GeForce RTX 3050 Ti Laptop GPU
min:
12.8 fps, P0.1:
14.3 fps, P1:
18.5 fps, max:
66.5 fps
fps
247%
NVIDIA GeForce RTX 3070:
80.9 [X] Desktop-PC Intel Core i9-12900K 3.2GHz
NVIDIA GeForce RTX 3070
min:
25.7 fps, P0.1:
34.3 fps, P1:
52.7 fps, max:
154.1 fps
fps
245%
NVIDIA GeForce RTX 3060 Ti:
80.5 [X] Nvidia GeForce RTX 3060 Ti FE AMD Ryzen 9 7950X 4.5GHz
NVIDIA GeForce RTX 3060 Ti
min:
11 fps, P0.1:
36.3 fps, P1:
59 fps, max:
126.4 fps
fps
100%
GeForce RTX 3050 Ti Laptop GPU:
25 [X] Asus VivoBook Pro 16 Intel Core i7-12700H 1.7GHz
GeForce RTX 3050 Ti Laptop GPU
min:
13.7 fps, P0.1:
14.2 fps, P1:
17.9 fps, max:
41.1 fps
fps
253%
NVIDIA GeForce RTX 3070:
63.3 [X] Desktop-PC Intel Core i9-12900K 3.2GHz
NVIDIA GeForce RTX 3070
min:
25.9 fps, P0.1:
29.6 fps, P1:
41.1 fps, max:
133.1 fps
fps
226%
NVIDIA GeForce RTX 3060 Ti:
56.5 [X] Nvidia GeForce RTX 3060 Ti FE AMD Ryzen 9 7950X 4.5GHz
NVIDIA GeForce RTX 3060 Ti
min:
12.2 fps, P0.1:
27.7 fps, P1:
42.5 fps, max:
134.9 fps
fps
NVIDIA GeForce RTX 3070:
35 [X] Desktop-PC Intel Core i9-12900K 3.2GHz
NVIDIA GeForce RTX 3070
min:
22.9 fps, P0.1:
24.2 fps, P1:
26.3 fps, max:
110.5 fps
fps
NVIDIA GeForce RTX 3060 Ti:
31.1 [X] Nvidia GeForce RTX 3060 Ti FE AMD Ryzen 9 7950X 4.5GHz
NVIDIA GeForce RTX 3060 Ti
min:
17.9 fps, P0.1:
18.3 fps, P1:
24.1 fps, max:
92.5 fps
fps
100%
GeForce RTX 3050 Ti Laptop GPU:
37.2 [X] Asus VivoBook Pro 16 Intel Core i7-12700H 1.7GHz
GeForce RTX 3050 Ti Laptop GPU
min:
13.9 fps, P0.1:
17.8 fps, P1:
26.4 fps, max:
75.9 fps
fps
255%
NVIDIA GeForce RTX 3070:
95 [X] Desktop-PC Intel Core i9-12900K 3.2GHz
NVIDIA GeForce RTX 3070
min:
34.7 fps, P0.1:
37.7 fps, P1:
64.3 fps, max:
495 fps
fps
317%
NVIDIA GeForce RTX 3060 Ti:
118 [X] Nvidia GeForce RTX 3060 Ti FE AMD Ryzen 9 7950X 4.5GHz
NVIDIA GeForce RTX 3060 Ti
min:
41.4 fps, P0.1:
48.5 fps, P1:
77.6 fps, max:
527 fps
fps
100%
GeForce RTX 3050 Ti Laptop GPU:
35.1 [X] Asus VivoBook Pro 16 Intel Core i7-12700H 1.7GHz
GeForce RTX 3050 Ti Laptop GPU
min:
19 fps, P0.1:
20.6 fps, P1:
25.6 fps, max:
73.3 fps
fps
264%
NVIDIA GeForce RTX 3070:
92.5 [X] Desktop-PC Intel Core i9-12900K 3.2GHz
NVIDIA GeForce RTX 3070
min:
35.9 fps, P0.1:
53.9 fps, P1:
61.6 fps, max:
204 fps
fps
324%
NVIDIA GeForce RTX 3060 Ti:
113.7 [X] Nvidia GeForce RTX 3060 Ti FE AMD Ryzen 9 7950X 4.5GHz
NVIDIA GeForce RTX 3060 Ti
min:
45.1 fps, P0.1:
59.1 fps, P1:
78.9 fps, max:
465 fps
fps
100%
GeForce RTX 3050 Ti Laptop GPU:
28.2 [X] Asus VivoBook Pro 16 Intel Core i7-12700H 1.7GHz
GeForce RTX 3050 Ti Laptop GPU
min:
9.69 fps, P0.1:
10.8 fps, P1:
16.6 fps, max:
64.1 fps
fps
288%
NVIDIA GeForce RTX 3070:
81.2 [X] Desktop-PC Intel Core i9-12900K 3.2GHz
NVIDIA GeForce RTX 3070
min:
34.8 fps, P0.1:
46.2 fps, P1:
55.9 fps, max:
198.4 fps
fps
344%
NVIDIA GeForce RTX 3060 Ti:
97.1 [X] Nvidia GeForce RTX 3060 Ti FE AMD Ryzen 9 7950X 4.5GHz
NVIDIA GeForce RTX 3060 Ti
min:
25.4 fps, P0.1:
62.6 fps, P1:
69 fps, max:
233 fps
fps
100%
GeForce RTX 3050 Ti Laptop GPU:
24.6 [X] Asus VivoBook Pro 16 Intel Core i7-12700H 1.7GHz
GeForce RTX 3050 Ti Laptop GPU
min:
8.54 fps, P0.1:
8.95 fps, P1:
10.4 fps, max:
51.4 fps
fps
308%
NVIDIA GeForce RTX 3070:
75.8 [X] Desktop-PC Intel Core i9-12900K 3.2GHz
NVIDIA GeForce RTX 3070
min:
26.2 fps, P0.1:
33.6 fps, P1:
52.9 fps, max:
332 fps
fps
400%
NVIDIA GeForce RTX 3060 Ti:
98.3 [X] Nvidia GeForce RTX 3060 Ti FE AMD Ryzen 9 7950X 4.5GHz
NVIDIA GeForce RTX 3060 Ti
min:
45.5 fps, P0.1:
53.2 fps, P1:
68.7 fps, max:
542 fps
fps
100%
GeForce RTX 3050 Ti Laptop GPU:
9.8 [X] Asus VivoBook Pro 16 Intel Core i7-12700H 1.7GHz
GeForce RTX 3050 Ti Laptop GPU
min:
5.55 fps, P0.1:
5.75 fps, P1:
6.8 fps, max:
13.2 fps
fps
530%
NVIDIA GeForce RTX 3070:
52 [X] Desktop-PC Intel Core i9-12900K 3.2GHz
NVIDIA GeForce RTX 3070
min:
23.1 fps, P0.1:
28.4 fps, P1:
37.8 fps, max:
121.4 fps
fps
659%
NVIDIA GeForce RTX 3060 Ti:
64.6 [X] Nvidia GeForce RTX 3060 Ti FE AMD Ryzen 9 7950X 4.5GHz
NVIDIA GeForce RTX 3060 Ti
min:
34.7 fps, P0.1:
38.1 fps, P1:
49.3 fps, max:
225 fps
fps
NVIDIA GeForce RTX 3070:
24.9 [X] Desktop-PC Intel Core i9-12900K 3.2GHz
NVIDIA GeForce RTX 3070
min:
16.3 fps, P0.1:
16.3 fps, P1:
16.9 fps, max:
51.7 fps
fps
NVIDIA GeForce RTX 3060 Ti:
32.9 [X] Nvidia GeForce RTX 3060 Ti FE AMD Ryzen 9 7950X 4.5GHz
NVIDIA GeForce RTX 3060 Ti
min:
23 fps, P0.1:
24.9 fps, P1:
27.4 fps, max:
41.6 fps
fps
100%
GeForce RTX 3050 Ti Laptop GPU:
88.4 [X] Asus VivoBook Pro 16 Intel Core i7-12700H 1.7GHz
GeForce RTX 3050 Ti Laptop GPU
min:
8.39 fps, P0.1:
42.2 fps, P1:
56.7 fps, max:
187.5 fps
127.2 [X] XMG Focus 17 @75 W TGP Intel Core i7-11800H 2.3GHz
GeForce RTX 3050 Ti Laptop GPU
min:
66.7 fps, P0.1:
79.9 fps, P1:
90.5 fps, max:
204 fps
~ 108 fps
234%
NVIDIA GeForce RTX 3060 Ti:
240 [X] Nvidia GeForce RTX 3060 Ti FE AMD Ryzen 9 7950X 4.5GHz
NVIDIA GeForce RTX 3060 Ti
min:
106.6 fps, P0.1:
158.8 fps, P1:
172.7 fps, max:
384 fps
265 [X] Nvidia GeForce RTX 3060 Ti FE AMD Ryzen 9 7950X 4.5GHz
NVIDIA GeForce RTX 3060 Ti
min:
44.8 fps, P0.1:
150.6 fps, P1:
190.5 fps, max:
425 fps
~ 253 fps
100%
GeForce RTX 3050 Ti Laptop GPU:
75.6 [X] Asus VivoBook Pro 16 Intel Core i7-12700H 1.7GHz
GeForce RTX 3050 Ti Laptop GPU
min:
9.5 fps, P0.1:
33.7 fps, P1:
49.6 fps, max:
164 fps
92.5 [X] XMG Focus 17 @75 W TGP Intel Core i7-11800H 2.3GHz
GeForce RTX 3050 Ti Laptop GPU
min:
50.1 fps, P0.1:
57.1 fps, P1:
63.3 fps, max:
152.3 fps
~ 84 fps
269%
NVIDIA GeForce RTX 3070:
226 [X] Desktop-PC Intel Core i9-12900K 3.2GHz
NVIDIA GeForce RTX 3070
min:
10.6 fps, P0.1:
43.2 fps, P1:
154.5 fps, max:
377 fps
fps
246%
NVIDIA GeForce RTX 3060 Ti:
205 [X] Nvidia GeForce RTX 3060 Ti FE AMD Ryzen 9 7950X 4.5GHz
NVIDIA GeForce RTX 3060 Ti
min:
73.7 fps, P0.1:
129.4 fps, P1:
143.2 fps, max:
334 fps
208 [X] Nvidia GeForce RTX 3060 Ti FE AMD Ryzen 9 7950X 4.5GHz
NVIDIA GeForce RTX 3060 Ti
min:
79 fps, P0.1:
124.1 fps, P1:
144.4 fps, max:
335 fps
~ 207 fps
100%
GeForce RTX 3050 Ti Laptop GPU:
36.8 [X] Asus VivoBook Pro 16 Intel Core i7-12700H 1.7GHz
GeForce RTX 3050 Ti Laptop GPU
min:
8.4 fps, P0.1:
25 fps, P1:
29.4 fps, max:
109.1 fps
74 [X] XMG Focus 17 @75 W TGP Intel Core i7-11800H 2.3GHz
GeForce RTX 3050 Ti Laptop GPU
min:
41.4 fps, P0.1:
46.6 fps, P1:
53 fps, max:
142.2 fps
~ 55 fps
342%
NVIDIA GeForce RTX 3070:
188.2 [X] Desktop-PC Intel Core i9-12900K 3.2GHz
NVIDIA GeForce RTX 3070
min:
17.3 fps, P0.1:
118.8 fps, P1:
136.2 fps, max:
291 fps
fps
311%
NVIDIA GeForce RTX 3060 Ti:
170.8 [X] Nvidia GeForce RTX 3060 Ti FE AMD Ryzen 9 7950X 4.5GHz
NVIDIA GeForce RTX 3060 Ti
min:
73.6 fps, P0.1:
111.6 fps, P1:
121.8 fps, max:
272 fps
171.7 [X] Nvidia GeForce RTX 3060 Ti FE AMD Ryzen 9 7950X 4.5GHz
NVIDIA GeForce RTX 3060 Ti
min:
82.7 fps, P0.1:
107.1 fps, P1:
124.7 fps, max:
299 fps
~ 171 fps
100%
GeForce RTX 3050 Ti Laptop GPU:
32.4 [X] Asus VivoBook Pro 16 Intel Core i7-12700H 1.7GHz
GeForce RTX 3050 Ti Laptop GPU
min:
9.93 fps, P0.1:
11.5 fps, P1:
25.6 fps, max:
147.2 fps
58 [X] XMG Focus 17 @75 W TGP Intel Core i7-11800H 2.3GHz
GeForce RTX 3050 Ti Laptop GPU
min:
26.3 fps, P0.1:
37.4 fps, P1:
41.8 fps, max:
108.4 fps
~ 45 fps
337%
NVIDIA GeForce RTX 3070:
151.5 [X] Desktop-PC Intel Core i9-12900K 3.2GHz
NVIDIA GeForce RTX 3070
min:
56.1 fps, P0.1:
93.8 fps, P1:
105.3 fps, max:
266 fps
fps
307%
NVIDIA GeForce RTX 3060 Ti:
134.8 [X] Nvidia GeForce RTX 3060 Ti FE AMD Ryzen 9 7950X 4.5GHz
NVIDIA GeForce RTX 3060 Ti
min:
32.9 fps, P0.1:
88.9 fps, P1:
93.9 fps, max:
237 fps
141.9 [X] Nvidia GeForce RTX 3060 Ti FE AMD Ryzen 9 7950X 4.5GHz
NVIDIA GeForce RTX 3060 Ti
min:
19.1 fps, P0.1:
93.6 fps, P1:
104.4 fps, max:
259 fps
~ 138 fps
100%
GeForce RTX 3050 Ti Laptop GPU:
19.6 [X] Asus VivoBook Pro 16 Intel Core i7-12700H 1.7GHz
GeForce RTX 3050 Ti Laptop GPU
min:
9.85 fps, P0.1:
11 fps, P1:
16.5 fps, max:
75.9 fps
fps
561%
NVIDIA GeForce RTX 3070:
109.9 [X] Desktop-PC Intel Core i9-12900K 3.2GHz
NVIDIA GeForce RTX 3070
min:
63 fps, P0.1:
68.6 fps, P1:
78.3 fps, max:
200 fps
fps
510%
NVIDIA GeForce RTX 3060 Ti:
98.5 [X] Nvidia GeForce RTX 3060 Ti FE AMD Ryzen 9 7950X 4.5GHz
NVIDIA GeForce RTX 3060 Ti
min:
62.2 fps, P0.1:
69 fps, P1:
73.6 fps, max:
186.4 fps
100.6 [X] Nvidia GeForce RTX 3060 Ti FE AMD Ryzen 9 7950X 4.5GHz
NVIDIA GeForce RTX 3060 Ti
min:
60.3 fps, P0.1:
71.7 fps, P1:
79.1 fps, max:
261 fps
~ 100 fps
NVIDIA GeForce RTX 3070:
61.9 [X] Desktop-PC Intel Core i9-12900K 3.2GHz
NVIDIA GeForce RTX 3070
min:
39.4 fps, P0.1:
42.5 fps, P1:
47.9 fps, max:
144.1 fps
fps
NVIDIA GeForce RTX 3060 Ti:
56.7 [X] Nvidia GeForce RTX 3060 Ti FE AMD Ryzen 9 7950X 4.5GHz
NVIDIA GeForce RTX 3060 Ti
min:
15.5 fps, P0.1:
44.8 fps, P1:
48 fps, max:
151.5 fps
57.8 [X] Nvidia GeForce RTX 3060 Ti FE AMD Ryzen 9 7950X 4.5GHz
NVIDIA GeForce RTX 3060 Ti
min:
32.5 fps, P0.1:
47.6 fps, P1:
50.4 fps, max:
174.4 fps
~ 57 fps
100%
GeForce RTX 3050 Ti Laptop GPU:
104.7 [X] Asus VivoBook Pro 16 Intel Core i7-12700H 1.7GHz
GeForce RTX 3050 Ti Laptop GPU
min:
35.4 fps, P0.1:
40.7 fps, P1:
57.6 fps, max:
231 fps
fps
309%
NVIDIA GeForce RTX 3070:
324 [X] Desktop-PC Intel Core i9-12900K 3.2GHz
NVIDIA GeForce RTX 3070
min:
92.8 fps, P0.1:
149.8 fps, P1:
207 fps, max:
509 fps
fps
304%
NVIDIA GeForce RTX 3060 Ti:
318 [X] Nvidia GeForce RTX 3060 Ti FE AMD Ryzen 9 7950X 4.5GHz
NVIDIA GeForce RTX 3060 Ti
min:
63.3 fps, P0.1:
170.6 fps, P1:
210 fps, max:
515 fps
fps
100%
GeForce RTX 3050 Ti Laptop GPU:
77.5 [X] Asus VivoBook Pro 16 Intel Core i7-12700H 1.7GHz
GeForce RTX 3050 Ti Laptop GPU
min:
32 fps, P0.1:
36.7 fps, P1:
44.3 fps, max:
164 fps
fps
283%
NVIDIA GeForce RTX 3070:
219 [X] Desktop-PC Intel Core i9-12900K 3.2GHz
NVIDIA GeForce RTX 3070
min:
56.8 fps, P0.1:
105.7 fps, P1:
134.9 fps, max:
395 fps
fps
268%
NVIDIA GeForce RTX 3060 Ti:
208 [X] Nvidia GeForce RTX 3060 Ti FE AMD Ryzen 9 7950X 4.5GHz
NVIDIA GeForce RTX 3060 Ti
min:
80.8 fps, P0.1:
103.4 fps, P1:
131.7 fps, max:
414 fps
fps
100%
GeForce RTX 3050 Ti Laptop GPU:
60.3 [X] Asus VivoBook Pro 16 Intel Core i7-12700H 1.7GHz
GeForce RTX 3050 Ti Laptop GPU
min:
29.9 fps, P0.1:
31.5 fps, P1:
34.2 fps, max:
137 fps
fps
284%
NVIDIA GeForce RTX 3070:
171.5 [X] Desktop-PC Intel Core i9-12900K 3.2GHz
NVIDIA GeForce RTX 3070
min:
52.3 fps, P0.1:
77.7 fps, P1:
106.4 fps, max:
293 fps
fps
265%
NVIDIA GeForce RTX 3060 Ti:
159.6 [X] Nvidia GeForce RTX 3060 Ti FE AMD Ryzen 9 7950X 4.5GHz
NVIDIA GeForce RTX 3060 Ti
min:
77.5 fps, P0.1:
92.6 fps, P1:
110.4 fps, max:
359 fps
fps
100%
GeForce RTX 3050 Ti Laptop GPU:
50.8 [X] Asus VivoBook Pro 16 Intel Core i7-12700H 1.7GHz
GeForce RTX 3050 Ti Laptop GPU
min:
18.3 fps, P0.1:
26.4 fps, P1:
29.7 fps, max:
115.7 fps
fps
268%
NVIDIA GeForce RTX 3070:
136.2 [X] Desktop-PC Intel Core i9-12900K 3.2GHz
NVIDIA GeForce RTX 3070
min:
61.1 fps, P0.1:
66.2 fps, P1:
88.7 fps, max:
238 fps
fps
252%
NVIDIA GeForce RTX 3060 Ti:
127.8 [X] Nvidia GeForce RTX 3060 Ti FE AMD Ryzen 9 7950X 4.5GHz
NVIDIA GeForce RTX 3060 Ti
min:
58.4 fps, P0.1:
74.2 fps, P1:
90.9 fps, max:
305 fps
fps
100%
GeForce RTX 3050 Ti Laptop GPU:
31.8 [X] Asus VivoBook Pro 16 Intel Core i7-12700H 1.7GHz
GeForce RTX 3050 Ti Laptop GPU
min:
14 fps, P0.1:
14.9 fps, P1:
16.6 fps, max:
124.2 fps
fps
267%
NVIDIA GeForce RTX 3070:
84.8 [X] Desktop-PC Intel Core i9-12900K 3.2GHz
NVIDIA GeForce RTX 3070
min:
37.8 fps, P0.1:
42.7 fps, P1:
55.8 fps, max:
236 fps
fps
246%
NVIDIA GeForce RTX 3060 Ti:
78.3 [X] Nvidia GeForce RTX 3060 Ti FE AMD Ryzen 9 7950X 4.5GHz
NVIDIA GeForce RTX 3060 Ti
min:
35.3 fps, P0.1:
39.8 fps, P1:
51.2 fps, max:
266 fps
fps
NVIDIA GeForce RTX 3070:
35.9 [X] Desktop-PC Intel Core i9-12900K 3.2GHz
NVIDIA GeForce RTX 3070
min:
14.9 fps, P0.1:
15.8 fps, P1:
19.2 fps, max:
177.4 fps
fps
NVIDIA GeForce RTX 3060 Ti:
33.9 [X] Nvidia GeForce RTX 3060 Ti FE AMD Ryzen 9 7950X 4.5GHz
NVIDIA GeForce RTX 3060 Ti
min:
15.1 fps, P0.1:
16.5 fps, P1:
18.6 fps, max:
197.3 fps
fps
100%
GeForce RTX 3050 Ti Laptop GPU:
82.5 91.2 [X] XMG Focus 17 @75 W TGP Intel Core i7-11800H 2.3GHz
GeForce RTX 3050 Ti Laptop GPU
~ 87 fps
207%
NVIDIA GeForce RTX 3060 Ti:
180.1 [X] Nvidia GeForce RTX 3060 Ti FE AMD Ryzen 9 7950X 4.5GHz
NVIDIA GeForce RTX 3060 Ti
fps
100%
GeForce RTX 3050 Ti Laptop GPU:
62.2 63.5 [X] XMG Focus 17 @75 W TGP Intel Core i7-11800H 2.3GHz
GeForce RTX 3050 Ti Laptop GPU
~ 63 fps
240%
NVIDIA GeForce RTX 3070:
151 [X] Desktop-PC Intel Core i9-12900K 3.2GHz
NVIDIA GeForce RTX 3070
fps
214%
NVIDIA GeForce RTX 3060 Ti:
134.6 [X] Nvidia GeForce RTX 3060 Ti FE AMD Ryzen 9 7950X 4.5GHz
NVIDIA GeForce RTX 3060 Ti
fps
100%
GeForce RTX 3050 Ti Laptop GPU:
37.2 [X] XMG Focus 17 @75 W TGP Intel Core i7-11800H 2.3GHz
GeForce RTX 3050 Ti Laptop GPU
58.3 ~ 48 fps
210%
NVIDIA GeForce RTX 3070:
101 [X] Desktop-PC Intel Core i9-12900K 3.2GHz
NVIDIA GeForce RTX 3070
fps
182%
NVIDIA GeForce RTX 3060 Ti:
87.4 [X] Nvidia GeForce RTX 3060 Ti FE AMD Ryzen 9 7950X 4.5GHz
NVIDIA GeForce RTX 3060 Ti
fps
100%
GeForce RTX 3050 Ti Laptop GPU:
31.7 36.1 [X] XMG Focus 17 @75 W TGP Intel Core i7-11800H 2.3GHz
GeForce RTX 3050 Ti Laptop GPU
~ 34 fps
294%
NVIDIA GeForce RTX 3070:
100 [X] Desktop-PC Intel Core i9-12900K 3.2GHz
NVIDIA GeForce RTX 3070
fps
256%
NVIDIA GeForce RTX 3060 Ti:
87.2 [X] Nvidia GeForce RTX 3060 Ti FE AMD Ryzen 9 7950X 4.5GHz
NVIDIA GeForce RTX 3060 Ti
fps
100%
GeForce RTX 3050 Ti Laptop GPU:
21.4 fps
346%
NVIDIA GeForce RTX 3070:
74 [X] Desktop-PC Intel Core i9-12900K 3.2GHz
NVIDIA GeForce RTX 3070
fps
299%
NVIDIA GeForce RTX 3060 Ti:
63.9 [X] Nvidia GeForce RTX 3060 Ti FE AMD Ryzen 9 7950X 4.5GHz
NVIDIA GeForce RTX 3060 Ti
fps
NVIDIA GeForce RTX 3070:
43.5 [X] Desktop-PC Intel Core i9-12900K 3.2GHz
NVIDIA GeForce RTX 3070
fps
NVIDIA GeForce RTX 3060 Ti:
37.5 [X] Nvidia GeForce RTX 3060 Ti FE AMD Ryzen 9 7950X 4.5GHz
NVIDIA GeForce RTX 3060 Ti
fps
100%
GeForce RTX 3050 Ti Laptop GPU:
73.9 [X] Asus VivoBook Pro 16 Intel Core i7-12700H 1.7GHz
GeForce RTX 3050 Ti Laptop GPU
min:
32.9 fps, P0.1:
45.9 fps, P1:
55.5 fps, max:
98.9 fps
95.6 [X] XMG Focus 17 @75 W TGP Intel Core i7-11800H 2.3GHz
GeForce RTX 3050 Ti Laptop GPU
min:
24.4 fps, P0.1:
48.6 fps, P1:
67.6 fps, max:
136.8 fps
~ 85 fps
211%
NVIDIA GeForce RTX 3060 Ti:
179.7 [X] Nvidia GeForce RTX 3060 Ti FE AMD Ryzen 9 7950X 4.5GHz
NVIDIA GeForce RTX 3060 Ti
min:
34.6 fps, P0.1:
105.2 fps, P1:
127.2 fps, max:
229 fps
fps
100%
GeForce RTX 3050 Ti Laptop GPU:
62.6 [X] Asus VivoBook Pro 16 Intel Core i7-12700H 1.7GHz
GeForce RTX 3050 Ti Laptop GPU
min:
28.3 fps, P0.1:
34.4 fps, P1:
43.3 fps, max:
90.1 fps
84.4 [X] XMG Focus 17 @75 W TGP Intel Core i7-11800H 2.3GHz
GeForce RTX 3050 Ti Laptop GPU
min:
23.6 fps, P0.1:
34.9 fps, P1:
54 fps, max:
131.4 fps
~ 74 fps
241%
NVIDIA GeForce RTX 3070:
178.7 [X] Desktop-PC Intel Core i9-12900K 3.2GHz
NVIDIA GeForce RTX 3070
min:
93.8 fps, P0.1:
103.9 fps, P1:
134.2 fps, max:
231 fps
fps
228%
NVIDIA GeForce RTX 3060 Ti:
168.7 [X] Nvidia GeForce RTX 3060 Ti FE AMD Ryzen 9 7950X 4.5GHz
NVIDIA GeForce RTX 3060 Ti
min:
72.4 fps, P0.1:
97.1 fps, P1:
124.7 fps, max:
209 fps
fps
100%
GeForce RTX 3050 Ti Laptop GPU:
35.5 [X] Asus VivoBook Pro 16 Intel Core i7-12700H 1.7GHz
GeForce RTX 3050 Ti Laptop GPU
min:
5.02 fps, P0.1:
7.66 fps, P1:
25.4 fps, max:
66.7 fps
63.4 [X] XMG Focus 17 @75 W TGP Intel Core i7-11800H 2.3GHz
GeForce RTX 3050 Ti Laptop GPU
min:
19.3 fps, P0.1:
29.2 fps, P1:
38.9 fps, max:
105 fps
~ 49 fps
316%
NVIDIA GeForce RTX 3070:
154.6 [X] Desktop-PC Intel Core i9-12900K 3.2GHz
NVIDIA GeForce RTX 3070
min:
34.2 fps, P0.1:
56.6 fps, P1:
110.1 fps, max:
208 fps
fps
295%
NVIDIA GeForce RTX 3060 Ti:
144.4 [X] Nvidia GeForce RTX 3060 Ti FE AMD Ryzen 9 7950X 4.5GHz
NVIDIA GeForce RTX 3060 Ti
min:
48.9 fps, P0.1:
81 fps, P1:
103.1 fps, max:
205 fps
fps
100%
GeForce RTX 3050 Ti Laptop GPU:
27.9 [X] Asus VivoBook Pro 16 Intel Core i7-12700H 1.7GHz
GeForce RTX 3050 Ti Laptop GPU
min:
0.897 fps, P0.1:
4.02 fps, P1:
16 fps, max:
61.4 fps
47.3 [X] XMG Focus 17 @75 W TGP Intel Core i7-11800H 2.3GHz
GeForce RTX 3050 Ti Laptop GPU
min:
5.88 fps, P0.1:
16.8 fps, P1:
30.6 fps, max:
87.5 fps
~ 38 fps
350%
NVIDIA GeForce RTX 3070:
133 [X] Desktop-PC Intel Core i9-12900K 3.2GHz
NVIDIA GeForce RTX 3070
min:
22.6 fps, P0.1:
57.3 fps, P1:
94.8 fps, max:
198.8 fps
fps
326%
NVIDIA GeForce RTX 3060 Ti:
124 [X] Nvidia GeForce RTX 3060 Ti FE AMD Ryzen 9 7950X 4.5GHz
NVIDIA GeForce RTX 3060 Ti
min:
15.5 fps, P0.1:
58.1 fps, P1:
89 fps, max:
188.2 fps
fps
100%
GeForce RTX 3050 Ti Laptop GPU:
15.6 [X] Asus VivoBook Pro 16 Intel Core i7-12700H 1.7GHz
GeForce RTX 3050 Ti Laptop GPU
min:
0.734 fps, P0.1:
2.36 fps, P1:
11.2 fps, max:
40.9 fps
fps
647%
NVIDIA GeForce RTX 3070:
101 [X] Desktop-PC Intel Core i9-12900K 3.2GHz
NVIDIA GeForce RTX 3070
min:
12.2 fps, P0.1:
35.6 fps, P1:
78.6 fps, max:
154.4 fps
fps
572%
NVIDIA GeForce RTX 3060 Ti:
89.2 [X] Nvidia GeForce RTX 3060 Ti FE AMD Ryzen 9 7950X 4.5GHz
NVIDIA GeForce RTX 3060 Ti
min:
45.7 fps, P0.1:
54.1 fps, P1:
68.4 fps, max:
144.1 fps
fps
NVIDIA GeForce RTX 3070:
50.3 [X] Desktop-PC Intel Core i9-12900K 3.2GHz
NVIDIA GeForce RTX 3070
min:
13.3 fps, P0.1:
30 fps, P1:
39.4 fps, max:
91.9 fps
fps
NVIDIA GeForce RTX 3060 Ti:
47.2 [X] Nvidia GeForce RTX 3060 Ti FE AMD Ryzen 9 7950X 4.5GHz
NVIDIA GeForce RTX 3060 Ti
min:
32.8 fps, P0.1:
35 fps, P1:
38.5 fps, max:
71.7 fps
fps
100%
GeForce RTX 3050 Ti Laptop GPU:
66.6 [X] Asus VivoBook Pro 16 Intel Core i7-12700H 1.7GHz
GeForce RTX 3050 Ti Laptop GPU
min:
42.7 fps, P0.1:
44.9 fps, P1:
53 fps, max:
91.6 fps
69.7 [X] XMG Focus 17 @75 W TGP Intel Core i7-11800H 2.3GHz
GeForce RTX 3050 Ti Laptop GPU
min:
6.13 fps, P0.1:
6.17 fps, P1:
9.75 fps, max:
101.5 fps
~ 68 fps
169%
NVIDIA GeForce RTX 3060 Ti:
114.8 [X] Nvidia GeForce RTX 3060 Ti FE AMD Ryzen 9 7950X 4.5GHz
NVIDIA GeForce RTX 3060 Ti
min:
70 fps, P0.1:
77.2 fps, P1:
92.9 fps, max:
172.6 fps
fps
100%
GeForce RTX 3050 Ti Laptop GPU:
53.6 [X] Asus VivoBook Pro 16 Intel Core i7-12700H 1.7GHz
GeForce RTX 3050 Ti Laptop GPU
min:
19.3 fps, P0.1:
27 fps, P1:
40.9 fps, max:
91.1 fps
57.3 [X] XMG Focus 17 @75 W TGP Intel Core i7-11800H 2.3GHz
GeForce RTX 3050 Ti Laptop GPU
min:
6.06 fps, P0.1:
6.07 fps, P1:
6.13 fps, max:
96.1 fps
~ 55 fps
268%
NVIDIA GeForce RTX 3070:
147.3 [X] Desktop-PC Intel Core i9-12900K 3.2GHz
NVIDIA GeForce RTX 3070
min:
73.4 fps, P0.1:
88.1 fps, P1:
117.7 fps, max:
172 fps
fps
195%
NVIDIA GeForce RTX 3060 Ti:
107.1 [X] Nvidia GeForce RTX 3060 Ti FE AMD Ryzen 9 7950X 4.5GHz
NVIDIA GeForce RTX 3060 Ti
min:
57.2 fps, P0.1:
71.5 fps, P1:
88.1 fps, max:
227 fps
fps
100%
GeForce RTX 3050 Ti Laptop GPU:
44.8 [X] Asus VivoBook Pro 16 Intel Core i7-12700H 1.7GHz
GeForce RTX 3050 Ti Laptop GPU
min:
20.5 fps, P0.1:
30.3 fps, P1:
36.8 fps, max:
81.3 fps
49.7 [X] XMG Focus 17 @75 W TGP Intel Core i7-11800H 2.3GHz
GeForce RTX 3050 Ti Laptop GPU
min:
5.94 fps, P0.1:
5.95 fps, P1:
19.2 fps, max:
65.5 fps
~ 47 fps
294%
NVIDIA GeForce RTX 3070:
138.1 [X] Desktop-PC Intel Core i9-12900K 3.2GHz
NVIDIA GeForce RTX 3070
min:
78.7 fps, P0.1:
81.5 fps, P1:
107.8 fps, max:
164.9 fps
fps
227%
NVIDIA GeForce RTX 3060 Ti:
106.6 [X] Nvidia GeForce RTX 3060 Ti FE AMD Ryzen 9 7950X 4.5GHz
NVIDIA GeForce RTX 3060 Ti
min:
68 fps, P0.1:
75.6 fps, P1:
87 fps, max:
183.7 fps
fps
100%
GeForce RTX 3050 Ti Laptop GPU:
34.9 [X] XMG Focus 17 @75 W TGP Intel Core i7-11800H 2.3GHz
GeForce RTX 3050 Ti Laptop GPU
min:
5.67 fps, P0.1:
5.68 fps, P1:
8.35 fps, max:
96.3 fps
36.8 [X] Asus VivoBook Pro 16 Intel Core i7-12700H 1.7GHz
GeForce RTX 3050 Ti Laptop GPU
min:
15.4 fps, P0.1:
17.6 fps, P1:
26.9 fps, max:
75.8 fps
~ 36 fps
359%
NVIDIA GeForce RTX 3070:
129.2 [X] Desktop-PC Intel Core i9-12900K 3.2GHz
NVIDIA GeForce RTX 3070
min:
75.7 fps, P0.1:
78.9 fps, P1:
104.8 fps, max:
156.2 fps
fps
270%
NVIDIA GeForce RTX 3060 Ti:
97.2 [X] Nvidia GeForce RTX 3060 Ti FE AMD Ryzen 9 7950X 4.5GHz
NVIDIA GeForce RTX 3060 Ti
min:
52.6 fps, P0.1:
59 fps, P1:
75.7 fps, max:
149.8 fps
fps
100%
GeForce RTX 3050 Ti Laptop GPU:
26.3 [X] Asus VivoBook Pro 16 Intel Core i7-12700H 1.7GHz
GeForce RTX 3050 Ti Laptop GPU
min:
17 fps, P0.1:
17.5 fps, P1:
19.7 fps, max:
41.9 fps
fps
366%
NVIDIA GeForce RTX 3070:
96.2 [X] Desktop-PC Intel Core i9-12900K 3.2GHz
NVIDIA GeForce RTX 3070
min:
52 fps, P0.1:
58.6 fps, P1:
79.5 fps, max:
113.6 fps
fps
251%
NVIDIA GeForce RTX 3060 Ti:
66 [X] Nvidia GeForce RTX 3060 Ti FE AMD Ryzen 9 7950X 4.5GHz
NVIDIA GeForce RTX 3060 Ti
min:
25.6 fps, P0.1:
28 fps, P1:
48.2 fps, max:
109.3 fps
fps
NVIDIA GeForce RTX 3070:
50.8 [X] Desktop-PC Intel Core i9-12900K 3.2GHz
NVIDIA GeForce RTX 3070
min:
25.7 fps, P0.1:
34.3 fps, P1:
42.9 fps, max:
57.4 fps
fps
NVIDIA GeForce RTX 3060 Ti:
33.9 [X] Nvidia GeForce RTX 3060 Ti FE AMD Ryzen 9 7950X 4.5GHz
NVIDIA GeForce RTX 3060 Ti
min:
19.3 fps, P0.1:
19.3 fps, P1:
22.2 fps, max:
65.9 fps
fps
100%
GeForce RTX 3050 Ti Laptop GPU:
63 89 [X] XMG Focus 17 @75 W TGP Intel Core i7-11800H 2.3GHz
GeForce RTX 3050 Ti Laptop GPU
min:
59 fps
~ 76 fps
217%
NVIDIA GeForce RTX 3060 Ti:
165 [X] Nvidia GeForce RTX 3060 Ti FE AMD Ryzen 9 7950X 4.5GHz
NVIDIA GeForce RTX 3060 Ti
fps
100%
GeForce RTX 3050 Ti Laptop GPU:
58 81 [X] XMG Focus 17 @75 W TGP Intel Core i7-11800H 2.3GHz
GeForce RTX 3050 Ti Laptop GPU
min:
56 fps
~ 70 fps
227%
NVIDIA GeForce RTX 3070:
159 [X] Desktop-PC Intel Core i9-12900K 3.2GHz
NVIDIA GeForce RTX 3070
min:
111 fps
fps
197%
NVIDIA GeForce RTX 3060 Ti:
138 [X] Nvidia GeForce RTX 3060 Ti FE AMD Ryzen 9 7950X 4.5GHz
NVIDIA GeForce RTX 3060 Ti
fps
100%
GeForce RTX 3050 Ti Laptop GPU:
44 59 [X] XMG Focus 17 @75 W TGP Intel Core i7-11800H 2.3GHz
GeForce RTX 3050 Ti Laptop GPU
min:
28 fps
~ 52 fps
233%
NVIDIA GeForce RTX 3070:
121 [X] Desktop-PC Intel Core i9-12900K 3.2GHz
NVIDIA GeForce RTX 3070
min:
67 fps
fps
198%
NVIDIA GeForce RTX 3060 Ti:
103 [X] Nvidia GeForce RTX 3060 Ti FE AMD Ryzen 9 7950X 4.5GHz
NVIDIA GeForce RTX 3060 Ti
fps
100%
GeForce RTX 3050 Ti Laptop GPU:
36 fps
328%
NVIDIA GeForce RTX 3070:
118 [X] Desktop-PC Intel Core i9-12900K 3.2GHz
NVIDIA GeForce RTX 3070
min:
67 fps
fps
272%
NVIDIA GeForce RTX 3060 Ti:
98 [X] Nvidia GeForce RTX 3060 Ti FE AMD Ryzen 9 7950X 4.5GHz
NVIDIA GeForce RTX 3060 Ti
fps
NVIDIA GeForce RTX 3070:
82 [X] Desktop-PC Intel Core i9-12900K 3.2GHz
NVIDIA GeForce RTX 3070
min:
42 fps
fps
NVIDIA GeForce RTX 3060 Ti:
70 [X] Nvidia GeForce RTX 3060 Ti FE AMD Ryzen 9 7950X 4.5GHz
NVIDIA GeForce RTX 3060 Ti
fps
NVIDIA GeForce RTX 3070:
49 [X] Desktop-PC Intel Core i9-12900K 3.2GHz
NVIDIA GeForce RTX 3070
min:
21 fps
fps
NVIDIA GeForce RTX 3060 Ti:
42 [X] Nvidia GeForce RTX 3060 Ti FE AMD Ryzen 9 7950X 4.5GHz
NVIDIA GeForce RTX 3060 Ti
fps
NVIDIA GeForce RTX 3060 Ti:
89 [X] Nvidia GeForce RTX 3060 Ti FE AMD Ryzen 9 7950X 4.5GHz
NVIDIA GeForce RTX 3060 Ti
fps
100%
GeForce RTX 3050 Ti Laptop GPU:
48.4 [X] Asus VivoBook Pro 16 Intel Core i7-12700H 1.7GHz
GeForce RTX 3050 Ti Laptop GPU
min:
16.9 fps, P0.1:
19.2 fps, P1:
42.1 fps, max:
105.2 fps
55.8 [X] XMG Focus 17 @75 W TGP Intel Core i7-11800H 2.3GHz
GeForce RTX 3050 Ti Laptop GPU
min:
30.1 fps, P0.1:
39.4 fps, P1:
51.7 fps, max:
68.3 fps
~ 52 fps
167%
NVIDIA GeForce RTX 3060 Ti:
86.8 [X] Nvidia GeForce RTX 3060 Ti FE AMD Ryzen 9 7950X 4.5GHz
NVIDIA GeForce RTX 3060 Ti
min:
32.5 fps, P0.1:
77.1 fps, P1:
79.2 fps, max:
98.2 fps
fps
100%
GeForce RTX 3050 Ti Laptop GPU:
30.5 [X] Asus VivoBook Pro 16 Intel Core i7-12700H 1.7GHz
GeForce RTX 3050 Ti Laptop GPU
min:
3.46 fps, P0.1:
3.51 fps, P1:
24.7 fps, max:
40.5 fps
44.8 [X] XMG Focus 17 @75 W TGP Intel Core i7-11800H 2.3GHz
GeForce RTX 3050 Ti Laptop GPU
min:
26.9 fps, P0.1:
37.5 fps, P1:
40 fps, max:
57.9 fps
~ 38 fps
259%
NVIDIA GeForce RTX 3070:
98.3 [X] Desktop-PC Intel Core i9-12900K 3.2GHz
NVIDIA GeForce RTX 3070
min:
40.5 fps, P0.1:
80.8 fps, P1:
85.7 fps, max:
122.9 fps
fps
251%
NVIDIA GeForce RTX 3060 Ti:
95.3 [X] Nvidia GeForce RTX 3060 Ti FE AMD Ryzen 9 7950X 4.5GHz
NVIDIA GeForce RTX 3060 Ti
min:
56.7 fps, P0.1:
84.7 fps, P1:
87.4 fps, max:
117.8 fps
fps
100%
GeForce RTX 3050 Ti Laptop GPU:
20.6 [X] Asus VivoBook Pro 16 Intel Core i7-12700H 1.7GHz
GeForce RTX 3050 Ti Laptop GPU
min:
15.9 fps, P0.1:
16.1 fps, P1:
16.7 fps, max:
26.5 fps
34 [X] XMG Focus 17 @75 W TGP Intel Core i7-11800H 2.3GHz
GeForce RTX 3050 Ti Laptop GPU
min:
26.6 fps, P0.1:
27.7 fps, P1:
29.7 fps, max:
44.7 fps
~ 27 fps
344%
NVIDIA GeForce RTX 3070:
92.8 [X] Desktop-PC Intel Core i9-12900K 3.2GHz
NVIDIA GeForce RTX 3070
min:
48.4 fps, P0.1:
69.5 fps, P1:
80.2 fps, max:
154.2 fps
fps
339%
NVIDIA GeForce RTX 3060 Ti:
91.4 [X] Nvidia GeForce RTX 3060 Ti FE AMD Ryzen 9 7950X 4.5GHz
NVIDIA GeForce RTX 3060 Ti
min:
63.1 fps, P0.1:
79.3 fps, P1:
84.7 fps, max:
109.4 fps
fps
100%
GeForce RTX 3050 Ti Laptop GPU:
20 [X] Asus VivoBook Pro 16 Intel Core i7-12700H 1.7GHz
GeForce RTX 3050 Ti Laptop GPU
min:
16 fps, P0.1:
16.1 fps, P1:
16.7 fps, max:
24.4 fps
33.2 [X] XMG Focus 17 @75 W TGP Intel Core i7-11800H 2.3GHz
GeForce RTX 3050 Ti Laptop GPU
min:
28.6 fps, P0.1:
28.7 fps, P1:
29.9 fps, max:
40.1 fps
~ 27 fps
331%
NVIDIA GeForce RTX 3070:
89.4 [X] Desktop-PC Intel Core i9-12900K 3.2GHz
NVIDIA GeForce RTX 3070
min:
52 fps, P0.1:
62.2 fps, P1:
77.4 fps, max:
161 fps
fps
310%
NVIDIA GeForce RTX 3060 Ti:
83.8 [X] Nvidia GeForce RTX 3060 Ti FE AMD Ryzen 9 7950X 4.5GHz
NVIDIA GeForce RTX 3060 Ti
min:
43.4 fps, P0.1:
73 fps, P1:
76.5 fps, max:
98 fps
fps
100%
GeForce RTX 3050 Ti Laptop GPU:
14.1 [X] Asus VivoBook Pro 16 Intel Core i7-12700H 1.7GHz
GeForce RTX 3050 Ti Laptop GPU
min:
11.2 fps, P0.1:
11.2 fps, P1:
11.7 fps, max:
20.3 fps
fps
496%
NVIDIA GeForce RTX 3070:
70 [X] Desktop-PC Intel Core i9-12900K 3.2GHz
NVIDIA GeForce RTX 3070
min:
42.7 fps, P0.1:
43.2 fps, P1:
63.6 fps, max:
172.8 fps
fps
467%
NVIDIA GeForce RTX 3060 Ti:
65.9 [X] Nvidia GeForce RTX 3060 Ti FE AMD Ryzen 9 7950X 4.5GHz
NVIDIA GeForce RTX 3060 Ti
min:
58.2 fps, P0.1:
59.2 fps, P1:
61.3 fps, max:
77.3 fps
fps
NVIDIA GeForce RTX 3070:
40.9 [X] Desktop-PC Intel Core i9-12900K 3.2GHz
NVIDIA GeForce RTX 3070
min:
23.5 fps, P0.1:
23.6 fps, P1:
37.4 fps, max:
135.6 fps
fps
NVIDIA GeForce RTX 3060 Ti:
29.7 [X] Nvidia GeForce RTX 3060 Ti FE AMD Ryzen 9 7950X 4.5GHz
NVIDIA GeForce RTX 3060 Ti
min:
24.1 fps, P0.1:
25.1 fps, P1:
26.1 fps, max:
33.8 fps
fps
100%
GeForce RTX 3050 Ti Laptop GPU:
43.9 [X] XMG Focus 17 @75 W TGP Intel Core i7-11800H 2.3GHz
GeForce RTX 3050 Ti Laptop GPU
min:
27.6 fps, P0.1:
28.4 fps, P1:
30.9 fps, max:
83.6 fps
fps
318%
NVIDIA GeForce RTX 3060 Ti:
139.7 [X] Nvidia GeForce RTX 3060 Ti FE AMD Ryzen 9 7950X 4.5GHz
NVIDIA GeForce RTX 3060 Ti
min:
86.2 fps, P0.1:
99.3 fps, P1:
111.3 fps, max:
207 fps
fps
100%
GeForce RTX 3050 Ti Laptop GPU:
37.9 [X] XMG Focus 17 @75 W TGP Intel Core i7-11800H 2.3GHz
GeForce RTX 3050 Ti Laptop GPU
min:
25.6 fps, P0.1:
26 fps, P1:
27.9 fps, max:
77.6 fps
fps
230%
NVIDIA GeForce RTX 3070:
87 [X] Desktop-PC Intel Core i9-12900K 3.2GHz
NVIDIA GeForce RTX 3070
min:
51 fps, P0.1:
62.6 fps, P1:
69.5 fps, max:
154.1 fps
fps
281%
NVIDIA GeForce RTX 3060 Ti:
106.6 [X] Nvidia GeForce RTX 3060 Ti FE AMD Ryzen 9 7950X 4.5GHz
NVIDIA GeForce RTX 3060 Ti
min:
68.6 fps, P0.1:
79.4 fps, P1:
89 fps, max:
155.5 fps
fps
100%
GeForce RTX 3050 Ti Laptop GPU:
32.2 [X] XMG Focus 17 @75 W TGP Intel Core i7-11800H 2.3GHz
GeForce RTX 3050 Ti Laptop GPU
min:
21.3 fps, P0.1:
22.8 fps, P1:
24.9 fps, max:
62 fps
fps
234%
NVIDIA GeForce RTX 3070:
75.3 [X] Desktop-PC Intel Core i9-12900K 3.2GHz
NVIDIA GeForce RTX 3070
min:
52.5 fps, P0.1:
54.1 fps, P1:
60.4 fps, max:
165.1 fps
fps
247%
NVIDIA GeForce RTX 3060 Ti:
79.5 [X] Nvidia GeForce RTX 3060 Ti FE AMD Ryzen 9 7950X 4.5GHz
NVIDIA GeForce RTX 3060 Ti
min:
55.9 fps, P0.1:
61.8 fps, P1:
67.9 fps, max:
109.3 fps
fps
100%
GeForce RTX 3050 Ti Laptop GPU:
27.5 [X] XMG Focus 17 @75 W TGP Intel Core i7-11800H 2.3GHz
GeForce RTX 3050 Ti Laptop GPU
min:
17.7 fps, P0.1:
18.3 fps, P1:
20.9 fps, max:
48.1 fps
fps
238%
NVIDIA GeForce RTX 3070:
65.5 [X] Desktop-PC Intel Core i9-12900K 3.2GHz
NVIDIA GeForce RTX 3070
min:
37.6 fps, P0.1:
46 fps, P1:
52.5 fps, max:
173.7 fps
fps
221%
NVIDIA GeForce RTX 3060 Ti:
60.9 [X] Nvidia GeForce RTX 3060 Ti FE AMD Ryzen 9 7950X 4.5GHz
NVIDIA GeForce RTX 3060 Ti
min:
42.4 fps, P0.1:
48.5 fps, P1:
51.8 fps, max:
81.4 fps
fps
NVIDIA GeForce RTX 3070:
47.4 [X] Desktop-PC Intel Core i9-12900K 3.2GHz
NVIDIA GeForce RTX 3070
min:
35.5 fps, P0.1:
37.4 fps, P1:
40 fps, max:
63 fps
fps
NVIDIA GeForce RTX 3060 Ti:
43.6 [X] Nvidia GeForce RTX 3060 Ti FE AMD Ryzen 9 7950X 4.5GHz
NVIDIA GeForce RTX 3060 Ti
min:
34.9 fps, P0.1:
35.7 fps, P1:
38.4 fps, max:
55.8 fps
fps
NVIDIA GeForce RTX 3070:
27.2 [X] Desktop-PC Intel Core i9-12900K 3.2GHz
NVIDIA GeForce RTX 3070
min:
22.8 fps, P0.1:
23.3 fps, P1:
23.8 fps, max:
34.3 fps
fps
NVIDIA GeForce RTX 3060 Ti:
24.4 [X] Nvidia GeForce RTX 3060 Ti FE AMD Ryzen 9 7950X 4.5GHz
NVIDIA GeForce RTX 3060 Ti
min:
20.7 fps, P0.1:
20.9 fps, P1:
21.4 fps, max:
29.5 fps
fps
100%
GeForce RTX 3050 Ti Laptop GPU:
129.4 [X] XMG Focus 17 @75 W TGP Intel Core i7-11800H 2.3GHz
GeForce RTX 3050 Ti Laptop GPU
min:
26.8 fps, P0.1:
67.3 fps, P1:
81.3 fps, max:
221 fps
fps
254%
NVIDIA GeForce RTX 3060 Ti:
329 [X] Nvidia GeForce RTX 3060 Ti FE AMD Ryzen 9 7950X 4.5GHz
NVIDIA GeForce RTX 3060 Ti
min:
99.7 fps, P0.1:
213 fps, P1:
247 fps, max:
428 fps
fps
100%
GeForce RTX 3050 Ti Laptop GPU:
118.2 [X] XMG Focus 17 @75 W TGP Intel Core i7-11800H 2.3GHz
GeForce RTX 3050 Ti Laptop GPU
min:
21.6 fps, P0.1:
64.9 fps, P1:
77.4 fps, max:
191.3 fps
fps
176%
NVIDIA GeForce RTX 3070:
208 [X] Desktop-PC Intel Core i9-12900K 3.2GHz
NVIDIA GeForce RTX 3070
min:
30.2 fps, P0.1:
126.5 fps, P1:
148.5 fps, max:
260 fps
fps
246%
NVIDIA GeForce RTX 3060 Ti:
291 [X] Nvidia GeForce RTX 3060 Ti FE AMD Ryzen 9 7950X 4.5GHz
NVIDIA GeForce RTX 3060 Ti
min:
124 fps, P0.1:
196.3 fps, P1:
221 fps, max:
364 fps
fps
100%
GeForce RTX 3050 Ti Laptop GPU:
92.2 [X] XMG Focus 17 @75 W TGP Intel Core i7-11800H 2.3GHz
GeForce RTX 3050 Ti Laptop GPU
min:
20 fps, P0.1:
46.8 fps, P1:
64.2 fps, max:
166.8 fps
fps
214%
NVIDIA GeForce RTX 3070:
197.4 [X] Desktop-PC Intel Core i9-12900K 3.2GHz
NVIDIA GeForce RTX 3070
min:
102.3 fps, P0.1:
123.3 fps, P1:
141.1 fps, max:
253 fps
fps
255%
NVIDIA GeForce RTX 3060 Ti:
235 [X] Nvidia GeForce RTX 3060 Ti FE AMD Ryzen 9 7950X 4.5GHz
NVIDIA GeForce RTX 3060 Ti
min:
73.2 fps, P0.1:
160.7 fps, P1:
178.9 fps, max:
305 fps
fps
100%
GeForce RTX 3050 Ti Laptop GPU:
90.7 [X] XMG Focus 17 @75 W TGP Intel Core i7-11800H 2.3GHz
GeForce RTX 3050 Ti Laptop GPU
min:
40.7 fps, P0.1:
46 fps, P1:
65.1 fps, max:
142.3 fps
fps
209%
NVIDIA GeForce RTX 3070:
189.9 [X] Desktop-PC Intel Core i9-12900K 3.2GHz
NVIDIA GeForce RTX 3070
min:
58.7 fps, P0.1:
112.1 fps, P1:
134.2 fps, max:
242 fps
fps
257%
NVIDIA GeForce RTX 3060 Ti:
233 [X] Nvidia GeForce RTX 3060 Ti FE AMD Ryzen 9 7950X 4.5GHz
NVIDIA GeForce RTX 3060 Ti
min:
58 fps, P0.1:
162 fps, P1:
175.2 fps, max:
309 fps
fps
100%
GeForce RTX 3050 Ti Laptop GPU:
78.2 [X] Asus VivoBook Pro 16 Intel Core i7-12700H 1.7GHz
GeForce RTX 3050 Ti Laptop GPU
min:
15.2 fps, P0.1:
46.8 fps, P1:
55.5 fps, max:
122.4 fps
fps
209%
NVIDIA GeForce RTX 3070:
163.6 [X] Desktop-PC Intel Core i9-12900K 3.2GHz
NVIDIA GeForce RTX 3070
min:
103.7 fps, P0.1:
108.1 fps, P1:
118 fps, max:
223 fps
fps
239%
NVIDIA GeForce RTX 3060 Ti:
186.9 [X] Nvidia GeForce RTX 3060 Ti FE AMD Ryzen 9 7950X 4.5GHz
NVIDIA GeForce RTX 3060 Ti
min:
61.7 fps, P0.1:
126 fps, P1:
141.3 fps, max:
274 fps
fps
NVIDIA GeForce RTX 3070:
105.9 [X] Desktop-PC Intel Core i9-12900K 3.2GHz
NVIDIA GeForce RTX 3070
min:
39.7 fps, P0.1:
73.3 fps, P1:
80.7 fps, max:
173.9 fps
fps
NVIDIA GeForce RTX 3060 Ti:
110.5 [X] Nvidia GeForce RTX 3060 Ti FE AMD Ryzen 9 7950X 4.5GHz
NVIDIA GeForce RTX 3060 Ti
min:
28.6 fps, P0.1:
88.8 fps, P1:
93.2 fps, max:
267 fps
fps
NVIDIA GeForce RTX 3060 Ti:
186.8 [X] Nvidia GeForce RTX 3060 Ti FE AMD Ryzen 9 7950X 4.5GHz
NVIDIA GeForce RTX 3060 Ti
min:
48 fps, P0.1:
99.8 fps, P1:
157 fps, max:
344 fps
191.3 [X] Nvidia GeForce RTX 3060 Ti FE AMD Ryzen 9 7900X 4.7GHz
NVIDIA GeForce RTX 3060 Ti
min:
23.5 fps, P0.1:
86.6 fps, P1:
157.5 fps, max:
319 fps
~ 189 fps
100%
GeForce RTX 3050 Ti Laptop GPU:
63.1 67.1 [X] XMG Focus 17 @75 W TGP Intel Core i7-11800H 2.3GHz
GeForce RTX 3050 Ti Laptop GPU
min:
26.4 fps, P0.1:
34.2 fps, P1:
54 fps, max:
132.8 fps
69.7 ~ 67 fps
209%
NVIDIA GeForce RTX 3060 Ti:
137.4 [X] Nvidia GeForce RTX 3060 Ti FE AMD Ryzen 9 7950X 4.5GHz
NVIDIA GeForce RTX 3060 Ti
min:
48.8 fps, P0.1:
84.7 fps, P1:
110.3 fps, max:
296 fps
141.7 [X] Nvidia GeForce RTX 3060 Ti FE AMD Ryzen 9 7900X 4.7GHz
NVIDIA GeForce RTX 3060 Ti
min:
34.6 fps, P0.1:
64.9 fps, P1:
113.6 fps, max:
272 fps
~ 140 fps
100%
GeForce RTX 3050 Ti Laptop GPU:
51.5 55.3 [X] XMG Focus 17 @75 W TGP Intel Core i7-11800H 2.3GHz
GeForce RTX 3050 Ti Laptop GPU
min:
17.3 fps, P0.1:
24.8 fps, P1:
44.3 fps, max:
185.7 fps
58.3 ~ 55 fps
209%
NVIDIA GeForce RTX 3060 Ti:
114.9 [X] Nvidia GeForce RTX 3060 Ti FE AMD Ryzen 9 7950X 4.5GHz
NVIDIA GeForce RTX 3060 Ti
min:
31.9 fps, P0.1:
54.8 fps, P1:
91 fps, max:
259 fps
115.4 [X] Nvidia GeForce RTX 3060 Ti FE AMD Ryzen 9 7900X 4.7GHz
NVIDIA GeForce RTX 3060 Ti
min:
27.2 fps, P0.1:
50.3 fps, P1:
91.1 fps, max:
247 fps
~ 115 fps
100%
GeForce RTX 3050 Ti Laptop GPU:
39.7 42.4 [X] XMG Focus 17 @75 W TGP Intel Core i7-11800H 2.3GHz
GeForce RTX 3050 Ti Laptop GPU
min:
17.1 fps, P0.1:
20.6 fps, P1:
33.8 fps, max:
124.4 fps
45.8 ~ 43 fps
212%
NVIDIA GeForce RTX 3060 Ti:
91.3 [X] Nvidia GeForce RTX 3060 Ti FE AMD Ryzen 9 7950X 4.5GHz
NVIDIA GeForce RTX 3060 Ti
min:
31.9 fps, P0.1:
42.8 fps, P1:
75.4 fps, max:
253 fps
91.4 [X] Nvidia GeForce RTX 3060 Ti FE AMD Ryzen 9 7900X 4.7GHz
NVIDIA GeForce RTX 3060 Ti
min:
32.4 fps, P0.1:
42.9 fps, P1:
74.9 fps, max:
254 fps
~ 91 fps
100%
GeForce RTX 3050 Ti Laptop GPU:
28.6 [X] XMG Focus 17 @75 W TGP Intel Core i7-11800H 2.3GHz
GeForce RTX 3050 Ti Laptop GPU
min:
9.21 fps, P0.1:
12.9 fps, P1:
16 fps, max:
115.4 fps
fps
224%
NVIDIA GeForce RTX 3060 Ti:
63.3 [X] Nvidia GeForce RTX 3060 Ti FE AMD Ryzen 9 7950X 4.5GHz
NVIDIA GeForce RTX 3060 Ti
min:
22.1 fps, P0.1:
28.2 fps, P1:
53.8 fps, max:
252 fps
64.1 [X] Nvidia GeForce RTX 3060 Ti FE AMD Ryzen 9 7900X 4.7GHz
NVIDIA GeForce RTX 3060 Ti
min:
21 fps, P0.1:
28.7 fps, P1:
54.6 fps, max:
193.3 fps
~ 64 fps
100%
GeForce RTX 3050 Ti Laptop GPU:
6.6 [X] XMG Focus 17 @75 W TGP Intel Core i7-11800H 2.3GHz
GeForce RTX 3050 Ti Laptop GPU
min:
1.237 fps, P0.1:
1.261 fps, P1:
2.82 fps, max:
14.2 fps
fps
350%
NVIDIA GeForce RTX 3060 Ti:
18.1 [X] Nvidia GeForce RTX 3060 Ti FE AMD Ryzen 9 7950X 4.5GHz
NVIDIA GeForce RTX 3060 Ti
min:
9.78 fps, P0.1:
9.88 fps, P1:
11.3 fps, max:
26.9 fps
27.4 [X] Nvidia GeForce RTX 3060 Ti FE AMD Ryzen 9 7900X 4.7GHz
NVIDIA GeForce RTX 3060 Ti
min:
11.4 fps, P0.1:
12.9 fps, P1:
19.4 fps, max:
156.3 fps
~ 23 fps
100%
GeForce RTX 3050 Ti Laptop GPU:
70 122.2 127.5 [X] Asus VivoBook Pro 16 959964
Intel Core i7-12700H 1.7GHz
GeForce RTX 3050 Ti Laptop GPU
min:
97 fps, P1:
83 fps, max:
159 fps
136.1 163 [X] XMG Focus 17 @75 W TGP Intel Core i7-11800H 2.3GHz
GeForce RTX 3050 Ti Laptop GPU
min:
144 fps
~ 124 fps
208%
NVIDIA GeForce RTX 3070:
258 fps
147%
NVIDIA GeForce RTX 3060 Ti:
59.2 [X] Geekom Mini IT11 (Nvidia GeForce RTX 3060 Ti FE TB3) 959964
Intel Core i7-11390H 3.4GHz
NVIDIA GeForce RTX 3060 Ti
min:
32 fps, P1:
16 fps, max:
86 fps
60.2 [X] Huawei MateBook X Pro 2023 (Nvidia GeForce RTX 3060 Ti FE TB3) 959964
Intel Core i7-1360P 1.6GHz
NVIDIA GeForce RTX 3060 Ti
min:
36 fps, P1:
17 fps, max:
92 fps
71.3 [X] Intel NUC 12 Pro Kit NUC12WSKi7 928484
Intel Core i7-1260P 1.5GHz
NVIDIA GeForce RTX 3060 Ti
min:
39 fps, P1:
42 fps, max:
90 fps
329 [X] Nvidia GeForce RTX 3060 Ti FE 918016
AMD Ryzen 9 7900X 4.7GHz
NVIDIA GeForce RTX 3060 Ti
min:
256 fps, P1:
195 fps, max:
394 fps
388 [X] Nvidia GeForce RTX 3060 Ti FE 923650
AMD Ryzen 9 7950X 4.5GHz
NVIDIA GeForce RTX 3060 Ti
min:
317 fps, P1:
244 fps, max:
461 fps
~ 182 fps
100%
GeForce RTX 3050 Ti Laptop GPU:
63 107.9 111 115.3 [X] Asus VivoBook Pro 16 959964
Intel Core i7-12700H 1.7GHz
GeForce RTX 3050 Ti Laptop GPU
min:
85 fps, P1:
73 fps, max:
148 fps
124.8 132 148 [X] XMG Focus 17 @75 W TGP Intel Core i7-11800H 2.3GHz
GeForce RTX 3050 Ti Laptop GPU
min:
134 fps
~ 115 fps
217%
NVIDIA GeForce RTX 3070:
249 fps
146%
NVIDIA GeForce RTX 3060 Ti:
54 [X] Geekom Mini IT11 (Nvidia GeForce RTX 3060 Ti FE TB3) 959964
Intel Core i7-11390H 3.4GHz
NVIDIA GeForce RTX 3060 Ti
min:
18 fps, P1:
14 fps, max:
83 fps
54.8 [X] Huawei MateBook X Pro 2023 (Nvidia GeForce RTX 3060 Ti FE TB3) 959964
Intel Core i7-1360P 1.6GHz
NVIDIA GeForce RTX 3060 Ti
min:
18 fps, P1:
13 fps, max:
85 fps
70.4 [X] Intel NUC 12 Pro Kit NUC12WSKi7 928484
Intel Core i7-1260P 1.5GHz
NVIDIA GeForce RTX 3060 Ti
min:
38 fps, P1:
40 fps, max:
84 fps
312 [X] Nvidia GeForce RTX 3060 Ti FE 918016
AMD Ryzen 9 7900X 4.7GHz
NVIDIA GeForce RTX 3060 Ti
min:
269 fps, P1:
192 fps, max:
357 fps
349 [X] Nvidia GeForce RTX 3060 Ti FE 923650
AMD Ryzen 9 7950X 4.5GHz
NVIDIA GeForce RTX 3060 Ti
min:
303 fps, P1:
233 fps, max:
408 fps
~ 168 fps
100%
GeForce RTX 3050 Ti Laptop GPU:
48 73.1 [X] Asus VivoBook Pro 16 959964
Intel Core i7-12700H 1.7GHz
GeForce RTX 3050 Ti Laptop GPU
min:
57 fps, P1:
53 fps, max:
87 fps
79.2 92 93 93 113 [X] XMG Focus 17 @75 W TGP Intel Core i7-11800H 2.3GHz
GeForce RTX 3050 Ti Laptop GPU
min:
101 fps
~ 84 fps
271%
NVIDIA GeForce RTX 3070:
228 fps
150%
NVIDIA GeForce RTX 3060 Ti:
41.1 [X] Geekom Mini IT11 (Nvidia GeForce RTX 3060 Ti FE TB3) 959964
Intel Core i7-11390H 3.4GHz
NVIDIA GeForce RTX 3060 Ti
min:
22 fps, P1:
11 fps, max:
60 fps
43.1 [X] Huawei MateBook X Pro 2023 (Nvidia GeForce RTX 3060 Ti FE TB3) 959964
Intel Core i7-1360P 1.6GHz
NVIDIA GeForce RTX 3060 Ti
min:
22 fps, P1:
11 fps, max:
63 fps
57.7 [X] Intel NUC 12 Pro Kit NUC12WSKi7 928484
Intel Core i7-1260P 1.5GHz
NVIDIA GeForce RTX 3060 Ti
min:
33 fps, P1:
34 fps, max:
71 fps
231 [X] Nvidia GeForce RTX 3060 Ti FE 918016
AMD Ryzen 9 7900X 4.7GHz
NVIDIA GeForce RTX 3060 Ti
min:
198 fps, P1:
167 fps, max:
262 fps
256 [X] Nvidia GeForce RTX 3060 Ti FE 923650
AMD Ryzen 9 7950X 4.5GHz
NVIDIA GeForce RTX 3060 Ti
min:
220 fps, P1:
184 fps, max:
297 fps
~ 126 fps
100%
GeForce RTX 3050 Ti Laptop GPU:
16 24.3 [X] Asus VivoBook Pro 16 959964
Intel Core i7-12700H 1.7GHz
GeForce RTX 3050 Ti Laptop GPU
min:
19 fps, P1:
19 fps, max:
28 fps
28 28 29.3 32 35 [X] XMG Focus 17 @75 W TGP Intel Core i7-11800H 2.3GHz
GeForce RTX 3050 Ti Laptop GPU
min:
28 fps
~ 28 fps
289%
NVIDIA GeForce RTX 3070:
81 fps
168%
NVIDIA GeForce RTX 3060 Ti:
26.5 [X] Geekom Mini IT11 (Nvidia GeForce RTX 3060 Ti FE TB3) 959964
Intel Core i7-11390H 3.4GHz
NVIDIA GeForce RTX 3060 Ti
min:
16 fps, P1:
7 fps, max:
37 fps
27.3 [X] Huawei MateBook X Pro 2023 (Nvidia GeForce RTX 3060 Ti FE TB3) 959964
Intel Core i7-1360P 1.6GHz
NVIDIA GeForce RTX 3060 Ti
min:
16 fps, P1:
7 fps, max:
38 fps
31.5 [X] Intel NUC 12 Pro Kit NUC12WSKi7 928484
Intel Core i7-1260P 1.5GHz
NVIDIA GeForce RTX 3060 Ti
min:
21 fps, P1:
18 fps, max:
39 fps
73.7 [X] Nvidia GeForce RTX 3060 Ti FE 918016
AMD Ryzen 9 7900X 4.7GHz
NVIDIA GeForce RTX 3060 Ti
min:
62 fps, P1:
61 fps, max:
85 fps
77.7 [X] Nvidia GeForce RTX 3060 Ti FE 923650
AMD Ryzen 9 7950X 4.5GHz
NVIDIA GeForce RTX 3060 Ti
min:
66 fps, P1:
65 fps, max:
92 fps
~ 47 fps
100%
GeForce RTX 3050 Ti Laptop GPU:
10 13.7 16.1 17.4 [X] Asus VivoBook Pro 16 959964
Intel Core i7-12700H 1.7GHz
GeForce RTX 3050 Ti Laptop GPU
min:
14 fps, P1:
13 fps, max:
20 fps
~ 14 fps
371%
NVIDIA GeForce RTX 3070:
52 fps
257%
NVIDIA GeForce RTX 3060 Ti:
25.3 [X] Geekom Mini IT11 (Nvidia GeForce RTX 3060 Ti FE TB3) 959964
Intel Core i7-11390H 3.4GHz
NVIDIA GeForce RTX 3060 Ti
min:
15 fps, P1:
7 fps, max:
38 fps
26.7 [X] Huawei MateBook X Pro 2023 (Nvidia GeForce RTX 3060 Ti FE TB3) 959964
Intel Core i7-1360P 1.6GHz
NVIDIA GeForce RTX 3060 Ti
min:
17 fps, P1:
8 fps, max:
38 fps
30.2 [X] Intel NUC 12 Pro Kit NUC12WSKi7 928484
Intel Core i7-1260P 1.5GHz
NVIDIA GeForce RTX 3060 Ti
min:
20 fps, P1:
18 fps, max:
37 fps
46.7 [X] Nvidia GeForce RTX 3060 Ti FE 918016
AMD Ryzen 9 7900X 4.7GHz
NVIDIA GeForce RTX 3060 Ti
min:
40 fps, P1:
39 fps, max:
55 fps
49.3 [X] Nvidia GeForce RTX 3060 Ti FE 923650
AMD Ryzen 9 7950X 4.5GHz
NVIDIA GeForce RTX 3060 Ti
min:
42 fps, P1:
41 fps, max:
58 fps
~ 36 fps
100%
GeForce RTX 3050 Ti Laptop GPU:
4 fps
625%
NVIDIA GeForce RTX 3070:
25 fps
525%
NVIDIA GeForce RTX 3060 Ti:
18.9 [X] Huawei MateBook X Pro 2023 (Nvidia GeForce RTX 3060 Ti FE TB3) 959964
Intel Core i7-1360P 1.6GHz
NVIDIA GeForce RTX 3060 Ti
min:
14 fps, P1:
7 fps, max:
24 fps
19 [X] Geekom Mini IT11 (Nvidia GeForce RTX 3060 Ti FE TB3) 959964
Intel Core i7-11390H 3.4GHz
NVIDIA GeForce RTX 3060 Ti
min:
13 fps, P1:
7 fps, max:
24 fps
21.1 [X] Intel NUC 12 Pro Kit NUC12WSKi7 928484
Intel Core i7-1260P 1.5GHz
NVIDIA GeForce RTX 3060 Ti
min:
16 fps, P1:
14 fps, max:
24 fps
22.9 [X] Nvidia GeForce RTX 3060 Ti FE 918016
AMD Ryzen 9 7900X 4.7GHz
NVIDIA GeForce RTX 3060 Ti
min:
19 fps, P1:
19 fps, max:
26 fps
23.8 [X] Nvidia GeForce RTX 3060 Ti FE 923650
AMD Ryzen 9 7950X 4.5GHz
NVIDIA GeForce RTX 3060 Ti
min:
20 fps, P1:
19 fps, max:
28 fps
~ 21 fps
100%
GeForce RTX 3050 Ti Laptop GPU:
241 [X] XMG Focus 17 @75 W TGP Intel Core i7-11800H 2.3GHz
GeForce RTX 3050 Ti Laptop GPU
min:
91.3 fps, P0.1:
111.6 fps, P1:
156.2 fps, max:
504 fps
fps
169%
NVIDIA GeForce RTX 3060 Ti:
407 [X] Nvidia GeForce RTX 3060 Ti FE AMD Ryzen 9 5900X 3.7GHz
NVIDIA GeForce RTX 3060 Ti
min:
33.9 fps, P0.1:
173.7 fps, P1:
284 fps, max:
616 fps
fps
100%
GeForce RTX 3050 Ti Laptop GPU:
111.8 132.4 [X] HP Victus 16-e0145ng AMD Ryzen 5 5600H 3.3GHz
GeForce RTX 3050 Ti Laptop GPU
min:
26.9 fps, P0.1:
73.2 fps, P1:
90.9 fps, max:
250 fps
137.7 [X] XMG Focus 17 @75 W TGP Intel Core i7-11800H 2.3GHz
GeForce RTX 3050 Ti Laptop GPU
min:
17.6 fps, P0.1:
81.1 fps, P1:
97.9 fps, max:
317 fps
~ 127 fps
235%
NVIDIA GeForce RTX 3070:
299 [X] Desktop-PC Intel Core i9-12900K 3.2GHz
NVIDIA GeForce RTX 3070
min:
96.4 fps, P0.1:
188.8 fps, P1:
225 fps, max:
543 fps
fps
175%
NVIDIA GeForce RTX 3060 Ti:
222 [X] Nvidia GeForce RTX 3060 Ti FE AMD Ryzen 9 5900X 3.7GHz
NVIDIA GeForce RTX 3060 Ti
min:
38.8 fps, P0.1:
124.6 fps, P1:
166 fps, max:
402 fps
fps
100%
GeForce RTX 3050 Ti Laptop GPU:
86.2 [X] HP Victus 16-e0145ng AMD Ryzen 5 5600H 3.3GHz
GeForce RTX 3050 Ti Laptop GPU
min:
17.2 fps, P0.1:
32.4 fps, P1:
43.3 fps, max:
241 fps
110.9 126.2 [X] XMG Focus 17 @75 W TGP Intel Core i7-11800H 2.3GHz
GeForce RTX 3050 Ti Laptop GPU
min:
7.98 fps, P0.1:
65.5 fps, P1:
84.7 fps, max:
251 fps
~ 108 fps
258%
NVIDIA GeForce RTX 3070:
279 [X] Desktop-PC Intel Core i9-12900K 3.2GHz
NVIDIA GeForce RTX 3070
min:
150 fps, P0.1:
186.9 fps, P1:
212 fps, max:
478 fps
fps
200%
NVIDIA GeForce RTX 3060 Ti:
216 [X] Nvidia GeForce RTX 3060 Ti FE AMD Ryzen 9 5900X 3.7GHz
NVIDIA GeForce RTX 3060 Ti
min:
23.6 fps, P0.1:
118 fps, P1:
164.3 fps, max:
347 fps
fps
100%
GeForce RTX 3050 Ti Laptop GPU:
86.1 [X] HP Victus 16-e0145ng AMD Ryzen 5 5600H 3.3GHz
GeForce RTX 3050 Ti Laptop GPU
min:
26.2 fps, P0.1:
33.2 fps, P1:
40 fps, max:
235 fps
106.1 122.8 [X] XMG Focus 17 @75 W TGP Intel Core i7-11800H 2.3GHz
GeForce RTX 3050 Ti Laptop GPU
min:
57.5 fps, P0.1:
69 fps, P1:
86.9 fps, max:
286 fps
~ 105 fps
253%
NVIDIA GeForce RTX 3070:
266 [X] Desktop-PC Intel Core i9-12900K 3.2GHz
NVIDIA GeForce RTX 3070
min:
51.6 fps, P0.1:
172.8 fps, P1:
199.6 fps, max:
443 fps
fps
230%
NVIDIA GeForce RTX 3060 Ti:
241 [X] Nvidia GeForce RTX 3060 Ti FE AMD Ryzen 9 5900X 3.7GHz
NVIDIA GeForce RTX 3060 Ti
min:
39.5 fps, P0.1:
111.6 fps, P1:
179.6 fps, max:
400 fps
fps
NVIDIA GeForce RTX 3070:
181.3 [X] Desktop-PC Intel Core i9-12900K 3.2GHz
NVIDIA GeForce RTX 3070
min:
56.7 fps, P0.1:
124.3 fps, P1:
138.7 fps, max:
348 fps
fps
NVIDIA GeForce RTX 3060 Ti:
146.3 [X] Nvidia GeForce RTX 3060 Ti FE AMD Ryzen 9 5900X 3.7GHz
NVIDIA GeForce RTX 3060 Ti
min:
26.2 fps, P0.1:
73.1 fps, P1:
112.6 fps, max:
289 fps
fps
NVIDIA GeForce RTX 3070:
95.9 [X] Desktop-PC Intel Core i9-12900K 3.2GHz
NVIDIA GeForce RTX 3070
min:
42.1 fps, P0.1:
61.4 fps, P1:
72.6 fps, max:
218 fps
fps
NVIDIA GeForce RTX 3060 Ti:
74.9 [X] Nvidia GeForce RTX 3060 Ti FE AMD Ryzen 9 5900X 3.7GHz
NVIDIA GeForce RTX 3060 Ti
min:
3.35 fps, P0.1:
25.9 fps, P1:
58.5 fps, max:
312 fps
fps
NVIDIA GeForce RTX 3060 Ti:
179.4 [X] Nvidia GeForce RTX 3060 Ti FE AMD Ryzen 9 5900X 3.7GHz
NVIDIA GeForce RTX 3060 Ti
min:
31.5 fps, P0.1:
93.9 fps, P1:
130.1 fps, max:
273 fps
207 [X] Nvidia GeForce RTX 3060 Ti FE AMD Ryzen 9 7950X 4.5GHz
NVIDIA GeForce RTX 3060 Ti
min:
56.2 fps, P0.1:
116.7 fps, P1:
147.9 fps, max:
331 fps
~ 193 fps
100%
GeForce RTX 3050 Ti Laptop GPU:
79.5 91.1 [X] HP Victus 16-e0145ng AMD Ryzen 5 5600H 3.3GHz
GeForce RTX 3050 Ti Laptop GPU
min:
24.5 fps, P0.1:
41.1 fps, P1:
58.9 fps, max:
189 fps
91.5 [X] XMG Focus 17 @75 W TGP Intel Core i7-11800H 2.3GHz
GeForce RTX 3050 Ti Laptop GPU
min:
32.7 fps, P0.1:
40.2 fps, P1:
55.9 fps, max:
213 fps
~ 87 fps
230%
NVIDIA GeForce RTX 3070:
200 [X] Desktop-PC Intel Core i9-12900K 3.2GHz
NVIDIA GeForce RTX 3070
min:
31.8 fps, P0.1:
60.6 fps, P1:
129.9 fps, max:
346 fps
fps
217%
NVIDIA GeForce RTX 3060 Ti:
179.5 [X] Nvidia GeForce RTX 3060 Ti FE AMD Ryzen 9 5900X 3.7GHz
NVIDIA GeForce RTX 3060 Ti
min:
33.1 fps, P0.1:
101.2 fps, P1:
130.3 fps, max:
274 fps
197.7 [X] Nvidia GeForce RTX 3060 Ti FE AMD Ryzen 9 7950X 4.5GHz
NVIDIA GeForce RTX 3060 Ti
min:
50.9 fps, P0.1:
129 fps, P1:
140.4 fps, max:
308 fps
~ 189 fps
100%
GeForce RTX 3050 Ti Laptop GPU:
76.8 88.6 [X] XMG Focus 17 @75 W TGP Intel Core i7-11800H 2.3GHz
GeForce RTX 3050 Ti Laptop GPU
min:
31.4 fps, P0.1:
45.3 fps, P1:
55.7 fps, max:
210 fps
90 [X] HP Victus 16-e0145ng AMD Ryzen 5 5600H 3.3GHz
GeForce RTX 3050 Ti Laptop GPU
min:
35.7 fps, P0.1:
41.1 fps, P1:
57.6 fps, max:
178.5 fps
~ 85 fps
233%
NVIDIA GeForce RTX 3070:
198 [X] Desktop-PC Intel Core i9-12900K 3.2GHz
NVIDIA GeForce RTX 3070
min:
46.3 fps, P0.1:
56.4 fps, P1:
128.5 fps, max:
354 fps
fps
251%
NVIDIA GeForce RTX 3060 Ti:
192.3 [X] Nvidia GeForce RTX 3060 Ti FE AMD Ryzen 9 7950X 4.5GHz
NVIDIA GeForce RTX 3060 Ti
min:
57.4 fps, P0.1:
122.4 fps, P1:
134.1 fps, max:
327 fps
234 [X] Nvidia GeForce RTX 3060 Ti FE AMD Ryzen 9 5900X 3.7GHz
NVIDIA GeForce RTX 3060 Ti
min:
32.2 fps, P0.1:
101.2 fps, P1:
180.9 fps, max:
295 fps
~ 213 fps
100%
GeForce RTX 3050 Ti Laptop GPU:
75.9 86.8 [X] XMG Focus 17 @75 W TGP Intel Core i7-11800H 2.3GHz
GeForce RTX 3050 Ti Laptop GPU
min:
33.5 fps, P0.1:
44.1 fps, P1:
53.7 fps, max:
196.4 fps
88.2 [X] HP Victus 16-e0145ng AMD Ryzen 5 5600H 3.3GHz
GeForce RTX 3050 Ti Laptop GPU
min:
26.5 fps, P0.1:
39.4 fps, P1:
58.5 fps, max:
184.8 fps
~ 84 fps
232%
NVIDIA GeForce RTX 3070:
195.1 [X] Desktop-PC Intel Core i9-12900K 3.2GHz
NVIDIA GeForce RTX 3070
min:
38.1 fps, P0.1:
60.2 fps, P1:
132.3 fps, max:
331 fps
fps
221%
NVIDIA GeForce RTX 3060 Ti:
182.2 [X] Nvidia GeForce RTX 3060 Ti FE AMD Ryzen 9 5900X 3.7GHz
NVIDIA GeForce RTX 3060 Ti
min:
33.2 fps, P0.1:
98 fps, P1:
130.3 fps, max:
276 fps
189.7 [X] Nvidia GeForce RTX 3060 Ti FE AMD Ryzen 9 7950X 4.5GHz
NVIDIA GeForce RTX 3060 Ti
min:
60 fps, P0.1:
119.3 fps, P1:
130 fps, max:
313 fps
~ 186 fps
100%
GeForce RTX 3050 Ti Laptop GPU:
55.2 [X] XMG Focus 17 @75 W TGP Intel Core i7-11800H 2.3GHz
GeForce RTX 3050 Ti Laptop GPU
min:
17.6 fps, P0.1:
26.2 fps, P1:
32.3 fps, max:
196.6 fps
fps
236%
NVIDIA GeForce RTX 3070:
130.4 [X] Desktop-PC Intel Core i9-12900K 3.2GHz
NVIDIA GeForce RTX 3070
min:
31.5 fps, P0.1:
55.2 fps, P1:
83.1 fps, max:
258 fps
fps
208%
NVIDIA GeForce RTX 3060 Ti:
114.8 [X] Nvidia GeForce RTX 3060 Ti FE AMD Ryzen 9 7950X 4.5GHz
NVIDIA GeForce RTX 3060 Ti
min:
45.5 fps, P0.1:
67 fps, P1:
70.2 fps, max:
280 fps
116.1 [X] Nvidia GeForce RTX 3060 Ti FE AMD Ryzen 9 5900X 3.7GHz
NVIDIA GeForce RTX 3060 Ti
min:
40 fps, P0.1:
60.5 fps, P1:
72.6 fps, max:
237 fps
~ 115 fps
100%
GeForce RTX 3050 Ti Laptop GPU:
17.1 [X] XMG Focus 17 @75 W TGP Intel Core i7-11800H 2.3GHz
GeForce RTX 3050 Ti Laptop GPU
min:
5.04 fps, P0.1:
5.22 fps, P1:
5.76 fps, max:
176.8 fps
fps
374%
NVIDIA GeForce RTX 3070:
63.9 [X] Desktop-PC Intel Core i9-12900K 3.2GHz
NVIDIA GeForce RTX 3070
min:
17.8 fps, P0.1:
30.9 fps, P1:
37 fps, max:
218 fps
fps
345%
NVIDIA GeForce RTX 3060 Ti:
58.2 [X] Nvidia GeForce RTX 3060 Ti FE AMD Ryzen 9 7950X 4.5GHz
NVIDIA GeForce RTX 3060 Ti
min:
27.3 fps, P0.1:
31.2 fps, P1:
32 fps, max:
277 fps
59.6 [X] Nvidia GeForce RTX 3060 Ti FE AMD Ryzen 9 5900X 3.7GHz
NVIDIA GeForce RTX 3060 Ti
min:
21.2 fps, P0.1:
25.4 fps, P1:
33.2 fps, max:
221 fps
~ 59 fps
NVIDIA GeForce RTX 3070:
248 fps
NVIDIA GeForce RTX 3060 Ti:
162.4 [X] Geekom Mini IT11 (Nvidia GeForce RTX 3060 Ti FE TB3) Intel Core i7-11390H 3.4GHz
NVIDIA GeForce RTX 3060 Ti
173.9 [X] Intel NUC 12 Pro Kit NUC12WSKi7 Intel Core i7-1260P 1.5GHz
NVIDIA GeForce RTX 3060 Ti
229 [X] Nvidia GeForce RTX 3060 Ti FE AMD Ryzen 9 5900X 3.7GHz
NVIDIA GeForce RTX 3060 Ti
257 [X] Nvidia GeForce RTX 3060 Ti FE AMD Ryzen 9 7900X 4.7GHz
NVIDIA GeForce RTX 3060 Ti
265 [X] Nvidia GeForce RTX 3060 Ti FE AMD Ryzen 9 7950X 4.5GHz
NVIDIA GeForce RTX 3060 Ti
~ 217 fps
100%
GeForce RTX 3050 Ti Laptop GPU:
80 [X] XMG Focus 17 @75 W TGP Intel Core i7-11800H 2.3GHz
GeForce RTX 3050 Ti Laptop GPU
92.1 99.3 ~ 90 fps
237%
NVIDIA GeForce RTX 3070:
204 221 [X] Desktop-PC Intel Core i9-12900K 3.2GHz
NVIDIA GeForce RTX 3070
~ 213 fps
193%
NVIDIA GeForce RTX 3060 Ti:
136.7 [X] Geekom Mini IT11 (Nvidia GeForce RTX 3060 Ti FE TB3) Intel Core i7-11390H 3.4GHz
NVIDIA GeForce RTX 3060 Ti
139.5 [X] Intel NUC 12 Pro Kit NUC12WSKi7 Intel Core i7-1260P 1.5GHz
NVIDIA GeForce RTX 3060 Ti
184.7 [X] Nvidia GeForce RTX 3060 Ti FE AMD Ryzen 9 5900X 3.7GHz
NVIDIA GeForce RTX 3060 Ti
202 [X] Nvidia GeForce RTX 3060 Ti FE AMD Ryzen 9 7900X 4.7GHz
NVIDIA GeForce RTX 3060 Ti
208 [X] Nvidia GeForce RTX 3060 Ti FE AMD Ryzen 9 7950X 4.5GHz
NVIDIA GeForce RTX 3060 Ti
~ 174 fps
100%
GeForce RTX 3050 Ti Laptop GPU:
64.7 [X] XMG Focus 17 @75 W TGP Intel Core i7-11800H 2.3GHz
GeForce RTX 3050 Ti Laptop GPU
67.2 68.6 ~ 67 fps
224%
NVIDIA GeForce RTX 3070:
145.8 155 [X] Desktop-PC Intel Core i9-12900K 3.2GHz
NVIDIA GeForce RTX 3070
~ 150 fps
179%
NVIDIA GeForce RTX 3060 Ti:
97.4 [X] Geekom Mini IT11 (Nvidia GeForce RTX 3060 Ti FE TB3) Intel Core i7-11390H 3.4GHz
NVIDIA GeForce RTX 3060 Ti
100.3 [X] Intel NUC 12 Pro Kit NUC12WSKi7 Intel Core i7-1260P 1.5GHz
NVIDIA GeForce RTX 3060 Ti
129.2 [X] Nvidia GeForce RTX 3060 Ti FE AMD Ryzen 9 5900X 3.7GHz
NVIDIA GeForce RTX 3060 Ti
134.3 [X] Nvidia GeForce RTX 3060 Ti FE AMD Ryzen 9 7900X 4.7GHz
NVIDIA GeForce RTX 3060 Ti
138.4 [X] Nvidia GeForce RTX 3060 Ti FE AMD Ryzen 9 7950X 4.5GHz
NVIDIA GeForce RTX 3060 Ti
~ 120 fps
100%
GeForce RTX 3050 Ti Laptop GPU:
49.5 [X] XMG Focus 17 @75 W TGP Intel Core i7-11800H 2.3GHz
GeForce RTX 3050 Ti Laptop GPU
51.7 51.8 ~ 51 fps
229%
NVIDIA GeForce RTX 3070:
113.9 121 [X] Desktop-PC Intel Core i9-12900K 3.2GHz
NVIDIA GeForce RTX 3070
~ 117 fps
186%
NVIDIA GeForce RTX 3060 Ti:
79.4 [X] Geekom Mini IT11 (Nvidia GeForce RTX 3060 Ti FE TB3) Intel Core i7-11390H 3.4GHz
NVIDIA GeForce RTX 3060 Ti
81.5 [X] Intel NUC 12 Pro Kit NUC12WSKi7 Intel Core i7-1260P 1.5GHz
NVIDIA GeForce RTX 3060 Ti
101.7 [X] Nvidia GeForce RTX 3060 Ti FE AMD Ryzen 9 5900X 3.7GHz
NVIDIA GeForce RTX 3060 Ti
104.4 [X] Nvidia GeForce RTX 3060 Ti FE AMD Ryzen 9 7900X 4.7GHz
NVIDIA GeForce RTX 3060 Ti
106.8 [X] Nvidia GeForce RTX 3060 Ti FE AMD Ryzen 9 7950X 4.5GHz
NVIDIA GeForce RTX 3060 Ti
~ 95 fps
100%
GeForce RTX 3050 Ti Laptop GPU:
24.6 [X] XMG Focus 17 @75 W TGP Intel Core i7-11800H 2.3GHz
GeForce RTX 3050 Ti Laptop GPU
fps
337%
NVIDIA GeForce RTX 3070:
80.7 85 [X] Desktop-PC Intel Core i9-12900K 3.2GHz
NVIDIA GeForce RTX 3070
~ 83 fps
280%
NVIDIA GeForce RTX 3060 Ti:
60.5 [X] Geekom Mini IT11 (Nvidia GeForce RTX 3060 Ti FE TB3) Intel Core i7-11390H 3.4GHz
NVIDIA GeForce RTX 3060 Ti
61.9 [X] Intel NUC 12 Pro Kit NUC12WSKi7 Intel Core i7-1260P 1.5GHz
NVIDIA GeForce RTX 3060 Ti
73.2 [X] Nvidia GeForce RTX 3060 Ti FE AMD Ryzen 9 7900X 4.7GHz
NVIDIA GeForce RTX 3060 Ti
74 [X] Nvidia GeForce RTX 3060 Ti FE AMD Ryzen 9 5900X 3.7GHz
NVIDIA GeForce RTX 3060 Ti
74.4 [X] Nvidia GeForce RTX 3060 Ti FE AMD Ryzen 9 7950X 4.5GHz
NVIDIA GeForce RTX 3060 Ti
~ 69 fps
100%
GeForce RTX 3050 Ti Laptop GPU:
9.6 [X] XMG Focus 17 @75 W TGP Intel Core i7-11800H 2.3GHz
GeForce RTX 3050 Ti Laptop GPU
fps
469%
NVIDIA GeForce RTX 3070:
44.4 46.4 [X] Desktop-PC Intel Core i9-12900K 3.2GHz
NVIDIA GeForce RTX 3070
~ 45 fps
375%
NVIDIA GeForce RTX 3060 Ti:
31.1 [X] Nvidia GeForce RTX 3060 Ti FE AMD Ryzen 9 5900X 3.7GHz
NVIDIA GeForce RTX 3060 Ti
35.7 [X] Geekom Mini IT11 (Nvidia GeForce RTX 3060 Ti FE TB3) Intel Core i7-11390H 3.4GHz
NVIDIA GeForce RTX 3060 Ti
36 [X] Intel NUC 12 Pro Kit NUC12WSKi7 Intel Core i7-1260P 1.5GHz
NVIDIA GeForce RTX 3060 Ti
38.5 [X] Nvidia GeForce RTX 3060 Ti FE AMD Ryzen 9 7900X 4.7GHz
NVIDIA GeForce RTX 3060 Ti
39.8 [X] Nvidia GeForce RTX 3060 Ti FE AMD Ryzen 9 7950X 4.5GHz
NVIDIA GeForce RTX 3060 Ti
~ 36 fps
100%
GeForce RTX 3050 Ti Laptop GPU:
48.2 55 56 59.4 62 70.6 78.3 79.5 81.9 [X] XMG Focus 17 @75 W TGP Intel Core i7-11800H 2.3GHz
GeForce RTX 3050 Ti Laptop GPU
min:
42 fps
~ 66 fps
222%
NVIDIA GeForce RTX 3070:
146.7 fps
200%
NVIDIA GeForce RTX 3060 Ti:
78.4 [X] Nvidia GeForce RTX 3060 Ti FE AMD Ryzen 9 5900X 3.7GHz
NVIDIA GeForce RTX 3060 Ti
185.8 [X] Nvidia GeForce RTX 3060 Ti FE 1.5
AMD Ryzen 9 7950X 4.5GHz
NVIDIA GeForce RTX 3060 Ti
min:
94.4 fps, max:
279 fps
~ 132 fps
100%
GeForce RTX 3050 Ti Laptop GPU:
47.4 48 49 50 59 60 65.7 66.2 67.4 [X] XMG Focus 17 @75 W TGP Intel Core i7-11800H 2.3GHz
GeForce RTX 3050 Ti Laptop GPU
min:
48 fps
~ 57 fps
244%
NVIDIA GeForce RTX 3070:
133 [X] MSI GeForce RTX 3070 Ventus 3X Intel Core i9-9900K 3.6GHz
NVIDIA GeForce RTX 3070
min:
53 fps
145.1 ~ 139 fps
198%
NVIDIA GeForce RTX 3060 Ti:
78.2 [X] Nvidia GeForce RTX 3060 Ti FE AMD Ryzen 9 5900X 3.7GHz
NVIDIA GeForce RTX 3060 Ti
147.3 [X] Nvidia GeForce RTX 3060 Ti FE 1.5
AMD Ryzen 9 7950X 4.5GHz
NVIDIA GeForce RTX 3060 Ti
min:
99.5 fps, max:
226 fps
~ 113 fps
100%
GeForce RTX 3050 Ti Laptop GPU:
39 39.3 40 42 44.5 46.9 47.9 50 51.5 [X] XMG Focus 17 @75 W TGP Intel Core i7-11800H 2.3GHz
GeForce RTX 3050 Ti Laptop GPU
min:
15 fps
~ 45 fps
280%
NVIDIA GeForce RTX 3070:
116 [X] MSI GeForce RTX 3070 Ventus 3X Intel Core i9-9900K 3.6GHz
NVIDIA GeForce RTX 3070
min:
72 fps
136 ~ 126 fps
211%
NVIDIA GeForce RTX 3060 Ti:
77.6 [X] Nvidia GeForce RTX 3060 Ti FE AMD Ryzen 9 5900X 3.7GHz
NVIDIA GeForce RTX 3060 Ti
111.4 [X] Nvidia GeForce RTX 3060 Ti FE 1.5
AMD Ryzen 9 7950X 4.5GHz
NVIDIA GeForce RTX 3060 Ti
min:
85.3 fps, max:
146.2 fps
~ 95 fps
100%
GeForce RTX 3050 Ti Laptop GPU:
31 36.8 37 39.5 39.5 40 44 49.9 [X] XMG Focus 17 @75 W TGP Intel Core i7-11800H 2.3GHz
GeForce RTX 3050 Ti Laptop GPU
min:
24 fps
50.5 ~ 41 fps
249%
NVIDIA GeForce RTX 3070:
90.3 114 [X] MSI GeForce RTX 3070 Ventus 3X Intel Core i9-9900K 3.6GHz
NVIDIA GeForce RTX 3070
min:
69 fps
~ 102 fps
205%
NVIDIA GeForce RTX 3060 Ti:
76.7 [X] Nvidia GeForce RTX 3060 Ti FE AMD Ryzen 9 5900X 3.7GHz
NVIDIA GeForce RTX 3060 Ti
91.6 [X] Nvidia GeForce RTX 3060 Ti FE 1.5
AMD Ryzen 9 7950X 4.5GHz
NVIDIA GeForce RTX 3060 Ti
min:
62.2 fps, max:
123.1 fps
~ 84 fps
100%
GeForce RTX 3050 Ti Laptop GPU:
20 20.2 23.4 25 [X] XMG Focus 17 @75 W TGP Intel Core i7-11800H 2.3GHz
GeForce RTX 3050 Ti Laptop GPU
min:
17 fps
~ 22 fps
282%
NVIDIA GeForce RTX 3070:
60.6 62.7 [X] MSI GeForce RTX 3070 Ventus 3X Intel Core i9-9900K 3.6GHz
NVIDIA GeForce RTX 3070
min:
43 fps
~ 62 fps
245%
NVIDIA GeForce RTX 3060 Ti:
51.8 [X] Nvidia GeForce RTX 3060 Ti FE AMD Ryzen 9 5900X 3.7GHz
NVIDIA GeForce RTX 3060 Ti
56.9 [X] Nvidia GeForce RTX 3060 Ti FE 1.5
AMD Ryzen 9 7950X 4.5GHz
NVIDIA GeForce RTX 3060 Ti
min:
36.3 fps, max:
91.4 fps
~ 54 fps
100%
GeForce RTX 3050 Ti Laptop GPU:
10.4 [X] XMG Focus 17 @75 W TGP Intel Core i7-11800H 2.3GHz
GeForce RTX 3050 Ti Laptop GPU
min:
8 fps
fps
288%
NVIDIA GeForce RTX 3070:
29 30.2 [X] MSI GeForce RTX 3070 Ventus 3X Intel Core i9-9900K 3.6GHz
NVIDIA GeForce RTX 3070
min:
21 fps
~ 30 fps
240%
NVIDIA GeForce RTX 3060 Ti:
24.7 [X] Nvidia GeForce RTX 3060 Ti FE AMD Ryzen 9 5900X 3.7GHz
NVIDIA GeForce RTX 3060 Ti
26.1 [X] Nvidia GeForce RTX 3060 Ti FE 1.5
AMD Ryzen 9 7950X 4.5GHz
NVIDIA GeForce RTX 3060 Ti
min:
17.9 fps, max:
34.6 fps
~ 25 fps
100%
GeForce RTX 3050 Ti Laptop GPU:
66 fps
100%
GeForce RTX 3050 Ti Laptop GPU:
52.2 55 62.8 [X] XMG Focus 17 @75 W TGP Intel Core i7-11800H 2.3GHz
GeForce RTX 3050 Ti Laptop GPU
min:
33.8 fps, P0.1:
36.6 fps, P1:
41.8 fps, max:
91.3 fps
~ 57 fps
170%
NVIDIA GeForce RTX 3070:
97 [X] MSI GeForce RTX 3070 Ventus 3X Intel Core i9-9900K 3.6GHz
NVIDIA GeForce RTX 3070
min:
36.9 fps, P0.1:
43.2 fps, P1:
70.7 fps, max:
139 fps
fps
188%
NVIDIA GeForce RTX 3060 Ti:
107.4 [X] Nvidia GeForce RTX 3060 Ti FE AMD Ryzen 9 5900X 3.7GHz
NVIDIA GeForce RTX 3060 Ti
min:
35.1 fps, P0.1:
69.3 fps, P1:
83.8 fps, max:
163.8 fps
fps
100%
GeForce RTX 3050 Ti Laptop GPU:
50.9 53 55 [X] XMG Focus 17 @75 W TGP Intel Core i7-11800H 2.3GHz
GeForce RTX 3050 Ti Laptop GPU
min:
29.4 fps, P0.1:
33.1 fps, P1:
42.9 fps, max:
86.8 fps
~ 53 fps
165%
NVIDIA GeForce RTX 3070:
87.2 [X] MSI GeForce RTX 3070 Ventus 3X Intel Core i9-9900K 3.6GHz
NVIDIA GeForce RTX 3070
min:
22.1 fps, P0.1:
54.4 fps, P1:
66 fps, max:
127 fps
fps
183%
NVIDIA GeForce RTX 3060 Ti:
93.4 [X] Nvidia GeForce RTX 3060 Ti FE AMD Ryzen 9 5900X 3.7GHz
NVIDIA GeForce RTX 3060 Ti
min:
29.4 fps, P0.1:
47 fps, P1:
73.5 fps, max:
149.4 fps
99.9 [X] Nvidia GeForce RTX 3060 Ti FE AMD Ryzen 9 5900X 3.7GHz
NVIDIA GeForce RTX 3060 Ti
min:
21.9 fps, P0.1:
30.8 fps, P1:
75.2 fps, max:
152.1 fps
~ 97 fps
100%
GeForce RTX 3050 Ti Laptop GPU:
46.1 48 49.6 [X] XMG Focus 17 @75 W TGP Intel Core i7-11800H 2.3GHz
GeForce RTX 3050 Ti Laptop GPU
min:
33.1 fps, P0.1:
33.8 fps, P1:
41 fps, max:
74.8 fps
~ 48 fps
173%
NVIDIA GeForce RTX 3070:
82.8 [X] MSI GeForce RTX 3070 Ventus 3X Intel Core i9-9900K 3.6GHz
NVIDIA GeForce RTX 3070
min:
32.7 fps, P0.1:
39 fps, P1:
62.3 fps, max:
121 fps
fps
184%
NVIDIA GeForce RTX 3060 Ti:
88.3 [X] Nvidia GeForce RTX 3060 Ti FE AMD Ryzen 9 5900X 3.7GHz
NVIDIA GeForce RTX 3060 Ti
min:
19.5 fps, P0.1:
32.8 fps, P1:
70.8 fps, max:
124.7 fps
fps
100%
GeForce RTX 3050 Ti Laptop GPU:
31 35.2 [X] XMG Focus 17 @75 W TGP Intel Core i7-11800H 2.3GHz
GeForce RTX 3050 Ti Laptop GPU
min:
26.8 fps, P0.1:
27.9 fps, P1:
30.1 fps, max:
56.2 fps
~ 33 fps
227%
NVIDIA GeForce RTX 3070:
74.9 [X] MSI GeForce RTX 3070 Ventus 3X Intel Core i9-9900K 3.6GHz
NVIDIA GeForce RTX 3070
min:
45.2 fps, P0.1:
47.6 fps, P1:
52.6 fps, max:
108 fps
fps
211%
NVIDIA GeForce RTX 3060 Ti:
69.5 [X] Nvidia GeForce RTX 3060 Ti FE AMD Ryzen 9 5900X 3.7GHz
NVIDIA GeForce RTX 3060 Ti
min:
38.8 fps, P0.1:
56.2 fps, P1:
59.5 fps, max:
91.6 fps
fps
100%
GeForce RTX 3050 Ti Laptop GPU:
14.3 [X] XMG Focus 17 @75 W TGP Intel Core i7-11800H 2.3GHz
GeForce RTX 3050 Ti Laptop GPU
min:
10.9 fps, P0.1:
11 fps, P1:
12.2 fps, max:
17.2 fps
16 ~ 15 fps
299%
NVIDIA GeForce RTX 3070:
44.9 [X] MSI GeForce RTX 3070 Ventus 3X Intel Core i9-9900K 3.6GHz
NVIDIA GeForce RTX 3070
min:
22.3 fps, P0.1:
30.2 fps, P1:
37.3 fps, max:
81.3 fps
fps
275%
NVIDIA GeForce RTX 3060 Ti:
41.2 [X] Nvidia GeForce RTX 3060 Ti FE AMD Ryzen 9 5900X 3.7GHz
NVIDIA GeForce RTX 3060 Ti
min:
18.3 fps, P0.1:
32.3 fps, P1:
36.5 fps, max:
87.6 fps
fps
100%
GeForce RTX 3050 Ti Laptop GPU:
66.6 91 ~ 79 fps
315%
NVIDIA GeForce RTX 3070:
249 fps
276%
NVIDIA GeForce RTX 3060 Ti:
103 [X] Geekom Mini IT11 (Nvidia GeForce RTX 3060 Ti FE TB3) 800660
Intel Core i7-11390H 3.4GHz
NVIDIA GeForce RTX 3060 Ti
min:
55.7 fps, max:
184.4 fps
115.1 [X] Huawei MateBook X Pro 2023 (Nvidia GeForce RTX 3060 Ti FE TB3) 800660
Intel Core i7-1360P 1.6GHz
NVIDIA GeForce RTX 3060 Ti
min:
53.5 fps, max:
221 fps
227.4 [X] Nvidia GeForce RTX 3060 Ti FE AMD Ryzen 9 5900X 3.7GHz
NVIDIA GeForce RTX 3060 Ti
281.2 [X] Nvidia GeForce RTX 3060 Ti FE AMD Ryzen 9 7900X 4.7GHz
NVIDIA GeForce RTX 3060 Ti
362 [X] Nvidia GeForce RTX 3060 Ti FE 591708
AMD Ryzen 9 7950X 4.5GHz
NVIDIA GeForce RTX 3060 Ti
min:
58.6 fps, max:
500 fps
~ 218 fps
100%
GeForce RTX 3050 Ti Laptop GPU:
61.8 84 129 [X] XMG Focus 17 @75 W TGP Intel Core i7-11800H 2.3GHz
GeForce RTX 3050 Ti Laptop GPU
min:
105 fps
~ 92 fps
205%
NVIDIA GeForce RTX 3070:
154 [X] MSI GeForce RTX 3070 Ventus 3X Intel Core i9-9900K 3.6GHz
NVIDIA GeForce RTX 3070
min:
117 fps
224 ~ 189 fps
188%
NVIDIA GeForce RTX 3060 Ti:
91.2 [X] Geekom Mini IT11 (Nvidia GeForce RTX 3060 Ti FE TB3) 800660
Intel Core i7-11390H 3.4GHz
NVIDIA GeForce RTX 3060 Ti
min:
40.4 fps, max:
158.1 fps
99.2 [X] Huawei MateBook X Pro 2023 (Nvidia GeForce RTX 3060 Ti FE TB3) 800660
Intel Core i7-1360P 1.6GHz
NVIDIA GeForce RTX 3060 Ti
min:
42.6 fps, max:
176.6 fps
172.1 [X] Nvidia GeForce RTX 3060 Ti FE AMD Ryzen 9 5900X 3.7GHz
NVIDIA GeForce RTX 3060 Ti
222.3 [X] Nvidia GeForce RTX 3060 Ti FE AMD Ryzen 9 7900X 4.7GHz
NVIDIA GeForce RTX 3060 Ti
281 [X] Nvidia GeForce RTX 3060 Ti FE 591708
AMD Ryzen 9 7950X 4.5GHz
NVIDIA GeForce RTX 3060 Ti
min:
100.2 fps, max:
415 fps
~ 173 fps
100%
GeForce RTX 3050 Ti Laptop GPU:
57.1 73 107 [X] XMG Focus 17 @75 W TGP Intel Core i7-11800H 2.3GHz
GeForce RTX 3050 Ti Laptop GPU
min:
86 fps
~ 79 fps
210%
NVIDIA GeForce RTX 3070:
134 [X] MSI GeForce RTX 3070 Ventus 3X Intel Core i9-9900K 3.6GHz
NVIDIA GeForce RTX 3070
min:
105 fps
198 ~ 166 fps
185%
NVIDIA GeForce RTX 3060 Ti:
78.7 [X] Geekom Mini IT11 (Nvidia GeForce RTX 3060 Ti FE TB3) 800660
Intel Core i7-11390H 3.4GHz
NVIDIA GeForce RTX 3060 Ti
min:
34.6 fps, max:
134.2 fps
83.1 [X] Huawei MateBook X Pro 2023 (Nvidia GeForce RTX 3060 Ti FE TB3) 800660
Intel Core i7-1360P 1.6GHz
NVIDIA GeForce RTX 3060 Ti
min:
12.8 fps, max:
143.1 fps
154.8 [X] Nvidia GeForce RTX 3060 Ti FE AMD Ryzen 9 5900X 3.7GHz
NVIDIA GeForce RTX 3060 Ti
184.6 [X] Nvidia GeForce RTX 3060 Ti FE AMD Ryzen 9 7900X 4.7GHz
NVIDIA GeForce RTX 3060 Ti
228 [X] Nvidia GeForce RTX 3060 Ti FE 591708
AMD Ryzen 9 7950X 4.5GHz
NVIDIA GeForce RTX 3060 Ti
min:
100.2 fps, max:
361 fps
~ 146 fps
100%
GeForce RTX 3050 Ti Laptop GPU:
52.9 56 75.6 [X] XMG Focus 17 @75 W TGP Intel Core i7-11800H 2.3GHz
GeForce RTX 3050 Ti Laptop GPU
min:
56 fps
~ 62 fps
221%
NVIDIA GeForce RTX 3070:
123 [X] MSI GeForce RTX 3070 Ventus 3X Intel Core i9-9900K 3.6GHz
NVIDIA GeForce RTX 3070
min:
100 fps
151 ~ 137 fps
181%
NVIDIA GeForce RTX 3060 Ti:
68.9 [X] Geekom Mini IT11 (Nvidia GeForce RTX 3060 Ti FE TB3) 800660
Intel Core i7-11390H 3.4GHz
NVIDIA GeForce RTX 3060 Ti
min:
29.3 fps, max:
107.9 fps
70.7 [X] Huawei MateBook X Pro 2023 (Nvidia GeForce RTX 3060 Ti FE TB3) 800660
Intel Core i7-1360P 1.6GHz
NVIDIA GeForce RTX 3060 Ti
min:
24.2 fps, max:
113 fps
115.7 [X] Nvidia GeForce RTX 3060 Ti FE AMD Ryzen 9 5900X 3.7GHz
NVIDIA GeForce RTX 3060 Ti
137.5 [X] Nvidia GeForce RTX 3060 Ti FE AMD Ryzen 9 7900X 4.7GHz
NVIDIA GeForce RTX 3060 Ti
168.9 [X] Nvidia GeForce RTX 3060 Ti FE 591708
AMD Ryzen 9 7950X 4.5GHz
NVIDIA GeForce RTX 3060 Ti
min:
81.3 fps, max:
300 fps
~ 112 fps
100%
GeForce RTX 3050 Ti Laptop GPU:
58.7 [X] XMG Focus 17 @75 W TGP Intel Core i7-11800H 2.3GHz
GeForce RTX 3050 Ti Laptop GPU
min:
46 fps
fps
211%
NVIDIA GeForce RTX 3070:
121 [X] MSI GeForce RTX 3070 Ventus 3X Intel Core i9-9900K 3.6GHz
NVIDIA GeForce RTX 3070
min:
92 fps
127 ~ 124 fps
162%
NVIDIA GeForce RTX 3060 Ti:
62.3 [X] Geekom Mini IT11 (Nvidia GeForce RTX 3060 Ti FE TB3) 800660
Intel Core i7-11390H 3.4GHz
NVIDIA GeForce RTX 3060 Ti
min:
2.99 fps, max:
102.9 fps
64.3 [X] Huawei MateBook X Pro 2023 (Nvidia GeForce RTX 3060 Ti FE TB3) 800660
Intel Core i7-1360P 1.6GHz
NVIDIA GeForce RTX 3060 Ti
min:
29.8 fps, max:
106.7 fps
97.8 [X] Nvidia GeForce RTX 3060 Ti FE AMD Ryzen 9 5900X 3.7GHz
NVIDIA GeForce RTX 3060 Ti
115.7 [X] Nvidia GeForce RTX 3060 Ti FE AMD Ryzen 9 7900X 4.7GHz
NVIDIA GeForce RTX 3060 Ti
133.7 [X] Nvidia GeForce RTX 3060 Ti FE 591708
AMD Ryzen 9 7950X 4.5GHz
NVIDIA GeForce RTX 3060 Ti
min:
75.2 fps, max:
302 fps
~ 95 fps
100%
GeForce RTX 3050 Ti Laptop GPU:
33.6 [X] XMG Focus 17 @75 W TGP Intel Core i7-11800H 2.3GHz
GeForce RTX 3050 Ti Laptop GPU
min:
29 fps
fps
244%
NVIDIA GeForce RTX 3070:
80.4 [X] MSI GeForce RTX 3070 Ventus 3X Intel Core i9-9900K 3.6GHz
NVIDIA GeForce RTX 3070
min:
64 fps
84 ~ 82 fps
193%
NVIDIA GeForce RTX 3060 Ti:
49.2 [X] Geekom Mini IT11 (Nvidia GeForce RTX 3060 Ti FE TB3) 800660
Intel Core i7-11390H 3.4GHz
NVIDIA GeForce RTX 3060 Ti
min:
2.88 fps, max:
104.2 fps
51.1 [X] Huawei MateBook X Pro 2023 (Nvidia GeForce RTX 3060 Ti FE TB3) 800660
Intel Core i7-1360P 1.6GHz
NVIDIA GeForce RTX 3060 Ti
min:
31.5 fps, max:
99.4 fps
65.6 [X] Nvidia GeForce RTX 3060 Ti FE AMD Ryzen 9 5900X 3.7GHz
NVIDIA GeForce RTX 3060 Ti
77.4 [X] Nvidia GeForce RTX 3060 Ti FE AMD Ryzen 9 7900X 4.7GHz
NVIDIA GeForce RTX 3060 Ti
82.6 [X] Nvidia GeForce RTX 3060 Ti FE 591708
AMD Ryzen 9 7950X 4.5GHz
NVIDIA GeForce RTX 3060 Ti
min:
59.1 fps, max:
239 fps
~ 65 fps
NVIDIA GeForce RTX 3060 Ti:
59.9 [X] Nvidia GeForce RTX 3060 Ti FE AMD Ryzen 9 5900X 3.7GHz
NVIDIA GeForce RTX 3060 Ti
min:
27.3 fps, P0.1:
32.7 fps, P1:
51.1 fps, max:
114.7 fps
fps
100%
GeForce RTX 3050 Ti Laptop GPU:
55.4 59.4 [X] XMG Focus 17 @75 W TGP Intel Core i7-11800H 2.3GHz
GeForce RTX 3050 Ti Laptop GPU
min:
31.3 fps, P0.1:
32.2 fps, P1:
46.1 fps, max:
86.1 fps
59.6 [X] HP Victus 16-e0145ng AMD Ryzen 5 5600H 3.3GHz
GeForce RTX 3050 Ti Laptop GPU
min:
31.2 fps, P0.1:
37 fps, P1:
46.5 fps, max:
84 fps
~ 58 fps
102%
NVIDIA GeForce RTX 3070:
59.3 [X] MSI GeForce RTX 3070 Ventus 3X Intel Core i9-9900K 3.6GHz
NVIDIA GeForce RTX 3070
min:
33.3 fps, P0.1:
37.2 fps, P1:
44.9 fps, max:
84.1 fps
fps
102%
NVIDIA GeForce RTX 3060 Ti:
59.4 [X] Nvidia GeForce RTX 3060 Ti FE AMD Ryzen 9 5900X 3.7GHz
NVIDIA GeForce RTX 3060 Ti
min:
4.42 fps, P0.1:
23.8 fps, P1:
50.3 fps, max:
105.4 fps
fps
100%
GeForce RTX 3050 Ti Laptop GPU:
53.8 58.7 [X] XMG Focus 17 @75 W TGP Intel Core i7-11800H 2.3GHz
GeForce RTX 3050 Ti Laptop GPU
min:
25.9 fps, P0.1:
26.5 fps, P1:
40.6 fps, max:
89.4 fps
59.6 [X] HP Victus 16-e0145ng AMD Ryzen 5 5600H 3.3GHz
GeForce RTX 3050 Ti Laptop GPU
min:
30.4 fps, P0.1:
33 fps, P1:
47.2 fps, max:
80.2 fps
~ 57 fps
103%
NVIDIA GeForce RTX 3070:
58.8 [X] MSI GeForce RTX 3070 Ventus 3X Intel Core i9-9900K 3.6GHz
NVIDIA GeForce RTX 3070
min:
28.9 fps, P0.1:
31.9 fps, P1:
39.3 fps, max:
88.4 fps
fps
105%
NVIDIA GeForce RTX 3060 Ti:
59.9 [X] Nvidia GeForce RTX 3060 Ti FE AMD Ryzen 9 5900X 3.7GHz
NVIDIA GeForce RTX 3060 Ti
min:
29.7 fps, P0.1:
35.5 fps, P1:
51.2 fps, max:
96.8 fps
fps
100%
GeForce RTX 3050 Ti Laptop GPU:
52.7 55.9 [X] XMG Focus 17 @75 W TGP Intel Core i7-11800H 2.3GHz
GeForce RTX 3050 Ti Laptop GPU
min:
23.4 fps, P0.1:
26.2 fps, P1:
37.2 fps, max:
77.5 fps
56.2 [X] HP Victus 16-e0145ng AMD Ryzen 5 5600H 3.3GHz
GeForce RTX 3050 Ti Laptop GPU
min:
20.1 fps, P0.1:
30.4 fps, P1:
41.8 fps, max:
75.5 fps
~ 55 fps
107%
NVIDIA GeForce RTX 3070:
58.6 [X] MSI GeForce RTX 3070 Ventus 3X Intel Core i9-9900K 3.6GHz
NVIDIA GeForce RTX 3070
min:
32.4 fps, P0.1:
33.3 fps, P1:
38.4 fps, max:
78.6 fps
fps
109%
NVIDIA GeForce RTX 3060 Ti:
59.9 [X] Nvidia GeForce RTX 3060 Ti FE AMD Ryzen 9 5900X 3.7GHz
NVIDIA GeForce RTX 3060 Ti
min:
28.9 fps, P0.1:
36.1 fps, P1:
50.8 fps, max:
99.8 fps
fps
100%
GeForce RTX 3050 Ti Laptop GPU:
43.9 [X] XMG Focus 17 @75 W TGP Intel Core i7-11800H 2.3GHz
GeForce RTX 3050 Ti Laptop GPU
min:
17.6 fps, P0.1:
22.1 fps, P1:
31.1 fps, max:
75.9 fps
fps
133%
NVIDIA GeForce RTX 3070:
58.5 [X] MSI GeForce RTX 3070 Ventus 3X Intel Core i9-9900K 3.6GHz
NVIDIA GeForce RTX 3070
min:
28.4 fps, P0.1:
29.4 fps, P1:
38.5 fps, max:
83.5 fps
fps
136%
NVIDIA GeForce RTX 3060 Ti:
59.9 [X] Nvidia GeForce RTX 3060 Ti FE AMD Ryzen 9 5900X 3.7GHz
NVIDIA GeForce RTX 3060 Ti
min:
29.4 fps, P0.1:
36 fps, P1:
53.2 fps, max:
99.7 fps
fps
100%
GeForce RTX 3050 Ti Laptop GPU:
25.6 [X] XMG Focus 17 @75 W TGP Intel Core i7-11800H 2.3GHz
GeForce RTX 3050 Ti Laptop GPU
min:
12.3 fps, P0.1:
13.6 fps, P1:
16.3 fps, max:
88 fps
fps
223%
NVIDIA GeForce RTX 3070:
57.1 [X] MSI GeForce RTX 3070 Ventus 3X Intel Core i9-9900K 3.6GHz
NVIDIA GeForce RTX 3070
min:
29.1 fps, P0.1:
29.2 fps, P1:
36.9 fps, max:
79.3 fps
fps
193%
NVIDIA GeForce RTX 3060 Ti:
49.5 [X] Nvidia GeForce RTX 3060 Ti FE AMD Ryzen 9 5900X 3.7GHz
NVIDIA GeForce RTX 3060 Ti
min:
22.9 fps, P0.1:
23.1 fps, P1:
39.6 fps, max:
106.5 fps
fps
NVIDIA GeForce RTX 3060 Ti:
114.1 [X] Nvidia GeForce RTX 3060 Ti FE AMD Ryzen 9 5900X 3.7GHz
NVIDIA GeForce RTX 3060 Ti
min:
34.2 fps, P0.1:
46.3 fps, P1:
99.4 fps, max:
144.3 fps
fps
100%
GeForce RTX 3050 Ti Laptop GPU:
46.7 47 [X] HP Victus 16-e0145ng AMD Ryzen 5 5600H 3.3GHz
GeForce RTX 3050 Ti Laptop GPU
min:
42.2 fps, P0.1:
42.3 fps, P1:
43.9 fps, max:
52.8 fps
49.6 [X] XMG Focus 17 @75 W TGP Intel Core i7-11800H 2.3GHz
GeForce RTX 3050 Ti Laptop GPU
min:
42.7 fps, P0.1:
42.9 fps, P1:
45.5 fps, max:
57.3 fps
~ 48 fps
225%
NVIDIA GeForce RTX 3070:
108 [X] MSI GeForce RTX 3070 Ventus 3X Intel Core i9-9900K 3.6GHz
NVIDIA GeForce RTX 3070
min:
51.2 fps, P0.1:
59.5 fps, P1:
92 fps, max:
146 fps
fps
195%
NVIDIA GeForce RTX 3060 Ti:
93.8 [X] Nvidia GeForce RTX 3060 Ti FE AMD Ryzen 9 5900X 3.7GHz
NVIDIA GeForce RTX 3060 Ti
min:
30.3 fps, P0.1:
34.8 fps, P1:
84.1 fps, max:
112 fps
fps
100%
GeForce RTX 3050 Ti Laptop GPU:
38.8 39.6 [X] HP Victus 16-e0145ng AMD Ryzen 5 5600H 3.3GHz
GeForce RTX 3050 Ti Laptop GPU
min:
35.7 fps, P0.1:
35.8 fps, P1:
36.6 fps, max:
44.3 fps
44 [X] XMG Focus 17 @75 W TGP Intel Core i7-11800H 2.3GHz
GeForce RTX 3050 Ti Laptop GPU
min:
37 fps, P0.1:
38.4 fps, P1:
40.5 fps, max:
51.4 fps
~ 41 fps
239%
NVIDIA GeForce RTX 3070:
97.8 [X] MSI GeForce RTX 3070 Ventus 3X Intel Core i9-9900K 3.6GHz
NVIDIA GeForce RTX 3070
min:
52.8 fps, P0.1:
57.1 fps, P1:
86.1 fps, max:
133 fps
fps
198%
NVIDIA GeForce RTX 3060 Ti:
81 [X] Nvidia GeForce RTX 3060 Ti FE AMD Ryzen 9 5900X 3.7GHz
NVIDIA GeForce RTX 3060 Ti
min:
28.5 fps, P0.1:
29 fps, P1:
72.6 fps, max:
98.2 fps
fps
100%
GeForce RTX 3050 Ti Laptop GPU:
30.3 [X] XMG Focus 17 @75 W TGP Intel Core i7-11800H 2.3GHz
GeForce RTX 3050 Ti Laptop GPU
min:
26 fps, P0.1:
26.1 fps, P1:
27.9 fps, max:
35 fps
fps
231%
NVIDIA GeForce RTX 3070:
70.1 [X] MSI GeForce RTX 3070 Ventus 3X Intel Core i9-9900K 3.6GHz
NVIDIA GeForce RTX 3070
min:
46.9 fps, P0.1:
55.6 fps, P1:
65.1 fps, max:
83.4 fps
fps
193%
NVIDIA GeForce RTX 3060 Ti:
58.6 [X] Nvidia GeForce RTX 3060 Ti FE AMD Ryzen 9 5900X 3.7GHz
NVIDIA GeForce RTX 3060 Ti
min:
24.6 fps, P0.1:
26.5 fps, P1:
53.9 fps, max:
70.4 fps
fps
100%
GeForce RTX 3050 Ti Laptop GPU:
15.3 [X] XMG Focus 17 @75 W TGP Intel Core i7-11800H 2.3GHz
GeForce RTX 3050 Ti Laptop GPU
min:
13.7 fps, P0.1:
13.7 fps, P1:
13.8 fps, max:
18.1 fps
fps
250%
NVIDIA GeForce RTX 3070:
38.2 [X] MSI GeForce RTX 3070 Ventus 3X Intel Core i9-9900K 3.6GHz
NVIDIA GeForce RTX 3070
min:
28 fps, P0.1:
28.7 fps, P1:
34.4 fps, max:
46.1 fps
fps
208%
NVIDIA GeForce RTX 3060 Ti:
31.9 [X] Nvidia GeForce RTX 3060 Ti FE AMD Ryzen 9 5900X 3.7GHz
NVIDIA GeForce RTX 3060 Ti
min:
18.4 fps, P0.1:
18.9 fps, P1:
29.5 fps, max:
40 fps
fps
NVIDIA GeForce RTX 3060 Ti:
262 [X] Nvidia GeForce RTX 3060 Ti FE AMD Ryzen 9 5900X 3.7GHz
NVIDIA GeForce RTX 3060 Ti
fps
100%
GeForce RTX 3050 Ti Laptop GPU:
112 116 [X] XMG Focus 17 @75 W TGP Intel Core i7-11800H 2.3GHz
GeForce RTX 3050 Ti Laptop GPU
min:
84 fps
116 ~ 115 fps
231%
NVIDIA GeForce RTX 3070:
266 [X] MSI GeForce RTX 3070 Ventus 3X Intel Core i9-9900K 3.6GHz
NVIDIA GeForce RTX 3070
min:
205 fps
fps
178%
NVIDIA GeForce RTX 3060 Ti:
205 [X] Nvidia GeForce RTX 3060 Ti FE AMD Ryzen 9 5900X 3.7GHz
NVIDIA GeForce RTX 3060 Ti
fps
100%
GeForce RTX 3050 Ti Laptop GPU:
108 112 113 [X] XMG Focus 17 @75 W TGP Intel Core i7-11800H 2.3GHz
GeForce RTX 3050 Ti Laptop GPU
min:
85 fps
~ 111 fps
233%
NVIDIA GeForce RTX 3070:
259 [X] MSI GeForce RTX 3070 Ventus 3X Intel Core i9-9900K 3.6GHz
NVIDIA GeForce RTX 3070
min:
200 fps
fps
173%
NVIDIA GeForce RTX 3060 Ti:
192 [X] Nvidia GeForce RTX 3060 Ti FE AMD Ryzen 9 5900X 3.7GHz
NVIDIA GeForce RTX 3060 Ti
fps
100%
GeForce RTX 3050 Ti Laptop GPU:
67 [X] XMG Focus 17 @75 W TGP Intel Core i7-11800H 2.3GHz
GeForce RTX 3050 Ti Laptop GPU
min:
39 fps
83 86 ~ 79 fps
252%
NVIDIA GeForce RTX 3070:
199 [X] MSI GeForce RTX 3070 Ventus 3X Intel Core i9-9900K 3.6GHz
NVIDIA GeForce RTX 3070
min:
113 fps
fps
208%
NVIDIA GeForce RTX 3060 Ti:
164 [X] Nvidia GeForce RTX 3060 Ti FE AMD Ryzen 9 5900X 3.7GHz
NVIDIA GeForce RTX 3060 Ti
fps
100%
GeForce RTX 3050 Ti Laptop GPU:
36 [X] XMG Focus 17 @75 W TGP Intel Core i7-11800H 2.3GHz
GeForce RTX 3050 Ti Laptop GPU
min:
23 fps
fps
367%
NVIDIA GeForce RTX 3070:
132 [X] MSI GeForce RTX 3070 Ventus 3X Intel Core i9-9900K 3.6GHz
NVIDIA GeForce RTX 3070
min:
74 fps
fps
281%
NVIDIA GeForce RTX 3060 Ti:
101 [X] Nvidia GeForce RTX 3060 Ti FE AMD Ryzen 9 5900X 3.7GHz
NVIDIA GeForce RTX 3060 Ti
fps
100%
GeForce RTX 3050 Ti Laptop GPU:
19 [X] XMG Focus 17 @75 W TGP Intel Core i7-11800H 2.3GHz
GeForce RTX 3050 Ti Laptop GPU
min:
11 fps
fps
358%
NVIDIA GeForce RTX 3070:
68 [X] MSI GeForce RTX 3070 Ventus 3X Intel Core i9-9900K 3.6GHz
NVIDIA GeForce RTX 3070
min:
35 fps
fps
300%
NVIDIA GeForce RTX 3060 Ti:
57 [X] Nvidia GeForce RTX 3060 Ti FE AMD Ryzen 9 5900X 3.7GHz
NVIDIA GeForce RTX 3060 Ti
fps
100%
GeForce RTX 3050 Ti Laptop GPU:
79.5 [X] XMG Focus 17 @75 W TGP Intel Core i7-11800H 2.3GHz
GeForce RTX 3050 Ti Laptop GPU
min:
58.3 fps, P0.1:
58.7 fps, P1:
66.3 fps, max:
122 fps
fps
179%
NVIDIA GeForce RTX 3070:
142.3 142.3 ~ 142 fps
167%
NVIDIA GeForce RTX 3060 Ti:
102 [X] Geekom Mini IT11 (Nvidia GeForce RTX 3060 Ti FE TB3) Intel Core i7-11390H 3.4GHz
NVIDIA GeForce RTX 3060 Ti
min:
54.8 fps, P0.1:
59.5 fps, P1:
76.4 fps, max:
213 fps
108.2 [X] Huawei MateBook X Pro 2023 (Nvidia GeForce RTX 3060 Ti FE TB3) Intel Core i7-1360P 1.6GHz
NVIDIA GeForce RTX 3060 Ti
min:
66.3 fps, P0.1:
69.9 fps, P1:
77.4 fps, max:
212 fps
140.6 [X] Nvidia GeForce RTX 3060 Ti FE AMD Ryzen 9 5900X 3.7GHz
NVIDIA GeForce RTX 3060 Ti
min:
86.5 fps, P0.1:
101.3 fps, P1:
112.1 fps, max:
249 fps
149.3 [X] Nvidia GeForce RTX 3060 Ti FE AMD Ryzen 9 7950X 4.5GHz
NVIDIA GeForce RTX 3060 Ti
min:
122.7 fps, P0.1:
125.5 fps, P1:
132.5 fps, max:
195.8 fps
164.5 [X] Nvidia GeForce RTX 3060 Ti FE AMD Ryzen 9 7900X 4.7GHz
NVIDIA GeForce RTX 3060 Ti
min:
91.2 fps, P0.1:
106.4 fps, P1:
128.6 fps, max:
367 fps
~ 133 fps
100%
GeForce RTX 3050 Ti Laptop GPU:
60.7 63.2 [X] XMG Focus 17 @75 W TGP Intel Core i7-11800H 2.3GHz
GeForce RTX 3050 Ti Laptop GPU
min:
35.3 fps, P0.1:
44.6 fps, P1:
51.1 fps, max:
138 fps
64.3 [X] HP Victus 16-e0145ng AMD Ryzen 5 5600H 3.3GHz
GeForce RTX 3050 Ti Laptop GPU
min:
26.4 fps, P0.1:
47.9 fps, P1:
54.6 fps, max:
99.6 fps
~ 63 fps
219%
NVIDIA GeForce RTX 3070:
132 [X] MSI GeForce RTX 3070 Ventus 3X Intel Core i9-9900K 3.6GHz
NVIDIA GeForce RTX 3070
min:
62.7 fps, P0.1:
81.9 fps, P1:
97.3 fps, max:
231 fps
140.5 140.5 ~ 138 fps
183%
NVIDIA GeForce RTX 3060 Ti:
93.1 [X] Geekom Mini IT11 (Nvidia GeForce RTX 3060 Ti FE TB3) Intel Core i7-11390H 3.4GHz
NVIDIA GeForce RTX 3060 Ti
min:
52.4 fps, P0.1:
59.1 fps, P1:
68.5 fps, max:
213 fps
96.1 [X] Huawei MateBook X Pro 2023 (Nvidia GeForce RTX 3060 Ti FE TB3) Intel Core i7-1360P 1.6GHz
NVIDIA GeForce RTX 3060 Ti
min:
56 fps, P0.1:
60.7 fps, P1:
72 fps, max:
183.7 fps
119.7 [X] Nvidia GeForce RTX 3060 Ti FE AMD Ryzen 9 5900X 3.7GHz
NVIDIA GeForce RTX 3060 Ti
min:
78.7 fps, P0.1:
87.9 fps, P1:
100.4 fps, max:
198.1 fps
126.3 [X] Nvidia GeForce RTX 3060 Ti FE AMD Ryzen 9 7950X 4.5GHz
NVIDIA GeForce RTX 3060 Ti
min:
93.6 fps, P0.1:
106.5 fps, P1:
113.5 fps, max:
176.9 fps
138.6 [X] Nvidia GeForce RTX 3060 Ti FE AMD Ryzen 9 7900X 4.7GHz
NVIDIA GeForce RTX 3060 Ti
min:
77.7 fps, P0.1:
107.9 fps, P1:
117.4 fps, max:
441 fps
~ 115 fps
100%
GeForce RTX 3050 Ti Laptop GPU:
48.6 50.3 [X] HP Victus 16-e0145ng AMD Ryzen 5 5600H 3.3GHz
GeForce RTX 3050 Ti Laptop GPU
min:
37.7 fps, P0.1:
39.2 fps, P1:
43.6 fps, max:
71 fps
51.4 [X] XMG Focus 17 @75 W TGP Intel Core i7-11800H 2.3GHz
GeForce RTX 3050 Ti Laptop GPU
min:
39.2 fps, P0.1:
41.2 fps, P1:
44.7 fps, max:
67.1 fps
~ 50 fps
234%
NVIDIA GeForce RTX 3070:
116 [X] MSI GeForce RTX 3070 Ventus 3X Intel Core i9-9900K 3.6GHz
NVIDIA GeForce RTX 3070
min:
51.1 fps, P0.1:
71.5 fps, P1:
86.5 fps, max:
247 fps
117.8 117.8 ~ 117 fps
186%
NVIDIA GeForce RTX 3060 Ti:
78.7 [X] Geekom Mini IT11 (Nvidia GeForce RTX 3060 Ti FE TB3) Intel Core i7-11390H 3.4GHz
NVIDIA GeForce RTX 3060 Ti
min:
43.5 fps, P0.1:
56.3 fps, P1:
62.8 fps, max:
196.3 fps
80.1 [X] Huawei MateBook X Pro 2023 (Nvidia GeForce RTX 3060 Ti FE TB3) Intel Core i7-1360P 1.6GHz
NVIDIA GeForce RTX 3060 Ti
min:
52.7 fps, P0.1:
54.8 fps, P1:
62.4 fps, max:
157.3 fps
95.3 [X] Nvidia GeForce RTX 3060 Ti FE AMD Ryzen 9 5900X 3.7GHz
NVIDIA GeForce RTX 3060 Ti
min:
64 fps, P0.1:
68.1 fps, P1:
81.9 fps, max:
173.8 fps
101.1 [X] Nvidia GeForce RTX 3060 Ti FE AMD Ryzen 9 7950X 4.5GHz
NVIDIA GeForce RTX 3060 Ti
min:
58.6 fps, P0.1:
77.2 fps, P1:
91.1 fps, max:
409 fps
109.7 [X] Nvidia GeForce RTX 3060 Ti FE AMD Ryzen 9 7900X 4.7GHz
NVIDIA GeForce RTX 3060 Ti
min:
71.2 fps, P0.1:
88.5 fps, P1:
94.8 fps, max:
162.5 fps
~ 93 fps
100%
GeForce RTX 3050 Ti Laptop GPU:
30.6 31.3 [X] HP Victus 16-e0145ng AMD Ryzen 5 5600H 3.3GHz
GeForce RTX 3050 Ti Laptop GPU
min:
7.44 fps, P0.1:
10.4 fps, P1:
15.4 fps, max:
48.3 fps
34.8 [X] XMG Focus 17 @75 W TGP Intel Core i7-11800H 2.3GHz
GeForce RTX 3050 Ti Laptop GPU
min:
21.6 fps, P0.1:
22.6 fps, P1:
26.7 fps, max:
64.3 fps
~ 32 fps
263%
NVIDIA GeForce RTX 3070:
83.5 83.5 83.6 [X] MSI GeForce RTX 3070 Ventus 3X Intel Core i9-9900K 3.6GHz
NVIDIA GeForce RTX 3070
min:
56.7 fps, P0.1:
61 fps, P1:
68.7 fps, max:
123 fps
~ 84 fps
206%
NVIDIA GeForce RTX 3060 Ti:
51.9 [X] Geekom Mini IT11 (Nvidia GeForce RTX 3060 Ti FE TB3) Intel Core i7-11390H 3.4GHz
NVIDIA GeForce RTX 3060 Ti
min:
40.6 fps, P0.1:
41.4 fps, P1:
43.8 fps, max:
73.2 fps
60.2 [X] Huawei MateBook X Pro 2023 (Nvidia GeForce RTX 3060 Ti FE TB3) Intel Core i7-1360P 1.6GHz
NVIDIA GeForce RTX 3060 Ti
min:
47.3 fps, P0.1:
47.8 fps, P1:
50.2 fps, max:
89.1 fps
68.2 [X] Nvidia GeForce RTX 3060 Ti FE AMD Ryzen 9 5900X 3.7GHz
NVIDIA GeForce RTX 3060 Ti
min:
52.5 fps, P0.1:
54.3 fps, P1:
59.6 fps, max:
97.6 fps
71.3 [X] Nvidia GeForce RTX 3060 Ti FE AMD Ryzen 9 7950X 4.5GHz
NVIDIA GeForce RTX 3060 Ti
min:
55.7 fps, P0.1:
56.8 fps, P1:
61.6 fps, max:
96.2 fps
79.6 [X] Nvidia GeForce RTX 3060 Ti FE AMD Ryzen 9 7900X 4.7GHz
NVIDIA GeForce RTX 3060 Ti
min:
61.4 fps, P0.1:
64.8 fps, P1:
70 fps, max:
101.3 fps
~ 66 fps
NVIDIA GeForce RTX 3070:
69 [X] MSI GeForce RTX 3070 Ventus 3X Intel Core i9-9900K 3.6GHz
NVIDIA GeForce RTX 3070
min:
49.7 fps, P0.1:
54.6 fps, P1:
58.6 fps, max:
102 fps
69.3 69.3 ~ 69 fps
NVIDIA GeForce RTX 3060 Ti:
53.2 [X] Huawei MateBook X Pro 2023 (Nvidia GeForce RTX 3060 Ti FE TB3) Intel Core i7-1360P 1.6GHz
NVIDIA GeForce RTX 3060 Ti
min:
41.8 fps, P0.1:
42.7 fps, P1:
45.5 fps, max:
74.4 fps
55.6 [X] Nvidia GeForce RTX 3060 Ti FE AMD Ryzen 9 5900X 3.7GHz
NVIDIA GeForce RTX 3060 Ti
min:
45.9 fps, P0.1:
48.6 fps, P1:
49.6 fps, max:
72.5 fps
58.3 [X] Geekom Mini IT11 (Nvidia GeForce RTX 3060 Ti FE TB3) Intel Core i7-11390H 3.4GHz
NVIDIA GeForce RTX 3060 Ti
min:
44.6 fps, P0.1:
45.1 fps, P1:
49.4 fps, max:
79.9 fps
59.1 [X] Nvidia GeForce RTX 3060 Ti FE AMD Ryzen 9 7950X 4.5GHz
NVIDIA GeForce RTX 3060 Ti
min:
47.1 fps, P0.1:
51.3 fps, P1:
52.3 fps, max:
80.4 fps
64.2 [X] Nvidia GeForce RTX 3060 Ti FE AMD Ryzen 9 7900X 4.7GHz
NVIDIA GeForce RTX 3060 Ti
min:
55 fps, P0.1:
56.2 fps, P1:
57.2 fps, max:
75.8 fps
~ 58 fps
NVIDIA GeForce RTX 3070:
47.1 [X] MSI GeForce RTX 3070 Ventus 3X Intel Core i9-9900K 3.6GHz
NVIDIA GeForce RTX 3070
min:
38.7 fps, P0.1:
38.9 fps, P1:
41.7 fps, max:
64.3 fps
49.8 49.8 ~ 49 fps
NVIDIA GeForce RTX 3060 Ti:
39.3 [X] Geekom Mini IT11 (Nvidia GeForce RTX 3060 Ti FE TB3) Intel Core i7-11390H 3.4GHz
NVIDIA GeForce RTX 3060 Ti
min:
30.2 fps, P0.1:
32.6 fps, P1:
34.5 fps, max:
54.9 fps
39.4 [X] Huawei MateBook X Pro 2023 (Nvidia GeForce RTX 3060 Ti FE TB3) Intel Core i7-1360P 1.6GHz
NVIDIA GeForce RTX 3060 Ti
min:
32.8 fps, P0.1:
32.9 fps, P1:
34.8 fps, max:
51.2 fps
40.6 [X] Nvidia GeForce RTX 3060 Ti FE AMD Ryzen 9 5900X 3.7GHz
NVIDIA GeForce RTX 3060 Ti
min:
32.3 fps, P0.1:
35 fps, P1:
35.9 fps, max:
48 fps
40.8 [X] Nvidia GeForce RTX 3060 Ti FE AMD Ryzen 9 7950X 4.5GHz
NVIDIA GeForce RTX 3060 Ti
min:
35.5 fps, P0.1:
36.3 fps, P1:
37 fps, max:
45.7 fps
43.7 [X] Nvidia GeForce RTX 3060 Ti FE AMD Ryzen 9 7900X 4.7GHz
NVIDIA GeForce RTX 3060 Ti
min:
39.2 fps, P0.1:
39.3 fps, P1:
39.8 fps, max:
49.2 fps
~ 41 fps
100%
GeForce RTX 3050 Ti Laptop GPU:
81.3 [X] XMG Focus 17 @75 W TGP Intel Core i7-11800H 2.3GHz
GeForce RTX 3050 Ti Laptop GPU
min:
43.3 fps, P0.1:
46.6 fps, P1:
64.5 fps, max:
224 fps
89.1 [X] HP Victus 16-e0145ng AMD Ryzen 5 5600H 3.3GHz
GeForce RTX 3050 Ti Laptop GPU
min:
46.2 fps, P0.1:
58.2 fps, P1:
67.8 fps, max:
178.9 fps
~ 85 fps
175%
NVIDIA GeForce RTX 3070:
149 [X] MSI GeForce RTX 3070 Ventus 3X Intel Core i9-9900K 3.6GHz
NVIDIA GeForce RTX 3070
min:
56.1 fps, P0.1:
81.1 fps, P1:
99 fps, max:
341 fps
fps
100%
GeForce RTX 3050 Ti Laptop GPU:
59 [X] HP Victus 16-e0145ng AMD Ryzen 5 5600H 3.3GHz
GeForce RTX 3050 Ti Laptop GPU
min:
39.6 fps, P0.1:
40 fps, P1:
43.8 fps, max:
152.1 fps
61.7 [X] XMG Focus 17 @75 W TGP Intel Core i7-11800H 2.3GHz
GeForce RTX 3050 Ti Laptop GPU
min:
28.2 fps, P0.1:
34.9 fps, P1:
43 fps, max:
182 fps
~ 60 fps
215%
NVIDIA GeForce RTX 3070:
129 [X] MSI GeForce RTX 3070 Ventus 3X Intel Core i9-9900K 3.6GHz
NVIDIA GeForce RTX 3070
min:
45.3 fps, P0.1:
73.9 fps, P1:
89.3 fps, max:
253 fps
fps
100%
GeForce RTX 3050 Ti Laptop GPU:
51.5 [X] HP Victus 16-e0145ng AMD Ryzen 5 5600H 3.3GHz
GeForce RTX 3050 Ti Laptop GPU
min:
28 fps, P0.1:
33.2 fps, P1:
36.1 fps, max:
142.4 fps
57 [X] XMG Focus 17 @75 W TGP Intel Core i7-11800H 2.3GHz
GeForce RTX 3050 Ti Laptop GPU
min:
29.7 fps, P0.1:
32.6 fps, P1:
42.2 fps, max:
165 fps
~ 54 fps
224%
NVIDIA GeForce RTX 3070:
121 [X] MSI GeForce RTX 3070 Ventus 3X Intel Core i9-9900K 3.6GHz
NVIDIA GeForce RTX 3070
min:
29.4 fps, P0.1:
51.5 fps, P1:
84.5 fps, max:
225 fps
fps
100%
GeForce RTX 3050 Ti Laptop GPU:
37.5 [X] XMG Focus 17 @75 W TGP Intel Core i7-11800H 2.3GHz
GeForce RTX 3050 Ti Laptop GPU
min:
26.1 fps, P0.1:
26.4 fps, P1:
28.5 fps, max:
61 fps
fps
246%
NVIDIA GeForce RTX 3070:
92.3 [X] MSI GeForce RTX 3070 Ventus 3X Intel Core i9-9900K 3.6GHz
NVIDIA GeForce RTX 3070
min:
38.7 fps, P0.1:
52.4 fps, P1:
69.7 fps, max:
211 fps
fps
100%
GeForce RTX 3050 Ti Laptop GPU:
14.9 [X] XMG Focus 17 @75 W TGP Intel Core i7-11800H 2.3GHz
GeForce RTX 3050 Ti Laptop GPU
min:
10.9 fps, P0.1:
11.2 fps, P1:
12.2 fps, max:
19.6 fps
fps
355%
NVIDIA GeForce RTX 3070:
52.9 [X] MSI GeForce RTX 3070 Ventus 3X Intel Core i9-9900K 3.6GHz
NVIDIA GeForce RTX 3070
min:
32.7 fps, P0.1:
35.2 fps, P1:
43 fps, max:
119 fps
fps
NVIDIA GeForce RTX 3060 Ti:
295 [X] Nvidia GeForce RTX 3060 Ti FE AMD Ryzen 9 5900X 3.7GHz
NVIDIA GeForce RTX 3060 Ti
min:
31.1 fps, P0.1:
123.7 fps, P1:
174.4 fps, max:
390 fps
fps
100%
GeForce RTX 3050 Ti Laptop GPU:
130 [X] HP Victus 16-e0145ng AMD Ryzen 5 5600H 3.3GHz
GeForce RTX 3050 Ti Laptop GPU
min:
0.4604 fps, P0.1:
18.3 fps, P1:
39.4 fps, max:
189.1 fps
148 [X] XMG Focus 17 @75 W TGP Intel Core i7-11800H 2.3GHz
GeForce RTX 3050 Ti Laptop GPU
min:
7.3 fps, P0.1:
20.5 fps, P1:
95.7 fps, max:
230 fps
~ 139 fps
128%
NVIDIA GeForce RTX 3070:
178 [X] MSI GeForce RTX 3070 Ventus 3X Intel Core i9-9900K 3.6GHz
NVIDIA GeForce RTX 3070
min:
23 fps, P0.1:
88.5 fps, P1:
134 fps, max:
269 fps
fps
173%
NVIDIA GeForce RTX 3060 Ti:
240 [X] Nvidia GeForce RTX 3060 Ti FE AMD Ryzen 9 5900X 3.7GHz
NVIDIA GeForce RTX 3060 Ti
min:
11.9 fps, P0.1:
25.1 fps, P1:
147.3 fps, max:
315 fps
fps
100%
GeForce RTX 3050 Ti Laptop GPU:
104.8 [X] HP Victus 16-e0145ng AMD Ryzen 5 5600H 3.3GHz
GeForce RTX 3050 Ti Laptop GPU
min:
0.4479 fps, P0.1:
12.8 fps, P1:
22.6 fps, max:
198.9 fps
116 [X] XMG Focus 17 @75 W TGP Intel Core i7-11800H 2.3GHz
GeForce RTX 3050 Ti Laptop GPU
min:
15.3 fps, P0.1:
50.1 fps, P1:
78.5 fps, max:
178 fps
~ 110 fps
139%
NVIDIA GeForce RTX 3070:
153 [X] MSI GeForce RTX 3070 Ventus 3X Intel Core i9-9900K 3.6GHz
NVIDIA GeForce RTX 3070
min:
54.2 fps, P0.1:
79.9 fps, P1:
114 fps, max:
211 fps
fps
176%
NVIDIA GeForce RTX 3060 Ti:
193.8 [X] Nvidia GeForce RTX 3060 Ti FE AMD Ryzen 9 5900X 3.7GHz
NVIDIA GeForce RTX 3060 Ti
min:
12.4 fps, P0.1:
23.6 fps, P1:
115.8 fps, max:
256 fps
fps
100%
GeForce RTX 3050 Ti Laptop GPU:
92.3 [X] HP Victus 16-e0145ng AMD Ryzen 5 5600H 3.3GHz
GeForce RTX 3050 Ti Laptop GPU
min:
0.465 fps, P0.1:
17.5 fps, P1:
63.1 fps, max:
146 fps
93.4 [X] XMG Focus 17 @75 W TGP Intel Core i7-11800H 2.3GHz
GeForce RTX 3050 Ti Laptop GPU
min:
12.2 fps, P0.1:
50.1 fps, P1:
62.6 fps, max:
129 fps
~ 93 fps
147%
NVIDIA GeForce RTX 3070:
137 [X] MSI GeForce RTX 3070 Ventus 3X Intel Core i9-9900K 3.6GHz
NVIDIA GeForce RTX 3070
min:
56.6 fps, P0.1:
77 fps, P1:
94.2 fps, max:
201 fps
fps
187%
NVIDIA GeForce RTX 3060 Ti:
174.2 [X] Nvidia GeForce RTX 3060 Ti FE AMD Ryzen 9 5900X 3.7GHz
NVIDIA GeForce RTX 3060 Ti
min:
16.3 fps, P0.1:
26.3 fps, P1:
119.9 fps, max:
229 fps
fps
100%
GeForce RTX 3050 Ti Laptop GPU:
69.7 [X] XMG Focus 17 @75 W TGP Intel Core i7-11800H 2.3GHz
GeForce RTX 3050 Ti Laptop GPU
min:
11.8 fps, P0.1:
15.4 fps, P1:
48.5 fps, max:
107 fps
fps
194%
NVIDIA GeForce RTX 3070:
135 [X] MSI GeForce RTX 3070 Ventus 3X Intel Core i9-9900K 3.6GHz
NVIDIA GeForce RTX 3070
min:
57.2 fps, P0.1:
74.1 fps, P1:
96.8 fps, max:
212 fps
fps
203%
NVIDIA GeForce RTX 3060 Ti:
141.3 [X] Nvidia GeForce RTX 3060 Ti FE AMD Ryzen 9 5900X 3.7GHz
NVIDIA GeForce RTX 3060 Ti
min:
18.8 fps, P0.1:
73.6 fps, P1:
99.8 fps, max:
203 fps
fps
100%
GeForce RTX 3050 Ti Laptop GPU:
41.9 [X] XMG Focus 17 @75 W TGP Intel Core i7-11800H 2.3GHz
GeForce RTX 3050 Ti Laptop GPU
min:
7.4 fps, P0.1:
11 fps, P1:
13.6 fps, max:
107 fps
fps
253%
NVIDIA GeForce RTX 3070:
106 [X] MSI GeForce RTX 3070 Ventus 3X Intel Core i9-9900K 3.6GHz
NVIDIA GeForce RTX 3070
min:
42.7 fps, P0.1:
56.2 fps, P1:
76.8 fps, max:
185 fps
fps
209%
NVIDIA GeForce RTX 3060 Ti:
87.6 [X] Nvidia GeForce RTX 3060 Ti FE AMD Ryzen 9 5900X 3.7GHz
NVIDIA GeForce RTX 3060 Ti
min:
29.9 fps, P0.1:
51.3 fps, P1:
64.1 fps, max:
160.5 fps
fps
100%
GeForce RTX 3050 Ti Laptop GPU:
140 [X] XMG Focus 17 @75 W TGP Intel Core i7-11800H 2.3GHz
GeForce RTX 3050 Ti Laptop GPU
min:
12.6 fps, P0.1:
60.3 fps, P1:
94.9 fps, max:
196 fps
fps
130%
NVIDIA GeForce RTX 3060 Ti:
182.3 [X] Nvidia GeForce RTX 3060 Ti FE AMD Ryzen 9 5900X 3.7GHz
NVIDIA GeForce RTX 3060 Ti
min:
58.2 fps, P0.1:
98.2 fps, P1:
119.3 fps, max:
251 fps
fps
100%
GeForce RTX 3050 Ti Laptop GPU:
78.6 [X] XMG Focus 17 @75 W TGP Intel Core i7-11800H 2.3GHz
GeForce RTX 3050 Ti Laptop GPU
min:
6.81 fps, P0.1:
9.77 fps, P1:
55.6 fps, max:
136 fps
fps
168%
NVIDIA GeForce RTX 3070:
132 [X] MSI GeForce RTX 3070 Ventus 3X Intel Core i9-9900K 3.6GHz
NVIDIA GeForce RTX 3070
min:
64.6 fps, P0.1:
67.4 fps, P1:
98.1 fps, max:
172 fps
fps
174%
NVIDIA GeForce RTX 3060 Ti:
136.5 [X] Nvidia GeForce RTX 3060 Ti FE AMD Ryzen 9 5900X 3.7GHz
NVIDIA GeForce RTX 3060 Ti
min:
61.2 fps, P0.1:
85.1 fps, P1:
98.9 fps, max:
207 fps
fps
100%
GeForce RTX 3050 Ti Laptop GPU:
64.6 [X] XMG Focus 17 @75 W TGP Intel Core i7-11800H 2.3GHz
GeForce RTX 3050 Ti Laptop GPU
min:
9.28 fps, P0.1:
10 fps, P1:
43.2 fps, max:
145 fps
fps
195%
NVIDIA GeForce RTX 3070:
126 [X] MSI GeForce RTX 3070 Ventus 3X Intel Core i9-9900K 3.6GHz
NVIDIA GeForce RTX 3070
min:
17.2 fps, P0.1:
62 fps, P1:
89.2 fps, max:
169 fps
fps
178%
NVIDIA GeForce RTX 3060 Ti:
115.2 [X] Nvidia GeForce RTX 3060 Ti FE AMD Ryzen 9 5900X 3.7GHz
NVIDIA GeForce RTX 3060 Ti
min:
69.5 fps, P0.1:
70.7 fps, P1:
83.1 fps, max:
199.6 fps
fps
100%
GeForce RTX 3050 Ti Laptop GPU:
53.2 [X] XMG Focus 17 @75 W TGP Intel Core i7-11800H 2.3GHz
GeForce RTX 3050 Ti Laptop GPU
min:
9.05 fps, P0.1:
10 fps, P1:
23.7 fps, max:
134 fps
fps
218%
NVIDIA GeForce RTX 3070:
116 [X] MSI GeForce RTX 3070 Ventus 3X Intel Core i9-9900K 3.6GHz
NVIDIA GeForce RTX 3070
min:
7.04 fps, P0.1:
31.5 fps, P1:
82 fps, max:
166 fps
fps
190%
NVIDIA GeForce RTX 3060 Ti:
101.1 [X] Nvidia GeForce RTX 3060 Ti FE AMD Ryzen 9 5900X 3.7GHz
NVIDIA GeForce RTX 3060 Ti
min:
47.1 fps, P0.1:
61.6 fps, P1:
69.9 fps, max:
189.3 fps
fps
NVIDIA GeForce RTX 3070:
96.8 [X] MSI GeForce RTX 3070 Ventus 3X Intel Core i9-9900K 3.6GHz
NVIDIA GeForce RTX 3070
min:
6.18 fps, P0.1:
12.1 fps, P1:
68.5 fps, max:
160 fps
fps
NVIDIA GeForce RTX 3060 Ti:
78.2 [X] Nvidia GeForce RTX 3060 Ti FE AMD Ryzen 9 5900X 3.7GHz
NVIDIA GeForce RTX 3060 Ti
min:
5.27 fps, P0.1:
10.1 fps, P1:
56.9 fps, max:
137.2 fps
fps
NVIDIA GeForce RTX 3070:
60.2 [X] MSI GeForce RTX 3070 Ventus 3X Intel Core i9-9900K 3.6GHz
NVIDIA GeForce RTX 3070
min:
21.2 fps, P0.1:
30.6 fps, P1:
45 fps, max:
133 fps
fps
NVIDIA GeForce RTX 3060 Ti:
49.3 [X] Nvidia GeForce RTX 3060 Ti FE AMD Ryzen 9 5900X 3.7GHz
NVIDIA GeForce RTX 3060 Ti
min:
4.44 fps, P0.1:
7.89 fps, P1:
39.8 fps, max:
119.9 fps
fps
NVIDIA GeForce RTX 3070:
247 fps
NVIDIA GeForce RTX 3060 Ti:
250 [X] Nvidia GeForce RTX 3060 Ti FE AMD Ryzen 9 5900X 3.7GHz
NVIDIA GeForce RTX 3060 Ti
313 [X] Nvidia GeForce RTX 3060 Ti FE AMD Ryzen 9 7900X 4.7GHz
NVIDIA GeForce RTX 3060 Ti
334 [X] Nvidia GeForce RTX 3060 Ti FE AMD Ryzen 9 7950X 4.5GHz
NVIDIA GeForce RTX 3060 Ti
~ 299 fps
100%
GeForce RTX 3050 Ti Laptop GPU:
93 94 [X] XMG Focus 17 @75 W TGP Intel Core i7-11800H 2.3GHz
GeForce RTX 3050 Ti Laptop GPU
~ 94 fps
169%
NVIDIA GeForce RTX 3070:
147 [X] MSI GeForce RTX 3070 Ventus 3X Intel Core i9-9900K 3.6GHz
NVIDIA GeForce RTX 3070
171 ~ 159 fps
204%
NVIDIA GeForce RTX 3060 Ti:
161 [X] Nvidia GeForce RTX 3060 Ti FE AMD Ryzen 9 5900X 3.7GHz
NVIDIA GeForce RTX 3060 Ti
176 [X] Nvidia GeForce RTX 3060 Ti FE AMD Ryzen 9 7900X 4.7GHz
NVIDIA GeForce RTX 3060 Ti
238 [X] Nvidia GeForce RTX 3060 Ti FE AMD Ryzen 9 7950X 4.5GHz
NVIDIA GeForce RTX 3060 Ti
~ 192 fps
100%
GeForce RTX 3050 Ti Laptop GPU:
83 [X] XMG Focus 17 @75 W TGP Intel Core i7-11800H 2.3GHz
GeForce RTX 3050 Ti Laptop GPU
84 ~ 84 fps
176%
NVIDIA GeForce RTX 3070:
136 [X] MSI GeForce RTX 3070 Ventus 3X Intel Core i9-9900K 3.6GHz
NVIDIA GeForce RTX 3070
160 ~ 148 fps
188%
NVIDIA GeForce RTX 3060 Ti:
142 [X] Nvidia GeForce RTX 3060 Ti FE AMD Ryzen 9 5900X 3.7GHz
NVIDIA GeForce RTX 3060 Ti
158 [X] Nvidia GeForce RTX 3060 Ti FE AMD Ryzen 9 7900X 4.7GHz
NVIDIA GeForce RTX 3060 Ti
173 [X] Nvidia GeForce RTX 3060 Ti FE AMD Ryzen 9 7950X 4.5GHz
NVIDIA GeForce RTX 3060 Ti
~ 158 fps
100%
GeForce RTX 3050 Ti Laptop GPU:
19 31 [X] XMG Focus 17 @75 W TGP Intel Core i7-11800H 2.3GHz
GeForce RTX 3050 Ti Laptop GPU
~ 25 fps
424%
NVIDIA GeForce RTX 3070:
97 [X] MSI GeForce RTX 3070 Ventus 3X Intel Core i9-9900K 3.6GHz
NVIDIA GeForce RTX 3070
115 ~ 106 fps
396%
NVIDIA GeForce RTX 3060 Ti:
95 [X] Nvidia GeForce RTX 3060 Ti FE AMD Ryzen 9 7900X 4.7GHz
NVIDIA GeForce RTX 3060 Ti
99 [X] Nvidia GeForce RTX 3060 Ti FE AMD Ryzen 9 5900X 3.7GHz
NVIDIA GeForce RTX 3060 Ti
103 [X] Nvidia GeForce RTX 3060 Ti FE AMD Ryzen 9 7950X 4.5GHz
NVIDIA GeForce RTX 3060 Ti
~ 99 fps
NVIDIA GeForce RTX 3070:
85 [X] MSI GeForce RTX 3070 Ventus 3X Intel Core i9-9900K 3.6GHz
NVIDIA GeForce RTX 3070
100 ~ 93 fps
NVIDIA GeForce RTX 3060 Ti:
81 [X] Nvidia GeForce RTX 3060 Ti FE AMD Ryzen 9 7900X 4.7GHz
NVIDIA GeForce RTX 3060 Ti
86 [X] Nvidia GeForce RTX 3060 Ti FE AMD Ryzen 9 5900X 3.7GHz
NVIDIA GeForce RTX 3060 Ti
86 [X] Nvidia GeForce RTX 3060 Ti FE AMD Ryzen 9 7950X 4.5GHz
NVIDIA GeForce RTX 3060 Ti
~ 84 fps
NVIDIA GeForce RTX 3070:
62 [X] MSI GeForce RTX 3070 Ventus 3X Intel Core i9-9900K 3.6GHz
NVIDIA GeForce RTX 3070
73 ~ 68 fps
NVIDIA GeForce RTX 3060 Ti:
58 [X] Nvidia GeForce RTX 3060 Ti FE AMD Ryzen 9 7900X 4.7GHz
NVIDIA GeForce RTX 3060 Ti
59 [X] Nvidia GeForce RTX 3060 Ti FE AMD Ryzen 9 7950X 4.5GHz
NVIDIA GeForce RTX 3060 Ti
63 [X] Nvidia GeForce RTX 3060 Ti FE AMD Ryzen 9 5900X 3.7GHz
NVIDIA GeForce RTX 3060 Ti
~ 60 fps
NVIDIA GeForce RTX 3060 Ti:
95.8 [X] Nvidia GeForce RTX 3060 Ti FE AMD Ryzen 9 5900X 3.7GHz
NVIDIA GeForce RTX 3060 Ti
min:
79.1 fps, P0.1:
82.1 fps, P1:
86.2 fps, max:
116.6 fps
107.5 [X] Nvidia GeForce RTX 3060 Ti FE AMD Ryzen 9 5900X 3.7GHz
NVIDIA GeForce RTX 3060 Ti
min:
55.1 fps, P0.1:
86.6 fps, P1:
95 fps, max:
318 fps
~ 102 fps
100%
GeForce RTX 3050 Ti Laptop GPU:
89.4 [X] XMG Focus 17 @75 W TGP Intel Core i7-11800H 2.3GHz
GeForce RTX 3050 Ti Laptop GPU
min:
65.8 fps, P0.1:
73.6 fps, P1:
77.1 fps, max:
214 fps
fps
176%
NVIDIA GeForce RTX 3070:
157 [X] MSI GeForce RTX 3070 Ventus 3X Intel Core i9-9900K 3.6GHz
NVIDIA GeForce RTX 3070
min:
100 fps, P0.1:
116 fps, P1:
126 fps, max:
316 fps
fps
102%
NVIDIA GeForce RTX 3060 Ti:
91.5 [X] Nvidia GeForce RTX 3060 Ti FE AMD Ryzen 9 5900X 3.7GHz
NVIDIA GeForce RTX 3060 Ti
min:
74.8 fps, P0.1:
78.1 fps, P1:
82.3 fps, max:
115.3 fps
fps
100%
GeForce RTX 3050 Ti Laptop GPU:
58.2 [X] XMG Focus 17 @75 W TGP Intel Core i7-11800H 2.3GHz
GeForce RTX 3050 Ti Laptop GPU
min:
25.3 fps, P0.1:
43.2 fps, P1:
45.7 fps, max:
168 fps
fps
247%
NVIDIA GeForce RTX 3070:
144 [X] MSI GeForce RTX 3070 Ventus 3X Intel Core i9-9900K 3.6GHz
NVIDIA GeForce RTX 3070
min:
90.8 fps, P0.1:
103 fps, P1:
111 fps, max:
317 fps
fps
233%
NVIDIA GeForce RTX 3060 Ti:
135.7 [X] Nvidia GeForce RTX 3060 Ti FE AMD Ryzen 9 5900X 3.7GHz
NVIDIA GeForce RTX 3060 Ti
min:
42.3 fps, P0.1:
48.7 fps, P1:
110.2 fps, max:
307 fps
fps
100%
GeForce RTX 3050 Ti Laptop GPU:
53.4 [X] XMG Focus 17 @75 W TGP Intel Core i7-11800H 2.3GHz
GeForce RTX 3050 Ti Laptop GPU
min:
38.9 fps, P0.1:
40.3 fps, P1:
42 fps, max:
95.4 fps
fps
245%
NVIDIA GeForce RTX 3070:
131 [X] MSI GeForce RTX 3070 Ventus 3X Intel Core i9-9900K 3.6GHz
NVIDIA GeForce RTX 3070
min:
68 fps, P0.1:
95.5 fps, P1:
104 fps, max:
349 fps
fps
217%
NVIDIA GeForce RTX 3060 Ti:
115.7 [X] Nvidia GeForce RTX 3060 Ti FE AMD Ryzen 9 5900X 3.7GHz
NVIDIA GeForce RTX 3060 Ti
min:
39.9 fps, P0.1:
45.8 fps, P1:
94 fps, max:
178.9 fps
fps
NVIDIA GeForce RTX 3070:
98.1 [X] MSI GeForce RTX 3070 Ventus 3X Intel Core i9-9900K 3.6GHz
NVIDIA GeForce RTX 3070
min:
68.9 fps, P0.1:
74.6 fps, P1:
81 fps, max:
159 fps
fps
NVIDIA GeForce RTX 3060 Ti:
98.8 [X] Nvidia GeForce RTX 3060 Ti FE AMD Ryzen 9 5900X 3.7GHz
NVIDIA GeForce RTX 3060 Ti
min:
41.2 fps, P0.1:
46.7 fps, P1:
80.5 fps, max:
144.6 fps
fps
NVIDIA GeForce RTX 3070:
56.8 [X] MSI GeForce RTX 3070 Ventus 3X Intel Core i9-9900K 3.6GHz
NVIDIA GeForce RTX 3070
min:
46.7 fps, P0.1:
48 fps, P1:
50.1 fps, max:
78 fps
fps
NVIDIA GeForce RTX 3060 Ti:
80.5 [X] Nvidia GeForce RTX 3060 Ti FE AMD Ryzen 9 5900X 3.7GHz
NVIDIA GeForce RTX 3060 Ti
min:
45.3 fps, P0.1:
48 fps, P1:
66 fps, max:
144.7 fps
fps
NVIDIA GeForce RTX 3060 Ti:
228 [X] Nvidia GeForce RTX 3060 Ti FE AMD Ryzen 9 5900X 3.7GHz
NVIDIA GeForce RTX 3060 Ti
fps
100%
GeForce RTX 3050 Ti Laptop GPU:
85 [X] XMG Focus 17 @75 W TGP Intel Core i7-11800H 2.3GHz
GeForce RTX 3050 Ti Laptop GPU
min:
68 fps
88 ~ 87 fps
160%
NVIDIA GeForce RTX 3070:
139 [X] MSI GeForce RTX 3070 Ventus 3X Intel Core i9-9900K 3.6GHz
NVIDIA GeForce RTX 3070
min:
111 fps
fps
178%
NVIDIA GeForce RTX 3060 Ti:
155 [X] Nvidia GeForce RTX 3060 Ti FE AMD Ryzen 9 5900X 3.7GHz
NVIDIA GeForce RTX 3060 Ti
fps
100%
GeForce RTX 3050 Ti Laptop GPU:
67 [X] XMG Focus 17 @75 W TGP Intel Core i7-11800H 2.3GHz
GeForce RTX 3050 Ti Laptop GPU
min:
55 fps
69 ~ 68 fps
182%
NVIDIA GeForce RTX 3070:
124 [X] MSI GeForce RTX 3070 Ventus 3X Intel Core i9-9900K 3.6GHz
NVIDIA GeForce RTX 3070
min:
99 fps
fps
185%
NVIDIA GeForce RTX 3060 Ti:
126 [X] Nvidia GeForce RTX 3060 Ti FE AMD Ryzen 9 5900X 3.7GHz
NVIDIA GeForce RTX 3060 Ti
fps
100%
GeForce RTX 3050 Ti Laptop GPU:
54 59 [X] XMG Focus 17 @75 W TGP Intel Core i7-11800H 2.3GHz
GeForce RTX 3050 Ti Laptop GPU
min:
46 fps
~ 57 fps
207%
NVIDIA GeForce RTX 3070:
118 [X] MSI GeForce RTX 3070 Ventus 3X Intel Core i9-9900K 3.6GHz
NVIDIA GeForce RTX 3070
min:
92 fps
fps
202%
NVIDIA GeForce RTX 3060 Ti:
115 [X] Nvidia GeForce RTX 3060 Ti FE AMD Ryzen 9 5900X 3.7GHz
NVIDIA GeForce RTX 3060 Ti
fps
100%
GeForce RTX 3050 Ti Laptop GPU:
40 [X] XMG Focus 17 @75 W TGP Intel Core i7-11800H 2.3GHz
GeForce RTX 3050 Ti Laptop GPU
min:
32 fps
fps
230%
NVIDIA GeForce RTX 3070:
92 [X] MSI GeForce RTX 3070 Ventus 3X Intel Core i9-9900K 3.6GHz
NVIDIA GeForce RTX 3070
min:
76 fps
fps
205%
NVIDIA GeForce RTX 3060 Ti:
82 [X] Nvidia GeForce RTX 3060 Ti FE AMD Ryzen 9 5900X 3.7GHz
NVIDIA GeForce RTX 3060 Ti
fps
100%
GeForce RTX 3050 Ti Laptop GPU:
20 [X] XMG Focus 17 @75 W TGP Intel Core i7-11800H 2.3GHz
GeForce RTX 3050 Ti Laptop GPU
min:
15 fps
fps
270%
NVIDIA GeForce RTX 3070:
54 [X] MSI GeForce RTX 3070 Ventus 3X Intel Core i9-9900K 3.6GHz
NVIDIA GeForce RTX 3070
min:
47 fps
fps
230%
NVIDIA GeForce RTX 3060 Ti:
46 [X] Nvidia GeForce RTX 3060 Ti FE AMD Ryzen 9 5900X 3.7GHz
NVIDIA GeForce RTX 3060 Ti
fps
NVIDIA GeForce RTX 3060 Ti:
151 [X] Nvidia GeForce RTX 3060 Ti FE AMD Ryzen 9 5900X 3.7GHz
NVIDIA GeForce RTX 3060 Ti
194 [X] Nvidia GeForce RTX 3060 Ti FE AMD Ryzen 9 7950X 4.5GHz
NVIDIA GeForce RTX 3060 Ti
~ 173 fps
100%
GeForce RTX 3050 Ti Laptop GPU:
83 84 [X] XMG Focus 17 @75 W TGP Intel Core i7-11800H 2.3GHz
GeForce RTX 3050 Ti Laptop GPU
min:
62 fps
~ 84 fps
132%
NVIDIA GeForce RTX 3070:
111 [X] MSI GeForce RTX 3070 Ventus 3X Intel Core i9-9900K 3.6GHz
NVIDIA GeForce RTX 3070
min:
65 fps
fps
202%
NVIDIA GeForce RTX 3060 Ti:
151 [X] Nvidia GeForce RTX 3060 Ti FE AMD Ryzen 9 5900X 3.7GHz
NVIDIA GeForce RTX 3060 Ti
189 [X] Nvidia GeForce RTX 3060 Ti FE AMD Ryzen 9 7950X 4.5GHz
NVIDIA GeForce RTX 3060 Ti
~ 170 fps
100%
GeForce RTX 3050 Ti Laptop GPU:
69 [X] XMG Focus 17 @75 W TGP Intel Core i7-11800H 2.3GHz
GeForce RTX 3050 Ti Laptop GPU
min:
52 fps
82 ~ 76 fps
132%
NVIDIA GeForce RTX 3070:
100 [X] MSI GeForce RTX 3070 Ventus 3X Intel Core i9-9900K 3.6GHz
NVIDIA GeForce RTX 3070
min:
77 fps
fps
222%
NVIDIA GeForce RTX 3060 Ti:
150 [X] Nvidia GeForce RTX 3060 Ti FE AMD Ryzen 9 5900X 3.7GHz
NVIDIA GeForce RTX 3060 Ti
187 [X] Nvidia GeForce RTX 3060 Ti FE AMD Ryzen 9 7950X 4.5GHz
NVIDIA GeForce RTX 3060 Ti
~ 169 fps
100%
GeForce RTX 3050 Ti Laptop GPU:
68 [X] XMG Focus 17 @75 W TGP Intel Core i7-11800H 2.3GHz
GeForce RTX 3050 Ti Laptop GPU
min:
26 fps
79 ~ 74 fps
147%
NVIDIA GeForce RTX 3070:
109 [X] MSI GeForce RTX 3070 Ventus 3X Intel Core i9-9900K 3.6GHz
NVIDIA GeForce RTX 3070
min:
63 fps
fps
219%
NVIDIA GeForce RTX 3060 Ti:
145 [X] Nvidia GeForce RTX 3060 Ti FE AMD Ryzen 9 5900X 3.7GHz
NVIDIA GeForce RTX 3060 Ti
179 [X] Nvidia GeForce RTX 3060 Ti FE AMD Ryzen 9 7950X 4.5GHz
NVIDIA GeForce RTX 3060 Ti
~ 162 fps
NVIDIA GeForce RTX 3070:
107 [X] MSI GeForce RTX 3070 Ventus 3X Intel Core i9-9900K 3.6GHz
NVIDIA GeForce RTX 3070
min:
68 fps
fps
NVIDIA GeForce RTX 3060 Ti:
110 [X] Nvidia GeForce RTX 3060 Ti FE AMD Ryzen 9 5900X 3.7GHz
NVIDIA GeForce RTX 3060 Ti
126 [X] Nvidia GeForce RTX 3060 Ti FE AMD Ryzen 9 7950X 4.5GHz
NVIDIA GeForce RTX 3060 Ti
~ 118 fps
NVIDIA GeForce RTX 3070:
69 [X] MSI GeForce RTX 3070 Ventus 3X Intel Core i9-9900K 3.6GHz
NVIDIA GeForce RTX 3070
min:
55 fps
fps
NVIDIA GeForce RTX 3060 Ti:
61 [X] Nvidia GeForce RTX 3060 Ti FE AMD Ryzen 9 5900X 3.7GHz
NVIDIA GeForce RTX 3060 Ti
67 [X] Nvidia GeForce RTX 3060 Ti FE AMD Ryzen 9 7950X 4.5GHz
NVIDIA GeForce RTX 3060 Ti
~ 64 fps
100%
GeForce RTX 3050 Ti Laptop GPU:
142.8 [X] HP Victus 16-e0145ng AMD Ryzen 5 5600H 3.3GHz
GeForce RTX 3050 Ti Laptop GPU
min:
51.6 fps, P0.1:
87.3 fps, P1:
100.4 fps, max:
359 fps
152 [X] XMG Focus 17 @75 W TGP Intel Core i7-11800H 2.3GHz
GeForce RTX 3050 Ti Laptop GPU
min:
55.7 fps, P0.1:
87.1 fps, P1:
96.8 fps, max:
402 fps
~ 147 fps
201%
NVIDIA GeForce RTX 3070:
295 [X] MSI GeForce RTX 3070 Ventus 3X Intel Core i9-9900K 3.6GHz
NVIDIA GeForce RTX 3070
min:
120 fps, P0.1:
145 fps, P1:
176 fps, max:
502 fps
fps
100%
GeForce RTX 3050 Ti Laptop GPU:
123 [X] XMG Focus 17 @75 W TGP Intel Core i7-11800H 2.3GHz
GeForce RTX 3050 Ti Laptop GPU
min:
26.3 fps, P0.1:
48.7 fps, P1:
78 fps, max:
273 fps
123.8 [X] HP Victus 16-e0145ng AMD Ryzen 5 5600H 3.3GHz
GeForce RTX 3050 Ti Laptop GPU
min:
67 fps, P0.1:
72.1 fps, P1:
83.5 fps, max:
270 fps
~ 123 fps
211%
NVIDIA GeForce RTX 3070:
260 [X] MSI GeForce RTX 3070 Ventus 3X Intel Core i9-9900K 3.6GHz
NVIDIA GeForce RTX 3070
min:
30.6 fps, P0.1:
128 fps, P1:
155 fps, max:
468 fps
fps
100%
GeForce RTX 3050 Ti Laptop GPU:
114 [X] XMG Focus 17 @75 W TGP Intel Core i7-11800H 2.3GHz
GeForce RTX 3050 Ti Laptop GPU
min:
59.4 fps, P0.1:
61.4 fps, P1:
70.2 fps, max:
305 fps
116.2 [X] HP Victus 16-e0145ng AMD Ryzen 5 5600H 3.3GHz
GeForce RTX 3050 Ti Laptop GPU
min:
47.7 fps, P0.1:
65.6 fps, P1:
74.6 fps, max:
330 fps
~ 115 fps
216%
NVIDIA GeForce RTX 3070:
248 [X] MSI GeForce RTX 3070 Ventus 3X Intel Core i9-9900K 3.6GHz
NVIDIA GeForce RTX 3070
min:
62.8 fps, P0.1:
128 fps, P1:
155 fps, max:
465 fps
fps
100%
GeForce RTX 3050 Ti Laptop GPU:
75 [X] XMG Focus 17 @75 W TGP Intel Core i7-11800H 2.3GHz
GeForce RTX 3050 Ti Laptop GPU
min:
26.3 fps, P0.1:
27.7 fps, P1:
42.7 fps, max:
346 fps
fps
239%
NVIDIA GeForce RTX 3070:
179 [X] MSI GeForce RTX 3070 Ventus 3X Intel Core i9-9900K 3.6GHz
NVIDIA GeForce RTX 3070
min:
59.9 fps, P0.1:
90.4 fps, P1:
117 fps, max:
359 fps
fps
100%
GeForce RTX 3050 Ti Laptop GPU:
37.3 [X] XMG Focus 17 @75 W TGP Intel Core i7-11800H 2.3GHz
GeForce RTX 3050 Ti Laptop GPU
min:
14.4 fps, P0.1:
18.1 fps, P1:
19.3 fps, max:
266 fps
fps
258%
NVIDIA GeForce RTX 3070:
96.4 [X] MSI GeForce RTX 3070 Ventus 3X Intel Core i9-9900K 3.6GHz
NVIDIA GeForce RTX 3070
min:
44.5 fps, P0.1:
50.9 fps, P1:
61.7 fps, max:
294 fps
fps
100%
GeForce RTX 3050 Ti Laptop GPU:
59 107 [X] Dell G15 5515 AMD Ryzen 7 5800H 3.2GHz
GeForce RTX 3050 Ti Laptop GPU
min:
65 fps, max:
132 fps
~ 83 fps
187%
NVIDIA GeForce RTX 3070:
154.9 fps
171%
NVIDIA GeForce RTX 3060 Ti:
67 [X] Geekom Mini IT11 (Nvidia GeForce RTX 3060 Ti FE TB3) Intel Core i7-11390H 3.4GHz
NVIDIA GeForce RTX 3060 Ti
min:
47 fps, max:
120 fps
73.7 [X] Huawei MateBook X Pro 2023 (Nvidia GeForce RTX 3060 Ti FE TB3) Intel Core i7-1360P 1.6GHz
NVIDIA GeForce RTX 3060 Ti
min:
48 fps, max:
162 fps
145.3 [X] Nvidia GeForce RTX 3060 Ti FE AMD Ryzen 9 5900X 3.7GHz
NVIDIA GeForce RTX 3060 Ti
min:
125 fps, max:
192 fps
211 [X] Nvidia GeForce RTX 3060 Ti FE AMD Ryzen 9 7900X 4.7GHz
NVIDIA GeForce RTX 3060 Ti
min:
166 fps, max:
277 fps
213 [X] Nvidia GeForce RTX 3060 Ti FE AMD Ryzen 9 7950X 4.5GHz
NVIDIA GeForce RTX 3060 Ti
min:
177 fps, max:
282 fps
~ 142 fps
100%
GeForce RTX 3050 Ti Laptop GPU:
48 81 [X] Dell G15 5515 AMD Ryzen 7 5800H 3.2GHz
GeForce RTX 3050 Ti Laptop GPU
min:
52 fps, max:
91 fps
86 [X] XMG Focus 17 @75 W TGP Intel Core i7-11800H 2.3GHz
GeForce RTX 3050 Ti Laptop GPU
min:
69 fps
~ 72 fps
167%
NVIDIA GeForce RTX 3070:
102 [X] MSI GeForce RTX 3070 Ventus 3X Intel Core i9-9900K 3.6GHz
NVIDIA GeForce RTX 3070
min:
65 fps
138.3 ~ 120 fps
154%
NVIDIA GeForce RTX 3060 Ti:
56.9 [X] Geekom Mini IT11 (Nvidia GeForce RTX 3060 Ti FE TB3) Intel Core i7-11390H 3.4GHz
NVIDIA GeForce RTX 3060 Ti
min:
41 fps, max:
102 fps
62.3 [X] Huawei MateBook X Pro 2023 (Nvidia GeForce RTX 3060 Ti FE TB3) Intel Core i7-1360P 1.6GHz
NVIDIA GeForce RTX 3060 Ti
min:
45 fps, max:
118 fps
105.7 [X] Nvidia GeForce RTX 3060 Ti FE AMD Ryzen 9 5900X 3.7GHz
NVIDIA GeForce RTX 3060 Ti
min:
95 fps, max:
131 fps
163.8 [X] Nvidia GeForce RTX 3060 Ti FE AMD Ryzen 9 7900X 4.7GHz
NVIDIA GeForce RTX 3060 Ti
min:
153 fps, max:
180 fps
168.3 [X] Nvidia GeForce RTX 3060 Ti FE AMD Ryzen 9 7950X 4.5GHz
NVIDIA GeForce RTX 3060 Ti
min:
146 fps, max:
190 fps
~ 111 fps
100%
GeForce RTX 3050 Ti Laptop GPU:
44 74 [X] Dell G15 5515 AMD Ryzen 7 5800H 3.2GHz
GeForce RTX 3050 Ti Laptop GPU
min:
46 fps, max:
81 fps
79 [X] XMG Focus 17 @75 W TGP Intel Core i7-11800H 2.3GHz
GeForce RTX 3050 Ti Laptop GPU
min:
60 fps
~ 66 fps
165%
NVIDIA GeForce RTX 3070:
96 [X] MSI GeForce RTX 3070 Ventus 3X Intel Core i9-9900K 3.6GHz
NVIDIA GeForce RTX 3070
min:
58 fps
121.1 ~ 109 fps
147%
NVIDIA GeForce RTX 3060 Ti:
47.6 [X] Geekom Mini IT11 (Nvidia GeForce RTX 3060 Ti FE TB3) Intel Core i7-11390H 3.4GHz
NVIDIA GeForce RTX 3060 Ti
min:
31 fps, max:
94 fps
51.8 [X] Huawei MateBook X Pro 2023 (Nvidia GeForce RTX 3060 Ti FE TB3) Intel Core i7-1360P 1.6GHz
NVIDIA GeForce RTX 3060 Ti
min:
34 fps, max:
113 fps
96.8 [X] Nvidia GeForce RTX 3060 Ti FE AMD Ryzen 9 5900X 3.7GHz
NVIDIA GeForce RTX 3060 Ti
min:
87 fps, max:
115 fps
141.6 [X] Nvidia GeForce RTX 3060 Ti FE AMD Ryzen 9 7900X 4.7GHz
NVIDIA GeForce RTX 3060 Ti
min:
131 fps, max:
156 fps
145 [X] Nvidia GeForce RTX 3060 Ti FE AMD Ryzen 9 7950X 4.5GHz
NVIDIA GeForce RTX 3060 Ti
min:
128 fps, max:
159 fps
~ 97 fps
100%
GeForce RTX 3050 Ti Laptop GPU:
53 [X] Dell G15 5515 AMD Ryzen 7 5800H 3.2GHz
GeForce RTX 3050 Ti Laptop GPU
min:
38 fps, max:
65 fps
62 [X] XMG Focus 17 @75 W TGP Intel Core i7-11800H 2.3GHz
GeForce RTX 3050 Ti Laptop GPU
min:
42 fps
~ 58 fps
178%
NVIDIA GeForce RTX 3070:
91 [X] MSI GeForce RTX 3070 Ventus 3X Intel Core i9-9900K 3.6GHz
NVIDIA GeForce RTX 3070
min:
54 fps
114.2 ~ 103 fps
124%
NVIDIA GeForce RTX 3060 Ti:
42.7 [X] Geekom Mini IT11 (Nvidia GeForce RTX 3060 Ti FE TB3) Intel Core i7-11390H 3.4GHz
NVIDIA GeForce RTX 3060 Ti
min:
27 fps, max:
77 fps
45.3 [X] Huawei MateBook X Pro 2023 (Nvidia GeForce RTX 3060 Ti FE TB3) Intel Core i7-1360P 1.6GHz
NVIDIA GeForce RTX 3060 Ti
min:
28 fps, max:
80 fps
72.2 [X] Nvidia GeForce RTX 3060 Ti FE AMD Ryzen 9 5900X 3.7GHz
NVIDIA GeForce RTX 3060 Ti
min:
43 fps, max:
112 fps
78.6 [X] Nvidia GeForce RTX 3060 Ti FE AMD Ryzen 9 7950X 4.5GHz
NVIDIA GeForce RTX 3060 Ti
min:
46 fps, max:
123 fps
120.4 [X] Nvidia GeForce RTX 3060 Ti FE AMD Ryzen 9 7900X 4.7GHz
NVIDIA GeForce RTX 3060 Ti
min:
109 fps, max:
133 fps
~ 72 fps
NVIDIA GeForce RTX 3070:
87 [X] MSI GeForce RTX 3070 Ventus 3X Intel Core i9-9900K 3.6GHz
NVIDIA GeForce RTX 3070
min:
51 fps
95.9 ~ 91 fps
NVIDIA GeForce RTX 3060 Ti:
41.8 [X] Geekom Mini IT11 (Nvidia GeForce RTX 3060 Ti FE TB3) Intel Core i7-11390H 3.4GHz
NVIDIA GeForce RTX 3060 Ti
min:
26 fps, max:
74 fps
43.9 [X] Huawei MateBook X Pro 2023 (Nvidia GeForce RTX 3060 Ti FE TB3) Intel Core i7-1360P 1.6GHz
NVIDIA GeForce RTX 3060 Ti
min:
29 fps, max:
75 fps
45.4 [X] Nvidia GeForce RTX 3060 Ti FE AMD Ryzen 9 5900X 3.7GHz
NVIDIA GeForce RTX 3060 Ti
min:
29 fps, max:
84 fps
91.3 [X] Nvidia GeForce RTX 3060 Ti FE AMD Ryzen 9 7900X 4.7GHz
NVIDIA GeForce RTX 3060 Ti
min:
81 fps, max:
100 fps
95.7 [X] Nvidia GeForce RTX 3060 Ti FE AMD Ryzen 9 7950X 4.5GHz
NVIDIA GeForce RTX 3060 Ti
min:
86 fps, max:
106 fps
~ 64 fps
NVIDIA GeForce RTX 3070:
26.4 57 [X] MSI GeForce RTX 3070 Ventus 3X Intel Core i9-9900K 3.6GHz
NVIDIA GeForce RTX 3070
min:
33 fps
~ 42 fps
NVIDIA GeForce RTX 3060 Ti:
1.7 [X] Nvidia GeForce RTX 3060 Ti FE AMD Ryzen 9 5900X 3.7GHz
NVIDIA GeForce RTX 3060 Ti
min:
1 fps, max:
2 fps
5 [X] Nvidia GeForce RTX 3060 Ti FE AMD Ryzen 9 7900X 4.7GHz
NVIDIA GeForce RTX 3060 Ti
min:
2 fps, max:
6 fps
36.1 [X] Nvidia GeForce RTX 3060 Ti FE AMD Ryzen 9 7950X 4.5GHz
NVIDIA GeForce RTX 3060 Ti
min:
33 fps, max:
51 fps
~ 14 fps
100%
GeForce RTX 3050 Ti Laptop GPU:
92.3 [X] XMG Focus 17 @75 W TGP Intel Core i7-11800H 2.3GHz
GeForce RTX 3050 Ti Laptop GPU
min:
42.1 fps, P0.1:
45.8 fps, P1:
76.8 fps, max:
136 fps
105.4 [X] HP Victus 16-e0145ng AMD Ryzen 5 5600H 3.3GHz
GeForce RTX 3050 Ti Laptop GPU
min:
34.2 fps, P0.1:
48.7 fps, P1:
81.9 fps, max:
168.2 fps
~ 99 fps
105%
NVIDIA GeForce RTX 3070:
104 [X] MSI GeForce RTX 3070 Ventus 3X Intel Core i9-9900K 3.6GHz
NVIDIA GeForce RTX 3070
min:
42.3 fps, P0.1:
43.5 fps, P1:
61.4 fps, max:
234 fps
fps
100%
GeForce RTX 3050 Ti Laptop GPU:
84.7 [X] XMG Focus 17 @75 W TGP Intel Core i7-11800H 2.3GHz
GeForce RTX 3050 Ti Laptop GPU
min:
42.9 fps, P0.1:
44.1 fps, P1:
74.5 fps, max:
114 fps
95.3 [X] HP Victus 16-e0145ng AMD Ryzen 5 5600H 3.3GHz
GeForce RTX 3050 Ti Laptop GPU
min:
33.8 fps, P0.1:
48.1 fps, P1:
71.8 fps, max:
135.2 fps
~ 90 fps
112%
NVIDIA GeForce RTX 3070:
101 [X] MSI GeForce RTX 3070 Ventus 3X Intel Core i9-9900K 3.6GHz
NVIDIA GeForce RTX 3070
min:
40.1 fps, P0.1:
45.8 fps, P1:
59.5 fps, max:
220 fps
fps
100%
GeForce RTX 3050 Ti Laptop GPU:
64.6 [X] XMG Focus 17 @75 W TGP Intel Core i7-11800H 2.3GHz
GeForce RTX 3050 Ti Laptop GPU
min:
33.6 fps, P0.1:
37.7 fps, P1:
54.5 fps, max:
82.3 fps
fps
152%
NVIDIA GeForce RTX 3070:
98.1 [X] MSI GeForce RTX 3070 Ventus 3X Intel Core i9-9900K 3.6GHz
NVIDIA GeForce RTX 3070
min:
26.9 fps, P0.1:
44.4 fps, P1:
59.7 fps, max:
226 fps
fps
NVIDIA GeForce RTX 3070:
84.3 [X] MSI GeForce RTX 3070 Ventus 3X Intel Core i9-9900K 3.6GHz
NVIDIA GeForce RTX 3070
min:
37 fps, P0.1:
41.9 fps, P1:
54.9 fps, max:
129 fps
fps
100%
GeForce RTX 3050 Ti Laptop GPU:
192 fps
100%
GeForce RTX 3050 Ti Laptop GPU:
177 198 [X] XMG Focus 17 @75 W TGP Intel Core i7-11800H 2.3GHz
GeForce RTX 3050 Ti Laptop GPU
min:
62.8 fps, P0.1:
100 fps, P1:
112 fps, max:
436 fps
~ 188 fps
141%
NVIDIA GeForce RTX 3070:
265 [X] MSI GeForce RTX 3070 Ventus 3X Intel Core i9-9900K 3.6GHz
NVIDIA GeForce RTX 3070
min:
132 fps, P0.1:
163 fps, P1:
182 fps, max:
363 fps
fps
100%
GeForce RTX 3050 Ti Laptop GPU:
171 192 [X] XMG Focus 17 @75 W TGP Intel Core i7-11800H 2.3GHz
GeForce RTX 3050 Ti Laptop GPU
min:
83 fps, P0.1:
96.4 fps, P1:
106 fps, max:
421 fps
~ 182 fps
145%
NVIDIA GeForce RTX 3070:
264 [X] MSI GeForce RTX 3070 Ventus 3X Intel Core i9-9900K 3.6GHz
NVIDIA GeForce RTX 3070
min:
125 fps, P0.1:
158 fps, P1:
180 fps, max:
371 fps
fps
100%
GeForce RTX 3050 Ti Laptop GPU:
163 177 [X] XMG Focus 17 @75 W TGP Intel Core i7-11800H 2.3GHz
GeForce RTX 3050 Ti Laptop GPU
min:
58.6 fps, P0.1:
91.6 fps, P1:
98 fps, max:
423 fps
~ 170 fps
155%
NVIDIA GeForce RTX 3070:
264 [X] MSI GeForce RTX 3070 Ventus 3X Intel Core i9-9900K 3.6GHz
NVIDIA GeForce RTX 3070
min:
74.9 fps, P0.1:
146 fps, P1:
180 fps, max:
369 fps
fps
100%
GeForce RTX 3050 Ti Laptop GPU:
130 138 [X] XMG Focus 17 @75 W TGP Intel Core i7-11800H 2.3GHz
GeForce RTX 3050 Ti Laptop GPU
min:
58.1 fps, P0.1:
70.7 fps, P1:
75 fps, max:
393 fps
~ 134 fps
195%
NVIDIA GeForce RTX 3070:
261 [X] MSI GeForce RTX 3070 Ventus 3X Intel Core i9-9900K 3.6GHz
NVIDIA GeForce RTX 3070
min:
96.5 fps, P0.1:
155 fps, P1:
176 fps, max:
364 fps
fps
100%
GeForce RTX 3050 Ti Laptop GPU:
88.3 [X] XMG Focus 17 @75 W TGP Intel Core i7-11800H 2.3GHz
GeForce RTX 3050 Ti Laptop GPU
min:
35.3 fps, P0.1:
42.9 fps, P1:
45.3 fps, max:
358 fps
fps
293%
NVIDIA GeForce RTX 3070:
259 [X] MSI GeForce RTX 3070 Ventus 3X Intel Core i9-9900K 3.6GHz
NVIDIA GeForce RTX 3070
min:
96.1 fps, P0.1:
147 fps, P1:
174 fps, max:
370 fps
fps
100%
GeForce RTX 3050 Ti Laptop GPU:
40.1 84.3 99.3 [X] Dell G15 5515 AMD Ryzen 7 5800H 3.2GHz
GeForce RTX 3050 Ti Laptop GPU
min:
25 fps, P0.1:
35.8 fps, P1:
45.1 fps, max:
241 fps
~ 75 fps
223%
NVIDIA GeForce RTX 3070:
166.9 fps
235%
NVIDIA GeForce RTX 3060 Ti:
176.2 [X] Nvidia GeForce RTX 3060 Ti FE AMD Ryzen 9 5900X 3.7GHz
NVIDIA GeForce RTX 3060 Ti
min:
33.2 fps, P0.1:
53 fps, P1:
84.8 fps, max:
374 fps
fps
100%
GeForce RTX 3050 Ti Laptop GPU:
35.1 62.8 [X] XMG Focus 17 @75 W TGP Intel Core i7-11800H 2.3GHz
GeForce RTX 3050 Ti Laptop GPU
min:
33.7 fps, P0.1:
34.9 fps, P1:
39.2 fps, max:
134 fps
66.2 73.6 [X] Dell G15 5515 AMD Ryzen 7 5800H 3.2GHz
GeForce RTX 3050 Ti Laptop GPU
min:
30.1 fps, P0.1:
36 fps, P1:
44.2 fps, max:
164 fps
~ 59 fps
185%
NVIDIA GeForce RTX 3070:
78.2 [X] MSI GeForce RTX 3070 Ventus 3X Intel Core i9-9900K 3.6GHz
NVIDIA GeForce RTX 3070
min:
35.5 fps, P0.1:
39 fps, P1:
47.3 fps, max:
165 fps
139.5 ~ 109 fps
222%
NVIDIA GeForce RTX 3060 Ti:
131.2 [X] Nvidia GeForce RTX 3060 Ti FE AMD Ryzen 9 5900X 3.7GHz
NVIDIA GeForce RTX 3060 Ti
min:
35.1 fps, P0.1:
47.8 fps, P1:
81.2 fps, max:
263 fps
fps
100%
GeForce RTX 3050 Ti Laptop GPU:
33.6 59.4 [X] XMG Focus 17 @75 W TGP Intel Core i7-11800H 2.3GHz
GeForce RTX 3050 Ti Laptop GPU
min:
27 fps, P0.1:
31.8 fps, P1:
39.4 fps, max:
166 fps
62.6 68.9 [X] Dell G15 5515 AMD Ryzen 7 5800H 3.2GHz
GeForce RTX 3050 Ti Laptop GPU
min:
32.9 fps, P0.1:
38 fps, P1:
45.4 fps, max:
127 fps
~ 56 fps
180%
NVIDIA GeForce RTX 3070:
73.4 [X] MSI GeForce RTX 3070 Ventus 3X Intel Core i9-9900K 3.6GHz
NVIDIA GeForce RTX 3070
min:
27.4 fps, P0.1:
34.3 fps, P1:
41.5 fps, max:
161 fps
128.3 ~ 101 fps
210%
NVIDIA GeForce RTX 3060 Ti:
117.8 [X] Nvidia GeForce RTX 3060 Ti FE AMD Ryzen 9 5900X 3.7GHz
NVIDIA GeForce RTX 3060 Ti
min:
33.2 fps, P0.1:
49.5 fps, P1:
73.9 fps, max:
254 fps
fps
100%
GeForce RTX 3050 Ti Laptop GPU:
24.9 45.1 47.6 [X] XMG Focus 17 @75 W TGP Intel Core i7-11800H 2.3GHz
GeForce RTX 3050 Ti Laptop GPU
min:
23.5 fps, P0.1:
25.9 fps, P1:
31.5 fps, max:
99.8 fps
52.2 [X] Dell G15 5515 AMD Ryzen 7 5800H 3.2GHz
GeForce RTX 3050 Ti Laptop GPU
min:
17.7 fps, P0.1:
20.2 fps, P1:
30.7 fps, max:
93 fps
~ 42 fps
221%
NVIDIA GeForce RTX 3070:
68.6 [X] MSI GeForce RTX 3070 Ventus 3X Intel Core i9-9900K 3.6GHz
NVIDIA GeForce RTX 3070
min:
30.1 fps, P0.1:
33.3 fps, P1:
39.5 fps, max:
153 fps
117.5 ~ 93 fps
261%
NVIDIA GeForce RTX 3060 Ti:
109.5 [X] Nvidia GeForce RTX 3060 Ti FE AMD Ryzen 9 5900X 3.7GHz
NVIDIA GeForce RTX 3060 Ti
min:
38.1 fps, P0.1:
48 fps, P1:
65 fps, max:
221 fps
fps
100%
GeForce RTX 3050 Ti Laptop GPU:
31.3 32.4 [X] XMG Focus 17 @75 W TGP Intel Core i7-11800H 2.3GHz
GeForce RTX 3050 Ti Laptop GPU
min:
9.77 fps, P0.1:
13.3 fps, P1:
19.9 fps, max:
70.5 fps
~ 32 fps
253%
NVIDIA GeForce RTX 3070:
66.2 [X] MSI GeForce RTX 3070 Ventus 3X Intel Core i9-9900K 3.6GHz
NVIDIA GeForce RTX 3070
min:
19.1 fps, P0.1:
31 fps, P1:
40 fps, max:
148 fps
95 ~ 81 fps
240%
NVIDIA GeForce RTX 3060 Ti:
76.9 [X] Nvidia GeForce RTX 3060 Ti FE AMD Ryzen 9 5900X 3.7GHz
NVIDIA GeForce RTX 3060 Ti
min:
35.6 fps, P0.1:
41.5 fps, P1:
54.9 fps, max:
129.7 fps
fps
100%
GeForce RTX 3050 Ti Laptop GPU:
17.7 [X] XMG Focus 17 @75 W TGP Intel Core i7-11800H 2.3GHz
GeForce RTX 3050 Ti Laptop GPU
min:
6.86 fps, P0.1:
10.5 fps, P1:
13.3 fps, max:
24.8 fps
fps
288%
NVIDIA GeForce RTX 3070:
48.9 52.6 [X] MSI GeForce RTX 3070 Ventus 3X Intel Core i9-9900K 3.6GHz
NVIDIA GeForce RTX 3070
min:
25.5 fps, P0.1:
30.7 fps, P1:
35.8 fps, max:
107 fps
~ 51 fps
228%
NVIDIA GeForce RTX 3060 Ti:
40.3 [X] Nvidia GeForce RTX 3060 Ti FE AMD Ryzen 9 5900X 3.7GHz
NVIDIA GeForce RTX 3060 Ti
min:
19 fps, P0.1:
24.4 fps, P1:
31.1 fps, max:
127.5 fps
fps
100%
GeForce RTX 3050 Ti Laptop GPU:
70.2 [X] SCHENKER XMG Focus 17 Intel Core i7-11800H 2.3GHz
GeForce RTX 3050 Ti Laptop GPU
min:
27.6 fps, P0.1:
56.5 fps, P1:
58.5 fps, max:
100 fps
72.4 [X] SCHENKER XMG Focus 15 Intel Core i7-11800H 2.3GHz
GeForce RTX 3050 Ti Laptop GPU
min:
17.6 fps, P0.1:
53.1 fps, P1:
59.3 fps, max:
112 fps
~ 71 fps
168%
NVIDIA GeForce RTX 3070:
119 [X] MSI GeForce RTX 3070 Ventus 3X Intel Core i9-9900K 3.6GHz
NVIDIA GeForce RTX 3070
min:
84.7 fps, P0.1:
98.7 fps, P1:
105 fps, max:
157 fps
fps
100%
GeForce RTX 3050 Ti Laptop GPU:
49.3 [X] SCHENKER XMG Focus 17 Intel Core i7-11800H 2.3GHz
GeForce RTX 3050 Ti Laptop GPU
min:
24 fps, P0.1:
37.8 fps, P1:
39 fps, max:
76.3 fps
57.4 [X] SCHENKER XMG Focus 15 Intel Core i7-11800H 2.3GHz
GeForce RTX 3050 Ti Laptop GPU
min:
25.3 fps, P0.1:
27.4 fps, P1:
39.6 fps, max:
109 fps
~ 53 fps
225%
NVIDIA GeForce RTX 3070:
119 [X] MSI GeForce RTX 3070 Ventus 3X Intel Core i9-9900K 3.6GHz
NVIDIA GeForce RTX 3070
min:
80.8 fps, P0.1:
88.4 fps, P1:
100 fps, max:
147 fps
fps
100%
GeForce RTX 3050 Ti Laptop GPU:
42.2 [X] SCHENKER XMG Focus 17 Intel Core i7-11800H 2.3GHz
GeForce RTX 3050 Ti Laptop GPU
min:
21.5 fps, P0.1:
29.9 fps, P1:
31.4 fps, max:
70.9 fps
51.2 [X] SCHENKER XMG Focus 15 Intel Core i7-11800H 2.3GHz
GeForce RTX 3050 Ti Laptop GPU
min:
18.8 fps, P0.1:
31 fps, P1:
40.3 fps, max:
95.8 fps
~ 47 fps
232%
NVIDIA GeForce RTX 3070:
109 [X] MSI GeForce RTX 3070 Ventus 3X Intel Core i9-9900K 3.6GHz
NVIDIA GeForce RTX 3070
min:
75.8 fps, P0.1:
79.2 fps, P1:
85.4 fps, max:
146 fps
fps
NVIDIA GeForce RTX 3070:
82.9 [X] MSI GeForce RTX 3070 Ventus 3X Intel Core i9-9900K 3.6GHz
NVIDIA GeForce RTX 3070
min:
14.5 fps, P0.1:
17.2 fps, P1:
62.1 fps, max:
121 fps
fps
NVIDIA GeForce RTX 3070:
49.7 [X] MSI GeForce RTX 3070 Ventus 3X Intel Core i9-9900K 3.6GHz
NVIDIA GeForce RTX 3070
min:
14.5 fps, P0.1:
16.4 fps, P1:
42.5 fps, max:
62.1 fps
fps
205%
NVIDIA GeForce RTX 3070:
407 fps
185%
NVIDIA GeForce RTX 3060 Ti:
128.9 [X] Geekom Mini IT11 (Nvidia GeForce RTX 3060 Ti FE TB3) 874931
Intel Core i7-11390H 3.4GHz
NVIDIA GeForce RTX 3060 Ti
min:
96 fps, P1:
80 fps, max:
151 fps
137.3 [X] Huawei MateBook X Pro 2023 (Nvidia GeForce RTX 3060 Ti FE TB3) 874931
Intel Core i7-1360P 1.6GHz
NVIDIA GeForce RTX 3060 Ti
min:
104 fps, P1:
80 fps, max:
162 fps
142.1 [X] Intel NUC 12 Pro Kit NUC12WSKi7 874931
Intel Core i7-1260P 1.5GHz
NVIDIA GeForce RTX 3060 Ti
min:
103 fps, P1:
88 fps, max:
168 fps
521 [X] Nvidia GeForce RTX 3060 Ti FE 874931
AMD Ryzen 9 5900X 3.7GHz
NVIDIA GeForce RTX 3060 Ti
min:
396 fps, P1:
332 fps, max:
560 fps
632 [X] Nvidia GeForce RTX 3060 Ti FE 874931
AMD Ryzen 9 7900X 4.7GHz
NVIDIA GeForce RTX 3060 Ti
min:
479 fps, P1:
393 fps, max:
705 fps
651 [X] Nvidia GeForce RTX 3060 Ti FE 874931
AMD Ryzen 9 7950X 4.5GHz
NVIDIA GeForce RTX 3060 Ti
min:
471 fps, P1:
407 fps, max:
726 fps
~ 369 fps
246%
NVIDIA GeForce RTX 3070:
259 [X] MSI GeForce RTX 3070 Ventus 3X Intel Core i9-9900K 3.6GHz
NVIDIA GeForce RTX 3070
min:
202 fps
361 ~ 310 fps
191%
NVIDIA GeForce RTX 3060 Ti:
101.8 [X] Geekom Mini IT11 (Nvidia GeForce RTX 3060 Ti FE TB3) 874931
Intel Core i7-11390H 3.4GHz
NVIDIA GeForce RTX 3060 Ti
min:
24 fps, P1:
30 fps, max:
131 fps
106.9 [X] Huawei MateBook X Pro 2023 (Nvidia GeForce RTX 3060 Ti FE TB3) 874931
Intel Core i7-1360P 1.6GHz
NVIDIA GeForce RTX 3060 Ti
min:
31 fps, P1:
31 fps, max:
137 fps
113.1 [X] Intel NUC 12 Pro Kit NUC12WSKi7 874931
Intel Core i7-1260P 1.5GHz
NVIDIA GeForce RTX 3060 Ti
min:
64 fps, P1:
32 fps, max:
147 fps
361 [X] Nvidia GeForce RTX 3060 Ti FE 874931
AMD Ryzen 9 5900X 3.7GHz
NVIDIA GeForce RTX 3060 Ti
min:
307 fps, P1:
251 fps, max:
404 fps
375 [X] Nvidia GeForce RTX 3060 Ti FE 874931
AMD Ryzen 9 7900X 4.7GHz
NVIDIA GeForce RTX 3060 Ti
min:
318 fps, P1:
269 fps, max:
429 fps
390 [X] Nvidia GeForce RTX 3060 Ti FE 874931
AMD Ryzen 9 7950X 4.5GHz
NVIDIA GeForce RTX 3060 Ti
min:
332 fps, P1:
284 fps, max:
451 fps
~ 241 fps
264%
NVIDIA GeForce RTX 3070:
250 [X] MSI GeForce RTX 3070 Ventus 3X Intel Core i9-9900K 3.6GHz
NVIDIA GeForce RTX 3070
min:
184 fps
304 ~ 277 fps
174%
NVIDIA GeForce RTX 3060 Ti:
66 [X] Geekom Mini IT11 (Nvidia GeForce RTX 3060 Ti FE TB3) 874931
Intel Core i7-11390H 3.4GHz
NVIDIA GeForce RTX 3060 Ti
min:
16 fps, P1:
9 fps, max:
103 fps
68.7 [X] Intel NUC 12 Pro Kit NUC12WSKi7 874931
Intel Core i7-1260P 1.5GHz
NVIDIA GeForce RTX 3060 Ti
min:
11 fps, P1:
9 fps, max:
111 fps
69.8 [X] Huawei MateBook X Pro 2023 (Nvidia GeForce RTX 3060 Ti FE TB3) 874931
Intel Core i7-1360P 1.6GHz
NVIDIA GeForce RTX 3060 Ti
min:
12 fps, P1:
9 fps, max:
108 fps
285 [X] Nvidia GeForce RTX 3060 Ti FE 874931
AMD Ryzen 9 5900X 3.7GHz
NVIDIA GeForce RTX 3060 Ti
min:
243 fps, P1:
183 fps, max:
319 fps
303 [X] Nvidia GeForce RTX 3060 Ti FE 874931
AMD Ryzen 9 7900X 4.7GHz
NVIDIA GeForce RTX 3060 Ti
min:
260 fps, P1:
233 fps, max:
344 fps
306 [X] Nvidia GeForce RTX 3060 Ti FE 874931
AMD Ryzen 9 7950X 4.5GHz
NVIDIA GeForce RTX 3060 Ti
min:
263 fps, P1:
231 fps, max:
349 fps
~ 183 fps
283%
NVIDIA GeForce RTX 3070:
148 [X] MSI GeForce RTX 3070 Ventus 3X Intel Core i9-9900K 3.6GHz
NVIDIA GeForce RTX 3070
min:
129 fps
158 ~ 153 fps
181%
NVIDIA GeForce RTX 3060 Ti:
49.8 [X] Geekom Mini IT11 (Nvidia GeForce RTX 3060 Ti FE TB3) 874931
Intel Core i7-11390H 3.4GHz
NVIDIA GeForce RTX 3060 Ti
min:
33 fps, P1:
24 fps, max:
57 fps
50.5 [X] Huawei MateBook X Pro 2023 (Nvidia GeForce RTX 3060 Ti FE TB3) 874931
Intel Core i7-1360P 1.6GHz
NVIDIA GeForce RTX 3060 Ti
min:
33 fps, P1:
23 fps, max:
59 fps
51.7 [X] Intel NUC 12 Pro Kit NUC12WSKi7 874931
Intel Core i7-1260P 1.5GHz
NVIDIA GeForce RTX 3060 Ti
min:
34 fps, P1:
24 fps, max:
59 fps
141.1 [X] Nvidia GeForce RTX 3060 Ti FE 874931
AMD Ryzen 9 5900X 3.7GHz
NVIDIA GeForce RTX 3060 Ti
min:
119 fps, P1:
120 fps, max:
158 fps
145.5 [X] Nvidia GeForce RTX 3060 Ti FE 874931
AMD Ryzen 9 7900X 4.7GHz
NVIDIA GeForce RTX 3060 Ti
min:
124 fps, P1:
123 fps, max:
161 fps
147.6 [X] Nvidia GeForce RTX 3060 Ti FE 874931
AMD Ryzen 9 7950X 4.5GHz
NVIDIA GeForce RTX 3060 Ti
min:
127 fps, P1:
126 fps, max:
165 fps
~ 98 fps
100%
GeForce RTX 3050 Ti Laptop GPU:
30.9 [X] SCHENKER Vision 14 831795
Intel Core i7-11370H 3.3GHz
GeForce RTX 3050 Ti Laptop GPU
min:
23 fps, P1:
22 fps, max:
38 fps
37 37.4 41 43.1 ~ 38 fps
305%
NVIDIA GeForce RTX 3070:
113 [X] MSI GeForce RTX 3070 Ventus 3X Intel Core i9-9900K 3.6GHz
NVIDIA GeForce RTX 3070
min:
97 fps
118 ~ 116 fps
203%
NVIDIA GeForce RTX 3060 Ti:
45.2 [X] Geekom Mini IT11 (Nvidia GeForce RTX 3060 Ti FE TB3) 874931
Intel Core i7-11390H 3.4GHz
NVIDIA GeForce RTX 3060 Ti
min:
10 fps, P1:
16 fps, max:
55 fps
48.8 [X] Huawei MateBook X Pro 2023 (Nvidia GeForce RTX 3060 Ti FE TB3) 874931
Intel Core i7-1360P 1.6GHz
NVIDIA GeForce RTX 3060 Ti
min:
30 fps, P1:
20 fps, max:
58 fps
49.2 [X] Intel NUC 12 Pro Kit NUC12WSKi7 874931
Intel Core i7-1260P 1.5GHz
NVIDIA GeForce RTX 3060 Ti
min:
34 fps, P1:
21 fps, max:
59 fps
103.7 [X] Nvidia GeForce RTX 3060 Ti FE 874931
AMD Ryzen 9 5900X 3.7GHz
NVIDIA GeForce RTX 3060 Ti
min:
89 fps, P1:
88 fps, max:
115 fps
107.2 [X] Nvidia GeForce RTX 3060 Ti FE 874931
AMD Ryzen 9 7900X 4.7GHz
NVIDIA GeForce RTX 3060 Ti
min:
92 fps, P1:
92 fps, max:
118 fps
107.8 [X] Nvidia GeForce RTX 3060 Ti FE 874931
AMD Ryzen 9 7950X 4.5GHz
NVIDIA GeForce RTX 3060 Ti
min:
92 fps, P1:
92 fps, max:
119 fps
~ 77 fps
100%
GeForce RTX 3050 Ti Laptop GPU:
14.4 fps
458%
NVIDIA GeForce RTX 3070:
64 [X] MSI GeForce RTX 3070 Ventus 3X Intel Core i9-9900K 3.6GHz
NVIDIA GeForce RTX 3070
min:
57 fps
67.3 ~ 66 fps
347%
NVIDIA GeForce RTX 3060 Ti:
38.4 [X] Geekom Mini IT11 (Nvidia GeForce RTX 3060 Ti FE TB3) 874931
Intel Core i7-11390H 3.4GHz
NVIDIA GeForce RTX 3060 Ti
min:
8 fps, P1:
9 fps, max:
49 fps
41.2 [X] Huawei MateBook X Pro 2023 (Nvidia GeForce RTX 3060 Ti FE TB3) 874931
Intel Core i7-1360P 1.6GHz
NVIDIA GeForce RTX 3060 Ti
min:
13 fps, P1:
14 fps, max:
52 fps
41.5 [X] Intel NUC 12 Pro Kit NUC12WSKi7 874931
Intel Core i7-1260P 1.5GHz
NVIDIA GeForce RTX 3060 Ti
min:
16 fps, P1:
15 fps, max:
52 fps
58.3 [X] Nvidia GeForce RTX 3060 Ti FE 874931
AMD Ryzen 9 7900X 4.7GHz
NVIDIA GeForce RTX 3060 Ti
min:
51 fps, P1:
29 fps, max:
59 fps
58.3 [X] Nvidia GeForce RTX 3060 Ti FE 874931
AMD Ryzen 9 7950X 4.5GHz
NVIDIA GeForce RTX 3060 Ti
min:
52 fps, P1:
29 fps, max:
60 fps
59.8 [X] Nvidia GeForce RTX 3060 Ti FE 874931
AMD Ryzen 9 5900X 3.7GHz
NVIDIA GeForce RTX 3060 Ti
min:
52 fps, P1:
52 fps, max:
67 fps
~ 50 fps
100%
GeForce RTX 3050 Ti Laptop GPU:
144 [X] SCHENKER XMG Focus 15 Intel Core i7-11800H 2.3GHz
GeForce RTX 3050 Ti Laptop GPU
min:
63.2 fps, P0.1:
99.5 fps, P1:
110 fps, max:
204 fps
144 [X] SCHENKER XMG Focus 17 Intel Core i7-11800H 2.3GHz
GeForce RTX 3050 Ti Laptop GPU
min:
100 fps, P0.1:
103 fps, P1:
111 fps, max:
208 fps
~ 144 fps
100%
NVIDIA GeForce RTX 3070:
144 [X] MSI GeForce RTX 3070 Ventus 3X Intel Core i9-9900K 3.6GHz
NVIDIA GeForce RTX 3070
min:
78.6 fps, P0.1:
112 fps, P1:
122 fps, max:
177 fps
fps
100%
GeForce RTX 3050 Ti Laptop GPU:
143 [X] SCHENKER XMG Focus 15 Intel Core i7-11800H 2.3GHz
GeForce RTX 3050 Ti Laptop GPU
min:
99.5 fps, P0.1:
100 fps, P1:
109 fps, max:
185 fps
143 [X] SCHENKER XMG Focus 17 Intel Core i7-11800H 2.3GHz
GeForce RTX 3050 Ti Laptop GPU
min:
62.8 fps, P0.1:
100 fps, P1:
111 fps, max:
194 fps
~ 143 fps
101%
NVIDIA GeForce RTX 3070:
144 [X] MSI GeForce RTX 3070 Ventus 3X Intel Core i9-9900K 3.6GHz
NVIDIA GeForce RTX 3070
min:
77.9 fps, P0.1:
100 fps, P1:
121 fps, max:
177 fps
fps
NVIDIA GeForce RTX 3070:
144 [X] MSI GeForce RTX 3070 Ventus 3X Intel Core i9-9900K 3.6GHz
NVIDIA GeForce RTX 3070
min:
48.1 fps, P0.1:
92.2 fps, P1:
100 fps, max:
167 fps
fps
NVIDIA GeForce RTX 3070:
144 [X] MSI GeForce RTX 3070 Ventus 3X Intel Core i9-9900K 3.6GHz
NVIDIA GeForce RTX 3070
min:
37.3 fps, P0.1:
108 fps, P1:
121 fps, max:
185 fps
fps
NVIDIA GeForce RTX 3060 Ti:
200 [X] Nvidia GeForce RTX 3060 Ti FE AMD Ryzen 9 5900X 3.7GHz
NVIDIA GeForce RTX 3060 Ti
min:
37.4 fps, P0.1:
52.9 fps, P1:
86.1 fps, max:
411 fps
fps
100%
GeForce RTX 3050 Ti Laptop GPU:
91.2 [X] SCHENKER XMG Focus 15 Intel Core i7-11800H 2.3GHz
GeForce RTX 3050 Ti Laptop GPU
min:
33.9 fps, P0.1:
43.2 fps, P1:
57.5 fps, max:
210 fps
91.3 [X] SCHENKER XMG Focus 17 Intel Core i7-11800H 2.3GHz
GeForce RTX 3050 Ti Laptop GPU
min:
35.5 fps, P0.1:
42.7 fps, P1:
57.6 fps, max:
209 fps
~ 91 fps
181%
NVIDIA GeForce RTX 3070:
165 [X] MSI GeForce RTX 3070 Ventus 3X Intel Core i9-9900K 3.6GHz
NVIDIA GeForce RTX 3070
min:
38.1 fps, P0.1:
55.6 fps, P1:
97.5 fps, max:
261 fps
fps
184%
NVIDIA GeForce RTX 3060 Ti:
167.8 [X] Nvidia GeForce RTX 3060 Ti FE AMD Ryzen 9 5900X 3.7GHz
NVIDIA GeForce RTX 3060 Ti
min:
38.5 fps, P0.1:
49.6 fps, P1:
82.3 fps, max:
390 fps
fps
100%
GeForce RTX 3050 Ti Laptop GPU:
79.8 [X] SCHENKER XMG Focus 15 Intel Core i7-11800H 2.3GHz
GeForce RTX 3050 Ti Laptop GPU
min:
25.6 fps, P0.1:
39.4 fps, P1:
52.2 fps, max:
156 fps
80 [X] SCHENKER XMG Focus 17 Intel Core i7-11800H 2.3GHz
GeForce RTX 3050 Ti Laptop GPU
min:
27.8 fps, P0.1:
38.1 fps, P1:
53.6 fps, max:
159 fps
~ 80 fps
198%
NVIDIA GeForce RTX 3070:
158 [X] MSI GeForce RTX 3070 Ventus 3X Intel Core i9-9900K 3.6GHz
NVIDIA GeForce RTX 3070
min:
35.9 fps, P0.1:
56.2 fps, P1:
94.2 fps, max:
279 fps
fps
187%
NVIDIA GeForce RTX 3060 Ti:
149.8 [X] Nvidia GeForce RTX 3060 Ti FE AMD Ryzen 9 5900X 3.7GHz
NVIDIA GeForce RTX 3060 Ti
min:
29.2 fps, P0.1:
52.9 fps, P1:
81.9 fps, max:
295 fps
fps
100%
GeForce RTX 3050 Ti Laptop GPU:
58.8 [X] SCHENKER XMG Focus 17 Intel Core i7-11800H 2.3GHz
GeForce RTX 3050 Ti Laptop GPU
min:
22.7 fps, P0.1:
32.9 fps, P1:
41.5 fps, max:
147 fps
59 [X] SCHENKER XMG Focus 15 Intel Core i7-11800H 2.3GHz
GeForce RTX 3050 Ti Laptop GPU
min:
24.9 fps, P0.1:
29.7 fps, P1:
40.3 fps, max:
131 fps
~ 59 fps
222%
NVIDIA GeForce RTX 3070:
131 [X] MSI GeForce RTX 3070 Ventus 3X Intel Core i9-9900K 3.6GHz
NVIDIA GeForce RTX 3070
min:
36.5 fps, P0.1:
54.2 fps, P1:
84.6 fps, max:
223 fps
fps
192%
NVIDIA GeForce RTX 3060 Ti:
113.3 [X] Nvidia GeForce RTX 3060 Ti FE AMD Ryzen 9 5900X 3.7GHz
NVIDIA GeForce RTX 3060 Ti
min:
14.6 fps, P0.1:
44.4 fps, P1:
69.1 fps, max:
319 fps
fps
NVIDIA GeForce RTX 3070:
99.3 [X] MSI GeForce RTX 3070 Ventus 3X Intel Core i9-9900K 3.6GHz
NVIDIA GeForce RTX 3070
min:
34.7 fps, P0.1:
47.7 fps, P1:
68.2 fps, max:
207 fps
fps
NVIDIA GeForce RTX 3060 Ti:
85.2 [X] Nvidia GeForce RTX 3060 Ti FE AMD Ryzen 9 5900X 3.7GHz
NVIDIA GeForce RTX 3060 Ti
min:
32.4 fps, P0.1:
44.4 fps, P1:
59.6 fps, max:
217 fps
fps
NVIDIA GeForce RTX 3070:
57.8 [X] MSI GeForce RTX 3070 Ventus 3X Intel Core i9-9900K 3.6GHz
NVIDIA GeForce RTX 3070
min:
25 fps, P0.1:
35.8 fps, P1:
42 fps, max:
140 fps
fps
NVIDIA GeForce RTX 3060 Ti:
49.8 [X] Nvidia GeForce RTX 3060 Ti FE AMD Ryzen 9 5900X 3.7GHz
NVIDIA GeForce RTX 3060 Ti
min:
32.7 fps, P0.1:
34.8 fps, P1:
39.4 fps, max:
96.4 fps
fps
NVIDIA GeForce RTX 3070:
129 [X] MSI GeForce RTX 3070 Ventus 3X Intel Core i9-9900K 3.6GHz
NVIDIA GeForce RTX 3070
min:
26 fps, P0.1:
46.8 fps, P1:
71.2 fps, max:
325 fps
fps
100%
GeForce RTX 3050 Ti Laptop GPU:
111 [X] SCHENKER XMG Focus 17 Intel Core i7-11800H 2.3GHz
GeForce RTX 3050 Ti Laptop GPU
min:
25.7 fps, P0.1:
44.9 fps, P1:
65 fps, max:
362 fps
115 [X] SCHENKER XMG Focus 15 Intel Core i7-11800H 2.3GHz
GeForce RTX 3050 Ti Laptop GPU
min:
27.6 fps, P0.1:
50.7 fps, P1:
69.7 fps, max:
387 fps
~ 113 fps
109%
NVIDIA GeForce RTX 3070:
123 [X] MSI GeForce RTX 3070 Ventus 3X Intel Core i9-9900K 3.6GHz
NVIDIA GeForce RTX 3070
min:
24.6 fps, P0.1:
49.7 fps, P1:
68.1 fps, max:
309 fps
fps
NVIDIA GeForce RTX 3070:
123 [X] MSI GeForce RTX 3070 Ventus 3X Intel Core i9-9900K 3.6GHz
NVIDIA GeForce RTX 3070
min:
24.8 fps, P0.1:
43.3 fps, P1:
67.1 fps, max:
294 fps
fps
NVIDIA GeForce RTX 3070:
105 [X] MSI GeForce RTX 3070 Ventus 3X Intel Core i9-9900K 3.6GHz
NVIDIA GeForce RTX 3070
min:
24.4 fps, P0.1:
33.3 fps, P1:
64.5 fps, max:
294 fps
fps
100%
GeForce RTX 3050 Ti Laptop GPU:
102 [X] SCHENKER XMG Focus 15 Intel Core i7-11800H 2.3GHz
GeForce RTX 3050 Ti Laptop GPU
min:
13.9 fps, P0.1:
82 fps, P1:
84.1 fps, max:
138 fps
103 [X] SCHENKER XMG Focus 17 Intel Core i7-11800H 2.3GHz
GeForce RTX 3050 Ti Laptop GPU
min:
51.1 fps, P0.1:
69.7 fps, P1:
83.2 fps, max:
132 fps
114 [X] XMG Prototyp AMD Ryzen 5 5600H 3.3GHz
GeForce RTX 3050 Ti Laptop GPU
min:
11.1 fps, P0.1:
83.8 fps, P1:
90 fps, max:
154 fps
~ 106 fps
175%
NVIDIA GeForce RTX 3070:
185 [X] MSI GeForce RTX 3070 Ventus 3X Intel Core i9-9900K 3.6GHz
NVIDIA GeForce RTX 3070
min:
112 fps, P0.1:
129 fps, P1:
142 fps, max:
242 fps
fps
100%
GeForce RTX 3050 Ti Laptop GPU:
101 [X] SCHENKER XMG Focus 15 Intel Core i7-11800H 2.3GHz
GeForce RTX 3050 Ti Laptop GPU
min:
77 fps, P0.1:
80.4 fps, P1:
83.6 fps, max:
130 fps
102 [X] SCHENKER XMG Focus 17 Intel Core i7-11800H 2.3GHz
GeForce RTX 3050 Ti Laptop GPU
min:
12.5 fps, P0.1:
81.7 fps, P1:
83.5 fps, max:
134 fps
105 [X] XMG Prototyp AMD Ryzen 5 5600H 3.3GHz
GeForce RTX 3050 Ti Laptop GPU
min:
45.6 fps, P0.1:
56.2 fps, P1:
82.9 fps, max:
143 fps
~ 103 fps
178%
NVIDIA GeForce RTX 3070:
183 [X] MSI GeForce RTX 3070 Ventus 3X Intel Core i9-9900K 3.6GHz
NVIDIA GeForce RTX 3070
min:
124 fps, P0.1:
131 fps, P1:
142 fps, max:
229 fps
fps
100%
GeForce RTX 3050 Ti Laptop GPU:
54.5 [X] XMG Prototyp AMD Ryzen 5 5600H 3.3GHz
GeForce RTX 3050 Ti Laptop GPU
min:
23.5 fps, P0.1:
24.3 fps, P1:
47 fps, max:
63.3 fps
76.4 [X] SCHENKER XMG Focus 15 Intel Core i7-11800H 2.3GHz
GeForce RTX 3050 Ti Laptop GPU
min:
40.2 fps, P0.1:
52.8 fps, P1:
63.1 fps, max:
102 fps
76.4 [X] SCHENKER XMG Focus 17 Intel Core i7-11800H 2.3GHz
GeForce RTX 3050 Ti Laptop GPU
min:
17.8 fps, P0.1:
36.5 fps, P1:
63.7 fps, max:
99.9 fps
~ 69 fps
265%
NVIDIA GeForce RTX 3070:
183 [X] MSI GeForce RTX 3070 Ventus 3X Intel Core i9-9900K 3.6GHz
NVIDIA GeForce RTX 3070
min:
118 fps, P0.1:
133 fps, P1:
141 fps, max:
234 fps
fps
100%
GeForce RTX 3050 Ti Laptop GPU:
40.6 [X] XMG Prototyp AMD Ryzen 5 5600H 3.3GHz
GeForce RTX 3050 Ti Laptop GPU
min:
18.7 fps, P0.1:
24.5 fps, P1:
31.6 fps, max:
58.2 fps
fps
350%
NVIDIA GeForce RTX 3070:
142 [X] MSI GeForce RTX 3070 Ventus 3X Intel Core i9-9900K 3.6GHz
NVIDIA GeForce RTX 3070
min:
32 fps, P0.1:
116 fps, P1:
120 fps, max:
183 fps
fps
100%
GeForce RTX 3050 Ti Laptop GPU:
23 [X] XMG Prototyp AMD Ryzen 5 5600H 3.3GHz
GeForce RTX 3050 Ti Laptop GPU
min:
7.03 fps, P0.1:
16.1 fps, P1:
19.4 fps, max:
28.6 fps
fps
308%
NVIDIA GeForce RTX 3070:
70.8 [X] MSI GeForce RTX 3070 Ventus 3X Intel Core i9-9900K 3.6GHz
NVIDIA GeForce RTX 3070
min:
21.3 fps, P0.1:
33.5 fps, P1:
39.8 fps, max:
98.5 fps
fps
100%
GeForce RTX 3050 Ti Laptop GPU:
76.2 [X] SCHENKER XMG Focus 15 Intel Core i7-11800H 2.3GHz
GeForce RTX 3050 Ti Laptop GPU
min:
9.88 fps, P0.1:
14.3 fps, P1:
31.7 fps, max:
137 fps
77.6 [X] SCHENKER XMG Focus 17 Intel Core i7-11800H 2.3GHz
GeForce RTX 3050 Ti Laptop GPU
min:
11.3 fps, P0.1:
27.9 fps, P1:
40.2 fps, max:
179 fps
95.9 [X] XMG Prototyp AMD Ryzen 5 5600H 3.3GHz
GeForce RTX 3050 Ti Laptop GPU
min:
8.52 fps, P0.1:
16.7 fps, P1:
33 fps, max:
211 fps
~ 83 fps
100%
GeForce RTX 3050 Ti Laptop GPU:
67.6 [X] SCHENKER XMG Focus 17 Intel Core i7-11800H 2.3GHz
GeForce RTX 3050 Ti Laptop GPU
min:
11.2 fps, P0.1:
12.6 fps, P1:
33.8 fps, max:
200 fps
69.5 [X] SCHENKER XMG Focus 15 Intel Core i7-11800H 2.3GHz
GeForce RTX 3050 Ti Laptop GPU
min:
9.65 fps, P0.1:
13.5 fps, P1:
37.1 fps, max:
172 fps
75.6 [X] XMG Prototyp AMD Ryzen 5 5600H 3.3GHz
GeForce RTX 3050 Ti Laptop GPU
min:
7.22 fps, P0.1:
10.5 fps, P1:
34.4 fps, max:
176 fps
~ 71 fps
100%
GeForce RTX 3050 Ti Laptop GPU:
57.2 [X] SCHENKER XMG Focus 15 Intel Core i7-11800H 2.3GHz
GeForce RTX 3050 Ti Laptop GPU
min:
5.71 fps, P0.1:
7.63 fps, P1:
23.6 fps, max:
151 fps
63 [X] SCHENKER XMG Focus 17 Intel Core i7-11800H 2.3GHz
GeForce RTX 3050 Ti Laptop GPU
min:
11.5 fps, P0.1:
16.3 fps, P1:
29.2 fps, max:
244 fps
66.1 [X] XMG Prototyp AMD Ryzen 5 5600H 3.3GHz
GeForce RTX 3050 Ti Laptop GPU
min:
13.7 fps, P0.1:
16.1 fps, P1:
39.8 fps, max:
176 fps
~ 62 fps
100%
GeForce RTX 3050 Ti Laptop GPU:
40.4 [X] XMG Prototyp AMD Ryzen 5 5600H 3.3GHz
GeForce RTX 3050 Ti Laptop GPU
min:
7.11 fps, P0.1:
13.4 fps, P1:
26.5 fps, max:
185 fps
fps
100%
GeForce RTX 3050 Ti Laptop GPU:
27.5 [X] XMG Prototyp AMD Ryzen 5 5600H 3.3GHz
GeForce RTX 3050 Ti Laptop GPU
min:
3.41 fps, P0.1:
4.22 fps, P1:
8.32 fps, max:
125 fps
fps
100%
GeForce RTX 3050 Ti Laptop GPU:
121.3 fps
100%
GeForce RTX 3050 Ti Laptop GPU:
95.3 115 [X] XMG Prototyp AMD Ryzen 5 5600H 3.3GHz
GeForce RTX 3050 Ti Laptop GPU
~ 105 fps
163%
NVIDIA GeForce RTX 3070:
171 [X] MSI GeForce RTX 3070 Ventus 3X Intel Core i9-9900K 3.6GHz
NVIDIA GeForce RTX 3070
min:
93 fps
fps
100%
GeForce RTX 3050 Ti Laptop GPU:
82.7 101 [X] XMG Prototyp AMD Ryzen 5 5600H 3.3GHz
GeForce RTX 3050 Ti Laptop GPU
~ 92 fps
182%
NVIDIA GeForce RTX 3070:
167 [X] MSI GeForce RTX 3070 Ventus 3X Intel Core i9-9900K 3.6GHz
NVIDIA GeForce RTX 3070
min:
87 fps
fps
100%
GeForce RTX 3050 Ti Laptop GPU:
79.8 93.6 [X] XMG Prototyp AMD Ryzen 5 5600H 3.3GHz
GeForce RTX 3050 Ti Laptop GPU
~ 87 fps
190%
NVIDIA GeForce RTX 3070:
165 [X] MSI GeForce RTX 3070 Ventus 3X Intel Core i9-9900K 3.6GHz
NVIDIA GeForce RTX 3070
max:
82 fps
fps
100%
GeForce RTX 3050 Ti Laptop GPU:
62.1 [X] XMG Prototyp AMD Ryzen 5 5600H 3.3GHz
GeForce RTX 3050 Ti Laptop GPU
fps
225%
NVIDIA GeForce RTX 3070:
140 [X] MSI GeForce RTX 3070 Ventus 3X Intel Core i9-9900K 3.6GHz
NVIDIA GeForce RTX 3070
min:
81 fps
fps
100%
GeForce RTX 3050 Ti Laptop GPU:
33.4 [X] XMG Prototyp AMD Ryzen 5 5600H 3.3GHz
GeForce RTX 3050 Ti Laptop GPU
fps
232%
NVIDIA GeForce RTX 3070:
77.5 [X] MSI GeForce RTX 3070 Ventus 3X Intel Core i9-9900K 3.6GHz
NVIDIA GeForce RTX 3070
min:
51 fps
fps
100%
GeForce RTX 3050 Ti Laptop GPU:
59 75 90.9 [X] Dell G15 5515 AMD Ryzen 7 5800H 3.2GHz
GeForce RTX 3050 Ti Laptop GPU
min:
21 fps, P0.1:
49.9 fps, P1:
58 fps, max:
187 fps
~ 75 fps
172%
NVIDIA GeForce RTX 3070:
125 132 [X] AMD Ryzen 9 5900X 3.7GHz
NVIDIA GeForce RTX 3070
min:
22.4 fps, P0.1:
76 fps, P1:
92.3 fps, max:
221 fps
~ 129 fps
163%
NVIDIA GeForce RTX 3060 Ti:
122 fps
100%
GeForce RTX 3050 Ti Laptop GPU:
39 40.3 42.1 [X] XMG Prototyp AMD Ryzen 5 5600H 3.3GHz
GeForce RTX 3050 Ti Laptop GPU
min:
19.2 fps, P0.1:
28.5 fps, P1:
30.5 fps, max:
81.5 fps
45.6 [X] Dell G15 5515 AMD Ryzen 7 5800H 3.2GHz
GeForce RTX 3050 Ti Laptop GPU
min:
21.7 fps, P0.1:
32.2 fps, P1:
35.3 fps, max:
84.3 fps
~ 42 fps
257%
NVIDIA GeForce RTX 3070:
108 [X] AMD Ryzen 9 5900X 3.7GHz
NVIDIA GeForce RTX 3070
min:
20.3 fps, P0.1:
71.9 fps, P1:
82.9 fps, max:
187 fps
108 ~ 108 fps
240%
NVIDIA GeForce RTX 3060 Ti:
101 fps
100%
GeForce RTX 3050 Ti Laptop GPU:
32 34.8 35.6 [X] Dell G15 5515 AMD Ryzen 7 5800H 3.2GHz
GeForce RTX 3050 Ti Laptop GPU
min:
13.5 fps, P0.1:
17.1 fps, P1:
27 fps, max:
73.8 fps
36.2 [X] XMG Prototyp AMD Ryzen 5 5600H 3.3GHz
GeForce RTX 3050 Ti Laptop GPU
min:
18.9 fps, P0.1:
24.4 fps, P1:
25.7 fps, max:
70.6 fps
~ 35 fps
266%
NVIDIA GeForce RTX 3070:
92.4 [X] AMD Ryzen 9 5900X 3.7GHz
NVIDIA GeForce RTX 3070
min:
20.7 fps, P0.1:
64 fps, P1:
72.2 fps, max:
162 fps
93.1 ~ 93 fps
243%
NVIDIA GeForce RTX 3060 Ti:
85.2 fps
100%
GeForce RTX 3050 Ti Laptop GPU:
26 29.8 [X] Dell G15 5515 AMD Ryzen 7 5800H 3.2GHz
GeForce RTX 3050 Ti Laptop GPU
min:
13.1 fps, P0.1:
14.1 fps, P1:
21.4 fps, max:
73.5 fps
30.8 31 [X] XMG Prototyp AMD Ryzen 5 5600H 3.3GHz
GeForce RTX 3050 Ti Laptop GPU
min:
19.4 fps, P0.1:
21.3 fps, P1:
22.8 fps, max:
77 fps
~ 29 fps
279%
NVIDIA GeForce RTX 3070:
80.6 81 [X] AMD Ryzen 9 5900X 3.7GHz
NVIDIA GeForce RTX 3070
min:
8.01 fps, P0.1:
51.5 fps, P1:
63 fps, max:
143 fps
~ 81 fps
254%
NVIDIA GeForce RTX 3060 Ti:
73.6 fps
100%
GeForce RTX 3050 Ti Laptop GPU:
18.6 21.1 [X] XMG Prototyp AMD Ryzen 5 5600H 3.3GHz
GeForce RTX 3050 Ti Laptop GPU
min:
14.2 fps, P0.1:
14.7 fps, P1:
16 fps, max:
25.2 fps
~ 20 fps
270%
NVIDIA GeForce RTX 3070:
53.7 54.8 [X] AMD Ryzen 9 5900X 3.7GHz
NVIDIA GeForce RTX 3070
min:
21.3 fps, P0.1:
42 fps, P1:
46.5 fps, max:
138 fps
~ 54 fps
240%
NVIDIA GeForce RTX 3060 Ti:
48 fps
100%
GeForce RTX 3050 Ti Laptop GPU:
9.3 [X] XMG Prototyp AMD Ryzen 5 5600H 3.3GHz
GeForce RTX 3050 Ti Laptop GPU
min:
5.06 fps, P0.1:
5.51 fps, P1:
5.83 fps, max:
46.3 fps
fps
291%
NVIDIA GeForce RTX 3070:
26.6 27.9 [X] AMD Ryzen 9 5900X 3.7GHz
NVIDIA GeForce RTX 3070
min:
6.44 fps, P0.1:
21.5 fps, P1:
24.6 fps, max:
186 fps
~ 27 fps
259%
NVIDIA GeForce RTX 3060 Ti:
24.1 fps
100%
GeForce RTX 3050 Ti Laptop GPU:
89 fps
148%
NVIDIA GeForce RTX 3070:
115 [X] AMD Ryzen 9 5900X 3.7GHz
NVIDIA GeForce RTX 3070
min:
33 fps, max:
188 fps
148 ~ 132 fps
187%
NVIDIA GeForce RTX 3060 Ti:
166 fps
100%
GeForce RTX 3050 Ti Laptop GPU:
73 [X] XMG Prototyp AMD Ryzen 5 5600H 3.3GHz
GeForce RTX 3050 Ti Laptop GPU
min:
27 fps
73 ~ 73 fps
138%
NVIDIA GeForce RTX 3070:
92 [X] AMD Ryzen 9 5900X 3.7GHz
NVIDIA GeForce RTX 3070
min:
26 fps, max:
161 fps
109 ~ 101 fps
163%
NVIDIA GeForce RTX 3060 Ti:
119 fps
100%
GeForce RTX 3050 Ti Laptop GPU:
58 59 [X] XMG Prototyp AMD Ryzen 5 5600H 3.3GHz
GeForce RTX 3050 Ti Laptop GPU
min:
20 fps
~ 59 fps
153%
NVIDIA GeForce RTX 3070:
83 [X] AMD Ryzen 9 5900X 3.7GHz
NVIDIA GeForce RTX 3070
min:
28 fps, max:
134 fps
96 ~ 90 fps
186%
NVIDIA GeForce RTX 3060 Ti:
110 fps
100%
GeForce RTX 3050 Ti Laptop GPU:
54 [X] XMG Prototyp AMD Ryzen 5 5600H 3.3GHz
GeForce RTX 3050 Ti Laptop GPU
min:
11 fps
54 ~ 54 fps
157%
NVIDIA GeForce RTX 3070:
81 [X] AMD Ryzen 9 5900X 3.7GHz
NVIDIA GeForce RTX 3070
min:
29 fps, max:
147 fps
88 ~ 85 fps
187%
NVIDIA GeForce RTX 3060 Ti:
101 fps
100%
GeForce RTX 3050 Ti Laptop GPU:
43 [X] XMG Prototyp AMD Ryzen 5 5600H 3.3GHz
GeForce RTX 3050 Ti Laptop GPU
min:
9 fps
fps
167%
NVIDIA GeForce RTX 3070:
68 [X] AMD Ryzen 9 5900X 3.7GHz
NVIDIA GeForce RTX 3070
min:
28 fps, max:
125 fps
76 ~ 72 fps
195%
NVIDIA GeForce RTX 3060 Ti:
84 fps
100%
GeForce RTX 3050 Ti Laptop GPU:
20 [X] XMG Prototyp AMD Ryzen 5 5600H 3.3GHz
GeForce RTX 3050 Ti Laptop GPU
min:
9 fps
fps
260%
NVIDIA GeForce RTX 3070:
50 [X] AMD Ryzen 9 5900X 3.7GHz
NVIDIA GeForce RTX 3070
min:
18 fps, max:
102 fps
54 ~ 52 fps
285%
NVIDIA GeForce RTX 3060 Ti:
57 fps
NVIDIA GeForce RTX 3070:
109 [X] AMD Ryzen 9 5900X 3.7GHz
NVIDIA GeForce RTX 3070
min:
31.8 fps, P0.1:
65.7 fps, P1:
77.7 fps, max:
152 fps
fps
100%
GeForce RTX 3050 Ti Laptop GPU:
79.1 [X] SCHENKER XMG Focus 15 Intel Core i7-11800H 2.3GHz
GeForce RTX 3050 Ti Laptop GPU
min:
30.2 fps, P0.1:
45.7 fps, P1:
52.7 fps, max:
137 fps
79.5 [X] SCHENKER XMG Focus 17 Intel Core i7-11800H 2.3GHz
GeForce RTX 3050 Ti Laptop GPU
min:
44.4 fps, P0.1:
46.9 fps, P1:
50.5 fps, max:
142 fps
80.8 [X] XMG Prototyp AMD Ryzen 5 5600H 3.3GHz
GeForce RTX 3050 Ti Laptop GPU
min:
52.9 fps, P0.1:
55.2 fps, P1:
60.1 fps, max:
167 fps
~ 80 fps
136%
NVIDIA GeForce RTX 3070:
109 [X] AMD Ryzen 9 5900X 3.7GHz
NVIDIA GeForce RTX 3070
min:
37.8 fps, P0.1:
62.3 fps, P1:
76 fps, max:
145 fps
fps
100%
GeForce RTX 3050 Ti Laptop GPU:
76.2 [X] SCHENKER XMG Focus 15 Intel Core i7-11800H 2.3GHz
GeForce RTX 3050 Ti Laptop GPU
min:
45.3 fps, P0.1:
46.1 fps, P1:
48.3 fps, max:
137 fps
76.5 [X] SCHENKER XMG Focus 17 Intel Core i7-11800H 2.3GHz
GeForce RTX 3050 Ti Laptop GPU
min:
45 fps, P0.1:
46.9 fps, P1:
49.9 fps, max:
138 fps
77.9 [X] XMG Prototyp AMD Ryzen 5 5600H 3.3GHz
GeForce RTX 3050 Ti Laptop GPU
min:
48.6 fps, P0.1:
53.8 fps, P1:
58.3 fps, max:
151 fps
~ 77 fps
151%
NVIDIA GeForce RTX 3070:
116 [X] AMD Ryzen 9 5900X 3.7GHz
NVIDIA GeForce RTX 3070
min:
26.2 fps, P0.1:
67.4 fps, P1:
79.2 fps, max:
154 fps
fps
100%
GeForce RTX 3050 Ti Laptop GPU:
67.4 [X] SCHENKER XMG Focus 15 Intel Core i7-11800H 2.3GHz
GeForce RTX 3050 Ti Laptop GPU
min:
38.4 fps, P0.1:
39.5 fps, P1:
43.1 fps, max:
125 fps
67.4 [X] SCHENKER XMG Focus 17 Intel Core i7-11800H 2.3GHz
GeForce RTX 3050 Ti Laptop GPU
min:
39.5 fps, P0.1:
40.2 fps, P1:
42.2 fps, max:
131 fps
68.2 [X] XMG Prototyp AMD Ryzen 5 5600H 3.3GHz
GeForce RTX 3050 Ti Laptop GPU
min:
42.6 fps, P0.1:
45.9 fps, P1:
51.8 fps, max:
137 fps
~ 68 fps
163%
NVIDIA GeForce RTX 3070:
111 [X] AMD Ryzen 9 5900X 3.7GHz
NVIDIA GeForce RTX 3070
min:
54.6 fps, P0.1:
63.5 fps, P1:
78.1 fps, max:
140 fps
fps
100%
GeForce RTX 3050 Ti Laptop GPU:
45.6 [X] XMG Prototyp AMD Ryzen 5 5600H 3.3GHz
GeForce RTX 3050 Ti Laptop GPU
min:
33 fps, P0.1:
35.1 fps, P1:
36.8 fps, max:
70.3 fps
fps
211%
NVIDIA GeForce RTX 3070:
96 [X] AMD Ryzen 9 5900X 3.7GHz
NVIDIA GeForce RTX 3070
min:
36.7 fps, P0.1:
58.5 fps, P1:
63.5 fps, max:
135 fps
fps
100%
GeForce RTX 3050 Ti Laptop GPU:
22.7 [X] XMG Prototyp AMD Ryzen 5 5600H 3.3GHz
GeForce RTX 3050 Ti Laptop GPU
min:
18.3 fps, P0.1:
18.3 fps, P1:
18.9 fps, max:
29.2 fps
fps
228%
NVIDIA GeForce RTX 3070:
51.7 [X] AMD Ryzen 9 5900X 3.7GHz
NVIDIA GeForce RTX 3070
min:
26.1 fps, P0.1:
30.1 fps, P1:
37.7 fps, max:
98.6 fps
fps
NVIDIA GeForce RTX 3070:
141 [X] AMD Ryzen 9 5900X 3.7GHz
NVIDIA GeForce RTX 3070
min:
41.9 fps, P0.1:
82.4 fps, P1:
98.9 fps, max:
247 fps
205 [X] AMD Ryzen 9 5900X 3.7GHz
NVIDIA GeForce RTX 3070
min:
33.3 fps, P0.1:
101 fps, P1:
128 fps, max:
519 fps
239 ~ 195 fps
NVIDIA GeForce RTX 3060 Ti:
243 fps
100%
GeForce RTX 3050 Ti Laptop GPU:
83.5 [X] XMG Prototyp AMD Ryzen 5 5600H 3.3GHz
GeForce RTX 3050 Ti Laptop GPU
min:
37.1 fps, P0.1:
47.5 fps, P1:
53.1 fps, max:
245 fps
fps
186%
NVIDIA GeForce RTX 3070:
133 [X] AMD Ryzen 9 5900X 3.7GHz
NVIDIA GeForce RTX 3070
min:
34.3 fps, P0.1:
75.8 fps, P1:
87.9 fps, max:
266 fps
146 186 [X] AMD Ryzen 9 5900X 3.7GHz
NVIDIA GeForce RTX 3070
min:
57.2 fps, P0.1:
93.8 fps, P1:
110 fps, max:
463 fps
~ 155 fps
159%
NVIDIA GeForce RTX 3060 Ti:
133 fps
100%
GeForce RTX 3050 Ti Laptop GPU:
58.6 [X] XMG Prototyp AMD Ryzen 5 5600H 3.3GHz
GeForce RTX 3050 Ti Laptop GPU
min:
36.3 fps, P0.1:
43.6 fps, P1:
47.3 fps, max:
225 fps
fps
212%
NVIDIA GeForce RTX 3070:
117 [X] AMD Ryzen 9 5900X 3.7GHz
NVIDIA GeForce RTX 3070
min:
18.9 fps, P0.1:
21.5 fps, P1:
78.5 fps, max:
220 fps
124 132 [X] AMD Ryzen 9 5900X 3.7GHz
NVIDIA GeForce RTX 3070
min:
40.9 fps, P0.1:
61.9 fps, P1:
76.6 fps, max:
309 fps
~ 124 fps
210%
NVIDIA GeForce RTX 3060 Ti:
123 fps
100%
GeForce RTX 3050 Ti Laptop GPU:
43.7 [X] XMG Prototyp AMD Ryzen 5 5600H 3.3GHz
GeForce RTX 3050 Ti Laptop GPU
min:
29.1 fps, P0.1:
31.4 fps, P1:
34.7 fps, max:
181 fps
fps
259%
NVIDIA GeForce RTX 3070:
95.7 [X] AMD Ryzen 9 5900X 3.7GHz
NVIDIA GeForce RTX 3070
min:
21.6 fps, P0.1:
37.6 fps, P1:
58 fps, max:
166 fps
120 122 [X] AMD Ryzen 9 5900X 3.7GHz
NVIDIA GeForce RTX 3070
min:
45 fps, P0.1:
57.3 fps, P1:
67.9 fps, max:
301 fps
~ 113 fps
252%
NVIDIA GeForce RTX 3060 Ti:
110 fps
100%
GeForce RTX 3050 Ti Laptop GPU:
27.7 [X] XMG Prototyp AMD Ryzen 5 5600H 3.3GHz
GeForce RTX 3050 Ti Laptop GPU
min:
22.1 fps, P0.1:
22.3 fps, P1:
22.7 fps, max:
58.9 fps
fps
336%
NVIDIA GeForce RTX 3070:
83 [X] AMD Ryzen 9 5900X 3.7GHz
NVIDIA GeForce RTX 3070
min:
22.7 fps, P0.1:
30 fps, P1:
52.1 fps, max:
158 fps
89.5 107 [X] AMD Ryzen 9 5900X 3.7GHz
NVIDIA GeForce RTX 3070
min:
43.6 fps, P0.1:
54 fps, P1:
62.7 fps, max:
272 fps
~ 93 fps
296%
NVIDIA GeForce RTX 3060 Ti:
82.1 fps
100%
GeForce RTX 3050 Ti Laptop GPU:
11.5 [X] XMG Prototyp AMD Ryzen 5 5600H 3.3GHz
GeForce RTX 3050 Ti Laptop GPU
min:
9.34 fps, P0.1:
9.48 fps, P1:
9.83 fps, max:
17.8 fps
fps
487%
NVIDIA GeForce RTX 3070:
43.8 50.2 [X] AMD Ryzen 9 5900X 3.7GHz
NVIDIA GeForce RTX 3070
min:
16.1 fps, P0.1:
25.6 fps, P1:
36.1 fps, max:
146 fps
74 [X] AMD Ryzen 9 5900X 3.7GHz
NVIDIA GeForce RTX 3070
min:
32.6 fps, P0.1:
43.5 fps, P1:
50.6 fps, max:
270 fps
~ 56 fps
390%
NVIDIA GeForce RTX 3060 Ti:
44.9 fps
100%
GeForce RTX 3050 Ti Laptop GPU:
79 84 ~ 82 fps
157%
NVIDIA GeForce RTX 3070:
125 [X] AMD Ryzen 9 5900X 3.7GHz
NVIDIA GeForce RTX 3070
min:
7 fps, max:
174 fps
130 133 [X] AMD Ryzen 9 5900X 3.7GHz
NVIDIA GeForce RTX 3070
min:
23 fps, max:
182 fps
~ 129 fps
154%
NVIDIA GeForce RTX 3060 Ti:
126 fps
100%
GeForce RTX 3050 Ti Laptop GPU:
53 60 64 [X] XMG Prototyp AMD Ryzen 5 5600H 3.3GHz
GeForce RTX 3050 Ti Laptop GPU
min:
23 fps
~ 59 fps
171%
NVIDIA GeForce RTX 3070:
100 [X] AMD Ryzen 9 5900X 3.7GHz
NVIDIA GeForce RTX 3070
min:
21 fps, max:
154 fps
100 103 [X] AMD Ryzen 9 5900X 3.7GHz
NVIDIA GeForce RTX 3070
min:
40 fps, max:
171 fps
~ 101 fps
161%
NVIDIA GeForce RTX 3060 Ti:
95 fps
100%
GeForce RTX 3050 Ti Laptop GPU:
34 35 ~ 35 fps
246%
NVIDIA GeForce RTX 3070:
85 87 [X] AMD Ryzen 9 5900X 3.7GHz
NVIDIA GeForce RTX 3070
min:
9 fps, max:
147 fps
87 [X] AMD Ryzen 9 5900X 3.7GHz
NVIDIA GeForce RTX 3070
min:
42 fps, max:
153 fps
~ 86 fps
231%
NVIDIA GeForce RTX 3060 Ti:
81 fps
100%
GeForce RTX 3050 Ti Laptop GPU:
24 28 ~ 26 fps
300%
NVIDIA GeForce RTX 3070:
77 78 [X] AMD Ryzen 9 5900X 3.7GHz
NVIDIA GeForce RTX 3070
min:
15 fps, max:
139 fps
80 [X] AMD Ryzen 9 5900X 3.7GHz
NVIDIA GeForce RTX 3070
min:
40 fps, max:
147 fps
~ 78 fps
285%
NVIDIA GeForce RTX 3060 Ti:
74 fps
100%
GeForce RTX 3050 Ti Laptop GPU:
26 fps
254%
NVIDIA GeForce RTX 3070:
65 [X] AMD Ryzen 9 5900X 3.7GHz
NVIDIA GeForce RTX 3070
min:
37 fps, max:
124 fps
65 67 [X] AMD Ryzen 9 5900X 3.7GHz
NVIDIA GeForce RTX 3070
min:
39 fps, max:
124 fps
~ 66 fps
231%
NVIDIA GeForce RTX 3060 Ti:
60 fps
NVIDIA GeForce RTX 3070:
42 [X] AMD Ryzen 9 5900X 3.7GHz
NVIDIA GeForce RTX 3070
min:
30 fps, max:
108 fps
43 47 [X] AMD Ryzen 9 5900X 3.7GHz
NVIDIA GeForce RTX 3070
min:
31 fps, max:
92 fps
~ 44 fps
NVIDIA GeForce RTX 3060 Ti:
40 fps
100%
GeForce RTX 3050 Ti Laptop GPU:
59.8 111.8 121 162 [X] Dell G15 5515 AMD Ryzen 7 5800H 3.2GHz
GeForce RTX 3050 Ti Laptop GPU
min:
96 fps, P0.1:
113.4 fps, P1:
135.4 fps, max:
201.4 fps
~ 114 fps
175%
NVIDIA GeForce RTX 3070:
169 [X] AMD Ryzen 9 5900X 3.7GHz
NVIDIA GeForce RTX 3070
min:
95 fps, P0.1:
127.4 fps, P1:
147.3 fps, max:
220.8 fps
179 [X] AMD Ryzen 9 5900X 3.7GHz
NVIDIA GeForce RTX 3070
min:
56.2 fps, P0.1:
126.2 fps, P1:
156.8 fps, max:
212.5 fps
248.1 ~ 199 fps
256%
NVIDIA GeForce RTX 3060 Ti:
291.3 [X] Nvidia GeForce RTX 3060 Ti FE AMD Ryzen 9 5900X 3.7GHz
NVIDIA GeForce RTX 3060 Ti
fps
100%
GeForce RTX 3050 Ti Laptop GPU:
58.9 62.6 77.4 83.3 [X] XMG Prototyp AMD Ryzen 5 5600H 3.3GHz
GeForce RTX 3050 Ti Laptop GPU
min:
55 fps
84.3 [X] Dell G15 5515 AMD Ryzen 7 5800H 3.2GHz
GeForce RTX 3050 Ti Laptop GPU
min:
54.5 fps, P0.1:
58.8 fps, P1:
70.4 fps, max:
125.1 fps
~ 73 fps
197%
NVIDIA GeForce RTX 3070:
119 [X] AMD Ryzen 9 5900X 3.7GHz
NVIDIA GeForce RTX 3070
min:
66.6 fps, P0.1:
94.2 fps, P1:
104 fps, max:
176.1 fps
122 [X] AMD Ryzen 9 5900X 3.7GHz
NVIDIA GeForce RTX 3070
min:
50.3 fps, P0.1:
95.3 fps, P1:
105.8 fps, max:
148.4 fps
191.8 ~ 144 fps
227%
NVIDIA GeForce RTX 3060 Ti:
165.9 [X] Nvidia GeForce RTX 3060 Ti FE AMD Ryzen 9 5900X 3.7GHz
NVIDIA GeForce RTX 3060 Ti
fps
100%
GeForce RTX 3050 Ti Laptop GPU:
51.2 52.7 67.3 [X] XMG Prototyp AMD Ryzen 5 5600H 3.3GHz
GeForce RTX 3050 Ti Laptop GPU
min:
51 fps
67.3 69.1 [X] Dell G15 5515 AMD Ryzen 7 5800H 3.2GHz
GeForce RTX 3050 Ti Laptop GPU
min:
51.7 fps, P0.1:
55.1 fps, P1:
57.5 fps, max:
102.3 fps
~ 62 fps
197%
NVIDIA GeForce RTX 3070:
102 [X] AMD Ryzen 9 5900X 3.7GHz
NVIDIA GeForce RTX 3070
min:
59.6 fps, P0.1:
75.5 fps, P1:
88 fps, max:
167.6 fps
106 [X] AMD Ryzen 9 5900X 3.7GHz
NVIDIA GeForce RTX 3070
min:
42 fps, P0.1:
83.8 fps, P1:
91.5 fps, max:
127.8 fps
157 ~ 122 fps
215%
NVIDIA GeForce RTX 3060 Ti:
133.4 [X] Nvidia GeForce RTX 3060 Ti FE AMD Ryzen 9 5900X 3.7GHz
NVIDIA GeForce RTX 3060 Ti
fps
100%
GeForce RTX 3050 Ti Laptop GPU:
40.5 44.9 53.3 53.6 [X] Dell G15 5515 AMD Ryzen 7 5800H 3.2GHz
GeForce RTX 3050 Ti Laptop GPU
min:
39.8 fps, P0.1:
42.7 fps, P1:
45.1 fps, max:
88.8 fps
54.3 [X] XMG Prototyp AMD Ryzen 5 5600H 3.3GHz
GeForce RTX 3050 Ti Laptop GPU
min:
42 fps
~ 49 fps
202%
NVIDIA GeForce RTX 3070:
86 [X] AMD Ryzen 9 5900X 3.7GHz
NVIDIA GeForce RTX 3070
min:
56.3 fps, P0.1:
71.4 fps, P1:
74.7 fps, max:
152.9 fps
89.3 [X] AMD Ryzen 9 5900X 3.7GHz
NVIDIA GeForce RTX 3070
min:
64.9 fps, P0.1:
71.6 fps, P1:
77 fps, max:
109.6 fps
122.1 ~ 99 fps
214%
NVIDIA GeForce RTX 3060 Ti:
105.1 [X] Nvidia GeForce RTX 3060 Ti FE AMD Ryzen 9 5900X 3.7GHz
NVIDIA GeForce RTX 3060 Ti
fps
100%
GeForce RTX 3050 Ti Laptop GPU:
33.8 41.9 [X] XMG Prototyp AMD Ryzen 5 5600H 3.3GHz
GeForce RTX 3050 Ti Laptop GPU
min:
32 fps
~ 38 fps
218%
NVIDIA GeForce RTX 3070:
74 [X] AMD Ryzen 9 5900X 3.7GHz
NVIDIA GeForce RTX 3070
min:
43.9 fps, P0.1:
60.2 fps, P1:
64.6 fps, max:
134 fps
75.9 [X] AMD Ryzen 9 5900X 3.7GHz
NVIDIA GeForce RTX 3070
min:
43.9 fps, P0.1:
62.6 fps, P1:
66.2 fps, max:
91.9 fps
99 ~ 83 fps
222%
NVIDIA GeForce RTX 3060 Ti:
84.2 [X] Nvidia GeForce RTX 3060 Ti FE AMD Ryzen 9 5900X 3.7GHz
NVIDIA GeForce RTX 3060 Ti
fps
100%
GeForce RTX 3050 Ti Laptop GPU:
20 [X] XMG Prototyp AMD Ryzen 5 5600H 3.3GHz
GeForce RTX 3050 Ti Laptop GPU
min:
12 fps
fps
290%
NVIDIA GeForce RTX 3070:
52.9 [X] AMD Ryzen 9 5900X 3.7GHz
NVIDIA GeForce RTX 3070
min:
40.2 fps, P0.1:
41.7 fps, P1:
46.4 fps, max:
72.2 fps
54.7 [X] AMD Ryzen 9 5900X 3.7GHz
NVIDIA GeForce RTX 3070
min:
40.4 fps, P0.1:
46.3 fps, P1:
48.8 fps, max:
64.6 fps
65.3 ~ 58 fps
269%
NVIDIA GeForce RTX 3060 Ti:
53.7 [X] Nvidia GeForce RTX 3060 Ti FE AMD Ryzen 9 5900X 3.7GHz
NVIDIA GeForce RTX 3060 Ti
fps
100%
GeForce RTX 3050 Ti Laptop GPU:
44 77 ~ 61 fps
195%
NVIDIA GeForce RTX 3070:
100 [X] AMD Ryzen 9 5900X 3.7GHz
NVIDIA GeForce RTX 3070
min:
30.45 fps, P1:
71.11 fps, max:
167.43 fps
122 [X] AMD Ryzen 9 5900X 3.7GHz
NVIDIA GeForce RTX 3070
min:
43.27 fps, P1:
85.83 fps, max:
203.5 fps
125 129 ~ 119 fps
203%
NVIDIA GeForce RTX 3060 Ti:
124 fps
100%
GeForce RTX 3050 Ti Laptop GPU:
46 59 79 [X] XMG Prototyp AMD Ryzen 5 5600H 3.3GHz
GeForce RTX 3050 Ti Laptop GPU
min:
50 fps
~ 61 fps
192%
NVIDIA GeForce RTX 3070:
100 [X] AMD Ryzen 9 5900X 3.7GHz
NVIDIA GeForce RTX 3070
min:
46.29 fps, P1:
73.18 fps, max:
164.42 fps
118 [X] AMD Ryzen 9 5900X 3.7GHz
NVIDIA GeForce RTX 3070
min:
41.63 fps, P1:
81.53 fps, max:
198.14 fps
123 127 ~ 117 fps
200%
NVIDIA GeForce RTX 3060 Ti:
122 fps
100%
GeForce RTX 3050 Ti Laptop GPU:
42 55 70 [X] XMG Prototyp AMD Ryzen 5 5600H 3.3GHz
GeForce RTX 3050 Ti Laptop GPU
min:
41 fps
~ 56 fps
189%
NVIDIA GeForce RTX 3070:
88.9 [X] AMD Ryzen 9 5900X 3.7GHz
NVIDIA GeForce RTX 3070
min:
39.08 fps, P1:
62.58 fps, max:
145.79 fps
109 112 [X] AMD Ryzen 9 5900X 3.7GHz
NVIDIA GeForce RTX 3070
min:
18.04 fps, P1:
78.99 fps, max:
177.29 fps
113 ~ 106 fps
195%
NVIDIA GeForce RTX 3060 Ti:
109 fps
100%
GeForce RTX 3050 Ti Laptop GPU:
28 28 29 [X] XMG Prototyp AMD Ryzen 5 5600H 3.3GHz
GeForce RTX 3050 Ti Laptop GPU
min:
19 fps
~ 28 fps
304%
NVIDIA GeForce RTX 3070:
79 [X] AMD Ryzen 9 5900X 3.7GHz
NVIDIA GeForce RTX 3070
min:
42.91 fps, P1:
56.59 fps, max:
121.27 fps
84.9 86 [X] AMD Ryzen 9 5900X 3.7GHz
NVIDIA GeForce RTX 3070
min:
37.65 fps, P1:
66.32 fps, max:
130.48 fps
89 ~ 85 fps
274%
NVIDIA GeForce RTX 3060 Ti:
76.6 fps
100%
GeForce RTX 3050 Ti Laptop GPU:
19 21 [X] XMG Prototyp AMD Ryzen 5 5600H 3.3GHz
GeForce RTX 3050 Ti Laptop GPU
min:
16 fps
~ 20 fps
330%
NVIDIA GeForce RTX 3070:
65.3 65.7 [X] AMD Ryzen 9 5900X 3.7GHz
NVIDIA GeForce RTX 3070
min:
25.01 fps, P1:
51.86 fps, max:
96.9 fps
66.3 [X] AMD Ryzen 9 5900X 3.7GHz
NVIDIA GeForce RTX 3070
min:
41 fps, P1:
50.81 fps, max:
116.42 fps
67 ~ 66 fps
296%
NVIDIA GeForce RTX 3060 Ti:
59.1 fps
100%
GeForce RTX 3050 Ti Laptop GPU:
10 [X] XMG Prototyp AMD Ryzen 5 5600H 3.3GHz
GeForce RTX 3050 Ti Laptop GPU
min:
8 fps
fps
380%
NVIDIA GeForce RTX 3070:
37 [X] AMD Ryzen 9 5900X 3.7GHz
NVIDIA GeForce RTX 3070
min:
17.44 fps, P1:
25.32 fps, max:
81.3 fps
37 38.9 39.2 [X] AMD Ryzen 9 5900X 3.7GHz
NVIDIA GeForce RTX 3070
min:
17.54 fps, P1:
27.54 fps, max:
81.17 fps
~ 38 fps
330%
NVIDIA GeForce RTX 3060 Ti:
33 fps
NVIDIA GeForce RTX 3070:
150 [X] AMD Ryzen 9 5900X 3.7GHz
NVIDIA GeForce RTX 3070
min:
33.6 fps, P0.1:
58.5 fps, P1:
75 fps, max:
273 fps
203 [X] AMD Ryzen 9 5900X 3.7GHz
NVIDIA GeForce RTX 3070
min:
10.3 fps, P0.1:
68.1 fps, P1:
118 fps, max:
342 fps
~ 177 fps
100%
GeForce RTX 3050 Ti Laptop GPU:
190 [X] XMG Prototyp AMD Ryzen 5 5600H 3.3GHz
GeForce RTX 3050 Ti Laptop GPU
min:
8.53 fps, P0.1:
107 fps, P1:
129 fps, max:
288 fps
231 [X] SCHENKER XMG Focus 17 Intel Core i7-11800H 2.3GHz
GeForce RTX 3050 Ti Laptop GPU
min:
22.4 fps, P0.1:
128 fps, P1:
154 fps, max:
327 fps
237 [X] SCHENKER XMG Focus 15 Intel Core i7-11800H 2.3GHz
GeForce RTX 3050 Ti Laptop GPU
min:
8.25 fps, P0.1:
133 fps, P1:
159 fps, max:
408 fps
~ 219 fps
79%
NVIDIA GeForce RTX 3070:
152 [X] AMD Ryzen 9 5900X 3.7GHz
NVIDIA GeForce RTX 3070
min:
38.1 fps, P0.1:
57 fps, P1:
74.4 fps, max:
278 fps
195 [X] AMD Ryzen 9 5900X 3.7GHz
NVIDIA GeForce RTX 3070
min:
10 fps, P0.1:
77.3 fps, P1:
114 fps, max:
335 fps
~ 174 fps
100%
GeForce RTX 3050 Ti Laptop GPU:
183 [X] XMG Prototyp AMD Ryzen 5 5600H 3.3GHz
GeForce RTX 3050 Ti Laptop GPU
min:
70.1 fps, P0.1:
92.1 fps, P1:
126 fps, max:
263 fps
203 [X] SCHENKER XMG Focus 17 Intel Core i7-11800H 2.3GHz
GeForce RTX 3050 Ti Laptop GPU
min:
14.2 fps, P0.1:
122 fps, P1:
133 fps, max:
342 fps
205 [X] SCHENKER XMG Focus 15 Intel Core i7-11800H 2.3GHz
GeForce RTX 3050 Ti Laptop GPU
min:
78.5 fps, P0.1:
120 fps, P1:
133 fps, max:
349 fps
~ 197 fps
90%
NVIDIA GeForce RTX 3070:
156 [X] AMD Ryzen 9 5900X 3.7GHz
NVIDIA GeForce RTX 3070
min:
54.6 fps, P0.1:
61.5 fps, P1:
85.9 fps, max:
277 fps
200 [X] AMD Ryzen 9 5900X 3.7GHz
NVIDIA GeForce RTX 3070
min:
49.4 fps, P0.1:
78.7 fps, P1:
118 fps, max:
356 fps
~ 178 fps
100%
GeForce RTX 3050 Ti Laptop GPU:
175 [X] XMG Prototyp AMD Ryzen 5 5600H 3.3GHz
GeForce RTX 3050 Ti Laptop GPU
min:
34.4 fps, P0.1:
109 fps, P1:
121 fps, max:
261 fps
192 [X] SCHENKER XMG Focus 15 Intel Core i7-11800H 2.3GHz
GeForce RTX 3050 Ti Laptop GPU
min:
63.5 fps, P0.1:
104 fps, P1:
121 fps, max:
331 fps
194 [X] SCHENKER XMG Focus 17 Intel Core i7-11800H 2.3GHz
GeForce RTX 3050 Ti Laptop GPU
min:
37.6 fps, P0.1:
105 fps, P1:
124 fps, max:
343 fps
~ 187 fps
92%
NVIDIA GeForce RTX 3070:
152 [X] AMD Ryzen 9 5900X 3.7GHz
NVIDIA GeForce RTX 3070
min:
48.4 fps, P0.1:
61.3 fps, P1:
84.1 fps, max:
267 fps
191 [X] AMD Ryzen 9 5900X 3.7GHz
NVIDIA GeForce RTX 3070
min:
28 fps, P0.1:
75.8 fps, P1:
111 fps, max:
303 fps
~ 172 fps
129%
NVIDIA GeForce RTX 3060 Ti:
242 fps
100%
GeForce RTX 3050 Ti Laptop GPU:
139 [X] XMG Prototyp AMD Ryzen 5 5600H 3.3GHz
GeForce RTX 3050 Ti Laptop GPU
min:
61.1 fps, P0.1:
77.9 fps, P1:
83.8 fps, max:
259 fps
fps
126%
NVIDIA GeForce RTX 3070:
156 [X] AMD Ryzen 9 5900X 3.7GHz
NVIDIA GeForce RTX 3070
min:
29.7 fps, P0.1:
63 fps, P1:
82.3 fps, max:
263 fps
193 [X] AMD Ryzen 9 5900X 3.7GHz
NVIDIA GeForce RTX 3070
min:
24.3 fps, P0.1:
78.6 fps, P1:
120 fps, max:
317 fps
~ 175 fps
178%
NVIDIA GeForce RTX 3060 Ti:
247 fps
100%
GeForce RTX 3050 Ti Laptop GPU:
87.1 [X] XMG Prototyp AMD Ryzen 5 5600H 3.3GHz
GeForce RTX 3050 Ti Laptop GPU
min:
37.5 fps, P0.1:
43.8 fps, P1:
48.1 fps, max:
256 fps
fps
203%
NVIDIA GeForce RTX 3070:
160 [X] AMD Ryzen 9 5900X 3.7GHz
NVIDIA GeForce RTX 3070
min:
61.4 fps, P0.1:
69.9 fps, P1:
95.6 fps, max:
262 fps
194 [X] AMD Ryzen 9 5900X 3.7GHz
NVIDIA GeForce RTX 3070
min:
33.4 fps, P0.1:
78.4 fps, P1:
121 fps, max:
327 fps
~ 177 fps
264%
NVIDIA GeForce RTX 3060 Ti:
230 fps
NVIDIA GeForce RTX 3070:
382 [X] AMD Ryzen 9 5900X 3.7GHz
NVIDIA GeForce RTX 3070
min:
93.4 fps, P0.1:
152 fps, P1:
208 fps, max:
712 fps
437 [X] AMD Ryzen 9 5900X 3.7GHz
NVIDIA GeForce RTX 3070
min:
30.2 fps, P0.1:
191 fps, P1:
249 fps, max:
717 fps
~ 410 fps
100%
GeForce RTX 3050 Ti Laptop GPU:
161 [X] XMG Prototyp AMD Ryzen 5 5600H 3.3GHz
GeForce RTX 3050 Ti Laptop GPU
min:
47.2 fps, P0.1:
115 fps, P1:
128 fps, max:
378 fps
168 [X] SCHENKER XMG Focus 17 Intel Core i7-11800H 2.3GHz
GeForce RTX 3050 Ti Laptop GPU
min:
40 fps, P0.1:
88.4 fps, P1:
108 fps, max:
391 fps
172 [X] SCHENKER XMG Focus 15 Intel Core i7-11800H 2.3GHz
GeForce RTX 3050 Ti Laptop GPU
min:
81.8 fps, P0.1:
115 fps, P1:
132 fps, max:
293 fps
~ 167 fps
198%
NVIDIA GeForce RTX 3070:
316 [X] AMD Ryzen 9 5900X 3.7GHz
NVIDIA GeForce RTX 3070
min:
63.9 fps, P0.1:
144 fps, P1:
198 fps, max:
517 fps
344 [X] AMD Ryzen 9 5900X 3.7GHz
NVIDIA GeForce RTX 3070
min:
48.3 fps, P0.1:
189 fps, P1:
228 fps, max:
601 fps
~ 330 fps
100%
GeForce RTX 3050 Ti Laptop GPU:
143 [X] XMG Prototyp AMD Ryzen 5 5600H 3.3GHz
GeForce RTX 3050 Ti Laptop GPU
min:
61.9 fps, P0.1:
103 fps, P1:
115 fps, max:
384 fps
151 [X] SCHENKER XMG Focus 15 Intel Core i7-11800H 2.3GHz
GeForce RTX 3050 Ti Laptop GPU
min:
102 fps, P0.1:
109 fps, P1:
121 fps, max:
304 fps
153 [X] SCHENKER XMG Focus 17 Intel Core i7-11800H 2.3GHz
GeForce RTX 3050 Ti Laptop GPU
min:
37.7 fps, P0.1:
106 fps, P1:
123 fps, max:
344 fps
~ 149 fps
210%
NVIDIA GeForce RTX 3070:
292 [X] AMD Ryzen 9 5900X 3.7GHz
NVIDIA GeForce RTX 3070
min:
53.7 fps, P0.1:
134 fps, P1:
226 fps, max:
457 fps
333 [X] AMD Ryzen 9 5900X 3.7GHz
NVIDIA GeForce RTX 3070
min:
58.1 fps, P0.1:
218 fps, P1:
250 fps, max:
523 fps
~ 313 fps
100%
GeForce RTX 3050 Ti Laptop GPU:
136 [X] XMG Prototyp AMD Ryzen 5 5600H 3.3GHz
GeForce RTX 3050 Ti Laptop GPU
min:
61.5 fps, P0.1:
102 fps, P1:
109 fps, max:
322 fps
138 [X] SCHENKER XMG Focus 15 Intel Core i7-11800H 2.3GHz
GeForce RTX 3050 Ti Laptop GPU
min:
85.6 fps, P0.1:
96 fps, P1:
112 fps, max:
261 fps
141 [X] SCHENKER XMG Focus 17 Intel Core i7-11800H 2.3GHz
GeForce RTX 3050 Ti Laptop GPU
min:
39.2 fps, P0.1:
84.3 fps, P1:
111 fps, max:
312 fps
~ 138 fps
210%
NVIDIA GeForce RTX 3070:
268 [X] AMD Ryzen 9 5900X 3.7GHz
NVIDIA GeForce RTX 3070
min:
78.4 fps, P0.1:
124 fps, P1:
209 fps, max:
411 fps
312 [X] AMD Ryzen 9 5900X 3.7GHz
NVIDIA GeForce RTX 3070
min:
77 fps, P0.1:
197 fps, P1:
237 fps, max:
472 fps
~ 290 fps
100%
GeForce RTX 3050 Ti Laptop GPU:
96.9 [X] XMG Prototyp AMD Ryzen 5 5600H 3.3GHz
GeForce RTX 3050 Ti Laptop GPU
min:
29.6 fps, P0.1:
38.7 fps, P1:
76.9 fps, max:
281 fps
fps
225%
NVIDIA GeForce RTX 3070:
207 [X] AMD Ryzen 9 5900X 3.7GHz
NVIDIA GeForce RTX 3070
min:
77.6 fps, P0.1:
110 fps, P1:
163 fps, max:
308 fps
228 [X] AMD Ryzen 9 5900X 3.7GHz
NVIDIA GeForce RTX 3070
min:
84.3 fps, P0.1:
148 fps, P1:
172 fps, max:
337 fps
~ 218 fps
100%
GeForce RTX 3050 Ti Laptop GPU:
57.1 [X] XMG Prototyp AMD Ryzen 5 5600H 3.3GHz
GeForce RTX 3050 Ti Laptop GPU
min:
29.5 fps, P0.1:
32.4 fps, P1:
44.6 fps, max:
390 fps
fps
231%
NVIDIA GeForce RTX 3070:
128 [X] AMD Ryzen 9 5900X 3.7GHz
NVIDIA GeForce RTX 3070
min:
61.7 fps, P0.1:
83 fps, P1:
103 fps, max:
201 fps
136 [X] AMD Ryzen 9 5900X 3.7GHz
NVIDIA GeForce RTX 3070
min:
35.7 fps, P0.1:
82.7 fps, P1:
99.1 fps, max:
267 fps
~ 132 fps
NVIDIA GeForce RTX 3070:
152 [X] AMD Ryzen 9 5900X 3.7GHz
NVIDIA GeForce RTX 3070
min:
35.1 fps, P0.1:
65.1 fps, P1:
94.9 fps, max:
264 fps
184 [X] AMD Ryzen 9 5900X 3.7GHz
NVIDIA GeForce RTX 3070
min:
33.3 fps, P0.1:
73.9 fps, P1:
113 fps, max:
342 fps
~ 168 fps
NVIDIA GeForce RTX 3060 Ti:
159 fps
100%
GeForce RTX 3050 Ti Laptop GPU:
73.8 [X] XMG Prototyp AMD Ryzen 5 5600H 3.3GHz
GeForce RTX 3050 Ti Laptop GPU
min:
42.1 fps, P0.1:
45 fps, P1:
50.1 fps, max:
152 fps
74.1 [X] SCHENKER XMG Focus 15 Intel Core i7-11800H 2.3GHz
GeForce RTX 3050 Ti Laptop GPU
min:
46.5 fps, P0.1:
48 fps, P1:
57.7 fps, max:
163 fps
74.3 [X] SCHENKER XMG Focus 17 Intel Core i7-11800H 2.3GHz
GeForce RTX 3050 Ti Laptop GPU
min:
45.5 fps, P0.1:
45.8 fps, P1:
53.4 fps, max:
156 fps
~ 74 fps
181%
NVIDIA GeForce RTX 3070:
128 [X] AMD Ryzen 9 5900X 3.7GHz
NVIDIA GeForce RTX 3070
min:
56.4 fps, P0.1:
67.3 fps, P1:
87.9 fps, max:
269 fps
140 [X] AMD Ryzen 9 5900X 3.7GHz
NVIDIA GeForce RTX 3070
min:
54.9 fps, P0.1:
70 fps, P1:
93.4 fps, max:
241 fps
~ 134 fps
176%
NVIDIA GeForce RTX 3060 Ti:
130 fps
100%
GeForce RTX 3050 Ti Laptop GPU:
68.3 [X] SCHENKER XMG Focus 15 Intel Core i7-11800H 2.3GHz
GeForce RTX 3050 Ti Laptop GPU
min:
40.4 fps, P0.1:
43.4 fps, P1:
55.8 fps, max:
122 fps
68.5 [X] XMG Prototyp AMD Ryzen 5 5600H 3.3GHz
GeForce RTX 3050 Ti Laptop GPU
min:
34.3 fps, P0.1:
40 fps, P1:
46.4 fps, max:
161 fps
68.7 [X] SCHENKER XMG Focus 17 Intel Core i7-11800H 2.3GHz
GeForce RTX 3050 Ti Laptop GPU
min:
40.9 fps, P0.1:
45.7 fps, P1:
53.3 fps, max:
135 fps
~ 69 fps
186%
NVIDIA GeForce RTX 3070:
124 [X] AMD Ryzen 9 5900X 3.7GHz
NVIDIA GeForce RTX 3070
min:
57.4 fps, P0.1:
62.8 fps, P1:
82 fps, max:
251 fps
132 [X] AMD Ryzen 9 5900X 3.7GHz
NVIDIA GeForce RTX 3070
min:
57.5 fps, P0.1:
71.1 fps, P1:
88.3 fps, max:
259 fps
~ 128 fps
180%
NVIDIA GeForce RTX 3060 Ti:
124 fps
100%
GeForce RTX 3050 Ti Laptop GPU:
46.6 [X] XMG Prototyp AMD Ryzen 5 5600H 3.3GHz
GeForce RTX 3050 Ti Laptop GPU
min:
33.5 fps, P0.1:
33.9 fps, P1:
37.5 fps, max:
83.2 fps
fps
210%
NVIDIA GeForce RTX 3070:
98.1 [X] AMD Ryzen 9 5900X 3.7GHz
NVIDIA GeForce RTX 3070
min:
34.5 fps, P0.1:
57.7 fps, P1:
68.6 fps, max:
174 fps
98.7 [X] AMD Ryzen 9 5900X 3.7GHz
NVIDIA GeForce RTX 3070
min:
45.2 fps, P0.1:
55.9 fps, P1:
69.4 fps, max:
191 fps
~ 98 fps
193%
NVIDIA GeForce RTX 3060 Ti:
90.1 fps
100%
GeForce RTX 3050 Ti Laptop GPU:
24 [X] XMG Prototyp AMD Ryzen 5 5600H 3.3GHz
GeForce RTX 3050 Ti Laptop GPU
min:
19.8 fps, P0.1:
19.9 fps, P1:
20.8 fps, max:
34.3 fps
fps
233%
NVIDIA GeForce RTX 3070:
55.2 [X] AMD Ryzen 9 5900X 3.7GHz
NVIDIA GeForce RTX 3070
min:
19.3 fps, P0.1:
34.2 fps, P1:
45.2 fps, max:
133 fps
56.6 [X] AMD Ryzen 9 5900X 3.7GHz
NVIDIA GeForce RTX 3070
min:
34.7 fps, P0.1:
37.9 fps, P1:
44.2 fps, max:
177 fps
~ 56 fps
207%
NVIDIA GeForce RTX 3060 Ti:
49.7 fps
NVIDIA GeForce RTX 3070:
148.8 [X] AMD Ryzen 9 5900X 3.7GHz
NVIDIA GeForce RTX 3070
161.2 [X] AMD Ryzen 9 5900X 3.7GHz
NVIDIA GeForce RTX 3070
~ 155 fps
100%
GeForce RTX 3050 Ti Laptop GPU:
77.9 79.1 [X] XMG Prototyp AMD Ryzen 5 5600H 3.3GHz
GeForce RTX 3050 Ti Laptop GPU
83.2 ~ 80 fps
158%
NVIDIA GeForce RTX 3070:
122 [X] AMD Ryzen 9 5900X 3.7GHz
NVIDIA GeForce RTX 3070
130.6 [X] AMD Ryzen 9 5900X 3.7GHz
NVIDIA GeForce RTX 3070
~ 126 fps
100%
GeForce RTX 3050 Ti Laptop GPU:
66.5 [X] XMG Prototyp AMD Ryzen 5 5600H 3.3GHz
GeForce RTX 3050 Ti Laptop GPU
66.7 67.9 ~ 67 fps
181%
NVIDIA GeForce RTX 3070:
120.9 [X] AMD Ryzen 9 5900X 3.7GHz
NVIDIA GeForce RTX 3070
121.3 [X] AMD Ryzen 9 5900X 3.7GHz
NVIDIA GeForce RTX 3070
~ 121 fps
100%
GeForce RTX 3050 Ti Laptop GPU:
48.7 [X] XMG Prototyp AMD Ryzen 5 5600H 3.3GHz
GeForce RTX 3050 Ti Laptop GPU
50 53.1 ~ 51 fps
200%
NVIDIA GeForce RTX 3070:
99 [X] AMD Ryzen 9 5900X 3.7GHz
NVIDIA GeForce RTX 3070
104.2 [X] AMD Ryzen 9 5900X 3.7GHz
NVIDIA GeForce RTX 3070
~ 102 fps
100%
GeForce RTX 3050 Ti Laptop GPU:
36.8 [X] XMG Prototyp AMD Ryzen 5 5600H 3.3GHz
GeForce RTX 3050 Ti Laptop GPU
fps
250%
NVIDIA GeForce RTX 3070:
91.3 [X] AMD Ryzen 9 5900X 3.7GHz
NVIDIA GeForce RTX 3070
92 [X] AMD Ryzen 9 5900X 3.7GHz
NVIDIA GeForce RTX 3070
~ 92 fps
NVIDIA GeForce RTX 3070:
66.6 [X] AMD Ryzen 9 5900X 3.7GHz
NVIDIA GeForce RTX 3070
67.6 [X] AMD Ryzen 9 5900X 3.7GHz
NVIDIA GeForce RTX 3070
~ 67 fps
NVIDIA GeForce RTX 3070:
221 [X] AMD Ryzen 9 5900X 3.7GHz
NVIDIA GeForce RTX 3070
min:
53.1 fps, P0.1:
83.2 fps, P1:
138 fps, max:
430 fps
fps
NVIDIA GeForce RTX 3060 Ti:
342 [X] Nvidia GeForce RTX 3060 Ti FE AMD Ryzen 9 5900X 3.7GHz
NVIDIA GeForce RTX 3060 Ti
min:
62.6 fps, P0.1:
107.9 fps, P1:
206 fps, max:
593 fps
fps
100%
GeForce RTX 3050 Ti Laptop GPU:
89 [X] SCHENKER XMG Focus 17 Intel Core i7-11800H 2.3GHz
GeForce RTX 3050 Ti Laptop GPU
min:
19.7 fps, P0.1:
20.5 fps, P1:
22.4 fps, max:
392 fps
90.4 [X] SCHENKER XMG Focus 15 Intel Core i7-11800H 2.3GHz
GeForce RTX 3050 Ti Laptop GPU
min:
19.4 fps, P0.1:
21.4 fps, P1:
22.8 fps, max:
366 fps
95.8 [X] XMG Prototyp AMD Ryzen 5 5600H 3.3GHz
GeForce RTX 3050 Ti Laptop GPU
min:
36.7 fps, P0.1:
39.6 fps, P1:
47.4 fps, max:
358 fps
~ 92 fps
198%
NVIDIA GeForce RTX 3070:
182 [X] AMD Ryzen 9 5900X 3.7GHz
NVIDIA GeForce RTX 3070
min:
49 fps, P0.1:
59 fps, P1:
113 fps, max:
416 fps
fps
274%
NVIDIA GeForce RTX 3060 Ti:
252 [X] Nvidia GeForce RTX 3060 Ti FE AMD Ryzen 9 5900X 3.7GHz
NVIDIA GeForce RTX 3060 Ti
min:
59 fps, P0.1:
151.9 fps, P1:
197.6 fps, max:
382 fps
fps
100%
GeForce RTX 3050 Ti Laptop GPU:
46.5 [X] SCHENKER XMG Focus 17 Intel Core i7-11800H 2.3GHz
GeForce RTX 3050 Ti Laptop GPU
min:
16.3 fps, P0.1:
21.7 fps, P1:
39 fps, max:
161 fps
46.6 [X] SCHENKER XMG Focus 15 Intel Core i7-11800H 2.3GHz
GeForce RTX 3050 Ti Laptop GPU
min:
25.4 fps, P0.1:
28.3 fps, P1:
37.2 fps, max:
116 fps
50.8 [X] XMG Prototyp AMD Ryzen 5 5600H 3.3GHz
GeForce RTX 3050 Ti Laptop GPU
min:
27.2 fps, P0.1:
32.4 fps, P1:
37.3 fps, max:
123 fps
~ 48 fps
204%
NVIDIA GeForce RTX 3070:
97.7 [X] AMD Ryzen 9 5900X 3.7GHz
NVIDIA GeForce RTX 3070
min:
36.3 fps, P0.1:
39.8 fps, P1:
53.2 fps, max:
192 fps
fps
245%
NVIDIA GeForce RTX 3060 Ti:
117.6 [X] Nvidia GeForce RTX 3060 Ti FE AMD Ryzen 9 5900X 3.7GHz
NVIDIA GeForce RTX 3060 Ti
min:
69.4 fps, P0.1:
81.8 fps, P1:
94.8 fps, max:
248 fps
fps
100%
GeForce RTX 3050 Ti Laptop GPU:
31.1 [X] SCHENKER XMG Focus 17 Intel Core i7-11800H 2.3GHz
GeForce RTX 3050 Ti Laptop GPU
min:
19 fps, P0.1:
20.3 fps, P1:
25.7 fps, max:
42.2 fps
31.3 [X] SCHENKER XMG Focus 15 Intel Core i7-11800H 2.3GHz
GeForce RTX 3050 Ti Laptop GPU
min:
25.3 fps, P0.1:
25.7 fps, P1:
26.5 fps, max:
41.8 fps
32.3 [X] XMG Prototyp AMD Ryzen 5 5600H 3.3GHz
GeForce RTX 3050 Ti Laptop GPU
min:
15.5 fps, P0.1:
17.9 fps, P1:
24.1 fps, max:
48.2 fps
~ 32 fps
237%
NVIDIA GeForce RTX 3070:
75.8 [X] AMD Ryzen 9 5900X 3.7GHz
NVIDIA GeForce RTX 3070
min:
46.1 fps, P0.1:
48.5 fps, P1:
54.2 fps, max:
148 fps
fps
336%
NVIDIA GeForce RTX 3060 Ti:
107.5 [X] Nvidia GeForce RTX 3060 Ti FE AMD Ryzen 9 5900X 3.7GHz
NVIDIA GeForce RTX 3060 Ti
min:
57.5 fps, P0.1:
74.2 fps, P1:
89.2 fps, max:
201 fps
fps
100%
GeForce RTX 3050 Ti Laptop GPU:
23.7 [X] XMG Prototyp AMD Ryzen 5 5600H 3.3GHz
GeForce RTX 3050 Ti Laptop GPU
min:
6.28 fps, P0.1:
8.75 fps, P1:
16.7 fps, max:
36.9 fps
fps
271%
NVIDIA GeForce RTX 3070:
64.3 [X] AMD Ryzen 9 5900X 3.7GHz
NVIDIA GeForce RTX 3070
min:
42.4 fps, P0.1:
47.6 fps, P1:
52.8 fps, max:
102 fps
fps
335%
NVIDIA GeForce RTX 3060 Ti:
79.4 [X] Nvidia GeForce RTX 3060 Ti FE AMD Ryzen 9 5900X 3.7GHz
NVIDIA GeForce RTX 3060 Ti
min:
61.7 fps, P0.1:
62.3 fps, P1:
67.3 fps, max:
100.7 fps
fps
100%
GeForce RTX 3050 Ti Laptop GPU:
11.5 [X] XMG Prototyp AMD Ryzen 5 5600H 3.3GHz
GeForce RTX 3050 Ti Laptop GPU
min:
6.21 fps, P0.1:
6.68 fps, P1:
9.22 fps, max:
14.5 fps
fps
338%
NVIDIA GeForce RTX 3070:
38.9 [X] AMD Ryzen 9 5900X 3.7GHz
NVIDIA GeForce RTX 3070
min:
21.9 fps, P0.1:
28 fps, P1:
31.1 fps, max:
58.6 fps
fps
386%
NVIDIA GeForce RTX 3060 Ti:
44.4 [X] Nvidia GeForce RTX 3060 Ti FE AMD Ryzen 9 5900X 3.7GHz
NVIDIA GeForce RTX 3060 Ti
min:
23.4 fps, P0.1:
32.7 fps, P1:
38.5 fps, max:
209 fps
fps
100%
GeForce RTX 3050 Ti Laptop GPU:
99 [X] Asus VivoBook Pro 16 Intel Core i7-12700H 1.7GHz
GeForce RTX 3050 Ti Laptop GPU
min:
17 fps, P0.1:
43.7 fps, P1:
56.4 fps, max:
125.8 fps
fps
116%
NVIDIA GeForce RTX 3070:
115 [X] AMD Ryzen 9 5900X 3.7GHz
NVIDIA GeForce RTX 3070
min:
7.09 fps, P0.1:
43.4 fps, P1:
81.7 fps, max:
141 fps
fps
100%
GeForce RTX 3050 Ti Laptop GPU:
52.1 [X] Asus VivoBook Pro 16 Intel Core i7-12700H 1.7GHz
GeForce RTX 3050 Ti Laptop GPU
min:
29.9 fps, P0.1:
36.2 fps, P1:
43.6 fps, max:
85.6 fps
fps
187%
NVIDIA GeForce RTX 3070:
97.4 [X] AMD Ryzen 9 5900X 3.7GHz
NVIDIA GeForce RTX 3070
min:
8.65 fps, P0.1:
39.1 fps, P1:
67.1 fps, max:
121 fps
fps
100%
GeForce RTX 3050 Ti Laptop GPU:
38.4 [X] Asus VivoBook Pro 16 Intel Core i7-12700H 1.7GHz
GeForce RTX 3050 Ti Laptop GPU
min:
18.7 fps, P0.1:
24.6 fps, P1:
31.8 fps, max:
52.9 fps
fps
208%
NVIDIA GeForce RTX 3070:
79.9 [X] AMD Ryzen 9 5900X 3.7GHz
NVIDIA GeForce RTX 3070
min:
9.96 fps, P0.1:
35.5 fps, P1:
59 fps, max:
98.4 fps
fps
100%
GeForce RTX 3050 Ti Laptop GPU:
26.4 [X] Asus VivoBook Pro 16 Intel Core i7-12700H 1.7GHz
GeForce RTX 3050 Ti Laptop GPU
min:
19.8 fps, P0.1:
20 fps, P1:
21.5 fps, max:
36.5 fps
fps
238%
NVIDIA GeForce RTX 3070:
62.8 [X] AMD Ryzen 9 5900X 3.7GHz
NVIDIA GeForce RTX 3070
min:
6.79 fps, P0.1:
32.1 fps, P1:
50 fps, max:
76.3 fps
fps
100%
GeForce RTX 3050 Ti Laptop GPU:
19.6 [X] Asus VivoBook Pro 16 Intel Core i7-12700H 1.7GHz
GeForce RTX 3050 Ti Laptop GPU
min:
16.1 fps, P0.1:
16.6 fps, P1:
17.2 fps, max:
25.7 fps
fps
284%
NVIDIA GeForce RTX 3070:
55.6 [X] AMD Ryzen 9 5900X 3.7GHz
NVIDIA GeForce RTX 3070
min:
6.88 fps, P0.1:
30.7 fps, P1:
44.2 fps, max:
68.6 fps
fps
NVIDIA GeForce RTX 3070:
37.3 [X] AMD Ryzen 9 5900X 3.7GHz
NVIDIA GeForce RTX 3070
min:
10.6 fps, P0.1:
19.7 fps, P1:
31 fps, max:
59.8 fps
fps
100%
GeForce RTX 3050 Ti Laptop GPU:
52 fps
348%
NVIDIA GeForce RTX 3070:
172 [X] AMD Ryzen 9 5900X 3.7GHz
NVIDIA GeForce RTX 3070
189 [X] AMD Ryzen 9 5900X 3.7GHz
NVIDIA GeForce RTX 3070
min:
29 fps, max:
341 fps
~ 181 fps
348%
NVIDIA GeForce RTX 3060 Ti:
181 fps
100%
GeForce RTX 3050 Ti Laptop GPU:
47 82 [X] XMG Prototyp AMD Ryzen 5 5600H 3.3GHz
GeForce RTX 3050 Ti Laptop GPU
min:
4 fps
~ 65 fps
235%
NVIDIA GeForce RTX 3070:
152 [X] AMD Ryzen 9 5900X 3.7GHz
NVIDIA GeForce RTX 3070
153 [X] AMD Ryzen 9 5900X 3.7GHz
NVIDIA GeForce RTX 3070
min:
32 fps, max:
256 fps
~ 153 fps
214%
NVIDIA GeForce RTX 3060 Ti:
139 fps
100%
GeForce RTX 3050 Ti Laptop GPU:
44 72 [X] XMG Prototyp AMD Ryzen 5 5600H 3.3GHz
GeForce RTX 3050 Ti Laptop GPU
min:
37 fps
~ 58 fps
233%
NVIDIA GeForce RTX 3070:
132 [X] AMD Ryzen 9 5900X 3.7GHz
NVIDIA GeForce RTX 3070
138 [X] AMD Ryzen 9 5900X 3.7GHz
NVIDIA GeForce RTX 3070
min:
18 fps, max:
268 fps
~ 135 fps
210%
NVIDIA GeForce RTX 3060 Ti:
122 fps
100%
GeForce RTX 3050 Ti Laptop GPU:
41 67 [X] XMG Prototyp AMD Ryzen 5 5600H 3.3GHz
GeForce RTX 3050 Ti Laptop GPU
min:
35 fps
~ 54 fps
231%
NVIDIA GeForce RTX 3070:
124 [X] AMD Ryzen 9 5900X 3.7GHz
NVIDIA GeForce RTX 3070
min:
68 fps, max:
221 fps
125 [X] AMD Ryzen 9 5900X 3.7GHz
NVIDIA GeForce RTX 3070
~ 125 fps
202%
NVIDIA GeForce RTX 3060 Ti:
109 fps
100%
GeForce RTX 3050 Ti Laptop GPU:
52 [X] XMG Prototyp AMD Ryzen 5 5600H 3.3GHz
GeForce RTX 3050 Ti Laptop GPU
min:
17 fps
fps
206%
NVIDIA GeForce RTX 3070:
104 [X] AMD Ryzen 9 5900X 3.7GHz
NVIDIA GeForce RTX 3070
min:
32 fps, max:
196 fps
109 [X] AMD Ryzen 9 5900X 3.7GHz
NVIDIA GeForce RTX 3070
~ 107 fps
177%
NVIDIA GeForce RTX 3060 Ti:
92 fps
NVIDIA GeForce RTX 3070:
61 [X] AMD Ryzen 9 5900X 3.7GHz
NVIDIA GeForce RTX 3070
min:
41 fps, max:
103 fps
77 [X] AMD Ryzen 9 5900X 3.7GHz
NVIDIA GeForce RTX 3070
~ 69 fps
NVIDIA GeForce RTX 3060 Ti:
53 fps
NVIDIA GeForce RTX 3070:
224 [X] AMD Ryzen 9 5900X 3.7GHz
NVIDIA GeForce RTX 3070
min:
56.8 fps, P0.1:
155 fps, P1:
177 fps, max:
305 fps
fps
NVIDIA GeForce RTX 3060 Ti:
229 [X] Nvidia GeForce RTX 3060 Ti FE AMD Ryzen 9 5900X 3.7GHz
NVIDIA GeForce RTX 3060 Ti
min:
120.9 fps, P0.1:
155.5 fps, P1:
177.6 fps, max:
334 fps
fps
100%
GeForce RTX 3050 Ti Laptop GPU:
62 [X] XMG Prototyp AMD Ryzen 5 5600H 3.3GHz
GeForce RTX 3050 Ti Laptop GPU
min:
25.5 fps, P0.1:
38.2 fps, P1:
40.9 fps, max:
95.7 fps
98.1 [X] SCHENKER XMG Focus 15 Intel Core i7-11800H 2.3GHz
GeForce RTX 3050 Ti Laptop GPU
min:
32.5 fps, P0.1:
63.8 fps, P1:
74.5 fps, max:
142 fps
100 [X] SCHENKER XMG Focus 17 Intel Core i7-11800H 2.3GHz
GeForce RTX 3050 Ti Laptop GPU
min:
41.7 fps, P0.1:
78 fps, P1:
84.1 fps, max:
138 fps
~ 87 fps
218%
NVIDIA GeForce RTX 3070:
190 [X] AMD Ryzen 9 5900X 3.7GHz
NVIDIA GeForce RTX 3070
min:
49.8 fps, P0.1:
135 fps, P1:
147 fps, max:
280 fps
fps
191%
NVIDIA GeForce RTX 3060 Ti:
166.4 [X] Nvidia GeForce RTX 3060 Ti FE AMD Ryzen 9 5900X 3.7GHz
NVIDIA GeForce RTX 3060 Ti
min:
85.3 fps, P0.1:
108.4 fps, P1:
129.7 fps, max:
265 fps
fps
100%
GeForce RTX 3050 Ti Laptop GPU:
59 [X] XMG Prototyp AMD Ryzen 5 5600H 3.3GHz
GeForce RTX 3050 Ti Laptop GPU
min:
34 fps, P0.1:
35.6 fps, P1:
38.5 fps, max:
86.8 fps
89.3 [X] SCHENKER XMG Focus 15 Intel Core i7-11800H 2.3GHz
GeForce RTX 3050 Ti Laptop GPU
min:
50.4 fps, P0.1:
57.2 fps, P1:
68.9 fps, max:
113 fps
93.1 [X] SCHENKER XMG Focus 17 Intel Core i7-11800H 2.3GHz
GeForce RTX 3050 Ti Laptop GPU
min:
71.1 fps, P0.1:
73.8 fps, P1:
78.7 fps, max:
130 fps
~ 80 fps
216%
NVIDIA GeForce RTX 3070:
173 [X] AMD Ryzen 9 5900X 3.7GHz
NVIDIA GeForce RTX 3070
min:
115 fps, P0.1:
128 fps, P1:
140 fps, max:
248 fps
fps
192%
NVIDIA GeForce RTX 3060 Ti:
153.5 [X] Nvidia GeForce RTX 3060 Ti FE AMD Ryzen 9 5900X 3.7GHz
NVIDIA GeForce RTX 3060 Ti
min:
75.8 fps, P0.1:
105.6 fps, P1:
124.6 fps, max:
248 fps
fps
100%
GeForce RTX 3050 Ti Laptop GPU:
57.6 [X] XMG Prototyp AMD Ryzen 5 5600H 3.3GHz
GeForce RTX 3050 Ti Laptop GPU
min:
33.5 fps, P0.1:
34.7 fps, P1:
38.6 fps, max:
81.5 fps
85.8 [X] SCHENKER XMG Focus 15 Intel Core i7-11800H 2.3GHz
GeForce RTX 3050 Ti Laptop GPU
min:
47.9 fps, P0.1:
50.8 fps, P1:
64.5 fps, max:
114 fps
90.8 [X] SCHENKER XMG Focus 17 Intel Core i7-11800H 2.3GHz
GeForce RTX 3050 Ti Laptop GPU
min:
33.9 fps, P0.1:
74 fps, P1:
78.1 fps, max:
118 fps
~ 78 fps
218%
NVIDIA GeForce RTX 3070:
170 [X] AMD Ryzen 9 5900X 3.7GHz
NVIDIA GeForce RTX 3070
min:
106 fps, P0.1:
117 fps, P1:
136 fps, max:
255 fps
fps
193%
NVIDIA GeForce RTX 3060 Ti:
150.4 [X] Nvidia GeForce RTX 3060 Ti FE AMD Ryzen 9 5900X 3.7GHz
NVIDIA GeForce RTX 3060 Ti
min:
52.1 fps, P0.1:
101.3 fps, P1:
122.6 fps, max:
236 fps
fps
100%
GeForce RTX 3050 Ti Laptop GPU:
38.1 [X] XMG Prototyp AMD Ryzen 5 5600H 3.3GHz
GeForce RTX 3050 Ti Laptop GPU
min:
22.3 fps, P0.1:
23 fps, P1:
24.8 fps, max:
50.5 fps
fps
331%
NVIDIA GeForce RTX 3070:
126 [X] AMD Ryzen 9 5900X 3.7GHz
NVIDIA GeForce RTX 3070
min:
95.7 fps, P0.1:
99.5 fps, P1:
107 fps, max:
178 fps
fps
286%
NVIDIA GeForce RTX 3060 Ti:
108.8 [X] Nvidia GeForce RTX 3060 Ti FE AMD Ryzen 9 5900X 3.7GHz
NVIDIA GeForce RTX 3060 Ti
min:
60.7 fps, P0.1:
77.7 fps, P1:
93 fps, max:
198.8 fps
fps
100%
GeForce RTX 3050 Ti Laptop GPU:
23 [X] XMG Prototyp AMD Ryzen 5 5600H 3.3GHz
GeForce RTX 3050 Ti Laptop GPU
min:
15.1 fps, P0.1:
15.6 fps, P1:
17.6 fps, max:
49.6 fps
fps
322%
NVIDIA GeForce RTX 3070:
74.1 [X] AMD Ryzen 9 5900X 3.7GHz
NVIDIA GeForce RTX 3070
min:
62.4 fps, P0.1:
64.2 fps, P1:
66.4 fps, max:
84.5 fps
fps
269%
NVIDIA GeForce RTX 3060 Ti:
61.9 [X] Nvidia GeForce RTX 3060 Ti FE AMD Ryzen 9 5900X 3.7GHz
NVIDIA GeForce RTX 3060 Ti
min:
36.2 fps, P0.1:
51.6 fps, P1:
54.8 fps, max:
133 fps
fps
100%
GeForce RTX 3050 Ti Laptop GPU:
186 236 ~ 211 fps
158%
NVIDIA GeForce RTX 3070:
321 [X] 692646
AMD Ryzen 9 5900X 3.7GHz
NVIDIA GeForce RTX 3070
min:
250 fps, max:
352 fps
327 [X] 712959
AMD Ryzen 9 5900X 3.7GHz
NVIDIA GeForce RTX 3070
min:
253 fps, max:
364 fps
351 ~ 333 fps
159%
NVIDIA GeForce RTX 3060 Ti:
182 [X] Huawei MateBook X Pro 2023 (Nvidia GeForce RTX 3060 Ti FE TB3) 759689
Intel Core i7-1360P 1.6GHz
NVIDIA GeForce RTX 3060 Ti
min:
150 fps, max:
203 fps
183.7 [X] Geekom Mini IT11 (Nvidia GeForce RTX 3060 Ti FE TB3) 759689
Intel Core i7-11390H 3.4GHz
NVIDIA GeForce RTX 3060 Ti
min:
148 fps, max:
207 fps
209 [X] Intel NUC 12 Pro Kit NUC12WSKi7 759689
Intel Core i7-1260P 1.5GHz
NVIDIA GeForce RTX 3060 Ti
min:
164 fps, max:
242 fps
369 501 [X] Nvidia GeForce RTX 3060 Ti FE 759689
AMD Ryzen 9 7900X 4.7GHz
NVIDIA GeForce RTX 3060 Ti
min:
385 fps, max:
553 fps
563 [X] Nvidia GeForce RTX 3060 Ti FE 759689
AMD Ryzen 9 7950X 4.5GHz
NVIDIA GeForce RTX 3060 Ti
min:
436 fps, max:
632 fps
~ 335 fps
100%
GeForce RTX 3050 Ti Laptop GPU:
119 144 152 [X] XMG Prototyp AMD Ryzen 5 5600H 3.3GHz
GeForce RTX 3050 Ti Laptop GPU
min:
137 fps
~ 138 fps
207%
NVIDIA GeForce RTX 3070:
268 [X] 712959
AMD Ryzen 9 5900X 3.7GHz
NVIDIA GeForce RTX 3070
min:
219 fps, max:
310 fps
288 [X] 692646
AMD Ryzen 9 5900X 3.7GHz
NVIDIA GeForce RTX 3070
min:
217 fps, max:
336 fps
302 ~ 286 fps
164%
NVIDIA GeForce RTX 3060 Ti:
119.5 [X] Huawei MateBook X Pro 2023 (Nvidia GeForce RTX 3060 Ti FE TB3) 759689
Intel Core i7-1360P 1.6GHz
NVIDIA GeForce RTX 3060 Ti
min:
55 fps, max:
174 fps
124.7 [X] Intel NUC 12 Pro Kit NUC12WSKi7 759689
Intel Core i7-1260P 1.5GHz
NVIDIA GeForce RTX 3060 Ti
min:
57 fps, max:
206 fps
152.2 [X] Geekom Mini IT11 (Nvidia GeForce RTX 3060 Ti FE TB3) 759689
Intel Core i7-11390H 3.4GHz
NVIDIA GeForce RTX 3060 Ti
min:
120 fps, max:
186 fps
361 [X] Nvidia GeForce RTX 3060 Ti FE 759689
AMD Ryzen 9 7900X 4.7GHz
NVIDIA GeForce RTX 3060 Ti
min:
312 fps, max:
408 fps
374 [X] Nvidia GeForce RTX 3060 Ti FE 759689
AMD Ryzen 9 7950X 4.5GHz
NVIDIA GeForce RTX 3060 Ti
min:
314 fps, max:
426 fps
~ 226 fps
100%
GeForce RTX 3050 Ti Laptop GPU:
104 123 134 [X] XMG Prototyp AMD Ryzen 5 5600H 3.3GHz
GeForce RTX 3050 Ti Laptop GPU
min:
120 fps
~ 120 fps
219%
NVIDIA GeForce RTX 3070:
249 [X] 692646
AMD Ryzen 9 5900X 3.7GHz
NVIDIA GeForce RTX 3070
min:
198 fps, max:
283 fps
252 [X] 712959
AMD Ryzen 9 5900X 3.7GHz
NVIDIA GeForce RTX 3070
min:
188 fps, max:
279 fps
288 ~ 263 fps
168%
NVIDIA GeForce RTX 3060 Ti:
118.2 [X] Huawei MateBook X Pro 2023 (Nvidia GeForce RTX 3060 Ti FE TB3) 759689
Intel Core i7-1360P 1.6GHz
NVIDIA GeForce RTX 3060 Ti
min:
61 fps, max:
167 fps
126.1 [X] Intel NUC 12 Pro Kit NUC12WSKi7 759689
Intel Core i7-1260P 1.5GHz
NVIDIA GeForce RTX 3060 Ti
min:
50 fps, max:
182 fps
139.7 [X] Geekom Mini IT11 (Nvidia GeForce RTX 3060 Ti FE TB3) 759689
Intel Core i7-11390H 3.4GHz
NVIDIA GeForce RTX 3060 Ti
min:
111 fps, max:
164 fps
252 286 [X] Nvidia GeForce RTX 3060 Ti FE 759689
AMD Ryzen 9 7900X 4.7GHz
NVIDIA GeForce RTX 3060 Ti
min:
246 fps, max:
321 fps
292 [X] Nvidia GeForce RTX 3060 Ti FE 759689
AMD Ryzen 9 7950X 4.5GHz
NVIDIA GeForce RTX 3060 Ti
min:
246 fps, max:
331 fps
~ 202 fps
100%
GeForce RTX 3050 Ti Laptop GPU:
78.4 92 99 [X] XMG Prototyp AMD Ryzen 5 5600H 3.3GHz
GeForce RTX 3050 Ti Laptop GPU
min:
80 fps
~ 90 fps
213%
NVIDIA GeForce RTX 3070:
179 [X] 692646
AMD Ryzen 9 5900X 3.7GHz
NVIDIA GeForce RTX 3070
min:
153 fps, max:
213 fps
181 [X] 712959
AMD Ryzen 9 5900X 3.7GHz
NVIDIA GeForce RTX 3070
min:
145 fps, max:
211 fps
215 ~ 192 fps
163%
NVIDIA GeForce RTX 3060 Ti:
101.5 [X] Huawei MateBook X Pro 2023 (Nvidia GeForce RTX 3060 Ti FE TB3) 759689
Intel Core i7-1360P 1.6GHz
NVIDIA GeForce RTX 3060 Ti
min:
65 fps, max:
139 fps
102.7 [X] Intel NUC 12 Pro Kit NUC12WSKi7 759689
Intel Core i7-1260P 1.5GHz
NVIDIA GeForce RTX 3060 Ti
min:
53 fps, max:
145 fps
106.5 [X] Geekom Mini IT11 (Nvidia GeForce RTX 3060 Ti FE TB3) 759689
Intel Core i7-11390H 3.4GHz
NVIDIA GeForce RTX 3060 Ti
min:
85 fps, max:
130 fps
174 197.2 [X] Nvidia GeForce RTX 3060 Ti FE 759689
AMD Ryzen 9 7900X 4.7GHz
NVIDIA GeForce RTX 3060 Ti
min:
160 fps, max:
237 fps
201 [X] Nvidia GeForce RTX 3060 Ti FE 759689
AMD Ryzen 9 7950X 4.5GHz
NVIDIA GeForce RTX 3060 Ti
min:
161 fps, max:
240 fps
~ 147 fps
100%
GeForce RTX 3050 Ti Laptop GPU:
56.4 68.9 72 [X] XMG Prototyp AMD Ryzen 5 5600H 3.3GHz
GeForce RTX 3050 Ti Laptop GPU
min:
60 fps
~ 66 fps
227%
NVIDIA GeForce RTX 3070:
143 [X] 712959
AMD Ryzen 9 5900X 3.7GHz
NVIDIA GeForce RTX 3070
min:
123 fps, max:
164 fps
146 [X] 692646
AMD Ryzen 9 5900X 3.7GHz
NVIDIA GeForce RTX 3070
min:
121 fps, max:
168 fps
162.2 ~ 150 fps
177%
NVIDIA GeForce RTX 3060 Ti:
87.6 [X] Huawei MateBook X Pro 2023 (Nvidia GeForce RTX 3060 Ti FE TB3) 759689
Intel Core i7-1360P 1.6GHz
NVIDIA GeForce RTX 3060 Ti
min:
53 fps, max:
113 fps
92 [X] Geekom Mini IT11 (Nvidia GeForce RTX 3060 Ti FE TB3) 759689
Intel Core i7-11390H 3.4GHz
NVIDIA GeForce RTX 3060 Ti
min:
76 fps, max:
108 fps
92.7 [X] Intel NUC 12 Pro Kit NUC12WSKi7 759689
Intel Core i7-1260P 1.5GHz
NVIDIA GeForce RTX 3060 Ti
min:
51 fps, max:
119 fps
135 147 [X] Nvidia GeForce RTX 3060 Ti FE 759689
AMD Ryzen 9 7900X 4.7GHz
NVIDIA GeForce RTX 3060 Ti
min:
124 fps, max:
170 fps
150 [X] Nvidia GeForce RTX 3060 Ti FE 759689
AMD Ryzen 9 7950X 4.5GHz
NVIDIA GeForce RTX 3060 Ti
min:
125 fps, max:
175 fps
~ 117 fps
100%
GeForce RTX 3050 Ti Laptop GPU:
34 [X] XMG Prototyp AMD Ryzen 5 5600H 3.3GHz
GeForce RTX 3050 Ti Laptop GPU
min:
28 fps
fps
265%
NVIDIA GeForce RTX 3070:
88.7 [X] 712959
AMD Ryzen 9 5900X 3.7GHz
NVIDIA GeForce RTX 3070
min:
76 fps, max:
101 fps
89.2 [X] 692646
AMD Ryzen 9 5900X 3.7GHz
NVIDIA GeForce RTX 3070
min:
73 fps, max:
104 fps
92.7 ~ 90 fps
212%
NVIDIA GeForce RTX 3060 Ti:
60.3 [X] Intel NUC 12 Pro Kit NUC12WSKi7 759689
Intel Core i7-1260P 1.5GHz
NVIDIA GeForce RTX 3060 Ti
min:
35 fps, max:
77 fps
60.9 [X] Huawei MateBook X Pro 2023 (Nvidia GeForce RTX 3060 Ti FE TB3) 759689
Intel Core i7-1360P 1.6GHz
NVIDIA GeForce RTX 3060 Ti
min:
42 fps, max:
77 fps
61.9 [X] Geekom Mini IT11 (Nvidia GeForce RTX 3060 Ti FE TB3) 759689
Intel Core i7-11390H 3.4GHz
NVIDIA GeForce RTX 3060 Ti
min:
51 fps, max:
72 fps
80 83.7 [X] Nvidia GeForce RTX 3060 Ti FE 759689
AMD Ryzen 9 7900X 4.7GHz
NVIDIA GeForce RTX 3060 Ti
min:
72 fps, max:
98 fps
84.3 [X] Nvidia GeForce RTX 3060 Ti FE 759689
AMD Ryzen 9 7950X 4.5GHz
NVIDIA GeForce RTX 3060 Ti
min:
71 fps, max:
100 fps
~ 72 fps
100%
GeForce RTX 3050 Ti Laptop GPU:
125.9 fps
272%
NVIDIA GeForce RTX 3070:
342.6 fps
264%
NVIDIA GeForce RTX 3060 Ti:
332.3 fps
100%
GeForce RTX 3050 Ti Laptop GPU:
136.4 141 [X] XMG Prototyp AMD Ryzen 5 5600H 3.3GHz
GeForce RTX 3050 Ti Laptop GPU
~ 139 fps
147%
NVIDIA GeForce RTX 3070:
204.9 fps
150%
NVIDIA GeForce RTX 3060 Ti:
208.8 fps
100%
GeForce RTX 3050 Ti Laptop GPU:
90.6 99 [X] XMG Prototyp AMD Ryzen 5 5600H 3.3GHz
GeForce RTX 3050 Ti Laptop GPU
~ 95 fps
159%
NVIDIA GeForce RTX 3070:
150.8 fps
171%
NVIDIA GeForce RTX 3060 Ti:
162.4 fps
100%
GeForce RTX 3050 Ti Laptop GPU:
64.7 68.8 [X] XMG Prototyp AMD Ryzen 5 5600H 3.3GHz
GeForce RTX 3050 Ti Laptop GPU
~ 67 fps
203%
NVIDIA GeForce RTX 3070:
136.2 fps
192%
NVIDIA GeForce RTX 3060 Ti:
128.9 fps
100%
GeForce RTX 3050 Ti Laptop GPU:
48.7 [X] XMG Prototyp AMD Ryzen 5 5600H 3.3GHz
GeForce RTX 3050 Ti Laptop GPU
fps
202%
NVIDIA GeForce RTX 3070:
98.2 fps
189%
NVIDIA GeForce RTX 3060 Ti:
91.9 fps
100%
GeForce RTX 3050 Ti Laptop GPU:
26.5 [X] XMG Prototyp AMD Ryzen 5 5600H 3.3GHz
GeForce RTX 3050 Ti Laptop GPU
fps
202%
NVIDIA GeForce RTX 3070:
53.5 fps
186%
NVIDIA GeForce RTX 3060 Ti:
49.4 fps
100%
GeForce RTX 3050 Ti Laptop GPU:
188.1 [X] Asus VivoBook Pro 16 Intel Core i7-12700H 1.7GHz
GeForce RTX 3050 Ti Laptop GPU
min:
102.6 fps, P0.1:
113.1 fps, P1:
124.3 fps, max:
291 fps
201 ~ 195 fps
177%
NVIDIA GeForce RTX 3070:
246 [X] AMD Ryzen 9 5900X 3.7GHz
NVIDIA GeForce RTX 3070
P1:
114.9 fps
246 [X] AMD Ryzen 9 5900X 3.7GHz
NVIDIA GeForce RTX 3070
P1:
114.9 fps
547 ~ 346 fps
261%
NVIDIA GeForce RTX 3060 Ti:
508 fps
100%
GeForce RTX 3050 Ti Laptop GPU:
120 [X] Asus VivoBook Pro 16 Intel Core i7-12700H 1.7GHz
GeForce RTX 3050 Ti Laptop GPU
min:
26.5 fps, P0.1:
75.2 fps, P1:
80 fps, max:
170.5 fps
121 ~ 121 fps
234%
NVIDIA GeForce RTX 3070:
246 [X] AMD Ryzen 9 5900X 3.7GHz
NVIDIA GeForce RTX 3070
P1:
131.6 fps
246 [X] AMD Ryzen 9 5900X 3.7GHz
NVIDIA GeForce RTX 3070
P1:
131.6 fps
358 ~ 283 fps
264%
NVIDIA GeForce RTX 3060 Ti:
320 fps
100%
GeForce RTX 3050 Ti Laptop GPU:
115 fps
235%
NVIDIA GeForce RTX 3070:
244 [X] AMD Ryzen 9 5900X 3.7GHz
NVIDIA GeForce RTX 3070
P1:
147.1 fps
244 [X] AMD Ryzen 9 5900X 3.7GHz
NVIDIA GeForce RTX 3070
P1:
147.1 fps
322 ~ 270 fps
246%
NVIDIA GeForce RTX 3060 Ti:
283 fps
100%
GeForce RTX 3050 Ti Laptop GPU:
112 fps
234%
NVIDIA GeForce RTX 3070:
237 [X] AMD Ryzen 9 5900X 3.7GHz
NVIDIA GeForce RTX 3070
P1:
128.2 fps
237 [X] AMD Ryzen 9 5900X 3.7GHz
NVIDIA GeForce RTX 3070
P1:
128.2 fps
311 ~ 262 fps
245%
NVIDIA GeForce RTX 3060 Ti:
274 fps
100%
GeForce RTX 3050 Ti Laptop GPU:
80.9 fps
272%
NVIDIA GeForce RTX 3070:
208 [X] AMD Ryzen 9 5900X 3.7GHz
NVIDIA GeForce RTX 3070
P1:
140.8 fps
208 [X] AMD Ryzen 9 5900X 3.7GHz
NVIDIA GeForce RTX 3070
P1:
140.8 fps
244 ~ 220 fps
271%
NVIDIA GeForce RTX 3060 Ti:
219 fps
NVIDIA GeForce RTX 3070:
116 [X] AMD Ryzen 9 5900X 3.7GHz
NVIDIA GeForce RTX 3070
P1:
96.2 fps
116 [X] AMD Ryzen 9 5900X 3.7GHz
NVIDIA GeForce RTX 3070
P1:
96.2 fps
136 ~ 123 fps
NVIDIA GeForce RTX 3060 Ti:
122 fps
NVIDIA GeForce RTX 3070:
174 [X] AMD Ryzen 9 5900X 3.7GHz
NVIDIA GeForce RTX 3070
min:
148 fps, max:
200 fps
216 [X] AMD Ryzen 9 5900X 3.7GHz
NVIDIA GeForce RTX 3070
min:
181 fps, max:
264 fps
~ 195 fps
100%
GeForce RTX 3050 Ti Laptop GPU:
86.4 [X] XMG Prototyp AMD Ryzen 5 5600H 3.3GHz
GeForce RTX 3050 Ti Laptop GPU
min:
54.1 fps, P0.1:
57.1 fps, P1:
66 fps, max:
136 fps
86.7 [X] SCHENKER XMG Focus 17 Intel Core i7-11800H 2.3GHz
GeForce RTX 3050 Ti Laptop GPU
min:
56.6 fps, P0.1:
61.8 fps, P1:
66.7 fps, max:
139 fps
92.5 [X] SCHENKER XMG Focus 15 Intel Core i7-11800H 2.3GHz
GeForce RTX 3050 Ti Laptop GPU
min:
58.5 fps, P0.1:
64.4 fps, P1:
70.1 fps, max:
138 fps
~ 89 fps
193%
NVIDIA GeForce RTX 3070:
152 [X] AMD Ryzen 9 5900X 3.7GHz
NVIDIA GeForce RTX 3070
min:
131 fps, max:
176 fps
192 [X] AMD Ryzen 9 5900X 3.7GHz
NVIDIA GeForce RTX 3070
min:
162 fps, max:
215 fps
~ 172 fps
100%
GeForce RTX 3050 Ti Laptop GPU:
73.5 [X] XMG Prototyp AMD Ryzen 5 5600H 3.3GHz
GeForce RTX 3050 Ti Laptop GPU
min:
22.5 fps, P0.1:
50.8 fps, P1:
58.1 fps, max:
110 fps
79 [X] SCHENKER XMG Focus 17 Intel Core i7-11800H 2.3GHz
GeForce RTX 3050 Ti Laptop GPU
min:
16.7 fps, P0.1:
50.7 fps, P1:
59.7 fps, max:
131 fps
79.2 [X] SCHENKER XMG Focus 15 Intel Core i7-11800H 2.3GHz
GeForce RTX 3050 Ti Laptop GPU
min:
17.5 fps, P0.1:
53.1 fps, P1:
60.6 fps, max:
113 fps
~ 77 fps
206%
NVIDIA GeForce RTX 3070:
137 [X] AMD Ryzen 9 5900X 3.7GHz
NVIDIA GeForce RTX 3070
min:
115 fps, max:
159 fps
180 [X] AMD Ryzen 9 5900X 3.7GHz
NVIDIA GeForce RTX 3070
min:
161 fps, max:
206 fps
~ 159 fps
100%
GeForce RTX 3050 Ti Laptop GPU:
46.7 [X] XMG Prototyp AMD Ryzen 5 5600H 3.3GHz
GeForce RTX 3050 Ti Laptop GPU
min:
20.1 fps, P0.1:
39.1 fps, P1:
44 fps, max:
58.1 fps
fps
285%
NVIDIA GeForce RTX 3070:
128 [X] AMD Ryzen 9 5900X 3.7GHz
NVIDIA GeForce RTX 3070
min:
108 fps, max:
139 fps
138 [X] AMD Ryzen 9 5900X 3.7GHz
NVIDIA GeForce RTX 3070
min:
131 fps, max:
144 fps
~ 133 fps
100%
GeForce RTX 3050 Ti Laptop GPU:
23.4 [X] XMG Prototyp AMD Ryzen 5 5600H 3.3GHz
GeForce RTX 3050 Ti Laptop GPU
min:
16.9 fps, P0.1:
19.9 fps, P1:
21.9 fps, max:
26 fps
fps
308%
NVIDIA GeForce RTX 3070:
70.2 [X] AMD Ryzen 9 5900X 3.7GHz
NVIDIA GeForce RTX 3070
min:
67 fps, max:
75 fps
74.2 [X] AMD Ryzen 9 5900X 3.7GHz
NVIDIA GeForce RTX 3070
min:
72 fps, max:
77 fps
~ 72 fps
100%
GeForce RTX 3050 Ti Laptop GPU:
118.4 [X] Dell G15 5515 AMD Ryzen 7 5800H 3.2GHz
GeForce RTX 3050 Ti Laptop GPU
min:
65.5 fps, max:
154.3 fps
fps
141%
NVIDIA GeForce RTX 3070:
156.5 [X] AMD Ryzen 9 5900X 3.7GHz
NVIDIA GeForce RTX 3070
min:
80 fps, max:
301 fps
168 [X] AMD Ryzen 9 5900X 3.7GHz
NVIDIA GeForce RTX 3070
min:
87 fps, max:
284 fps
175 ~ 167 fps
144%
NVIDIA GeForce RTX 3060 Ti:
170 fps
100%
GeForce RTX 3050 Ti Laptop GPU:
75.8 [X] Dell G15 5515 AMD Ryzen 7 5800H 3.2GHz
GeForce RTX 3050 Ti Laptop GPU
min:
66 fps, max:
96.4 fps
fps
204%
NVIDIA GeForce RTX 3070:
149 [X] AMD Ryzen 9 5900X 3.7GHz
NVIDIA GeForce RTX 3070
156 [X] AMD Ryzen 9 5900X 3.7GHz
NVIDIA GeForce RTX 3070
min:
83 fps, max:
209 fps
160 ~ 155 fps
203%
NVIDIA GeForce RTX 3060 Ti:
154 fps
100%
GeForce RTX 3050 Ti Laptop GPU:
50.8 [X] Dell G15 5515 AMD Ryzen 7 5800H 3.2GHz
GeForce RTX 3050 Ti Laptop GPU
min:
35.7 fps, max:
71.4 fps
fps
230%
NVIDIA GeForce RTX 3070:
112.8 [X] AMD Ryzen 9 5900X 3.7GHz
NVIDIA GeForce RTX 3070
min:
40 fps, max:
160 fps
118 119 [X] AMD Ryzen 9 5900X 3.7GHz
NVIDIA GeForce RTX 3070
min:
82 fps, max:
119 fps
~ 117 fps
213%
NVIDIA GeForce RTX 3060 Ti:
108 fps
100%
GeForce RTX 3050 Ti Laptop GPU:
27 [X] Dell G15 5515 AMD Ryzen 7 5800H 3.2GHz
GeForce RTX 3050 Ti Laptop GPU
min:
16.8 fps, max:
49.4 fps
fps
285%
NVIDIA GeForce RTX 3070:
76.2 [X] AMD Ryzen 9 5900X 3.7GHz
NVIDIA GeForce RTX 3070
min:
33 fps, max:
116 fps
77.9 78 [X] AMD Ryzen 9 5900X 3.7GHz
NVIDIA GeForce RTX 3070
min:
38 fps, max:
126 fps
~ 77 fps
259%
NVIDIA GeForce RTX 3060 Ti:
69.9 fps
NVIDIA GeForce RTX 3070:
63.2 63.4 [X] AMD Ryzen 9 5900X 3.7GHz
NVIDIA GeForce RTX 3070
min:
32 fps, max:
90 fps
65 [X] AMD Ryzen 9 5900X 3.7GHz
NVIDIA GeForce RTX 3070
min:
33 fps, max:
100 fps
~ 64 fps
NVIDIA GeForce RTX 3060 Ti:
57.3 fps
NVIDIA GeForce RTX 3070:
42.1 [X] AMD Ryzen 9 5900X 3.7GHz
NVIDIA GeForce RTX 3070
min:
31 fps, max:
54 fps
42.6 44 [X] AMD Ryzen 9 5900X 3.7GHz
NVIDIA GeForce RTX 3070
min:
32 fps, max:
55 fps
~ 43 fps
NVIDIA GeForce RTX 3060 Ti:
37.5 fps
100%
GeForce RTX 3050 Ti Laptop GPU:
97.9 [X] XMG Prototyp AMD Ryzen 5 5600H 3.3GHz
GeForce RTX 3050 Ti Laptop GPU
min:
48.4 fps, P0.1:
51.8 fps, P1:
59.2 fps, max:
143 fps
fps
121%
NVIDIA GeForce RTX 3070:
106 [X] AMD Ryzen 9 5900X 3.7GHz
NVIDIA GeForce RTX 3070
min:
60 fps, max:
141 fps
130 [X] AMD Ryzen 9 5900X 3.7GHz
NVIDIA GeForce RTX 3070
min:
87 fps, max:
145 fps
~ 118 fps
100%
GeForce RTX 3050 Ti Laptop GPU:
89.5 [X] XMG Prototyp AMD Ryzen 5 5600H 3.3GHz
GeForce RTX 3050 Ti Laptop GPU
min:
26.5 fps, P0.1:
47.5 fps, P1:
57.9 fps, max:
126 fps
fps
131%
NVIDIA GeForce RTX 3070:
106 [X] AMD Ryzen 9 5900X 3.7GHz
NVIDIA GeForce RTX 3070
min:
60 fps, max:
142 fps
128 [X] AMD Ryzen 9 5900X 3.7GHz
NVIDIA GeForce RTX 3070
min:
89 fps, max:
145 fps
~ 117 fps
100%
GeForce RTX 3050 Ti Laptop GPU:
81.1 [X] XMG Prototyp AMD Ryzen 5 5600H 3.3GHz
GeForce RTX 3050 Ti Laptop GPU
min:
21.1 fps, P0.1:
32.3 fps, P1:
53.7 fps, max:
115 fps
fps
143%
NVIDIA GeForce RTX 3070:
104 [X] AMD Ryzen 9 5900X 3.7GHz
NVIDIA GeForce RTX 3070
min:
55 fps, max:
134 fps
128 [X] AMD Ryzen 9 5900X 3.7GHz
NVIDIA GeForce RTX 3070
min:
82 fps, max:
145 fps
~ 116 fps
100%
GeForce RTX 3050 Ti Laptop GPU:
56.3 [X] XMG Prototyp AMD Ryzen 5 5600H 3.3GHz
GeForce RTX 3050 Ti Laptop GPU
min:
29.5 fps, P0.1:
38.1 fps, P1:
45.7 fps, max:
81.6 fps
fps
202%
NVIDIA GeForce RTX 3070:
102 [X] AMD Ryzen 9 5900X 3.7GHz
NVIDIA GeForce RTX 3070
min:
59 fps, max:
133 fps
125 [X] AMD Ryzen 9 5900X 3.7GHz
NVIDIA GeForce RTX 3070
min:
81 fps, max:
145 fps
~ 114 fps
100%
GeForce RTX 3050 Ti Laptop GPU:
29.3 [X] XMG Prototyp AMD Ryzen 5 5600H 3.3GHz
GeForce RTX 3050 Ti Laptop GPU
min:
18.6 fps, P0.1:
18.9 fps, P1:
22.2 fps, max:
58.8 fps
fps
235%
NVIDIA GeForce RTX 3070:
67.6 [X] AMD Ryzen 9 5900X 3.7GHz
NVIDIA GeForce RTX 3070
min:
56 fps, max:
76 fps
70.1 [X] AMD Ryzen 9 5900X 3.7GHz
NVIDIA GeForce RTX 3070
min:
60 fps, max:
82 fps
~ 69 fps
100%
GeForce RTX 3050 Ti Laptop GPU:
86.6 [X] XMG Prototyp AMD Ryzen 5 5600H 3.3GHz
GeForce RTX 3050 Ti Laptop GPU
min:
31 fps, P0.1:
49.7 fps, P1:
59.8 fps, max:
140 fps
fps
100%
GeForce RTX 3050 Ti Laptop GPU:
77.7 [X] XMG Prototyp AMD Ryzen 5 5600H 3.3GHz
GeForce RTX 3050 Ti Laptop GPU
min:
32 fps, P0.1:
42.4 fps, P1:
52.7 fps, max:
126 fps
fps
100%
GeForce RTX 3050 Ti Laptop GPU:
67.5 [X] XMG Prototyp AMD Ryzen 5 5600H 3.3GHz
GeForce RTX 3050 Ti Laptop GPU
min:
19.7 fps, P0.1:
33.1 fps, P1:
46.2 fps, max:
122 fps
fps
100%
GeForce RTX 3050 Ti Laptop GPU:
50.5 [X] XMG Prototyp AMD Ryzen 5 5600H 3.3GHz
GeForce RTX 3050 Ti Laptop GPU
min:
14.4 fps, P0.1:
29.1 fps, P1:
37.6 fps, max:
123 fps
fps
100%
GeForce RTX 3050 Ti Laptop GPU:
25.9 [X] XMG Prototyp AMD Ryzen 5 5600H 3.3GHz
GeForce RTX 3050 Ti Laptop GPU
min:
6.72 fps, P0.1:
10.5 fps, P1:
12.7 fps, max:
80.4 fps
fps
100%
GeForce RTX 3050 Ti Laptop GPU:
113 [X] XMG Prototyp AMD Ryzen 5 5600H 3.3GHz
GeForce RTX 3050 Ti Laptop GPU
min:
76 fps
fps
100%
GeForce RTX 3050 Ti Laptop GPU:
91.8 [X] XMG Prototyp AMD Ryzen 5 5600H 3.3GHz
GeForce RTX 3050 Ti Laptop GPU
min:
51 fps
fps
100%
GeForce RTX 3050 Ti Laptop GPU:
53.8 [X] XMG Prototyp AMD Ryzen 5 5600H 3.3GHz
GeForce RTX 3050 Ti Laptop GPU
min:
6 fps
fps
100%
GeForce RTX 3050 Ti Laptop GPU:
28.3 [X] XMG Prototyp AMD Ryzen 5 5600H 3.3GHz
GeForce RTX 3050 Ti Laptop GPU
min:
5 fps
fps
100%
GeForce RTX 3050 Ti Laptop GPU:
14.6 [X] XMG Prototyp AMD Ryzen 5 5600H 3.3GHz
GeForce RTX 3050 Ti Laptop GPU
min:
5 fps
fps
100%
GeForce RTX 3050 Ti Laptop GPU:
97 123.5 ~ 110 fps
139%
NVIDIA GeForce RTX 3070:
134 [X] AMD Ryzen 9 5900X 3.7GHz
NVIDIA GeForce RTX 3070
142 [X] AMD Ryzen 9 5900X 3.7GHz
NVIDIA GeForce RTX 3070
149 [X] Intel Core i7-10700 2.9GHz
NVIDIA GeForce RTX 3070
169 171.5 ~ 153 fps
159%
NVIDIA GeForce RTX 3060 Ti:
114.9 [X] Geekom Mini IT11 (Nvidia GeForce RTX 3060 Ti FE TB3) Intel Core i7-11390H 3.4GHz
NVIDIA GeForce RTX 3060 Ti
139.7 [X] Huawei MateBook X Pro 2023 (Nvidia GeForce RTX 3060 Ti FE TB3) Intel Core i7-1360P 1.6GHz
NVIDIA GeForce RTX 3060 Ti
145.2 [X] Intel NUC 12 Pro Kit NUC12WSKi7 Intel Core i7-1260P 1.5GHz
NVIDIA GeForce RTX 3060 Ti
172 231 [X] Nvidia GeForce RTX 3060 Ti FE AMD Ryzen 9 7900X 4.7GHz
NVIDIA GeForce RTX 3060 Ti
246 [X] Nvidia GeForce RTX 3060 Ti FE AMD Ryzen 9 7950X 4.5GHz
NVIDIA GeForce RTX 3060 Ti
~ 175 fps
100%
GeForce RTX 3050 Ti Laptop GPU:
76 88 97.5 [X] XMG Prototyp AMD Ryzen 5 5600H 3.3GHz
GeForce RTX 3050 Ti Laptop GPU
~ 87 fps
156%
NVIDIA GeForce RTX 3070:
123 [X] AMD Ryzen 9 5900X 3.7GHz
NVIDIA GeForce RTX 3070
129 [X] AMD Ryzen 9 5900X 3.7GHz
NVIDIA GeForce RTX 3070
132 [X] Intel Core i7-10700 2.9GHz
NVIDIA GeForce RTX 3070
144.7 150 ~ 136 fps
170%
NVIDIA GeForce RTX 3060 Ti:
101.6 [X] Geekom Mini IT11 (Nvidia GeForce RTX 3060 Ti FE TB3) Intel Core i7-11390H 3.4GHz
NVIDIA GeForce RTX 3060 Ti
120.9 [X] Huawei MateBook X Pro 2023 (Nvidia GeForce RTX 3060 Ti FE TB3) Intel Core i7-1360P 1.6GHz
NVIDIA GeForce RTX 3060 Ti
126.5 [X] Intel NUC 12 Pro Kit NUC12WSKi7 Intel Core i7-1260P 1.5GHz
NVIDIA GeForce RTX 3060 Ti
149 191.3 [X] Nvidia GeForce RTX 3060 Ti FE AMD Ryzen 9 7900X 4.7GHz
NVIDIA GeForce RTX 3060 Ti
201 [X] Nvidia GeForce RTX 3060 Ti FE AMD Ryzen 9 7950X 4.5GHz
NVIDIA GeForce RTX 3060 Ti
~ 148 fps
100%
GeForce RTX 3050 Ti Laptop GPU:
55 56.8 65.5 [X] XMG Prototyp AMD Ryzen 5 5600H 3.3GHz
GeForce RTX 3050 Ti Laptop GPU
~ 59 fps
195%
NVIDIA GeForce RTX 3070:
94.5 [X] AMD Ryzen 9 5900X 3.7GHz
NVIDIA GeForce RTX 3070
111 [X] AMD Ryzen 9 5900X 3.7GHz
NVIDIA GeForce RTX 3070
118 [X] Intel Core i7-10700 2.9GHz
NVIDIA GeForce RTX 3070
126 127.9 ~ 115 fps
195%
NVIDIA GeForce RTX 3060 Ti:
90.2 [X] Geekom Mini IT11 (Nvidia GeForce RTX 3060 Ti FE TB3) Intel Core i7-11390H 3.4GHz
NVIDIA GeForce RTX 3060 Ti
97.7 [X] Huawei MateBook X Pro 2023 (Nvidia GeForce RTX 3060 Ti FE TB3) Intel Core i7-1360P 1.6GHz
NVIDIA GeForce RTX 3060 Ti
101.3 [X] Intel NUC 12 Pro Kit NUC12WSKi7 Intel Core i7-1260P 1.5GHz
NVIDIA GeForce RTX 3060 Ti
118 139.4 [X] Nvidia GeForce RTX 3060 Ti FE AMD Ryzen 9 7900X 4.7GHz
NVIDIA GeForce RTX 3060 Ti
143.3 [X] Nvidia GeForce RTX 3060 Ti FE AMD Ryzen 9 7950X 4.5GHz
NVIDIA GeForce RTX 3060 Ti
~ 115 fps
100%
GeForce RTX 3050 Ti Laptop GPU:
36.8 45 50.2 [X] XMG Prototyp AMD Ryzen 5 5600H 3.3GHz
GeForce RTX 3050 Ti Laptop GPU
~ 44 fps
230%
NVIDIA GeForce RTX 3070:
95.3 [X] AMD Ryzen 9 5900X 3.7GHz
NVIDIA GeForce RTX 3070
95.8 [X] AMD Ryzen 9 5900X 3.7GHz
NVIDIA GeForce RTX 3070
98.8 [X] Intel Core i7-10700 2.9GHz
NVIDIA GeForce RTX 3070
104 108.9 ~ 101 fps
211%
NVIDIA GeForce RTX 3060 Ti:
78.2 [X] Geekom Mini IT11 (Nvidia GeForce RTX 3060 Ti FE TB3) Intel Core i7-11390H 3.4GHz
NVIDIA GeForce RTX 3060 Ti
82.9 [X] Huawei MateBook X Pro 2023 (Nvidia GeForce RTX 3060 Ti FE TB3) Intel Core i7-1360P 1.6GHz
NVIDIA GeForce RTX 3060 Ti
83.6 [X] Intel NUC 12 Pro Kit NUC12WSKi7 Intel Core i7-1260P 1.5GHz
NVIDIA GeForce RTX 3060 Ti
96 106.6 [X] Nvidia GeForce RTX 3060 Ti FE AMD Ryzen 9 7900X 4.7GHz
NVIDIA GeForce RTX 3060 Ti
108.5 [X] Nvidia GeForce RTX 3060 Ti FE AMD Ryzen 9 7950X 4.5GHz
NVIDIA GeForce RTX 3060 Ti
~ 93 fps
100%
GeForce RTX 3050 Ti Laptop GPU:
35.6 [X] XMG Prototyp AMD Ryzen 5 5600H 3.3GHz
GeForce RTX 3050 Ti Laptop GPU
fps
219%
NVIDIA GeForce RTX 3070:
75.1 [X] AMD Ryzen 9 5900X 3.7GHz
NVIDIA GeForce RTX 3070
75.5 [X] Intel Core i7-10700 2.9GHz
NVIDIA GeForce RTX 3070
75.9 [X] AMD Ryzen 9 5900X 3.7GHz
NVIDIA GeForce RTX 3070
79 82.9 ~ 78 fps
194%
NVIDIA GeForce RTX 3060 Ti:
63.2 [X] Geekom Mini IT11 (Nvidia GeForce RTX 3060 Ti FE TB3) Intel Core i7-11390H 3.4GHz
NVIDIA GeForce RTX 3060 Ti
63.9 [X] Intel NUC 12 Pro Kit NUC12WSKi7 Intel Core i7-1260P 1.5GHz
NVIDIA GeForce RTX 3060 Ti
64.3 [X] Huawei MateBook X Pro 2023 (Nvidia GeForce RTX 3060 Ti FE TB3) Intel Core i7-1360P 1.6GHz
NVIDIA GeForce RTX 3060 Ti
70.2 75.7 [X] Nvidia GeForce RTX 3060 Ti FE AMD Ryzen 9 7900X 4.7GHz
NVIDIA GeForce RTX 3060 Ti
76.3 [X] Nvidia GeForce RTX 3060 Ti FE AMD Ryzen 9 7950X 4.5GHz
NVIDIA GeForce RTX 3060 Ti
~ 69 fps
100%
GeForce RTX 3050 Ti Laptop GPU:
16.3 [X] XMG Prototyp AMD Ryzen 5 5600H 3.3GHz
GeForce RTX 3050 Ti Laptop GPU
fps
270%
NVIDIA GeForce RTX 3070:
42.7 [X] Intel Core i7-10700 2.9GHz
NVIDIA GeForce RTX 3070
43.8 [X] AMD Ryzen 9 5900X 3.7GHz
NVIDIA GeForce RTX 3070
44.2 [X] AMD Ryzen 9 5900X 3.7GHz
NVIDIA GeForce RTX 3070
44.5 46.3 ~ 44 fps
239%
NVIDIA GeForce RTX 3060 Ti:
37.8 [X] Intel NUC 12 Pro Kit NUC12WSKi7 Intel Core i7-1260P 1.5GHz
NVIDIA GeForce RTX 3060 Ti
38.1 [X] Huawei MateBook X Pro 2023 (Nvidia GeForce RTX 3060 Ti FE TB3) Intel Core i7-1360P 1.6GHz
NVIDIA GeForce RTX 3060 Ti
38.1 [X] Geekom Mini IT11 (Nvidia GeForce RTX 3060 Ti FE TB3) Intel Core i7-11390H 3.4GHz
NVIDIA GeForce RTX 3060 Ti
38.4 41.4 [X] Nvidia GeForce RTX 3060 Ti FE AMD Ryzen 9 7900X 4.7GHz
NVIDIA GeForce RTX 3060 Ti
41.5 [X] Nvidia GeForce RTX 3060 Ti FE AMD Ryzen 9 7950X 4.5GHz
NVIDIA GeForce RTX 3060 Ti
~ 39 fps
NVIDIA GeForce RTX 3070:
238 [X] AMD Ryzen 9 5900X 3.7GHz
NVIDIA GeForce RTX 3070
min:
214 fps, max:
242 fps
238 [X] AMD Ryzen 9 5900X 3.7GHz
NVIDIA GeForce RTX 3070
min:
228 fps, max:
242 fps
240 ~ 239 fps
NVIDIA GeForce RTX 3060 Ti:
240 240 [X] Nvidia GeForce RTX 3060 Ti FE AMD Ryzen 9 7950X 4.5GHz
NVIDIA GeForce RTX 3060 Ti
min:
52 fps, P0.1:
145.8 fps, P1:
157.7 fps, max:
675 fps
~ 240 fps
100%
GeForce RTX 3050 Ti Laptop GPU:
69.3 [X] XMG Prototyp AMD Ryzen 5 5600H 3.3GHz
GeForce RTX 3050 Ti Laptop GPU
min:
42 fps
fps
224%
NVIDIA GeForce RTX 3070:
147 [X] AMD Ryzen 9 5900X 3.7GHz
NVIDIA GeForce RTX 3070
min:
99 fps, max:
180 fps
149 [X] AMD Ryzen 9 5900X 3.7GHz
NVIDIA GeForce RTX 3070
min:
128 fps, max:
174 fps
167.7 ~ 155 fps
221%
NVIDIA GeForce RTX 3060 Ti:
147 159.1 [X] Nvidia GeForce RTX 3060 Ti FE AMD Ryzen 9 7950X 4.5GHz
NVIDIA GeForce RTX 3060 Ti
min:
29.1 fps, P0.1:
114.9 fps, P1:
129.9 fps, max:
791 fps
~ 153 fps
100%
GeForce RTX 3050 Ti Laptop GPU:
52.8 [X] XMG Prototyp AMD Ryzen 5 5600H 3.3GHz
GeForce RTX 3050 Ti Laptop GPU
min:
42 fps
fps
229%
NVIDIA GeForce RTX 3070:
117 [X] AMD Ryzen 9 5900X 3.7GHz
NVIDIA GeForce RTX 3070
min:
100 fps, max:
135 fps
122 [X] AMD Ryzen 9 5900X 3.7GHz
NVIDIA GeForce RTX 3070
min:
103 fps, max:
138 fps
124.9 ~ 121 fps
212%
NVIDIA GeForce RTX 3060 Ti:
110 114.8 [X] Nvidia GeForce RTX 3060 Ti FE AMD Ryzen 9 7950X 4.5GHz
NVIDIA GeForce RTX 3060 Ti
min:
54.4 fps, P0.1:
88.5 fps, P1:
95.3 fps, max:
367 fps
~ 112 fps
100%
GeForce RTX 3050 Ti Laptop GPU:
34 [X] XMG Prototyp AMD Ryzen 5 5600H 3.3GHz
GeForce RTX 3050 Ti Laptop GPU
min:
26 fps
fps
238%
NVIDIA GeForce RTX 3070:
79.8 [X] AMD Ryzen 9 5900X 3.7GHz
NVIDIA GeForce RTX 3070
min:
68 fps, max:
91 fps
81.3 82.5 [X] AMD Ryzen 9 5900X 3.7GHz
NVIDIA GeForce RTX 3070
min:
72 fps, max:
96 fps
~ 81 fps
215%
NVIDIA GeForce RTX 3060 Ti:
71.9 73.6 [X] Nvidia GeForce RTX 3060 Ti FE AMD Ryzen 9 7950X 4.5GHz
NVIDIA GeForce RTX 3060 Ti
min:
46.9 fps, P0.1:
53.4 fps, P1:
62.6 fps, max:
103.7 fps
~ 73 fps
100%
GeForce RTX 3050 Ti Laptop GPU:
16.5 [X] XMG Prototyp AMD Ryzen 5 5600H 3.3GHz
GeForce RTX 3050 Ti Laptop GPU
min:
12 fps
fps
248%
NVIDIA GeForce RTX 3070:
40.6 41 [X] AMD Ryzen 9 5900X 3.7GHz
NVIDIA GeForce RTX 3070
42.3 [X] AMD Ryzen 9 5900X 3.7GHz
NVIDIA GeForce RTX 3070
min:
37 fps, max:
49 fps
~ 41 fps
218%
NVIDIA GeForce RTX 3060 Ti:
36.1 36.4 [X] Nvidia GeForce RTX 3060 Ti FE AMD Ryzen 9 7950X 4.5GHz
NVIDIA GeForce RTX 3060 Ti
min:
29.5 fps, P0.1:
29.7 fps, P1:
31.3 fps, max:
45.4 fps
~ 36 fps
100%
GeForce RTX 3050 Ti Laptop GPU:
178 fps
209%
NVIDIA GeForce RTX 3070:
371.5 fps
206%
NVIDIA GeForce RTX 3060 Ti:
367.4 fps
100%
GeForce RTX 3050 Ti Laptop GPU:
77 fps
268%
NVIDIA GeForce RTX 3070:
206.4 fps
254%
NVIDIA GeForce RTX 3060 Ti:
195.6 fps
100%
GeForce RTX 3050 Ti Laptop GPU:
52 fps
262%
NVIDIA GeForce RTX 3070:
136 fps
245%
NVIDIA GeForce RTX 3060 Ti:
127.3 fps
100%
GeForce RTX 3050 Ti Laptop GPU:
37 fps
280%
NVIDIA GeForce RTX 3070:
103.5 fps
251%
NVIDIA GeForce RTX 3060 Ti:
92.8 fps
NVIDIA GeForce RTX 3070:
67.5 fps
NVIDIA GeForce RTX 3060 Ti:
59 fps
NVIDIA GeForce RTX 3070:
33.1 fps
NVIDIA GeForce RTX 3060 Ti:
28.8 fps
NVIDIA GeForce RTX 3070:
264 [X] AMD Ryzen 9 5900X 3.7GHz
NVIDIA GeForce RTX 3070
P1:
138.9 fps
fps
NVIDIA GeForce RTX 3070:
192 [X] AMD Ryzen 9 5900X 3.7GHz
NVIDIA GeForce RTX 3070
P1:
135.1 fps
fps
NVIDIA GeForce RTX 3070:
168 [X] AMD Ryzen 9 5900X 3.7GHz
NVIDIA GeForce RTX 3070
P1:
129.9 fps
fps
NVIDIA GeForce RTX 3070:
163 [X] AMD Ryzen 9 5900X 3.7GHz
NVIDIA GeForce RTX 3070
P1:
119 fps
fps
NVIDIA GeForce RTX 3070:
110 [X] AMD Ryzen 9 5900X 3.7GHz
NVIDIA GeForce RTX 3070
P1:
87.7 fps
fps
NVIDIA GeForce RTX 3070:
56.7 [X] AMD Ryzen 9 5900X 3.7GHz
NVIDIA GeForce RTX 3070
P1:
51.8 fps
fps
NVIDIA GeForce RTX 3070:
115 [X] AMD Ryzen 9 5900X 3.7GHz
NVIDIA GeForce RTX 3070
min:
103 fps, max:
135 fps
167.5 170 [X] AMD Ryzen 9 5900X 3.7GHz
NVIDIA GeForce RTX 3070
min:
143 fps, max:
189 fps
~ 151 fps
NVIDIA GeForce RTX 3060 Ti:
134 fps
100%
GeForce RTX 3050 Ti Laptop GPU:
94.3 [X] XMG Prototyp AMD Ryzen 5 5600H 3.3GHz
GeForce RTX 3050 Ti Laptop GPU
min:
54.8 fps, P0.1:
59.4 fps, P1:
67.2 fps, max:
118 fps
fps
150%
NVIDIA GeForce RTX 3070:
112 [X] AMD Ryzen 9 5900X 3.7GHz
NVIDIA GeForce RTX 3070
min:
94 fps, max:
137 fps
147 [X] AMD Ryzen 9 5900X 3.7GHz
NVIDIA GeForce RTX 3070
min:
118 fps, max:
170 fps
164.1 ~ 141 fps
143%
NVIDIA GeForce RTX 3060 Ti:
135 fps
100%
GeForce RTX 3050 Ti Laptop GPU:
65.8 [X] XMG Prototyp AMD Ryzen 5 5600H 3.3GHz
GeForce RTX 3050 Ti Laptop GPU
min:
22.1 fps, P0.1:
22.6 fps, P1:
39.6 fps, max:
87.4 fps
fps
160%
NVIDIA GeForce RTX 3070:
82.7 [X] AMD Ryzen 9 5900X 3.7GHz
NVIDIA GeForce RTX 3070
min:
66 fps, max:
107 fps
100 [X] AMD Ryzen 9 5900X 3.7GHz
NVIDIA GeForce RTX 3070
min:
85 fps, max:
121 fps
130.8 ~ 105 fps
143%
NVIDIA GeForce RTX 3060 Ti:
94.1 fps
100%
GeForce RTX 3050 Ti Laptop GPU:
35.2 [X] XMG Prototyp AMD Ryzen 5 5600H 3.3GHz
GeForce RTX 3050 Ti Laptop GPU
min:
20.2 fps, P0.1:
22.2 fps, P1:
24.9 fps, max:
50.5 fps
fps
165%
NVIDIA GeForce RTX 3070:
46.5 [X] AMD Ryzen 9 5900X 3.7GHz
NVIDIA GeForce RTX 3070
min:
34 fps, max:
66 fps
52 [X] AMD Ryzen 9 5900X 3.7GHz
NVIDIA GeForce RTX 3070
min:
42 fps, max:
66 fps
74.7 ~ 58 fps
154%
NVIDIA GeForce RTX 3060 Ti:
54.2 fps
100%
GeForce RTX 3050 Ti Laptop GPU:
25 [X] XMG Prototyp AMD Ryzen 5 5600H 3.3GHz
GeForce RTX 3050 Ti Laptop GPU
min:
17.5 fps, P0.1:
17.7 fps, P1:
20.5 fps, max:
42.1 fps
fps
220%
NVIDIA GeForce RTX 3070:
46.2 [X] AMD Ryzen 9 5900X 3.7GHz
NVIDIA GeForce RTX 3070
min:
37 fps, max:
58 fps
50.5 [X] AMD Ryzen 9 5900X 3.7GHz
NVIDIA GeForce RTX 3070
min:
42 fps, max:
66 fps
69.3 ~ 55 fps
162%
NVIDIA GeForce RTX 3060 Ti:
40.6 fps
100%
GeForce RTX 3050 Ti Laptop GPU:
15.3 [X] XMG Prototyp AMD Ryzen 5 5600H 3.3GHz
GeForce RTX 3050 Ti Laptop GPU
min:
12.8 fps, P0.1:
12.9 fps, P1:
13.5 fps, max:
20.2 fps
fps
242%
NVIDIA GeForce RTX 3070:
34.3 [X] AMD Ryzen 9 5900X 3.7GHz
NVIDIA GeForce RTX 3070
min:
25 fps, max:
40 fps
35 [X] AMD Ryzen 9 5900X 3.7GHz
NVIDIA GeForce RTX 3070
min:
23 fps, max:
40 fps
41.8 ~ 37 fps
225%
NVIDIA GeForce RTX 3060 Ti:
34.4 fps
NVIDIA GeForce RTX 3070:
220 [X] AMD Ryzen 9 5900X 3.7GHz
NVIDIA GeForce RTX 3070
fps
NVIDIA GeForce RTX 3060 Ti:
225 fps
100%
GeForce RTX 3050 Ti Laptop GPU:
94 [X] XMG Prototyp AMD Ryzen 5 5600H 3.3GHz
GeForce RTX 3050 Ti Laptop GPU
fps
184%
NVIDIA GeForce RTX 3070:
173 [X] AMD Ryzen 9 5900X 3.7GHz
NVIDIA GeForce RTX 3070
fps
183%
NVIDIA GeForce RTX 3060 Ti:
172 fps
100%
GeForce RTX 3050 Ti Laptop GPU:
76 [X] XMG Prototyp AMD Ryzen 5 5600H 3.3GHz
GeForce RTX 3050 Ti Laptop GPU
fps
187%
NVIDIA GeForce RTX 3070:
142 [X] AMD Ryzen 9 5900X 3.7GHz
NVIDIA GeForce RTX 3070
fps
187%
NVIDIA GeForce RTX 3060 Ti:
142 fps
100%
GeForce RTX 3050 Ti Laptop GPU:
58 [X] XMG Prototyp AMD Ryzen 5 5600H 3.3GHz
GeForce RTX 3050 Ti Laptop GPU
fps
193%
NVIDIA GeForce RTX 3070:
112 [X] AMD Ryzen 9 5900X 3.7GHz
NVIDIA GeForce RTX 3070
fps
188%
NVIDIA GeForce RTX 3060 Ti:
109 fps
100%
GeForce RTX 3050 Ti Laptop GPU:
39 [X] XMG Prototyp AMD Ryzen 5 5600H 3.3GHz
GeForce RTX 3050 Ti Laptop GPU
fps
210%
NVIDIA GeForce RTX 3070:
82 [X] AMD Ryzen 9 5900X 3.7GHz
NVIDIA GeForce RTX 3070
fps
198%
NVIDIA GeForce RTX 3060 Ti:
77.3 fps
100%
GeForce RTX 3050 Ti Laptop GPU:
20 [X] XMG Prototyp AMD Ryzen 5 5600H 3.3GHz
GeForce RTX 3050 Ti Laptop GPU
fps
245%
NVIDIA GeForce RTX 3070:
49 [X] AMD Ryzen 9 5900X 3.7GHz
NVIDIA GeForce RTX 3070
fps
219%
NVIDIA GeForce RTX 3060 Ti:
43.7 fps
100%
GeForce RTX 3050 Ti Laptop GPU:
94 fps
152%
NVIDIA GeForce RTX 3070:
126 [X] Intel Core i7-10700 2.9GHz
NVIDIA GeForce RTX 3070
min:
96 fps, max:
186 fps
131 [X] AMD Ryzen 9 5900X 3.7GHz
NVIDIA GeForce RTX 3070
min:
91 fps, max:
206 fps
152 [X] AMD Ryzen 9 5900X 3.7GHz
NVIDIA GeForce RTX 3070
min:
101 fps, max:
237 fps
162 ~ 143 fps
155%
NVIDIA GeForce RTX 3060 Ti:
101 [X] Geekom Mini IT11 (Nvidia GeForce RTX 3060 Ti FE TB3) Intel Core i7-11390H 3.4GHz
NVIDIA GeForce RTX 3060 Ti
min:
71 fps, max:
146 fps
122 [X] Huawei MateBook X Pro 2023 (Nvidia GeForce RTX 3060 Ti FE TB3) Intel Core i7-1360P 1.6GHz
NVIDIA GeForce RTX 3060 Ti
min:
92 fps, max:
179 fps
123 133 [X] Intel NUC 12 Pro Kit NUC12WSKi7 Intel Core i7-1260P 1.5GHz
NVIDIA GeForce RTX 3060 Ti
min:
97 fps, max:
193 fps
197 [X] Nvidia GeForce RTX 3060 Ti FE AMD Ryzen 9 7950X 4.5GHz
NVIDIA GeForce RTX 3060 Ti
min:
146 fps, max:
299 fps
201 [X] Nvidia GeForce RTX 3060 Ti FE AMD Ryzen 9 7900X 4.7GHz
NVIDIA GeForce RTX 3060 Ti
min:
148 fps, max:
318 fps
~ 146 fps
100%
GeForce RTX 3050 Ti Laptop GPU:
80 87 [X] XMG Prototyp AMD Ryzen 5 5600H 3.3GHz
GeForce RTX 3050 Ti Laptop GPU
min:
70 fps
~ 84 fps
148%
NVIDIA GeForce RTX 3070:
110 [X] Intel Core i7-10700 2.9GHz
NVIDIA GeForce RTX 3070
min:
86 fps, max:
163 fps
112 [X] AMD Ryzen 9 5900X 3.7GHz
NVIDIA GeForce RTX 3070
min:
84 fps, max:
166 fps
135 [X] AMD Ryzen 9 5900X 3.7GHz
NVIDIA GeForce RTX 3070
min:
103 fps, max:
199 fps
140 ~ 124 fps
150%
NVIDIA GeForce RTX 3060 Ti:
88 [X] Geekom Mini IT11 (Nvidia GeForce RTX 3060 Ti FE TB3) Intel Core i7-11390H 3.4GHz
NVIDIA GeForce RTX 3060 Ti
min:
68 fps, max:
130 fps
106 [X] Huawei MateBook X Pro 2023 (Nvidia GeForce RTX 3060 Ti FE TB3) Intel Core i7-1360P 1.6GHz
NVIDIA GeForce RTX 3060 Ti
min:
84 fps, max:
152 fps
111 115 [X] Intel NUC 12 Pro Kit NUC12WSKi7 Intel Core i7-1260P 1.5GHz
NVIDIA GeForce RTX 3060 Ti
min:
92 fps, max:
163 fps
167 [X] Nvidia GeForce RTX 3060 Ti FE AMD Ryzen 9 7900X 4.7GHz
NVIDIA GeForce RTX 3060 Ti
min:
124 fps, max:
218 fps
168 [X] Nvidia GeForce RTX 3060 Ti FE AMD Ryzen 9 7950X 4.5GHz
NVIDIA GeForce RTX 3060 Ti
min:
137 fps, max:
226 fps
~ 126 fps
100%
GeForce RTX 3050 Ti Laptop GPU:
78 85 [X] XMG Prototyp AMD Ryzen 5 5600H 3.3GHz
GeForce RTX 3050 Ti Laptop GPU
min:
57 fps
~ 82 fps
148%
NVIDIA GeForce RTX 3070:
106 [X] Intel Core i7-10700 2.9GHz
NVIDIA GeForce RTX 3070
min:
82 fps, max:
154 fps
112 [X] AMD Ryzen 9 5900X 3.7GHz
NVIDIA GeForce RTX 3070
min:
80 fps, max:
177 fps
130 [X] AMD Ryzen 9 5900X 3.7GHz
NVIDIA GeForce RTX 3070
min:
99 fps, max:
188 fps
135 ~ 121 fps
146%
NVIDIA GeForce RTX 3060 Ti:
84 [X] Geekom Mini IT11 (Nvidia GeForce RTX 3060 Ti FE TB3) Intel Core i7-11390H 3.4GHz
NVIDIA GeForce RTX 3060 Ti
min:
66 fps, max:
124 fps
102 [X] Huawei MateBook X Pro 2023 (Nvidia GeForce RTX 3060 Ti FE TB3) Intel Core i7-1360P 1.6GHz
NVIDIA GeForce RTX 3060 Ti
min:
80 fps, max:
145 fps
108 111 [X] Intel NUC 12 Pro Kit NUC12WSKi7 Intel Core i7-1260P 1.5GHz
NVIDIA GeForce RTX 3060 Ti
min:
89 fps, max:
152 fps
158 [X] Nvidia GeForce RTX 3060 Ti FE AMD Ryzen 9 7900X 4.7GHz
NVIDIA GeForce RTX 3060 Ti
min:
117 fps, max:
201 fps
159 [X] Nvidia GeForce RTX 3060 Ti FE AMD Ryzen 9 7950X 4.5GHz
NVIDIA GeForce RTX 3060 Ti
min:
128 fps, max:
207 fps
~ 120 fps
100%
GeForce RTX 3050 Ti Laptop GPU:
70 75 [X] XMG Prototyp AMD Ryzen 5 5600H 3.3GHz
GeForce RTX 3050 Ti Laptop GPU
min:
49 fps
~ 73 fps
147%
NVIDIA GeForce RTX 3070:
95 [X] Intel Core i7-10700 2.9GHz
NVIDIA GeForce RTX 3070
min:
66 fps, max:
149 fps
97 [X] AMD Ryzen 9 5900X 3.7GHz
NVIDIA GeForce RTX 3070
min:
61 fps, max:
166 fps
116 [X] AMD Ryzen 9 5900X 3.7GHz
NVIDIA GeForce RTX 3070
min:
77 fps, max:
187 fps
121 ~ 107 fps
148%
NVIDIA GeForce RTX 3060 Ti:
76 [X] Geekom Mini IT11 (Nvidia GeForce RTX 3060 Ti FE TB3) Intel Core i7-11390H 3.4GHz
NVIDIA GeForce RTX 3060 Ti
min:
54 fps, max:
121 fps
92 [X] Huawei MateBook X Pro 2023 (Nvidia GeForce RTX 3060 Ti FE TB3) Intel Core i7-1360P 1.6GHz
NVIDIA GeForce RTX 3060 Ti
min:
67 fps, max:
138 fps
99 101 [X] Intel NUC 12 Pro Kit NUC12WSKi7 Intel Core i7-1260P 1.5GHz
NVIDIA GeForce RTX 3060 Ti
min:
74 fps, max:
147 fps
140 [X] Nvidia GeForce RTX 3060 Ti FE AMD Ryzen 9 7900X 4.7GHz
NVIDIA GeForce RTX 3060 Ti
min:
94 fps, max:
190 fps
142 [X] Nvidia GeForce RTX 3060 Ti FE AMD Ryzen 9 7950X 4.5GHz
NVIDIA GeForce RTX 3060 Ti
min:
103 fps, max:
196 fps
~ 108 fps
100%
GeForce RTX 3050 Ti Laptop GPU:
60 [X] XMG Prototyp AMD Ryzen 5 5600H 3.3GHz
GeForce RTX 3050 Ti Laptop GPU
min:
45 fps
fps
170%
NVIDIA GeForce RTX 3070:
92 [X] Intel Core i7-10700 2.9GHz
NVIDIA GeForce RTX 3070
min:
67 fps, max:
138 fps
94 [X] AMD Ryzen 9 5900X 3.7GHz
NVIDIA GeForce RTX 3070
min:
64 fps, max:
138 fps
107 [X] AMD Ryzen 9 5900X 3.7GHz
NVIDIA GeForce RTX 3070
min:
76 fps, max:
148 fps
113 ~ 102 fps
163%
NVIDIA GeForce RTX 3060 Ti:
73 [X] Geekom Mini IT11 (Nvidia GeForce RTX 3060 Ti FE TB3) Intel Core i7-11390H 3.4GHz
NVIDIA GeForce RTX 3060 Ti
87 [X] Huawei MateBook X Pro 2023 (Nvidia GeForce RTX 3060 Ti FE TB3) Intel Core i7-1360P 1.6GHz
NVIDIA GeForce RTX 3060 Ti
min:
65 fps, max:
117 fps
92 [X] Intel NUC 12 Pro Kit NUC12WSKi7 Intel Core i7-1260P 1.5GHz
NVIDIA GeForce RTX 3060 Ti
min:
73 fps, max:
119 fps
94 119 [X] Nvidia GeForce RTX 3060 Ti FE AMD Ryzen 9 7900X 4.7GHz
NVIDIA GeForce RTX 3060 Ti
min:
100 fps, max:
144 fps
121 [X] Nvidia GeForce RTX 3060 Ti FE AMD Ryzen 9 7950X 4.5GHz
NVIDIA GeForce RTX 3060 Ti
min:
92 fps, max:
148 fps
~ 98 fps
100%
GeForce RTX 3050 Ti Laptop GPU:
28 [X] XMG Prototyp AMD Ryzen 5 5600H 3.3GHz
GeForce RTX 3050 Ti Laptop GPU
min:
22 fps
fps
257%
NVIDIA GeForce RTX 3070:
70 [X] AMD Ryzen 9 5900X 3.7GHz
NVIDIA GeForce RTX 3070
min:
52 fps, max:
86 fps
70 [X] Intel Core i7-10700 2.9GHz
NVIDIA GeForce RTX 3070
min:
58 fps, max:
86 fps
72 [X] AMD Ryzen 9 5900X 3.7GHz
NVIDIA GeForce RTX 3070
min:
61 fps, max:
86 fps
74 ~ 72 fps
225%
NVIDIA GeForce RTX 3060 Ti:
56 [X] Geekom Mini IT11 (Nvidia GeForce RTX 3060 Ti FE TB3) Intel Core i7-11390H 3.4GHz
NVIDIA GeForce RTX 3060 Ti
min:
47 fps, max:
68 fps
59 [X] Intel NUC 12 Pro Kit NUC12WSKi7 Intel Core i7-1260P 1.5GHz
NVIDIA GeForce RTX 3060 Ti
min:
50 fps, max:
71 fps
60 [X] Huawei MateBook X Pro 2023 (Nvidia GeForce RTX 3060 Ti FE TB3) Intel Core i7-1360P 1.6GHz
NVIDIA GeForce RTX 3060 Ti
min:
50 fps, max:
72 fps
65 68 [X] Nvidia GeForce RTX 3060 Ti FE AMD Ryzen 9 7900X 4.7GHz
NVIDIA GeForce RTX 3060 Ti
min:
57 fps, max:
82 fps
69 [X] Nvidia GeForce RTX 3060 Ti FE AMD Ryzen 9 7950X 4.5GHz
NVIDIA GeForce RTX 3060 Ti
min:
57 fps, max:
83 fps
~ 63 fps
100%
GeForce RTX 3050 Ti Laptop GPU:
126.3 fps
148%
NVIDIA GeForce RTX 3070:
156 [X] AMD Ryzen 9 5900X 3.7GHz
NVIDIA GeForce RTX 3070
min:
84.62 fps, max:
247.28 fps
166 [X] Intel Core i7-10700 2.9GHz
NVIDIA GeForce RTX 3070
min:
92.98 fps, max:
251.64 fps
193 [X] AMD Ryzen 9 5900X 3.7GHz
NVIDIA GeForce RTX 3070
min:
108.31 fps, max:
293.17 fps
197 224 ~ 187 fps
162%
NVIDIA GeForce RTX 3060 Ti:
133.4 [X] Huawei MateBook X Pro 2023 (Nvidia GeForce RTX 3060 Ti FE TB3) Intel Core i7-1360P 1.6GHz
NVIDIA GeForce RTX 3060 Ti
min:
55.29 fps, max:
246.91 fps
144.5 [X] Intel NUC 12 Pro Kit NUC12WSKi7 Intel Core i7-1260P 1.5GHz
NVIDIA GeForce RTX 3060 Ti
min:
59.62 fps, max:
259.74 fps
193 273 [X] Nvidia GeForce RTX 3060 Ti FE AMD Ryzen 9 7950X 4.5GHz
NVIDIA GeForce RTX 3060 Ti
min:
116.28 fps, max:
440.33 fps
276 [X] Nvidia GeForce RTX 3060 Ti FE AMD Ryzen 9 7900X 4.7GHz
NVIDIA GeForce RTX 3060 Ti
min:
119.63 fps, max:
460.83 fps
~ 204 fps
100%
GeForce RTX 3050 Ti Laptop GPU:
71.2 72.3 [X] XMG Prototyp AMD Ryzen 5 5600H 3.3GHz
GeForce RTX 3050 Ti Laptop GPU
min:
36 fps
~ 72 fps
203%
NVIDIA GeForce RTX 3070:
136 [X] AMD Ryzen 9 5900X 3.7GHz
NVIDIA GeForce RTX 3070
min:
62.19 fps, max:
220.9 fps
136 [X] Intel Core i7-10700 2.9GHz
NVIDIA GeForce RTX 3070
min:
61.07 fps, max:
208.64 fps
148 [X] AMD Ryzen 9 5900X 3.7GHz
NVIDIA GeForce RTX 3070
min:
71.58 fps, max:
228.99 fps
154 156.8 ~ 146 fps
174%
NVIDIA GeForce RTX 3060 Ti:
89.4 [X] Huawei MateBook X Pro 2023 (Nvidia GeForce RTX 3060 Ti FE TB3) Intel Core i7-1360P 1.6GHz
NVIDIA GeForce RTX 3060 Ti
min:
34.27 fps, max:
165.98 fps
91.9 [X] Intel NUC 12 Pro Kit NUC12WSKi7 Intel Core i7-1260P 1.5GHz
NVIDIA GeForce RTX 3060 Ti
min:
36.09 fps, max:
169.15 fps
139 148.9 [X] Nvidia GeForce RTX 3060 Ti FE AMD Ryzen 9 7900X 4.7GHz
NVIDIA GeForce RTX 3060 Ti
min:
68.55 fps, max:
251.64 fps
153.6 [X] Nvidia GeForce RTX 3060 Ti FE AMD Ryzen 9 7950X 4.5GHz
NVIDIA GeForce RTX 3060 Ti
min:
66.61 fps, max:
270.42 fps
~ 125 fps
100%
GeForce RTX 3050 Ti Laptop GPU:
55 [X] XMG Prototyp AMD Ryzen 5 5600H 3.3GHz
GeForce RTX 3050 Ti Laptop GPU
min:
29 fps
55.3 ~ 55 fps
213%
NVIDIA GeForce RTX 3070:
113 [X] AMD Ryzen 9 5900X 3.7GHz
NVIDIA GeForce RTX 3070
min:
54.14 fps, max:
178.54 fps
116 [X] Intel Core i7-10700 2.9GHz
NVIDIA GeForce RTX 3070
min:
58.17 fps, max:
182.15 fps
117 [X] AMD Ryzen 9 5900X 3.7GHz
NVIDIA GeForce RTX 3070
min:
53.16 fps, max:
187.55 fps
118 121.9 ~ 117 fps
171%
NVIDIA GeForce RTX 3060 Ti:
67.7 [X] Huawei MateBook X Pro 2023 (Nvidia GeForce RTX 3060 Ti FE TB3) Intel Core i7-1360P 1.6GHz
NVIDIA GeForce RTX 3060 Ti
min:
27.46 fps, max:
125.28 fps
70.5 [X] Intel NUC 12 Pro Kit NUC12WSKi7 Intel Core i7-1260P 1.5GHz
NVIDIA GeForce RTX 3060 Ti
min:
29.24 fps, max:
123.76 fps
105 111.7 [X] Nvidia GeForce RTX 3060 Ti FE AMD Ryzen 9 7900X 4.7GHz
NVIDIA GeForce RTX 3060 Ti
min:
54.6 fps, max:
202.31 fps
116 [X] Nvidia GeForce RTX 3060 Ti FE AMD Ryzen 9 7950X 4.5GHz
NVIDIA GeForce RTX 3060 Ti
min:
54.44 fps, max:
205 fps
~ 94 fps
100%
GeForce RTX 3050 Ti Laptop GPU:
43.2 [X] XMG Prototyp AMD Ryzen 5 5600H 3.3GHz
GeForce RTX 3050 Ti Laptop GPU
min:
25 fps
43.5 ~ 43 fps
219%
NVIDIA GeForce RTX 3070:
91.3 [X] AMD Ryzen 9 5900X 3.7GHz
NVIDIA GeForce RTX 3070
min:
46.36 fps, max:
152.74 fps
93.1 [X] Intel Core i7-10700 2.9GHz
NVIDIA GeForce RTX 3070
min:
45.73 fps, max:
151.06 fps
93.6 93.7 [X] AMD Ryzen 9 5900X 3.7GHz
NVIDIA GeForce RTX 3070
min:
46.52 fps, max:
161.6 fps
97.7 ~ 94 fps
172%
NVIDIA GeForce RTX 3060 Ti:
51.3 [X] Huawei MateBook X Pro 2023 (Nvidia GeForce RTX 3060 Ti FE TB3) Intel Core i7-1360P 1.6GHz
NVIDIA GeForce RTX 3060 Ti
min:
23.19 fps, max:
99.6 fps
52.9 [X] Intel NUC 12 Pro Kit NUC12WSKi7 Intel Core i7-1260P 1.5GHz
NVIDIA GeForce RTX 3060 Ti
min:
24.48 fps, max:
97.96 fps
84.9 88 [X] Nvidia GeForce RTX 3060 Ti FE AMD Ryzen 9 7900X 4.7GHz
NVIDIA GeForce RTX 3060 Ti
min:
46.88 fps, max:
149.7 fps
91.5 [X] Nvidia GeForce RTX 3060 Ti FE AMD Ryzen 9 7950X 4.5GHz
NVIDIA GeForce RTX 3060 Ti
min:
46.9 fps, max:
167.64 fps
~ 74 fps
100%
GeForce RTX 3050 Ti Laptop GPU:
34.2 [X] XMG Prototyp AMD Ryzen 5 5600H 3.3GHz
GeForce RTX 3050 Ti Laptop GPU
min:
21 fps
fps
222%
NVIDIA GeForce RTX 3070:
74.4 [X] AMD Ryzen 9 5900X 3.7GHz
NVIDIA GeForce RTX 3070
min:
38.95 fps, max:
129.85 fps
74.8 [X] AMD Ryzen 9 5900X 3.7GHz
NVIDIA GeForce RTX 3070
min:
41.41 fps, max:
120.5 fps
75.4 76.1 [X] Intel Core i7-10700 2.9GHz
NVIDIA GeForce RTX 3070
min:
40.35 fps, max:
120.19 fps
78.3 ~ 76 fps
175%
NVIDIA GeForce RTX 3060 Ti:
45 [X] Huawei MateBook X Pro 2023 (Nvidia GeForce RTX 3060 Ti FE TB3) Intel Core i7-1360P 1.6GHz
NVIDIA GeForce RTX 3060 Ti
min:
21.72 fps, max:
87.89 fps
46.1 [X] Intel NUC 12 Pro Kit NUC12WSKi7 Intel Core i7-1260P 1.5GHz
NVIDIA GeForce RTX 3060 Ti
min:
22.9 fps, max:
80.71 fps
66.2 69.8 [X] Nvidia GeForce RTX 3060 Ti FE AMD Ryzen 9 7900X 4.7GHz
NVIDIA GeForce RTX 3060 Ti
min:
39.94 fps, max:
120.47 fps
72 [X] Nvidia GeForce RTX 3060 Ti FE AMD Ryzen 9 7950X 4.5GHz
NVIDIA GeForce RTX 3060 Ti
min:
40.41 fps, max:
128.37 fps
~ 60 fps
100%
GeForce RTX 3050 Ti Laptop GPU:
21.1 [X] XMG Prototyp AMD Ryzen 5 5600H 3.3GHz
GeForce RTX 3050 Ti Laptop GPU
min:
14 fps
fps
232%
NVIDIA GeForce RTX 3070:
48.3 48.6 [X] AMD Ryzen 9 5900X 3.7GHz
NVIDIA GeForce RTX 3070
min:
29.82 fps, max:
99.64 fps
49 [X] Intel Core i7-10700 2.9GHz
NVIDIA GeForce RTX 3070
min:
30.54 fps, max:
96.98 fps
49.1 [X] AMD Ryzen 9 5900X 3.7GHz
NVIDIA GeForce RTX 3070
min:
30.24 fps, max:
89.89 fps
49.7 ~ 49 fps
190%
NVIDIA GeForce RTX 3060 Ti:
33.5 [X] Huawei MateBook X Pro 2023 (Nvidia GeForce RTX 3060 Ti FE TB3) Intel Core i7-1360P 1.6GHz
NVIDIA GeForce RTX 3060 Ti
min:
18.19 fps, max:
59.67 fps
33.8 [X] Intel NUC 12 Pro Kit NUC12WSKi7 Intel Core i7-1260P 1.5GHz
NVIDIA GeForce RTX 3060 Ti
min:
18.65 fps, max:
53.84 fps
42.7 44.4 [X] Nvidia GeForce RTX 3060 Ti FE AMD Ryzen 9 7900X 4.7GHz
NVIDIA GeForce RTX 3060 Ti
min:
28.19 fps, max:
70.96 fps
44.8 [X] Nvidia GeForce RTX 3060 Ti FE AMD Ryzen 9 7950X 4.5GHz
NVIDIA GeForce RTX 3060 Ti
min:
28.26 fps, max:
72.2 fps
~ 40 fps
NVIDIA GeForce RTX 3070:
144 [X] AMD Ryzen 9 5900X 3.7GHz
NVIDIA GeForce RTX 3070
144 [X] AMD Ryzen 9 5900X 3.7GHz
NVIDIA GeForce RTX 3070
~ 144 fps
100%
GeForce RTX 3050 Ti Laptop GPU:
143 [X] XMG Prototyp AMD Ryzen 5 5600H 3.3GHz
GeForce RTX 3050 Ti Laptop GPU
min:
102 fps, P0.1:
109 fps, P1:
118 fps, max:
227 fps
fps
101%
NVIDIA GeForce RTX 3070:
144 [X] AMD Ryzen 9 5900X 3.7GHz
NVIDIA GeForce RTX 3070
144 [X] AMD Ryzen 9 5900X 3.7GHz
NVIDIA GeForce RTX 3070
~ 144 fps
100%
GeForce RTX 3050 Ti Laptop GPU:
118 [X] XMG Prototyp AMD Ryzen 5 5600H 3.3GHz
GeForce RTX 3050 Ti Laptop GPU
min:
86.5 fps, P0.1:
98 fps, P1:
104 fps, max:
196 fps
fps
122%
NVIDIA GeForce RTX 3070:
144 [X] AMD Ryzen 9 5900X 3.7GHz
NVIDIA GeForce RTX 3070
144 [X] AMD Ryzen 9 5900X 3.7GHz
NVIDIA GeForce RTX 3070
~ 144 fps
100%
GeForce RTX 3050 Ti Laptop GPU:
109 [X] XMG Prototyp AMD Ryzen 5 5600H 3.3GHz
GeForce RTX 3050 Ti Laptop GPU
min:
19.6 fps, P0.1:
20.9 fps, P1:
94.4 fps, max:
150 fps
fps
132%
NVIDIA GeForce RTX 3070:
144 [X] AMD Ryzen 9 5900X 3.7GHz
NVIDIA GeForce RTX 3070
144 [X] AMD Ryzen 9 5900X 3.7GHz
NVIDIA GeForce RTX 3070
min:
142 fps, max:
145 fps
~ 144 fps
100%
GeForce RTX 3050 Ti Laptop GPU:
80.3 [X] XMG Prototyp AMD Ryzen 5 5600H 3.3GHz
GeForce RTX 3050 Ti Laptop GPU
min:
18.1 fps, P0.1:
19.6 fps, P1:
69.8 fps, max:
149 fps
fps
179%
NVIDIA GeForce RTX 3070:
144 [X] AMD Ryzen 9 5900X 3.7GHz
NVIDIA GeForce RTX 3070
min:
142 fps, max:
145 fps
144 [X] AMD Ryzen 9 5900X 3.7GHz
NVIDIA GeForce RTX 3070
min:
141 fps, max:
145 fps
~ 144 fps
100%
GeForce RTX 3050 Ti Laptop GPU:
47.2 [X] XMG Prototyp AMD Ryzen 5 5600H 3.3GHz
GeForce RTX 3050 Ti Laptop GPU
min:
14.3 fps, P0.1:
15.7 fps, P1:
41.7 fps, max:
63.4 fps
fps
227%
NVIDIA GeForce RTX 3070:
106 [X] AMD Ryzen 9 5900X 3.7GHz
NVIDIA GeForce RTX 3070
min:
97 fps, max:
119 fps
107 [X] AMD Ryzen 9 5900X 3.7GHz
NVIDIA GeForce RTX 3070
min:
98 fps, max:
117 fps
~ 107 fps
NVIDIA GeForce RTX 3070:
177.5 [X] AMD Ryzen 9 5900X 3.7GHz
NVIDIA GeForce RTX 3070
188.9 [X] AMD Ryzen 9 5900X 3.7GHz
NVIDIA GeForce RTX 3070
~ 183 fps
NVIDIA GeForce RTX 3060 Ti:
181 fps
100%
GeForce RTX 3050 Ti Laptop GPU:
108 [X] XMG Prototyp AMD Ryzen 5 5600H 3.3GHz
GeForce RTX 3050 Ti Laptop GPU
min:
42.5 fps, P0.1:
49.3 fps, P1:
58.2 fps, max:
244 fps
fps
138%
NVIDIA GeForce RTX 3070:
144.3 [X] AMD Ryzen 9 5900X 3.7GHz
NVIDIA GeForce RTX 3070
154.3 [X] AMD Ryzen 9 5900X 3.7GHz
NVIDIA GeForce RTX 3070
~ 149 fps
134%
NVIDIA GeForce RTX 3060 Ti:
145 fps
100%
GeForce RTX 3050 Ti Laptop GPU:
97.6 [X] XMG Prototyp AMD Ryzen 5 5600H 3.3GHz
GeForce RTX 3050 Ti Laptop GPU
min:
53.2 fps, P0.1:
58.8 fps, P1:
69.2 fps, max:
180 fps
fps
135%
NVIDIA GeForce RTX 3070:
125.8 [X] AMD Ryzen 9 5900X 3.7GHz
NVIDIA GeForce RTX 3070
137.4 [X] AMD Ryzen 9 5900X 3.7GHz
NVIDIA GeForce RTX 3070
~ 132 fps
127%
NVIDIA GeForce RTX 3060 Ti:
124 fps
100%
GeForce RTX 3050 Ti Laptop GPU:
89.3 [X] XMG Prototyp AMD Ryzen 5 5600H 3.3GHz
GeForce RTX 3050 Ti Laptop GPU
min:
48.5 fps, P0.1:
53.2 fps, P1:
63.6 fps, max:
179 fps
fps
133%
NVIDIA GeForce RTX 3070:
113.6 [X] AMD Ryzen 9 5900X 3.7GHz
NVIDIA GeForce RTX 3070
125.2 [X] AMD Ryzen 9 5900X 3.7GHz
NVIDIA GeForce RTX 3070
~ 119 fps
128%
NVIDIA GeForce RTX 3060 Ti:
114 fps
100%
GeForce RTX 3050 Ti Laptop GPU:
69.4 [X] XMG Prototyp AMD Ryzen 5 5600H 3.3GHz
GeForce RTX 3050 Ti Laptop GPU
min:
41.1 fps, P0.1:
48.1 fps, P1:
50.8 fps, max:
157 fps
fps
148%
NVIDIA GeForce RTX 3070:
98.8 [X] AMD Ryzen 9 5900X 3.7GHz
NVIDIA GeForce RTX 3070
106.8 [X] AMD Ryzen 9 5900X 3.7GHz
NVIDIA GeForce RTX 3070
~ 103 fps
141%
NVIDIA GeForce RTX 3060 Ti:
97.9 fps
100%
GeForce RTX 3050 Ti Laptop GPU:
38.4 [X] XMG Prototyp AMD Ryzen 5 5600H 3.3GHz
GeForce RTX 3050 Ti Laptop GPU
min:
4.34 fps, P0.1:
5.39 fps, P1:
19.6 fps, max:
163 fps
fps
182%
NVIDIA GeForce RTX 3070:
69 [X] AMD Ryzen 9 5900X 3.7GHz
NVIDIA GeForce RTX 3070
70.9 [X] AMD Ryzen 9 5900X 3.7GHz
NVIDIA GeForce RTX 3070
~ 70 fps
169%
NVIDIA GeForce RTX 3060 Ti:
64.9 fps
NVIDIA GeForce RTX 3070:
149 fps
NVIDIA GeForce RTX 3060 Ti:
142 fps
NVIDIA GeForce RTX 3070:
125 fps
NVIDIA GeForce RTX 3060 Ti:
121 fps
NVIDIA GeForce RTX 3070:
107 fps
NVIDIA GeForce RTX 3060 Ti:
104 fps
NVIDIA GeForce RTX 3070:
81 fps
NVIDIA GeForce RTX 3060 Ti:
75 fps
NVIDIA GeForce RTX 3070:
68 fps
NVIDIA GeForce RTX 3060 Ti:
65 fps
NVIDIA GeForce RTX 3070:
48 fps
NVIDIA GeForce RTX 3060 Ti:
45 fps
NVIDIA GeForce RTX 3060 Ti:
246 fps
NVIDIA GeForce RTX 3060 Ti:
200 fps
NVIDIA GeForce RTX 3060 Ti:
196 fps
NVIDIA GeForce RTX 3060 Ti:
173 fps
NVIDIA GeForce RTX 3060 Ti:
150 fps
NVIDIA GeForce RTX 3060 Ti:
103 fps
100%
GeForce RTX 3050 Ti Laptop GPU:
102 115 ~ 109 fps
164%
NVIDIA GeForce RTX 3070:
155 [X] AMD Ryzen 9 5900X 3.7GHz
NVIDIA GeForce RTX 3070
max:
270.2 fps
165 194.8 200 [X] AMD Ryzen 9 5900X 3.7GHz
NVIDIA GeForce RTX 3070
max:
392.9 fps
~ 179 fps
198%
NVIDIA GeForce RTX 3060 Ti:
108.7 [X] Geekom Mini IT11 (Nvidia GeForce RTX 3060 Ti FE TB3) Intel Core i7-11390H 3.4GHz
NVIDIA GeForce RTX 3060 Ti
max:
186.8 fps
141.4 [X] Huawei MateBook X Pro 2023 (Nvidia GeForce RTX 3060 Ti FE TB3) Intel Core i7-1360P 1.6GHz
NVIDIA GeForce RTX 3060 Ti
185 314 [X] Nvidia GeForce RTX 3060 Ti FE AMD Ryzen 9 7900X 4.7GHz
NVIDIA GeForce RTX 3060 Ti
max:
493.5 fps
333 [X] Nvidia GeForce RTX 3060 Ti FE AMD Ryzen 9 7950X 4.5GHz
NVIDIA GeForce RTX 3060 Ti
max:
494.4 fps
~ 216 fps
100%
GeForce RTX 3050 Ti Laptop GPU:
78 92 97 [X] XMG Prototyp AMD Ryzen 5 5600H 3.3GHz
GeForce RTX 3050 Ti Laptop GPU
min:
77 fps
106 [X] no model GeForce RTX 3050 Ti Laptop GPU
~ 93 fps
175%
NVIDIA GeForce RTX 3070:
143 [X] AMD Ryzen 9 5900X 3.7GHz
NVIDIA GeForce RTX 3070
max:
244.9 fps
161 173.8 176 [X] AMD Ryzen 9 5900X 3.7GHz
NVIDIA GeForce RTX 3070
max:
289.2 fps
~ 163 fps
158%
NVIDIA GeForce RTX 3060 Ti:
98 [X] Geekom Mini IT11 (Nvidia GeForce RTX 3060 Ti FE TB3) Intel Core i7-11390H 3.4GHz
NVIDIA GeForce RTX 3060 Ti
max:
182.6 fps
98.3 [X] Huawei MateBook X Pro 2023 (Nvidia GeForce RTX 3060 Ti FE TB3) Intel Core i7-1360P 1.6GHz
NVIDIA GeForce RTX 3060 Ti
157 187.6 [X] Nvidia GeForce RTX 3060 Ti FE AMD Ryzen 9 7900X 4.7GHz
NVIDIA GeForce RTX 3060 Ti
max:
305.9 fps
191.6 [X] Nvidia GeForce RTX 3060 Ti FE AMD Ryzen 9 7950X 4.5GHz
NVIDIA GeForce RTX 3060 Ti
max:
319.9 fps
~ 147 fps
100%
GeForce RTX 3050 Ti Laptop GPU:
60 82 [X] XMG Prototyp AMD Ryzen 5 5600H 3.3GHz
GeForce RTX 3050 Ti Laptop GPU
min:
66 fps
83 ~ 75 fps
212%
NVIDIA GeForce RTX 3070:
143 [X] AMD Ryzen 9 5900X 3.7GHz
NVIDIA GeForce RTX 3070
max:
248.7 fps
157 166.8 168 [X] AMD Ryzen 9 5900X 3.7GHz
NVIDIA GeForce RTX 3070
max:
275.8 fps
~ 159 fps
184%
NVIDIA GeForce RTX 3060 Ti:
95.6 [X] Huawei MateBook X Pro 2023 (Nvidia GeForce RTX 3060 Ti FE TB3) Intel Core i7-1360P 1.6GHz
NVIDIA GeForce RTX 3060 Ti
97.6 [X] Geekom Mini IT11 (Nvidia GeForce RTX 3060 Ti FE TB3) Intel Core i7-11390H 3.4GHz
NVIDIA GeForce RTX 3060 Ti
max:
185.3 fps
153 169.8 [X] Nvidia GeForce RTX 3060 Ti FE AMD Ryzen 9 7900X 4.7GHz
NVIDIA GeForce RTX 3060 Ti
max:
268.2 fps
172.2 [X] Nvidia GeForce RTX 3060 Ti FE AMD Ryzen 9 7950X 4.5GHz
NVIDIA GeForce RTX 3060 Ti
max:
268.5 fps
~ 138 fps
100%
GeForce RTX 3050 Ti Laptop GPU:
49 69 [X] no model GeForce RTX 3050 Ti Laptop GPU
71 [X] XMG Prototyp AMD Ryzen 5 5600H 3.3GHz
GeForce RTX 3050 Ti Laptop GPU
min:
56 fps
72 ~ 65 fps
232%
NVIDIA GeForce RTX 3070:
138 [X] AMD Ryzen 9 5900X 3.7GHz
NVIDIA GeForce RTX 3070
max:
254.8 fps
150 157.1 160 [X] AMD Ryzen 9 5900X 3.7GHz
NVIDIA GeForce RTX 3070
max:
279.9 fps
~ 151 fps
197%
NVIDIA GeForce RTX 3060 Ti:
89.6 [X] Huawei MateBook X Pro 2023 (Nvidia GeForce RTX 3060 Ti FE TB3) Intel Core i7-1360P 1.6GHz
NVIDIA GeForce RTX 3060 Ti
95 [X] Geekom Mini IT11 (Nvidia GeForce RTX 3060 Ti FE TB3) Intel Core i7-11390H 3.4GHz
NVIDIA GeForce RTX 3060 Ti
max:
181 fps
145 154.1 [X] Nvidia GeForce RTX 3060 Ti FE AMD Ryzen 9 7900X 4.7GHz
NVIDIA GeForce RTX 3060 Ti
max:
250.8 fps
157.1 [X] Nvidia GeForce RTX 3060 Ti FE AMD Ryzen 9 7950X 4.5GHz
NVIDIA GeForce RTX 3060 Ti
max:
251.7 fps
~ 128 fps
100%
GeForce RTX 3050 Ti Laptop GPU:
44 [X] XMG Prototyp AMD Ryzen 5 5600H 3.3GHz
GeForce RTX 3050 Ti Laptop GPU
min:
36 fps
fps
257%
NVIDIA GeForce RTX 3070:
108 [X] AMD Ryzen 9 5900X 3.7GHz
NVIDIA GeForce RTX 3070
max:
175.7 fps
114 114.8 116 [X] AMD Ryzen 9 5900X 3.7GHz
NVIDIA GeForce RTX 3070
max:
180.1 fps
~ 113 fps
216%
NVIDIA GeForce RTX 3060 Ti:
73.6 [X] Huawei MateBook X Pro 2023 (Nvidia GeForce RTX 3060 Ti FE TB3) Intel Core i7-1360P 1.6GHz
NVIDIA GeForce RTX 3060 Ti
84.7 [X] Geekom Mini IT11 (Nvidia GeForce RTX 3060 Ti FE TB3) Intel Core i7-11390H 3.4GHz
NVIDIA GeForce RTX 3060 Ti
max:
164.3 fps
103 106.3 [X] Nvidia GeForce RTX 3060 Ti FE AMD Ryzen 9 7900X 4.7GHz
NVIDIA GeForce RTX 3060 Ti
max:
164 fps
107.4 [X] Nvidia GeForce RTX 3060 Ti FE AMD Ryzen 9 7950X 4.5GHz
NVIDIA GeForce RTX 3060 Ti
max:
163.3 fps
~ 95 fps
100%
GeForce RTX 3050 Ti Laptop GPU:
19 [X] XMG Prototyp AMD Ryzen 5 5600H 3.3GHz
GeForce RTX 3050 Ti Laptop GPU
min:
14 fps
fps
326%
NVIDIA GeForce RTX 3070:
61 [X] AMD Ryzen 9 5900X 3.7GHz
NVIDIA GeForce RTX 3070
max:
91.5 fps
62 62.6 63.5 [X] AMD Ryzen 9 5900X 3.7GHz
NVIDIA GeForce RTX 3070
max:
95.9 fps
~ 62 fps
289%
NVIDIA GeForce RTX 3060 Ti:
49.2 [X] Huawei MateBook X Pro 2023 (Nvidia GeForce RTX 3060 Ti FE TB3) Intel Core i7-1360P 1.6GHz
NVIDIA GeForce RTX 3060 Ti
53.8 [X] Geekom Mini IT11 (Nvidia GeForce RTX 3060 Ti FE TB3) Intel Core i7-11390H 3.4GHz
NVIDIA GeForce RTX 3060 Ti
max:
104.9 fps
56 57.6 [X] Nvidia GeForce RTX 3060 Ti FE AMD Ryzen 9 7900X 4.7GHz
NVIDIA GeForce RTX 3060 Ti
max:
83.8 fps
58.2 [X] Nvidia GeForce RTX 3060 Ti FE AMD Ryzen 9 7950X 4.5GHz
NVIDIA GeForce RTX 3060 Ti
max:
83.9 fps
~ 55 fps
100%
GeForce RTX 3050 Ti Laptop GPU:
103.3 [X] MSI Prestige 15 A12UD-093 1.47.22.14 D3D12
Intel Core i7-1280P 1.3GHz
GeForce RTX 3050 Ti Laptop GPU
min:
13.9 fps, P1:
50.2 fps, max:
213 fps
183.7 [X] Dell G15 5510-43NHT 1.47.22.14 D3D12
Intel Core i5-10200H 2.4GHz
GeForce RTX 3050 Ti Laptop GPU
min:
37.7 fps, P1:
125.4 fps, max:
340 fps
206 208 213 226 227 232 [X] SCHENKER Vision 14 1.47.22.14 D3D12
Intel Core i7-11370H 3.3GHz
GeForce RTX 3050 Ti Laptop GPU
min:
80.1 fps, P1:
181 fps, max:
387 fps
232 [X] Asus ROG Flow Z13 GZ301ZE 1.47.22.14 D3D12
Intel Core i9-12900H 1.8GHz
GeForce RTX 3050 Ti Laptop GPU
min:
79.2 fps, P1:
180 fps, max:
416 fps
241 [X] Asus VivoBook Pro 16 1.47.22.14 D3D12
Intel Core i7-12700H 1.7GHz
GeForce RTX 3050 Ti Laptop GPU
min:
138.2 fps, P1:
195.7 fps, max:
394 fps
245 245 [X] Dell G15 5515 1.47.22.14 D3D12
AMD Ryzen 7 5800H 3.2GHz
GeForce RTX 3050 Ti Laptop GPU
min:
111 fps, P1:
178 fps, max:
420 fps
256 259 259 270 281 289 297 [X] HP Victus 15 fa0020nr 1.47.22.14 D3D12
Intel Core i7-12700H 1.7GHz
GeForce RTX 3050 Ti Laptop GPU
min:
67 fps, P1:
220 fps, max:
466 fps
307 [X] Dell Inspiron 16 Plus 7620 1.47.22.14 D3D12
Intel Core i7-12700H 1.7GHz
GeForce RTX 3050 Ti Laptop GPU
min:
191.1 fps, P1:
230 fps, max:
486 fps
~ 239 fps
183%
NVIDIA GeForce RTX 3070:
413 [X] 1.47.22.14 D3D12
AMD Ryzen 9 5900X 3.7GHz
NVIDIA GeForce RTX 3070
min:
107 fps, P1:
293 fps, max:
701 fps
430 [X] 1.47.22.14 D3D12
Intel Core i7-10700 2.9GHz
NVIDIA GeForce RTX 3070
min:
215 fps, P1:
319 fps, max:
674 fps
439 [X] 1.47.22.14 D3D12
AMD Ryzen 9 5900X 3.7GHz
NVIDIA GeForce RTX 3070
min:
105 fps, P1:
319 fps, max:
705 fps
466 ~ 437 fps
173%
NVIDIA GeForce RTX 3060 Ti:
182.2 [X] Geekom Mini IT11 (Nvidia GeForce RTX 3060 Ti FE TB3) 1.47.22.14 D3D12
Intel Core i7-11390H 3.4GHz
NVIDIA GeForce RTX 3060 Ti
min:
115.5 fps, P1:
125.2 fps, max:
346 fps
200 [X] Huawei MateBook X Pro 2023 (Nvidia GeForce RTX 3060 Ti FE TB3) 1.47.22.14 D3D12
Intel Core i7-1360P 1.6GHz
NVIDIA GeForce RTX 3060 Ti
min:
61.8 fps, P1:
131.8 fps, max:
397 fps
204 [X] Intel NUC 12 Pro Kit NUC12WSKi7 1.47.22.14 D3D12
Intel Core i7-1260P 1.5GHz
NVIDIA GeForce RTX 3060 Ti
min:
94.6 fps, P1:
137.9 fps, max:
399 fps
550 [X] Nvidia GeForce RTX 3060 Ti FE 1.47.22.14 D3D12
AMD Ryzen 9 5900X 3.7GHz
NVIDIA GeForce RTX 3060 Ti
min:
72 fps, P1:
443 fps, max:
773 fps
659 [X] Nvidia GeForce RTX 3060 Ti FE 1.47.22.14 D3D12
AMD Ryzen 9 7900X 4.7GHz
NVIDIA GeForce RTX 3060 Ti
min:
353 fps, P1:
539 fps, max:
912 fps
680 [X] Nvidia GeForce RTX 3060 Ti FE 1.47.22.14 D3D12
AMD Ryzen 9 7950X 4.5GHz
NVIDIA GeForce RTX 3060 Ti
min:
339 fps, P1:
562 fps, max:
934 fps
~ 413 fps
100%
GeForce RTX 3050 Ti Laptop GPU:
53 [X] MSI Prestige 15 A12UD-093 1.47.22.14 D3D12
Intel Core i7-1280P 1.3GHz
GeForce RTX 3050 Ti Laptop GPU
min:
10.1 fps, P1:
27.3 fps, max:
301 fps
100 [X] Asus ROG Flow Z13 GZ301ZE 1.47.22.14 D3D12
Intel Core i9-12900H 1.8GHz
GeForce RTX 3050 Ti Laptop GPU
min:
77.1 fps, P1:
83.9 fps, max:
171 fps
109.6 110 [X] SCHENKER Vision 14 1.47.22.14 D3D12
Intel Core i7-11370H 3.3GHz
GeForce RTX 3050 Ti Laptop GPU
min:
45.7 fps, P1:
91.5 fps, max:
194 fps
114.8 115.9 [X] Dell G15 5510-43NHT 1.47.22.14 D3D12
Intel Core i5-10200H 2.4GHz
GeForce RTX 3050 Ti Laptop GPU
min:
48.3 fps, P1:
65 fps, max:
288 fps
117 118 119 121.2 [X] Asus VivoBook Pro 16 1.47.22.14 D3D12
Intel Core i7-12700H 1.7GHz
GeForce RTX 3050 Ti Laptop GPU
min:
46.3 fps, P1:
101.9 fps, max:
271 fps
126.9 126.9 128 129 129 132.8 133 134 138 [X] SCHENKER XMG Focus 15 1.47.22.14 D3D12
Intel Core i7-11800H 2.3GHz
GeForce RTX 3050 Ti Laptop GPU
min:
109 fps, P1:
112 fps, max:
213 fps
138 [X] Dell G15 5515 1.47.22.14 D3D12
AMD Ryzen 7 5800H 3.2GHz
GeForce RTX 3050 Ti Laptop GPU
min:
98.7 fps, P1:
112 fps, max:
203 fps
138.3 [X] Dell Inspiron 16 Plus 7620 1.47.22.14 D3D12
Intel Core i7-12700H 1.7GHz
GeForce RTX 3050 Ti Laptop GPU
min:
84.4 fps, P1:
116.2 fps, max:
231 fps
138.8 [X] HP Victus 15 fa0020nr 1.47.22.14 D3D12
Intel Core i7-12700H 1.7GHz
GeForce RTX 3050 Ti Laptop GPU
min:
35.4 fps, P1:
114.6 fps, max:
233 fps
139 [X] SCHENKER XMG Focus 17 1.47.22.14 D3D12
Intel Core i7-11800H 2.3GHz
GeForce RTX 3050 Ti Laptop GPU
min:
107 fps, P1:
112 fps, max:
258 fps
140.1 [X] HP Victus 16-e0145ng 1.47.22.14 D3D12
AMD Ryzen 5 5600H 3.3GHz
GeForce RTX 3050 Ti Laptop GPU
min:
98.8 fps, P1:
116.4 fps, max:
218 fps
145.5 ~ 124 fps
252%
NVIDIA GeForce RTX 3070:
302 [X] 1.47.22.14 D3D12
AMD Ryzen 9 5900X 3.7GHz
NVIDIA GeForce RTX 3070
min:
85.2 fps, P1:
230 fps, max:
471 fps
311 [X] 1.47.22.14 D3D12
AMD Ryzen 9 5900X 3.7GHz
NVIDIA GeForce RTX 3070
min:
113 fps, P1:
244 fps, max:
494 fps
311 [X] 1.47.22.14 D3D12
Intel Core i7-10700 2.9GHz
NVIDIA GeForce RTX 3070
min:
185 fps, P1:
256 fps, max:
437 fps
328 ~ 313 fps
183%
NVIDIA GeForce RTX 3060 Ti:
144.6 [X] Geekom Mini IT11 (Nvidia GeForce RTX 3060 Ti FE TB3) 1.47.22.14 D3D12
Intel Core i7-11390H 3.4GHz
NVIDIA GeForce RTX 3060 Ti
min:
87.9 fps, P1:
96.3 fps, max:
270 fps
151.6 [X] Huawei MateBook X Pro 2023 (Nvidia GeForce RTX 3060 Ti FE TB3) 1.47.22.14 D3D12
Intel Core i7-1360P 1.6GHz
NVIDIA GeForce RTX 3060 Ti
min:
79.2 fps, P1:
102.5 fps, max:
294 fps
156.4 [X] Intel NUC 12 Pro Kit NUC12WSKi7 1.47.22.14 D3D12
Intel Core i7-1260P 1.5GHz
NVIDIA GeForce RTX 3060 Ti
min:
95.4 fps, P1:
105.1 fps, max:
301 fps
283 [X] Nvidia GeForce RTX 3060 Ti FE 1.47.22.14 D3D12
AMD Ryzen 9 5900X 3.7GHz
NVIDIA GeForce RTX 3060 Ti
min:
75 fps, P1:
231 fps, max:
389 fps
307 [X] Nvidia GeForce RTX 3060 Ti FE 1.47.22.14 D3D12
AMD Ryzen 9 7900X 4.7GHz
NVIDIA GeForce RTX 3060 Ti
min:
86.3 fps, P1:
270 fps, max:
457 fps
319 [X] Nvidia GeForce RTX 3060 Ti FE 1.47.22.14 D3D12
AMD Ryzen 9 7950X 4.5GHz
NVIDIA GeForce RTX 3060 Ti
min:
250 fps, P1:
279 fps, max:
416 fps
~ 227 fps
100%
GeForce RTX 3050 Ti Laptop GPU:
79.2 [X] Asus ROG Flow Z13 GZ301ZE 1.47.22.14 D3D12
Intel Core i9-12900H 1.8GHz
GeForce RTX 3050 Ti Laptop GPU
min:
58.1 fps, P1:
59.6 fps, max:
118 fps
89.4 [X] SCHENKER Vision 14 1.47.22.14 D3D12
Intel Core i7-11370H 3.3GHz
GeForce RTX 3050 Ti Laptop GPU
min:
64.6 fps, P1:
67.3 fps, max:
160 fps
91.1 94 95.1 [X] Dell G15 5510-43NHT 1.47.22.14 D3D12
Intel Core i5-10200H 2.4GHz
GeForce RTX 3050 Ti Laptop GPU
min:
31.7 fps, P1:
54.5 fps, max:
254 fps
95.2 96.2 98.3 [X] Asus VivoBook Pro 16 1.47.22.14 D3D12
Intel Core i7-12700H 1.7GHz
GeForce RTX 3050 Ti Laptop GPU
min:
38.6 fps, P1:
75 fps, max:
266 fps
100.8 102.1 103 104.9 105.8 106 110.2 [X] Dell Inspiron 16 Plus 7620 1.47.22.14 D3D12
Intel Core i7-12700H 1.7GHz
GeForce RTX 3050 Ti Laptop GPU
min:
76.2 fps, P1:
84.7 fps, max:
164.6 fps
111 [X] SCHENKER XMG Focus 17 1.47.22.14 D3D12
Intel Core i7-11800H 2.3GHz
GeForce RTX 3050 Ti Laptop GPU
min:
80.8 fps, P1:
82.6 fps, max:
175 fps
112 [X] SCHENKER XMG Focus 15 1.47.22.14 D3D12
Intel Core i7-11800H 2.3GHz
GeForce RTX 3050 Ti Laptop GPU
min:
81.6 fps, P1:
82.7 fps, max:
177 fps
112 112 [X] Dell G15 5515 1.47.22.14 D3D12
AMD Ryzen 7 5800H 3.2GHz
GeForce RTX 3050 Ti Laptop GPU
min:
80.5 fps, P1:
83 fps, max:
181 fps
112.2 [X] HP Victus 15 fa0020nr 1.47.22.14 D3D12
Intel Core i7-12700H 1.7GHz
GeForce RTX 3050 Ti Laptop GPU
min:
38.3 fps, P1:
86.1 fps, max:
193.6 fps
114 114.5 [X] HP Victus 16-e0145ng 1.47.22.14 D3D12
AMD Ryzen 5 5600H 3.3GHz
GeForce RTX 3050 Ti Laptop GPU
min:
84.3 fps, P1:
86.6 fps, max:
188.2 fps
117.3 ~ 103 fps
250%
NVIDIA GeForce RTX 3070:
251 [X] 1.47.22.14 D3D12
AMD Ryzen 9 5900X 3.7GHz
NVIDIA GeForce RTX 3070
min:
118 fps, P1:
188 fps, max:
423 fps
253 [X] 1.47.22.14 D3D12
Intel Core i7-10700 2.9GHz
NVIDIA GeForce RTX 3070
min:
169 fps, P1:
187 fps, max:
410 fps
256 [X] 1.47.22.14 D3D12
AMD Ryzen 9 5900X 3.7GHz
NVIDIA GeForce RTX 3070
min:
139 fps, P1:
191 fps, max:
449 fps
268 ~ 257 fps
191%
NVIDIA GeForce RTX 3060 Ti:
143.2 [X] Geekom Mini IT11 (Nvidia GeForce RTX 3060 Ti FE TB3) 1.47.22.14 D3D12
Intel Core i7-11390H 3.4GHz
NVIDIA GeForce RTX 3060 Ti
min:
86 fps, P1:
99.4 fps, max:
266 fps
150.8 [X] Huawei MateBook X Pro 2023 (Nvidia GeForce RTX 3060 Ti FE TB3) 1.47.22.14 D3D12
Intel Core i7-1360P 1.6GHz
NVIDIA GeForce RTX 3060 Ti
min:
69.4 fps, P1:
104.3 fps, max:
308 fps
153.7 [X] Intel NUC 12 Pro Kit NUC12WSKi7 1.47.22.14 D3D12
Intel Core i7-1260P 1.5GHz
NVIDIA GeForce RTX 3060 Ti
min:
86 fps, P1:
106.2 fps, max:
296 fps
230 [X] Nvidia GeForce RTX 3060 Ti FE 1.47.22.14 D3D12
AMD Ryzen 9 5900X 3.7GHz
NVIDIA GeForce RTX 3060 Ti
min:
111.3 fps, P1:
166.6 fps, max:
346 fps
249 [X] Nvidia GeForce RTX 3060 Ti FE 1.47.22.14 D3D12
AMD Ryzen 9 7900X 4.7GHz
NVIDIA GeForce RTX 3060 Ti
min:
178.3 fps, P1:
184.1 fps, max:
360 fps
255 [X] Nvidia GeForce RTX 3060 Ti FE 1.47.22.14 D3D12
AMD Ryzen 9 7950X 4.5GHz
NVIDIA GeForce RTX 3060 Ti
min:
181.5 fps, P1:
187 fps, max:
369 fps
~ 197 fps
100%
GeForce RTX 3050 Ti Laptop GPU:
34.8 [X] MSI Prestige 15 A12UD-093 1.47.22.14 D3D12
Intel Core i7-1280P 1.3GHz
GeForce RTX 3050 Ti Laptop GPU
min:
17.1 fps, P1:
26.1 fps, max:
79.5 fps
68 [X] Asus ROG Flow Z13 GZ301ZE 1.47.22.14 D3D12
Intel Core i9-12900H 1.8GHz
GeForce RTX 3050 Ti Laptop GPU
min:
49.8 fps, P1:
52.8 fps, max:
101 fps
76.7 [X] SCHENKER Vision 14 1.47.22.14 D3D12
Intel Core i7-11370H 3.3GHz
GeForce RTX 3050 Ti Laptop GPU
min:
54 fps, P1:
57.9 fps, max:
130 fps
79.4 81.9 82.3 84 84.5 [X] Asus VivoBook Pro 16 1.47.22.14 D3D12
Intel Core i7-12700H 1.7GHz
GeForce RTX 3050 Ti Laptop GPU
min:
48.3 fps, P1:
64.9 fps, max:
231 fps
86 87.5 88.2 89.5 89.7 90 90.3 94.9 [X] Dell G15 5510-43NHT 1.47.22.14 D3D12
Intel Core i5-10200H 2.4GHz
GeForce RTX 3050 Ti Laptop GPU
min:
39.4 fps, P1:
54.7 fps, max:
254 fps
95.2 [X] Dell Inspiron 16 Plus 7620 1.47.22.14 D3D12
Intel Core i7-12700H 1.7GHz
GeForce RTX 3050 Ti Laptop GPU
min:
68.1 fps, P1:
72.5 fps, max:
151.2 fps
96.3 [X] SCHENKER XMG Focus 17 1.47.22.14 D3D12
Intel Core i7-11800H 2.3GHz
GeForce RTX 3050 Ti Laptop GPU
min:
69.8 fps, P1:
75.5 fps, max:
140 fps
96.4 [X] SCHENKER XMG Focus 15 1.47.22.14 D3D12
Intel Core i7-11800H 2.3GHz
GeForce RTX 3050 Ti Laptop GPU
min:
69.9 fps, P1:
75.5 fps, max:
148 fps
97 [X] Dell G15 5515 1.47.22.14 D3D12
AMD Ryzen 7 5800H 3.2GHz
GeForce RTX 3050 Ti Laptop GPU
min:
70.7 fps, P1:
76 fps, max:
145 fps
97.4 [X] HP Victus 15 fa0020nr 1.47.22.14 D3D12
Intel Core i7-12700H 1.7GHz
GeForce RTX 3050 Ti Laptop GPU
min:
34.3 fps, P1:
73.6 fps, max:
233 fps
97.5 98.9 [X] HP Victus 16-e0145ng 1.47.22.14 D3D12
AMD Ryzen 5 5600H 3.3GHz
GeForce RTX 3050 Ti Laptop GPU
min:
72.6 fps, P1:
78.6 fps, max:
158.3 fps
100 101.3 ~ 88 fps
256%
NVIDIA GeForce RTX 3070:
222 [X] 1.47.22.14 D3D12
AMD Ryzen 9 5900X 3.7GHz
NVIDIA GeForce RTX 3070
min:
106 fps, P1:
167 fps, max:
343 fps
222 [X] 1.47.22.14 D3D12
Intel Core i7-10700 2.9GHz
NVIDIA GeForce RTX 3070
min:
155 fps, P1:
168 fps, max:
324 fps
223 [X] 1.47.22.14 D3D12
AMD Ryzen 9 5900X 3.7GHz
NVIDIA GeForce RTX 3070
min:
74.2 fps, P1:
168 fps, max:
381 fps
233 ~ 225 fps
202%
NVIDIA GeForce RTX 3060 Ti:
139.7 [X] Geekom Mini IT11 (Nvidia GeForce RTX 3060 Ti FE TB3) 1.47.22.14 D3D12
Intel Core i7-11390H 3.4GHz
NVIDIA GeForce RTX 3060 Ti
min:
74 fps, P1:
89.1 fps, max:
257 fps
148.1 [X] Huawei MateBook X Pro 2023 (Nvidia GeForce RTX 3060 Ti FE TB3) 1.47.22.14 D3D12
Intel Core i7-1360P 1.6GHz
NVIDIA GeForce RTX 3060 Ti
min:
69.7 fps, P1:
93.8 fps, max:
292 fps
148.8 [X] Intel NUC 12 Pro Kit NUC12WSKi7 1.47.22.14 D3D12
Intel Core i7-1260P 1.5GHz
NVIDIA GeForce RTX 3060 Ti
min:
78.4 fps, P1:
90.6 fps, max:
285 fps
200 [X] Nvidia GeForce RTX 3060 Ti FE 1.47.22.14 D3D12
AMD Ryzen 9 5900X 3.7GHz
NVIDIA GeForce RTX 3060 Ti
min:
106.5 fps, P1:
149.8 fps, max:
306 fps
215 [X] Nvidia GeForce RTX 3060 Ti FE 1.47.22.14 D3D12
AMD Ryzen 9 7900X 4.7GHz
NVIDIA GeForce RTX 3060 Ti
min:
158.4 fps, P1:
162.2 fps, max:
301 fps
219 [X] Nvidia GeForce RTX 3060 Ti FE 1.47.22.14 D3D12
AMD Ryzen 9 7950X 4.5GHz
NVIDIA GeForce RTX 3060 Ti
min:
159.8 fps, P1:
163.4 fps, max:
311 fps
~ 178 fps
285%
NVIDIA GeForce RTX 3070:
165 [X] 1.47.22.14 D3D12
Intel Core i7-10700 2.9GHz
NVIDIA GeForce RTX 3070
min:
53.6 fps, P1:
133 fps, max:
285 fps
166 [X] 1.47.22.14 D3D12
AMD Ryzen 9 5900X 3.7GHz
NVIDIA GeForce RTX 3070
min:
82.9 fps, P1:
134 fps, max:
264 fps
166 [X] 1.47.22.14 D3D12
AMD Ryzen 9 5900X 3.7GHz
NVIDIA GeForce RTX 3070
min:
92.5 fps, P1:
133 fps, max:
284 fps
173.2 ~ 168 fps
239%
NVIDIA GeForce RTX 3060 Ti:
119.3 [X] Geekom Mini IT11 (Nvidia GeForce RTX 3060 Ti FE TB3) 1.47.22.14 D3D12
Intel Core i7-11390H 3.4GHz
NVIDIA GeForce RTX 3060 Ti
min:
56.5 fps, P1:
84 fps, max:
216 fps
127.4 [X] Huawei MateBook X Pro 2023 (Nvidia GeForce RTX 3060 Ti FE TB3) 1.47.22.14 D3D12
Intel Core i7-1360P 1.6GHz
NVIDIA GeForce RTX 3060 Ti
min:
64.5 fps, P1:
87.5 fps, max:
232 fps
129.9 [X] Intel NUC 12 Pro Kit NUC12WSKi7 1.47.22.14 D3D12
Intel Core i7-1260P 1.5GHz
NVIDIA GeForce RTX 3060 Ti
min:
35.9 fps, P1:
86.2 fps, max:
222 fps
147.1 [X] Nvidia GeForce RTX 3060 Ti FE 1.47.22.14 D3D12
AMD Ryzen 9 5900X 3.7GHz
NVIDIA GeForce RTX 3060 Ti
min:
64.8 fps, P1:
115.6 fps, max:
213 fps
159.7 [X] Nvidia GeForce RTX 3060 Ti FE 1.47.22.14 D3D12
AMD Ryzen 9 7900X 4.7GHz
NVIDIA GeForce RTX 3060 Ti
min:
125.3 fps, P1:
128 fps, max:
216 fps
161.3 [X] Nvidia GeForce RTX 3060 Ti FE 1.47.22.14 D3D12
AMD Ryzen 9 7950X 4.5GHz
NVIDIA GeForce RTX 3060 Ti
min:
124.3 fps, P1:
127.6 fps, max:
219 fps
~ 141 fps
100%
GeForce RTX 3050 Ti Laptop GPU:
18.9 [X] MSI Prestige 15 A12UD-093 1.47.22.14 D3D12
Intel Core i7-1280P 1.3GHz
GeForce RTX 3050 Ti Laptop GPU
min:
6.8 fps, P1:
8.18 fps, max:
38.9 fps
33.5 35.8 ~ 29 fps
338%
NVIDIA GeForce RTX 3070:
96.8 [X] 1.47.22.14 D3D12
AMD Ryzen 9 5900X 3.7GHz
NVIDIA GeForce RTX 3070
min:
66.9 fps, P1:
82.6 fps, max:
127 fps
97.1 [X] 1.47.22.14 D3D12
Intel Core i7-10700 2.9GHz
NVIDIA GeForce RTX 3070
min:
68.9 fps, P1:
83 fps, max:
165 fps
97.6 [X] 1.47.22.14 D3D12
AMD Ryzen 9 5900X 3.7GHz
NVIDIA GeForce RTX 3070
min:
53.6 fps, P1:
84.9 fps, max:
282 fps
98.7 ~ 98 fps
297%
NVIDIA GeForce RTX 3060 Ti:
79.6 [X] Geekom Mini IT11 (Nvidia GeForce RTX 3060 Ti FE TB3) 1.47.22.14 D3D12
Intel Core i7-11390H 3.4GHz
NVIDIA GeForce RTX 3060 Ti
min:
54.8 fps, P1:
66.3 fps, max:
111.6 fps
83.4 [X] Intel NUC 12 Pro Kit NUC12WSKi7 1.47.22.14 D3D12
Intel Core i7-1260P 1.5GHz
NVIDIA GeForce RTX 3060 Ti
min:
56.2 fps, P1:
67.9 fps, max:
115.6 fps
83.5 [X] Nvidia GeForce RTX 3060 Ti FE 1.47.22.14 D3D12
AMD Ryzen 9 5900X 3.7GHz
NVIDIA GeForce RTX 3060 Ti
min:
62.4 fps, P1:
71.8 fps, max:
112.4 fps
83.9 [X] Huawei MateBook X Pro 2023 (Nvidia GeForce RTX 3060 Ti FE TB3) 1.47.22.14 D3D12
Intel Core i7-1360P 1.6GHz
NVIDIA GeForce RTX 3060 Ti
min:
53.4 fps, P1:
65.8 fps, max:
141.4 fps
92.5 [X] Nvidia GeForce RTX 3060 Ti FE 1.47.22.14 D3D12
AMD Ryzen 9 7950X 4.5GHz
NVIDIA GeForce RTX 3060 Ti
min:
80.6 fps, P1:
81.6 fps, max:
118.4 fps
92.6 [X] Nvidia GeForce RTX 3060 Ti FE 1.47.22.14 D3D12
AMD Ryzen 9 7900X 4.7GHz
NVIDIA GeForce RTX 3060 Ti
min:
78 fps, P1:
80.3 fps, max:
117.2 fps
~ 86 fps
154%
NVIDIA GeForce RTX 3070:
150 [X] Intel Core i7-10700 2.9GHz
NVIDIA GeForce RTX 3070
min:
118 fps, max:
203 fps
159 [X] AMD Ryzen 9 5900X 3.7GHz
NVIDIA GeForce RTX 3070
min:
120 fps, max:
225 fps
179 184 [X] AMD Ryzen 9 5900X 3.7GHz
NVIDIA GeForce RTX 3070
min:
142 fps, max:
254 fps
~ 168 fps
168%
NVIDIA GeForce RTX 3060 Ti:
121 [X] Geekom Mini IT11 (Nvidia GeForce RTX 3060 Ti FE TB3) Intel Core i7-11390H 3.4GHz
NVIDIA GeForce RTX 3060 Ti
min:
76 fps, max:
161 fps
141 [X] Huawei MateBook X Pro 2023 (Nvidia GeForce RTX 3060 Ti FE TB3) Intel Core i7-1360P 1.6GHz
NVIDIA GeForce RTX 3060 Ti
min:
89 fps, max:
171 fps
153 [X] Intel NUC 12 Pro Kit NUC12WSKi7 Intel Core i7-1260P 1.5GHz
NVIDIA GeForce RTX 3060 Ti
min:
116 fps, max:
189 fps
199 [X] Nvidia GeForce RTX 3060 Ti FE AMD Ryzen 9 5900X 3.7GHz
NVIDIA GeForce RTX 3060 Ti
min:
152 fps, max:
279 fps
238 [X] Nvidia GeForce RTX 3060 Ti FE AMD Ryzen 9 7950X 4.5GHz
NVIDIA GeForce RTX 3060 Ti
min:
179 fps, max:
322 fps
245 [X] Nvidia GeForce RTX 3060 Ti FE AMD Ryzen 9 7900X 4.7GHz
NVIDIA GeForce RTX 3060 Ti
min:
174 fps, max:
336 fps
~ 183 fps
187%
NVIDIA GeForce RTX 3070:
133 [X] Intel Core i7-10700 2.9GHz
NVIDIA GeForce RTX 3070
min:
87 fps, max:
177 fps
139 [X] AMD Ryzen 9 5900X 3.7GHz
NVIDIA GeForce RTX 3070
min:
107 fps, max:
188 fps
159 161 [X] AMD Ryzen 9 5900X 3.7GHz
NVIDIA GeForce RTX 3070
min:
128 fps, max:
217 fps
~ 148 fps
191%
NVIDIA GeForce RTX 3060 Ti:
106 [X] Geekom Mini IT11 (Nvidia GeForce RTX 3060 Ti FE TB3) Intel Core i7-11390H 3.4GHz
NVIDIA GeForce RTX 3060 Ti
min:
65 fps, max:
142 fps
123 [X] Huawei MateBook X Pro 2023 (Nvidia GeForce RTX 3060 Ti FE TB3) Intel Core i7-1360P 1.6GHz
NVIDIA GeForce RTX 3060 Ti
min:
78 fps, max:
157 fps
133 [X] Intel NUC 12 Pro Kit NUC12WSKi7 Intel Core i7-1260P 1.5GHz
NVIDIA GeForce RTX 3060 Ti
min:
103 fps, max:
176 fps
154 [X] Nvidia GeForce RTX 3060 Ti FE AMD Ryzen 9 5900X 3.7GHz
NVIDIA GeForce RTX 3060 Ti
min:
124 fps, max:
200 fps
193 [X] Nvidia GeForce RTX 3060 Ti FE AMD Ryzen 9 7900X 4.7GHz
NVIDIA GeForce RTX 3060 Ti
min:
162 fps, max:
221 fps
194 [X] Nvidia GeForce RTX 3060 Ti FE AMD Ryzen 9 7950X 4.5GHz
NVIDIA GeForce RTX 3060 Ti
min:
157 fps, max:
223 fps
~ 151 fps
191%
NVIDIA GeForce RTX 3070:
126 [X] Intel Core i7-10700 2.9GHz
NVIDIA GeForce RTX 3070
min:
100 fps, max:
169 fps
133 [X] AMD Ryzen 9 5900X 3.7GHz
NVIDIA GeForce RTX 3070
min:
104 fps, max:
183 fps
151 154 [X] AMD Ryzen 9 5900X 3.7GHz
NVIDIA GeForce RTX 3070
min:
124 fps, max:
205 fps
~ 141 fps
193%
NVIDIA GeForce RTX 3060 Ti:
101 [X] Geekom Mini IT11 (Nvidia GeForce RTX 3060 Ti FE TB3) Intel Core i7-11390H 3.4GHz
NVIDIA GeForce RTX 3060 Ti
min:
70 fps, max:
136 fps
120 [X] Huawei MateBook X Pro 2023 (Nvidia GeForce RTX 3060 Ti FE TB3) Intel Core i7-1360P 1.6GHz
NVIDIA GeForce RTX 3060 Ti
min:
94 fps, max:
159 fps
127 [X] Intel NUC 12 Pro Kit NUC12WSKi7 Intel Core i7-1260P 1.5GHz
NVIDIA GeForce RTX 3060 Ti
min:
101 fps, max:
162 fps
146 [X] Nvidia GeForce RTX 3060 Ti FE AMD Ryzen 9 5900X 3.7GHz
NVIDIA GeForce RTX 3060 Ti
min:
113 fps, max:
188 fps
181 [X] Nvidia GeForce RTX 3060 Ti FE AMD Ryzen 9 7900X 4.7GHz
NVIDIA GeForce RTX 3060 Ti
min:
154 fps, max:
206 fps
182 [X] Nvidia GeForce RTX 3060 Ti FE AMD Ryzen 9 7950X 4.5GHz
NVIDIA GeForce RTX 3060 Ti
min:
153 fps, max:
207 fps
~ 143 fps
194%
NVIDIA GeForce RTX 3070:
117 [X] Intel Core i7-10700 2.9GHz
NVIDIA GeForce RTX 3070
min:
89 fps, max:
155 fps
127 [X] AMD Ryzen 9 5900X 3.7GHz
NVIDIA GeForce RTX 3070
min:
90 fps, max:
177 fps
141 143 [X] AMD Ryzen 9 5900X 3.7GHz
NVIDIA GeForce RTX 3070
min:
108 fps, max:
192 fps
~ 132 fps
197%
NVIDIA GeForce RTX 3060 Ti:
95 [X] Geekom Mini IT11 (Nvidia GeForce RTX 3060 Ti FE TB3) Intel Core i7-11390H 3.4GHz
NVIDIA GeForce RTX 3060 Ti
min:
70 fps, max:
128 fps
112 [X] Huawei MateBook X Pro 2023 (Nvidia GeForce RTX 3060 Ti FE TB3) Intel Core i7-1360P 1.6GHz
NVIDIA GeForce RTX 3060 Ti
min:
81 fps, max:
149 fps
120 [X] Intel NUC 12 Pro Kit NUC12WSKi7 Intel Core i7-1260P 1.5GHz
NVIDIA GeForce RTX 3060 Ti
min:
92 fps, max:
158 fps
137 [X] Nvidia GeForce RTX 3060 Ti FE AMD Ryzen 9 5900X 3.7GHz
NVIDIA GeForce RTX 3060 Ti
min:
102 fps, max:
178 fps
170 [X] Nvidia GeForce RTX 3060 Ti FE AMD Ryzen 9 7950X 4.5GHz
NVIDIA GeForce RTX 3060 Ti
min:
134 fps, max:
197 fps
171 [X] Nvidia GeForce RTX 3060 Ti FE AMD Ryzen 9 7900X 4.7GHz
NVIDIA GeForce RTX 3060 Ti
min:
141 fps, max:
193 fps
~ 134 fps
100%
GeForce RTX 3050 Ti Laptop GPU:
19 40 50 50 53 55 ~ 45 fps
264%
NVIDIA GeForce RTX 3070:
112 [X] Intel Core i7-10700 2.9GHz
NVIDIA GeForce RTX 3070
min:
86 fps, max:
138 fps
113 [X] AMD Ryzen 9 5900X 3.7GHz
NVIDIA GeForce RTX 3070
min:
89 fps, max:
132 fps
125 [X] AMD Ryzen 9 5900X 3.7GHz
NVIDIA GeForce RTX 3070
min:
105 fps, max:
145 fps
125 ~ 119 fps
240%
NVIDIA GeForce RTX 3060 Ti:
90 [X] Geekom Mini IT11 (Nvidia GeForce RTX 3060 Ti FE TB3) Intel Core i7-11390H 3.4GHz
NVIDIA GeForce RTX 3060 Ti
min:
72 fps, max:
118 fps
97 [X] Huawei MateBook X Pro 2023 (Nvidia GeForce RTX 3060 Ti FE TB3) Intel Core i7-1360P 1.6GHz
NVIDIA GeForce RTX 3060 Ti
min:
80 fps, max:
121 fps
100 [X] Intel NUC 12 Pro Kit NUC12WSKi7 Intel Core i7-1260P 1.5GHz
NVIDIA GeForce RTX 3060 Ti
min:
85 fps, max:
120 fps
110 [X] Nvidia GeForce RTX 3060 Ti FE AMD Ryzen 9 5900X 3.7GHz
NVIDIA GeForce RTX 3060 Ti
min:
90 fps, max:
130 fps
124 [X] Nvidia GeForce RTX 3060 Ti FE AMD Ryzen 9 7900X 4.7GHz
NVIDIA GeForce RTX 3060 Ti
min:
112 fps, max:
143 fps
125 [X] Nvidia GeForce RTX 3060 Ti FE AMD Ryzen 9 7950X 4.5GHz
NVIDIA GeForce RTX 3060 Ti
min:
113 fps, max:
146 fps
~ 108 fps
100%
GeForce RTX 3050 Ti Laptop GPU:
13 21 26 ~ 20 fps
350%
NVIDIA GeForce RTX 3070:
69 [X] AMD Ryzen 9 5900X 3.7GHz
NVIDIA GeForce RTX 3070
min:
61 fps, max:
81 fps
70 [X] AMD Ryzen 9 5900X 3.7GHz
NVIDIA GeForce RTX 3070
min:
63 fps, max:
84 fps
70 [X] Intel Core i7-10700 2.9GHz
NVIDIA GeForce RTX 3070
min:
62 fps, max:
85 fps
72 ~ 70 fps
315%
NVIDIA GeForce RTX 3060 Ti:
58 [X] Geekom Mini IT11 (Nvidia GeForce RTX 3060 Ti FE TB3) Intel Core i7-11390H 3.4GHz
NVIDIA GeForce RTX 3060 Ti
min:
52 fps, max:
68 fps
59 [X] Huawei MateBook X Pro 2023 (Nvidia GeForce RTX 3060 Ti FE TB3) Intel Core i7-1360P 1.6GHz
NVIDIA GeForce RTX 3060 Ti
min:
52 fps, max:
70 fps
65 [X] Nvidia GeForce RTX 3060 Ti FE AMD Ryzen 9 5900X 3.7GHz
NVIDIA GeForce RTX 3060 Ti
min:
58 fps, max:
79 fps
65 [X] Nvidia GeForce RTX 3060 Ti FE AMD Ryzen 9 7900X 4.7GHz
NVIDIA GeForce RTX 3060 Ti
min:
58 fps, max:
79 fps
66 [X] Nvidia GeForce RTX 3060 Ti FE AMD Ryzen 9 7950X 4.5GHz
NVIDIA GeForce RTX 3060 Ti
min:
59 fps, max:
80 fps
~ 63 fps
113%
NVIDIA GeForce RTX 3070:
59.7 121 [X] Cooler Master MasterCase EG200 RTX 3070 Aorus 15G Intel Core i7-10875H 2.3GHz
NVIDIA GeForce RTX 3070
124 [X] Intel Core i7-10700 2.9GHz
NVIDIA GeForce RTX 3070
141 [X] AMD Ryzen 9 5900X 3.7GHz
NVIDIA GeForce RTX 3070
143 [X] AMD Ryzen 9 5900X 3.7GHz
NVIDIA GeForce RTX 3070
150.6 ~ 123 fps
145%
NVIDIA GeForce RTX 3060 Ti:
94.3 [X] Geekom Mini IT11 (Nvidia GeForce RTX 3060 Ti FE TB3) Intel Core i7-11390H 3.4GHz
NVIDIA GeForce RTX 3060 Ti
118.6 [X] Huawei MateBook X Pro 2023 (Nvidia GeForce RTX 3060 Ti FE TB3) Intel Core i7-1360P 1.6GHz
NVIDIA GeForce RTX 3060 Ti
126.9 [X] Intel NUC 12 Pro Kit NUC12WSKi7 Intel Core i7-1260P 1.5GHz
NVIDIA GeForce RTX 3060 Ti
162.4 [X] Nvidia GeForce RTX 3060 Ti FE AMD Ryzen 9 5900X 3.7GHz
NVIDIA GeForce RTX 3060 Ti
220 [X] Nvidia GeForce RTX 3060 Ti FE AMD Ryzen 9 7950X 4.5GHz
NVIDIA GeForce RTX 3060 Ti
224 [X] Nvidia GeForce RTX 3060 Ti FE AMD Ryzen 9 7900X 4.7GHz
NVIDIA GeForce RTX 3060 Ti
~ 158 fps
115%
NVIDIA GeForce RTX 3070:
55.4 106 [X] Cooler Master MasterCase EG200 RTX 3070 Aorus 15G Intel Core i7-10875H 2.3GHz
NVIDIA GeForce RTX 3070
110 [X] Intel Core i7-10700 2.9GHz
NVIDIA GeForce RTX 3070
117 [X] AMD Ryzen 9 5900X 3.7GHz
NVIDIA GeForce RTX 3070
123 [X] AMD Ryzen 9 5900X 3.7GHz
NVIDIA GeForce RTX 3070
137.4 ~ 108 fps
147%
NVIDIA GeForce RTX 3060 Ti:
82.2 [X] Geekom Mini IT11 (Nvidia GeForce RTX 3060 Ti FE TB3) Intel Core i7-11390H 3.4GHz
NVIDIA GeForce RTX 3060 Ti
104.6 [X] Huawei MateBook X Pro 2023 (Nvidia GeForce RTX 3060 Ti FE TB3) Intel Core i7-1360P 1.6GHz
NVIDIA GeForce RTX 3060 Ti
110.6 [X] Intel NUC 12 Pro Kit NUC12WSKi7 Intel Core i7-1260P 1.5GHz
NVIDIA GeForce RTX 3060 Ti
143.6 [X] Nvidia GeForce RTX 3060 Ti FE AMD Ryzen 9 5900X 3.7GHz
NVIDIA GeForce RTX 3060 Ti
189.2 [X] Nvidia GeForce RTX 3060 Ti FE AMD Ryzen 9 7900X 4.7GHz
NVIDIA GeForce RTX 3060 Ti
196 [X] Nvidia GeForce RTX 3060 Ti FE AMD Ryzen 9 7950X 4.5GHz
NVIDIA GeForce RTX 3060 Ti
~ 138 fps
116%
NVIDIA GeForce RTX 3070:
53.7 88 [X] Cooler Master MasterCase EG200 RTX 3070 Aorus 15G Intel Core i7-10875H 2.3GHz
NVIDIA GeForce RTX 3070
91 [X] Intel Core i7-10700 2.9GHz
NVIDIA GeForce RTX 3070
95.4 [X] AMD Ryzen 9 5900X 3.7GHz
NVIDIA GeForce RTX 3070
95.4 [X] AMD Ryzen 9 5900X 3.7GHz
NVIDIA GeForce RTX 3070
111.3 ~ 89 fps
144%
NVIDIA GeForce RTX 3060 Ti:
68.4 [X] Geekom Mini IT11 (Nvidia GeForce RTX 3060 Ti FE TB3) Intel Core i7-11390H 3.4GHz
NVIDIA GeForce RTX 3060 Ti
88.5 [X] Huawei MateBook X Pro 2023 (Nvidia GeForce RTX 3060 Ti FE TB3) Intel Core i7-1360P 1.6GHz
NVIDIA GeForce RTX 3060 Ti
90.3 [X] Intel NUC 12 Pro Kit NUC12WSKi7 Intel Core i7-1260P 1.5GHz
NVIDIA GeForce RTX 3060 Ti
114.9 [X] Nvidia GeForce RTX 3060 Ti FE AMD Ryzen 9 5900X 3.7GHz
NVIDIA GeForce RTX 3060 Ti
152.7 [X] Nvidia GeForce RTX 3060 Ti FE AMD Ryzen 9 7950X 4.5GHz
NVIDIA GeForce RTX 3060 Ti
153.1 [X] Nvidia GeForce RTX 3060 Ti FE AMD Ryzen 9 7900X 4.7GHz
NVIDIA GeForce RTX 3060 Ti
~ 111 fps
162%
NVIDIA GeForce RTX 3070:
78.8 [X] Intel Core i7-10700 2.9GHz
NVIDIA GeForce RTX 3070
81.1 [X] AMD Ryzen 9 5900X 3.7GHz
NVIDIA GeForce RTX 3070
84.3 [X] AMD Ryzen 9 5900X 3.7GHz
NVIDIA GeForce RTX 3070
98.4 ~ 86 fps
170%
NVIDIA GeForce RTX 3060 Ti:
30.3 [X] Geekom Mini IT11 (Nvidia GeForce RTX 3060 Ti FE TB3) Intel Core i7-11390H 3.4GHz
NVIDIA GeForce RTX 3060 Ti
76.9 [X] Huawei MateBook X Pro 2023 (Nvidia GeForce RTX 3060 Ti FE TB3) Intel Core i7-1360P 1.6GHz
NVIDIA GeForce RTX 3060 Ti
80.1 [X] Intel NUC 12 Pro Kit NUC12WSKi7 Intel Core i7-1260P 1.5GHz
NVIDIA GeForce RTX 3060 Ti
96.9 [X] Nvidia GeForce RTX 3060 Ti FE AMD Ryzen 9 5900X 3.7GHz
NVIDIA GeForce RTX 3060 Ti
127.4 [X] Nvidia GeForce RTX 3060 Ti FE AMD Ryzen 9 7950X 4.5GHz
NVIDIA GeForce RTX 3060 Ti
128.8 [X] Nvidia GeForce RTX 3060 Ti FE AMD Ryzen 9 7900X 4.7GHz
NVIDIA GeForce RTX 3060 Ti
~ 90 fps
171%
NVIDIA GeForce RTX 3070:
167 [X] 1.3
Intel Core i7-10700 2.9GHz
NVIDIA GeForce RTX 3070
190 [X] 1.3
AMD Ryzen 9 5900X 3.7GHz
NVIDIA GeForce RTX 3070
195.8 209 [X] 1.3
AMD Ryzen 9 5900X 3.7GHz
NVIDIA GeForce RTX 3070
~ 190 fps
173%
NVIDIA GeForce RTX 3060 Ti:
124.1 [X] Geekom Mini IT11 (Nvidia GeForce RTX 3060 Ti FE TB3) 1.3
Intel Core i7-11390H 3.4GHz
NVIDIA GeForce RTX 3060 Ti
160.8 [X] Huawei MateBook X Pro 2023 (Nvidia GeForce RTX 3060 Ti FE TB3) 1.3
Intel Core i7-1360P 1.6GHz
NVIDIA GeForce RTX 3060 Ti
175.7 [X] Intel NUC 12 Pro Kit NUC12WSKi7 1.3
Intel Core i7-1260P 1.5GHz
NVIDIA GeForce RTX 3060 Ti
224 [X] Nvidia GeForce RTX 3060 Ti FE 1.3
AMD Ryzen 9 5900X 3.7GHz
NVIDIA GeForce RTX 3060 Ti
235 [X] Nvidia GeForce RTX 3060 Ti FE 1.3
AMD Ryzen 9 7900X 4.7GHz
NVIDIA GeForce RTX 3060 Ti
235 [X] Nvidia GeForce RTX 3060 Ti FE 1.3
AMD Ryzen 9 7950X 4.5GHz
NVIDIA GeForce RTX 3060 Ti
~ 192 fps
223%
NVIDIA GeForce RTX 3070:
146 [X] 1.3
Intel Core i7-10700 2.9GHz
NVIDIA GeForce RTX 3070
148 [X] 1.3
AMD Ryzen 9 5900X 3.7GHz
NVIDIA GeForce RTX 3070
159 [X] 1.3
AMD Ryzen 9 5900X 3.7GHz
NVIDIA GeForce RTX 3070
172.3 ~ 156 fps
203%
NVIDIA GeForce RTX 3060 Ti:
76.7 [X] Geekom Mini IT11 (Nvidia GeForce RTX 3060 Ti FE TB3) 1.3
Intel Core i7-11390H 3.4GHz
NVIDIA GeForce RTX 3060 Ti
134.7 [X] Huawei MateBook X Pro 2023 (Nvidia GeForce RTX 3060 Ti FE TB3) 1.3
Intel Core i7-1360P 1.6GHz
NVIDIA GeForce RTX 3060 Ti
141.1 [X] Intel NUC 12 Pro Kit NUC12WSKi7 1.3
Intel Core i7-1260P 1.5GHz
NVIDIA GeForce RTX 3060 Ti
159 [X] Nvidia GeForce RTX 3060 Ti FE 1.3
AMD Ryzen 9 5900X 3.7GHz
NVIDIA GeForce RTX 3060 Ti
168 [X] Nvidia GeForce RTX 3060 Ti FE 1.3
AMD Ryzen 9 7900X 4.7GHz
NVIDIA GeForce RTX 3060 Ti
172.3 [X] Nvidia GeForce RTX 3060 Ti FE 1.3
AMD Ryzen 9 7950X 4.5GHz
NVIDIA GeForce RTX 3060 Ti
~ 142 fps
235%
NVIDIA GeForce RTX 3070:
112 [X] 1.3
Intel Core i7-10700 2.9GHz
NVIDIA GeForce RTX 3070
115 [X] 1.3
AMD Ryzen 9 5900X 3.7GHz
NVIDIA GeForce RTX 3070
122 [X] 1.3
AMD Ryzen 9 5900X 3.7GHz
NVIDIA GeForce RTX 3070
129.7 ~ 120 fps
202%
NVIDIA GeForce RTX 3060 Ti:
58.8 [X] Geekom Mini IT11 (Nvidia GeForce RTX 3060 Ti FE TB3) 1.3
Intel Core i7-11390H 3.4GHz
NVIDIA GeForce RTX 3060 Ti
96.2 [X] Huawei MateBook X Pro 2023 (Nvidia GeForce RTX 3060 Ti FE TB3) 1.3
Intel Core i7-1360P 1.6GHz
NVIDIA GeForce RTX 3060 Ti
97.6 [X] Intel NUC 12 Pro Kit NUC12WSKi7 1.3
Intel Core i7-1260P 1.5GHz
NVIDIA GeForce RTX 3060 Ti
116.3 [X] Nvidia GeForce RTX 3060 Ti FE 1.3
AMD Ryzen 9 5900X 3.7GHz
NVIDIA GeForce RTX 3060 Ti
124 [X] Nvidia GeForce RTX 3060 Ti FE 1.3
AMD Ryzen 9 7900X 4.7GHz
NVIDIA GeForce RTX 3060 Ti
125.9 [X] Nvidia GeForce RTX 3060 Ti FE 1.3
AMD Ryzen 9 7950X 4.5GHz
NVIDIA GeForce RTX 3060 Ti
~ 103 fps
276%
NVIDIA GeForce RTX 3070:
89.2 [X] 1.3
Intel Core i7-10700 2.9GHz
NVIDIA GeForce RTX 3070
93.9 [X] 1.3
AMD Ryzen 9 5900X 3.7GHz
NVIDIA GeForce RTX 3070
94.1 [X] 1.3
AMD Ryzen 9 5900X 3.7GHz
NVIDIA GeForce RTX 3070
99.3 ~ 94 fps
229%
NVIDIA GeForce RTX 3060 Ti:
40.8 [X] Geekom Mini IT11 (Nvidia GeForce RTX 3060 Ti FE TB3) 1.3
Intel Core i7-11390H 3.4GHz
NVIDIA GeForce RTX 3060 Ti
76.1 [X] Huawei MateBook X Pro 2023 (Nvidia GeForce RTX 3060 Ti FE TB3) 1.3
Intel Core i7-1360P 1.6GHz
NVIDIA GeForce RTX 3060 Ti
77.1 [X] Intel NUC 12 Pro Kit NUC12WSKi7 1.3
Intel Core i7-1260P 1.5GHz
NVIDIA GeForce RTX 3060 Ti
88 [X] Nvidia GeForce RTX 3060 Ti FE 1.3
AMD Ryzen 9 5900X 3.7GHz
NVIDIA GeForce RTX 3060 Ti
93.1 [X] Nvidia GeForce RTX 3060 Ti FE 1.3
AMD Ryzen 9 7900X 4.7GHz
NVIDIA GeForce RTX 3060 Ti
93.2 [X] Nvidia GeForce RTX 3060 Ti FE 1.3
AMD Ryzen 9 7950X 4.5GHz
NVIDIA GeForce RTX 3060 Ti
~ 78 fps
335%
NVIDIA GeForce RTX 3070:
54.8 [X] 1.3
Intel Core i7-10700 2.9GHz
NVIDIA GeForce RTX 3070
56.9 [X] 1.3
AMD Ryzen 9 5900X 3.7GHz
NVIDIA GeForce RTX 3070
57.6 [X] 1.3
AMD Ryzen 9 5900X 3.7GHz
NVIDIA GeForce RTX 3070
58.2 ~ 57 fps
271%
NVIDIA GeForce RTX 3060 Ti:
23.2 [X] Geekom Mini IT11 (Nvidia GeForce RTX 3060 Ti FE TB3) 1.3
Intel Core i7-11390H 3.4GHz
NVIDIA GeForce RTX 3060 Ti
48.5 [X] Intel NUC 12 Pro Kit NUC12WSKi7 1.3
Intel Core i7-1260P 1.5GHz
NVIDIA GeForce RTX 3060 Ti
48.6 [X] Huawei MateBook X Pro 2023 (Nvidia GeForce RTX 3060 Ti FE TB3) 1.3
Intel Core i7-1360P 1.6GHz
NVIDIA GeForce RTX 3060 Ti
51.4 [X] Nvidia GeForce RTX 3060 Ti FE 1.3
AMD Ryzen 9 5900X 3.7GHz
NVIDIA GeForce RTX 3060 Ti
52.8 [X] Nvidia GeForce RTX 3060 Ti FE 1.3
AMD Ryzen 9 7900X 4.7GHz
NVIDIA GeForce RTX 3060 Ti
54.2 [X] Nvidia GeForce RTX 3060 Ti FE 1.3
AMD Ryzen 9 7950X 4.5GHz
NVIDIA GeForce RTX 3060 Ti
~ 46 fps
NVIDIA GeForce RTX 3070:
135.5 171 [X] Cooler Master MasterCase EG200 RTX 3070 Aorus 15G Intel Core i7-10875H 2.3GHz
NVIDIA GeForce RTX 3070
~ 153 fps
NVIDIA GeForce RTX 3070:
135 160 [X] Cooler Master MasterCase EG200 RTX 3070 Aorus 15G Intel Core i7-10875H 2.3GHz
NVIDIA GeForce RTX 3070
~ 148 fps
NVIDIA GeForce RTX 3070:
118 155 [X] Cooler Master MasterCase EG200 RTX 3070 Aorus 15G Intel Core i7-10875H 2.3GHz
NVIDIA GeForce RTX 3070
~ 137 fps
NVIDIA GeForce RTX 3070:
117 153 [X] Cooler Master MasterCase EG200 RTX 3070 Aorus 15G Intel Core i7-10875H 2.3GHz
NVIDIA GeForce RTX 3070
~ 135 fps
NVIDIA GeForce RTX 3070:
226 [X] AMD Ryzen 9 5900X 3.7GHz
NVIDIA GeForce RTX 3070
min:
207 fps, max:
236 fps
336 [X] AMD Ryzen 9 5900X 3.7GHz
NVIDIA GeForce RTX 3070
min:
320 fps, max:
354 fps
376 ~ 313 fps
NVIDIA GeForce RTX 3070:
159 [X] AMD Ryzen 9 5900X 3.7GHz
NVIDIA GeForce RTX 3070
min:
150 fps, max:
168 fps
252 [X] AMD Ryzen 9 5900X 3.7GHz
NVIDIA GeForce RTX 3070
min:
238 fps, max:
270 fps
266 ~ 226 fps
NVIDIA GeForce RTX 3070:
156 [X] AMD Ryzen 9 5900X 3.7GHz
NVIDIA GeForce RTX 3070
min:
147 fps, max:
166 fps
182.9 197 [X] AMD Ryzen 9 5900X 3.7GHz
NVIDIA GeForce RTX 3070
min:
184 fps, max:
213 fps
~ 179 fps
NVIDIA GeForce RTX 3070:
151 [X] AMD Ryzen 9 5900X 3.7GHz
NVIDIA GeForce RTX 3070
min:
131 fps, max:
163 fps
153.7 169 [X] AMD Ryzen 9 5900X 3.7GHz
NVIDIA GeForce RTX 3070
min:
153 fps, max:
188 fps
~ 158 fps
NVIDIA GeForce RTX 3070:
76.7 80.9 [X] AMD Ryzen 9 5900X 3.7GHz
NVIDIA GeForce RTX 3070
min:
74 fps, max:
90 fps
83.8 [X] AMD Ryzen 9 5900X 3.7GHz
NVIDIA GeForce RTX 3070
min:
75 fps, max:
93 fps
~ 80 fps
101%
NVIDIA GeForce RTX 3070:
107.8 146.5 150.5 [X] Cooler Master MasterCase EG200 RTX 3070 Aorus 15G Intel Core i7-10875H 2.3GHz
NVIDIA GeForce RTX 3070
min:
130.2 fps, max:
-1 fps
162.9 [X] AMD Ryzen 9 5900X 3.7GHz
NVIDIA GeForce RTX 3070
min:
134.5 fps, max:
-1 fps
164.2 [X] Intel Core i7-10700 2.9GHz
NVIDIA GeForce RTX 3070
min:
143.5 fps, max:
-1 fps
171 [X] AMD Ryzen 9 5900X 3.7GHz
NVIDIA GeForce RTX 3070
min:
140 fps, max:
-1 fps
~ 150 fps
141%
NVIDIA GeForce RTX 3060 Ti:
115.4 [X] Geekom Mini IT11 (Nvidia GeForce RTX 3060 Ti FE TB3) Intel Core i7-11390H 3.4GHz
NVIDIA GeForce RTX 3060 Ti
min:
101.3 fps, max:
-1 fps
156.2 [X] Huawei MateBook X Pro 2023 (Nvidia GeForce RTX 3060 Ti FE TB3) Intel Core i7-1360P 1.6GHz
NVIDIA GeForce RTX 3060 Ti
min:
135 fps, max:
-1 fps
167.7 [X] Intel NUC 12 Pro Kit NUC12WSKi7 Intel Core i7-1260P 1.5GHz
NVIDIA GeForce RTX 3060 Ti
min:
148.7 fps, max:
-1 fps
215 [X] Nvidia GeForce RTX 3060 Ti FE AMD Ryzen 9 5900X 3.7GHz
NVIDIA GeForce RTX 3060 Ti
min:
179.5 fps, max:
-1 fps
295.3 [X] Nvidia GeForce RTX 3060 Ti FE AMD Ryzen 9 7900X 4.7GHz
NVIDIA GeForce RTX 3060 Ti
min:
252.7 fps, max:
-1 fps
298.8 [X] Nvidia GeForce RTX 3060 Ti FE AMD Ryzen 9 7950X 4.5GHz
NVIDIA GeForce RTX 3060 Ti
min:
255.3 fps, max:
-1 fps
~ 208 fps
100%
NVIDIA GeForce RTX 3070:
99.2 125.3 [X] Cooler Master MasterCase EG200 RTX 3070 Aorus 15G Intel Core i7-10875H 2.3GHz
NVIDIA GeForce RTX 3070
min:
100 fps, max:
-1 fps
133.9 140.5 [X] AMD Ryzen 9 5900X 3.7GHz
NVIDIA GeForce RTX 3070
min:
115 fps, max:
-1 fps
143.8 [X] Intel Core i7-10700 2.9GHz
NVIDIA GeForce RTX 3070
min:
126.6 fps, max:
-1 fps
157 [X] AMD Ryzen 9 5900X 3.7GHz
NVIDIA GeForce RTX 3070
min:
124.8 fps, max:
-1 fps
~ 133 fps
140%
NVIDIA GeForce RTX 3060 Ti:
107.2 [X] Geekom Mini IT11 (Nvidia GeForce RTX 3060 Ti FE TB3) Intel Core i7-11390H 3.4GHz
NVIDIA GeForce RTX 3060 Ti
min:
91.1 fps, max:
-1 fps
140 [X] Huawei MateBook X Pro 2023 (Nvidia GeForce RTX 3060 Ti FE TB3) Intel Core i7-1360P 1.6GHz
NVIDIA GeForce RTX 3060 Ti
min:
117.1 fps, max:
-1 fps
150.9 [X] Intel NUC 12 Pro Kit NUC12WSKi7 Intel Core i7-1260P 1.5GHz
NVIDIA GeForce RTX 3060 Ti
min:
132.6 fps, max:
-1 fps
188.7 [X] Nvidia GeForce RTX 3060 Ti FE AMD Ryzen 9 5900X 3.7GHz
NVIDIA GeForce RTX 3060 Ti
min:
156.7 fps, max:
-1 fps
262.7 [X] Nvidia GeForce RTX 3060 Ti FE AMD Ryzen 9 7900X 4.7GHz
NVIDIA GeForce RTX 3060 Ti
min:
225.4 fps, max:
-1 fps
264.2 [X] Nvidia GeForce RTX 3060 Ti FE AMD Ryzen 9 7950X 4.5GHz
NVIDIA GeForce RTX 3060 Ti
min:
228.3 fps, max:
-1 fps
~ 186 fps
108%
NVIDIA GeForce RTX 3070:
96.1 116.8 [X] Cooler Master MasterCase EG200 RTX 3070 Aorus 15G Intel Core i7-10875H 2.3GHz
NVIDIA GeForce RTX 3070
min:
95.9 fps, max:
-1 fps
129.3 137.6 [X] AMD Ryzen 9 5900X 3.7GHz
NVIDIA GeForce RTX 3070
min:
113.8 fps, max:
-1 fps
138.2 [X] Intel Core i7-10700 2.9GHz
NVIDIA GeForce RTX 3070
min:
121.1 fps, max:
-1 fps
153.6 [X] AMD Ryzen 9 5900X 3.7GHz
NVIDIA GeForce RTX 3070
min:
120.6 fps, max:
-1 fps
~ 129 fps
146%
NVIDIA GeForce RTX 3060 Ti:
95.5 [X] Geekom Mini IT11 (Nvidia GeForce RTX 3060 Ti FE TB3) Intel Core i7-11390H 3.4GHz
NVIDIA GeForce RTX 3060 Ti
min:
80.1 fps, max:
-1 fps
135.6 [X] Huawei MateBook X Pro 2023 (Nvidia GeForce RTX 3060 Ti FE TB3) Intel Core i7-1360P 1.6GHz
NVIDIA GeForce RTX 3060 Ti
min:
109.8 fps, max:
-1 fps
144.9 [X] Intel NUC 12 Pro Kit NUC12WSKi7 Intel Core i7-1260P 1.5GHz
NVIDIA GeForce RTX 3060 Ti
min:
126.6 fps, max:
-1 fps
179.9 [X] Nvidia GeForce RTX 3060 Ti FE AMD Ryzen 9 5900X 3.7GHz
NVIDIA GeForce RTX 3060 Ti
min:
147.2 fps, max:
-1 fps
246.6 [X] Nvidia GeForce RTX 3060 Ti FE AMD Ryzen 9 7900X 4.7GHz
NVIDIA GeForce RTX 3060 Ti
min:
210.3 fps, max:
-1 fps
250.4 [X] Nvidia GeForce RTX 3060 Ti FE AMD Ryzen 9 7950X 4.5GHz
NVIDIA GeForce RTX 3060 Ti
min:
213.8 fps, max:
-1 fps
~ 175 fps
105%
NVIDIA GeForce RTX 3070:
92.1 107.1 [X] Cooler Master MasterCase EG200 RTX 3070 Aorus 15G Intel Core i7-10875H 2.3GHz
NVIDIA GeForce RTX 3070
min:
84.9 fps, max:
-1 fps
121.4 128.6 [X] AMD Ryzen 9 5900X 3.7GHz
NVIDIA GeForce RTX 3070
min:
99 fps, max:
-1 fps
129.7 [X] Intel Core i7-10700 2.9GHz
NVIDIA GeForce RTX 3070
min:
113.4 fps, max:
-1 fps
136.3 [X] AMD Ryzen 9 5900X 3.7GHz
NVIDIA GeForce RTX 3070
min:
108.9 fps, max:
-1 fps
~ 119 fps
143%
NVIDIA GeForce RTX 3060 Ti:
89.2 [X] Geekom Mini IT11 (Nvidia GeForce RTX 3060 Ti FE TB3) Intel Core i7-11390H 3.4GHz
NVIDIA GeForce RTX 3060 Ti
min:
74.2 fps, max:
-1 fps
121.4 [X] Huawei MateBook X Pro 2023 (Nvidia GeForce RTX 3060 Ti FE TB3) Intel Core i7-1360P 1.6GHz
NVIDIA GeForce RTX 3060 Ti
min:
101.7 fps, max:
-1 fps
134.5 [X] Intel NUC 12 Pro Kit NUC12WSKi7 Intel Core i7-1260P 1.5GHz
NVIDIA GeForce RTX 3060 Ti
min:
115.1 fps, max:
-1 fps
164.9 [X] Nvidia GeForce RTX 3060 Ti FE AMD Ryzen 9 5900X 3.7GHz
NVIDIA GeForce RTX 3060 Ti
min:
136.6 fps, max:
-1 fps
231.1 [X] Nvidia GeForce RTX 3060 Ti FE AMD Ryzen 9 7900X 4.7GHz
NVIDIA GeForce RTX 3060 Ti
min:
199.5 fps, max:
-1 fps
232.1 [X] Nvidia GeForce RTX 3060 Ti FE AMD Ryzen 9 7950X 4.5GHz
NVIDIA GeForce RTX 3060 Ti
min:
197.7 fps, max:
-1 fps
~ 162 fps
225%
NVIDIA GeForce RTX 3070:
122.7 123.4 [X] AMD Ryzen 9 5900X 3.7GHz
NVIDIA GeForce RTX 3070
min:
98 fps, max:
-1 fps
127.4 [X] Intel Core i7-10700 2.9GHz
NVIDIA GeForce RTX 3070
min:
107.8 fps, max:
-1 fps
128.5 [X] AMD Ryzen 9 5900X 3.7GHz
NVIDIA GeForce RTX 3070
min:
102.9 fps, max:
-1 fps
~ 126 fps
216%
NVIDIA GeForce RTX 3060 Ti:
33.7 [X] Geekom Mini IT11 (Nvidia GeForce RTX 3060 Ti FE TB3) Intel Core i7-11390H 3.4GHz
NVIDIA GeForce RTX 3060 Ti
min:
15.7 fps, max:
-1 fps
104.3 [X] Huawei MateBook X Pro 2023 (Nvidia GeForce RTX 3060 Ti FE TB3) Intel Core i7-1360P 1.6GHz
NVIDIA GeForce RTX 3060 Ti
min:
86.9 fps, max:
-1 fps
109 [X] Intel NUC 12 Pro Kit NUC12WSKi7 Intel Core i7-1260P 1.5GHz
NVIDIA GeForce RTX 3060 Ti
min:
89.4 fps, max:
-1 fps
141.9 [X] Nvidia GeForce RTX 3060 Ti FE AMD Ryzen 9 5900X 3.7GHz
NVIDIA GeForce RTX 3060 Ti
min:
113.1 fps, max:
-1 fps
167.8 [X] Nvidia GeForce RTX 3060 Ti FE AMD Ryzen 9 7900X 4.7GHz
NVIDIA GeForce RTX 3060 Ti
min:
146 fps, max:
-1 fps
169 [X] Nvidia GeForce RTX 3060 Ti FE AMD Ryzen 9 7950X 4.5GHz
NVIDIA GeForce RTX 3060 Ti
min:
145.3 fps, max:
-1 fps
~ 121 fps
172%
NVIDIA GeForce RTX 3070:
154 196.8 [X] Cooler Master MasterCase EG200 RTX 3070 Aorus 15G Intel Core i7-10875H 2.3GHz
NVIDIA GeForce RTX 3070
367 [X] Intel Core i7-10700 2.9GHz
NVIDIA GeForce RTX 3070
407 [X] AMD Ryzen 9 5900X 3.7GHz
NVIDIA GeForce RTX 3070
min:
351 fps, max:
466 fps
451 [X] AMD Ryzen 9 5900X 3.7GHz
NVIDIA GeForce RTX 3070
min:
397 fps, max:
505 fps
507 548 ~ 376 fps
193%
NVIDIA GeForce RTX 3060 Ti:
227.9 [X] Geekom Mini IT11 (Nvidia GeForce RTX 3060 Ti FE TB3) Intel Core i7-11390H 3.4GHz
NVIDIA GeForce RTX 3060 Ti
302.5 [X] Huawei MateBook X Pro 2023 (Nvidia GeForce RTX 3060 Ti FE TB3) Intel Core i7-1360P 1.6GHz
NVIDIA GeForce RTX 3060 Ti
308 [X] Intel NUC 12 Pro Kit NUC12WSKi7 Intel Core i7-1260P 1.5GHz
NVIDIA GeForce RTX 3060 Ti
min:
14.9 fps, P0.1:
95.6 fps, P1:
204 fps, max:
576 fps
479 590 [X] Nvidia GeForce RTX 3060 Ti FE AMD Ryzen 9 7900X 4.7GHz
NVIDIA GeForce RTX 3060 Ti
min:
64.4 fps, P0.1:
262 fps, P1:
424 fps, max:
1145 fps
610 [X] Nvidia GeForce RTX 3060 Ti FE AMD Ryzen 9 7950X 4.5GHz
NVIDIA GeForce RTX 3060 Ti
min:
25.1 fps, P0.1:
256 fps, P1:
407 fps, max:
1159 fps
~ 420 fps
197%
NVIDIA GeForce RTX 3070:
128.2 [X] Cooler Master MasterCase EG200 RTX 3070 Aorus 15G Intel Core i7-10875H 2.3GHz
NVIDIA GeForce RTX 3070
141.2 316 [X] Intel Core i7-10700 2.9GHz
NVIDIA GeForce RTX 3070
350 [X] AMD Ryzen 9 5900X 3.7GHz
NVIDIA GeForce RTX 3070
min:
312 fps, max:
390 fps
363 [X] AMD Ryzen 9 5900X 3.7GHz
NVIDIA GeForce RTX 3070
min:
319 fps, max:
391 fps
408 449 ~ 308 fps
199%
NVIDIA GeForce RTX 3060 Ti:
208.5 [X] Huawei MateBook X Pro 2023 (Nvidia GeForce RTX 3060 Ti FE TB3) Intel Core i7-1360P 1.6GHz
NVIDIA GeForce RTX 3060 Ti
211 [X] Intel NUC 12 Pro Kit NUC12WSKi7 Intel Core i7-1260P 1.5GHz
NVIDIA GeForce RTX 3060 Ti
min:
46.9 fps, P0.1:
108.4 fps, P1:
155.6 fps, max:
468 fps
342 393 [X] Nvidia GeForce RTX 3060 Ti FE AMD Ryzen 9 7900X 4.7GHz
NVIDIA GeForce RTX 3060 Ti
min:
26 fps, P0.1:
227 fps, P1:
312 fps, max:
979 fps
395 [X] Nvidia GeForce RTX 3060 Ti FE AMD Ryzen 9 7950X 4.5GHz
NVIDIA GeForce RTX 3060 Ti
min:
33.4 fps, P0.1:
241 fps, P1:
311 fps, max:
977 fps
~ 310 fps
226%
NVIDIA GeForce RTX 3070:
100 [X] Cooler Master MasterCase EG200 RTX 3070 Aorus 15G Intel Core i7-10875H 2.3GHz
NVIDIA GeForce RTX 3070
121.4 176 [X] AMD Ryzen 9 5900X 3.7GHz
NVIDIA GeForce RTX 3070
min:
161 fps, max:
189 fps
224 [X] AMD Ryzen 9 5900X 3.7GHz
NVIDIA GeForce RTX 3070
min:
207 fps, max:
243 fps
235 [X] Intel Core i7-10700 2.9GHz
NVIDIA GeForce RTX 3070
244 244 264 ~ 201 fps
215%
NVIDIA GeForce RTX 3060 Ti:
115 [X] Geekom Mini IT11 (Nvidia GeForce RTX 3060 Ti FE TB3) Intel Core i7-11390H 3.4GHz
NVIDIA GeForce RTX 3060 Ti
151.2 [X] Intel NUC 12 Pro Kit NUC12WSKi7 Intel Core i7-1260P 1.5GHz
NVIDIA GeForce RTX 3060 Ti
min:
24.1 fps, P0.1:
86.8 fps, P1:
114.5 fps, max:
364 fps
152 [X] Huawei MateBook X Pro 2023 (Nvidia GeForce RTX 3060 Ti FE TB3) Intel Core i7-1360P 1.6GHz
NVIDIA GeForce RTX 3060 Ti
218 232 [X] Nvidia GeForce RTX 3060 Ti FE AMD Ryzen 9 7900X 4.7GHz
NVIDIA GeForce RTX 3060 Ti
min:
96.3 fps, P0.1:
152.3 fps, P1:
194.8 fps, max:
782 fps
278 [X] Nvidia GeForce RTX 3060 Ti FE AMD Ryzen 9 7950X 4.5GHz
NVIDIA GeForce RTX 3060 Ti
min:
94.5 fps, P0.1:
182.3 fps, P1:
228 fps, max:
790 fps
~ 191 fps
221%
NVIDIA GeForce RTX 3070:
52.8 [X] Cooler Master MasterCase EG200 RTX 3070 Aorus 15G Intel Core i7-10875H 2.3GHz
NVIDIA GeForce RTX 3070
70.4 121 [X] AMD Ryzen 9 5900X 3.7GHz
NVIDIA GeForce RTX 3070
min:
112 fps, max:
134 fps
121 [X] Intel Core i7-10700 2.9GHz
NVIDIA GeForce RTX 3070
122 [X] AMD Ryzen 9 5900X 3.7GHz
NVIDIA GeForce RTX 3070
min:
110 fps, max:
138 fps
123 132.2 ~ 106 fps
196%
NVIDIA GeForce RTX 3060 Ti:
64.6 [X] Geekom Mini IT11 (Nvidia GeForce RTX 3060 Ti FE TB3) Intel Core i7-11390H 3.4GHz
NVIDIA GeForce RTX 3060 Ti
75.1 [X] Huawei MateBook X Pro 2023 (Nvidia GeForce RTX 3060 Ti FE TB3) Intel Core i7-1360P 1.6GHz
NVIDIA GeForce RTX 3060 Ti
75.3 [X] Intel NUC 12 Pro Kit NUC12WSKi7 Intel Core i7-1260P 1.5GHz
NVIDIA GeForce RTX 3060 Ti
min:
40.5 fps, P0.1:
52.6 fps, P1:
59.5 fps, max:
173.3 fps
109 115.7 [X] Nvidia GeForce RTX 3060 Ti FE AMD Ryzen 9 7900X 4.7GHz
NVIDIA GeForce RTX 3060 Ti
min:
31.4 fps, P0.1:
79.7 fps, P1:
98.6 fps, max:
420 fps
124.3 [X] Nvidia GeForce RTX 3060 Ti FE AMD Ryzen 9 7950X 4.5GHz
NVIDIA GeForce RTX 3060 Ti
min:
35.1 fps, P0.1:
81.8 fps, P1:
103.5 fps, max:
390 fps
~ 94 fps
100%
GeForce RTX 3050 Ti Laptop GPU:
10 26 32.4 38.4 [X] XMG Prototyp AMD Ryzen 5 5600H 3.3GHz
GeForce RTX 3050 Ti Laptop GPU
min:
33 fps
~ 27 fps
330%
NVIDIA GeForce RTX 3070:
84 [X] Intel Core i7-10700 2.9GHz
NVIDIA GeForce RTX 3070
88.2 [X] AMD Ryzen 9 5900X 3.7GHz
NVIDIA GeForce RTX 3070
min:
82 fps, max:
97 fps
89.6 90.9 [X] AMD Ryzen 9 5900X 3.7GHz
NVIDIA GeForce RTX 3070
min:
84 fps, max:
101 fps
93.9 ~ 89 fps
278%
NVIDIA GeForce RTX 3060 Ti:
54.6 [X] Geekom Mini IT11 (Nvidia GeForce RTX 3060 Ti FE TB3) Intel Core i7-11390H 3.4GHz
NVIDIA GeForce RTX 3060 Ti
71.9 [X] Huawei MateBook X Pro 2023 (Nvidia GeForce RTX 3060 Ti FE TB3) Intel Core i7-1360P 1.6GHz
NVIDIA GeForce RTX 3060 Ti
72.3 [X] Intel NUC 12 Pro Kit NUC12WSKi7 Intel Core i7-1260P 1.5GHz
NVIDIA GeForce RTX 3060 Ti
min:
48.3 fps, P0.1:
54.7 fps, P1:
59.9 fps, max:
170 fps
81.3 84.6 [X] Nvidia GeForce RTX 3060 Ti FE AMD Ryzen 9 7900X 4.7GHz
NVIDIA GeForce RTX 3060 Ti
min:
49.8 fps, P0.1:
67.3 fps, P1:
74.9 fps, max:
453 fps
85.6 [X] Nvidia GeForce RTX 3060 Ti FE AMD Ryzen 9 7950X 4.5GHz
NVIDIA GeForce RTX 3060 Ti
min:
59 fps, P0.1:
67.3 fps, P1:
74.7 fps, max:
139.4 fps
~ 75 fps
100%
GeForce RTX 3050 Ti Laptop GPU:
102.7 134 144 163 [X] SCHENKER Vision 14 Intel Core i7-11370H 3.3GHz
GeForce RTX 3050 Ti Laptop GPU
min:
5.05 fps, P1:
90.9 fps, max:
352 fps
170 170.6 172 172.8 174 [X] Dell G15 5515 AMD Ryzen 7 5800H 3.2GHz
GeForce RTX 3050 Ti Laptop GPU
min:
4.18 fps, P1:
125 fps, max:
264 fps
175 175 175.1 [X] Asus VivoBook Pro 16 Intel Core i7-12700H 1.7GHz
GeForce RTX 3050 Ti Laptop GPU
min:
3.22 fps, P1:
125 fps, max:
370 fps
176 179 [X] XMG Prototyp AMD Ryzen 5 5600H 3.3GHz
GeForce RTX 3050 Ti Laptop GPU
min:
3.34 fps, P1:
143 fps, max:
277 fps
179 179.5 [X] HP Victus 15 fa0020nr Intel Core i7-12700H 1.7GHz
GeForce RTX 3050 Ti Laptop GPU
min:
4.1 fps, P1:
125 fps, max:
322 fps
179.7 180 181 181.7 185 ~ 169 fps
108%
NVIDIA GeForce RTX 3070:
180 [X] Intel Core i7-10700 2.9GHz
NVIDIA GeForce RTX 3070
min:
3.38 fps, P1:
143 fps, max:
409 fps
182 [X] AMD Ryzen 9 5900X 3.7GHz
NVIDIA GeForce RTX 3070
min:
2.89 fps, P1:
125 fps, max:
455 fps
184 [X] AMD Ryzen 9 5900X 3.7GHz
NVIDIA GeForce RTX 3070
min:
2.18 fps, P1:
125 fps, max:
539 fps
184.7 ~ 183 fps
107%
NVIDIA GeForce RTX 3060 Ti:
161.7 [X] Geekom Mini IT11 (Nvidia GeForce RTX 3060 Ti FE TB3) Intel Core i7-11390H 3.4GHz
NVIDIA GeForce RTX 3060 Ti
min:
5.58 fps, P1:
100 fps, max:
293 fps
175 [X] Huawei MateBook X Pro 2023 (Nvidia GeForce RTX 3060 Ti FE TB3) Intel Core i7-1360P 1.6GHz
NVIDIA GeForce RTX 3060 Ti
min:
4.02 fps, P1:
111.1 fps, max:
344 fps
178.5 [X] Intel NUC 12 Pro Kit NUC12WSKi7 Intel Core i7-1260P 1.5GHz
NVIDIA GeForce RTX 3060 Ti
min:
4.33 fps, P1:
125 fps, max:
287 fps
187.5 [X] Nvidia GeForce RTX 3060 Ti FE AMD Ryzen 9 5900X 3.7GHz
NVIDIA GeForce RTX 3060 Ti
min:
4.56 fps, P1:
200 fps, max:
420 fps
187.5 [X] Nvidia GeForce RTX 3060 Ti FE AMD Ryzen 9 7900X 4.7GHz
NVIDIA GeForce RTX 3060 Ti
min:
8.78 fps, P1:
200 fps, max:
510 fps
188 [X] Nvidia GeForce RTX 3060 Ti FE AMD Ryzen 9 7950X 4.5GHz
NVIDIA GeForce RTX 3060 Ti
min:
5.45 fps, P1:
200 fps, max:
663 fps
~ 180 fps
100%
GeForce RTX 3050 Ti Laptop GPU:
88.4 118 136 154 [X] SCHENKER Vision 14 Intel Core i7-11370H 3.3GHz
GeForce RTX 3050 Ti Laptop GPU
min:
4.56 fps, P1:
83.3 fps, max:
296 fps
156.1 160.7 163 163.3 164 [X] Dell G15 5515 AMD Ryzen 7 5800H 3.2GHz
GeForce RTX 3050 Ti Laptop GPU
min:
4.78 fps, P1:
100 fps, max:
277 fps
166 167.2 167.7 [X] HP Victus 16-e0145ng AMD Ryzen 5 5600H 3.3GHz
GeForce RTX 3050 Ti Laptop GPU
min:
3.96 fps, P1:
111.1 fps, max:
274 fps
169 169 170.9 [X] Asus VivoBook Pro 16 Intel Core i7-12700H 1.7GHz
GeForce RTX 3050 Ti Laptop GPU
min:
56.3 fps, P1:
111.1 fps, max:
273 fps
172 173 [X] HP Victus 15 fa0020nr Intel Core i7-12700H 1.7GHz
GeForce RTX 3050 Ti Laptop GPU
min:
3.33 fps, P1:
111.1 fps, max:
301 fps
173.8 174 176.1 180 [X] SCHENKER XMG Focus 15 Intel Core i7-11800H 2.3GHz
GeForce RTX 3050 Ti Laptop GPU
min:
2.92 fps, P1:
125 fps, max:
373 fps
180 [X] SCHENKER XMG Focus 17 Intel Core i7-11800H 2.3GHz
GeForce RTX 3050 Ti Laptop GPU
min:
3.06 fps, P1:
143 fps, max:
315 fps
181.3 ~ 162 fps
108%
NVIDIA GeForce RTX 3070:
172 [X] AMD Ryzen 9 5900X 3.7GHz
NVIDIA GeForce RTX 3070
min:
0.3776 fps, P1:
100 fps, max:
424 fps
173 [X] Intel Core i7-10700 2.9GHz
NVIDIA GeForce RTX 3070
min:
3.46 fps, P1:
125 fps, max:
371 fps
175 [X] AMD Ryzen 9 5900X 3.7GHz
NVIDIA GeForce RTX 3070
min:
4.2 fps, P1:
111 fps, max:
399 fps
181.6 ~ 175 fps
109%
NVIDIA GeForce RTX 3060 Ti:
151.4 [X] Geekom Mini IT11 (Nvidia GeForce RTX 3060 Ti FE TB3) Intel Core i7-11390H 3.4GHz
NVIDIA GeForce RTX 3060 Ti
min:
4.44 fps, P1:
90.9 fps, max:
307 fps
170.5 [X] Huawei MateBook X Pro 2023 (Nvidia GeForce RTX 3060 Ti FE TB3) Intel Core i7-1360P 1.6GHz
NVIDIA GeForce RTX 3060 Ti
min:
4.96 fps, P1:
111.1 fps, max:
346 fps
172.4 [X] Intel NUC 12 Pro Kit NUC12WSKi7 Intel Core i7-1260P 1.5GHz
NVIDIA GeForce RTX 3060 Ti
min:
4.85 fps, P1:
111.1 fps, max:
278 fps
186.1 [X] Nvidia GeForce RTX 3060 Ti FE AMD Ryzen 9 5900X 3.7GHz
NVIDIA GeForce RTX 3060 Ti
min:
2.12 fps, P1:
166.7 fps, max:
452 fps
187.4 [X] Nvidia GeForce RTX 3060 Ti FE AMD Ryzen 9 7900X 4.7GHz
NVIDIA GeForce RTX 3060 Ti
min:
6.07 fps, P1:
200 fps, max:
395 fps
187.8 [X] Nvidia GeForce RTX 3060 Ti FE AMD Ryzen 9 7950X 4.5GHz
NVIDIA GeForce RTX 3060 Ti
min:
3.68 fps, P1:
200 fps, max:
623 fps
~ 176 fps
100%
GeForce RTX 3050 Ti Laptop GPU:
53.8 62.2 85.6 90.3 104 [X] SCHENKER Vision 14 Intel Core i7-11370H 3.3GHz
GeForce RTX 3050 Ti Laptop GPU
min:
8.49 fps, P1:
71.4 fps, max:
198 fps
110 111 111.9 [X] Asus VivoBook Pro 16 Intel Core i7-12700H 1.7GHz
GeForce RTX 3050 Ti Laptop GPU
min:
37.8 fps, P1:
76.9 fps, max:
231 fps
114 114.3 119.9 121 122 123.7 124 125 [X] Dell G15 5515 AMD Ryzen 7 5800H 3.2GHz
GeForce RTX 3050 Ti Laptop GPU
min:
29.7 fps, P1:
90.9 fps, max:
180 fps
129 [X] XMG Prototyp AMD Ryzen 5 5600H 3.3GHz
GeForce RTX 3050 Ti Laptop GPU
min:
43.5 fps, P1:
90.9 fps, max:
196 fps
130 130.6 131 131.4 [X] HP Victus 16-e0145ng AMD Ryzen 5 5600H 3.3GHz
GeForce RTX 3050 Ti Laptop GPU
min:
38.8 fps, P1:
100 fps, max:
203 fps
144.7 [X] HP Victus 15 fa0020nr Intel Core i7-12700H 1.7GHz
GeForce RTX 3050 Ti Laptop GPU
min:
4.22 fps, P1:
90.9 fps, max:
245 fps
147 [X] SCHENKER XMG Focus 15 Intel Core i7-11800H 2.3GHz
GeForce RTX 3050 Ti Laptop GPU
min:
4.88 fps, P1:
100 fps, max:
302 fps
148.7 149 [X] SCHENKER XMG Focus 17 Intel Core i7-11800H 2.3GHz
GeForce RTX 3050 Ti Laptop GPU
min:
4.65 fps, P1:
100 fps, max:
291 fps
~ 117 fps
142%
NVIDIA GeForce RTX 3070:
157 [X] AMD Ryzen 9 5900X 3.7GHz
NVIDIA GeForce RTX 3070
min:
3.65 fps, P1:
90.9 fps, max:
354 fps
161 [X] Intel Core i7-10700 2.9GHz
NVIDIA GeForce RTX 3070
min:
6.66 fps, P1:
100 fps, max:
318 fps
170 [X] AMD Ryzen 9 5900X 3.7GHz
NVIDIA GeForce RTX 3070
min:
3.14 fps, P1:
100 fps, max:
356 fps
177.7 ~ 166 fps
133%
NVIDIA GeForce RTX 3060 Ti:
92.1 [X] Geekom Mini IT11 (Nvidia GeForce RTX 3060 Ti FE TB3) Intel Core i7-11390H 3.4GHz
NVIDIA GeForce RTX 3060 Ti
min:
6.52 fps, P1:
55.6 fps, max:
193.8 fps
128.2 [X] Intel NUC 12 Pro Kit NUC12WSKi7 Intel Core i7-1260P 1.5GHz
NVIDIA GeForce RTX 3060 Ti
min:
33.8 fps, P1:
83.3 fps, max:
260 fps
156.5 [X] Huawei MateBook X Pro 2023 (Nvidia GeForce RTX 3060 Ti FE TB3) Intel Core i7-1360P 1.6GHz
NVIDIA GeForce RTX 3060 Ti
min:
3.57 fps, P1:
100 fps, max:
355 fps
181.5 [X] Nvidia GeForce RTX 3060 Ti FE AMD Ryzen 9 5900X 3.7GHz
NVIDIA GeForce RTX 3060 Ti
min:
2.85 fps, P1:
142.9 fps, max:
361 fps
186.8 [X] Nvidia GeForce RTX 3060 Ti FE AMD Ryzen 9 7900X 4.7GHz
NVIDIA GeForce RTX 3060 Ti
min:
7.33 fps, P1:
166.7 fps, max:
495 fps
187.9 [X] Nvidia GeForce RTX 3060 Ti FE AMD Ryzen 9 7950X 4.5GHz
NVIDIA GeForce RTX 3060 Ti
min:
5.83 fps, P1:
200 fps, max:
574 fps
~ 156 fps
100%
GeForce RTX 3050 Ti Laptop GPU:
27.8 39.6 49.9 52.2 [X] SCHENKER Vision 14 Intel Core i7-11370H 3.3GHz
GeForce RTX 3050 Ti Laptop GPU
min:
9.58 fps, P1:
29.4 fps, max:
142 fps
53.8 [X] Asus VivoBook Pro 16 Intel Core i7-12700H 1.7GHz
GeForce RTX 3050 Ti Laptop GPU
min:
30.1 fps, P1:
38.5 fps, max:
98.5 fps
54.9 55 57.1 57.2 63.2 63.9 65.6 66.7 66.9 67.5 69 71.6 71.8 [X] Dell G15 5515 AMD Ryzen 7 5800H 3.2GHz
GeForce RTX 3050 Ti Laptop GPU
min:
21.9 fps, P1:
52.6 fps, max:
119 fps
72.2 72.9 [X] XMG Prototyp AMD Ryzen 5 5600H 3.3GHz
GeForce RTX 3050 Ti Laptop GPU
min:
25.9 fps, P1:
52.6 fps, max:
120 fps
73.1 [X] HP Victus 15 fa0020nr Intel Core i7-12700H 1.7GHz
GeForce RTX 3050 Ti Laptop GPU
min:
6.87 fps, P1:
47.6 fps, max:
123.1 fps
73.5 73.7 [X] HP Victus 16-e0145ng AMD Ryzen 5 5600H 3.3GHz
GeForce RTX 3050 Ti Laptop GPU
min:
21 fps, P1:
52.6 fps, max:
124 fps
74.5 [X] SCHENKER XMG Focus 15 Intel Core i7-11800H 2.3GHz
GeForce RTX 3050 Ti Laptop GPU
min:
24.4 fps, P1:
50 fps, max:
144 fps
75.4 75.6 [X] SCHENKER XMG Focus 17 Intel Core i7-11800H 2.3GHz
GeForce RTX 3050 Ti Laptop GPU
min:
40.2 fps, P1:
50 fps, max:
136 fps
~ 63 fps
165%
NVIDIA GeForce RTX 3070:
91.1 [X] AMD Ryzen 9 5900X 3.7GHz
NVIDIA GeForce RTX 3070
min:
4.66 fps, P1:
52.6 fps, max:
233 fps
95.6 [X] Intel Core i7-10700 2.9GHz
NVIDIA GeForce RTX 3070
min:
6.11 fps, P1:
66.7 fps, max:
180 fps
108 [X] AMD Ryzen 9 5900X 3.7GHz
NVIDIA GeForce RTX 3070
min:
4.47 fps, P1:
71.4 fps, max:
218 fps
122.4 ~ 104 fps
176%
NVIDIA GeForce RTX 3060 Ti:
56.7 [X] Geekom Mini IT11 (Nvidia GeForce RTX 3060 Ti FE TB3) Intel Core i7-11390H 3.4GHz
NVIDIA GeForce RTX 3060 Ti
min:
16.3 fps, P1:
20.4 fps, max:
152.8 fps
85.1 [X] Intel NUC 12 Pro Kit NUC12WSKi7 Intel Core i7-1260P 1.5GHz
NVIDIA GeForce RTX 3060 Ti
min:
17.4 fps, P1:
52.6 fps, max:
186.7 fps
94.5 [X] Huawei MateBook X Pro 2023 (Nvidia GeForce RTX 3060 Ti FE TB3) Intel Core i7-1360P 1.6GHz
NVIDIA GeForce RTX 3060 Ti
min:
18.2 fps, P1:
62.5 fps, max:
190.9 fps
131.2 [X] Nvidia GeForce RTX 3060 Ti FE AMD Ryzen 9 5900X 3.7GHz
NVIDIA GeForce RTX 3060 Ti
min:
5.33 fps, P1:
90.9 fps, max:
238 fps
146.6 [X] Nvidia GeForce RTX 3060 Ti FE AMD Ryzen 9 7900X 4.7GHz
NVIDIA GeForce RTX 3060 Ti
min:
3.98 fps, P1:
100 fps, max:
287 fps
149.9 [X] Nvidia GeForce RTX 3060 Ti FE AMD Ryzen 9 7950X 4.5GHz
NVIDIA GeForce RTX 3060 Ti
min:
6.21 fps, P1:
100 fps, max:
286 fps
~ 111 fps
237%
NVIDIA GeForce RTX 3070:
86.5 [X] AMD Ryzen 9 5900X 3.7GHz
NVIDIA GeForce RTX 3070
min:
4.41 fps, P1:
52.6 fps, max:
212 fps
91.6 [X] Intel Core i7-10700 2.9GHz
NVIDIA GeForce RTX 3070
min:
4.49 fps, P1:
62.5 fps, max:
195 fps
98.3 [X] AMD Ryzen 9 5900X 3.7GHz
NVIDIA GeForce RTX 3070
min:
6.76 fps, P1:
62.5 fps, max:
249 fps
113.1 ~ 97 fps
212%
NVIDIA GeForce RTX 3060 Ti:
38.9 [X] Geekom Mini IT11 (Nvidia GeForce RTX 3060 Ti FE TB3) Intel Core i7-11390H 3.4GHz
NVIDIA GeForce RTX 3060 Ti
min:
10.5 fps, P1:
17.2 fps, max:
118.8 fps
57.8 [X] Intel NUC 12 Pro Kit NUC12WSKi7 Intel Core i7-1260P 1.5GHz
NVIDIA GeForce RTX 3060 Ti
min:
15.7 fps, P1:
32.3 fps, max:
150.9 fps
86.3 [X] Huawei MateBook X Pro 2023 (Nvidia GeForce RTX 3060 Ti FE TB3) Intel Core i7-1360P 1.6GHz
NVIDIA GeForce RTX 3060 Ti
min:
15.8 fps, P1:
52.6 fps, max:
172 fps
107.4 [X] Nvidia GeForce RTX 3060 Ti FE AMD Ryzen 9 5900X 3.7GHz
NVIDIA GeForce RTX 3060 Ti
min:
7.56 fps, P1:
71.4 fps, max:
221 fps
115.6 [X] Nvidia GeForce RTX 3060 Ti FE AMD Ryzen 9 7900X 4.7GHz
NVIDIA GeForce RTX 3060 Ti
min:
8.29 fps, P1:
76.9 fps, max:
257 fps
117 [X] Nvidia GeForce RTX 3060 Ti FE AMD Ryzen 9 7950X 4.5GHz
NVIDIA GeForce RTX 3060 Ti
min:
8.45 fps, P1:
76.9 fps, max:
225 fps
~ 87 fps
100%
GeForce RTX 3050 Ti Laptop GPU:
43.9 fps
264%
NVIDIA GeForce RTX 3070:
110 [X] Intel Core i7-10700 2.9GHz
NVIDIA GeForce RTX 3070
min:
9.32 fps, P1:
90.9 fps, max:
188 fps
112 [X] AMD Ryzen 9 5900X 3.7GHz
NVIDIA GeForce RTX 3070
min:
8.76 fps, P1:
76.9 fps, max:
213 fps
117 [X] AMD Ryzen 9 5900X 3.7GHz
NVIDIA GeForce RTX 3070
min:
9.24 fps, P1:
76.9 fps, max:
263 fps
125.9 ~ 116 fps
196%
NVIDIA GeForce RTX 3060 Ti:
30.5 [X] Geekom Mini IT11 (Nvidia GeForce RTX 3060 Ti FE TB3) Intel Core i7-11390H 3.4GHz
NVIDIA GeForce RTX 3060 Ti
min:
8.77 fps, P1:
17.5 fps, max:
93.6 fps
39.4 [X] Intel NUC 12 Pro Kit NUC12WSKi7 Intel Core i7-1260P 1.5GHz
NVIDIA GeForce RTX 3060 Ti
min:
10.5 fps, P1:
18.2 fps, max:
128.5 fps
103.3 [X] Huawei MateBook X Pro 2023 (Nvidia GeForce RTX 3060 Ti FE TB3) Intel Core i7-1360P 1.6GHz
NVIDIA GeForce RTX 3060 Ti
min:
10.2 fps, P1:
71.4 fps, max:
240 fps
110.9 [X] Nvidia GeForce RTX 3060 Ti FE AMD Ryzen 9 5900X 3.7GHz
NVIDIA GeForce RTX 3060 Ti
min:
7.35 fps, P1:
83.3 fps, max:
275 fps
115.4 [X] Nvidia GeForce RTX 3060 Ti FE AMD Ryzen 9 7900X 4.7GHz
NVIDIA GeForce RTX 3060 Ti
min:
10.5 fps, P1:
83.3 fps, max:
269 fps
117.5 [X] Nvidia GeForce RTX 3060 Ti FE AMD Ryzen 9 7950X 4.5GHz
NVIDIA GeForce RTX 3060 Ti
min:
10.9 fps, P1:
83.3 fps, max:
340 fps
~ 86 fps
Average Gaming NVIDIA GeForce RTX 3050 Ti Laptop GPU → 100% Average Gaming 30-70 fps → 100%
Average Gaming NVIDIA GeForce RTX 3070 → 233% Average Gaming 30-70 fps → 280%
Average Gaming NVIDIA GeForce RTX 3060 Ti → 225% Average Gaming 30-70 fps → 251%
 Deutsch
 English
 Español
 Français
 Italiano
 Nederlands
 Polski
 Português
 Русский
 Türkçe
 Svenska
 Chinese
 Magyar