Intel HD Graphics 400 (Braswell) vs Intel HD Graphics 2000 vs Intel HD Graphics (Cherry Trail)
Intel HD Graphics 400 (Braswell) ► remove from comparison
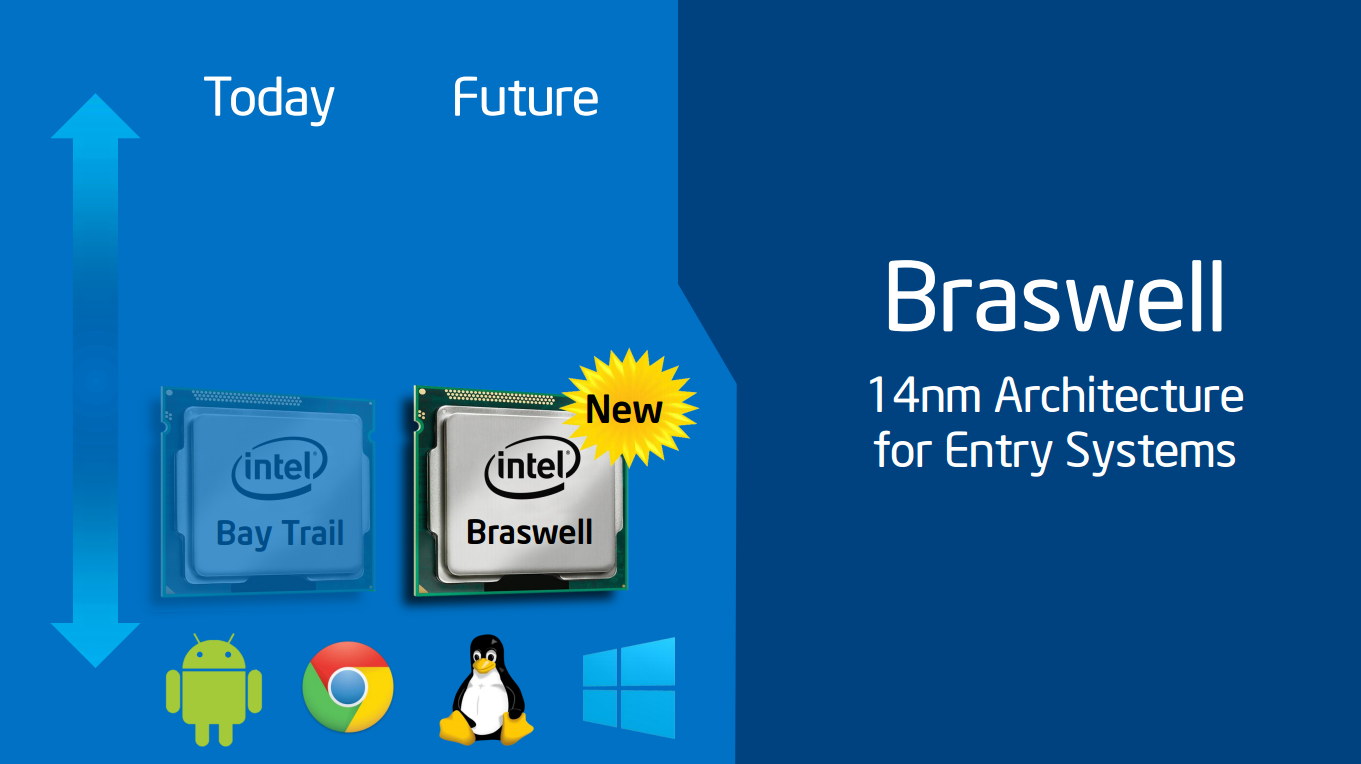
Die Intel HD Graphics 400 ist eine in den Low-End-SoCs der Braswell-Serie (z.B. Celeron Serie in 2016) integrierte Grafikeinheit. Sie basiert auf der gleichen Architektur wie die GPU verschiedener Broadwell-Prozessoren (z.B. HD Graphics 5300 ), bietet allerdings deutlich weniger Shadereinheiten und geringere Taktraten. Die genauen Spezifikationen hängen vom jeweiligen SoC ab: Die schnellste Variante bietet derzeit 12 EUs und maximal 640 MHz.
Anfangs wurde die GPU nur Intel HD Graphics benannt, später als Intel HD Graphics 400 (12 EU Version) und Intel HD Graphics 405 (16 EU Version) bezeichnet.
Anwender müssen sich deshalb insbesondere bei den Celeron-Modellen, die zusätzlich durch die Beschneidung auf nur zwei CPU-Kerne ausgebremst werden, auf ältere und anspruchslose Spiele beschränken. Videos werden dagegen auch in 4K/H.265 flüssig wiedergeben.
Für mehr Benchmarks besuchen sie auch die Seite der Intel HD Graphics (Braswell) GPU , welche Benchmarks der älteren baugleichen 12 und 16 EU Versionen beinhaltet.
Intel HD Graphics 2000 ► remove from comparison
Die Intel HD Graphics 2000 (oder Intel Graphics Media Accelerator HD 2000 oder GMA HD 2000) ist eine in den Sandy Bridge Prozessoren integrierte Grafikkarte. Sie komm in den meisten Desktop CPU zum Einsatz und heisst in den günstigen mobilen Prozessoren (Celeron und Pentium) nur Intel HD Graphics . Die HD Graphics 2000 bietet keinen eigenen dedizierten Speicher, teilt sich jedoch den sehr schnellen Level 3 Cache mit den Prozessorkernen. Der restliche Speicher wird vom Hauptspeicher abgezwackt (wie bei der Vorgänger-Grafikkarte Intel HD Graphics ). Dank Turbo Boost kann sich die Grafikkarte wie die Prozessorkerne in gewissen Lastsituationen übertakten (bei ausreichend Kühlung). Die Intel GMA HD2000 bietet nur die Hälfte der 12 Execution Units (EUs) der GMA HD 3000 und ist dadurch deutlich langsamer.
Je nach Prozessor weist die HD Graphics 2000 eine unterschiedliche Basis- und Turbo-Taktrate auf. Im Desktop Einsteigs Core i3-2100 z.B. 850 bzw 1100 MHz. Im schnellen i7-2600 850 bzw. 1350MHz. Die mobilen Ableger werden wahrscheinlich deutlich geringer getaktet sein.
Unsere Performance Tests haben wir mit einem i5-2400 Desktop Prozessor durchgeführt. Dieser taktet die Grafikkarte mit 850MHz bzw 1100MHz (Turbo Boost). In den Spieletests plazierte sich die HD Graphics 2000 etwa auf dem Niveau einer Geforce G 105M und damit leicht oberhalb der alten Intel HD Graphics Grafikkarte. Damit sind anspruchslose Spiele wie Sims 3 oder World of Warcraft in niedrigen Details flüssig spielbar (mit einer ausreichend starken CPU).
Wie bei den Ivy Bridge basierten Grafikkarten, wird anscheinend auch bei Sandy Bridge 2x Antialiasing per Software aus dem 4x Antialiasing errechnet. Daher ergibt sich kein Geschwindigkeitsunterschied zwischen 2x und 4x AA. Im Unigine Valley Benchmark erreichten wir als Bestätigung bei 2x AA und 4x AA das selbe Ergebnis (HD Graphics 3000 ULV im i7-2637M).
Neben der GPU ist auch noch eine dedizierte Einheit zum Dekodieren und auch Encodieren von HD Videos in den Sandy Bridge Prozessoren enthalten. Um ein dreiminütiges 1080p-Video für das iPhone in das Format 640x360 zu wandeln, braucht Sandy Bridge laut Intel etwa 14s (IDF 2010). Eine weitere Besonderheit ist der unterstützte "embedded DisplayPort" eDP um interne Displays anzusteuern.
Aufgrund der Integration in den mit 32nm gefertigten Prozessor und die halbierte Shaderzahl, ist der Stromverbrauch relativ gering und eignet sich auch für flache und kleine Notebooks.
Intel HD Graphics (Cherry Trail) ► remove from comparison
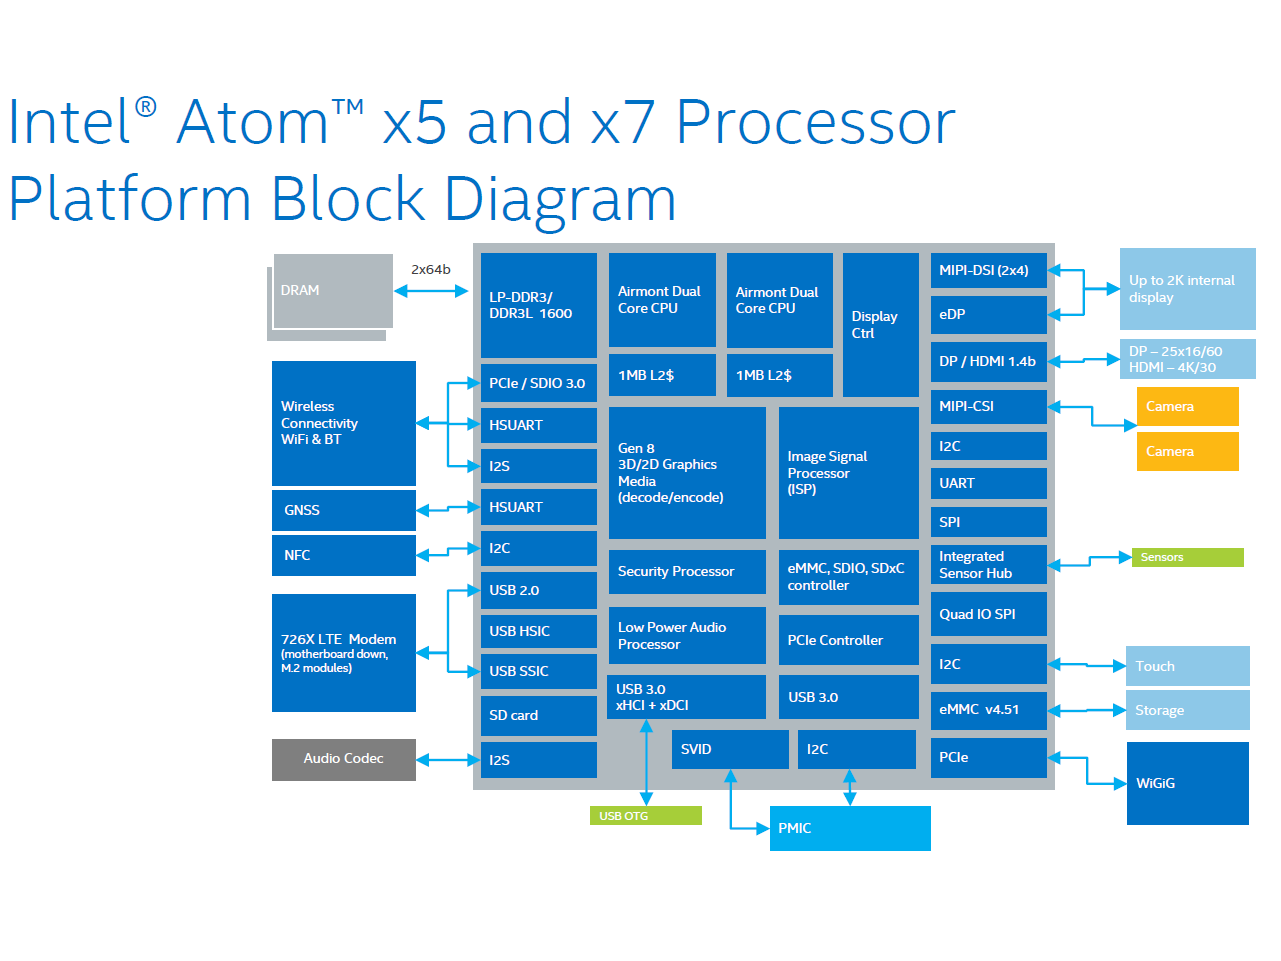
Die Intel HD Graphics (Cherry Trail) ist eine in den Tablet-SoCs der Cherry-Trail-Serie (z.B. Atom x7-Z8700 ) integrierte Grafikeinheit. Sie basiert auf der gleichen Architektur wie die GPU verschiedener Broadwell-Prozessoren (z.B. HD Graphics 5300 ), bietet allerdings deutlich weniger Shadereinheiten und geringere Taktraten. Die genauen Spezifikationen hängen vom jeweiligen SoC ab:
Die schnellste Variante mit 16 EUs und maximal 600 MHz schlägt die ältere HD Graphics (Bay Trail) um Faktor zwei, womit sich die GPU etwas oberhalb einer Qualcomm Adreno 330 oder PowerVR G6430 , jedoch deutlich unter einer Adreno 420 oder GX6450 einordnet. Auch Nvidias Tegra-SoCs K1 und X1 rechnen weitaus schneller.
Unter Windows werden sich Anwender deshalb weiter auf sehr alte und anspruchslose Spiele beschränken müssen, wohingegen moderne Android-Games auch in hohen Auflösungen zumeist flüssig dargestellt werden sollten. Der x7-Z8700 war z.B. nur knapp in der Lage Team Fortress 2 in minimalen Details und 1280x720 flüssig wiederzugeben (11 - 69 fps).
Videos kann die GPU auch in 4K/H.265 flüssig wiedergeben (je nach Bitrate und Farbtiefe).
Die Intel HD Graphics Grafikkarte in den Cherry Trail SoCs unterstützt nach unseren Tests mit dem MS Surface 3 mit Atom x7-Z8700 nur DisplayPort 1.1 und damit lediglich 30 Hz bei 4K (3.840 x 2.160).
Intel HD Graphics 400 (Braswell) Intel HD Graphics 2000 Intel HD Graphics (Cherry Trail) HD Graphics Serie Codename Braswell Sandy Bridge Cherry Trail Architektur Gen. 8 Gen. 6 Sandy Bridge Gen. 8 Pipelines 12 - unified 6 - unified 16 - unified Kerntakt 320 - 640 (Boost) MHz 850/1100 - 1350 (Boost) MHz 200 - 600 (Boost) MHz Speicherbandbreite 64/128 Bit 64/128 Bit 64/128 Bit Shared Memory ja ja ja API DirectX 11.2, Shader 5.0 DirectX 10.1, Shader 4.1 DirectX 12 (FL 11_1), Shader 5.0, OpenGL 4.3 Herstellungsprozess 14 nm 32 nm 14 nm Erscheinungsdatum 01.04.2016 01.02.2011 02.03.2015
Benchmarks Performance Rating - 3DMark 11 + Fire Strike + Time Spy - HD Graphics 400 (Braswell)
0.1 pt (0%)
Intel HD Graphics 400 (Braswell)
...
max:
Performance Rating - 3DMark 11 + Fire Strike + Time Spy - HD Graphics (Cherry Trail)
0.1 pt (0%)
Intel HD Graphics (Cherry Trail)
...
max:
3DMark - 3DMark Ice Storm Unlimited Graphics
min: 17968 avg: 20459 median: 20277 (2%) max: 23161 Points
min: 18563 avg: 20873 median: 19303 (2%) max: 27537 Points
3DMark - 3DMark Ice Storm Extreme Graphics
14334 Points (2%)
3DMark - 3DMark Cloud Gate Score
min: 1350 avg: 1553 median: 1457 (2%) max: 2087 Points
min: 769 avg: 1454 median: 1488 (2%) max: 1905 Points
3DMark - 3DMark Cloud Gate Graphics
min: 1519 avg: 1865 median: 1841 (0%) max: 2455 Points
min: 1537 avg: 1851 median: 1783.5 (0%) max: 2272 Points
3DMark - 3DMark Fire Strike Standard Score
min: 176 avg: 188 median: 188 (0%) max: 200 Points
min: 174 avg: 390.4 median: 248 (0%) max: 1059 Points
3DMark - 3DMark Fire Strike Standard Graphics
min: 202 avg: 218 median: 218 (0%) max: 234 Points
min: 193 avg: 233 median: 225 (0%) max: 281 Points
3DMark - 3DMark Ice Storm Graphics
min: 13689 avg: 18517 median: 18516.5 (2%) max: 23344 Points
min: 7544 avg: 16078 median: 17063.5 (2%) max: 23395 Points
3DMark - 3DMark Sling Shot (ES 3.0) Unlimited
min: 1502 avg: 1926 median: 1925.5 (8%) max: 2349 Points
min: 1445 avg: 1525 median: 1525 (7%) max: 1605 Points
3DMark - 3DMark Sling Shot (ES 3.0) Unlimited Graphics
min: 1452 avg: 2046 median: 2046 (4%) max: 2640 Points
min: 1598 avg: 1684 median: 1684 (4%) max: 1770 Points
3DMark - 3DMark Sling Shot Extreme (ES 3.1) Unlimited
1180 Points (6%)
min: 1072 avg: 1215 median: 1159 (6%) max: 1414 Points
3DMark - 3DMark Sling Shot Extreme (ES 3.1) Unlimited Graphics
977 Points (3%)
min: 1058 avg: 1251 median: 1142 (3%) max: 1554 Points
3DMark 11 - 3DM11 Performance Score
min: 289 avg: 386.1 median: 397 (1%) max: 478 Points
min: 314 avg: 359.4 median: 343 (0%) max: 562 Points
3DMark 11 - 3DM11 Performance GPU
min: 247 avg: 341.1 median: 349 (0%) max: 418 Points
min: 278 avg: 319.9 median: 298 (0%) max: 494 Points
3DMark Vantage + Intel HD Graphics 2000 3DMark Vantage - 3DM Vant. Perf. total
min: 789 avg: 896 median: 895.5 (0%) max: 1002 Points
3DM Vant. Perf. GPU no PhysX + Intel HD Graphics 2000 3DMark Vantage - 3DM Vant. Perf. GPU no PhysX
min: 626 avg: 695 median: 694.5 (0%) max: 763 Points
3DMark 2001SE - 3DMark 2001 - Standard
15201 Points (16%)
3DMark 03 - 3DMark 03 - Standard
min: 6077 avg: 7083 median: 7083 (4%) max: 8089 Points
3DMark 05 - 3DMark 05 - Standard
min: 4585 avg: 5194 median: 5193.5 (6%) max: 5802 Points
3DMark 06 3DMark 06 - Standard 1280x1024 + Intel HD Graphics 400 (Braswell)
2474 Points (3%)
3DMark 06 - Standard 1280x1024 + Intel HD Graphics 2000
min: 1217 avg: 2222 median: 2288 (3%) max: 3162 Points
3DMark 06 - Standard 1280x1024 + Intel HD Graphics (Cherry Trail)
min: 2403 avg: 2833 median: 2595 (3%) max: 3330 Points
3DMark 06 - Standard 1024x768 + Intel HD Graphics (Cherry Trail)
2877 Points (4%)
Unigine Valley 1.0 - Unigine Valley 1.0 DX
1.2 fps (0%)
Unigine Heaven 2.1 - Heaven 2.1 high
5.3 fps (1%)
5.7 fps (1%)
Windows 7 Experience Index - Win7 Gaming graphics
5.6 Points (71%)
Windows 7 Experience Index - Win7 Graphics
min: 4.5 avg: 4.9 median: 4.9 (61%) max: 5.2 Points
Cinebench R10 Cinebench R10 Shading (32bit) + Intel HD Graphics 400 (Braswell) Cinebench R10 - Cinebench R10 Shading (32bit)
min: 1627 avg: 2057 median: 2052.5 (1%) max: 2510 Points
Cinebench R10 Shading (32bit) + Intel HD Graphics 2000
min: 1169 avg: 2298 median: 2298 (2%) max: 3427 Points
Cinebench R10 Shading (32bit) + Intel HD Graphics (Cherry Trail)
min: 1192 avg: 2009 median: 1973 (1%) max: 2551 Points
Cinebench R11.5 Cinebench R11.5 OpenGL 64 Bit + Intel HD Graphics 400 (Braswell) Cinebench R11.5 - Cinebench R11.5 OpenGL 64 Bit
min: 9.97 avg: 10.1 median: 10 (3%) max: 10.12 fps
Cinebench R11.5 OpenGL 64 Bit + Intel HD Graphics 2000
min: 2.69 avg: 5.1 median: 5.9 (2%) max: 6.68 fps
Cinebench R11.5 OpenGL 64 Bit + Intel HD Graphics (Cherry Trail)
min: 4.01 avg: 8.8 median: 8.4 (3%) max: 11.71 fps
Cinebench R15 + Intel HD Graphics 400 (Braswell) Cinebench R15 - Cinebench R15 OpenGL 64 Bit
min: 8.48 avg: 11 median: 11.3 (1%) max: 13.98 fps
Cinebench R15 OpenGL 64 Bit + Intel HD Graphics (Cherry Trail)
min: 6.64 avg: 10.3 median: 9.7 (1%) max: 15.52 fps
Cinebench R15 OpenGL Ref. Match 64 Bit + Intel HD Graphics 400 (Braswell) Cinebench R15 - Cinebench R15 OpenGL Ref. Match 64 Bit
98 % (98%)
Cinebench R15 OpenGL Ref. Match 64 Bit + Intel HD Graphics (Cherry Trail)
min: 98 avg: 98 median: 98 (98%) max: 98.6 %
GFXBench - GFXBench 5.0 Aztec Ruins High Tier Offscreen
3.3 fps (1%)
GFXBench - GFXBench 5.0 Aztec Ruins Normal Tier Offscreen
9.3 fps (1%)
GFXBench - GFXBench Car Chase Offscreen
min: 6.3 avg: 7.3 median: 7 (1%) max: 9 fps
GFXBench 3.1 - GFXBench Manhattan ES 3.1 Offscreen
min: 7.2 avg: 10.6 median: 10.6 (0%) max: 14 fps
min: 9.2 avg: 10.8 median: 11 (0%) max: 13 fps
GFXBench 3.0 - GFXBench 3.0 Manhattan Offscreen
min: 14 avg: 16 median: 16 (1%) max: 18 fps
min: 8.4 avg: 13.8 median: 13.5 (1%) max: 18 fps
GFXBench (DX / GLBenchmark) 2.7 + Intel HD Graphics 400 (Braswell) GFXBench (DX / GLBenchmark) 2.7 - GFXBench T-Rex HD Offscreen C24Z16
min: 27 avg: 29 median: 29 (0%) max: 31 fps
GFXBench T-Rex HD Offscreen C24Z16 + Intel HD Graphics (Cherry Trail) min: 22 avg: 30.5 median: 32 (0%) max: 38.5 fps
LuxMark v2.0 64Bit - LuxMark v2.0 Room GPU
min: 48 avg: 58.7 median: 59 (0%) max: 69 Samples/s
LuxMark v2.0 64Bit - LuxMark v2.0 Sala GPU
min: 69 avg: 87.7 median: 89 (0%) max: 105 Samples/s
ComputeMark v2.1 - ComputeMark v2.1 Result
277 Points (0%)
Average Benchmarks Intel HD Graphics 400 (Braswell) → 100% n=3 Average Benchmarks Intel HD Graphics 2000 → 88% n=3 Average Benchmarks Intel HD Graphics (Cherry Trail) → 95% n=3
- Bereich der Benchmarkergebnisse für diese Grafikkarte
- Durchschnittliche Benchmarkergebnisse für diese Grafikkarte
* Smaller numbers mean a higher performance
1 This benchmark is not used for the average calculation
Spiele-Benchmarks Die folgenden Benchmarks basieren auf unseren Spieletests mit Testnotebooks. Die Performance dieser Grafikkarte bei den gelisteten Spielen ist abhängig von der verwendeten CPU, Speicherausstattung, Treiber und auch Betriebssystem. Dadurch müssen die untenstehenden Werte nicht repräsentativ sein. Detaillierte Informationen über das verwendete System sehen Sie nach einem Klick auf den fps-Wert.
100%
HD Graphics 400 (Braswell):
14.1 fps
100%
HD Graphics 400 (Braswell):
18.5 fps
116%
HD Graphics (Cherry Trail):
21.4 fps
100%
HD Graphics 400 (Braswell):
16 fps
100%
HD Graphics 400 (Braswell):
12.7 fps
122%
HD Graphics (Cherry Trail):
15.5 fps
100%
HD Graphics 400 (Braswell):
6.8 fps
100%
HD Graphics 400 (Braswell):
10.7 fps
100%
HD Graphics 400 (Braswell):
20.9 fps
108%
HD Graphics (Cherry Trail):
22.6 [X] Chuwi Hi12 Intel Atom x5-Z8300 1.4GHz
HD Graphics (Cherry Trail)
min:
21 fps, max:
27 fps
fps
100%
HD Graphics 400 (Braswell):
5.8 fps
100%
HD Graphics 400 (Braswell):
9.7 fps
100%
HD Graphics 400 (Braswell):
15 15.1 ~ 15 fps
100%
HD Graphics 400 (Braswell):
9.5 9.7 ~ 10 fps
100%
HD Graphics 400 (Braswell):
5.3 fps
100%
HD Graphics 400 (Braswell):
7.3 fps
158%
HD Graphics (Cherry Trail):
11.5 fps
100%
HD Graphics 400 (Braswell):
3.2 fps
219%
HD Graphics (Cherry Trail):
7 fps
HD Graphics (Cherry Trail):
8.8 fps
HD Graphics (Cherry Trail):
4.8 fps
HD Graphics (Cherry Trail):
8.1 fps
HD Graphics (Cherry Trail):
3.9 fps
100%
HD Graphics 400 (Braswell):
36.5 fps
100%
HD Graphics 400 (Braswell):
14.2 fps
100%
HD Graphics 400 (Braswell):
9 fps
100%
HD Graphics 400 (Braswell):
13 fps
115%
HD Graphics (Cherry Trail):
13.9 [X] Chuwi Hi12 Intel Atom x5-Z8300 1.4GHz
HD Graphics (Cherry Trail)
min:
7 fps, max:
19 fps
16.8 ~ 15 fps
100%
HD Graphics 400 (Braswell):
8 fps
100%
HD Graphics 400 (Braswell):
13.3 fps
114%
HD Graphics (Cherry Trail):
15.1 fps
HD Graphics (Cherry Trail):
9.8 fps
100%
HD Graphics 400 (Braswell):
21.3 fps
94%
HD Graphics (Cherry Trail):
20 [X] Chuwi Hi12 Intel Atom x5-Z8300 1.4GHz
HD Graphics (Cherry Trail)
min:
18 fps
fps
100%
HD Graphics 400 (Braswell):
11.4 fps
133%
HD Graphics (Cherry Trail):
15.2 [X] Chuwi Hi12 Intel Atom x5-Z8300 1.4GHz
HD Graphics (Cherry Trail)
min:
13 fps
fps
HD Graphics (Cherry Trail):
7.2 [X] Chuwi Hi12 Intel Atom x5-Z8300 1.4GHz
HD Graphics (Cherry Trail)
min:
6 fps
fps
100%
HD Graphics 400 (Braswell):
8.5 fps
100%
HD Graphics 400 (Braswell):
5.6 fps
100%
HD Graphics 400 (Braswell):
40.1 fps
50%
HD Graphics (Cherry Trail):
20.1 fps
100%
HD Graphics 400 (Braswell):
11.7 fps
107%
HD Graphics (Cherry Trail):
12.5 fps
100%
HD Graphics 400 (Braswell):
14.3 fps
76%
HD Graphics (Cherry Trail):
10.8 (!) [X] Microsoft Surface 3 Intel Atom x7-Z8700 1.6GHz
HD Graphics (Cherry Trail)
fps
100%
HD Graphics 400 (Braswell):
5.4 fps
176%
HD Graphics (Cherry Trail):
9.5 fps
100%
HD Graphics 400 (Braswell):
2.9 fps
197%
HD Graphics (Cherry Trail):
5.7 fps
HD Graphics (Cherry Trail):
16.2 fps
HD Graphics (Cherry Trail):
6.1 fps
100%
HD Graphics 400 (Braswell):
27 fps
59%
HD Graphics (Cherry Trail):
16 fps
100%
HD Graphics 400 (Braswell):
16 fps
75%
HD Graphics (Cherry Trail):
12 fps
100%
HD Graphics 400 (Braswell):
11.5 11.9 ~ 12 fps
100%
HD Graphics 400 (Braswell):
7 fps
HD Graphics (Cherry Trail):
15.6 fps
100%
HD Graphics 400 (Braswell):
37 fps
100%
HD Graphics 400 (Braswell):
7.6 fps
HD Graphics (Cherry Trail):
5.5 10 ~ 8 fps
100%
HD Graphics 400 (Braswell):
6.5 fps
100%
HD Graphics 400 (Braswell):
4.8 fps
100%
HD Graphics 400 (Braswell):
28.9 fps
87%
HD Graphics (Cherry Trail):
22 27.3 ~ 25 fps
100%
HD Graphics 400 (Braswell):
12.5 fps
104%
HD Graphics (Cherry Trail):
12.5 13.5 ~ 13 fps
100%
HD Graphics 400 (Braswell):
11.8 fps
100%
HD Graphics 400 (Braswell):
16.2 fps
82%
HD Graphics (Cherry Trail):
13.3 fps
100%
HD Graphics 400 (Braswell):
12.3 fps
100%
HD Graphics 400 (Braswell):
7.9 fps
100%
HD Graphics 400 (Braswell):
30 fps
100%
HD Graphics 400 (Braswell):
28 fps
100%
HD Graphics 400 (Braswell):
17 fps
100%
HD Graphics 400 (Braswell):
30 fps
193%
HD Graphics (Cherry Trail):
58 fps
100%
HD Graphics 400 (Braswell):
30 fps
157%
HD Graphics (Cherry Trail):
47 fps
HD Graphics (Cherry Trail):
29.7 fps
HD Graphics (Cherry Trail):
16.5 fps
100%
HD Graphics 400 (Braswell):
19.9 fps
121%
HD Graphics (Cherry Trail):
24 fps
100%
HD Graphics 400 (Braswell):
12.5 fps
108%
HD Graphics (Cherry Trail):
13.5 fps
100%
HD Graphics 400 (Braswell):
6.2 fps
100%
HD Graphics 400 (Braswell):
1.8 fps
111%
HD Graphics (Cherry Trail):
2.4 2.6 ~ 2 fps
100%
HD Graphics 400 (Braswell):
24.8 fps
100%
HD Graphics 400 (Braswell):
10.2 (!) fps
HD Graphics (Cherry Trail):
7 8.3 9 ~ 8 fps
HD Graphics (Cherry Trail):
3.7 3.8 ~ 4 fps
100%
HD Graphics 400 (Braswell):
21.1 fps
100%
HD Graphics 400 (Braswell):
10.8 fps
100%
HD Graphics 400 (Braswell):
8.7 fps
HD Graphics (Cherry Trail):
34 fps
HD Graphics (Cherry Trail):
15.2 fps
HD Graphics (Cherry Trail):
11.6 fps
HD Graphics (Cherry Trail):
0 (!) [X] Microsoft Surface 3 Intel Atom x7-Z8700 1.6GHz
HD Graphics (Cherry Trail)
fps
HD Graphics (Cherry Trail):
0 (!) [X] Microsoft Surface 3 Intel Atom x7-Z8700 1.6GHz
HD Graphics (Cherry Trail)
fps
100%
HD Graphics 400 (Braswell):
10.5 fps
HD Graphics (Cherry Trail):
20.3 fps
HD Graphics (Cherry Trail):
11.4 fps
100%
HD Graphics 400 (Braswell):
18.3 fps
132%
HD Graphics 2000:
24.1 fps
153%
HD Graphics (Cherry Trail):
24.3 [X] Chuwi Hi12 Intel Atom x5-Z8300 1.4GHz
HD Graphics (Cherry Trail)
min:
20 fps, max:
29 fps
31.9 ~ 28 fps
HD Graphics (Cherry Trail):
16 [X] Chuwi Hi12 Intel Atom x5-Z8300 1.4GHz
HD Graphics (Cherry Trail)
min:
13 fps, max:
19 fps
19 ~ 18 fps
HD Graphics 2000:
11.9 fps
100%
HD Graphics 400 (Braswell):
27.7 fps
HD Graphics (Cherry Trail):
8 fps
100%
HD Graphics 400 (Braswell):
19.8 fps
71%
HD Graphics 2000:
14 fps
86%
HD Graphics (Cherry Trail):
15.5 18.9 ~ 17 fps
100%
HD Graphics 400 (Braswell):
9.5 fps
84%
HD Graphics (Cherry Trail):
7.2 8.5 ~ 8 fps
HD Graphics 2000:
117 [X] Desktop Intel Core i5-2400 3.1GHz
HD Graphics 2000
fps
HD Graphics 2000:
56 [X] Desktop Intel Core i5-2400 3.1GHz
HD Graphics 2000
fps
HD Graphics 2000:
37 [X] Desktop Intel Core i5-2400 3.1GHz
HD Graphics 2000
fps
HD Graphics 2000:
21 [X] Desktop Intel Core i5-2400 3.1GHz
HD Graphics 2000
fps
HD Graphics 2000:
37 [X] Desktop Intel Core i5-2400 3.1GHz
HD Graphics 2000
fps
HD Graphics 2000:
19 [X] Desktop Intel Core i5-2400 3.1GHz
HD Graphics 2000
fps
100%
HD Graphics 400 (Braswell):
18.4 fps
136%
HD Graphics 2000:
23.3 26 [X] Desktop Intel Core i5-2400 3.1GHz
HD Graphics 2000
~ 25 fps
139%
HD Graphics (Cherry Trail):
25.6 fps
100%
HD Graphics 400 (Braswell):
11.3 fps
106%
HD Graphics (Cherry Trail):
12 fps
100%
HD Graphics 400 (Braswell):
29.4 fps
180%
HD Graphics 2000:
53 [X] Desktop Intel Core i5-2400 3.1GHz
HD Graphics 2000
min:
39 fps
fps
96%
HD Graphics (Cherry Trail):
28.1 fps
100%
HD Graphics 400 (Braswell):
14.3 fps
150%
HD Graphics 2000:
21.4 [X] Desktop Intel Core i5-2400 3.1GHz
HD Graphics 2000
min:
18 fps
fps
87%
HD Graphics (Cherry Trail):
12.5 fps
100%
HD Graphics 400 (Braswell):
12.5 fps
106%
HD Graphics 2000:
13.3 [X] Desktop Intel Core i5-2400 3.1GHz
HD Graphics 2000
min:
12.5 fps
fps
HD Graphics 2000:
9 [X] Desktop Intel Core i5-2400 3.1GHz
HD Graphics 2000
fps
HD Graphics 2000:
18 [X] Desktop Intel Core i5-2400 3.1GHz
HD Graphics 2000
fps
HD Graphics 2000:
43.2 [X] Desktop Intel Core i5-2400 3.1GHz
HD Graphics 2000
fps
HD Graphics 2000:
26 [X] no model Intel Core i5-2400 3.1GHz
HD Graphics 2000
fps
HD Graphics 2000:
17 [X] no model Intel Core i5-2400 3.1GHz
HD Graphics 2000
fps
HD Graphics 2000:
68 [X] no model Intel Core i5-2400 3.1GHz
HD Graphics 2000
71 [X] Desktop Intel Core i5-2400 3.1GHz
HD Graphics 2000
~ 70 fps
HD Graphics 2000:
34 [X] no model Intel Core i5-2400 3.1GHz
HD Graphics 2000
40 [X] Desktop Intel Core i5-2400 3.1GHz
HD Graphics 2000
~ 37 fps
HD Graphics 2000:
19 [X] no model Intel Core i5-2400 3.1GHz
HD Graphics 2000
22 [X] Desktop Intel Core i5-2400 3.1GHz
HD Graphics 2000
~ 21 fps
HD Graphics (Cherry Trail):
18.7 fps
HD Graphics 2000:
-1 [X] no model Intel Core i5-2400 3.1GHz
HD Graphics 2000
16.9 [X] no model Intel Core i5-2400 3.1GHz
HD Graphics 2000
~ 8 fps
100%
HD Graphics 400 (Braswell):
34.5 fps
180%
HD Graphics 2000:
62 [X] no model Intel Core i5-2400 3.1GHz
HD Graphics 2000
fps
186%
HD Graphics (Cherry Trail):
63.2 64 ~ 64 fps
100%
HD Graphics 400 (Braswell):
8.8 fps
136%
HD Graphics 2000:
12 [X] no model Intel Core i5-2400 3.1GHz
HD Graphics 2000
fps
205%
HD Graphics (Cherry Trail):
18 18.8 ~ 18 fps
100%
HD Graphics 400 (Braswell):
5.6 fps
161%
HD Graphics 2000:
9 [X] no model Intel Core i5-2400 3.1GHz
HD Graphics 2000
fps
250%
HD Graphics (Cherry Trail):
14 fps
HD Graphics 2000:
5 [X] no model Intel Core i5-2400 3.1GHz
HD Graphics 2000
fps
HD Graphics (Cherry Trail):
7 fps
HD Graphics 2000:
27 [X] no model Intel Core i5-2400 3.1GHz
HD Graphics 2000
fps
HD Graphics 2000:
11 [X] no model Intel Core i5-2400 3.1GHz
HD Graphics 2000
fps
HD Graphics 2000:
26.4 [X] Desktop Intel Core i5-2400 3.1GHz
HD Graphics 2000
min:
7.14 fps, max:
56 fps
fps
HD Graphics 2000:
10.4 [X] Desktop Intel Core i5-2400 3.1GHz
HD Graphics 2000
min:
1.6 fps, max:
24 fps
fps
HD Graphics 2000:
21.2 23 [X] no model Intel Core i5-2400 3.1GHz
HD Graphics 2000
~ 22 fps
HD Graphics 2000:
12 [X] no model Intel Core i5-2400 3.1GHz
HD Graphics 2000
13.5 ~ 13 fps
HD Graphics 2000:
50 [X] no model Intel Core i5-2400 3.1GHz
HD Graphics 2000
fps
HD Graphics 2000:
14 [X] no model Intel Core i5-2400 3.1GHz
HD Graphics 2000
fps
HD Graphics 2000:
26 48 [X] no model Intel Core i5-2400 3.1GHz
HD Graphics 2000
~ 37 fps
HD Graphics 2000:
11 [X] no model Intel Core i5-2400 3.1GHz
HD Graphics 2000
15.5 ~ 13 fps
HD Graphics 2000:
62 [X] no model Intel Core i5-2400 3.1GHz
HD Graphics 2000
fps
HD Graphics 2000:
12.7 [X] no model Intel Core i5-2400 3.1GHz
HD Graphics 2000
fps
HD Graphics 2000:
6.1 [X] no model Intel Core i5-2400 3.1GHz
HD Graphics 2000
fps
HD Graphics 2000:
30 [X] no model Intel Core i5-2400 3.1GHz
HD Graphics 2000
fps
HD Graphics 2000:
12 [X] no model Intel Core i5-2400 3.1GHz
HD Graphics 2000
fps
HD Graphics 2000:
27.1 [X] no model Intel Core i5-2400 3.1GHz
HD Graphics 2000
fps
HD Graphics 2000:
17.9 [X] no model Intel Core i5-2400 3.1GHz
HD Graphics 2000
fps
HD Graphics 2000:
12.7 [X] no model Intel Core i5-2400 3.1GHz
HD Graphics 2000
fps
HD Graphics 2000:
32 [X] no model Intel Core i5-2400 3.1GHz
HD Graphics 2000
fps
HD Graphics 2000:
5 [X] no model Intel Core i5-2400 3.1GHz
HD Graphics 2000
fps
HD Graphics 2000:
107 [X] no model Intel Core i5-2400 3.1GHz
HD Graphics 2000
fps
HD Graphics 2000:
24 [X] no model Intel Core i5-2400 3.1GHz
HD Graphics 2000
fps
HD Graphics 2000:
13 [X] no model Intel Core i5-2400 3.1GHz
HD Graphics 2000
fps
HD Graphics 2000:
73 [X] no model Intel Core i5-2400 3.1GHz
HD Graphics 2000
fps
HD Graphics 2000:
20 [X] no model Intel Core i5-2400 3.1GHz
HD Graphics 2000
fps
HD Graphics 2000:
-1 [X] no model Intel Core i5-2400 3.1GHz
HD Graphics 2000
fps
HD Graphics 2000:
31 [X] no model Intel Core i5-2400 3.1GHz
HD Graphics 2000
fps
HD Graphics 2000:
27.9 49 [X] no model Intel Core i5-2400 3.1GHz
HD Graphics 2000
~ 38 fps
HD Graphics 2000:
13 [X] no model Intel Core i5-2400 3.1GHz
HD Graphics 2000
13 ~ 13 fps
HD Graphics 2000:
5.2 [X] no model Intel Core i5-2400 3.1GHz
HD Graphics 2000
fps
HD Graphics 2000:
30 [X] no model Intel Core i5-2400 3.1GHz
HD Graphics 2000
fps
HD Graphics 2000:
4 [X] no model Intel Core i5-2400 3.1GHz
HD Graphics 2000
fps
100%
HD Graphics 400 (Braswell):
60 88.5 ~ 74 fps
224%
HD Graphics 2000:
166 [X] no model Intel Core i5-2400 3.1GHz
HD Graphics 2000
fps
100%
HD Graphics 400 (Braswell):
22.6 25.2 ~ 24 fps
164%
HD Graphics 2000:
39.3 [X] no model Intel Core i5-2400 3.1GHz
HD Graphics 2000
fps
100%
HD Graphics 400 (Braswell):
9.9 fps
138%
HD Graphics 2000:
13.7 [X] no model Intel Core i5-2400 3.1GHz
HD Graphics 2000
fps
HD Graphics 2000:
74 [X] no model Intel Core i5-2400 3.1GHz
HD Graphics 2000
fps
HD Graphics 2000:
27 [X] no model Intel Core i5-2400 3.1GHz
HD Graphics 2000
fps
HD Graphics 2000:
11 [X] no model Intel Core i5-2400 3.1GHz
HD Graphics 2000
fps
HD Graphics 2000:
27 [X] no model Intel Core i5-2400 3.1GHz
HD Graphics 2000
fps
HD Graphics 2000:
16 [X] no model Intel Core i5-2400 3.1GHz
HD Graphics 2000
fps
HD Graphics 2000:
25 [X] no model Intel Core i5-2400 3.1GHz
HD Graphics 2000
37 [X] Desktop Intel Core i5-2400 3.1GHz
HD Graphics 2000
~ 31 fps
HD Graphics 2000:
13.8 [X] no model Intel Core i5-2400 3.1GHz
HD Graphics 2000
14.7 [X] Desktop Intel Core i5-2400 3.1GHz
HD Graphics 2000
~ 14 fps
HD Graphics 2000:
33.3 [X] Desktop Intel Core i5-2400 3.1GHz
HD Graphics 2000
fps
HD Graphics 2000:
13.7 [X] Desktop Intel Core i5-2400 3.1GHz
HD Graphics 2000
fps
HD Graphics 2000:
78 [X] no model Intel Core i5-2400 3.1GHz
HD Graphics 2000
fps
HD Graphics 2000:
21 [X] no model Intel Core i5-2400 3.1GHz
HD Graphics 2000
fps
HD Graphics 2000:
10 [X] no model Intel Core i5-2400 3.1GHz
HD Graphics 2000
fps
HD Graphics 2000:
4 [X] no model Intel Core i5-2400 3.1GHz
HD Graphics 2000
fps
HD Graphics 2000:
100.6 [X] no model Intel Core i5-2400 3.1GHz
HD Graphics 2000
fps
HD Graphics 2000:
44 [X] no model Intel Core i5-2400 3.1GHz
HD Graphics 2000
fps
HD Graphics 2000:
144 [X] no model Intel Core i5-2400 3.1GHz
HD Graphics 2000
fps
HD Graphics (Cherry Trail):
44 50.9 [X] Chuwi Hi12 Intel Atom x5-Z8300 1.4GHz
HD Graphics (Cherry Trail)
min:
40 fps, max:
60 fps
~ 47 fps
HD Graphics 2000:
36 [X] no model Intel Core i5-2400 3.1GHz
HD Graphics 2000
fps
HD Graphics (Cherry Trail):
18.3 [X] Chuwi Hi12 Intel Atom x5-Z8300 1.4GHz
HD Graphics (Cherry Trail)
min:
13 fps, max:
29 fps
fps
HD Graphics 2000:
9 [X] no model Intel Core i5-2400 3.1GHz
HD Graphics 2000
fps
HD Graphics 2000:
210 [X] no model Intel Core i5-2400 3.1GHz
HD Graphics 2000
fps
HD Graphics 2000:
70 [X] no model Intel Core i5-2400 3.1GHz
HD Graphics 2000
fps
HD Graphics 2000:
52 [X] no model Intel Core i5-2400 3.1GHz
HD Graphics 2000
fps
HD Graphics 2000:
44.1 [X] no model Intel Core i5-2400 3.1GHz
HD Graphics 2000
fps
HD Graphics 2000:
243 [X] no model Intel Core i5-2400 3.1GHz
HD Graphics 2000
fps
Average Gaming Intel HD Graphics 400 (Braswell) → 100% Average Gaming 30-70 fps → 100%
Average Gaming Intel HD Graphics 2000 → 142% Average Gaming 30-70 fps → 175%
Average Gaming Intel HD Graphics (Cherry Trail) → 129% Average Gaming 30-70 fps → 179%
v1.26
log 18. 20:56:26
#0 checking url part for id 7349 +0s ... 0s
#1 checking url part for id 1958 +0s ... 0s
#2 checking url part for id 6197 +0s ... 0s
#3 not redirecting to Ajax server +0s ... 0s
#4 did not recreate cache, as it is less than 5 days old! Created at Tue, 16 Apr 2024 05:39:00 +0200 +0.001s ... 0.001s
#5 composed specs +0.175s ... 0.176s
#6 did output specs +0s ... 0.176s
#7 start showIntegratedCPUs +0s ... 0.176s
#8 getting avg benchmarks for device 7349 +0.049s ... 0.224s
#9 got single benchmarks 7349 +0.074s ... 0.299s
#10 getting avg benchmarks for device 1958 +0.002s ... 0.3s
#11 got single benchmarks 1958 +0.034s ... 0.334s
#12 getting avg benchmarks for device 6197 +0.011s ... 0.345s
#13 got single benchmarks 6197 +0.073s ... 0.418s
#14 got avg benchmarks for devices +0s ... 0.418s
#15 min, max, avg, median took s +0.316s ... 0.734s
#16 before gaming benchmark output +0s ... 0.734s
#17 Got 333 rows for game benchmarks. +0.032s ... 0.765s
#18 composed SQL query for gamebenchmarks +0s ... 0.765s
#19 got data and put it in $dataArray +0.049s ... 0.815s
#20 benchmarks composed for output. +0.189s ... 1.004s
#21 calculated avg scores. +0s ... 1.004s
#22 return log +0.003s ... 1.007s
Teilen Sie diesen Artikel, um uns zu unterstützen. Jeder Link hilft!
Autor: Klaus Hinum, 8.09.2017 (Update: 1.07.2023)
 Deutsch
 English
 Español
 Français
 Italiano
 Nederlands
 Polski
 Português
 Русский
 Türkçe
 Svenska
 Chinese
 Magyar