Intel HD Graphics 400 (Braswell) vs Intel HD Graphics 4000 vs Intel HD Graphics 4200
Intel HD Graphics 400 (Braswell)
► remove from comparison 
Die Intel HD Graphics 400 ist eine in den Low-End-SoCs der Braswell-Serie (z.B. Celeron Serie in 2016) integrierte Grafikeinheit. Sie basiert auf der gleichen Architektur wie die GPU verschiedener Broadwell-Prozessoren (z.B. HD Graphics 5300), bietet allerdings deutlich weniger Shadereinheiten und geringere Taktraten. Die genauen Spezifikationen hängen vom jeweiligen SoC ab: Die schnellste Variante bietet derzeit 12 EUs und maximal 640 MHz.
Anfangs wurde die GPU nur Intel HD Graphics benannt, später als Intel HD Graphics 400 (12 EU Version) und Intel HD Graphics 405 (16 EU Version) bezeichnet.
Anwender müssen sich deshalb insbesondere bei den Celeron-Modellen, die zusätzlich durch die Beschneidung auf nur zwei CPU-Kerne ausgebremst werden, auf ältere und anspruchslose Spiele beschränken. Videos werden dagegen auch in 4K/H.265 flüssig wiedergeben.
Für mehr Benchmarks besuchen sie auch die Seite der Intel HD Graphics (Braswell) GPU, welche Benchmarks der älteren baugleichen 12 und 16 EU Versionen beinhaltet.
Intel HD Graphics 4000
► remove from comparison 
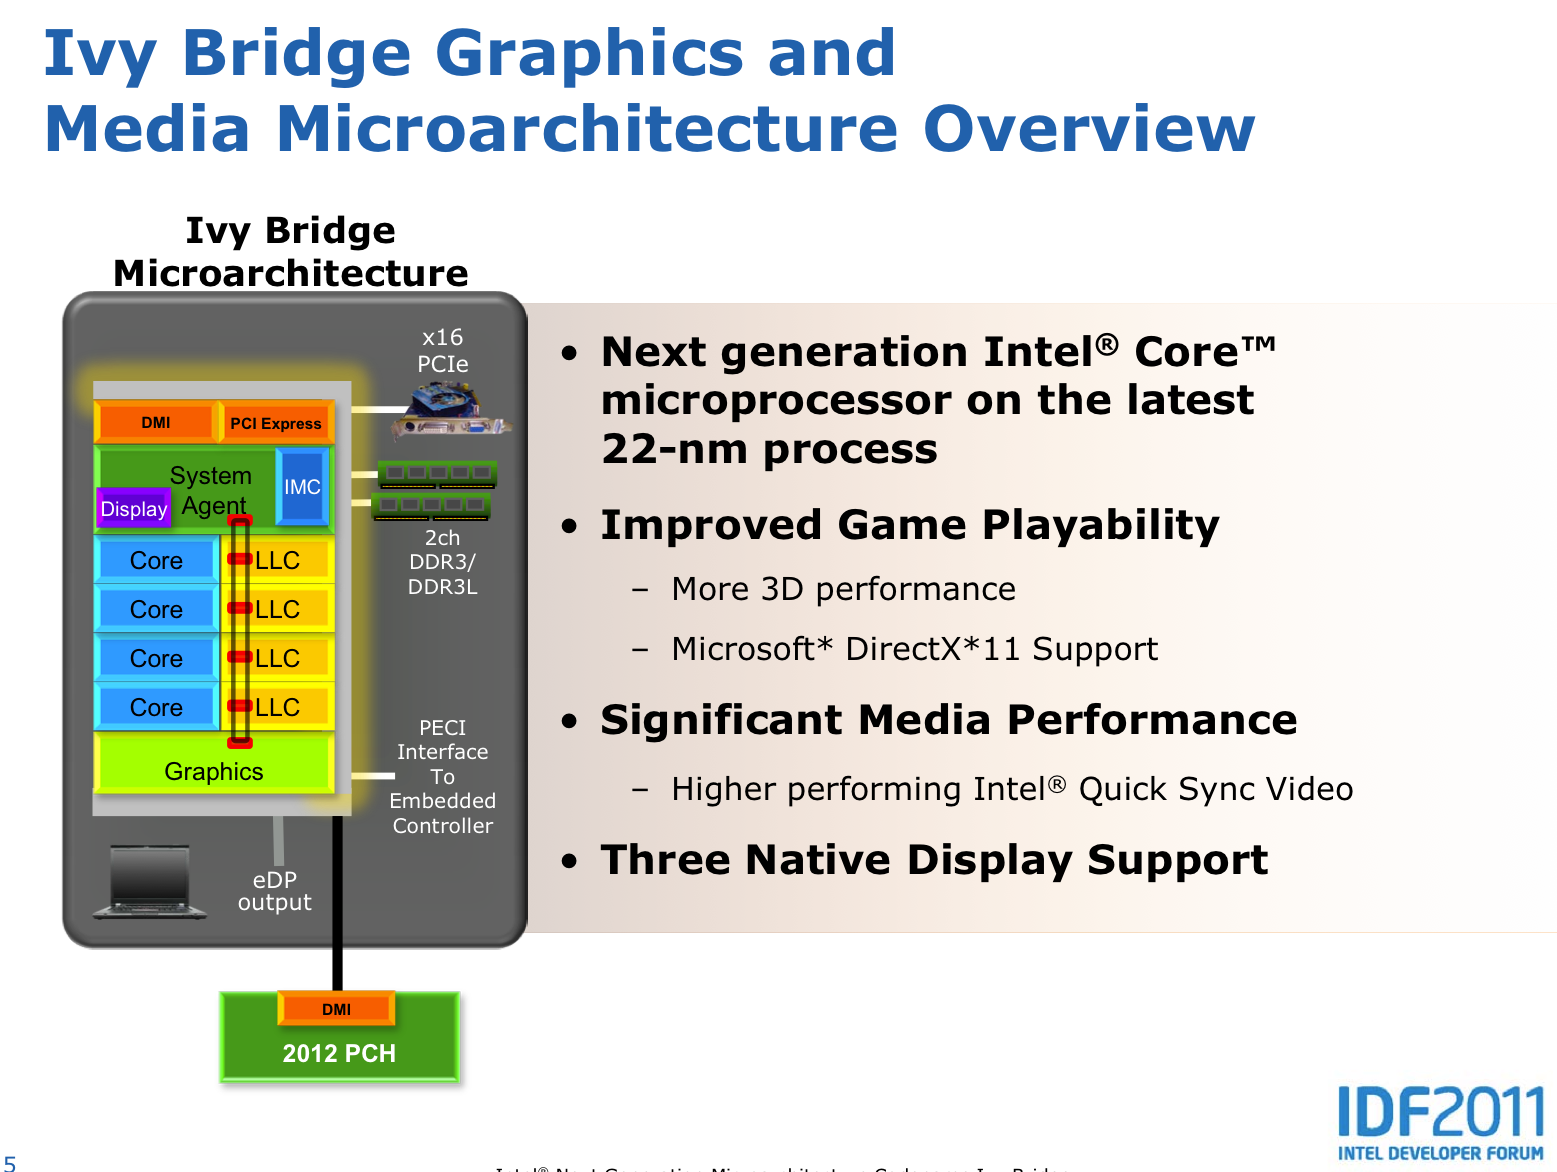
Die Intel HD Graphics 4000 (GT2) ist eine Prozessorgrafikkarte in den CPUs der Ivy Bridge Generation (3. Generation von Intel Core z.B. Core i7-3770). Je nach Prozessormodell wird die Intel HD Graphics 4000 unterschiedlich getaktet (und kann auf den unterschiedlich großen Cache zurückgreifen) und bietet daher eine teilweise deutlich geringe Leistung. Weiterhin kann die Taktung durch die Turbo Boost Technologie je nach Anforderung und TDP deutlich erhöht werden. In den schnellen Modellen soll der Basistakt 650 MHz und der Turbo 1.1 bis 1.25 GHz betragen. Die ULV Modelle weisen jedoch einen deutlich geringeren Basistakt auf (Sandy Bridge z.B. 350 MHz).
Im Vergleich zur HD Graphics 3000 der Sandy Bridge Prozessoren, bietet die 4000er einen eigenen Cache, überarbeitete DirectX 11 taugliche Shader (und vier mehr) und soll dadurch bis zu 60% mehr Leistung (3DMark Vantage) zeigen. Weiterhin sollte die GPU auf den gemeinsamen Last Level Cache (Level 3 Cache) des Prozessors zugreifen können. Weiters können die Shader auch für Direct Compute genutzt werden.
Erste Benchmarks positionieren die HD Graphics 4000 (in einem schnellen Desktop Quad-Core) auf dem Level einer Nvidia GeForce GT 330M und dadurch oberhalb der integrierten Prozessorgrafik Radeon HD 6620G. In unserem Unfangreichen Testbericht der HD Graphics 4000 konnte sie sich im schnellen Core i7-3820QM deutlich durchsetzen (6620G 15% langsamer). In den Mittelklassemodellen Core i7-3610QM und einem Dual-Core i5 war sie nur noch knapp schneller. Manchmal ist sogar eine langsame GeForce GT 630M in Reichweite. Gelegenheitsspieler, die bei Bedarf mit einer geringen Auflösung, deaktivierter Kantenglättung und niedrigen Settings leben können, werden daher an der HD Graphics 4000 durchaus Gefallen finden. In den ULV Prozessoren (Core ix-3xx7U) wird eine geringer getaktete Variante eingesetzt. Durch die TDP Beschränkungen kann der Turbo außerdem meistens nicht so hoch takten, wie bei den 35/45 Watt Versionen. Dadurch ist die HD Graphics 4000 hier meist etwa 30% langsamer als in schnellen Quad-Core CPUs.
Eine Besonderheit der Ivy Bride Grafikkerne ist, das nur 4x MSAA von der Hardware unterstützt wird. 2x MSAA wird per Software berechnet und geht durch die 4x MSAA Pipeline. Daher empfiehlt sich der Einsatz des gleich schnellen 4x MSAA.
Auch der integrierte Videodecoder genannt Multi Format Codec Engine (MFX) wurde kräftig überarbeitet und soll nun sogar mehrere 4K Videos parallel dekodieren können (ev nur in den High-End Modellen). DXVA Checker gibt weiterhin die Formate MPEG2, VC1, WMV9 und H264 als unterstütz an. QuickSync zum schnellen Transkodieren von Videos wurde ebenfalls verbessert und soll nun schneller bei gleichzeitig höherer Qualität laufen.
Ebenfalls neu ist die Unterstützung für drei unabhängige Bildschirme (abhängig von der Umsetzung im Notebook eventuell nur zwei gleichzeitige möglich). Bis jetzt waren nur zwei möglich und lediglich die AMD Grafikkarten mit Eyefinity Support bieten mehr als zwei Anschlüsse für Notebooks (jedoch nur mit DisplayPorts). Laut Intel wird DisplayPort in der Version 1.1 unterstützt (daher maximal 2560x1600) und HDMI in 1.4 (in der Praxis 1920x1080, siehe Fokusartikel für 2560x1600).
Der Stromverbrauch ist dank des 22nm Prozesses mit 3D Tri-Gate Technologie relativ gering und nicht einzeln angegeben. Die Notebook-Prozessoren (CPU, GPU, Speichercontroller) sind gesamt auf einen TDP von 18-45 Watt spezifziert.
Intel HD Graphics 4200
► remove from comparison 
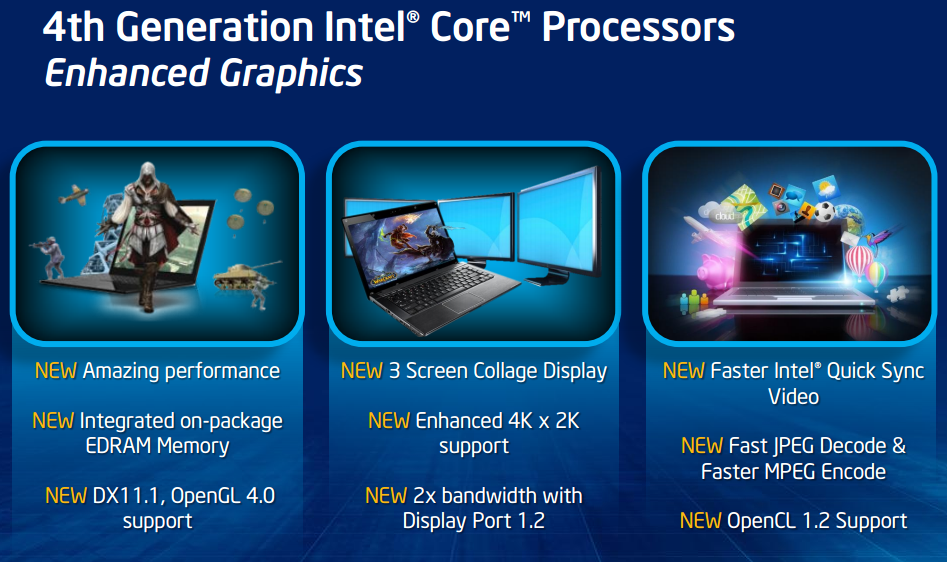
Die Intel HD Graphics 4200 (GT2) ist eine Low-End Prozessorgrafikkarte in einigen besonders sparsamen ULV-CPUs der Haswell-Generation.
Der Grafikkern wurde im Vergleich zum Intel HD Graphics 4000 der Ivy-Bridge-Generation in verschiedenen Punkten weiterentwickelt. So unterstützt die GPU nun mit DirectX 11.1, OpenCL 1.2 und OpenGL 4.0 alle wichtigen aktuellen Standards. Auch ein verbesserter Decoder für 4K-Videos sowie ein überarbeiteter Quick-Sync-Encoder sind mit an Bord.
Die Performance der HD Graphics 4200 liegt im Schnitt noch deutlich unter der HD 4600 und HD 4400, da die GPU für ULV-Modelle der Y-Serie (11,5 Watt TDP) mit sehr niedriger Taktrate vorgesehen ist. Insgesamt entspricht die Leistung trotz der geringeren Kernfrequenz in etwa der HD 4000 der Ivy-Bridge-Generation. Neben architektonischen Verbesserungen wird dies vor allem über eine gesteigerte Zahl an Ausführungseinheiten erreicht: Die GT2-Ausbaustufe integriert nun 20 (HD 4000: 16) der sogenannten EUs.
In einfachen Spielen wie Anno 2070 oder Counter Strike: Global Offensive genügt die Performance, um niedrige Einstellungen und 1.024 x 768 Pixel zu bewältigen. Viele aktuelle Titel wie Battlefield 4 sind hingegen selbst bei minimaler grafischer Qualität nicht flüssig spielbar. Detaillierte Benchmarks können sie weiter unten auf dieser Seite finden.
Der Stromverbrauch ist dank des 22-Nanometer-Prozesses mit Tri-Gate-Transistoren relativ gering und wird dynamisch vom TDP-Budget des gesamten Chips abgezweigt. Zusätzlich zur TDP von 11,5 Watt gibt Intel auch eine durchschnittliche Leistungsaufnahme (SDP) an, die je nach Modell bei 4,5 oder 6 Watt liegt.
Weitere Details zur Grafikkartenarchitektur der Haswell Generation finden Sie in unserem Artikel zur Haswell-Architektur sowie dem Bericht vom IDF 2012.
| Intel HD Graphics 400 (Braswell) | Intel HD Graphics 4000 | Intel HD Graphics 4200 |
Hersteller | Intel | Intel | Intel |
HD Graphics Serie | | | |
Codename | Braswell | Ivy Bridge | Haswell GT2 |
Architektur | Gen. 8 | Gen. 7 Ivy Bridge | Gen. 7.5 Haswell |
Pipelines | 12 - unified | 16 - unified | 20 - unified |
Kerntakt | 320 - 640 (Boost) MHz | 350 - 1350 (Boost) MHz | 200 - 850 (Boost) MHz |
Speicherbandbreite | 64/128 Bit | 64/128 Bit | 64/128 Bit |
Shared Memory | ja | ja | ja |
DirectX | DirectX 11.2, Shader 5.0 | DirectX 11, Shader 5.0 | DirectX 11.1, Shader 5.0 |
Herstellungsprozess | 14 nm | 22 nm | 22 nm |
Erscheinungsdatum | 01.04.2016 | 23.03.2011 | 05.06.2013 |
Features | | QuickSync | QuickSync |
CPU in HD Graphics 400 (Braswell) | GPU Base Speed | GPU Boost / Turbo |
---|
Intel Atom x5-Z8550 | 4 x 1440 MHz | 200 MHz | 600 MHz | Intel Celeron N3060 | 2 x 1600 MHz, 6 W | 320 MHz | 700 MHz | min. - max. | | 200 - 320 MHz | 600 - 700 MHz |
| CPU in HD Graphics 4000 | GPU Base Speed | GPU Boost / Turbo |
---|
Intel Core i7-3770K | 4 x 3500 MHz, 77 W | 650 MHz | 1150 MHz | Intel Core i7-3940XM | 4 x 3000 MHz, 55 W | 650 MHz | 1350 MHz | Intel Core i7-3920XM | 4 x 2900 MHz, 55 W | 650 MHz | 1300 MHz | » show 36 more | Intel Core i7-3840QM | 4 x 2800 MHz, 45 W | 650 MHz | 1300 MHz | Intel Core i7-3820QM | 4 x 2700 MHz, 45 W | 650 MHz | 1250 MHz | Intel Core i7-3740QM | 4 x 2700 MHz, 45 W | 650 MHz | 1300 MHz | Intel Core i7-3720QM | 4 x 2600 MHz, 45 W | 650 MHz | 1250 MHz | Intel Core i5-3570K | 4 x 3400 MHz, 77 W | 650 MHz | 1150 MHz | Intel Core i7-3635QM | 4 x 2400 MHz, 45 W | 650 MHz | 1200 MHz | Intel Core i7-3630QM | 4 x 2400 MHz, 45 W | 650 MHz | 1150 MHz | Intel Core i7-3615QM | 4 x 2300 MHz, 45 W | 650 MHz | 1200 MHz | Intel Core i7-3610QM | 4 x 2300 MHz, 45 W | 650 MHz | 1100 MHz | Intel Core i7-3632QM | 4 x 2200 MHz, 35 W | 650 MHz | 1150 MHz | Intel Core i7-3612QM | 4 x 2100 MHz, 35 W | 650 MHz | 1100 MHz | Intel Core i7-3540M | 2 x 3000 MHz, 35 W | 650 MHz | 1300 MHz | Intel Core i7-3520M | 2 x 2900 MHz, 35 W | 650 MHz | 1250 MHz | Intel Core i5-3380M | 2 x 2900 MHz, 35 W | 650 MHz | 1250 MHz | Intel Core i5-3360M | 2 x 2800 MHz, 35 W | 650 MHz | 1200 MHz | Intel Core i5-3340M | 2 x 2700 MHz, 35 W | 650 MHz | 1250 MHz | Intel Core i5-3320M | 2 x 2600 MHz, 35 W | 650 MHz | 1200 MHz | Intel Core i5-3230M | 2 x 2600 MHz, 35 W | 650 MHz | 1100 MHz | Intel Core i7-3687U | 2 x 2100 MHz, 17 W | 350 MHz | 1200 MHz | Intel Core i5-3210M | 2 x 2500 MHz, 35 W | 650 MHz | 1100 MHz | Intel Core i7-3667U | 2 x 2000 MHz, 17 W | 350 MHz | 1150 MHz | Intel Core i7-3537U | 2 x 2000 MHz, 17 W | 350 MHz | 1200 MHz | Intel Core i7-3517U | 2 x 1900 MHz, 17 W | 350 MHz | 1150 MHz | Intel Core i3-3130M | 2 x 2600 MHz, 35 W | 650 MHz | 1100 MHz | Intel Core i5-3437U | 2 x 1900 MHz, 17 W | 650 MHz | 1200 MHz | Intel Core i3-3120M | 2 x 2500 MHz, 35 W | 650 MHz | 1100 MHz | Intel Core i5-3427U | 2 x 1800 MHz, 17 W | 350 MHz | 1150 MHz | Intel Core i3-3110M | 2 x 2400 MHz, 35 W | 650 MHz | 1000 MHz | Intel Core i5-3337U | 2 x 1800 MHz, 17 W | 350 MHz | 1100 MHz | Intel Core i5-3317U | 2 x 1700 MHz, 17 W | 350 MHz | 1050 MHz | Intel Core i7-3689Y | 2 x 1500 MHz, 13 W | 350 MHz | 850 MHz | Intel Core i5-3439Y | 2 x 1500 MHz, 13 W | 350 MHz | 850 MHz | Intel Core i3-3227U | 2 x 1900 MHz, 17 W | 350 MHz | 1100 MHz | Intel Core i5-3339Y | 2 x 1500 MHz, 13 W | 350 MHz | 850 MHz | Intel Core i3-3217U | 2 x 1800 MHz, 17 W | 350 MHz | 1050 MHz | Intel Core i3-3229Y | 2 x 1400 MHz, 13 W | 350 MHz | 850 MHz | min. - max. | | 200 - 650 MHz | 600 - 1350 MHz |
| CPU in HD Graphics 4200 | GPU Base Speed | GPU Boost / Turbo |
---|
Intel Core i7-4610Y | 2 x 1700 MHz, 11.5 W | 200 MHz | 850 MHz | Intel Core i5-4300Y | 2 x 1600 MHz, 11.5 W | 200 MHz | 850 MHz | Intel Core i5-4302Y | 2 x 1600 MHz, 11.5 W | 200 MHz | 850 MHz | » show 8 more | Intel Core i5-4202Y | 2 x 1600 MHz, 11.5 W | 200 MHz | 850 MHz | Intel Core i5-4220Y | 2 x 1600 MHz, 11.5 W | 200 MHz | 850 MHz | Intel Core i5-4210Y | 2 x 1500 MHz, 11.5 W | 200 MHz | 850 MHz | Intel Core i5-4200Y | 2 x 1400 MHz, 11.5 W | 200 MHz | 850 MHz | Intel Core i3-4030Y | 2 x 1600 MHz, 11.5 W | 200 MHz | 850 MHz | Intel Core i3-4020Y | 2 x 1500 MHz, 11.5 W | 200 MHz | 850 MHz | Intel Core i3-4012Y | 2 x 1500 MHz, 11.5 W | 200 MHz | 850 MHz | Intel Core i3-4010Y | 2 x 1300 MHz, 11.5 W | 200 MHz | 850 MHz | min. - max. | | 200 - 650 MHz | 600 - 1350 MHz |
|
Benchmarks
Performance Rating - 3DMark 11 + Fire Strike + Time Spy - HD Graphics 400 (Braswell)
1.7 pt (2%)
Intel HD Graphics 400 (Braswell)
...
Performance Rating - 3DMark 11 + Fire Strike + Time Spy - HD Graphics 4000
3 pt (3%)
...
...
Performance Rating - 3DMark 11 + Fire Strike + Time Spy - HD Graphics 4200
3.2 pt (3%)
...
...
3DMark - 3DMark Ice Storm Unlimited Graphics
min: 17968 avg: 20459 median: 20277 (3%) max: 23161 Points
min: 43759 avg: 44324 median: 44323.5 (7%) max: 44888 Points
Vizio CT14-A0 | 3217U | 4096 | 350 / MHz | | 43759 |
Asus N56VM | 3720QM | 8192 | | | 44888 |
41579 Points (7%)
3DMark - 3DMark Ice Storm Extreme Graphics
14334 Points (2%)
min: 20514 avg: 24179 median: 24426 (3%) max: 28772 Points
3DMark - 3DMark Cloud Gate Score
min: 1350 avg: 1553 median: 1457 (2%) max: 2087 Points
min: 1469 avg: 3380 median: 3282.5 (4%) max: 5946 Points
min: 1716 avg: 2853 median: 3027 (4%) max: 3754 Points
3DMark - 3DMark Cloud Gate Graphics
min: 1519 avg: 1865 median: 1841 (1%) max: 2455 Points
min: 1619 avg: 3850 median: 3768.5 (2%) max: 5761 Points
min: 2101 avg: 3793 median: 3807 (2%) max: 5239 Points
3DMark - 3DMark Fire Strike Standard Score
min: 176 avg: 188 median: 188 (0%) max: 200 Points
min: 168 avg: 447 median: 444 (1%) max: 647 Points
min: 199 avg: 370 median: 394.5 (1%) max: 512 Points
3DMark - 3DMark Fire Strike Standard Graphics
min: 202 avg: 218 median: 218 (0%) max: 234 Points
min: 191 avg: 486 median: 480 (1%) max: 705 Points
min: 218 avg: 411 median: 431.5 (1%) max: 578 Points
3DMark - 3DMark Ice Storm Graphics
min: 13689 avg: 18517 median: 18516.5 (2%) max: 23344 Points
min: 11232 avg: 31858 median: 31598 (4%) max: 48923 Points
min: 17834 avg: 32317 median: 34087 (5%) max: 46175 Points
3DMark - 3DMark Sling Shot (ES 3.0) Unlimited
min: 1502 avg: 1926 median: 1925.5 (14%) max: 2349 Points
3DMark - 3DMark Sling Shot (ES 3.0) Unlimited Graphics
min: 1452 avg: 2046 median: 2046 (7%) max: 2640 Points
3DMark - 3DMark Sling Shot Extreme (ES 3.1) Unlimited
1180 Points (12%)
3DMark - 3DMark Sling Shot Extreme (ES 3.1) Unlimited Graphics
977 Points (8%)
3DMark 11 - 3DM11 Performance Score
min: 289 avg: 386 median: 397 (1%) max: 478 Points
min: 248 avg: 603 median: 603 (2%) max: 802 Points
min: 367 avg: 660 median: 712 (2%) max: 828 Points
3DMark 11 - 3DM11 Performance GPU
min: 247 avg: 341 median: 349 (1%) max: 418 Points
min: 216 avg: 522 median: 523 (1%) max: 684 Points
min: 329 avg: 624 median: 638 (1%) max: 1060 Points
3DMark Vantage
3DM Vant. Perf. total + Intel HD Graphics 4000 3DMark Vantage - 3DM Vant. Perf. total
min: 830 avg: 2985 median: 2959 (3%) max: 4433 Points
3DM Vant. Perf. total + Intel HD Graphics 4200 min: 2165 avg: 2538 median: 2537.5 (2%) max: 2910 Points
3DM Vant. Perf. GPU no PhysX + Intel HD Graphics 4000 3DMark Vantage - 3DM Vant. Perf. GPU no PhysX
min: 659 avg: 2441 median: 2415 (2%) max: 3488 Points
3DM Vant. Perf. GPU no PhysX + Intel HD Graphics 4200 min: 1678 avg: 1985 median: 1807 (2%) max: 2471 Points
3DMark 2001SE - 3DMark 2001 - Standard
min: 8967 avg: 14343 median: 15220 (16%) max: 16933 Points
3DMark 03 - 3DMark 03 - Standard
min: 7402 avg: 11805 median: 12768 (7%) max: 19294 Points
3DMark 05 - 3DMark 05 - Standard
min: 5239 avg: 8296 median: 8393 (12%) max: 11948 Points
3DMark 06 3DMark 06 - Standard 1280x1024 + Intel HD Graphics 400 (Braswell) 2474 Points (5%)
3DMark 06 - Standard 1280x1024 + Intel HD Graphics 4000 min: 1605 avg: 4588 median: 4412.5 (8%) max: 7159 Points
3DMark 06 - Standard 1280x1024 + Intel HD Graphics 4200 min: 2060 avg: 3529 median: 3383 (6%) max: 5020 Points
3DMark 06 - Score Unknown Settings + Intel HD Graphics 4000 4276 (8%)
Unigine Heaven 3.0 - Unigine Heaven 3.0 DX 11
min: 6.9 avg: 7.6 median: 7.4 (2%) max: 8.9 fps
Unigine Heaven 3.0 - Unigine Heaven 3.0 OpenGL
min: 7.7 avg: 8.1 median: 8.1 (4%) max: 8.4 fps
Unigine Heaven 2.1 - Heaven 2.1 high
min: 6 avg: 9.6 median: 9.4 (2%) max: 13 fps
SPECviewperf 11
specvp11 snx-01 + Intel HD Graphics 4000 SPECviewperf 11 - specvp11 snx-01
min: 0.69 avg: 1.1 median: 1.2 (1%) max: 1.47 fps
specvp11 tcvis-02 + Intel HD Graphics 4000 SPECviewperf 11 - specvp11 tcvis-02
min: 1.43 avg: 1.9 median: 2.1 (3%) max: 2.27 fps
specvp11 sw-02 + Intel HD Graphics 4000 SPECviewperf 11 - specvp11 sw-02
min: 3.98 avg: 6.9 median: 7.5 (9%) max: 8.45 fps
specvp11 proe-05 + Intel HD Graphics 4000 SPECviewperf 11 - specvp11 proe-05
min: 0.62 avg: 1.1 median: 1.2 (5%) max: 1.47 fps
specvp11 maya-03 + Intel HD Graphics 4000 SPECviewperf 11 - specvp11 maya-03
min: 7.12 avg: 10.2 median: 9.7 (7%) max: 13.09 fps
specvp11 lightwave-01 + Intel HD Graphics 4000 SPECviewperf 11 - specvp11 lightwave-01
min: 5.67 avg: 10.2 median: 11.1 (12%) max: 12.55 fps
specvp11 ensight-04 + Intel HD Graphics 4000 SPECviewperf 11 - specvp11 ensight-04
min: 1.06 avg: 1.6 median: 1.7 (1%) max: 2.24 fps
specvp11 catia-03 + Intel HD Graphics 4000 SPECviewperf 11 - specvp11 catia-03
0 fps (0%)
Windows 7 Experience Index - Win7 Gaming graphics
min: 5.9 avg: 6.4 median: 6.4 (81%) max: 6.6 Points
Windows 7 Experience Index - Win7 Graphics
min: 4.7 avg: 5.6 median: 5.1 (65%) max: 6.6 Points
Cinebench R10 Cinebench R10 Shading (32bit) + Intel HD Graphics 400 (Braswell) Cinebench R10 - Cinebench R10 Shading (32bit)
min: 1627 avg: 2057 median: 2052.5 (10%) max: 2510
Cinebench R10 Shading (32bit) + Intel HD Graphics 4000 min: 2447 avg: 5020 median: 5157 (24%) max: 8562
Cinebench R10 Shading (32bit) + Intel HD Graphics 4200 min: 1991 avg: 4602 median: 4514 (21%) max: 6367
Cinebench R11.5 Cinebench R11.5 OpenGL 64 Bit + Intel HD Graphics 400 (Braswell) Cinebench R11.5 - Cinebench R11.5 OpenGL 64 Bit
min: 9.97 avg: 10 median: 10 (4%) max: 10.12 fps
Cinebench R11.5 OpenGL 64 Bit + Intel HD Graphics 4000 min: 5.58 avg: 14.4 median: 13.6 (6%) max: 22.54 fps
Cinebench R11.5 OpenGL 64 Bit + Intel HD Graphics 4200 min: 7.65 avg: 14.1 median: 14.9 (7%) max: 19.67 fps
Cinebench R15
Cinebench R15 OpenGL 64 Bit + Intel HD Graphics 400 (Braswell) Cinebench R15 - Cinebench R15 OpenGL 64 Bit
min: 8.48 avg: 11 median: 11.3 (3%) max: 13.98 fps
Cinebench R15 OpenGL 64 Bit + Intel HD Graphics 4000 min: 8.47 avg: 11.9 median: 11.9 (3%) max: 15.35 fps
Cinebench R15 OpenGL 64 Bit + Intel HD Graphics 4200 min: 8.82 avg: 15.6 median: 17 (5%) max: 19.99 fps
Cinebench R15 OpenGL Ref. Match 64 Bit + Intel HD Graphics 400 (Braswell) Cinebench R15 - Cinebench R15 OpenGL Ref. Match 64 Bit
98 % (98%)
Cinebench R15 OpenGL Ref. Match 64 Bit + Intel HD Graphics 4000 min: 32.2 avg: 50.9 median: 32.2 (32%) max: 97.8 %
Cinebench R15 OpenGL Ref. Match 64 Bit + Intel HD Graphics 4200 min: 63.3 avg: 87.8 median: 98 (98%) max: 99.6 %
GLBenchmark 2.5 - GLBench 2.5 Egypt HD Offscreen
min: 74 avg: 91.5 median: 91.5 (17%) max: 109 fps
GLBenchmark 2.5 - GLBench 2.5 Egypt HD
min: 51 avg: 52 median: 52 (87%) max: 53 fps
GFXBench (DX / GLBenchmark) 2.7
GLBench 2.7 T-Rex HD Offscreen C24Z16 + Intel HD Graphics 400 (Braswell) GFXBench (DX / GLBenchmark) 2.7 - GLBench 2.7 T-Rex HD Offscreen C24Z16
min: 27 avg: 29 median: 29 (0%) max: 31 fps
GLBench 2.7 T-Rex HD Offscreen C24Z16 + Intel HD Graphics 4000 min: 31 avg: 40.1 median: 39 (0%) max: 49 fps
GLBench 2.7 T-Rex HD Offscreen C24Z16 + Intel HD Graphics 4200 min: 21 avg: 35.8 median: 37.5 (0%) max: 47 fps
GLBench 2.7 T-Rex HD Onscreen C24Z16 + Intel HD Graphics 400 (Braswell) GFXBench (DX / GLBenchmark) 2.7 - GLBench 2.7 T-Rex HD Onscreen C24Z16
min: 31 avg: 33.5 median: 33.5 (1%) max: 36 fps
GLBench 2.7 T-Rex HD Onscreen C24Z16 + Intel HD Graphics 4000 min: 31 avg: 32.4 median: 32 (1%) max: 34 fps
GLBench 2.7 T-Rex HD Onscreen C24Z16 + Intel HD Graphics 4200 min: 27 avg: 36 median: 32 (1%) max: 49 fps
GFXBench 3.0 - GFXBench 3.0 Manhattan Offscreen
min: 14 avg: 16 median: 16 (2%) max: 18 fps
GFXBench 3.0 - GFXBench 3.0 Manhattan
min: 15 avg: 23 median: 23 (6%) max: 31 fps
GFXBench - GFXBench 5.0 Aztec Ruins High Tier Onscreen
11 fps (7%)
GFXBench - GFXBench 5.0 Aztec Ruins High Tier Offscreen
3.3 fps (1%)
GFXBench - GFXBench 5.0 Aztec Ruins Normal Tier Onscreen
17 fps (8%)
GFXBench - GFXBench 5.0 Aztec Ruins Normal Tier Offscreen
9.3 fps (2%)
LuxMark v2.0 64Bit - LuxMark v2.0 Room GPU
min: 31 avg: 46.9 median: 34 (0%) max: 163 Samples/s
min: 102 avg: 114 median: 113.5 (1%) max: 125 Samples/s
LuxMark v2.0 64Bit - LuxMark v2.0 Sala GPU
min: 50 avg: 79.4 median: 66 (0%) max: 251 Samples/s
min: 162 avg: 177 median: 176.5 (1%) max: 191 Samples/s
ComputeMark v2.1 - ComputeMark v2.1 Result
min: 31 avg: 514 median: 537 (1%) max: 630
min: 469 avg: 486 median: 486 (1%) max: 503
Average Benchmarks Intel HD Graphics 400 (Braswell) → 100% n=15
Average Benchmarks Intel HD Graphics 4000 → 167% n=15
Average Benchmarks Intel HD Graphics 4200 → 170% n=15
- Bereich der Benchmarkergebnisse für diese Grafikkarte

- Durchschnittliche Benchmarkergebnisse für diese Grafikkarte
* Smaller numbers mean a higher performance
1 This benchmark is not used for the average calculation
Spiele-Benchmarks
Die folgenden Benchmarks basieren auf unseren Spieletests mit Testnotebooks. Die Performance dieser Grafikkarte bei den gelisteten Spielen ist abhängig von der verwendeten CPU, Speicherausstattung, Treiber und auch Betriebssystem. Dadurch müssen die untenstehenden Werte nicht repräsentativ sein. Detaillierte Informationen über das verwendete System sehen Sie nach einem Klick auf den fps-Wert.
100%
HD Graphics 400 (Braswell):
14.1 fps
100%
HD Graphics 400 (Braswell):
18.5 fps
368%
HD Graphics 4000:
68 [X] Asus N56VMIntel Core i7-3720QM 2.6GHz
HD Graphics 4000
min:
63 fps
fps
100%
HD Graphics 400 (Braswell):
16 fps
HD Graphics 4000:
13.3 [X] Asus N56VMIntel Core i7-3720QM 2.6GHz
HD Graphics 4000
fps
100%
HD Graphics 400 (Braswell):
12.7 fps
100%
HD Graphics 400 (Braswell):
6.8 fps
100%
HD Graphics 400 (Braswell):
10.7 fps
100%
HD Graphics 400 (Braswell):
20.9 fps
206%
HD Graphics 4000:
43 [X] Asus N56VMIntel Core i7-3720QM 2.6GHz
HD Graphics 4000
min:
39 fps, max:
51 fps
fps
100%
HD Graphics 400 (Braswell):
5.8 fps
433%
HD Graphics 4000:
25.1 [X] Asus N56VMIntel Core i7-3720QM 2.6GHz
HD Graphics 4000
min:
23 fps, max:
30 fps
fps
100%
HD Graphics 400 (Braswell):
9.7 fps
HD Graphics 4000:
0 (!) [X] Asus N56VMIntel Core i7-3720QM 2.6GHz
HD Graphics 4000
Problem during benchmarking occured: Spiel startete nicht fps
100%
HD Graphics 400 (Braswell):
15 15.1 ~ 15 fps
171%
HD Graphics 4000:
25.6 [X] Asus N56VMIntel Core i7-3720QM 2.6GHz
HD Graphics 4000
min:
19 fps, max:
31 fps
fps
100%
HD Graphics 400 (Braswell):
9.5 9.7 ~ 10 fps
100%
HD Graphics 400 (Braswell):
5.3 fps
189%
HD Graphics 4000:
10 [X] Asus N56VMIntel Core i7-3720QM 2.6GHz
HD Graphics 4000
min:
9 fps, max:
11 fps
fps
211%
HD Graphics 4200:
11.2 fps
100%
HD Graphics 400 (Braswell):
7.3 fps
236%
HD Graphics 4200:
17.2 fps
100%
HD Graphics 400 (Braswell):
3.2 fps
334%
HD Graphics 4200:
10.7 fps
HD Graphics 4200:
11.3 fps
HD Graphics 4200:
19.2 fps
HD Graphics 4200:
11.5 fps
HD Graphics 4200:
14.9 fps
100%
HD Graphics 400 (Braswell):
36.5 fps
164%
HD Graphics 4000:
60 [X] Asus N56VMIntel Core i7-3720QM 2.6GHz
HD Graphics 4000
min:
53 fps, max:
62 fps
fps
100%
HD Graphics 400 (Braswell):
14.2 fps
183%
HD Graphics 4000:
26 [X] Asus N56VMIntel Core i7-3720QM 2.6GHz
HD Graphics 4000
min:
23 fps, max:
30 fps
fps
100%
HD Graphics 400 (Braswell):
9 fps
178%
HD Graphics 4000:
16 [X] Asus N56VMIntel Core i7-3720QM 2.6GHz
HD Graphics 4000
min:
13 fps, max:
18 fps
fps
100%
HD Graphics 400 (Braswell):
13 fps
436%
HD Graphics 4000:
56.7 [X] Asus N56VMIntel Core i7-3720QM 2.6GHz
HD Graphics 4000
min:
44 fps, max:
71 fps
fps
290%
HD Graphics 4200:
37.7 fps
100%
HD Graphics 400 (Braswell):
8 fps
450%
HD Graphics 4000:
36 [X] Asus N56VMIntel Core i7-3720QM 2.6GHz
HD Graphics 4000
min:
25 fps, max:
48 fps
fps
310%
HD Graphics 4200:
24.8 fps
HD Graphics 4000:
17.1 [X] Asus N56VMIntel Core i7-3720QM 2.6GHz
HD Graphics 4000
min:
11 fps, max:
26 fps
fps
HD Graphics 4000:
12.4 [X] Asus N56VMIntel Core i7-3720QM 2.6GHz
HD Graphics 4000
min:
7 fps, max:
20 fps
fps
100%
HD Graphics 400 (Braswell):
13.3 fps
308%
HD Graphics 4000:
41 [X] Asus N56VMIntel Core i7-3720QM 2.6GHz
HD Graphics 4000
min:
37 fps, max:
45 fps
fps
231%
HD Graphics 4200:
30.7 fps
HD Graphics 4000:
25.2 [X] Asus N56VMIntel Core i7-3720QM 2.6GHz
HD Graphics 4000
min:
24 fps, max:
27 fps
fps
HD Graphics 4200:
20.5 fps
HD Graphics 4000:
9.6 [X] Asus N56VMIntel Core i7-3720QM 2.6GHz
HD Graphics 4000
min:
7 fps, max:
12 fps
fps
HD Graphics 4000:
14.6 [X] Asus N56VMIntel Core i7-3720QM 2.6GHz
HD Graphics 4000
min:
8 fps, max:
20 fps
fps
100%
HD Graphics 400 (Braswell):
21.3 fps
451%
HD Graphics 4000:
96 [X] Asus N56VMIntel Core i7-3720QM 2.6GHz
HD Graphics 4000
min:
81 fps
fps
100%
HD Graphics 400 (Braswell):
11.4 fps
353%
HD Graphics 4000:
40.2 [X] Asus N56VMIntel Core i7-3720QM 2.6GHz
HD Graphics 4000
min:
36 fps
fps
HD Graphics 4000:
16.9 [X] Asus N56VMIntel Core i7-3720QM 2.6GHz
HD Graphics 4000
min:
14 fps
fps
100%
HD Graphics 400 (Braswell):
8.5 fps
104%
HD Graphics 4200:
8.8 fps
100%
HD Graphics 400 (Braswell):
5.6 fps