Notebookcheck Logo

Intel HD Graphics 400 (Braswell) vs Intel HD Graphics (Skylake) vs Intel HD Graphics P530

Intel HD Graphics 400 (Braswell)

► remove from comparison Intel HD Graphics 400 (Braswell)

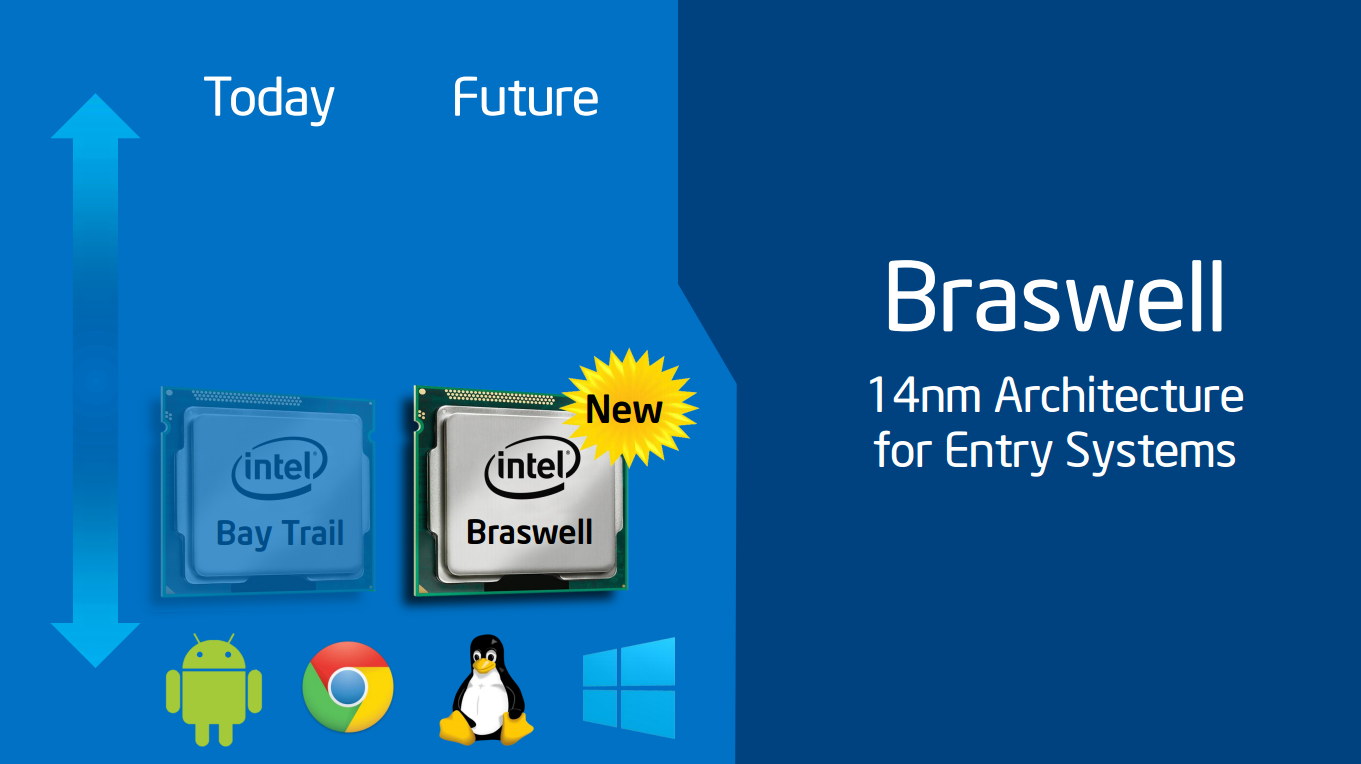
Die Intel HD Graphics 400 ist eine in den Low-End-SoCs der Braswell-Serie (z.B. Celeron Serie in 2016) integrierte Grafikeinheit. Sie basiert auf der gleichen Architektur wie die GPU verschiedener Broadwell-Prozessoren (z.B. HD Graphics 5300), bietet allerdings deutlich weniger Shadereinheiten und geringere Taktraten. Die genauen Spezifikationen hängen vom jeweiligen SoC ab: Die schnellste Variante bietet derzeit 12 EUs und maximal 640 MHz.

Anfangs wurde die GPU nur Intel HD Graphics benannt, später als Intel HD Graphics 400 (12 EU Version) und Intel HD Graphics 405 (16 EU Version) bezeichnet.

Anwender müssen sich deshalb insbesondere bei den Celeron-Modellen, die zusätzlich durch die Beschneidung auf nur zwei CPU-Kerne ausgebremst werden, auf ältere und anspruchslose Spiele beschränken. Videos werden dagegen auch in 4K/H.265 flüssig wiedergeben.

Für mehr Benchmarks besuchen sie auch die Seite der Intel HD Graphics (Braswell) GPU, welche Benchmarks der älteren baugleichen 12 und 16 EU Versionen beinhaltet.

Intel HD Graphics (Skylake)

► remove from comparison Intel HD Graphics (Skylake)

Die Intel HD Graphics (Skylake) (GT1) ist eine Prozessorgrafikkarte der im September 2015 vorgestellten Skylake-Generation. Für die meisten CPU wurden die Namen Intel HD Graphics 510 und Intel HD Graphics 515 genutzt.

Zwar glänzt die GPU mit einer extrem niedrigen Leistungsaufnahme, allerdings siedelt sich die Performance nur im untersten Low-End-Segment an und ist für neuere Spiele kaum ausreichend. Als sogenannte GT1-Ausbaustufe der Skylake-GPU verfügt die HD Graphics über 12 Execution Units (EUs), die je nach Modell mit bis zu 800 MHz takten.

Mangels eigenem Grafikspeicher oder eDRAM-Cache greift die HD Graphics (Skylake) über das Interface des Prozessors auf den System-RAM zu (2x 64 Bit DDR3L-1600/LPDDR3-1866).

Performance

Die exakte Leistung der HD Graphics hängt stark vom jeweiligen Endgerät und dessen TDP-Einstellung ab. Zum anderen bestimmt auch der eingesetzte Speicher die Performance.

Im Optimalfall dürfte die GPU in etwa mit der älteren HD Graphics 4200 konkurrieren und kann aktuelle Spiele (Stand 2015) nur in wenigen Ausnahmefällen flüssig darstellen.

Features

Der überarbeitete Videodecoder decodiert nun auch H.265-/HEVC-Videos vollständig in Hardware und arbeitet dadurch deutlich effizienter als bislang. Die Bildausgabe erfolgt über DP 1.2/eDP 1.3 (max. 3.840 x 2.160 @ 60 Hz), wohingegen HDMI nur in der älteren Version 1.4a angeboten wird. Ein HDMI-2.0-Anschluss kann aber mittels Konverter von DisplayPort ergänzt werden. Maximal lassen sich drei Displays parallel angesteuern.

Leistungsaufnahme

Die TDP des gesamten Chips liegt standardmäßig bei 6 Watt, sodass viele Ultrabooks oder 2-in-1-Geräte mit einer rein passiven Kühlung auskommen. Teils kann die TDP auch auf 4,5 Watt abgesenkt werden, wodurch allerdings die Performance sinkt.

Intel HD Graphics P530

► remove from comparison Intel HD Graphics P530

Die Intel HD Graphics P530 (GT2) ist eine integrierte Grafikeinheit, die in Skylake-Prozessoren der Xeon-Baureihe für Workstation-Notebooks verbaut wird. Die mittlere, auch "GT2" genannte Ausbaustufe verfügt über 24 EUs (Execution Units bzw. Ausführungseinheiten) und taktet je nach Modell mit bis zu 1.050 MHz (Turbo). Mangels eigenem Grafikspeicher oder eDRAM-Cache greift die HD Graphics P530 über das Interface des Prozessors auf den System-RAM zu (2x 64 Bit DDR3L-1600/DDR4-2133).

Performance

Die Leistung der HD Graphics P530 dürfte entsprechend der identischen technischen Daten genau auf dem Niveau der HD Graphics 530 liegen. Je nach Spiel kann die GPU damit in etwa mit einer dedizierten GeForce 920M konkurrieren und aktuelle Spiele (Stand 2015) zumeist in niedrigen, selten auch mittleren Einstellungen flüssig darstellen.

Features

Der überarbeitete Videodecoder decodiert nun auch H.265-/HEVC-Videos vollständig in Hardware und arbeitet dadurch deutlich effizienter als bislang. Die Bildausgabe erfolgt über DP 1.2/eDP 1.3 (max. 3.840 x 2.160 @ 60 Hz), wohingegen HDMI nur in der älteren Version 1.4a angeboten wird. Ein HDMI-2.0-Anschluss kann aber mittels Konverter von DisplayPort ergänzt werden. Maximal lassen sich drei Displays parallel angesteuern.

Leistungsaufnahme

Mobile Xeon-Modelle wie der E3-1535M v5 werden von Intel mit einer TDP von 45 Watt spezifiziert, sodass die HD Graphics P530 vor allem in größeren Notebooks ab etwa 15 Zoll zu finden ist.

Intel HD Graphics 400 (Braswell)Intel HD Graphics (Skylake)Intel HD Graphics P530
HD Graphics Serie
HD Graphics P530 24 @ 0.35 - 1.05 GHz64/128 Bit
HD Graphics 5600 24 @ 0.3 - 1.05 GHz64/128 Bit
HD Graphics 6000 48 @ 0.3 - 1 GHz64/128 Bit
HD Graphics 4600 20 @ 0.2 - 1.35 GHz64/128 Bit
HD Graphics 5500 24 @ 0.3 - 0.95 GHz64/128 Bit
HD Graphics 5000 40 @ 0.2 - 1.1 GHz64/128 Bit
HD Graphics 4400 20 @ 0.2 - 1.1 GHz64/128 Bit
HD Graphics 5300 24 @ 0.1 - 0.9 GHz64/128 Bit
HD Graphics 4000 16 @ 0.35 - 1.35 GHz64/128 Bit
HD Graphics (Broadwell) 12 @ 0.1 - 0.85 GHz64/128 Bit
HD Graphics 4200 20 @ 0.2 - 0.85 GHz64/128 Bit
HD Graphics (Skylake) 12 @ 0.3 - 0.8 GHz64/128 Bit
HD Graphics 405 (Braswell) 16 @ 0.32 - 0.7 GHz64/128 Bit
HD Graphics (Braswell) 16 @ 0.32 - 0.7 GHz64/128 Bit
HD Graphics 400 (Braswell) 12 @ 0.32 - 0.64 GHz64/128 Bit
HD Graphics (Haswell) 10 @ 0.2 - 1 GHz64/128 Bit
HD Graphics (Cherry Trail) 16 @ 0.2 - 0.6 GHz64/128 Bit
HD Graphics 3000 12 @ 0.35 - 1.35 GHz64/128 Bit
HD Graphics 2500 6 @ 0.65 - 1.15 GHz64/128 Bit
HD Graphics (Ivy Bridge) 6 @ 0.35 - 1.1 GHz64/128 Bit
HD Graphics 2000 6 @ 0.85 - 1.35 GHz64/128 Bit
HD Graphics (Sandy Bridge) 6 @ 0.35 - 1.1 GHz64/128 Bit
HD Graphics (Bay Trail) 4 @ 0.31 - 0.9 GHz32/64/128 Bit
CodenameBraswellSkylake GT1Skylake GT2
ArchitekturGen. 8Gen. 9 SkylakeGen. 9 Skylake
Pipelines12 - unified12 - unified24 - unified
Kerntakt320 - 640 (Boost) MHz300 - 800 (Boost) MHz350 - 1050 (Boost) MHz
Speicherbandbreite64/128 Bit64/128 Bit64/128 Bit
Shared Memoryjajaja
APIDirectX 11.2, Shader 5.0DirectX 12_1, OpenGL 4.4DirectX 12_1, OpenGL 4.4
Herstellungsprozess14 nm14 nm14 nm
Erscheinungsdatum01.04.2016 01.09.2015 01.09.2015
SpeichertypDDR3L/LPDDR3DDR3/DDR4
FeaturesQuickSyncQuickSync
CPU in HD Graphics 400 (Braswell)GPU Base SpeedGPU Boost / Turbo
Intel Atom x5-Z85504 x 1440 MHz200 MHz600 MHz
Intel Celeron N30602 x 1600 MHz, 6 W320 MHz700 MHz
min. - max.200 - 320 MHz600 - 700 MHz
CPU in HD Graphics P530GPU Base SpeedGPU Boost / Turbo
Intel Xeon E3-1535M v54 x 2900 MHz, 45 W350 MHz1050 MHz
Intel Xeon E3-1505M v54 x 2800 MHz, 45 W350 MHz1050 MHz
min. - max.200 - 350 MHz600 - 1050 MHz

Benchmarks

Performance Rating - 3DMark 11 + Fire Strike + Time Spy - HD Graphics 400 (Braswell)
0.1 pt (0%)
3DMark - 3DMark Ice Storm Unlimited Graphics
min: 17968     avg: 20459     median: 20277 (2%)     max: 23161 Points
3DMark - 3DMark Ice Storm Extreme Graphics
14334 Points (2%)
3DMark - 3DMark Cloud Gate Score
min: 1350     avg: 1553     median: 1457 (2%)     max: 2087 Points
3DMark - 3DMark Cloud Gate Graphics
min: 1519     avg: 1865     median: 1841 (0%)     max: 2455 Points
3DMark - 3DMark Fire Strike Standard Score
min: 176     avg: 188     median: 188 (0%)     max: 200 Points
3DMark - 3DMark Fire Strike Standard Graphics
min: 202     avg: 218     median: 218 (0%)     max: 234 Points
3DMark - 3DMark Ice Storm Graphics
min: 13689     avg: 18517     median: 18516.5 (2%)     max: 23344 Points
3DMark - 3DMark Sling Shot (ES 3.0) Unlimited
min: 1502     avg: 1926     median: 1925.5 (8%)     max: 2349 Points
3DMark - 3DMark Sling Shot (ES 3.0) Unlimited Graphics
min: 1452     avg: 2046     median: 2046 (4%)     max: 2640 Points
3DMark - 3DMark Sling Shot Extreme (ES 3.1) Unlimited
1180 Points (6%)
3DMark - 3DMark Sling Shot Extreme (ES 3.1) Unlimited Graphics
977 Points (3%)
3DMark 06 3DMark 06 - Standard 1280x1024 + Intel HD Graphics 400 (Braswell)
3DMark 06
2474 Points (3%)
Cinebench R10 Cinebench R10 Shading (32bit) + Intel HD Graphics 400 (Braswell)
Cinebench R10 - Cinebench R10 Shading (32bit)
min: 1627     avg: 2057     median: 2052.5 (1%)     max: 2510 Points
Cinebench R11.5 Cinebench R11.5 OpenGL 64 Bit + Intel HD Graphics 400 (Braswell)
Cinebench R11.5 - Cinebench R11.5 OpenGL 64 Bit
min: 9.97     avg: 10.1     median: 10 (3%)     max: 10.12 fps
Cinebench R15
Cinebench R15 OpenGL 64 Bit + Intel HD Graphics 400 (Braswell)
Cinebench R15 OpenGL Ref. Match 64 Bit + Intel HD Graphics 400 (Braswell)
GFXBench - GFXBench 5.0 Aztec Ruins High Tier Offscreen
3.3 fps (1%)
GFXBench - GFXBench 5.0 Aztec Ruins Normal Tier Offscreen
9.3 fps (1%)
GFXBench 3.1 - GFXBench Manhattan ES 3.1 Offscreen
min: 7.2     avg: 10.6     median: 10.6 (0%)     max: 14 fps
GFXBench 3.0 - GFXBench 3.0 Manhattan Offscreen
min: 14     avg: 16     median: 16 (1%)     max: 18 fps
GFXBench (DX / GLBenchmark) 2.7
GFXBench T-Rex HD Offscreen C24Z16 + Intel HD Graphics 400 (Braswell)
GFXBench (DX / GLBenchmark) 2.7 - GFXBench T-Rex HD Offscreen C24Z16
min: 27     avg: 29     median: 29 (0%)     max: 31 fps

Average Benchmarks Intel HD Graphics 400 (Braswell) → 0% n=

- Bereich der Benchmarkergebnisse für diese Grafikkarte
- Durchschnittliche Benchmarkergebnisse für diese Grafikkarte
* Smaller numbers mean a higher performance
1 This benchmark is not used for the average calculation

Spiele-Benchmarks

Die folgenden Benchmarks basieren auf unseren Spieletests mit Testnotebooks. Die Performance dieser Grafikkarte bei den gelisteten Spielen ist abhängig von der verwendeten CPU, Speicherausstattung, Treiber und auch Betriebssystem. Dadurch müssen die untenstehenden Werte nicht repräsentativ sein. Detaillierte Informationen über das verwendete System sehen Sie nach einem Klick auf den fps-Wert.

low 1280x720
100%
HD Graphics 400 (Braswell):
14.1  fps
low 1280x720
100%
HD Graphics 400 (Braswell):
18.5  fps
med. 1366x768
100%
HD Graphics 400 (Braswell):
16  fps
low 1280x720
100%
HD Graphics 400 (Braswell):
12.7  fps
Prey

Prey

2017
low 1280x720
100%
HD Graphics 400 (Braswell):
6.8  fps
low 1280x720
100%
HD Graphics 400 (Braswell):
10.7  fps
low 1280x720
100%
HD Graphics 400 (Braswell):
20.9  fps
med. 1366x768
100%
HD Graphics 400 (Braswell):
5.8  fps
low 1024x768
100%
HD Graphics 400 (Braswell):
9.7  fps
Overwatch

Overwatch

2016
low 1280x720
100%
HD Graphics 400 (Braswell):
15 15.1 ~ 15 fps
med. 1366x768
100%
HD Graphics 400 (Braswell):
9.5 9.7 ~ 10 fps
low 1024x768
100%
HD Graphics 400 (Braswell):
5.3  fps
low 1024x768
100%
HD Graphics 400 (Braswell):
7.3  fps
med. 1366x768
100%
HD Graphics 400 (Braswell):
3.2  fps
FIFA 16

FIFA 16

2015
low 1280x720
100%
HD Graphics 400 (Braswell):
36.5  fps
high 1366x768
100%
HD Graphics 400 (Braswell):
14.2  fps
ultra 1920x1080
100%
HD Graphics 400 (Braswell):
9  fps
low 1366x768
100%
HD Graphics 400 (Braswell):
13  fps
med. 1366x768
100%
HD Graphics 400 (Braswell):
8  fps
low 1024x768
100%
HD Graphics 400 (Braswell):
13.3  fps
low 1280x720
100%
HD Graphics 400 (Braswell):
21.3  fps
med. 1366x768
100%
HD Graphics 400 (Braswell):
11.4  fps
low 1024x768
100%
HD Graphics 400 (Braswell):
8.5  fps
med. 1366x768
100%
HD Graphics 400 (Braswell):
5.6  fps
low 1024x768
100%
HD Graphics 400 (Braswell):
40.1  fps
med. 1366x768
100%
HD Graphics 400 (Braswell):
11.7  fps
GTA V

GTA V

2015
low 1024x768
100%
HD Graphics 400 (Braswell):
14.3  fps
low 1024x768
100%
HD Graphics 400 (Braswell):
5.4  fps
med. 1366x768
100%
HD Graphics 400 (Braswell):
2.9  fps
F1 2014

F1 2014

2014
low 1024x768
100%
HD Graphics 400 (Braswell):
27  fps
med. 1366x768
100%
HD Graphics 400 (Braswell):
16  fps
low 1024x768
100%
HD Graphics 400 (Braswell):
11.5 11.9 ~ 12 fps
med. 1366x768
100%
HD Graphics 400 (Braswell):
7  fps
Sims 4

Sims 4

2014
low 1024x768
100%
HD Graphics 400 (Braswell):
37  fps
med. 1366x768
100%
HD Graphics 400 (Braswell):
7.6  fps
low 1024x768
100%
HD Graphics 400 (Braswell):
6.5  fps
med. 1366x768
100%
HD Graphics 400 (Braswell):
4.8  fps
low 1024x768
100%
HD Graphics 400 (Braswell):
28.9  fps
med. 1366x768
100%
HD Graphics 400 (Braswell):
12.5  fps
low 1024x768
100%
HD Graphics 400 (Braswell):
11.8  fps
low 1024x768
100%
HD Graphics 400 (Braswell):
16.2  fps
med. 1366x768
100%
HD Graphics 400 (Braswell):
12.3  fps
high 1366x768
100%
HD Graphics 400 (Braswell):
7.9  fps
Dead Trigger 2

Dead Trigger 2

2013
high
100%
HD Graphics 400 (Braswell):
30  fps
F1 2013

F1 2013

2013
low 1024x768
100%
HD Graphics 400 (Braswell):
28  fps
med. 1366x768
100%
HD Graphics 400 (Braswell):
17  fps
Asphalt 8: Airborne

Asphalt 8: Airborne

2013
low
100%
HD Graphics 400 (Braswell):
30  fps
high
100%
HD Graphics 400 (Braswell):
30  fps
GRID 2

GRID 2

2013
low 1024x768
100%
HD Graphics 400 (Braswell):
19.9  fps
med. 1366x768
100%
HD Graphics 400 (Braswell):
12.5  fps
low 1280x720
100%
HD Graphics 400 (Braswell):
16.2 16.5 16.9 18.1 18.5 18.7 18.8 19.5 ~ 18 fps
med. 1366x768
100%
HD Graphics 400 (Braswell):
7.2 7.8 8.5 8.8 8.9 9.1 9.6 ~ 9 fps
high 1366x768
100%
HD Graphics 400 (Braswell):
6.2  fps
ultra 1920x1080
100%
HD Graphics 400 (Braswell):
1.8  fps
low 1024x768
100%
HD Graphics 400 (Braswell):
24.8  fps
med. 1366x768
100%
HD Graphics 400 (Braswell):
10.2 (!)  fps
low 1024x768
100%
HD Graphics 400 (Braswell):
21.1  fps
med. 1366x768
100%
HD Graphics 400 (Braswell):
10.8  fps
high 1366x768
100%
HD Graphics 400 (Braswell):
8.7  fps
low 1024x768
100%
HD Graphics 400 (Braswell):
10.5  fps
low 1024x768
100%
HD Graphics 400 (Braswell):
18.3  fps
Anno 2070

Anno 2070

2011
low 1024x768
100%
HD Graphics 400 (Braswell):
27.7  fps
low 1280x720
100%
HD Graphics 400 (Braswell):
19.8  fps
med. 1366x768
100%
HD Graphics 400 (Braswell):
9.5  fps
low 1024x768
100%
HD Graphics 400 (Braswell):
18.4  fps
high 1366x768
100%
HD Graphics 400 (Braswell):
11.3  fps
Dirt 3

Dirt 3

2011
low 800x600
100%
HD Graphics 400 (Braswell):
29.4  fps
med. 1024x768
100%
HD Graphics 400 (Braswell):
14.3  fps
high 1360x768
100%
HD Graphics 400 (Braswell):
12.5  fps
low 1024x768
100%
HD Graphics 400 (Braswell):
34.5  fps
med. 1360x768
100%
HD Graphics 400 (Braswell):
8.8  fps
high 1360x768
100%
HD Graphics 400 (Braswell):
5.6  fps
Trackmania Nations Forever

Trackmania Nations Forever

2008
low 640x480
100%
HD Graphics 400 (Braswell):
60 88.5 ~ 74 fps
high 1024x768
100%
HD Graphics 400 (Braswell):
22.6 25.2 ~ 24 fps
ultra 1920x1080
100%
HD Graphics 400 (Braswell):
9.9  fps

Average Gaming Intel HD Graphics 400 (Braswell) → 100%

Average Gaming 30-70 fps → 100%

Intel HD Graphics 400 (Braswell)lowmed.highultraQHD4K
Farming Simulator 1914.1
Team Fortress 218.516
Rocket League12.7
Prey6.8
Resident Evil 710.7
Farming Simulator 1720.95.8
Civilization VI9.7
Overwatch1510
Rise of the Tomb Raider5.3
Rainbow Six Siege7.33.2
FIFA 1636.514.29
World of Warships138
Metal Gear Solid V13.3
Dota 2 Reborn21.311.4
The Witcher 38.55.6
Dirt Rally40.111.7
GTA V14.3
Dragon Age: Inquisition5.42.9
F1 20142716
Alien: Isolation127
Sims 4377.6
Risen 3: Titan Lords6.54.8
GRID: Autosport28.912.5
X-Plane 10.2511.8
Battlefield 416.212.37.9
Dead Trigger 230
F1 20132817
Asphalt 8: Airborne3030
GRID 219.912.5
BioShock Infinite1896.231.8
Tomb Raider24.810.2
Dead Space 321.110.88.7
Counter-Strike: GO10.5
Diablo III18.3
Anno 207027.7
The Elder Scrolls V: Skyrim19.89.5
Deus Ex Human Revolution18.411.3
Dirt 329.414.312.5
StarCraft 234.58.85.6
Trackmania Nations Forever74249.9
< 30 fps
< 60 fps
< 120 fps
≥ 120 fps
33
5
1
23


8
2

3


Eine Liste mit weiteren Spielen und allen Grafikkarten finden Sie auf unserer Seite: Welches Spiel ist mit welcher Grafikkarte spielbar?

v1.26
log 18. 08:49:42

#0 checking url part for id 7349 +0s ... 0s

#1 checking url part for id 6474 +0s ... 0s

#2 checking url part for id 6452 +0s ... 0s

#3 not redirecting to Ajax server +0s ... 0s

#4 did not recreate cache, as it is less than 5 days old! Created at Tue, 16 Apr 2024 05:39:00 +0200 +0.001s ... 0.001s

#5 composed specs +0.139s ... 0.14s

#6 did output specs +0s ... 0.14s

#7 start showIntegratedCPUs +0s ... 0.14s

#8 getting avg benchmarks for device 7349 +0.055s ... 0.195s

#9 got single benchmarks 7349 +0.08s ... 0.275s

#10 getting avg benchmarks for device 6474 +0.002s ... 0.277s

#11 got single benchmarks 6474 +0s ... 0.277s

#12 getting avg benchmarks for device 6452 +0.002s ... 0.279s

#13 got single benchmarks 6452 +0s ... 0.279s

#14 got avg benchmarks for devices +0s ... 0.279s

#15 min, max, avg, median took s +0.109s ... 0.389s

#16 before gaming benchmark output +0s ... 0.389s

#17 Got 93 rows for game benchmarks. +0.011s ... 0.4s

#18 composed SQL query for gamebenchmarks +0s ... 0.4s

#19 got data and put it in $dataArray +0.028s ... 0.428s

#20 benchmarks composed for output. +0.09s ... 0.518s

#21 calculated avg scores. +0s ... 0.518s

#22 return log +0.002s ... 0.52s

Teilen Sie diesen Artikel, um uns zu unterstützen. Jeder Link hilft!
> Notebook Test, Laptop Test und News > Benchmarks / Technik > Benchmarks / Technik > Grafikkarten Vergleich - Head 2 Head
Autor: Klaus Hinum,  8.09.2017 (Update:  1.07.2023)