Intel HD Graphics 405 (Braswell) vs Intel HD Graphics (Ivy Bridge) vs Intel HD Graphics (Haswell)
Intel HD Graphics 405 (Braswell) ► remove from comparison
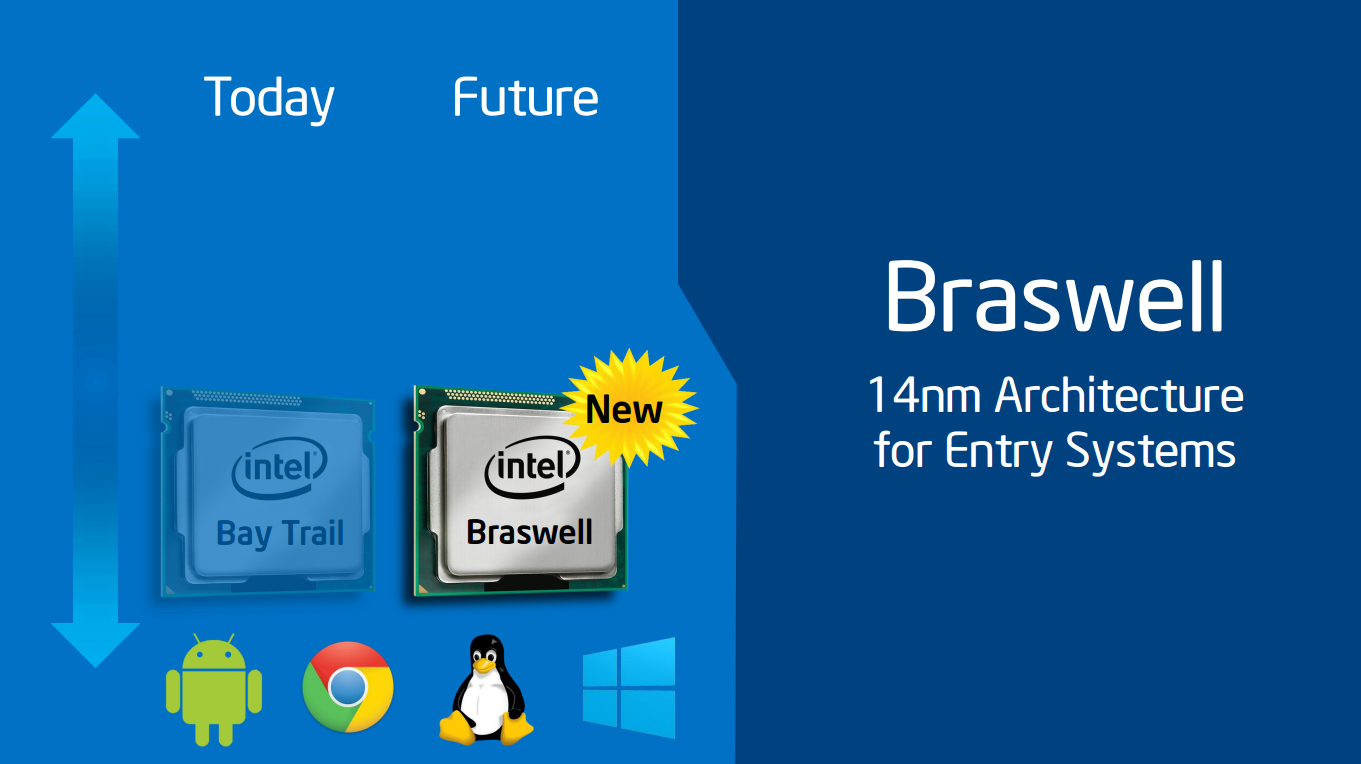
Die Intel HD Graphics 405 ist eine in den Low-End-SoCs der Braswell-Serie (z.B. Pentium N3710 ) integrierte Grafikeinheit. Sie basiert auf der gleichen Architektur wie die GPU verschiedener Broadwell-Prozessoren (z.B. HD Graphics 5300 ), bietet allerdings deutlich weniger Shadereinheiten und geringere Taktraten. Die genauen Spezifikationen hängen vom jeweiligen SoC ab: Die schnellste Variante mit 16 EUs und maximal 700 MHz schlägt die ältere HD Graphics (Bay Trail) um etwa Faktor zwei. Vor 2016 war die Grafikkarte nur unter Intel HD Graphics (Braswell) bekannt und beinhaltete 12 und 16-Kern-Modelle.
Anwender müssen sich deshalb insbesondere bei den Celeron-Modellen, die zusätzlich durch die Beschneidung auf nur zwei CPU-Kerne ausgebremst werden, auf ältere und anspruchslose Spiele beschränken. Videos werden dagegen auch in 4K/H.265 flüssig wiedergeben.
Weitere Benchmarks sind daher auch auf unserer Seite der Intel HD Graphics (Braswell) zu finden.
Intel HD Graphics (Ivy Bridge) ► remove from comparison
Die Intel HD Graphics ist eine in den Ivy Bridge Prozessoren integrierte Grafikkarte. Sie kommt in den mobilen Celeron- und Pentium-Modellen zu Einsatz. Im Vergleich zur stärkeren Intel HD Graphics 4000 , ist die HD Graphics deutlich abgespeckt und bietet weniger Execution Units (6 EUs) und Texture Sampler (nur einer). Daher ist die Performance deutlich geringer und liegt nur etwas oberhalb der alten Intel HD Graphics 2000 . Je nach Prozessor weist die HD Graphics eine unterschiedliche Basis- und Turbo-Taktrate auf.
Da die Leistung nur zwischen der HD Graphics 2000 und 3000 liegt, ist die Ivy Bridge GT1 nur für ältere und anspruchslose Spiele ausreichend. Intel selbst gibt eine Geschwindigkeit 10-15% über der alten HD Graphics 2000 in Sandy Bridge CPUs an. Unsere Benchmarks (siehe weiter unten) zeigen eine Performance auf dem Niveau integrierter Einstiegslösungen von AMD wie der Radeon HD 8210 .
Eine Besonderheit der Ivy Bride Grafikkerne ist, dass nur 4x MSAA von der Hardware unterstützt wird. 2x MSAA wird per Software berechnet und geht durch die 4x MSAA Pipeline. Daher empfiehlt sich der Einsatz des gleich schnellen 4x MSAA.
Auch der integrierte Videodecoder genannt Multi Format Codec Engine (MFX) wurde kräftig überarbeitet und soll nun sogar mehrere 4K Videos parallel dekodieren können (ev. nur in den High-End Modellen). DXVA Checker gibt weiterhin die Formate MPEG2, VC1, WMV9 und H264 als unterstützt an. QuickSync zum schnellen Transkodieren von Videos wurde ebenfalls verbessert und soll nun schneller bei gleichzeitig höherer Qualität laufen.
Ebenfalls neu ist die Unterstützung für drei unabhängige Bildschirme . Bis Sandy Bridge waren nur zwei möglich und lediglich die AMD Grafikkarten mit Eyefinity Support bieten mehr als zwei Anschlüsse für Notebooks (jedoch nur mit DisplayPort).
Aufgrund der Integration in den mit 22nm gefertigten Prozessor und die halbierte Shaderzahl ist der Stromverbrauch relativ gering und eignet sich auch für flache und kleine Notebooks.
Intel HD Graphics (Haswell) ► remove from comparison
Die Intel HD Graphics ist eine in den Haswell Prozessoren integrierte Grafikkarte. Sie kommt in den mobilen Celeron- und Pentium-Modellen zu Einsatz. Je nach Prozessormodell kann die HD Graphics (auch GT1 genannt) unterschiedlich getaktet sein (typischerweise 200 MHz Basis- und 1.000 MHz Turbo-Takt). Dies sowie die Geschwindigkeit des angebundenen Arbeitsspeichers beeinflusst die Performance entscheidend.
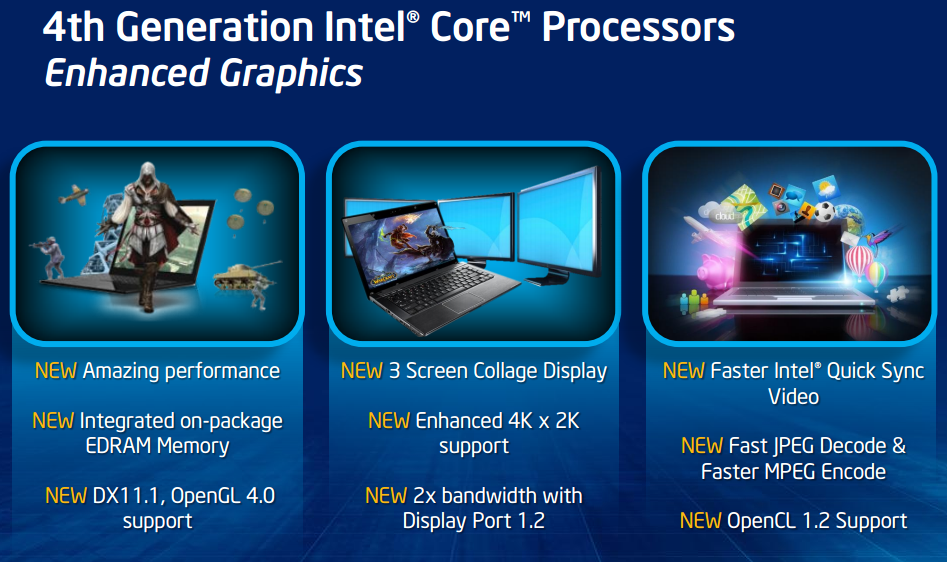
Der Grafikkern wurde im Vergleich zum Intel HD Graphics 4000 der Ivy-Bridge-Generation in verschiedenen Punkten weiterentwickelt. So unterstützt die GPU nun mit DirectX 11.1, OpenCL 1.2 und OpenGL 4.0 alle wichtigen aktuellen Standards. Auch ein verbesserter Decoder für 4K-Videos sowie ein überarbeiteter Quick-Sync-Encoder (bei vielen Einstiegsmodellen deaktiviert) sind mit an Bord.
Die Performance der HD Graphics (Haswell) liegt durch die Beschneidung auf nur noch 10 EUs deutlich unter der HD Graphics 4400 /4600 und etwa auf dem Level der älteren HD Graphics 3000 oder AMDs Radeon HD 8250 . Nur die wenigsten aktuellen Spiele des Jahres 2013, beispielsweise das sehr anspruchslose Dota 2, können mit niedrigsten Details flüssig dargestellt werden.
Der Stromverbrauch ist dank des 22-Nanometer-Prozesses mit Tri-Gate-Transistoren relativ gering und wird dynamisch vom TDP-Budget des gesamten Chips abgezweigt. Die HD Graphics (Haswell) wird in Dual-Core-Prozessoren der ULV- und regulären 37-Watt-Klasse eingesetzt.
Weitere Details zur Grafikkartenarchitektur der Haswell Generation finden Sie in unserem Artikel zur Haswell-Architektur sowie dem Testbericht der HD Graphics 4600 .
Intel HD Graphics 405 (Braswell) Intel HD Graphics (Ivy Bridge) Intel HD Graphics (Haswell) HD Graphics Serie Codename Braswell Ivy Bridge GT1 Haswell GT1 Architektur Gen. 8 Gen. 7 Ivy Bridge Gen. 7.5 Haswell Pipelines 16 - unified 6 - unified 10 - unified Kerntakt 320 - 700 (Boost) MHz 350 - 1100 (Boost) MHz 200 - 1000 (Boost) MHz Speicherbandbreite 64/128 Bit 64/128 Bit 64/128 Bit Shared Memory ja ja ja API DirectX 11.2, Shader 5.0 DirectX 11.0, Shader 5.0 DirectX 11.1, Shader 5.0 Herstellungsprozess 14 nm 22 nm 22 nm Erscheinungsdatum 01.04.2016 01.10.2012 01.10.2012
CPU in HD Graphics 405 (Braswell) GPU Base Speed GPU Boost / Turbo Intel Pentium N3710 4 x 1600 MHz, 6 W 400 MHz 700 MHz Intel Atom x7-Z8750 4 x 1600 MHz 400 MHz 600 MHz min. - max. 400 MHz 600 - 700 MHz
CPU in HD Graphics (Ivy Bridge) GPU Base Speed GPU Boost / Turbo Intel Pentium 2030M 2 x 2500 MHz, 35 W 650 MHz 1100 MHz Intel Pentium 2020M 2 x 2400 MHz, 35 W 650 MHz 1100 MHz Intel Celeron 1020E 2 x 2200 MHz, 35 W 650 MHz 1000 MHz » show 12 more Intel Celeron 1020M 2 x 2100 MHz, 35 W 650 MHz 1000 MHz Intel Pentium 2127U 2 x 1900 MHz, 17 W 350 MHz 1100 MHz Intel Celeron 1005M 2 x 1900 MHz, 35 W 650 MHz 1000 MHz Intel Pentium 2117U 2 x 1800 MHz, 17 W 350 MHz 1000 MHz Intel Celeron 1000M 2 x 1800 MHz, 35 W 650 MHz 1000 MHz Intel Celeron 1037U 2 x 1800 MHz, 17 W 350 MHz 1000 MHz Intel Celeron 1017U 2 x 1600 MHz, 17 W 350 MHz 1000 MHz Intel Celeron 1007U 2 x 1500 MHz, 17 W 350 MHz 1000 MHz Intel Celeron 1047UE 2 x 1400 MHz, 17 W 350 MHz 900 MHz Intel Pentium 2129Y 2 x 1100 MHz, 10 W 350 MHz 850 MHz Intel Celeron 1019Y 2 x 1000 MHz, 10 W 350 MHz 800 MHz Intel Celeron 927UE 1 x 1500 MHz, 17 W 350 MHz 900 MHz min. - max. 350 - 650 MHz 600 - 1100 MHz
CPU in HD Graphics (Haswell) GPU Base Speed GPU Boost / Turbo Intel Pentium 3560M 2 x 2400 MHz, 37 W 400 MHz 1100 MHz Intel Pentium 3550M 2 x 2300 MHz, 37 W 400 MHz 1100 MHz Intel Celeron 2970M 2 x 2200 MHz, 37 W 400 MHz 1100 MHz » show 10 more Intel Celeron 2950M 2 x 2000 MHz, 37 W 400 MHz 1100 MHz Intel Pentium 3558U 2 x 1700 MHz, 15 W 200 MHz 1000 MHz Intel Pentium 3556U 2 x 1700 MHz, 15 W 200 MHz 1000 MHz Intel Celeron 2981U 2 x 1600 MHz, 15 W 200 MHz 1000 MHz Intel Celeron 2980U 2 x 1600 MHz, 15 W 200 MHz 1000 MHz Intel Celeron 2957U 2 x 1400 MHz, 15 W 200 MHz 1000 MHz Intel Celeron 2955U 2 x 1400 MHz, 15 W 200 MHz 1000 MHz Intel Pentium 3561Y 2 x 1200 MHz, 11.5 W 200 MHz 850 MHz Intel Pentium 3560Y 2 x 1200 MHz, 11.5 W 200 MHz 850 MHz Intel Celeron 2961Y 2 x 1100 MHz, 11.5 W 200 MHz 850 MHz min. - max. 200 - 650 MHz 600 - 1100 MHz
Benchmarks Performance Rating - 3DMark 11 + Fire Strike + Time Spy - HD Graphics 405 (Braswell)
0.1 pt (0%)
Intel HD Graphics 405 (Braswell)
...
max:
Performance Rating - 3DMark 11 + Fire Strike + Time Spy - HD Graphics (Ivy Bridge)
0.1 pt (0%)
...
Intel HD Graphics (Ivy Bridge)
...
max:
Performance Rating - 3DMark 11 + Fire Strike + Time Spy - HD Graphics (Haswell)
0.2 pt (0%)
...
Intel HD Graphics (Haswell)
...
max:
3DMark - 3DMark Ice Storm Unlimited Graphics
min: 19812 avg: 23763 median: 23763 (3%) max: 27714 Points
43493 Points (5%)
3DMark - 3DMark Ice Storm Extreme Graphics
min: 12601 avg: 14069 median: 14068.5 (2%) max: 15536 Points
3DMark - 3DMark Cloud Gate Score
min: 1743 avg: 2000 median: 1933 (2%) max: 2392 Points
min: 1478 avg: 1898 median: 1906.5 (2%) max: 2207 Points
min: 2141 avg: 2403 median: 2335.5 (2%) max: 3011 Points
3DMark - 3DMark Cloud Gate Graphics
min: 1767 avg: 2206 median: 2113 (1%) max: 2831 Points
min: 2116 avg: 2283 median: 2286 (1%) max: 2470 Points
min: 3111 avg: 3415 median: 3278 (1%) max: 4199 Points
3DMark - 3DMark Fire Strike Standard Score
min: 216 avg: 237.5 median: 237.5 (0%) max: 259 Points
min: 208 avg: 253.6 median: 254.5 (0%) max: 275 Points
min: 300 avg: 323.8 median: 314 (1%) max: 383 Points
3DMark - 3DMark Fire Strike Standard Graphics
min: 231 avg: 254.5 median: 254.5 (0%) max: 278 Points
min: 248 avg: 286.2 median: 285.5 (0%) max: 305 Points
min: 340 avg: 370.8 median: 362.5 (0%) max: 433 Points
3DMark - 3DMark Ice Storm Graphics
min: 26056 avg: 28119 median: 28119 (3%) max: 30182 Points
min: 22834 avg: 24734 median: 24209.5 (3%) max: 29149 Points
min: 29291 avg: 34138 median: 34675 (4%) max: 40515 Points
3DMark 11 - 3DM11 Performance Score
min: 451 avg: 523 median: 537 (1%) max: 565 Points
min: 258 avg: 363.3 median: 370.5 (1%) max: 413 Points
min: 435 avg: 543 median: 544 (1%) max: 688 Points
3DMark 11 - 3DM11 Performance GPU
min: 408 avg: 469.1 median: 473 (0%) max: 496 Points
min: 218 avg: 310.6 median: 315 (0%) max: 352 Points
min: 384 avg: 479.6 median: 484 (0%) max: 602 Points
3DMark Vantage + Intel HD Graphics 405 (Braswell) 3DMark Vantage - 3DM Vant. Perf. total
2081 Points (1%)
3DM Vant. Perf. total + Intel HD Graphics (Ivy Bridge) min: 930 avg: 1465 median: 1491 (0%) max: 1691 Points
3DM Vant. Perf. total + Intel HD Graphics (Haswell)
min: 2146 avg: 2163 median: 2163 (1%) max: 2180 Points
3DM Vant. Perf. GPU no PhysX + Intel HD Graphics 405 (Braswell) 3DMark Vantage - 3DM Vant. Perf. GPU no PhysX
1730 Points (1%)
3DM Vant. Perf. GPU no PhysX + Intel HD Graphics (Ivy Bridge)
min: 728 avg: 1186 median: 1213 (1%) max: 1360 Points
3DM Vant. Perf. GPU no PhysX + Intel HD Graphics (Haswell)
min: 1848 avg: 1859 median: 1859 (1%) max: 1870 Points
3DMark 2001SE - 3DMark 2001 - Standard
min: 8075 avg: 9212 median: 9212 (10%) max: 10349 Points
3DMark 03 - 3DMark 03 - Standard
min: 5909 avg: 7584 median: 7434 (4%) max: 10124 Points
3DMark 05 - 3DMark 05 - Standard
min: 3839 avg: 5085 median: 5186 (6%) max: 6252 Points
3DMark 06 3DMark 06 - Standard 1280x1024 + Intel HD Graphics 405 (Braswell)
min: 2274 avg: 2920 median: 2920 (4%) max: 3566 Points
3DMark 06 - Standard 1280x1024 + Intel HD Graphics (Ivy Bridge)
min: 2186 avg: 2949 median: 2930 (4%) max: 3573 Points
3DMark 06 - Standard 1280x1024 + Intel HD Graphics (Haswell)
min: 2917 avg: 3274 median: 3357.5 (4%) max: 3463 Points
Unigine Heaven 2.1 - Heaven 2.1 high
7.4 fps (1%)
SPECviewperf 11 + Intel HD Graphics (Ivy Bridge) SPECviewperf 11 - specvp11 snx-01
min: 0.75 avg: 0.8 median: 0.8 (0%) max: 0.87 fps
specvp11 tcvis-02 + Intel HD Graphics (Ivy Bridge) SPECviewperf 11 - specvp11 tcvis-02
min: 1.31 avg: 1.5 median: 1.5 (1%) max: 1.66 fps
specvp11 sw-02 + Intel HD Graphics (Ivy Bridge) SPECviewperf 11 - specvp11 sw-02
min: 4.68 avg: 5.3 median: 5.3 (4%) max: 5.88 fps
specvp11 proe-05 + Intel HD Graphics (Ivy Bridge) SPECviewperf 11 - specvp11 proe-05
min: 0.91 avg: 1.1 median: 1.1 (1%) max: 1.19 fps
specvp11 maya-03 + Intel HD Graphics (Ivy Bridge) SPECviewperf 11 - specvp11 maya-03
min: 8.71 avg: 8.8 median: 8.8 (7%) max: 8.93 fps
specvp11 lightwave-01 + Intel HD Graphics (Ivy Bridge) SPECviewperf 11 - specvp11 lightwave-01
min: 7.83 avg: 8.9 median: 8.9 (10%) max: 10.03 fps
specvp11 ensight-04 + Intel HD Graphics (Ivy Bridge) SPECviewperf 11 - specvp11 ensight-04
min: 1.27 avg: 1.4 median: 1.4 (1%) max: 1.51 fps
specvp11 catia-03 + Intel HD Graphics (Ivy Bridge) SPECviewperf 11 - specvp11 catia-03
0 fps (0%)
Windows 7 Experience Index - Win7 Gaming graphics
6.2 Points (78%)
6.3 Points (80%)
Windows 7 Experience Index - Win7 Graphics
min: 4.6 avg: 4.7 median: 4.7 (59%) max: 4.7 Points
4.7 Points (59%)
Cinebench R10 Cinebench R10 Shading (32bit) + Intel HD Graphics 405 (Braswell) Cinebench R10 - Cinebench R10 Shading (32bit)
min: 2412 avg: 2685 median: 2753 (2%) max: 2822 Points
Cinebench R10 Shading (32bit) + Intel HD Graphics (Ivy Bridge)
min: 2410 avg: 3337 median: 3382 (2%) max: 4037 Points
Cinebench R10 Shading (32bit) + Intel HD Graphics (Haswell)
min: 3867 avg: 4235 median: 4215.5 (3%) max: 4642 Points
Cinebench R11.5 Cinebench R11.5 OpenGL 64 Bit + Intel HD Graphics 405 (Braswell) Cinebench R11.5 - Cinebench R11.5 OpenGL 64 Bit
min: 10.24 avg: 11.7 median: 11.7 (4%) max: 13.06 fps
Cinebench R11.5 OpenGL 64 Bit + Intel HD Graphics (Ivy Bridge)
min: 6.62 avg: 9.1 median: 9.2 (3%) max: 11.32 fps
Cinebench R11.5 OpenGL 64 Bit + Intel HD Graphics (Haswell)
min: 9.38 avg: 11.4 median: 11.6 (4%) max: 12.78 fps
Cinebench R15 + Intel HD Graphics 405 (Braswell) Cinebench R15 - Cinebench R15 OpenGL 64 Bit
min: 10.3 avg: 13.8 median: 14.1 (1%) max: 15.74 fps
Cinebench R15 OpenGL 64 Bit + Intel HD Graphics (Haswell)
min: 10.28 avg: 13.2 median: 13.9 (1%) max: 14.59 fps
Cinebench R15 OpenGL Ref. Match 64 Bit + Intel HD Graphics 405 (Braswell) Cinebench R15 - Cinebench R15 OpenGL Ref. Match 64 Bit
min: 9 avg: 83.2 median: 98 (98%) max: 98 %
Cinebench R15 OpenGL Ref. Match 64 Bit + Intel HD Graphics (Haswell)
98 % (98%)
GFXBench - GFXBench Car Chase Offscreen
9.9 fps (1%)
11.6 fps (1%)
GFXBench 3.1 - GFXBench Manhattan ES 3.1 Offscreen
20.3 fps (0%)
20.1 fps (0%)
GFXBench 3.0 - GFXBench 3.0 Manhattan Offscreen
20.3 fps (1%)
28.7 fps (2%)
GFXBench (DX / GLBenchmark) 2.7 + Intel HD Graphics 405 (Braswell) GFXBench (DX / GLBenchmark) 2.7 - GFXBench T-Rex HD Offscreen C24Z16
41.3 fps (0%)
GFXBench T-Rex HD Offscreen C24Z16 + Intel HD Graphics (Ivy Bridge) 27 fps (0%)
GFXBench T-Rex HD Offscreen C24Z16 + Intel HD Graphics (Haswell) 53.5 fps (0%)
LuxMark v2.0 64Bit - LuxMark v2.0 Room GPU
min: 56 avg: 68 median: 68 (0%) max: 80 Samples/s
min: 27 avg: 38.3 median: 44 (0%) max: 44 Samples/s
min: 77 avg: 93 median: 93 (0%) max: 109 Samples/s
LuxMark v2.0 64Bit - LuxMark v2.0 Sala GPU
min: 81 avg: 102.5 median: 102.5 (0%) max: 124 Samples/s
44 Samples/s (0%)
min: 115 avg: 140 median: 140 (0%) max: 165 Samples/s
ComputeMark v2.1 - ComputeMark v2.1 Result
min: 388 avg: 390.5 median: 390.5 (0%) max: 393 Points
min: 190 avg: 266.4 median: 275 (0%) max: 290 Points
min: 355 avg: 370 median: 370 (0%) max: 385 Points
Power Consumption - Furmark Stress Test Power Consumption - external Monitor *
9.8 Watt (1%)
43.7 Watt (6%)
Power Consumption - The Witcher 3 Power Consumption - external Monitor *
30.5 Watt (4%)
Average Benchmarks Intel HD Graphics 405 (Braswell) → 100% n=16 Average Benchmarks Intel HD Graphics (Ivy Bridge) → 83% n=16 Average Benchmarks Intel HD Graphics (Haswell) → 122% n=16
- Bereich der Benchmarkergebnisse für diese Grafikkarte
- Durchschnittliche Benchmarkergebnisse für diese Grafikkarte
* Smaller numbers mean a higher performance
1 This benchmark is not used for the average calculation
Spiele-Benchmarks Die folgenden Benchmarks basieren auf unseren Spieletests mit Testnotebooks. Die Performance dieser Grafikkarte bei den gelisteten Spielen ist abhängig von der verwendeten CPU, Speicherausstattung, Treiber und auch Betriebssystem. Dadurch müssen die untenstehenden Werte nicht repräsentativ sein. Detaillierte Informationen über das verwendete System sehen Sie nach einem Klick auf den fps-Wert.
100%
HD Graphics 405 (Braswell):
17.8 fps
100%
HD Graphics 405 (Braswell):
18 fps
100%
HD Graphics 405 (Braswell):
9.9 fps
100%
HD Graphics 405 (Braswell):
23.6 fps
100%
HD Graphics 405 (Braswell):
18 fps
100%
HD Graphics 405 (Braswell):
13.9 fps
HD Graphics (Haswell):
0 (!) [X] MSI CX61 2QC 2970M MS-16GD Intel Celeron 2970M 2.2GHz
HD Graphics (Haswell)
fps
HD Graphics (Haswell):
4.9 (!) [X] MSI CX61 2QC 2970M MS-16GD Intel Celeron 2970M 2.2GHz
HD Graphics (Haswell)
min:
1 fps, max:
7 fps
fps
HD Graphics 405 (Braswell):
0 (!) [X] Teclast Tbook 16 Power Intel Atom x7-Z8750 1.6GHz
HD Graphics 405 (Braswell)
fps
100%
HD Graphics 405 (Braswell):
37 fps
100%
HD Graphics 405 (Braswell):
24 fps
100%
HD Graphics 405 (Braswell):
25 fps
100%
HD Graphics 405 (Braswell):
30 fps
100%
HD Graphics 405 (Braswell):
37 fps
HD Graphics (Haswell):
14.3 [X] MSI CX61 2QC 2970M MS-16GD Intel Celeron 2970M 2.2GHz
HD Graphics (Haswell)
fps
HD Graphics (Haswell):
8 [X] MSI CX61 2QC 2970M MS-16GD Intel Celeron 2970M 2.2GHz
HD Graphics (Haswell)
fps
HD Graphics (Haswell):
5.9 [X] MSI CX61 2QC 2970M MS-16GD Intel Celeron 2970M 2.2GHz
HD Graphics (Haswell)
min:
5 fps, max:
7 fps
fps
HD Graphics (Haswell):
13 [X] MSI CX61 2QC 2970M MS-16GD Intel Celeron 2970M 2.2GHz
HD Graphics (Haswell)
min:
7 fps, max:
13 fps
fps
100%
HD Graphics 405 (Braswell):
19.6 fps
316%
HD Graphics (Haswell):
62 [X] MSI CX61 2QC 2970M MS-16GD Intel Celeron 2970M 2.2GHz
HD Graphics (Haswell)
min:
54 fps
fps
HD Graphics (Haswell):
28.6 [X] MSI CX61 2QC 2970M MS-16GD Intel Celeron 2970M 2.2GHz
HD Graphics (Haswell)
min:
19 fps
fps
HD Graphics (Haswell):
16.4 [X] MSI CX61 2QC 2970M MS-16GD Intel Celeron 2970M 2.2GHz
HD Graphics (Haswell)
min:
14 fps, max:
19 fps
fps
100%
HD Graphics 405 (Braswell):
18.7 fps
241%
HD Graphics (Haswell):
45.1 [X] MSI CX61 2QC 2970M MS-16GD Intel Celeron 2970M 2.2GHz
HD Graphics (Haswell)
min:
37 fps, max:
54 fps
fps
HD Graphics (Haswell):
15.9 [X] MSI CX61 2QC 2970M MS-16GD Intel Celeron 2970M 2.2GHz
HD Graphics (Haswell)
min:
13 fps, max:
19 fps
fps
HD Graphics (Haswell):
0 (!) [X] MSI CX61 2QC 2970M MS-16GD Intel Celeron 2970M 2.2GHz
HD Graphics (Haswell)
fps
100%
HD Graphics 405 (Braswell):
13.5 fps
132%
HD Graphics (Haswell):
17.8 [X] MSI CX61 2QC 2970M MS-16GD Intel Celeron 2970M 2.2GHz
HD Graphics (Haswell)
min:
15 fps, max:
21 fps
fps
100%
HD Graphics 405 (Braswell):
11 fps
100%
HD Graphics 405 (Braswell):
14.4 fps
100%
HD Graphics 405 (Braswell):
10.5 fps
100%
HD Graphics 405 (Braswell):
17.6 31.3 ~ 24 fps
161%
HD Graphics (Haswell):
38.6 [X] MSI CX61 2QC 2970M MS-16GD Intel Celeron 2970M 2.2GHz
HD Graphics (Haswell)
min:
35 fps, max:
52 fps
fps
100%
HD Graphics 405 (Braswell):
21.3 fps
101%
HD Graphics (Haswell):
21.6 [X] MSI CX61 2QC 2970M MS-16GD Intel Celeron 2970M 2.2GHz
HD Graphics (Haswell)
min:
19 fps, max:
28 fps
fps
HD Graphics (Haswell):
6.3 [X] MSI CX61 2QC 2970M MS-16GD Intel Celeron 2970M 2.2GHz
HD Graphics (Haswell)
min:
5 fps, max:
8 fps
fps
HD Graphics (Haswell):
14.1 [X] MSI CX61 2QC 2970M MS-16GD Intel Celeron 2970M 2.2GHz
HD Graphics (Haswell)
min:
12 fps, max:
15 fps
fps
100%
HD Graphics 405 (Braswell):
12.2 fps
100%
HD Graphics 405 (Braswell):
5.2 fps
100%
HD Graphics 405 (Braswell):
10.5 fps
118%
HD Graphics (Haswell):
12.4 [X] MSI CX61 2QC 2970M MS-16GD Intel Celeron 2970M 2.2GHz
HD Graphics (Haswell)
min:
11 fps, max:
14 fps
fps
100%
HD Graphics 405 (Braswell):
6.1 fps
116%
HD Graphics (Haswell):
7.1 [X] MSI CX61 2QC 2970M MS-16GD Intel Celeron 2970M 2.2GHz
HD Graphics (Haswell)
min:
6 fps, max:
8 fps
fps
HD Graphics (Haswell):
26.1 [X] MSI CX61 2QC 2970M MS-16GD Intel Celeron 2970M 2.2GHz
HD Graphics (Haswell)
min:
19 fps, max:
33 fps
fps
HD Graphics (Haswell):
16.3 [X] MSI CX61 2QC 2970M MS-16GD Intel Celeron 2970M 2.2GHz
HD Graphics (Haswell)
min:
12 fps, max:
21 fps
fps
HD Graphics (Haswell):
0 (!) [X] MSI CX61 2QC 2970M MS-16GD Intel Celeron 2970M 2.2GHz
HD Graphics (Haswell)
fps
HD Graphics (Haswell):
6 [X] MSI CX61 2QC 2970M MS-16GD Intel Celeron 2970M 2.2GHz
HD Graphics (Haswell)
min:
3 fps, max:
9 fps
fps
HD Graphics (Haswell):
8.5 [X] MSI CX61 2QC 2970M MS-16GD Intel Celeron 2970M 2.2GHz
HD Graphics (Haswell)
min:
6 fps, max:
11 fps
fps
HD Graphics (Haswell):
9 [X] MSI CX61 2QC 2970M MS-16GD Intel Celeron 2970M 2.2GHz
HD Graphics (Haswell)
min:
8 fps, max:
11 fps
fps
100%
HD Graphics 405 (Braswell):
7.1 fps
132%
HD Graphics (Haswell):
9.4 [X] MSI CX61 2QC 2970M MS-16GD Intel Celeron 2970M 2.2GHz
HD Graphics (Haswell)
min:
8 fps, max:
11 fps
fps
100%
HD Graphics 405 (Braswell):
4.2 fps
126%
HD Graphics (Haswell):
5.3 [X] MSI CX61 2QC 2970M MS-16GD Intel Celeron 2970M 2.2GHz
HD Graphics (Haswell)
fps
HD Graphics (Haswell):
2.5 [X] MSI CX61 2QC 2970M MS-16GD Intel Celeron 2970M 2.2GHz
HD Graphics (Haswell)
fps
HD Graphics (Haswell):
1.8 [X] MSI CX61 2QC 2970M MS-16GD Intel Celeron 2970M 2.2GHz
HD Graphics (Haswell)
fps
100%
HD Graphics 405 (Braswell):
15.3 fps
90%
HD Graphics (Haswell):
13.7 [X] MSI CX61 2QC 2970M MS-16GD Intel Celeron 2970M 2.2GHz
HD Graphics (Haswell)
min:
5 fps, max:
75 fps
fps
100%
HD Graphics 405 (Braswell):
8.9 fps
100%
HD Graphics (Haswell):
8.9 [X] MSI CX61 2QC 2970M MS-16GD Intel Celeron 2970M 2.2GHz
HD Graphics (Haswell)
min:
4 fps, max:
65 fps
fps
HD Graphics (Haswell):
11.7 [X] MSI CX61 2QC 2970M MS-16GD Intel Celeron 2970M 2.2GHz
HD Graphics (Haswell)
min:
10 fps, max:
14 fps
fps
HD Graphics (Haswell):
0 (!) [X] MSI CX61 2QC 2970M MS-16GD Intel Celeron 2970M 2.2GHz
HD Graphics (Haswell)
fps
100%
HD Graphics 405 (Braswell):
10.8 fps
100%
HD Graphics 405 (Braswell):
6.9 fps
100%
HD Graphics 405 (Braswell):
15 21.8 ~ 18 fps
230%
HD Graphics (Haswell):
41.4 [X] MSI CX61 2QC 2970M MS-16GD Intel Celeron 2970M 2.2GHz
HD Graphics (Haswell)
min:
21 fps, max:
51 fps
fps
100%
HD Graphics 405 (Braswell):
16.2 fps
149%
HD Graphics (Haswell):
24.1 [X] MSI CX61 2QC 2970M MS-16GD Intel Celeron 2970M 2.2GHz
HD Graphics (Haswell)
min:
11 fps, max:
35 fps
fps
HD Graphics (Haswell):
11.4 [X] MSI CX61 2QC 2970M MS-16GD Intel Celeron 2970M 2.2GHz
HD Graphics (Haswell)
min:
5 fps, max:
18 fps
fps
100%
HD Graphics 405 (Braswell):
18.8 fps
100%
HD Graphics 405 (Braswell):
13 fps
100%
HD Graphics 405 (Braswell):
22.1 35.2 ~ 29 fps
100%
HD Graphics 405 (Braswell):
13.7 22.8 ~ 18 fps
HD Graphics (Haswell):
8.9 [X] MSI CX61 2QC 2970M MS-16GD Intel Celeron 2970M 2.2GHz
HD Graphics (Haswell)
min:
5 fps, max:
12 fps
fps
HD Graphics (Haswell):
5.2 [X] MSI CX61 2QC 2970M MS-16GD Intel Celeron 2970M 2.2GHz
HD Graphics (Haswell)
min:
3 fps, max:
8 fps
5.8 ~ 6 fps
HD Graphics (Haswell):
3.1 fps
100%
HD Graphics 405 (Braswell):
41.5 fps
126%
HD Graphics (Haswell):
52.4 fps
100%
HD Graphics 405 (Braswell):
12.5 fps
102%
HD Graphics (Haswell):
12.8 fps
HD Graphics (Haswell):
15.9 fps
HD Graphics (Haswell):
11.2 fps
HD Graphics (Haswell):
7.7 fps
HD Graphics (Haswell):
5.7 fps
HD Graphics (Haswell):
9.7 fps
HD Graphics (Haswell):
8.4 fps
100%
HD Graphics 405 (Braswell):
12.1 fps
90%
HD Graphics (Haswell):
10.9 fps
100%
HD Graphics 405 (Braswell):
7.6 fps
92%
HD Graphics (Haswell):
7 fps
100%
HD Graphics 405 (Braswell):
28 fps
111%
HD Graphics (Haswell):
31 fps
100%
HD Graphics 405 (Braswell):
17 fps
118%
HD Graphics (Haswell):
20 fps
HD Graphics (Haswell):
9 fps
HD Graphics (Haswell):
5.8 fps
100%
HD Graphics 405 (Braswell):
18.9 fps
114%
HD Graphics (Haswell):
21.6 fps
100%
HD Graphics 405 (Braswell):
13.6 fps
95%
HD Graphics (Haswell):
12.9 fps
HD Graphics (Haswell):
13.5 fps
HD Graphics (Haswell):
8.3 fps
HD Graphics (Haswell):
16.4 fps
HD Graphics (Haswell):
11.3 fps
100%
HD Graphics 405 (Braswell):
77.5 fps
159%
HD Graphics (Haswell):
123.6 fps
100%
HD Graphics 405 (Braswell):
19.6 fps
134%
HD Graphics (Haswell):
26.2 fps
100%
HD Graphics 405 (Braswell):
14 fps
95%
HD Graphics (Haswell):
13.3 fps
100%
HD Graphics 405 (Braswell):
9.1 fps
107%
HD Graphics (Haswell):
9.7 fps
100%
HD Graphics 405 (Braswell):
50.5 fps
115%
HD Graphics (Haswell):
58.2 fps
100%
HD Graphics 405 (Braswell):
15 fps
131%
HD Graphics (Haswell):
19.6 fps
HD Graphics (Haswell):
2.2 fps
HD Graphics (Haswell):
19.9 fps
HD Graphics (Haswell):
14 fps
HD Graphics (Ivy Bridge):
34.5 fps
HD Graphics (Haswell):
35.2 fps
HD Graphics (Ivy Bridge):
14.3 fps
HD Graphics (Haswell):
13.6 fps
HD Graphics (Ivy Bridge):
8.6 fps
HD Graphics (Haswell):
9 fps
HD Graphics (Haswell):
23.1 fps
HD Graphics (Haswell):
13.7 fps
100%
HD Graphics 405 (Braswell):
6 fps
98%
HD Graphics (Ivy Bridge):
5.9 fps
168%
HD Graphics (Haswell):
10.1 fps
HD Graphics (Ivy Bridge):
3.6 fps
HD Graphics (Haswell):
5.7 fps
HD Graphics (Ivy Bridge):
15 fps
HD Graphics (Haswell):
22.1 fps
HD Graphics (Ivy Bridge):
7.6 fps
HD Graphics (Haswell):
13 fps
HD Graphics (Haswell):
11.1 fps
100%
HD Graphics 405 (Braswell):
16.5 fps
121%
HD Graphics (Haswell):
12.8 27.8 [X] MSI CX61 2QC 2970M MS-16GD Intel Celeron 2970M 2.2GHz
HD Graphics (Haswell)
~ 20 fps
100%
HD Graphics 405 (Braswell):
12.5 fps
112%
HD Graphics (Haswell):
10 18.2 [X] MSI CX61 2QC 2970M MS-16GD Intel Celeron 2970M 2.2GHz
HD Graphics (Haswell)
~ 14 fps
100%
HD Graphics 405 (Braswell):
8.3 fps
142%
HD Graphics (Haswell):
11.8 [X] MSI CX61 2QC 2970M MS-16GD Intel Celeron 2970M 2.2GHz
HD Graphics (Haswell)
fps
HD Graphics (Haswell):
3.9 [X] MSI CX61 2QC 2970M MS-16GD Intel Celeron 2970M 2.2GHz
HD Graphics (Haswell)
fps
HD Graphics (Haswell):
21 fps
HD Graphics (Haswell):
12 fps
HD Graphics (Ivy Bridge):
20 fps
HD Graphics (Haswell):
27 fps
HD Graphics (Ivy Bridge):
14 fps
HD Graphics (Haswell):
18 fps
HD Graphics (Haswell):
14 fps
HD Graphics (Ivy Bridge):
54.4 fps
HD Graphics (Haswell):
57.7 fps
HD Graphics (Ivy Bridge):
32 fps
HD Graphics (Haswell):
37 fps
HD Graphics (Haswell):
22.4 fps
HD Graphics (Haswell):
16.9 fps
HD Graphics (Haswell):
14 fps
HD Graphics (Haswell):
7.8 fps
HD Graphics (Haswell):
15.9 fps
HD Graphics (Haswell):
8.9 fps
HD Graphics (Haswell):
14.2 fps
HD Graphics (Haswell):
11.5 fps
HD Graphics (Ivy Bridge):
18.4 30.5 ~ 24 fps
HD Graphics (Haswell):
36.9 fps
HD Graphics (Ivy Bridge):
8.2 24.5 ~ 16 fps
HD Graphics (Haswell):
24.2 fps
HD Graphics (Haswell):
7.2 fps
HD Graphics (Ivy Bridge):
27.5 fps
HD Graphics (Haswell):
38 38.5 ~ 38 fps
HD Graphics (Ivy Bridge):
12.8 fps
HD Graphics (Haswell):
18.6 19.6 ~ 19 fps
HD Graphics (Ivy Bridge):
12.5 fps
HD Graphics (Haswell):
13.2 fps
HD Graphics (Ivy Bridge):
10.5 fps
HD Graphics (Haswell):
11.2 fps
HD Graphics (Ivy Bridge):
8.1 fps
HD Graphics (Ivy Bridge):
4.4 fps
85%
HD Graphics (Ivy Bridge):
16 16.4 19.1 ~ 17 fps
140%
HD Graphics (Haswell):
23 32.8 [X] MSI CX61 2QC 2970M MS-16GD Intel Celeron 2970M 2.2GHz
HD Graphics (Haswell)
~ 28 fps
82%
HD Graphics (Ivy Bridge):
8.6 8.9 9 ~ 9 fps
109%
HD Graphics (Haswell):
10.3 14.2 [X] MSI CX61 2QC 2970M MS-16GD Intel Celeron 2970M 2.2GHz
HD Graphics (Haswell)
~ 12 fps
100%
HD Graphics 405 (Braswell):
9.2 10 ~ 10 fps
77%
HD Graphics (Ivy Bridge):
7.7 fps
119%
HD Graphics (Haswell):
11.9 [X] MSI CX61 2QC 2970M MS-16GD Intel Celeron 2970M 2.2GHz
HD Graphics (Haswell)
fps
HD Graphics (Haswell):
3.7 [X] MSI CX61 2QC 2970M MS-16GD Intel Celeron 2970M 2.2GHz
HD Graphics (Haswell)
fps
HD Graphics (Ivy Bridge):
80.8 112 ~ 96 fps
HD Graphics (Haswell):
96.5 fps
HD Graphics (Ivy Bridge):
19.3 24 ~ 22 fps
HD Graphics (Haswell):
28.3 fps
HD Graphics (Ivy Bridge):
10.8 15 ~ 13 fps
HD Graphics (Haswell):
15 fps
HD Graphics (Ivy Bridge):
4 fps
HD Graphics (Haswell):
59.6 fps
HD Graphics (Haswell):
11.2 fps
100%
HD Graphics 405 (Braswell):
27.8 fps
100%
HD Graphics 405 (Braswell):
12.8 fps
100%
HD Graphics 405 (Braswell):
9.5 fps
74%
HD Graphics (Ivy Bridge):
5.1 7.4 7.6 8 ~ 7 fps
HD Graphics (Haswell):
12.2 fps
HD Graphics (Haswell):
7.6 fps
100%
HD Graphics 405 (Braswell):
43.2 fps
97%
HD Graphics (Ivy Bridge):
42 fps
90%
HD Graphics (Haswell):
38.7 fps
100%
HD Graphics 405 (Braswell):
19.6 fps
87%
HD Graphics (Ivy Bridge):
17 fps
90%
HD Graphics (Haswell):
17.7 fps
100%
HD Graphics 405 (Braswell):
14.3 fps
84%
HD Graphics (Ivy Bridge):
12 fps
92%
HD Graphics (Haswell):
13.1 fps
HD Graphics (Ivy Bridge):
6 fps
HD Graphics (Haswell):
18.7 fps
HD Graphics (Haswell):
11.4 fps
HD Graphics (Ivy Bridge):
13 fps
HD Graphics (Haswell):
12.3 fps
HD Graphics (Ivy Bridge):
11 fps
HD Graphics (Haswell):
9.9 fps
HD Graphics (Ivy Bridge):
4 fps
HD Graphics (Haswell):
25.6 fps
HD Graphics (Haswell):
17.6 fps
HD Graphics (Ivy Bridge):
18 19 ~ 19 fps
HD Graphics (Haswell):
22.3 fps
HD Graphics (Ivy Bridge):
14 15.2 ~ 15 fps
HD Graphics (Haswell):
16.8 fps
HD Graphics (Ivy Bridge):
13 fps
HD Graphics (Ivy Bridge):
20 25 ~ 23 fps
HD Graphics (Ivy Bridge):
18 20 ~ 19 fps
HD Graphics (Ivy Bridge):
16 16 ~ 16 fps
HD Graphics (Ivy Bridge):
12 fps
HD Graphics (Ivy Bridge):
30 fps
HD Graphics (Ivy Bridge):
8 fps
HD Graphics (Ivy Bridge):
5 fps
100%
HD Graphics 405 (Braswell):
42.6 fps
108%
HD Graphics (Haswell):
46.2 fps
100%
HD Graphics 405 (Braswell):
32 fps
116%
HD Graphics (Ivy Bridge):
37 fps
108%
HD Graphics (Haswell):
34.7 fps
100%
HD Graphics 405 (Braswell):
20.4 fps
98%
HD Graphics (Ivy Bridge):
20 fps
110%
HD Graphics (Haswell):
22.5 fps
HD Graphics (Ivy Bridge):
11 fps
HD Graphics (Ivy Bridge):
33.3 38 ~ 36 fps
HD Graphics (Haswell):
31 fps
HD Graphics (Ivy Bridge):
13.2 13.5 ~ 13 fps
HD Graphics (Haswell):
18.8 fps
HD Graphics (Haswell):
11.7 fps
100%
HD Graphics 405 (Braswell):
32 fps
91%
HD Graphics (Ivy Bridge):
29.2 fps
115%
HD Graphics (Haswell):
36.9 fps
100%
HD Graphics 405 (Braswell):
19.1 fps
92%
HD Graphics (Ivy Bridge):
17.5 fps
120%
HD Graphics (Haswell):
23 fps
100%
HD Graphics 405 (Braswell):
14.4 fps
101%
HD Graphics (Ivy Bridge):
14.6 fps
135%
HD Graphics (Haswell):
19.5 fps
HD Graphics (Haswell):
12.5 fps
HD Graphics (Haswell):
36 fps
HD Graphics (Haswell):
16 fps
HD Graphics (Haswell):
9.8 fps
100%
HD Graphics 405 (Braswell):
21.8 fps
101%
HD Graphics (Haswell):
21.7 22.2 ~ 22 fps
100%
HD Graphics 405 (Braswell):
10.4 fps
87%
HD Graphics (Ivy Bridge):
7.3 9.4 9.6 ~ 9 fps
106%
HD Graphics (Haswell):
11.2 11.3 ~ 11 fps
100%
HD Graphics 405 (Braswell):
6.5 fps
70%
HD Graphics (Ivy Bridge):
4.6 fps
105%
HD Graphics (Haswell):
6.8 fps
HD Graphics (Ivy Bridge):
55.8 [X] Lenovo B590 (59-362559) Intel Pentium 2020M 2.4GHz
HD Graphics (Ivy Bridge)
fps
HD Graphics (Ivy Bridge):
21.2 [X] Lenovo B590 (59-362559) Intel Pentium 2020M 2.4GHz
HD Graphics (Ivy Bridge)
fps
100%
HD Graphics 405 (Braswell):
35.4 fps
72%
HD Graphics (Ivy Bridge):
25.4 fps
104%
HD Graphics (Haswell):
36.8 fps
100%
HD Graphics 405 (Braswell):
14.7 fps
78%
HD Graphics (Ivy Bridge):
11.4 fps
114%
HD Graphics (Haswell):
16.7 fps
HD Graphics (Ivy Bridge):
41.4 fps
HD Graphics (Haswell):
51.9 fps
HD Graphics (Ivy Bridge):
16.5 fps
HD Graphics (Haswell):
27.4 fps
HD Graphics (Haswell):
14.8 fps
HD Graphics (Haswell):
49.2 fps
HD Graphics (Haswell):
28 fps
HD Graphics (Haswell):
21.2 fps
HD Graphics (Haswell):
42.6 fps
HD Graphics (Haswell):
17.8 fps
HD Graphics (Ivy Bridge):
90 fps
HD Graphics (Haswell):
113 fps
HD Graphics (Ivy Bridge):
20.7 fps
HD Graphics (Haswell):
45.1 fps
HD Graphics (Ivy Bridge):
78.3 fps
HD Graphics (Haswell):
93.7 fps
HD Graphics (Ivy Bridge):
28.3 fps
HD Graphics (Haswell):
39.2 fps
Average Gaming Intel HD Graphics 405 (Braswell) → 100% Average Gaming 30-70 fps → 100%
Average Gaming Intel HD Graphics (Ivy Bridge) → 86% Average Gaming 30-70 fps → 106%
Average Gaming Intel HD Graphics (Haswell) → 124% Average Gaming 30-70 fps → 152%
v1.26
log 24. 05:55:03
#0 checking url part for id 7348 +0s ... 0s
#1 checking url part for id 3563 +0s ... 0s
#2 checking url part for id 4622 +0s ... 0s
#3 not redirecting to Ajax server +0s ... 0s
#4 did not recreate cache, as it is less than 5 days old! Created at Mon, 22 Apr 2024 05:40:21 +0200 +0.001s ... 0.001s
#5 composed specs +0.153s ... 0.154s
#6 did output specs +0s ... 0.155s
#7 start showIntegratedCPUs +0s ... 0.155s
#8 getting avg benchmarks for device 7348 +0.079s ... 0.233s
#9 got single benchmarks 7348 +0.029s ... 0.262s
#10 getting avg benchmarks for device 3563 +0.014s ... 0.276s
#11 got single benchmarks 3563 +0.046s ... 0.322s
#12 getting avg benchmarks for device 4622 +0.015s ... 0.337s
#13 got single benchmarks 4622 +0.045s ... 0.381s
#14 got avg benchmarks for devices +0s ... 0.381s
#15 No cached benchmark found, getting uncached values +0.271s ... 0.652s
#16 min, max, avg, median took s +0.082s ... 0.735s
#17 before gaming benchmark output +0s ... 0.735s
#18 Got 406 rows for game benchmarks. +0.049s ... 0.783s
#19 composed SQL query for gamebenchmarks +0s ... 0.783s
#20 got data and put it in $dataArray +0.073s ... 0.856s
#21 benchmarks composed for output. +0.226s ... 1.082s
#22 calculated avg scores. +0s ... 1.082s
#23 return log +0.003s ... 1.085s
Teilen Sie diesen Artikel, um uns zu unterstützen. Jeder Link hilft!
Autor: Klaus Hinum, 8.09.2017 (Update: 1.07.2023)
 Deutsch
 English
 Español
 Français
 Italiano
 Nederlands
 Polski
 Português
 Русский
 Türkçe
 Svenska
 Chinese
 Magyar