Intel HD Graphics 405 (Braswell) vs Intel HD Graphics (Skylake) vs Intel HD Graphics 2500
Intel HD Graphics 405 (Braswell) ► remove from comparison
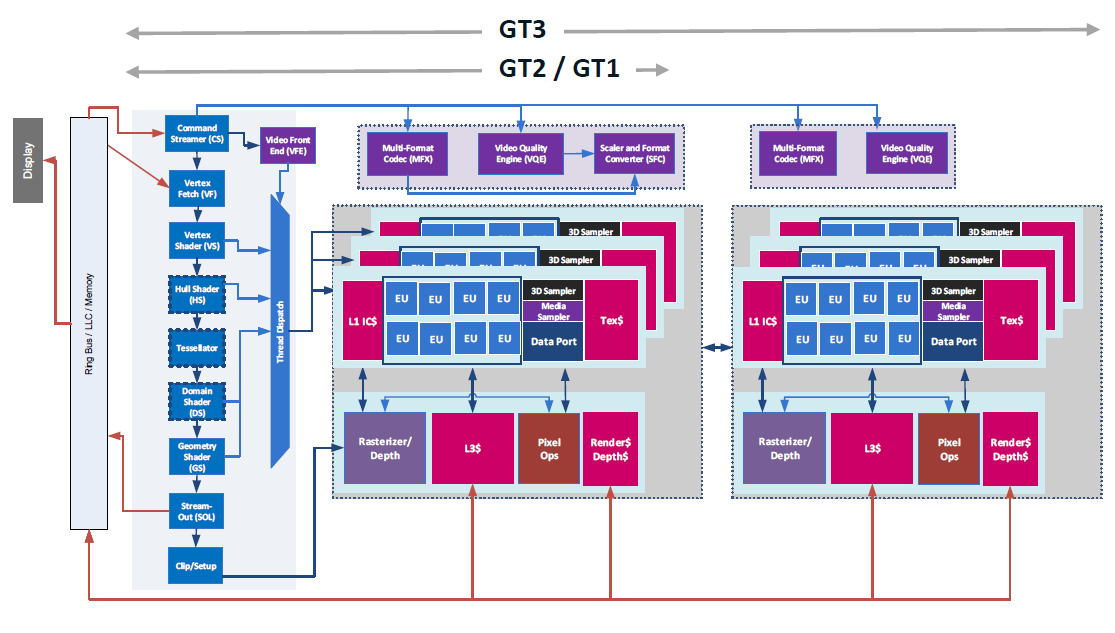
Die Intel HD Graphics 405 ist eine in den Low-End-SoCs der Braswell-Serie (z.B. Pentium N3710 ) integrierte Grafikeinheit. Sie basiert auf der gleichen Architektur wie die GPU verschiedener Broadwell-Prozessoren (z.B. HD Graphics 5300 ), bietet allerdings deutlich weniger Shadereinheiten und geringere Taktraten. Die genauen Spezifikationen hängen vom jeweiligen SoC ab: Die schnellste Variante mit 16 EUs und maximal 700 MHz schlägt die ältere HD Graphics (Bay Trail) um etwa Faktor zwei. Vor 2016 war die Grafikkarte nur unter Intel HD Graphics (Braswell) bekannt und beinhaltete 12 und 16-Kern-Modelle.
Anwender müssen sich deshalb insbesondere bei den Celeron-Modellen, die zusätzlich durch die Beschneidung auf nur zwei CPU-Kerne ausgebremst werden, auf ältere und anspruchslose Spiele beschränken. Videos werden dagegen auch in 4K/H.265 flüssig wiedergeben.
Weitere Benchmarks sind daher auch auf unserer Seite der Intel HD Graphics (Braswell) zu finden.
Intel HD Graphics (Skylake) ► remove from comparison
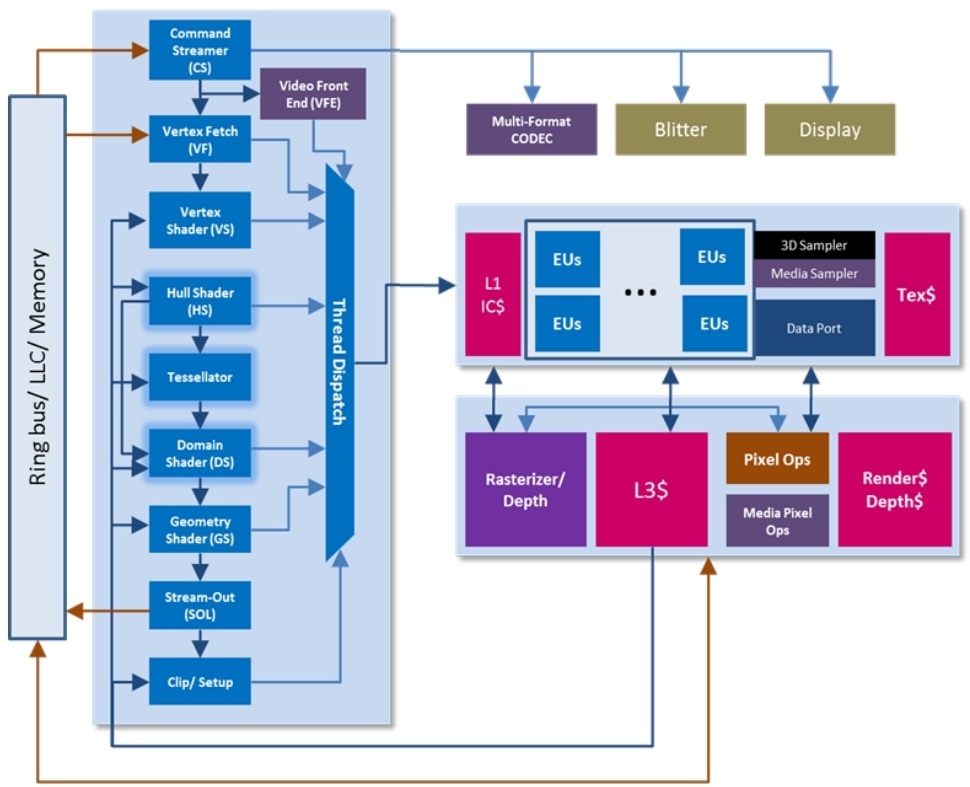
Die Intel HD Graphics (Skylake) (GT1) ist eine Prozessorgrafikkarte der im September 2015 vorgestellten Skylake-Generation. Für die meisten CPU wurden die Namen Intel HD Graphics 510 und Intel HD Graphics 515 genutzt.
Zwar glänzt die GPU mit einer extrem niedrigen Leistungsaufnahme, allerdings siedelt sich die Performance nur im untersten Low-End-Segment an und ist für neuere Spiele kaum ausreichend. Als sogenannte GT1-Ausbaustufe der Skylake-GPU verfügt die HD Graphics über 12 Execution Units (EUs), die je nach Modell mit bis zu 800 MHz takten.
Mangels eigenem Grafikspeicher oder eDRAM-Cache greift die HD Graphics (Skylake) über das Interface des Prozessors auf den System-RAM zu (2x 64 Bit DDR3L-1600/LPDDR3-1866).
Performance
Die exakte Leistung der HD Graphics hängt stark vom jeweiligen Endgerät und dessen TDP-Einstellung ab. Zum anderen bestimmt auch der eingesetzte Speicher die Performance.
Im Optimalfall dürfte die GPU in etwa mit der älteren HD Graphics 4200 konkurrieren und kann aktuelle Spiele (Stand 2015) nur in wenigen Ausnahmefällen flüssig darstellen.
Features
Der überarbeitete Videodecoder decodiert nun auch H.265-/HEVC-Videos vollständig in Hardware und arbeitet dadurch deutlich effizienter als bislang. Die Bildausgabe erfolgt über DP 1.2/eDP 1.3 (max. 3.840 x 2.160 @ 60 Hz), wohingegen HDMI nur in der älteren Version 1.4a angeboten wird. Ein HDMI-2.0-Anschluss kann aber mittels Konverter von DisplayPort ergänzt werden. Maximal lassen sich drei Displays parallel angesteuern.
Leistungsaufnahme
Die TDP des gesamten Chips liegt standardmäßig bei 6 Watt, sodass viele Ultrabooks oder 2-in-1-Geräte mit einer rein passiven Kühlung auskommen. Teils kann die TDP auch auf 4,5 Watt abgesenkt werden, wodurch allerdings die Performance sinkt.
Intel HD Graphics 2500 ► remove from comparison
Die Intel HD Graphics 2500 (oder Ivy Bridge GT1) ist eine in den Ivy Bridge Prozessoren integrierte Grafikkarte. Sie kommt ausschließlich in Desktop CPUs zum Einsatz. Das mobile Pendant nennt sich schlicht Intel HD Graphics . Im Vergleich zur stärkeren Intel HD Graphics 4000 ist die HD 2500 deutlich abgespeckt und bietet weniger Execution Units (6 EUs) und Texture Sampler (nur einer). Daher ist die Performance deutlich geringer und nur etwas oberhalb der alten Intel HD Graphics 2000 . Je nach Prozessor weist die HD Graphics 2500 eine unterschiedliche Basis- und Turbo-Taktrate auf.
Da die Leistung nur zwischen der HD Graphics 2000 und 3000 liegt (siehe Benchmarks), reicht die HD Graphics 2500 nur für ältere und anspruchslose Spiele aus. Im Konkurrenzvergleich entspricht die Performance etwa den integrierten Einstiegslösungen von AMD, zum Beispiel der Radeon HD 8210 .
Eine Besonderheit der Ivy Bride Grafikkerne ist, das nur 4x MSAA von der Hardware unterstützt wird. 2x MSAA wird per Software berechnet und geht durch die 4x MSAA Pipeline. Daher empfiehlt sich der Einsatz des gleich schnellen 4x MSAA.
Auch der integrierte Videodecoder genannt Multi Format Codec Engine (MFX) wurde kräftig überarbeitet und soll nun sogar mehrere 4K Videos parallel dekodieren können (ev. nur in den High-End Modellen). DXVA Checker gibt weiterhin die Formate MPEG2, VC1, WMV9 und H264 als unterstütz an. QuickSync zum schnellen Transkodieren von Videos wurde ebenfalls verbessert und soll nun schneller bei gleichzeitig höherer Qualität laufen.
Ebenfalls neu ist die Unterstützung für drei unabhängige Bildschirme . Bis Sandy Bridge waren nur zwei möglich und lediglich die AMD Grafikkarten mit Eyefinity Support bieten mehr als zwei Anschlüsse für Notebooks (jedoch nur mit DisplayPorts).
Aufgrund der Integration in den mit 22nm gefertigten Prozessor und die halbierte Shaderzahl ist der Stromverbrauch relativ gering.
Intel HD Graphics 405 (Braswell) Intel HD Graphics (Skylake) Intel HD Graphics 2500 HD Graphics Serie Codename Braswell Skylake GT1 Ivy Bridge GT1 Architektur Gen. 8 Gen. 9 Skylake Gen. 7 Ivy Bridge Pipelines 16 - unified 12 - unified 6 - unified Kerntakt 320 - 700 (Boost) MHz 300 - 800 (Boost) MHz 650 - 1150 (Boost) MHz Speicherbandbreite 64/128 Bit 64/128 Bit 64/128 Bit Shared Memory ja ja ja API DirectX 11.2, Shader 5.0 DirectX 12_1, OpenGL 4.4 DirectX 11.0, Shader 5.0 Herstellungsprozess 14 nm 14 nm 22 nm Erscheinungsdatum 01.04.2016 01.09.2015 01.04.2012 Speichertyp DDR3L/LPDDR3 Features QuickSync Notebookgröße groß (17" z.B.)
Benchmarks Performance Rating - 3DMark 11 + Fire Strike + Time Spy - HD Graphics 405 (Braswell)
0.1 pt (0%)
Intel HD Graphics 405 (Braswell)
...
max:
Performance Rating - 3DMark 11 + Fire Strike + Time Spy - HD Graphics 2500
0.1 pt (0%)
...
...
max:
3DMark - 3DMark Ice Storm Unlimited Graphics
min: 19812 avg: 23763 median: 23763 (3%) max: 27714 Points
3DMark - 3DMark Ice Storm Extreme Graphics
min: 12601 avg: 14069 median: 14068.5 (2%) max: 15536 Points
3DMark - 3DMark Cloud Gate Score
min: 1743 avg: 2000 median: 1933 (2%) max: 2392 Points
min: 1906 avg: 2659 median: 2817 (3%) max: 3095 Points
3DMark - 3DMark Cloud Gate Graphics
min: 1767 avg: 2206 median: 2113 (1%) max: 2831 Points
min: 2301 avg: 2584 median: 2604.5 (1%) max: 2825 Points
3DMark - 3DMark Fire Strike Standard Score
min: 216 avg: 237.5 median: 237.5 (0%) max: 259 Points
min: 257 avg: 293.3 median: 294.5 (1%) max: 327 Points
3DMark - 3DMark Fire Strike Standard Graphics
min: 231 avg: 254.5 median: 254.5 (0%) max: 278 Points
min: 289 avg: 319.5 median: 318 (0%) max: 353 Points
3DMark - 3DMark Ice Storm Graphics
min: 26056 avg: 28119 median: 28119 (3%) max: 30182 Points
min: 21978 avg: 23693 median: 24058 (3%) max: 24676 Points
3DMark 11 - 3DM11 Performance Score
min: 451 avg: 523 median: 537 (1%) max: 565 Points
min: 374 avg: 419 median: 430 (1%) max: 449 Points
3DMark 11 - 3DM11 Performance GPU
min: 408 avg: 469.1 median: 473 (0%) max: 496 Points
min: 321 avg: 349 median: 350.5 (0%) max: 374 Points
3DMark Vantage + Intel HD Graphics 405 (Braswell) 3DMark Vantage - 3DM Vant. Perf. total
2081 Points (1%)
3DM Vant. Perf. total + Intel HD Graphics 2500
min: 1375 avg: 1849 median: 1930.5 (1%) max: 2068 Points
3DM Vant. Perf. GPU no PhysX + Intel HD Graphics 405 (Braswell) 3DMark Vantage - 3DM Vant. Perf. GPU no PhysX
1730 Points (1%)
3DM Vant. Perf. GPU no PhysX + Intel HD Graphics 2500
min: 1115 avg: 1369 median: 1400.5 (1%) max: 1561 Points
3DMark 2001SE - 3DMark 2001 - Standard
20814 Points (22%)
Modell CPU GPU RAM Wert Intel Core i5-3470, Intel DZ77GA-70K Desktop, DDR3-1600 3470 HD Graphics 2500 1100 MHz8 GB 20814
3DMark 03 - 3DMark 03 - Standard
10138 Points (5%)
Modell CPU GPU RAM Wert Intel Core i5-3470, Intel DZ77GA-70K Desktop, DDR3-1600 3470 HD Graphics 2500 1100 MHz8 GB 10138
3DMark 05 - 3DMark 05 - Standard
min: 6341 avg: 6627 median: 6627 (7%) max: 6913 Points
Modell CPU GPU RAM Wert Intel Core i3-3220, Intel DZ77GA-70K Desktop, DDR3-1600 3220 HD Graphics 2500 1050 MHz8 GB 6341 Intel Core i5-3470, Intel DZ77GA-70K Desktop, DDR3-1600 3470 HD Graphics 2500 1100 MHz8 GB 6913
3DMark 06 3DMark 06 - Standard 1280x1024 + Intel HD Graphics 405 (Braswell)
min: 2274 avg: 2920 median: 2920 (4%) max: 3566 Points
3DMark 06 - Standard 1280x1024 + Intel HD Graphics 2500
min: 3300 avg: 3933 median: 3816 (5%) max: 4442 Points
Unigine Heaven 2.1 - Heaven 2.1 high
7.4 fps (1%)
SPECviewperf 11 + Intel HD Graphics 2500 SPECviewperf 11 - specvp11 snx-01
1.6 fps (1%)
Modell CPU GPU RAM Wert Intel Core i5-3470, Intel DZ77GA-70K Desktop, DDR3-1600 3470 HD Graphics 2500 1100 MHz8 GB 1.61
specvp11 tcvis-02 + Intel HD Graphics 2500 SPECviewperf 11 - specvp11 tcvis-02
2.7 fps (2%)
Modell CPU GPU RAM Wert Intel Core i5-3470, Intel DZ77GA-70K Desktop, DDR3-1600 3470 HD Graphics 2500 1100 MHz8 GB 2.66
specvp11 sw-02 + Intel HD Graphics 2500 SPECviewperf 11 - specvp11 sw-02
6.8 fps (5%)
Modell CPU GPU RAM Wert Intel Core i5-3470, Intel DZ77GA-70K Desktop, DDR3-1600 3470 HD Graphics 2500 1100 MHz8 GB 6.76
specvp11 proe-05 + Intel HD Graphics 2500 SPECviewperf 11 - specvp11 proe-05
1.9 fps (2%)
Modell CPU GPU RAM Wert Intel Core i5-3470, Intel DZ77GA-70K Desktop, DDR3-1600 3470 HD Graphics 2500 1100 MHz8 GB 1.86
specvp11 maya-03 + Intel HD Graphics 2500 SPECviewperf 11 - specvp11 maya-03
12.9 fps (10%)
Modell CPU GPU RAM Wert Intel Core i5-3470, Intel DZ77GA-70K Desktop, DDR3-1600 3470 HD Graphics 2500 1100 MHz8 GB 12.91
specvp11 lightwave-01 + Intel HD Graphics 2500 SPECviewperf 11 - specvp11 lightwave-01
15.6 fps (17%)
Modell CPU GPU RAM Wert Intel Core i5-3470, Intel DZ77GA-70K Desktop, DDR3-1600 3470 HD Graphics 2500 1100 MHz8 GB 15.59
specvp11 ensight-04 + Intel HD Graphics 2500 SPECviewperf 11 - specvp11 ensight-04
2.4 fps (1%)
Modell CPU GPU RAM Wert Intel Core i5-3470, Intel DZ77GA-70K Desktop, DDR3-1600 3470 HD Graphics 2500 1100 MHz8 GB 2.4
specvp11 catia-03 + Intel HD Graphics 2500 SPECviewperf 11 - specvp11 catia-03
0 fps (0%)
Modell CPU GPU RAM Wert Intel Core i5-3470, Intel DZ77GA-70K Desktop, DDR3-1600 3470 HD Graphics 2500 1100 MHz8 GB 0
Cinebench R10 Cinebench R10 Shading (32bit) + Intel HD Graphics 405 (Braswell) Cinebench R10 - Cinebench R10 Shading (32bit)
min: 2412 avg: 2685 median: 2753 (2%) max: 2822 Points
Cinebench R10 Shading (32bit) + Intel HD Graphics 2500
min: 3409 avg: 5543 median: 6037 (4%) max: 6687 Points
Cinebench R11.5 Cinebench R11.5 OpenGL 64 Bit + Intel HD Graphics 405 (Braswell) Cinebench R11.5 - Cinebench R11.5 OpenGL 64 Bit
min: 10.24 avg: 11.7 median: 11.7 (4%) max: 13.06 fps
Cinebench R11.5 OpenGL 64 Bit + Intel HD Graphics 2500
min: 9.09 avg: 10.6 median: 10.8 (4%) max: 11.98 fps
Cinebench R15 + Intel HD Graphics 405 (Braswell) Cinebench R15 - Cinebench R15 OpenGL 64 Bit
min: 10.3 avg: 13.8 median: 14.1 (1%) max: 15.74 fps
Cinebench R15 OpenGL Ref. Match 64 Bit + Intel HD Graphics 405 (Braswell) Cinebench R15 - Cinebench R15 OpenGL Ref. Match 64 Bit
min: 9 avg: 83.2 median: 98 (98%) max: 98 %
GFXBench - GFXBench Car Chase Offscreen
9.9 fps (1%)
GFXBench 3.1 - GFXBench Manhattan ES 3.1 Offscreen
20.3 fps (0%)
GFXBench 3.0 - GFXBench 3.0 Manhattan Offscreen
20.3 fps (1%)
GFXBench (DX / GLBenchmark) 2.7 + Intel HD Graphics 405 (Braswell) GFXBench (DX / GLBenchmark) 2.7 - GFXBench T-Rex HD Offscreen C24Z16
41.3 fps (0%)
LuxMark v2.0 64Bit - LuxMark v2.0 Room GPU
min: 56 avg: 68 median: 68 (0%) max: 80 Samples/s
min: 30 avg: 31 median: 31 (0%) max: 32 Samples/s
LuxMark v2.0 64Bit - LuxMark v2.0 Sala GPU
min: 81 avg: 102.5 median: 102.5 (0%) max: 124 Samples/s
min: 47 avg: 50 median: 50 (0%) max: 53 Samples/s
ComputeMark v2.1 - ComputeMark v2.1 Result
min: 388 avg: 390.5 median: 390.5 (0%) max: 393 Points
min: 282 avg: 287.3 median: 286 (0%) max: 294 Points
Power Consumption - Furmark Stress Test Power Consumption - external Monitor *
9.8 Watt (1%)
Average Benchmarks Intel HD Graphics 405 (Braswell) → 0% n= Average Benchmarks Intel HD Graphics 2500 → 0% n=
- Bereich der Benchmarkergebnisse für diese Grafikkarte
- Durchschnittliche Benchmarkergebnisse für diese Grafikkarte
* Smaller numbers mean a higher performance
1 This benchmark is not used for the average calculation
Spiele-Benchmarks Die folgenden Benchmarks basieren auf unseren Spieletests mit Testnotebooks. Die Performance dieser Grafikkarte bei den gelisteten Spielen ist abhängig von der verwendeten CPU, Speicherausstattung, Treiber und auch Betriebssystem. Dadurch müssen die untenstehenden Werte nicht repräsentativ sein. Detaillierte Informationen über das verwendete System sehen Sie nach einem Klick auf den fps-Wert.
100%
HD Graphics 405 (Braswell):
17.8 fps
100%
HD Graphics 405 (Braswell):
18 fps
100%
HD Graphics 405 (Braswell):
9.9 fps
100%
HD Graphics 405 (Braswell):
23.6 fps
100%
HD Graphics 405 (Braswell):
18 fps
100%
HD Graphics 405 (Braswell):
13.9 fps
HD Graphics 405 (Braswell):
0 (!) [X] Teclast Tbook 16 Power Intel Atom x7-Z8750 1.6GHz
HD Graphics 405 (Braswell)
fps
100%
HD Graphics 405 (Braswell):
37 fps
100%
HD Graphics 405 (Braswell):
24 fps
100%
HD Graphics 405 (Braswell):
25 fps
100%
HD Graphics 405 (Braswell):
30 fps
100%
HD Graphics 405 (Braswell):
37 fps
100%
HD Graphics 405 (Braswell):
19.6 fps
100%
HD Graphics 405 (Braswell):
18.7 fps
100%
HD Graphics 405 (Braswell):
13.5 fps
100%
HD Graphics 405 (Braswell):
11 fps
100%
HD Graphics 405 (Braswell):
14.4 fps
100%
HD Graphics 405 (Braswell):
10.5 fps
100%
HD Graphics 405 (Braswell):
17.6 31.3 ~ 24 fps
100%
HD Graphics 405 (Braswell):
21.3 fps
100%
HD Graphics 405 (Braswell):
12.2 fps
100%
HD Graphics 405 (Braswell):
5.2 fps
100%
HD Graphics 405 (Braswell):
10.5 fps
100%
HD Graphics 405 (Braswell):
6.1 fps
100%
HD Graphics 405 (Braswell):
7.1 fps
100%
HD Graphics 405 (Braswell):
4.2 fps
100%
HD Graphics 405 (Braswell):
15.3 fps
100%
HD Graphics 405 (Braswell):
8.9 fps
100%
HD Graphics 405 (Braswell):
10.8 fps
100%
HD Graphics 405 (Braswell):
6.9 fps
100%
HD Graphics 405 (Braswell):
15 21.8 ~ 18 fps
100%
HD Graphics 405 (Braswell):
16.2 fps
100%
HD Graphics 405 (Braswell):
18.8 fps
100%
HD Graphics 405 (Braswell):
13 fps
100%
HD Graphics 405 (Braswell):
22.1 35.2 ~ 29 fps
100%
HD Graphics 405 (Braswell):
13.7 22.8 ~ 18 fps
100%
HD Graphics 405 (Braswell):
41.5 fps
100%
HD Graphics 405 (Braswell):
12.5 fps
100%
HD Graphics 405 (Braswell):
12.1 fps
100%
HD Graphics 405 (Braswell):
7.6 fps
100%
HD Graphics 405 (Braswell):
28 fps
100%
HD Graphics 405 (Braswell):
17 fps
100%
HD Graphics 405 (Braswell):
18.9 fps
100%
HD Graphics 405 (Braswell):
13.6 fps
100%
HD Graphics 405 (Braswell):
77.5 fps
100%
HD Graphics 405 (Braswell):
19.6 fps
100%
HD Graphics 405 (Braswell):
14 fps
100%
HD Graphics 405 (Braswell):
9.1 fps
100%
HD Graphics 405 (Braswell):
50.5 fps
100%
HD Graphics 405 (Braswell):
15 fps
100%
HD Graphics 405 (Braswell):
6 fps
100%
HD Graphics 405 (Braswell):
16.5 fps
100%
HD Graphics 405 (Braswell):
12.5 fps
100%
HD Graphics 405 (Braswell):
8.3 fps
HD Graphics 2500:
11.1 fps
88%
HD Graphics 2500:
17.7 fps
73%
HD Graphics 2500:
8 fps
100%
HD Graphics 405 (Braswell):
9.2 10 ~ 10 fps
70%
HD Graphics 2500:
7 fps
HD Graphics 2500:
145 [X] Intel Core i5-3550, Intel DZ77GA-70K Desktop, DDR3-1600 Intel Core i5-3550 3.3GHz
HD Graphics 2500
fps
HD Graphics 2500:
26 [X] Intel Core i5-3550, Intel DZ77GA-70K Desktop, DDR3-1600 Intel Core i5-3550 3.3GHz
HD Graphics 2500
fps
HD Graphics 2500:
13.7 [X] Intel Core i5-3550, Intel DZ77GA-70K Desktop, DDR3-1600 Intel Core i5-3550 3.3GHz
HD Graphics 2500
fps
HD Graphics 2500:
4.3 [X] Intel Core i5-3550, Intel DZ77GA-70K Desktop, DDR3-1600 Intel Core i5-3550 3.3GHz
HD Graphics 2500
fps
HD Graphics 2500:
14.8 [X] Intel Core i5-3550, Intel DZ77GA-70K Desktop, DDR3-1600 Intel Core i5-3550 3.3GHz
HD Graphics 2500
fps
HD Graphics 2500:
8 [X] Intel Core i5-3550, Intel DZ77GA-70K Desktop, DDR3-1600 Intel Core i5-3550 3.3GHz
HD Graphics 2500
fps
100%
HD Graphics 405 (Braswell):
27.8 fps
72%
HD Graphics 2500:
20.1 fps
100%
HD Graphics 405 (Braswell):
12.8 fps
85%
HD Graphics 2500:
10.9 fps
100%
HD Graphics 405 (Braswell):
9.5 fps
75%
HD Graphics 2500:
7.1 fps
HD Graphics 2500:
13.8 [X] Intel Core i5-3550, Intel DZ77GA-70K Desktop, DDR3-1600 Intel Core i5-3550 3.3GHz
HD Graphics 2500
fps
100%
HD Graphics 405 (Braswell):
43.2 fps
104%
HD Graphics 2500:
43 [X] Intel Core i3-3220, Intel DZ77GA-70K Desktop, DDR3-1600 Intel Core i3-3220 3.3GHz
HD Graphics 2500
46.2 [X] Intel Core i5-3470, Intel DZ77GA-70K Desktop, DDR3-1600 Intel Core i5-3470 3.2GHz
HD Graphics 2500
~ 45 fps
100%
HD Graphics 405 (Braswell):
19.6 fps
96%
HD Graphics 2500:
18.8 [X] Intel Core i5-3470, Intel DZ77GA-70K Desktop, DDR3-1600 Intel Core i5-3470 3.2GHz
HD Graphics 2500
fps
100%
HD Graphics 405 (Braswell):
14.3 fps
94%
HD Graphics 2500:
13.5 [X] Intel Core i5-3470, Intel DZ77GA-70K Desktop, DDR3-1600 Intel Core i5-3470 3.2GHz
HD Graphics 2500
fps
HD Graphics 2500:
7.3 [X] Intel Core i5-3470, Intel DZ77GA-70K Desktop, DDR3-1600 Intel Core i5-3470 3.2GHz
HD Graphics 2500
fps
HD Graphics 2500:
18 [X] Intel Core i3-3220, Intel DZ77GA-70K Desktop, DDR3-1600 Intel Core i3-3220 3.3GHz
HD Graphics 2500
20.5 [X] Intel Core i5-3470, Intel DZ77GA-70K Desktop, DDR3-1600 Intel Core i5-3470 3.2GHz
HD Graphics 2500
~ 19 fps
HD Graphics 2500:
11.9 [X] Intel Core i5-3470, Intel DZ77GA-70K Desktop, DDR3-1600 Intel Core i5-3470 3.2GHz
HD Graphics 2500
fps
HD Graphics 2500:
13.8 [X] Intel Core i5-3470, Intel DZ77GA-70K Desktop, DDR3-1600 Intel Core i5-3470 3.2GHz
HD Graphics 2500
fps
HD Graphics 2500:
18.4 [X] Intel Core i3-3220, Intel DZ77GA-70K Desktop, DDR3-1600 Intel Core i3-3220 3.3GHz
HD Graphics 2500
20.1 [X] Intel Core i5-3470, Intel DZ77GA-70K Desktop, DDR3-1600 Intel Core i5-3470 3.2GHz
HD Graphics 2500
min:
15.6 fps, max:
28.3 fps
~ 19 fps
HD Graphics 2500:
10.7 [X] Intel Core i3-3220, Intel DZ77GA-70K Desktop, DDR3-1600 Intel Core i3-3220 3.3GHz
HD Graphics 2500
11.6 [X] Intel Core i5-3470, Intel DZ77GA-70K Desktop, DDR3-1600 Intel Core i5-3470 3.2GHz
HD Graphics 2500
~ 11 fps
HD Graphics 2500:
3.8 [X] Intel Core i5-3470, Intel DZ77GA-70K Desktop, DDR3-1600 Intel Core i5-3470 3.2GHz
HD Graphics 2500
fps
HD Graphics 2500:
1.9 [X] Intel Core i5-3470, Intel DZ77GA-70K Desktop, DDR3-1600 Intel Core i5-3470 3.2GHz
HD Graphics 2500
fps
HD Graphics 2500:
18 [X] Intel Core i3-3220, Intel DZ77GA-70K Desktop, DDR3-1600 Intel Core i3-3220 3.3GHz
HD Graphics 2500
fps
HD Graphics 2500:
29.7 99 [X] Intel Core i3-3220, Intel DZ77GA-70K Desktop, DDR3-1600 Intel Core i3-3220 3.3GHz
HD Graphics 2500
101 [X] Intel Core i5-3470, Intel DZ77GA-70K Desktop, DDR3-1600 Intel Core i5-3470 3.2GHz
HD Graphics 2500
~ 77 fps
HD Graphics 2500:
23.6 51 [X] Intel Core i3-3220, Intel DZ77GA-70K Desktop, DDR3-1600 Intel Core i3-3220 3.3GHz
HD Graphics 2500
52 [X] Intel Core i5-3470, Intel DZ77GA-70K Desktop, DDR3-1600 Intel Core i5-3470 3.2GHz
HD Graphics 2500
60 [X] Intel Core i5-3550, Intel DZ77GA-70K Desktop, DDR3-1600 Intel Core i5-3550 3.3GHz
HD Graphics 2500
~ 47 fps
HD Graphics 2500:
17.2 28 [X] Intel Core i3-3220, Intel DZ77GA-70K Desktop, DDR3-1600 Intel Core i3-3220 3.3GHz
HD Graphics 2500
31.2 [X] Intel Core i5-3470, Intel DZ77GA-70K Desktop, DDR3-1600 Intel Core i5-3470 3.2GHz
HD Graphics 2500
32 [X] Intel Core i5-3550, Intel DZ77GA-70K Desktop, DDR3-1600 Intel Core i5-3550 3.3GHz
HD Graphics 2500
~ 27 fps
HD Graphics 2500:
14.5 [X] Intel Core i5-3470, Intel DZ77GA-70K Desktop, DDR3-1600 Intel Core i5-3470 3.2GHz
HD Graphics 2500
fps
HD Graphics 2500:
37 [X] Intel Core i3-3220, Intel DZ77GA-70K Desktop, DDR3-1600 Intel Core i3-3220 3.3GHz
HD Graphics 2500
min:
27 fps
40 [X] Intel Core i5-3470, Intel DZ77GA-70K Desktop, DDR3-1600 Intel Core i5-3470 3.2GHz
HD Graphics 2500
~ 39 fps
HD Graphics 2500:
21 [X] Intel Core i3-3220, Intel DZ77GA-70K Desktop, DDR3-1600 Intel Core i3-3220 3.3GHz
HD Graphics 2500
26 [X] Intel Core i5-3470, Intel DZ77GA-70K Desktop, DDR3-1600 Intel Core i5-3470 3.2GHz
HD Graphics 2500
~ 24 fps
HD Graphics 2500:
21 [X] Intel Core i3-3220, Intel DZ77GA-70K Desktop, DDR3-1600 Intel Core i3-3220 3.3GHz
HD Graphics 2500
22 [X] Intel Core i5-3470, Intel DZ77GA-70K Desktop, DDR3-1600 Intel Core i5-3470 3.2GHz
HD Graphics 2500
~ 22 fps
HD Graphics 2500:
12 [X] Intel Core i5-3470, Intel DZ77GA-70K Desktop, DDR3-1600 Intel Core i5-3470 3.2GHz
HD Graphics 2500
12 [X] Intel Core i3-3220, Intel DZ77GA-70K Desktop, DDR3-1600 Intel Core i3-3220 3.3GHz
HD Graphics 2500
~ 12 fps
HD Graphics 2500:
37 [X] Intel Core i3-3220, Intel DZ77GA-70K Desktop, DDR3-1600 Intel Core i3-3220 3.3GHz
HD Graphics 2500
fps
HD Graphics 2500:
8 [X] Intel Core i3-3220, Intel DZ77GA-70K Desktop, DDR3-1600 Intel Core i3-3220 3.3GHz
HD Graphics 2500
fps
100%
HD Graphics 405 (Braswell):
42.6 fps
188%
HD Graphics 2500:
77 [X] Intel Core i3-3220, Intel DZ77GA-70K Desktop, DDR3-1600 Intel Core i3-3220 3.3GHz
HD Graphics 2500
82 [X] Intel Core i5-3470, Intel DZ77GA-70K Desktop, DDR3-1600 Intel Core i5-3470 3.2GHz
HD Graphics 2500
~ 80 fps
100%
HD Graphics 405 (Braswell):
32 fps
119%
HD Graphics 2500:
36 [X] Intel Core i3-3220, Intel DZ77GA-70K Desktop, DDR3-1600 Intel Core i3-3220 3.3GHz
HD Graphics 2500
39 [X] Intel Core i5-3470, Intel DZ77GA-70K Desktop, DDR3-1600 Intel Core i5-3470 3.2GHz
HD Graphics 2500
~ 38 fps
100%
HD Graphics 405 (Braswell):
20.4 fps
93%
HD Graphics 2500:
18 [X] Intel Core i3-3220, Intel DZ77GA-70K Desktop, DDR3-1600 Intel Core i3-3220 3.3GHz
HD Graphics 2500
20.6 [X] Intel Core i5-3470, Intel DZ77GA-70K Desktop, DDR3-1600 Intel Core i5-3470 3.2GHz
HD Graphics 2500
~ 19 fps
HD Graphics 2500:
11.7 [X] Intel Core i5-3470, Intel DZ77GA-70K Desktop, DDR3-1600 Intel Core i5-3470 3.2GHz
HD Graphics 2500
fps
HD Graphics 2500:
21.7 [X] Intel Core i5-3470, Intel DZ77GA-70K Desktop, DDR3-1600 Intel Core i5-3470 3.2GHz
HD Graphics 2500
fps
HD Graphics 2500:
15.5 [X] Intel Core i5-3470, Intel DZ77GA-70K Desktop, DDR3-1600 Intel Core i5-3470 3.2GHz
HD Graphics 2500
fps
100%
HD Graphics 405 (Braswell):
32 fps
100%
HD Graphics 405 (Braswell):
19.1 fps
100%
HD Graphics 405 (Braswell):
14.4 fps
HD Graphics 2500:
23.2 fps
100%
HD Graphics 405 (Braswell):
21.8 fps
100%
HD Graphics 405 (Braswell):
10.4 fps
100%
HD Graphics 405 (Braswell):
6.5 fps
HD Graphics 2500:
16.8 [X] Intel Core i5-3470, Intel DZ77GA-70K Desktop, DDR3-1600 Intel Core i5-3470 3.2GHz
HD Graphics 2500
fps
HD Graphics 2500:
11 [X] Intel Core i5-3470, Intel DZ77GA-70K Desktop, DDR3-1600 Intel Core i5-3470 3.2GHz
HD Graphics 2500
fps
100%
HD Graphics 405 (Braswell):
35.4 fps
100%
HD Graphics 405 (Braswell):
14.7 fps
HD Graphics 2500:
46 [X] Intel Core i5-3470, Intel DZ77GA-70K Desktop, DDR3-1600 Intel Core i5-3470 3.2GHz
HD Graphics 2500
fps
HD Graphics 2500:
22.2 [X] Intel Core i5-3470, Intel DZ77GA-70K Desktop, DDR3-1600 Intel Core i5-3470 3.2GHz
HD Graphics 2500
fps
HD Graphics 2500:
18.7 [X] Intel Core i5-3470, Intel DZ77GA-70K Desktop, DDR3-1600 Intel Core i5-3470 3.2GHz
HD Graphics 2500
fps
HD Graphics 2500:
7.6 [X] Intel Core i5-3470, Intel DZ77GA-70K Desktop, DDR3-1600 Intel Core i5-3470 3.2GHz
HD Graphics 2500
fps
HD Graphics 2500:
48.8 [X] Intel Core i3-3220, Intel DZ77GA-70K Desktop, DDR3-1600 Intel Core i3-3220 3.3GHz
HD Graphics 2500
52.8 [X] Intel Core i5-3470, Intel DZ77GA-70K Desktop, DDR3-1600 Intel Core i5-3470 3.2GHz
HD Graphics 2500
~ 51 fps
HD Graphics 2500:
20.2 [X] Intel Core i3-3220, Intel DZ77GA-70K Desktop, DDR3-1600 Intel Core i3-3220 3.3GHz
HD Graphics 2500
21.6 [X] Intel Core i5-3470, Intel DZ77GA-70K Desktop, DDR3-1600 Intel Core i5-3470 3.2GHz
HD Graphics 2500
~ 21 fps
HD Graphics 2500:
12 [X] Intel Core i5-3470, Intel DZ77GA-70K Desktop, DDR3-1600 Intel Core i5-3470 3.2GHz
HD Graphics 2500
fps
HD Graphics 2500:
3 [X] Intel Core i5-3470, Intel DZ77GA-70K Desktop, DDR3-1600 Intel Core i5-3470 3.2GHz
HD Graphics 2500
fps
HD Graphics 2500:
104 [X] Intel Core i3-3220, Intel DZ77GA-70K Desktop, DDR3-1600 Intel Core i3-3220 3.3GHz
HD Graphics 2500
fps
HD Graphics 2500:
29 [X] Intel Core i3-3220, Intel DZ77GA-70K Desktop, DDR3-1600 Intel Core i3-3220 3.3GHz
HD Graphics 2500
fps
Average Gaming Intel HD Graphics 405 (Braswell) → 100% Average Gaming 30-70 fps → 100%
Average Gaming Intel HD Graphics 2500 → 96% Average Gaming 30-70 fps → 111%
v1.26
log 19. 05:27:11
#0 checking url part for id 7348 +0s ... 0s
#1 checking url part for id 6474 +0s ... 0s
#2 checking url part for id 2887 +0s ... 0s
#3 not redirecting to Ajax server +0s ... 0s
#4 did not recreate cache, as it is less than 5 days old! Created at Tue, 16 Apr 2024 05:39:00 +0200 +0.001s ... 0.001s
#5 composed specs +0.196s ... 0.197s
#6 did output specs +0s ... 0.197s
#7 start showIntegratedCPUs +0s ... 0.197s
#8 getting avg benchmarks for device 7348 +0.082s ... 0.279s
#9 got single benchmarks 7348 +0.033s ... 0.312s
#10 getting avg benchmarks for device 6474 +0.002s ... 0.314s
#11 got single benchmarks 6474 +0s ... 0.314s
#12 getting avg benchmarks for device 2887 +0.017s ... 0.332s
#13 got single benchmarks 2887 +0.023s ... 0.354s
#14 got avg benchmarks for devices +0s ... 0.354s
#15 No cached benchmark found, getting uncached values +0.275s ... 0.629s
#16 min, max, avg, median took s +0.054s ... 0.683s
#17 before gaming benchmark output +0s ... 0.683s
#18 Got 164 rows for game benchmarks. +0.014s ... 0.697s
#19 composed SQL query for gamebenchmarks +0s ... 0.697s
#20 got data and put it in $dataArray +0.043s ... 0.74s
#21 benchmarks composed for output. +0.134s ... 0.874s
#22 calculated avg scores. +0s ... 0.874s
#23 return log +0.003s ... 0.877s
Teilen Sie diesen Artikel, um uns zu unterstützen. Jeder Link hilft!
Autor: Klaus Hinum, 8.09.2017 (Update: 1.07.2023)
 Deutsch
 English
 Español
 Français
 Italiano
 Nederlands
 Polski
 Português
 Русский
 Türkçe
 Svenska
 Chinese
 Magyar