Intel HD Graphics 500 vs Intel HD Graphics 505 vs Intel HD Graphics 510
Intel HD Graphics 500 ► remove from comparison
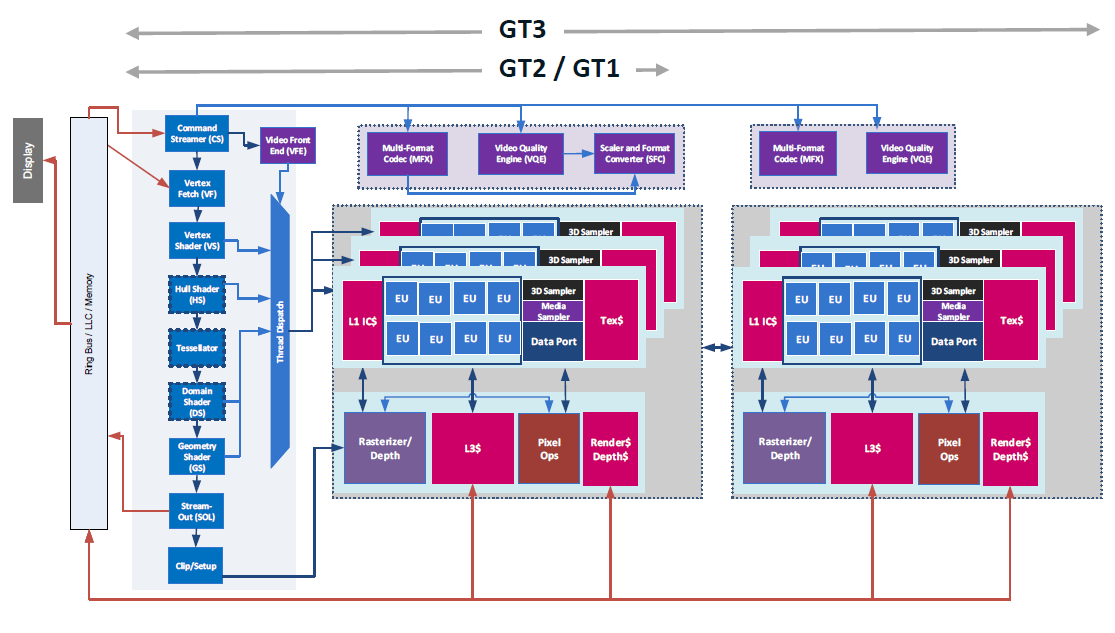
Die Intel HD Graphics 500 ist eine Prozessorgrafikkarte der Mitte 2016 vorgestellten Apollo-Lake-Generation (z.B. Celeron N3450 und Celeron N3350 ). Zwar glänzt die GPU mit einer sehr niedrigen Leistungsaufnahme, allerdings siedelt sich die Performance nur im untersten Low-End-Segment an und ist für neuere Spiele zumeist nicht ausreichend. Als teildeaktivierte Variante der Apollo-Lake-GPU verfügt die HD Graphics 500 nur über 12 Execution Units (HD Graphics 505: 18 EUs), die je nach Modell mit bis zu 650 oder 700 MHz takten. Technisch basiert die GPU auf der Intel-Gen9-Architektur, die auch bei der teureren Skylake-Serie zum Einsatz kommt.
Mangels eigenem Grafikspeicher oder eDRAM-Cache greift die HD Graphics 500 über das Interface des Prozessors auf den System-RAM zu (2x 64 Bit DDR3L-/LPDDR3-1866, LPDDR4-2400).
Performance
Die HD Graphics 500 dürfte sich noch knapp unterhalb der älteren Broadwell-Grafikeinheit HD Graphics (Broadwell) ansiedeln, sodass aktuelle Spiele (Stand 2016) nur in den seltensten Fällen und in sehr niedrigen Einstellungen flüssig dargestellt werden.
Features
Der überarbeitete Videodecoder decodiert nun auch H.265-/HEVC-Videos vollständig in Hardware und arbeitet dadurch deutlich effizienter als bislang. Die Bildausgabe auf bis zu drei Displays erfolgt über DP/eDP oder HDMI (4K vermutlich nur bei 30 Hz via HDMI 1.4).
Leistungsaufnahme
Die TDP des gesamten SoCs liegt bei standardmäßig bei 6 Watt, sodass die GPU vor allem in (oftmals passiv gekühlten) Netbooks oder schlanken Notebooks zu finden ist. Optional kann die TDP auch auf 4 Watt abgesenkt werden, wodurch allerdings die Performance sinkt.
Intel HD Graphics 505 ► remove from comparison
Die Intel HD Graphics 505 ist eine Prozessorgrafikkarte der Mitte 2016 vorgestellten Apollo-Lake-Generation (z.B. Pentium N4200 ). Zwar glänzt die GPU mit einer sehr niedrigen Leistungsaufnahme, allerdings siedelt sich die Performance nur im Low-End-Segment an und ist für neuere Spiele selten ausreichend. Als maximale Ausbaustufe der Apollo-Lake-GPU verfügt die HD Graphics 505 über 18 Execution Units (EUs), die mit bis zu 750 MHz takten. Technisch basiert die GPU auf der Intel-Gen9-Architektur, die auch bei der teureren Skylake-Serie zum Einsatz kommt.
Mangels eigenem Grafikspeicher oder eDRAM-Cache greift die HD Graphics 505 über das Interface des Prozessors auf den System-RAM zu (2x 64 Bit DDR3L-/LPDDR3-1866, LPDDR4-2400).
Performance
Die theoretische Grafikleistung entspricht in etwa der älteren Core-M-Grafikeinheit HD Graphics 5300 . Dadurch sind nur wenige anspruchslose Spiele flüssig spielbar (siehe weiter unten). In unseren Tests erreichte z.B. nur wenige Spiele wie Dirt Rally oder Sims 4 spielbare Frameraten in niedrigsten Detailstufe.
Features
Der überarbeitete Videodecoder decodiert nun auch H.265-/HEVC-Videos vollständig in Hardware und arbeitet dadurch deutlich effizienter als bislang. Die Bildausgabe auf bis zu drei Displays erfolgt über DP/eDP oder HDMI (4K vermutlich nur bei 30 Hz via HDMI 1.4).
Leistungsaufnahme
Die TDP des gesamten Chips liegt beim Pentium N4200 standardmäßig bei 6 Watt, sodass die GPU vor allem in (oftmals passiv gekühlten) Netbooks oder schlanken Notebooks zu finden ist. Optional kann die TDP auch auf 4 Watt abgesenkt werden, wodurch allerdings die Performance sinkt.
Intel HD Graphics 510 ► remove from comparison
Die Intel HD Graphics 510 (GT1) ist eine Prozessorgrafikkarte der im September 2015 vorgestellten Skylake-Generation (z.B. Pentium 4405U ). Zwar glänzt die GPU mit einer niedrigen Leistungsaufnahme, allerdings siedelt sich die Performance nur im Low-End-Segment an und ist für neuere Spiele selten ausreichend. Als sogenannte GT1-Ausbaustufe der Skylake-GPU verfügt die HD Graphics 510 über 12 Execution Units (EUs), die je nach Modell mit bis zu 950 MHz takten.
Mangels eigenem Grafikspeicher oder eDRAM-Cache greift die HD Graphics 510 über das Interface des Prozessors auf den System-RAM zu (2x 64 Bit DDR3L-1600/LPDDR3-1866).
Performance
Die exakte Leistung der HD Graphics 510 dürfte sich knapp unterhalb der älteren HD Graphics 4400 ansiedeln, sodass aktuelle Spiele (Stand 2015) nur in wenigen Fällen und in niedrigsten Einstellungen flüssig dargestellt werden.
Features
Der überarbeitete Videodecoder decodiert nun auch H.265-/HEVC-Videos vollständig in Hardware und arbeitet dadurch deutlich effizienter als bislang. Die Bildausgabe erfolgt über DP 1.2/eDP 1.3 (max. 3.840 x 2.160 @ 60 Hz), wohingegen HDMI nur in der älteren Version 1.4a angeboten wird. Ein HDMI-2.0-Anschluss kann aber mittels Konverter von DisplayPort ergänzt werden. Maximal lassen sich drei Displays parallel angesteuern.
Leistungsaufnahme
Die TDP des gesamten Chips liegt standardmäßig bei 15 Watt, sodass die GPU vor allem in Ultrabooks oder oder schlanken Notebooks zu finden ist. Teils kann die TDP auch auf 10 Watt abgesenkt werden, wodurch allerdings die Performance sinkt.
Intel HD Graphics 500 Intel HD Graphics 505 Intel HD Graphics 510 Gen. 9 Serie Codename Apollo Lake Apollo Lake Skylake GT1 Architektur Gen. 9 Apollo Lake Gen. 9 Apollo Lake Gen. 9 Skylake Pipelines 12 - unified 18 - unified 12 - unified Kerntakt 300 - 700 (Boost) MHz 300 - 750 (Boost) MHz 300 - 950 (Boost) MHz Speicherbandbreite 64/128 Bit 64/128 Bit 64/128 Bit Shared Memory ja ja ja API DirectX 12_1, OpenGL 4.4 DirectX 12_1, OpenGL 4.4 DirectX 12_1, OpenGL 4.4 Herstellungsprozess 14 nm 14 nm 14 nm Features QuickSync QuickSync QuickSync Erscheinungsdatum 01.09.2016 01.09.2016 01.09.2015 Speichertyp DDR3/DDR4
Benchmarks Performance Rating - 3DMark 11 + Fire Strike + Time Spy - HD Graphics 500
0.2 pt (0%)
...
...
max:
Performance Rating - 3DMark 11 + Fire Strike + Time Spy - HD Graphics 505
0.2 pt (1%)
...
...
max:
Performance Rating - 3DMark 11 + Fire Strike + Time Spy - HD Graphics 510
0.3 pt (1%)
...
...
max:
3DMark - 3DMark Time Spy Score
min: 87 avg: 115.8 median: 107.5 (0%) max: 161 Points
3DMark - 3DMark Time Spy Graphics
min: 76 avg: 101.5 median: 94 (0%) max: 142 Points
3DMark - 3DMark Ice Storm Unlimited Graphics
min: 19294 avg: 24491 median: 24609 (3%) max: 29579 Points
min: 27199 avg: 32979 median: 32480.5 (4%) max: 41454 Points
43274 Points (5%)
3DMark - 3DMark Ice Storm Extreme Graphics
min: 12299 avg: 15195 median: 15085 (2%) max: 18200 Points
min: 8531 avg: 19014 median: 18860 (2%) max: 28843 Points
26846 Points (3%)
3DMark - 3DMark Cloud Gate Score
min: 1932 avg: 2140 median: 2116 (2%) max: 2306 Points
min: 2411 avg: 2877 median: 2837.5 (3%) max: 3558 Points
4721 Points (5%)
3DMark - 3DMark Cloud Gate Graphics
min: 2578 avg: 3030 median: 3007 (1%) max: 3693 Points
min: 2844 avg: 3609 median: 3413.5 (1%) max: 4738 Points
5664 Points (1%)
3DMark - 3DMark Fire Strike Standard Score
min: 271 avg: 321.5 median: 307 (1%) max: 401 Points
min: 324 avg: 417.3 median: 383 (1%) max: 565 Points
570 Points (1%)
3DMark - 3DMark Fire Strike Standard Graphics
min: 293 avg: 355.9 median: 362.5 (0%) max: 444 Points
min: 344 avg: 448.6 median: 408 (0%) max: 606 Points
621 Points (1%)
3DMark - 3DMark Ice Storm Graphics
min: 20140 avg: 26074 median: 23761 (3%) max: 34320 Points
min: 26964 avg: 33899 median: 36228 (4%) max: 39766 Points
62653 Points (8%)
3DMark 11 - 3DM11 Performance Score
min: 414 avg: 533 median: 530 (1%) max: 655 Points
min: 476 avg: 692 median: 679 (1%) max: 899 Points
985 Points (1%)
3DMark 11 - 3DM11 Performance GPU
min: 368 avg: 478.6 median: 482 (0%) max: 584 Points
min: 424 avg: 632 median: 620 (1%) max: 825 Points
847 Points (1%)
3DMark Vantage + Intel HD Graphics 505 3DMark Vantage - 3DM Vant. Perf. total
min: 1957 avg: 2351 median: 2350.5 (1%) max: 2744 Points
3DM Vant. Perf. total + Intel HD Graphics 510
3798 Points (1%)
3DM Vant. Perf. GPU no PhysX + Intel HD Graphics 505 3DMark Vantage - 3DM Vant. Perf. GPU no PhysX
min: 1656 avg: 2073 median: 2072.5 (1%) max: 2489 Points
3DM Vant. Perf. GPU no PhysX + Intel HD Graphics 510
3125 Points (2%)
3DMark 06 3DMark 06 - Standard 1280x1024 + Intel HD Graphics 500
min: 3393 avg: 3551 median: 3506 (5%) max: 3753 Points
3DMark 06 - Standard 1280x1024 + Intel HD Graphics 505
min: 3721 avg: 4303 median: 4302.5 (6%) max: 4884 Points
3DMark 06 - Standard 1280x1024 + Intel HD Graphics 510
7253 Points (10%)
Modell CPU GPU RAM Wert 3DMark 06 - Standard 1280x1024 Asus Vivobook F556UQ-XO626D (3DMark 06 - Standard 1280x1024) 6198DU HD Graphics 510 100 MHz8 GB 7253
Unigine Heaven 3.0 - Unigine Heaven 3.0 DX 11
9.3 fps (3%)
Unigine Heaven 3.0 - Unigine Heaven 3.0 OpenGL
10.8 fps (5%)
Unigine Heaven 2.1 - Heaven 2.1 high
8.9 fps (2%)
13.5 fps (3%)
SPECviewperf 11 + Intel HD Graphics 505 SPECviewperf 11 - specvp11 snx-01
0.9 fps (1%)
specvp11 tcvis-02 + Intel HD Graphics 505 SPECviewperf 11 - specvp11 tcvis-02
1.2 fps (1%)
specvp11 sw-02 + Intel HD Graphics 505 SPECviewperf 11 - specvp11 sw-02
6.6 fps (5%)
specvp11 proe-05 + Intel HD Graphics 505 SPECviewperf 11 - specvp11 proe-05
0.8 fps (1%)
specvp11 maya-03 + Intel HD Graphics 505 SPECviewperf 11 - specvp11 maya-03
5.6 fps (4%)
specvp11 lightwave-01 + Intel HD Graphics 505 SPECviewperf 11 - specvp11 lightwave-01
8.7 fps (9%)
specvp11 ensight-04 + Intel HD Graphics 505 SPECviewperf 11 - specvp11 ensight-04
1.3 fps (1%)
Cinebench R10 Cinebench R10 Shading (32bit) + Intel HD Graphics 500 Cinebench R10 - Cinebench R10 Shading (32bit)
min: 2791 avg: 2888 median: 2894 (2%) max: 3031 Points
Cinebench R10 Shading (32bit) + Intel HD Graphics 505
min: 32.61 avg: 2776 median: 3155 (2%) max: 3331 Points
Cinebench R10 Shading (32bit) + Intel HD Graphics 510
7348 Points (5%)
Cinebench R11.5 Cinebench R11.5 OpenGL 64 Bit + Intel HD Graphics 500 Cinebench R11.5 - Cinebench R11.5 OpenGL 64 Bit
min: 7.05 avg: 8.2 median: 8.1 (3%) max: 9.61 fps
Cinebench R11.5 OpenGL 64 Bit + Intel HD Graphics 505
min: 9.78 avg: 12.1 median: 12.5 (4%) max: 13.53 fps
Cinebench R11.5 OpenGL 64 Bit + Intel HD Graphics 510
17.2 fps (6%)
Cinebench R15 + Intel HD Graphics 500 Cinebench R15 - Cinebench R15 OpenGL 64 Bit
min: 10.15 avg: 12.9 median: 13 (1%) max: 15.74 fps
Cinebench R15 OpenGL 64 Bit + Intel HD Graphics 505
min: 11.3 avg: 16.1 median: 16.6 (1%) max: 19.87 fps
Cinebench R15 OpenGL 64 Bit + Intel HD Graphics 510
28 fps (2%)
Cinebench R15 OpenGL Ref. Match 64 Bit + Intel HD Graphics 500 Cinebench R15 - Cinebench R15 OpenGL Ref. Match 64 Bit
min: 97.7 avg: 97.8 median: 97.8 (98%) max: 98 %
Cinebench R15 OpenGL Ref. Match 64 Bit + Intel HD Graphics 505
min: 97.7 avg: 97.8 median: 97.8 (98%) max: 97.8 %
GFXBench - GFXBench 5.0 Aztec Ruins High Tier Offscreen
3.6 fps (1%)
4.8 fps (1%)
GFXBench - GFXBench 5.0 Aztec Ruins Normal Tier Offscreen
9.7 fps (1%)
12 fps (1%)
GFXBench - GFXBench Car Chase Offscreen
8.4 fps (1%)
min: 10 avg: 10.2 median: 10.2 (1%) max: 10.3 fps
35.9 fps (4%)
GFXBench 3.1 - GFXBench Manhattan ES 3.1 Offscreen
15 fps (0%)
14.1 fps (0%)
51.7 fps (1%)
GFXBench 3.0 - GFXBench 3.0 Manhattan Offscreen
20 fps (1%)
18.9 fps (1%)
64.6 fps (4%)
GFXBench (DX / GLBenchmark) 2.7 + Intel HD Graphics 500 GFXBench (DX / GLBenchmark) 2.7 - GFXBench T-Rex HD Offscreen C24Z16
42 fps (0%)
GFXBench T-Rex HD Offscreen C24Z16 + Intel HD Graphics 505 47.2 fps (0%)
GFXBench T-Rex HD Offscreen C24Z16 + Intel HD Graphics 510
121.9 fps (1%)
Basemark GPU 1.2 - Basemark GPU 1.2 Vulkan Official Medium Offscreen 1080
16.3 fps (0%)
LuxMark v2.0 64Bit - LuxMark v2.0 Room GPU
49 Samples/s (0%)
min: 62 avg: 87 median: 87 (0%) max: 112 Samples/s
167 Samples/s (1%)
LuxMark v2.0 64Bit - LuxMark v2.0 Sala GPU
79 Samples/s (0%)
min: 93 avg: 141.5 median: 141.5 (0%) max: 190 Samples/s
302 Samples/s (1%)
ComputeMark v2.1 - ComputeMark v2.1 Result
min: 296 avg: 320 median: 324 (0%) max: 336 Points
382 Points (0%)
500 Points (1%)
Power Consumption - Furmark Stress Test Power Consumption - external Monitor *
8.9 Watt (1%)
19 Watt (3%)
Clock Speed - GPU Clock Speed Furmark
450 MHz (18%)
Average Benchmarks Intel HD Graphics 500 → 100% n=20 Average Benchmarks Intel HD Graphics 505 → 128% n=20 Average Benchmarks Intel HD Graphics 510 → 245% n=20
- Bereich der Benchmarkergebnisse für diese Grafikkarte
- Durchschnittliche Benchmarkergebnisse für diese Grafikkarte
* Smaller numbers mean a higher performance
1 This benchmark is not used for the average calculation
Spiele-Benchmarks Die folgenden Benchmarks basieren auf unseren Spieletests mit Testnotebooks. Die Performance dieser Grafikkarte bei den gelisteten Spielen ist abhängig von der verwendeten CPU, Speicherausstattung, Treiber und auch Betriebssystem. Dadurch müssen die untenstehenden Werte nicht repräsentativ sein. Detaillierte Informationen über das verwendete System sehen Sie nach einem Klick auf den fps-Wert.
100%
HD Graphics 500:
9.1 fps
100%
HD Graphics 500:
23.9 fps
100%
HD Graphics 500:
24 fps
100%
HD Graphics 500:
11.2 fps
100%
HD Graphics 500:
28.2 fps
100%
HD Graphics 500:
20.2 fps
100%
HD Graphics 500:
13.9 fps
100%
HD Graphics 500:
12.6 fps
100%
HD Graphics 500:
2 fps
50%
HD Graphics 505:
1 fps
100%
HD Graphics 500:
3 fps
67%
HD Graphics 505:
2 fps
HD Graphics 500:
0 (!) [X] Jumper EZbook 3 Intel Celeron N3350 1.1GHz
HD Graphics 500
fps
100%
HD Graphics 500:
12 fps
100%
HD Graphics 500:
5.5 fps
100%
HD Graphics 500:
1 fps
300%
HD Graphics 505:
3 fps
100%
HD Graphics 500:
1 fps
100%
HD Graphics 500:
34.4 (!) [X] Jumper EZbook 3 Intel Celeron N3350 1.1GHz
HD Graphics 500
max:
93 fps
fps
100%
HD Graphics 500:
4.6 (!) [X] Jumper EZbook 3 Intel Celeron N3350 1.1GHz
HD Graphics 500
max:
9 fps
fps
92%
HD Graphics 505:
5.5 fps
100%
HD Graphics 500:
3.9 4.7 ~ 4 fps
100%
HD Graphics 500:
3.6 4.3 ~ 4 fps
100%
HD Graphics 500:
10 fps
140%
HD Graphics 505:
28 fps
100%
HD Graphics 500:
17.2 fps
147%
HD Graphics 505:
25.2 fps
100%
HD Graphics 500:
10 fps
147%
HD Graphics 505:
14.7 fps
100%
HD Graphics 500:
5.6 fps
100%
HD Graphics 500:
18.1 fps
100%
HD Graphics 500:
6.2 fps
247%
HD Graphics 505:
15.3 fps
100%
HD Graphics 500:
4.9 fps
110%
HD Graphics 505:
5.4 fps
100%
HD Graphics 500:
8.7 fps
139%
HD Graphics 505:
12.1 fps
HD Graphics 510:
18.3 [X] Asus Vivobook F556UQ-XO626D Intel Core i5-6198DU 2.3GHz
HD Graphics 510
fps
HD Graphics 510:
19.9 [X] Asus Vivobook F556UQ-XO626D Intel Core i5-6198DU 2.3GHz
HD Graphics 510
fps
HD Graphics 510:
15.4 [X] Asus Vivobook F556UQ-XO626D Intel Core i5-6198DU 2.3GHz
HD Graphics 510
fps
HD Graphics 510:
70.6 [X] Asus Vivobook F556UQ-XO626D Intel Core i5-6198DU 2.3GHz
HD Graphics 510
fps
HD Graphics 510:
41.3 [X] Asus Vivobook F556UQ-XO626D Intel Core i5-6198DU 2.3GHz
HD Graphics 510
fps
HD Graphics 510:
24.5 [X] Asus Vivobook F556UQ-XO626D Intel Core i5-6198DU 2.3GHz
HD Graphics 510
fps
HD Graphics 510:
9.4 [X] Asus Vivobook F556UQ-XO626D Intel Core i5-6198DU 2.3GHz
HD Graphics 510
fps
100%
HD Graphics 500:
15.9 fps
45%
HD Graphics 505:
7.1 fps
HD Graphics 510:
13.4 [X] Asus Vivobook F556UQ-XO626D Intel Core i5-6198DU 2.3GHz
HD Graphics 510
fps
HD Graphics 510:
7.7 [X] Asus Vivobook F556UQ-XO626D Intel Core i5-6198DU 2.3GHz
HD Graphics 510
fps
HD Graphics 510:
11.1 [X] Asus Vivobook F556UQ-XO626D Intel Core i5-6198DU 2.3GHz
HD Graphics 510
fps
HD Graphics 510:
7 [X] Asus Vivobook F556UQ-XO626D Intel Core i5-6198DU 2.3GHz
HD Graphics 510
fps
100%
HD Graphics 500:
15.5 fps
97%
HD Graphics 505:
15 fps
161%
HD Graphics 510:
25 [X] Asus Vivobook F556UQ-XO626D Intel Core i5-6198DU 2.3GHz
HD Graphics 510
fps
HD Graphics 510:
15.9 [X] Asus Vivobook F556UQ-XO626D Intel Core i5-6198DU 2.3GHz
HD Graphics 510
fps
HD Graphics 510:
19.9 [X] Asus Vivobook F556UQ-XO626D Intel Core i5-6198DU 2.3GHz
HD Graphics 510
fps
HD Graphics 510:
11 [X] Asus Vivobook F556UQ-XO626D Intel Core i5-6198DU 2.3GHz
HD Graphics 510
fps
100%
HD Graphics 500:
19.1 fps
132%
HD Graphics 505:
25.2 fps
255%
HD Graphics 510:
48.7 [X] Asus Vivobook F556UQ-XO626D Intel Core i5-6198DU 2.3GHz
HD Graphics 510
fps
HD Graphics 510:
29.2 [X] Asus Vivobook F556UQ-XO626D Intel Core i5-6198DU 2.3GHz
HD Graphics 510
fps
100%
HD Graphics 500:
16.4 fps
126%
HD Graphics 505:
20.7 fps
237%
HD Graphics 510:
38.9 [X] Asus Vivobook F556UQ-XO626D Intel Core i5-6198DU 2.3GHz
HD Graphics 510
fps
100%
HD Graphics 500:
9.7 fps
142%
HD Graphics 505:
13.8 fps
260%
HD Graphics 510:
25.2 [X] Asus Vivobook F556UQ-XO626D Intel Core i5-6198DU 2.3GHz
HD Graphics 510
fps
145%
HD Graphics 505:
32 fps
301%
HD Graphics 510:
66.2 [X] Asus Vivobook F556UQ-XO626D Intel Core i5-6198DU 2.3GHz
HD Graphics 510
fps
147%
HD Graphics 505:
22 fps
279%
HD Graphics 510:
41.8 [X] Asus Vivobook F556UQ-XO626D Intel Core i5-6198DU 2.3GHz
HD Graphics 510
fps
100%
HD Graphics 500:
5.6 fps
100%
HD Graphics 500:
5.1 fps
100%
HD Graphics 500:
28.5 fps
128%
HD Graphics 505:
36.5 fps
387%
HD Graphics 510:
110.4 [X] Asus Vivobook F556UQ-XO626D Intel Core i5-6198DU 2.3GHz
HD Graphics 510
fps
100%
HD Graphics 500:
12.5 fps
102%
HD Graphics 505:
12.7 fps
154%
HD Graphics 510:
19.3 [X] Asus Vivobook F556UQ-XO626D Intel Core i5-6198DU 2.3GHz
HD Graphics 510
fps
HD Graphics 510:
30.9 [X] Asus Vivobook F556UQ-XO626D Intel Core i5-6198DU 2.3GHz
HD Graphics 510
fps
HD Graphics 510:
26.8 [X] Asus Vivobook F556UQ-XO626D Intel Core i5-6198DU 2.3GHz
HD Graphics 510
fps
HD Graphics 510:
31.5 [X] Asus Vivobook F556UQ-XO626D Intel Core i5-6198DU 2.3GHz
HD Graphics 510
fps
HD Graphics 510:
22.2 [X] Asus Vivobook F556UQ-XO626D Intel Core i5-6198DU 2.3GHz
HD Graphics 510
fps
100%
HD Graphics 500:
22 fps
127%
HD Graphics 505:
28 fps
327%
HD Graphics 510:
72 [X] Asus Vivobook F556UQ-XO626D Intel Core i5-6198DU 2.3GHz
HD Graphics 510
fps
100%
HD Graphics 500:
16 fps
88%
HD Graphics 505:
14 fps
294%
HD Graphics 510:
47 [X] Asus Vivobook F556UQ-XO626D Intel Core i5-6198DU 2.3GHz
HD Graphics 510
fps
100%
HD Graphics 500:
17.7 fps
70%
HD Graphics 505:
12.4 fps
100%
HD Graphics 500:
71.6 fps
105%
HD Graphics 505:
75.2 fps
243%
HD Graphics 510:
173.7 [X] Asus Vivobook F556UQ-XO626D Intel Core i5-6198DU 2.3GHz
HD Graphics 510
fps
100%
HD Graphics 500:
13.7 fps
134%
HD Graphics 505:
18.4 fps
235%
HD Graphics 510:
32.2 [X] Asus Vivobook F556UQ-XO626D Intel Core i5-6198DU 2.3GHz
HD Graphics 510
fps
100%
HD Graphics 500:
10 fps
142%
HD Graphics 505:
14.2 fps
100%
HD Graphics 500:
6.3 fps
148%
HD Graphics 505:
9.3 fps
100%
HD Graphics 500:
43.8 fps
118%
HD Graphics 505:
51.5 fps
309%
HD Graphics 510:
135.5 [X] Asus Vivobook F556UQ-XO626D Intel Core i5-6198DU 2.3GHz
HD Graphics 510
fps
100%
HD Graphics 500:
19.1 fps
99%
HD Graphics 505:
19 fps
172%
HD Graphics 510:
32.8 [X] Asus Vivobook F556UQ-XO626D Intel Core i5-6198DU 2.3GHz
HD Graphics 510
fps
HD Graphics 505:
6.5 7.8 ~ 7 fps
HD Graphics 505:
4.2 5.1 ~ 5 fps
HD Graphics 510:
33.4 [X] Asus Vivobook F556UQ-XO626D Intel Core i5-6198DU 2.3GHz
HD Graphics 510
fps
HD Graphics 510:
22.5 [X] Asus Vivobook F556UQ-XO626D Intel Core i5-6198DU 2.3GHz
HD Graphics 510
fps
HD Graphics 505:
8.3 9.5 ~ 9 fps
HD Graphics 510:
15.9 [X] Asus Vivobook F556UQ-XO626D Intel Core i5-6198DU 2.3GHz
HD Graphics 510
fps
100%
HD Graphics 500:
29.3 fps
126%
HD Graphics 505:
36.8 fps
100%
HD Graphics 500:
14.4 fps
135%
HD Graphics 505:
19.4 fps
195%
HD Graphics 510:
39 [X] Asus Vivobook F556UQ-XO626D Intel Core i5-6198DU 2.3GHz
HD Graphics 510
fps
201%
HD Graphics 510:
20.1 [X] Asus Vivobook F556UQ-XO626D Intel Core i5-6198DU 2.3GHz
HD Graphics 510
fps
197%
HD Graphics 510:
17.7 [X] Asus Vivobook F556UQ-XO626D Intel Core i5-6198DU 2.3GHz
HD Graphics 510
fps
100%
HD Graphics 500:
2.7 fps
111%
HD Graphics 505:
2.5 3.1 ~ 3 fps
100%
HD Graphics 500:
21.5 fps
172%
HD Graphics 505:
31.2 42.9 [X] Dell Latitude 3189 N002L318911EMEA Intel Pentium N4200 1.1GHz
HD Graphics 505
~ 37 fps
245%
HD Graphics 510:
52.7 [X] Asus Vivobook F556UQ-XO626D Intel Core i5-6198DU 2.3GHz
HD Graphics 510
fps
100%
HD Graphics 500:
9.3 fps
215%
HD Graphics 505:
17.4 21.6 [X] Dell Latitude 3189 N002L318911EMEA Intel Pentium N4200 1.1GHz
HD Graphics 505
~ 20 fps
257%
HD Graphics 510:
23.9 [X] Asus Vivobook F556UQ-XO626D Intel Core i5-6198DU 2.3GHz
HD Graphics 510
fps
HD Graphics 510:
16.2 [X] Asus Vivobook F556UQ-XO626D Intel Core i5-6198DU 2.3GHz
HD Graphics 510
fps
100%
HD Graphics 500:
19.3 fps
179%
HD Graphics 505:
34.6 fps
100%
HD Graphics 500:
9.1 fps
186%
HD Graphics 505:
16.9 fps
100%
HD Graphics 500:
14 16.6 ~ 15 fps
240%
HD Graphics 505:
35 36.7 ~ 36 fps
100%
HD Graphics 500:
14 fps
221%
HD Graphics 505:
30.9 31 ~ 31 fps
100%
HD Graphics 500:
12.7 22 ~ 17 fps
177%
HD Graphics 505:
30.1 fps
100%
HD Graphics 500:
13.6 fps
144%
HD Graphics 505:
19.6 fps
100%
HD Graphics 500:
27.8 fps
112%
HD Graphics 505:
31.1 fps
100%
HD Graphics 500:
12.2 fps
121%
HD Graphics 505:
14.8 fps
100%
HD Graphics 500:
11.2 fps
188%
HD Graphics 505:
21.1 fps
100%
HD Graphics 500:
7.6 fps
153%
HD Graphics 505:
11.6 fps
100%
HD Graphics 500:
22.9 fps
137%
HD Graphics 505:
31.3 fps
100%
HD Graphics 500:
11.1 fps
170%
HD Graphics 505:
18.9 fps
100%
HD Graphics 500:
40.1 fps
118%
HD Graphics 505:
47.2 fps
100%
HD Graphics 500:
14.7 fps
171%
HD Graphics 505:
25.2 fps
100%
HD Graphics 500:
54.5 fps
128%
HD Graphics 505:
69.7 fps
100%
HD Graphics 500:
14.1 fps
113%
HD Graphics 505:
15.9 fps
100%
HD Graphics 500:
119 fps
100%
HD Graphics 500:
27.2 fps
100%
HD Graphics 500:
46 fps
135%
HD Graphics 505:
62.3 fps
Average Gaming Intel HD Graphics 500 → 100% Average Gaming 30-70 fps → 100%
Average Gaming Intel HD Graphics 505 → 139% Average Gaming 30-70 fps → 153%
Average Gaming Intel HD Graphics 510 → 248% Average Gaming 30-70 fps → 246%
v1.26
log 20. 03:18:12
#0 checking url part for id 7543 +0s ... 0s
#1 checking url part for id 7542 +0s ... 0s
#2 checking url part for id 6475 +0s ... 0s
#3 not redirecting to Ajax server +0s ... 0s
#4 did not recreate cache, as it is less than 5 days old! Created at Fri, 19 Apr 2024 05:40:26 +0200 +0.001s ... 0.001s
#5 composed specs +0.174s ... 0.176s
#6 did output specs +0s ... 0.176s
#7 start showIntegratedCPUs +0s ... 0.176s
#8 getting avg benchmarks for device 7543 +0.061s ... 0.237s
#9 got single benchmarks 7543 +0.105s ... 0.342s
#10 getting avg benchmarks for device 7542 +0.015s ... 0.356s
#11 got single benchmarks 7542 +0.076s ... 0.432s
#12 getting avg benchmarks for device 6475 +0.02s ... 0.453s
#13 got single benchmarks 6475 +0.019s ... 0.471s
#14 got avg benchmarks for devices +0s ... 0.471s
#15 min, max, avg, median took s +0.463s ... 0.934s
#16 before gaming benchmark output +0s ... 0.934s
#17 Got 298 rows for game benchmarks. +0.058s ... 0.992s
#18 composed SQL query for gamebenchmarks +0s ... 0.992s
#19 got data and put it in $dataArray +0.046s ... 1.038s
#20 benchmarks composed for output. +0.162s ... 1.2s
#21 calculated avg scores. +0s ... 1.2s
#22 return log +0.003s ... 1.203s
Teilen Sie diesen Artikel, um uns zu unterstützen. Jeder Link hilft!
Autor: Klaus Hinum, 8.09.2017 (Update: 1.07.2023)
 Deutsch
 English
 Español
 Français
 Italiano
 Nederlands
 Polski
 Português
 Русский
 Türkçe
 Svenska
 Chinese
 Magyar