Notebookcheck Logo

Intel HD Graphics P530 vs Intel HD Graphics (Broadwell)

Intel HD Graphics P530

► remove from comparison Intel HD Graphics P530

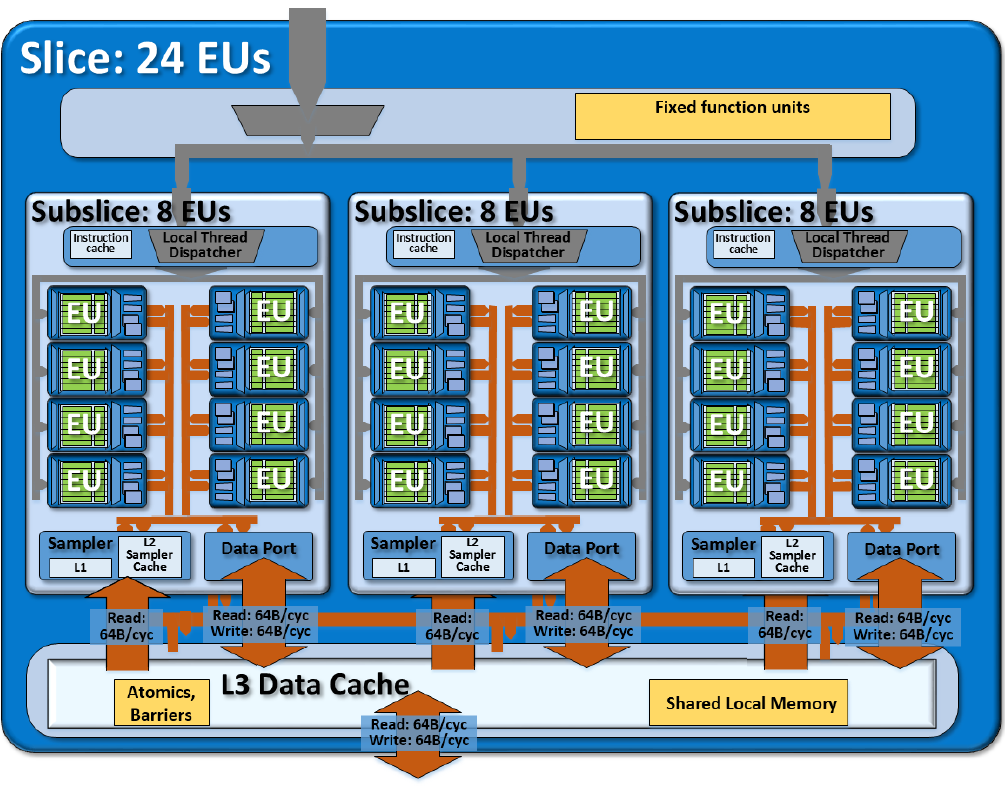
Die Intel HD Graphics P530 (GT2) ist eine integrierte Grafikeinheit, die in Skylake-Prozessoren der Xeon-Baureihe für Workstation-Notebooks verbaut wird. Die mittlere, auch "GT2" genannte Ausbaustufe verfügt über 24 EUs (Execution Units bzw. Ausführungseinheiten) und taktet je nach Modell mit bis zu 1.050 MHz (Turbo). Mangels eigenem Grafikspeicher oder eDRAM-Cache greift die HD Graphics P530 über das Interface des Prozessors auf den System-RAM zu (2x 64 Bit DDR3L-1600/DDR4-2133).

Performance

Die Leistung der HD Graphics P530 dürfte entsprechend der identischen technischen Daten genau auf dem Niveau der HD Graphics 530 liegen. Je nach Spiel kann die GPU damit in etwa mit einer dedizierten GeForce 920M konkurrieren und aktuelle Spiele (Stand 2015) zumeist in niedrigen, selten auch mittleren Einstellungen flüssig darstellen.

Features

Der überarbeitete Videodecoder decodiert nun auch H.265-/HEVC-Videos vollständig in Hardware und arbeitet dadurch deutlich effizienter als bislang. Die Bildausgabe erfolgt über DP 1.2/eDP 1.3 (max. 3.840 x 2.160 @ 60 Hz), wohingegen HDMI nur in der älteren Version 1.4a angeboten wird. Ein HDMI-2.0-Anschluss kann aber mittels Konverter von DisplayPort ergänzt werden. Maximal lassen sich drei Displays parallel angesteuern.

Leistungsaufnahme

Mobile Xeon-Modelle wie der E3-1535M v5 werden von Intel mit einer TDP von 45 Watt spezifiziert, sodass die HD Graphics P530 vor allem in größeren Notebooks ab etwa 15 Zoll zu finden ist.

Intel HD Graphics (Broadwell)

► remove from comparison Intel HD Graphics (Broadwell)

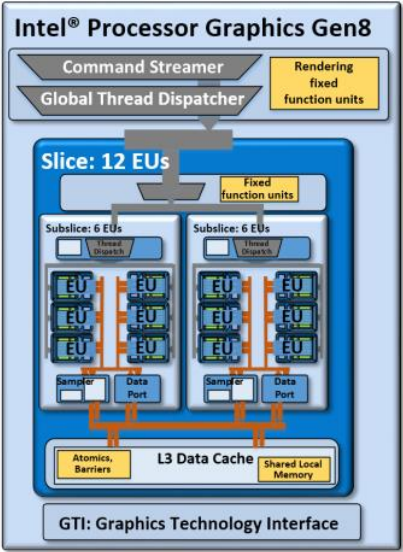
Die Intel HD Graphics (Broadwell) (GT1) ist eine Prozessorgrafikkarte in den CPUs der Broadwell-Generation. Die GPU wird in einigen Pentium- und Celeron-Modellen der Serie verbaut und bietet 12 EUs (Execution Units bzw. Ausführungseinheiten). Die maximale Turbo-Taktrate und damit auch die Performance kann sich von Modell zu Modell leicht unterscheiden, insgesamt siedelt sich die Grafikkarte aber nur im Low-End-Segment an und ist für neuere Spiele kaum ausreichend.

Architektur und Features

Broadwell integriert eine Grafikeinheit auf Basis der Intel-Gen8-Architektur, die gegenüber dem Vorgänger Intel Gen7.5 (Haswell) in verschiedenen Punkten weiterentwickelt wurde. So hat Intel unter anderem die "Subslice" genannten Shader-Arrays umorganisiert, die bei diesem Modell nun jeweils 6 Execution Units (EUs) beinhalten. Zwei Subslices bilden wiederum einen Slice mit insgesamt 12 EUs. Hinzu kommen größere L1-Caches und Verbesserungen im Front-End, die die Leistung zusätzlich steigern sollen.

Die HD Graphics (Broadwell) repräsentiert die kleinste, auch "GT1" bezeichnete Ausbaustufe mit einem Slice und 12 EUs. Daneben existieren auch schnellere Varianten wie die GT2 (24 EUs) sowie die GT3/GT3e (48 EUs) ohne/mit zusätzlichem eDRAM-Cache.

Alle Broadwell-GPUs unterstützen OpenCL 2.0 sowie DirectX 12 (FL 11_1). Zudem kann der Videodecoder nun auch den H.265-Codec verarbeiten, greift dafür allerdings nur teilweise auf besonders sparsame Fixed-Function-Einheiten zurück. Die Bildausgabe erfolgt über DP 1.2/eDP 1.3 (max. 3.840 x 2.160 @ 60 Hz) oder HDMI 1.4a (max. 3.840 x 2.160 @ 24 Hz), HDMI 2.0 steht dagegen nicht zur Verfügung. Es können maximal drei Displays parallel angesteuert werden.

Performance

Obwohl der maximale GPU-Takt etwas niedriger ausfällt, dürfte die HD Graphics (Broadwell) die ältere HD Graphics (Haswell) klar übertrumpfen und etwa das Niveau der HD Graphics 4000 erreichen. Nur sehr wenige aktuelle Spiele wie das anspruchslose Dota 2 lassen sich in niedrigen Einstellungen flüssig darstellen.

Leistungsaufnahme

Die bislang vorgestellten Celeron- und Pentium-Prozessoren gehören ausschließlich der sparsamen 15-Watt-Klasse an, später dürften auch weitere Dual-Core-Modelle mit 37 Watt TDP folgen. Abhängig davon ist die HD Graphics (Broadwell) sowohl in kleinen Subnotebooks als auch deutlich größeren Geräten zu finden.

Intel HD Graphics P530Intel HD Graphics (Broadwell)
HD Graphics Serie
HD Graphics P530 24 @ 0.35 - 1.05 GHz64/128 Bit
HD Graphics 5600 compare 24 @ 0.3 - 1.05 GHz64/128 Bit
HD Graphics 6000 compare 48 @ 0.3 - 1 GHz64/128 Bit
HD Graphics 4600 compare 20 @ 0.2 - 1.35 GHz64/128 Bit
HD Graphics 5500 compare 24 @ 0.3 - 0.95 GHz64/128 Bit
HD Graphics 5000 compare 40 @ 0.2 - 1.1 GHz64/128 Bit
HD Graphics 4400 compare 20 @ 0.2 - 1.1 GHz64/128 Bit
HD Graphics 5300 compare 24 @ 0.1 - 0.9 GHz64/128 Bit
HD Graphics 4000 compare 16 @ 0.35 - 1.35 GHz64/128 Bit
HD Graphics (Broadwell) 12 @ 0.1 - 0.85 GHz64/128 Bit
HD Graphics 4200 compare 20 @ 0.2 - 0.85 GHz64/128 Bit
HD Graphics (Skylake) compare 12 @ 0.3 - 0.8 GHz64/128 Bit
HD Graphics 405 (Braswell) compare 16 @ 0.32 - 0.7 GHz64/128 Bit
HD Graphics (Braswell) compare 16 @ 0.32 - 0.7 GHz64/128 Bit
HD Graphics 400 (Braswell) compare 12 @ 0.32 - 0.64 GHz64/128 Bit
HD Graphics (Haswell) compare 10 @ 0.2 - 1 GHz64/128 Bit
HD Graphics (Cherry Trail) compare 16 @ 0.2 - 0.6 GHz64/128 Bit
HD Graphics 3000 compare 12 @ 0.35 - 1.35 GHz64/128 Bit
HD Graphics 2500 compare 6 @ 0.65 - 1.15 GHz64/128 Bit
HD Graphics (Ivy Bridge) compare 6 @ 0.35 - 1.1 GHz64/128 Bit
HD Graphics 2000 compare 6 @ 0.85 - 1.35 GHz64/128 Bit
HD Graphics (Sandy Bridge) compare 6 @ 0.35 - 1.1 GHz64/128 Bit
HD Graphics (Bay Trail) compare 4 @ 0.31 - 0.9 GHz32/64/128 Bit
CodenameSkylake GT2Broadwell GT1
ArchitekturGen. 9 SkylakeGen. 8 Broadwell
Pipelines24 - unified12 - unified
Kerntakt350 - 1050 (Boost) MHz100 - 850 (Boost) MHz
Speicherbandbreite64/128 Bit64/128 Bit
SpeichertypDDR3/DDR4
Shared Memoryjaja
APIDirectX 12_1, OpenGL 4.4DirectX 12 (FL 11_1), OpenGL 4.3
Herstellungsprozess14 nm14 nm
FeaturesQuickSyncQuickSync
Erscheinungsdatum01.09.2015 05.01.2015
CPU in HD Graphics P530GPU Base SpeedGPU Boost / Turbo
Intel Xeon E3-1535M v54 x 2900 MHz, 45 W350 MHz1050 MHz
Intel Xeon E3-1505M v54 x 2800 MHz, 45 W350 MHz1050 MHz
min. - max.350 MHz1050 MHz
CPU in HD Graphics (Broadwell)GPU Base SpeedGPU Boost / Turbo
Intel Pentium 3825U2 x 1900 MHz, 15 W100 MHz850 MHz
Intel Celeron 3765U2 x 1900 MHz, 15 W300 MHz850 MHz
Intel Pentium 3805U2 x 1900 MHz, 15 W100 MHz800 MHz
min. - max.100 - 350 MHz800 - 1050 MHz

Benchmarks

Performance Rating - 3DMark 11 + Fire Strike + Time Spy - HD Graphics (Broadwell)
0.2 pt (1%)
3DMark - 3DMark Cloud Gate Score
3398 Points (4%)
3DMark - 3DMark Cloud Gate Graphics
4015 Points (1%)
3DMark - 3DMark Fire Strike Standard Score
428 Points (1%)
3DMark - 3DMark Fire Strike Standard Graphics
463 Points (1%)
3DMark - 3DMark Ice Storm Graphics
45539 Points (5%)
3DMark 11 - 3DM11 Performance Score
729 Points (1%)
3DMark 11 - 3DM11 Performance GPU
641 Points (1%)
3DMark Vantage
3DM Vant. Perf. total + Intel HD Graphics (Broadwell)
3DMark Vantage - 3DM Vant. Perf. total
2651 Points (1%)
3DM Vant. Perf. GPU no PhysX + Intel HD Graphics (Broadwell)
3DMark Vantage - 3DM Vant. Perf. GPU no PhysX
2196 Points (1%)
3DMark 06 3DMark 06 - Standard 1280x1024 + Intel HD Graphics (Broadwell)
3DMark 06
5077 Points (7%)
Unigine Heaven 2.1 - Heaven 2.1 high
10.9 fps (2%)
Cinebench R10 Cinebench R10 Shading (32bit) + Intel HD Graphics (Broadwell)
Cinebench R10 - Cinebench R10 Shading (32bit)
4886 Points (3%)
Cinebench R11.5 Cinebench R11.5 OpenGL 64 Bit + Intel HD Graphics (Broadwell)
Cinebench R11.5 - Cinebench R11.5 OpenGL 64 Bit
12.8 fps (4%)
Cinebench R15
Cinebench R15 OpenGL 64 Bit + Intel HD Graphics (Broadwell)
Cinebench R15 - Cinebench R15 OpenGL 64 Bit
17.8 fps (1%)
Cinebench R15 OpenGL Ref. Match 64 Bit + Intel HD Graphics (Broadwell)
Cinebench R15 - Cinebench R15 OpenGL Ref. Match 64 Bit
98 % (98%)
GFXBench 3.1 - GFXBench Manhattan ES 3.1 Offscreen
17.4 fps (0%)
GFXBench 3.0 - GFXBench 3.0 Manhattan Offscreen
21.5 fps (1%)
GFXBench (DX / GLBenchmark) 2.7
GFXBench T-Rex HD Offscreen C24Z16 + Intel HD Graphics (Broadwell)
GFXBench (DX / GLBenchmark) 2.7 - GFXBench T-Rex HD Offscreen C24Z16
47.1 fps (0%)
LuxMark v2.0 64Bit - LuxMark v2.0 Room GPU
86 Samples/s (0%)
LuxMark v2.0 64Bit - LuxMark v2.0 Sala GPU
182 Samples/s (0%)
ComputeMark v2.1 - ComputeMark v2.1 Result
374 Points (0%)

Average Benchmarks Intel HD Graphics (Broadwell) → 0% n=

- Bereich der Benchmarkergebnisse für diese Grafikkarte
- Durchschnittliche Benchmarkergebnisse für diese Grafikkarte
* Smaller numbers mean a higher performance
1 This benchmark is not used for the average calculation

Spiele-Benchmarks

Die folgenden Benchmarks basieren auf unseren Spieletests mit Testnotebooks. Die Performance dieser Grafikkarte bei den gelisteten Spielen ist abhängig von der verwendeten CPU, Speicherausstattung, Treiber und auch Betriebssystem. Dadurch müssen die untenstehenden Werte nicht repräsentativ sein. Detaillierte Informationen über das verwendete System sehen Sie nach einem Klick auf den fps-Wert.

low 1024x768
HD Graphics (Broadwell):
15.3  fps
med. 1366x768
HD Graphics (Broadwell):
8.5  fps
FIFA 16

FIFA 16

2015
low 1280x720
HD Graphics (Broadwell):
38.1  fps
high 1366x768
HD Graphics (Broadwell):
20.6  fps
low 1366x768
HD Graphics (Broadwell):
29  fps
med. 1366x768
HD Graphics (Broadwell):
20.8  fps
low 1024x768
HD Graphics (Broadwell):
50  fps
med. 1366x768
HD Graphics (Broadwell):
13.5  fps
low 1024x768
HD Graphics (Broadwell):
23.9  fps
med. 1366x768
HD Graphics (Broadwell):
16.4  fps
low 1024x768
HD Graphics (Broadwell):
13.9  fps
med. 1366x768
HD Graphics (Broadwell):
9.4  fps
F1 2014

F1 2014

2014
low 1024x768
HD Graphics (Broadwell):
34  fps
med. 1366x768
HD Graphics (Broadwell):
24  fps
Sims 4

Sims 4

2014
low 1024x768
HD Graphics (Broadwell):
113.6  fps
med. 1366x768
HD Graphics (Broadwell):
26.3  fps
low 1024x768
HD Graphics (Broadwell):
57.6  fps
med. 1366x768
HD Graphics (Broadwell):
22.6  fps
low 1024x768
HD Graphics (Broadwell):
13.7  fps
med. 1366x768
HD Graphics (Broadwell):
10.7  fps
high 1366x768
HD Graphics (Broadwell):
7  fps
low 1280x720
HD Graphics (Broadwell):
25.3  fps
med. 1366x768
HD Graphics (Broadwell):
14.1  fps
high 1366x768
HD Graphics (Broadwell):
11.7  fps
low 1024x768
HD Graphics (Broadwell):
34.7  fps
med. 1366x768
HD Graphics (Broadwell):
17.7  fps
high 1366x768
HD Graphics (Broadwell):
11.7  fps
low 1024x768
HD Graphics (Broadwell):
15.6  fps
med. 1366x768
HD Graphics (Broadwell):
11.4  fps
high 1366x768
HD Graphics (Broadwell):
5.3  fps
low 1024x768
HD Graphics (Broadwell):
43.7  fps
med. 1366x768
HD Graphics (Broadwell):
31.5  fps
high 1366x768
HD Graphics (Broadwell):
23.9  fps
low 1024x768
HD Graphics (Broadwell):
38.4  fps
med. 1366x768
HD Graphics (Broadwell):
24.9  fps
high 1366x768
HD Graphics (Broadwell):
19.7  fps
Intel HD Graphics (Broadwell)lowmed.highultraQHD4K
Star Wars Battlefront15.38.5
FIFA 1638.120.6
World of Warships2920.8
Dirt Rally5013.5
Battlefield Hardline23.916.4
Dragon Age: Inquisition13.99.4
F1 20143424
Sims 4113.626.3
GRID: Autosport57.622.6
Metro: Last Light13.710.77
BioShock Infinite25.314.111.7
Tomb Raider34.717.711.7
Hitman: Absolution15.611.45.3
Counter-Strike: GO43.731.523.9
Diablo III38.424.919.7
< 30 fps
< 60 fps
< 120 fps
≥ 120 fps
7
7
1
13
1

7


Eine Liste mit weiteren Spielen und allen Grafikkarten finden Sie auf unserer Seite: Welches Spiel ist mit welcher Grafikkarte spielbar?

Add one or more devices and compare

In the following list you can select (and also search for) devices that should be added to the comparison. You can select more than one device.

restrict list:

show all (including archived), 2024, 2023
v1.26
log 19. 18:38:17

#0 checking url part for id 6452 +0s ... 0s

#1 checking url part for id 5979 +0s ... 0s

#2 not redirecting to Ajax server +0s ... 0s

#3 did not recreate cache, as it is less than 5 days old! Created at Fri, 19 Apr 2024 05:40:26 +0200 +0.001s ... 0.001s

#4 composed specs +0.163s ... 0.164s

#5 did output specs +0s ... 0.164s

#6 start showIntegratedCPUs +0s ... 0.164s

#7 getting avg benchmarks for device 6452 +0.042s ... 0.205s

#8 got single benchmarks 6452 +0s ... 0.206s

#9 getting avg benchmarks for device 5979 +0.023s ... 0.229s

#10 got single benchmarks 5979 +0.019s ... 0.248s

#11 got avg benchmarks for devices +0s ... 0.248s

#12 min, max, avg, median took s +0.159s ... 0.407s

#13 before gaming benchmark output +0s ... 0.407s

#14 Got 36 rows for game benchmarks. +0.006s ... 0.413s

#15 composed SQL query for gamebenchmarks +0s ... 0.413s

#16 got data and put it in $dataArray +0.012s ... 0.425s

#17 benchmarks composed for output. +0.039s ... 0.464s

#18 calculated avg scores. +0s ... 0.464s

#19 return log +0.063s ... 0.527s

Teilen Sie diesen Artikel, um uns zu unterstützen. Jeder Link hilft!
> Notebook Test, Laptop Test und News > Benchmarks / Technik > Benchmarks / Technik > Grafikkarten Vergleich - Head 2 Head
Autor: Klaus Hinum,  8.09.2017 (Update:  1.07.2023)