 Deutsch
 English
 Español
 Français
 Italiano
 Nederlands
 Polski
 Português
 Русский
 Türkçe
 Svenska
 Chinese
 Magyar
Intel HD Graphics (Skylake) vs Intel HD Graphics 4000 vs Intel HD Graphics 3000
Intel HD Graphics (Skylake)
► remove from comparison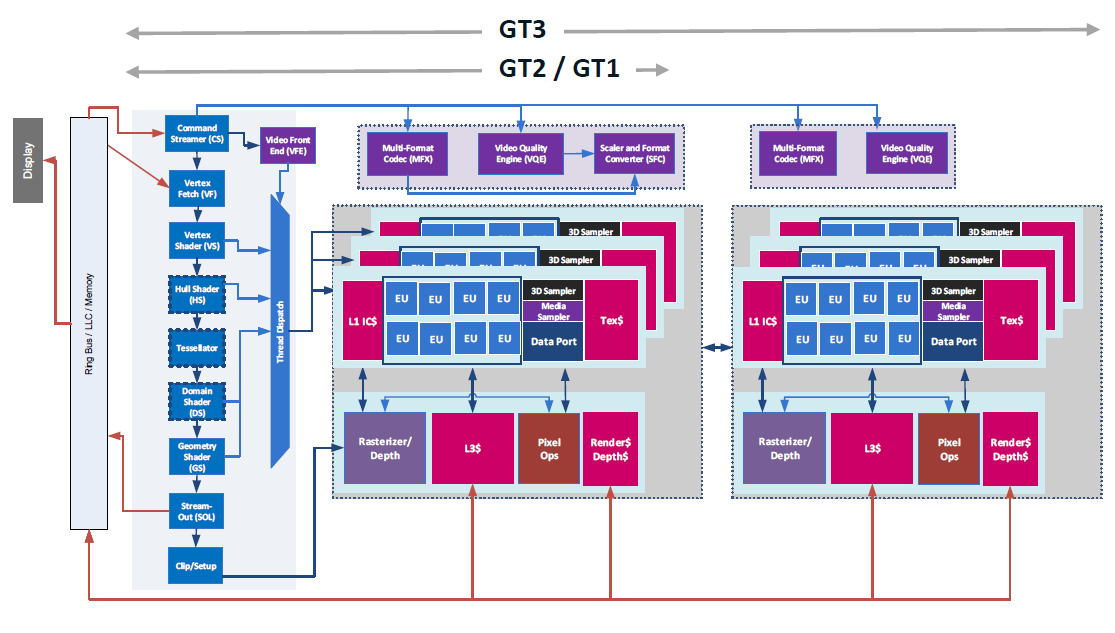
Die Intel HD Graphics (Skylake) (GT1) ist eine Prozessorgrafikkarte der im September 2015 vorgestellten Skylake-Generation. Für die meisten CPU wurden die Namen Intel HD Graphics 510 und Intel HD Graphics 515 genutzt.
Zwar glänzt die GPU mit einer extrem niedrigen Leistungsaufnahme, allerdings siedelt sich die Performance nur im untersten Low-End-Segment an und ist für neuere Spiele kaum ausreichend. Als sogenannte GT1-Ausbaustufe der Skylake-GPU verfügt die HD Graphics über 12 Execution Units (EUs), die je nach Modell mit bis zu 800 MHz takten.
Mangels eigenem Grafikspeicher oder eDRAM-Cache greift die HD Graphics (Skylake) über das Interface des Prozessors auf den System-RAM zu (2x 64 Bit DDR3L-1600/LPDDR3-1866).
Performance
Die exakte Leistung der HD Graphics hängt stark vom jeweiligen Endgerät und dessen TDP-Einstellung ab. Zum anderen bestimmt auch der eingesetzte Speicher die Performance.
Im Optimalfall dürfte die GPU in etwa mit der älteren HD Graphics 4200 konkurrieren und kann aktuelle Spiele (Stand 2015) nur in wenigen Ausnahmefällen flüssig darstellen.
Features
Der überarbeitete Videodecoder decodiert nun auch H.265-/HEVC-Videos vollständig in Hardware und arbeitet dadurch deutlich effizienter als bislang. Die Bildausgabe erfolgt über DP 1.2/eDP 1.3 (max. 3.840 x 2.160 @ 60 Hz), wohingegen HDMI nur in der älteren Version 1.4a angeboten wird. Ein HDMI-2.0-Anschluss kann aber mittels Konverter von DisplayPort ergänzt werden. Maximal lassen sich drei Displays parallel angesteuern.
Leistungsaufnahme
Die TDP des gesamten Chips liegt standardmäßig bei 6 Watt, sodass viele Ultrabooks oder 2-in-1-Geräte mit einer rein passiven Kühlung auskommen. Teils kann die TDP auch auf 4,5 Watt abgesenkt werden, wodurch allerdings die Performance sinkt.
Intel HD Graphics 4000
► remove from comparison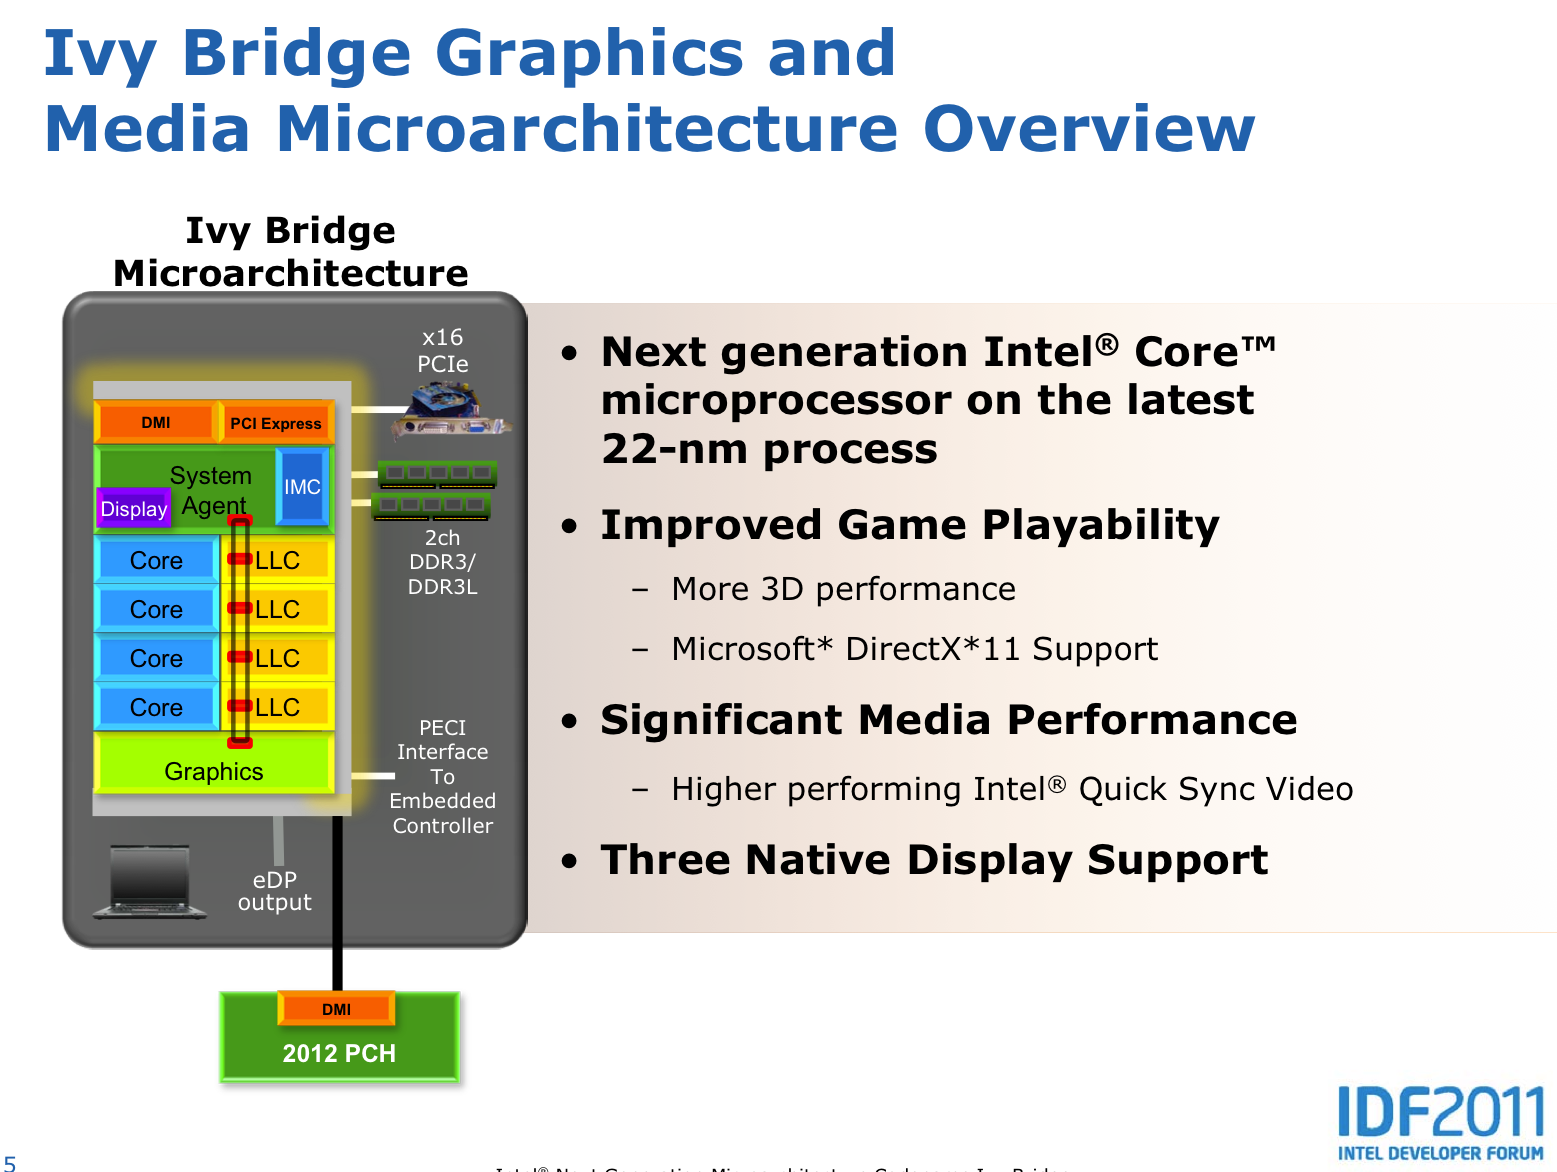
Die Intel HD Graphics 4000 (GT2) ist eine Prozessorgrafikkarte in den CPUs der Ivy Bridge Generation (3. Generation von Intel Core z.B. Core i7-3770). Je nach Prozessormodell wird die Intel HD Graphics 4000 unterschiedlich getaktet (und kann auf den unterschiedlich großen Cache zurückgreifen) und bietet daher eine teilweise deutlich geringe Leistung. Weiterhin kann die Taktung durch die Turbo Boost Technologie je nach Anforderung und TDP deutlich erhöht werden. In den schnellen Modellen soll der Basistakt 650 MHz und der Turbo 1.1 bis 1.25 GHz betragen. Die ULV Modelle weisen jedoch einen deutlich geringeren Basistakt auf (Sandy Bridge z.B. 350 MHz).
Im Vergleich zur HD Graphics 3000 der Sandy Bridge Prozessoren, bietet die 4000er einen eigenen Cache, überarbeitete DirectX 11 taugliche Shader (und vier mehr) und soll dadurch bis zu 60% mehr Leistung (3DMark Vantage) zeigen. Weiterhin sollte die GPU auf den gemeinsamen Last Level Cache (Level 3 Cache) des Prozessors zugreifen können. Weiters können die Shader auch für Direct Compute genutzt werden.
Erste Benchmarks positionieren die HD Graphics 4000 (in einem schnellen Desktop Quad-Core) auf dem Level einer Nvidia GeForce GT 330M und dadurch oberhalb der integrierten Prozessorgrafik Radeon HD 6620G. In unserem Unfangreichen Testbericht der HD Graphics 4000 konnte sie sich im schnellen Core i7-3820QM deutlich durchsetzen (6620G 15% langsamer). In den Mittelklassemodellen Core i7-3610QM und einem Dual-Core i5 war sie nur noch knapp schneller. Manchmal ist sogar eine langsame GeForce GT 630M in Reichweite. Gelegenheitsspieler, die bei Bedarf mit einer geringen Auflösung, deaktivierter Kantenglättung und niedrigen Settings leben können, werden daher an der HD Graphics 4000 durchaus Gefallen finden. In den ULV Prozessoren (Core ix-3xx7U) wird eine geringer getaktete Variante eingesetzt. Durch die TDP Beschränkungen kann der Turbo außerdem meistens nicht so hoch takten, wie bei den 35/45 Watt Versionen. Dadurch ist die HD Graphics 4000 hier meist etwa 30% langsamer als in schnellen Quad-Core CPUs.
Eine Besonderheit der Ivy Bride Grafikkerne ist, das nur 4x MSAA von der Hardware unterstützt wird. 2x MSAA wird per Software berechnet und geht durch die 4x MSAA Pipeline. Daher empfiehlt sich der Einsatz des gleich schnellen 4x MSAA.
Auch der integrierte Videodecoder genannt Multi Format Codec Engine (MFX) wurde kräftig überarbeitet und soll nun sogar mehrere 4K Videos parallel dekodieren können (ev nur in den High-End Modellen). DXVA Checker gibt weiterhin die Formate MPEG2, VC1, WMV9 und H264 als unterstütz an. QuickSync zum schnellen Transkodieren von Videos wurde ebenfalls verbessert und soll nun schneller bei gleichzeitig höherer Qualität laufen.
Ebenfalls neu ist die Unterstützung für drei unabhängige Bildschirme (abhängig von der Umsetzung im Notebook eventuell nur zwei gleichzeitige möglich). Bis jetzt waren nur zwei möglich und lediglich die AMD Grafikkarten mit Eyefinity Support bieten mehr als zwei Anschlüsse für Notebooks (jedoch nur mit DisplayPorts). Laut Intel wird DisplayPort in der Version 1.1 unterstützt (daher maximal 2560x1600) und HDMI in 1.4 (in der Praxis 1920x1080, siehe Fokusartikel für 2560x1600).
Der Stromverbrauch ist dank des 22nm Prozesses mit 3D Tri-Gate Technologie relativ gering und nicht einzeln angegeben. Die Notebook-Prozessoren (CPU, GPU, Speichercontroller) sind gesamt auf einen TDP von 18-45 Watt spezifziert.
Intel HD Graphics 3000
► remove from comparison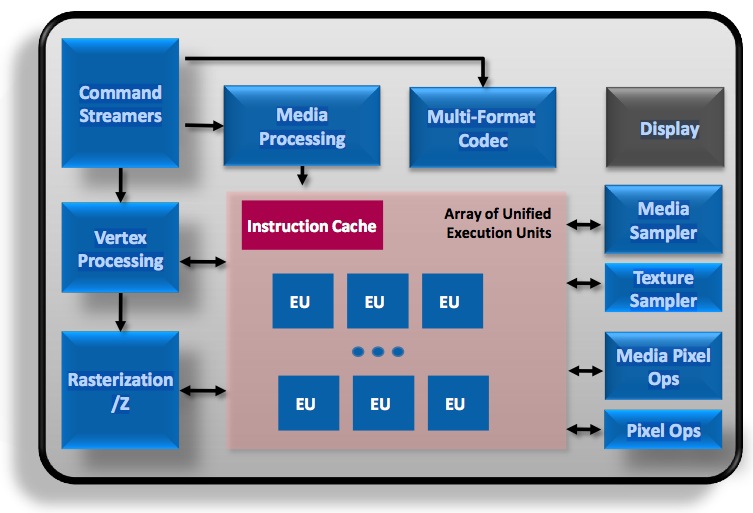
Die Intel HD Graphics 3000 (fälschlich auch Intel Graphics Media Accelerator HD 3000, GMA HD 3000, HD Graphics 200 genannt) ist eine in den Sandy Bridge Prozessoren integrierte Grafikkarte. Sie bietet keinen eigenen dedizierten Speicher, teilt sich jedoch den sehr schnellen Level 3 Cache bzw. LLC Cache mit den Prozessorkernen (3-8 MB je nach CPU). Der restliche Speicher wird vom Hauptspeicher abgezweigt (wie bei der Vorgänger-Grafikkarte Intel HD Graphics). Je nach Prozessormodell unterscheidet sich der Basistakt und damit auch die Leistung deutlich (350-650 MHz) Dank TurboBoost kann sich die Grafikkarte wie die Prozessorkerne in gewissen Lastsituationen übertakten (bei ausreichend Kühlung und ebenfalls abhängig vom Prozessormodell).
- ULV Prozessoren Core ix-2xx7 (Basis 350 MHz, Turbo 900-1000 MHz)
- LV Prozessoren Core ix-2xx5 (Basis 500 MHz, Turbo 1000 MHz)
- Standard Dual und Quad-Core Core ix-2xx0 (Basis 650 MHz, Turbo 1100-1300 MHz)
- Desktop K Prozessoren (Basis 850, Turbo 1100-1350 MHz)
Die Intel GMA HD 3000 bietet wie die GMA HD 12 Execution Units (EUs), welche jedoch deutlich überarbeitet wurden und daher eine höhere Performance bieten. Die EUs der GMA HD 3000 können mit DirectX 10.1, OpenGL 3.0 und DirectCompute 4.1 angesteuert werden. OpenCL wird nicht unterstützt (das Media SDK verwendet nur die CPU, Stand März 2013).
Unsere Performancetests mit den schnell getakteten Versionen der HD Graphics 3000 zeigen eine deutlich gesteigerte Leistung im Vergleich zur Vorgängergeneration. Die integrierte shared Memory Grafikkarte positioniert sich je nach Spiel auf dem Niveau älterer Einstiegsgrafikkarten von Nvidia (GeForce 310M) bzw. AMD (Mobility Radeon HD 5450), manchmal auch etwas darüber (Radeon HD 6450M). Im Vergleich mit AMDs APU-Modellen kann die HD 3000 nur gegen die C- und E-Serie bestehen, nicht aber die schnelleren Llano- und Trinity-Ableger. Die in früheren Jahren oftmals problematische Qualität der Intel-Treiber (Grafikfehler, Spiele starten nicht) hat sich zuletzt deutlich verbessert, sodass die meisten Spiele bei erfüllten Mindestvoraussetzungen fehlerfrei spielbar sind.
Flüssige Frameraten konnten wir unter anderem in Spielen wie Dead Space 3, World of Tanks, Fifa 13, Torchlight 2, Counter-Strike: GO, Diablo 3 sowie vielen älteren Titeln erreichen, wenn auch meist nur bei minimalen Detaileinstellungen. Genaue Performanceanalysen und Spielebenchmarks finden Sie in unserem Schwerpunktartikel zur Intel HD Graphics 3000 bzw. weiter unten in diesem Artikel.
Wie bei den Ivy Bridge basierten Grafikkarten, wird anscheinend auch bei Sandy Bridge 2x Antialiasing per Software aus dem 4x Antialiasing errechnet. Daher ergibt sich kein Geschwindigkeitsunterschied zwischen 2x und 4x AA. Im Unigine Valley Benchmark erreichten wir als Bestätigung bei 2x AA und 4x AA dasselbe Ergebnis (HD Graphics 3000 ULV im i7-2637M).
Neben der GPU ist auch noch eine dedizierte Einheit zum Dekodieren und auch Encodieren von HD Videos in den Sandy Bridge Prozessoren enthalten (Intel Quick Sync). Um ein dreiminütiges 1080p-Video für das iPhone in das Format 640x360 zu wandeln, braucht Sandy Bridge laut Intel etwa 14s (IDF 2010). Eine weitere Besonderheit ist der unterstützte "embedded DisplayPort" eDP um interne Displays anzusteuern.
Aufgrund der Integration in den mit 32nm gefertigten Prozessor, ist der Stromverbrauch relativ gering.
| Intel HD Graphics (Skylake) | Intel HD Graphics 4000 | Intel HD Graphics 3000 | ||||||||||||||||||||||||||||||||||||||||||||||||||||||||||||||||||||||||||||||||||||||||||||||||||||||||||||||||||||||||||||||||||||||||||||||||||||||||||||||||||||||||||||||||||||||||||||||||||||||||||||||||
| HD Graphics Serie |
|
|
| |||||||||||||||||||||||||||||||||||||||||||||||||||||||||||||||||||||||||||||||||||||||||||||||||||||||||||||||||||||||||||||||||||||||||||||||||||||||||||||||||||||||||||||||||||||||||||||||||||||||||||||||
| Codename | Skylake GT1 | Ivy Bridge | Sandy Bridge | |||||||||||||||||||||||||||||||||||||||||||||||||||||||||||||||||||||||||||||||||||||||||||||||||||||||||||||||||||||||||||||||||||||||||||||||||||||||||||||||||||||||||||||||||||||||||||||||||||||||||||||||
| Architektur | Gen. 9 Skylake | Gen. 7 Ivy Bridge | Gen. 6 Sandy Bridge | |||||||||||||||||||||||||||||||||||||||||||||||||||||||||||||||||||||||||||||||||||||||||||||||||||||||||||||||||||||||||||||||||||||||||||||||||||||||||||||||||||||||||||||||||||||||||||||||||||||||||||||||
| Pipelines | 12 - unified | 16 - unified | 12 - unified | |||||||||||||||||||||||||||||||||||||||||||||||||||||||||||||||||||||||||||||||||||||||||||||||||||||||||||||||||||||||||||||||||||||||||||||||||||||||||||||||||||||||||||||||||||||||||||||||||||||||||||||||
| Kerntakt | 300 - 800 (Boost) MHz | 350 - 1350 (Boost) MHz | 350 - 1350 (Boost) MHz | |||||||||||||||||||||||||||||||||||||||||||||||||||||||||||||||||||||||||||||||||||||||||||||||||||||||||||||||||||||||||||||||||||||||||||||||||||||||||||||||||||||||||||||||||||||||||||||||||||||||||||||||
| Speicherbandbreite | 64/128 Bit | 64/128 Bit | 64/128 Bit | |||||||||||||||||||||||||||||||||||||||||||||||||||||||||||||||||||||||||||||||||||||||||||||||||||||||||||||||||||||||||||||||||||||||||||||||||||||||||||||||||||||||||||||||||||||||||||||||||||||||||||||||
| Speichertyp | DDR3L/LPDDR3 | |||||||||||||||||||||||||||||||||||||||||||||||||||||||||||||||||||||||||||||||||||||||||||||||||||||||||||||||||||||||||||||||||||||||||||||||||||||||||||||||||||||||||||||||||||||||||||||||||||||||||||||||||
| Shared Memory | ja | ja | ja | |||||||||||||||||||||||||||||||||||||||||||||||||||||||||||||||||||||||||||||||||||||||||||||||||||||||||||||||||||||||||||||||||||||||||||||||||||||||||||||||||||||||||||||||||||||||||||||||||||||||||||||||
| API | DirectX 12_1, OpenGL 4.4 | DirectX 11, Shader 5.0, OpenGL 3.1 | DirectX 10.1, Shader 4.1, OpenGL 3.0 | |||||||||||||||||||||||||||||||||||||||||||||||||||||||||||||||||||||||||||||||||||||||||||||||||||||||||||||||||||||||||||||||||||||||||||||||||||||||||||||||||||||||||||||||||||||||||||||||||||||||||||||||
| Herstellungsprozess | 14 nm | 22 nm | 32 nm | |||||||||||||||||||||||||||||||||||||||||||||||||||||||||||||||||||||||||||||||||||||||||||||||||||||||||||||||||||||||||||||||||||||||||||||||||||||||||||||||||||||||||||||||||||||||||||||||||||||||||||||||
| Features | QuickSync | QuickSync | ||||||||||||||||||||||||||||||||||||||||||||||||||||||||||||||||||||||||||||||||||||||||||||||||||||||||||||||||||||||||||||||||||||||||||||||||||||||||||||||||||||||||||||||||||||||||||||||||||||||||||||||||
| Erscheinungsdatum | 01.09.2015 | 23.03.2011 | 01.02.2011 |
|
| |||||||||||||||||||||||||||||||||||||||||||||||||


