Notebookcheck Logo

Intel Iris Pro Graphics P580 vs Intel HD Graphics 510 vs Intel UHD Graphics 605

Intel Iris Pro Graphics P580

► remove from comparison

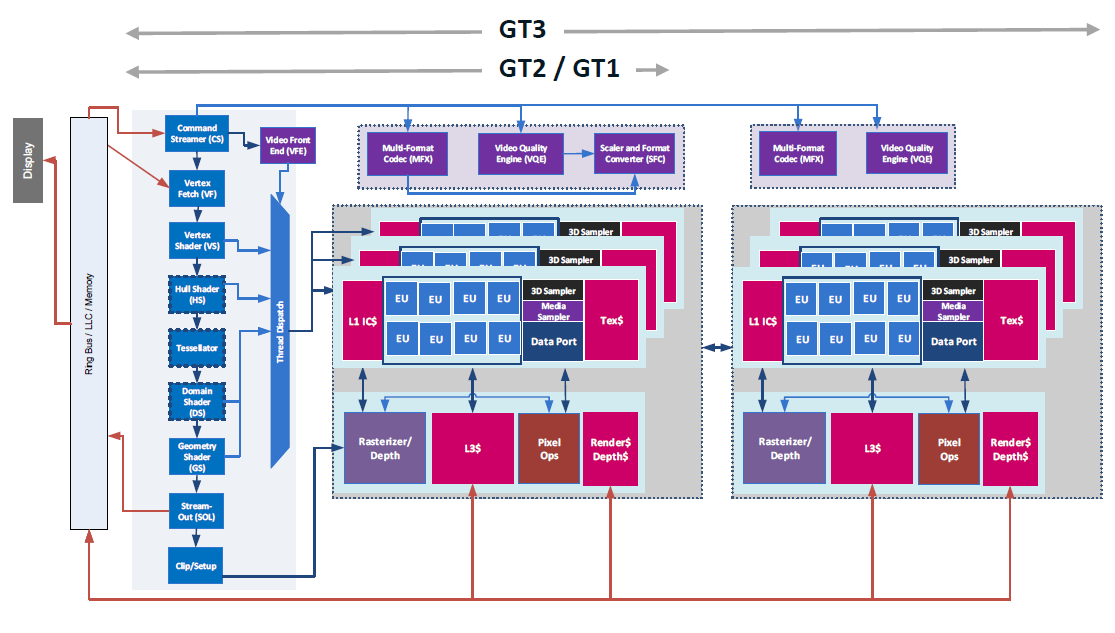
Die Intel Iris Pro Graphics P580 (GT4e) ist eine Prozessorgrafikkarte der im Sommer 2015 vorgestellten Skylake-Generation. Als Nachfolger der Iris Pro Graphics 6200 (Broadwell) ist die Iris Pro P580 dabei in ausgewählten Quad-Core-Modellen der Xeon-Serie zu finden und besitzt einen dedizierten eDRAM-Cache mit 128 MB Kapazität. Die sogenannte GT4e-Ausbaustufe der Skylake-GPU verfügt zudem über 72 Execution Units (EUs) und damit deutlich mehr Rechenleistung als die GT2- (24 EUs) und GT3e-Ausbaustufen (48 EUs). Neben dem eDRAM-Cache kann die Iris P580 auch über das Interface des Prozessors auf den Hauptspeicher zugreifen (2x 64 Bit DDR3L-1600/DDR4-2133).

Im Unterschied zur Consumer-Variante Iris Pro Graphics 580 ist die Iris P580 ausschließlich den professionellen Xeon-Modellen vorbehalten, weist ansonsten aber keine bedeutsamen technischen Abweichungen auf.

Performance

Die exakte Leistung der Iris Pro Graphics P580 ist bislang noch nicht bekannt und hängt unter anderem vom jeweiligen CPU-Modell sowie der Speicherbestückung ab. Im Optimalfall sollte die Performance aber knapp an eine dedizierte GeForce 945M heranreichen und liegt damit in der Mittelklasse mobiler Grafikchips des Jahres 2015/2016. Aktuelle Spiele können zumeist in mittleren Einstellungen flüssig dargestellt werden.

Features

Die überarbeitete Videoeinheit decodiert nun auch H.265-/HEVC-Videos vollständig in Hardware und arbeitet dadurch deutlich effizienter als bislang. Die Bildausgabe erfolgt über DP 1.2/eDP 1.3 (max. 3.840 x 2.160 @ 60 Hz), wohingegen HDMI nur in der älteren Version 1.4 angeboten wird. Ein HDMI-2.0-Anschluss kann aber mittels Konverter von DisplayPort ergänzt werden. Maximal lassen sich drei Displays parallel angesteuern.

Leistungsaufnahme

Die Iris Pro Graphics P580 wird zunächst ausschließlich in Prozessoren der 45-Watt-Klasse verbaut und ist damit vorrangig in größeren Notebooks zu finden.

Intel HD Graphics 510

► remove from comparison Intel HD Graphics 510

Die Intel HD Graphics 510 (GT1) ist eine Prozessorgrafikkarte der im September 2015 vorgestellten Skylake-Generation (z.B. Pentium 4405U). Zwar glänzt die GPU mit einer niedrigen Leistungsaufnahme, allerdings siedelt sich die Performance nur im Low-End-Segment an und ist für neuere Spiele selten ausreichend. Als sogenannte GT1-Ausbaustufe der Skylake-GPU verfügt die HD Graphics 510 über 12 Execution Units (EUs), die je nach Modell mit bis zu 950 MHz takten.

Mangels eigenem Grafikspeicher oder eDRAM-Cache greift die HD Graphics 510 über das Interface des Prozessors auf den System-RAM zu (2x 64 Bit DDR3L-1600/LPDDR3-1866).

Performance

Die exakte Leistung der HD Graphics 510 dürfte sich knapp unterhalb der älteren HD Graphics 4400 ansiedeln, sodass aktuelle Spiele (Stand 2015) nur in wenigen Fällen und in niedrigsten Einstellungen flüssig dargestellt werden.

Features

Der überarbeitete Videodecoder decodiert nun auch H.265-/HEVC-Videos vollständig in Hardware und arbeitet dadurch deutlich effizienter als bislang. Die Bildausgabe erfolgt über DP 1.2/eDP 1.3 (max. 3.840 x 2.160 @ 60 Hz), wohingegen HDMI nur in der älteren Version 1.4a angeboten wird. Ein HDMI-2.0-Anschluss kann aber mittels Konverter von DisplayPort ergänzt werden. Maximal lassen sich drei Displays parallel angesteuern.

Leistungsaufnahme

Die TDP des gesamten Chips liegt standardmäßig bei 15 Watt, sodass die GPU vor allem in Ultrabooks oder oder schlanken Notebooks zu finden ist. Teils kann die TDP auch auf 10 Watt abgesenkt werden, wodurch allerdings die Performance sinkt.

Intel UHD Graphics 605

► remove from comparison Intel UHD Graphics 605

Die Intel UHD Graphics 605 ist eine Prozessorgrafikkarte der Ende 2017 vorgestellten Gemini-Lake-Generation (z.B. Pentium Silver N5000). Zwar glänzt die GPU mit einer sehr niedrigen Leistungsaufnahme, allerdings siedelt sich die Performance nur im Low-End-Segment an und ist für neuere Spiele nicht ausreichend. Als maximale Ausbaustufe der Gemini-Lake-GPU verfügt die UHD Graphics 605 über 18 Execution Units (EUs), die mit bis zu 750 MHz takten. Technisch basiert die GPU auf der Intel-Gen9-Architektur, die auch bei der teureren Skylake-Serie zum Einsatz kommt. Im Vergleich zur alten Intel HD Graphics 505 in Apollo Lake, wurden nur die Displayausgänge verbessert (Gen. 10). Performance und Architektur blieben unangetastet. 

Mangels eigenem Grafikspeicher oder eDRAM-Cache greift die UHD Graphics 605 über das Interface des Prozessors auf den System-RAM zu (2x 64 Bit DDR3L/LPDDR4-2400).

Performance

Die theoretische Grafikleistung entspricht in etwa der älteren Core-M-Grafikeinheit HD Graphics 5300. Dadurch sind nur wenige anspruchslose Spiele flüssig spielbar (siehe auch die Spielebenchmarks der Intel HD Graphics 505). In unseren Tests erreichte z.B. nur wenige Spiele wie Dirt Rally oder Sims 4 spielbare Frameraten in niedrigsten Detailstufe.

Features

Der überarbeitete Videodecoder decodiert und encodiert H.265-/HEVC-Videos (8b und 10b) sowie VP9 vollständig in Hardware und arbeitet dadurch deutlich effizienter als bislang. Bei der Bildausgabe unterstützt der SoC dank Gen.10 nun auch HDMI 2.0a mit HDCP 2.2 un DisplayPort 1.2a nativ.

Leistungsaufnahme

Die TDP des gesamten Chips liegt beim Pentium N5000 standardmäßig bei 6 Watt, sodass die GPU vor allem in (oftmals passiv gekühlten) Netbooks oder schlanken Notebooks zu finden ist. Optional kann die TDP auch auf 4,8 Watt abgesenkt werden, wodurch allerdings die Performance sinkt.

Intel Iris Pro Graphics P580Intel HD Graphics 510Intel UHD Graphics 605
Gen. 9 Serie
Iris Pro Graphics P580 72 @ 0.35 - 1.1 GHzeDRAM + 64/128 Bit
Iris Pro Graphics 580 72 @ 0.35 - 1.05 GHzeDRAM + 64/128 Bit
Iris Graphics 550 48 @ 0.3 - 1.1 GHzeDRAM + 64/128 Bit
Iris Graphics 540 48 @ 0.3 - 1.05 GHzeDRAM + 64/128 Bit
HD Graphics 530 24 @ 0.35 - 1.15 GHz64/128 Bit
HD Graphics 520 24 @ 0.3 - 1.05 GHz64/128 Bit
HD Graphics 515 24 @ 0.3 - 1 GHz64/128 Bit
UHD Graphics 610 12 @ 0.3 - 0.95 GHz64/128 Bit
HD Graphics 610 12 @ 0.3 - 0.95 GHz64/128 Bit
HD Graphics 510 12 @ 0.3 - 0.95 GHz64/128 Bit
UHD Graphics 605 18 @ 0.3 - 0.75 GHz64/128 Bit
HD Graphics 505 18 @ 0.3 - 0.75 GHz64/128 Bit
UHD Graphics 600 12 @ 0.3 - 0.7 GHz64/128 Bit
HD Graphics 500 12 @ 0.3 - 0.7 GHz64/128 Bit
CodenameSkylake GT4eSkylake GT1Gemini Lake
ArchitekturGen. 9 SkylakeGen. 9 SkylakeGen. 9 Apollo Lake
Pipelines72 - unified12 - unified18 - unified
Kerntakt350 - 1100 (Boost) MHz300 - 950 (Boost) MHz300 - 750 (Boost) MHz
SpeicherbandbreiteeDRAM + 64/128 Bit64/128 Bit64/128 Bit
SpeichertypeDRAMDDR3/DDR4DDR4 / LPDDR4
Max. Speichergröße128 MB
Shared Memoryjajaja
APIDirectX 12_1, OpenGL 4.4DirectX 12_1, OpenGL 4.4DirectX 12_1, OpenGL 4.4
Herstellungsprozess14 nm14 nm14 nm
FeaturesQuickSyncQuickSyncQuickSync
Erscheinungsdatum24.01.2016 01.09.2015 11.12.2017
Herstellerseiteark.intel.com
CPU in Iris Pro Graphics P580GPU Base SpeedGPU Boost / Turbo
Intel Xeon E3-1575M v54 x 3000 MHz, 45 W350 MHz1100 MHz
CPU in HD Graphics 510GPU Base SpeedGPU Boost / Turbo
Intel Core i5-6198DU2 x 2300 MHz, 15 W300 MHz1000 MHz
Intel Pentium 4405U2 x 2100 MHz, 15 W300 MHz950 MHz
min. - max.300 - 350 MHz950 - 1100 MHz
CPU in UHD Graphics 605GPU Base SpeedGPU Boost / Turbo
Intel Pentium Silver J50404 x 2000 MHz, 10 W250 MHz800 MHz
Intel Pentium Silver N50304 x 1100 MHz, 6 W200 MHz750 MHz
Intel Pentium Silver N50004 x 1100 MHz, 6 W200 MHz750 MHz
min. - max.200 - 350 MHz750 - 1100 MHz

Benchmarks

Performance Rating - 3DMark 11 + Fire Strike + Time Spy - HD Graphics 510
0.3 pt (1%)
Performance Rating - 3DMark 11 + Fire Strike + Time Spy - UHD Graphics 605
0.2 pt (1%)
3DMark - 3DMark Time Spy Score
129 Points (0%)
3DMark - 3DMark Time Spy Graphics
113 Points (0%)
3DMark - 3DMark Ice Storm Unlimited Graphics
43274 Points (5%)
3DMark - 3DMark Ice Storm Extreme Graphics
26846 Points (3%)
min: 13350     avg: 16118     median: 16553.5 (2%)     max: 18016 Points
3DMark - 3DMark Cloud Gate Score
4721 Points (5%)
3DMark - 3DMark Cloud Gate Graphics
5664 Points (1%)
3DMark - 3DMark Fire Strike Standard Score
570 Points (1%)
3DMark - 3DMark Fire Strike Standard Graphics
621 Points (1%)
3DMark - 3DMark Ice Storm Graphics
62653 Points (8%)
min: 20859     avg: 25930     median: 26031 (3%)     max: 30797 Points
3DMark - 3DMark Sling Shot (ES 3.0) Unlimited
2870 Points (12%)
3DMark - 3DMark Sling Shot (ES 3.0) Unlimited Graphics
2805 Points (6%)
3DMark - 3DMark Sling Shot Extreme (ES 3.1) Unlimited
1628 Points (8%)
3DMark - 3DMark Sling Shot Extreme (ES 3.1) Unlimited Graphics
1450 Points (4%)
3DMark - 3DMark Wild Life Unlimited
882 Points (0%)
3DMark - 3DMark Wild Life Extreme Unlimited
281 Points (0%)
3DMark - 3DMark Night Raid
min: 1614     avg: 1751     median: 1619 (2%)     max: 2019 Points
3DMark - 3DMark Night Raid Graphics Score
min: 1849     avg: 2059     median: 1893 (1%)     max: 2434 Points
3DMark 11 - 3DM11 Performance Score
985 Points (1%)
3DMark 11 - 3DM11 Performance GPU
847 Points (1%)
3DMark Vantage
3DM Vant. Perf. total + Intel HD Graphics 510
3DMark Vantage - 3DM Vant. Perf. total
3798 Points (1%)
3DM Vant. Perf. total + Intel UHD Graphics 605
2162 Points (1%)
3DM Vant. Perf. GPU no PhysX + Intel HD Graphics 510
3DMark Vantage - 3DM Vant. Perf. GPU no PhysX
3125 Points (2%)
3DM Vant. Perf. GPU no PhysX + Intel UHD Graphics 605
1785 Points (1%)
3DMark 03 - 3DMark 03 - Standard
8388 Points (4%)
3DMark 05 - 3DMark 05 - Standard
5802 Points (6%)
3DMark 06 3DMark 06 - Standard 1280x1024 + Intel HD Graphics 510
3DMark 06
7253 Points (9%)
3DMark 06 - Standard 1280x1024 + Intel UHD Graphics 605
min: 2882     avg: 4208     median: 4171 (5%)     max: 5570 Points
Unigine Valley 1.0 - Unigine Valley 1.0 DX
1.7 fps (1%)
Unigine Heaven 3.0 - Unigine Heaven 3.0 DX 11
9.3 fps (3%)
6.5 fps (2%)
Unigine Heaven 3.0 - Unigine Heaven 3.0 OpenGL
10.8 fps (5%)
7.2 fps (3%)
Unigine Heaven 2.1 - Heaven 2.1 high
13.5 fps (3%)
9 fps (2%)
Cinebench R10 Cinebench R10 Shading (32bit) + Intel HD Graphics 510
Cinebench R10 - Cinebench R10 Shading (32bit)
7348 Points (5%)
Cinebench R10 Shading (32bit) + Intel UHD Graphics 605
min: 3505     avg: 3812     median: 3773 (3%)     max: 4366 Points
Cinebench R11.5 Cinebench R11.5 OpenGL 64 Bit + Intel HD Graphics 510
Cinebench R11.5 - Cinebench R11.5 OpenGL 64 Bit
17.2 fps (6%)
Cinebench R11.5 OpenGL 64 Bit + Intel UHD Graphics 605
min: 15.24     avg: 17.9     median: 17.9 (6%)     max: 20.5 fps
Cinebench R15
Cinebench R15 OpenGL 64 Bit + Intel HD Graphics 510
Cinebench R15 - Cinebench R15 OpenGL 64 Bit
28 fps (2%)
Cinebench R15 OpenGL 64 Bit + Intel UHD Graphics 605
Cinebench R15 OpenGL Ref. Match 64 Bit + Intel UHD Graphics 605
GFXBench - GFXBench 5.0 Aztec Ruins High Tier Offscreen
min: 5.9     avg: 6.4     median: 6.4 (1%)     max: 6.8 fps
GFXBench - GFXBench 5.0 Aztec Ruins Normal Tier Offscreen
min: 9.9     avg: 12.8     median: 12.8 (1%)     max: 15.7 fps
GFXBench - GFXBench Car Chase Offscreen
35.9 fps (4%)
min: 7.1     avg: 11     median: 11.3 (1%)     max: 14.6 fps
GFXBench 3.1 - GFXBench Manhattan ES 3.1 Offscreen
51.7 fps (1%)
min: 13     avg: 17.6     median: 16.5 (0%)     max: 23.3 fps
GFXBench 3.0 - GFXBench 3.0 Manhattan Offscreen
64.6 fps (4%)
min: 16     avg: 23.8     median: 22.1 (1%)     max: 33.4 fps
GFXBench (DX / GLBenchmark) 2.7
GFXBench T-Rex HD Offscreen C24Z16 + Intel HD Graphics 510
GFXBench (DX / GLBenchmark) 2.7 - GFXBench T-Rex HD Offscreen C24Z16
121.9 fps (1%)
GFXBench T-Rex HD Offscreen C24Z16 + Intel UHD Graphics 605
min: 32     avg: 43.1     median: 45.5 (0%)     max: 51.9 fps
Basemark GPU 1.2 - Basemark GPU 1.2 Vulkan Official Medium Offscreen 1080
23.3 fps (0%)
Basemark GPU 1.2 - Basemark GPU 1.2 Vulkan Official High Offscreen 2160
2 fps (0%)
LuxMark v2.0 64Bit - LuxMark v2.0 Room GPU
167 Samples/s (1%)
min: 67     avg: 93.5     median: 93.5 (0%)     max: 120 Samples/s
LuxMark v2.0 64Bit - LuxMark v2.0 Sala GPU
302 Samples/s (1%)
min: 96     avg: 142     median: 142 (0%)     max: 188 Samples/s
ComputeMark v2.1 - ComputeMark v2.1 Result
500 Points (1%)
min: 432     avg: 490.5     median: 490.5 (1%)     max: 549 Points
Power Consumption - Furmark Stress Test Power Consumption - external Monitor *
min: 10.3     avg: 11     median: 11 (2%)     max: 11.6 Watt
Power Consumption - Witcher 3 Power Consumption *
11.8 Watt (3%)
Power Consumption - Witcher 3 ultra Power Efficiency
0.1 fps per Watt (10%)
Clock Speed - GPU Clock Speed Furmark
515 MHz (20%)

Average Benchmarks Intel HD Graphics 510 → 0% n=

Average Benchmarks Intel UHD Graphics 605 → 0% n=

- Bereich der Benchmarkergebnisse für diese Grafikkarte
- Durchschnittliche Benchmarkergebnisse für diese Grafikkarte
* Smaller numbers mean a higher performance
1 This benchmark is not used for the average calculation

Spiele-Benchmarks

Die folgenden Benchmarks basieren auf unseren Spieletests mit Testnotebooks. Die Performance dieser Grafikkarte bei den gelisteten Spielen ist abhängig von der verwendeten CPU, Speicherausstattung, Treiber und auch Betriebssystem. Dadurch müssen die untenstehenden Werte nicht repräsentativ sein. Detaillierte Informationen über das verwendete System sehen Sie nach einem Klick auf den fps-Wert.

low 1920x1080
UHD Graphics 605:
31.1  fps
F1 2019

F1 2019

2019
low 1280x720
UHD Graphics 605:
7 8.2 ~ 8 fps
low 1280x720
UHD Graphics 605:
49.8  fps
med. 1920x1080
UHD Graphics 605:
39  fps
high 1920x1080
UHD Graphics 605:
26.6  fps
ultra 1920x1080
UHD Graphics 605:
24.9  fps
QHD 2560x1440
UHD Graphics 605:
23.6  fps
4K 3840x2160
UHD Graphics 605:
15  fps
low 1280x720
UHD Graphics 605:
6.5 10.9 ~ 9 fps
Anno 1800

Anno 1800

2019
low 1280x720
UHD Graphics 605:
5.8  fps
low 1280x720
UHD Graphics 605:
1  fps
low 1280x720
UHD Graphics 605:
11.7 (!) 17.6 ~ 15 fps
low 1280x720
UHD Graphics 605:
1  fps
low 1280x720
UHD Graphics 605:
7.2  fps
low 1280x720
UHD Graphics 605:
4  fps
low 1280x720
UHD Graphics 605:
4  fps
low 1280x720
UHD Graphics 605:
4  fps
Strange Brigade

Strange Brigade

2018
low 1280x720
UHD Graphics 605:
8.5  fps
F1 2018

F1 2018

2018
low 1280x720
UHD Graphics 605:
12  fps
low 1280x720
UHD Graphics 605:
4.6  fps
low 1280x720
UHD Graphics 605:
8.8  fps
Far Cry 5

Far Cry 5

2018
low 1280x720
UHD Graphics 605:
3  fps
World of Tanks enCore

World of Tanks enCore

2018
low 1366x768
UHD Graphics 605:
53  fps
med. 1920x1080
UHD Graphics 605:
8.9  fps
low 1280x720
UHD Graphics 605:
5 6.4 7.2 8.6 9.1 ~ 7 fps
med. 1920x1080
UHD Graphics 605:
3.5 5.9 6 6.1 ~ 5 fps
high 1920x1080
UHD Graphics 605:
3.1 5.3 5.5 5.5 ~ 5 fps
low 1280x720
UHD Graphics 605:
5.5  fps
low 1280x720
UHD Graphics 605:
3.4 4.2 4.4 5.2 7.5 ~ 5 fps
med. 1920x1080
UHD Graphics 605:
3.3  fps
ELEX

ELEX

2017
low 1280x720
UHD Graphics 605:
5.2  fps
low 1280x720
UHD Graphics 605:
7  fps
F1 2017

F1 2017

2017
low 1280x720
UHD Graphics 605:
13  fps
low 1280x720
UHD Graphics 605:
38 41.4 ~ 40 fps
med. 1366x768
UHD Graphics 605:
34.5 36.5 ~ 36 fps
high 1920x1080
UHD Graphics 605:
17 18.4 ~ 18 fps
Dirt 4

Dirt 4

2017
low 1280x720
UHD Graphics 605:
18.8  fps
low 1280x720
UHD Graphics 605:
22.6 26.8 27.8 ~ 26 fps
med. 1920x1080
UHD Graphics 605:
9.9 10 ~ 10 fps
Prey

Prey

2017
low 1280x720
UHD Graphics 605:
5.5  fps
low 1280x720
UHD Graphics 605:
3.2  fps
For Honor

For Honor

2017
low 1280x720
UHD Graphics 605:
9  fps
low 1280x720
HD Graphics 510:
18.3  fps
UHD Graphics 605:
7.9  fps
low 1280x720
HD Graphics 510:
19.9  fps
med. 1366x768
HD Graphics 510:
15.4  fps
low 1280x720
HD Graphics 510:
70.6  fps
med. 1366x768
HD Graphics 510:
41.3  fps
low 1024x768
HD Graphics 510:
24.5  fps
UHD Graphics 605:
12.7  fps
med. 1366x768
HD Graphics 510:
9.4  fps
UHD Graphics 605:
5.5  fps
Overwatch

Overwatch

2016
low 1280x720
UHD Graphics 605:
11.4  fps
med. 1366x768
UHD Graphics 605:
8.3  fps
low 1280x720
HD Graphics 510:
13.4  fps
UHD Graphics 605:
4.3  fps
med. 1366x768
HD Graphics 510:
7.7  fps
low 1024x768
HD Graphics 510:
11.1  fps
UHD Graphics 605:
6.9  fps
med. 1366x768
HD Graphics 510:
7  fps
low 1024x768
HD Graphics 510:
25  fps
UHD Graphics 605:
12.3  fps
med. 1366x768
HD Graphics 510:
15.9  fps
Anno 2205

Anno 2205

2015
low 1024x768
HD Graphics 510:
19.9  fps
med. 1366x768
HD Graphics 510:
11  fps
low 1366x768
HD Graphics 510:
48.7  fps
UHD Graphics 605:
22.7 24.7 ~ 24 fps
med. 1366x768
HD Graphics 510:
29.2  fps
UHD Graphics 605:
14.3  fps
low 1024x768
HD Graphics 510:
38.9  fps
UHD Graphics 605:
21.6  fps
med. 1366x768
HD Graphics 510:
25.2  fps
UHD Graphics 605:
15.8  fps
low 1280x720
HD Graphics 510:
66.2  fps
UHD Graphics 605:
32.5 33.7 35 35.9 36.5 49.5 ~ 37 fps
med. 1366x768
HD Graphics 510:
41.8  fps
UHD Graphics 605:
11.5 14 14.3 14.3 15.1 18.6 ~ 15 fps
high 1920x1080
UHD Graphics 605:
5.9 6.7 7.4 7.8 10.6 ~ 8 fps
ultra 1920x1080
UHD Graphics 605:
5.9 6.7 10 ~ 8 fps
ultra 1920x1080
UHD Graphics 605:
1.2  fps
low 1024x768
HD Graphics 510:
110.4  fps
UHD Graphics 605:
42  fps
med. 1366x768
HD Graphics 510:
19.3  fps
UHD Graphics 605:
12.5  fps
GTA V

GTA V

2015
low 1024x768
HD Graphics 510:
30.9  fps
UHD Graphics 605:
9.5 11.6 11.7 ~ 11 fps
med. 1366x768
HD Graphics 510:
26.8  fps
UHD Graphics 605:
9.3  fps
low 1024x768
HD Graphics 510:
31.5  fps
UHD Graphics 605:
10.9  fps
med. 1366x768
HD Graphics 510:
22.2  fps
UHD Graphics 605:
9.5  fps
high 1920x1080
UHD Graphics 605:
4  fps
low 1024x768
UHD Graphics 605:
7.8  fps
med. 1366x768
UHD Graphics 605:
6.2  fps
F1 2014

F1 2014

2014
low 1024x768
HD Graphics 510:
72  fps
UHD Graphics 605:
31  fps
med. 1366x768
HD Graphics 510:
47  fps
UHD Graphics 605:
20  fps
high 1920x1080
UHD Graphics 605:
13  fps
low 1024x768
UHD Graphics 605:
17.5  fps
med. 1366x768
UHD Graphics 605:
13.1  fps
low 1280x720
UHD Graphics 605:
14.4  fps
med. 1344x756
UHD Graphics 605:
9.3  fps
Sims 4

Sims 4

2014
low 1024x768
HD Graphics 510:
173.7  fps
UHD Graphics 605:
96.9  fps
med. 1366x768
HD Graphics 510:
32.2  fps
UHD Graphics 605:
21.8  fps
high 1920x1080
UHD Graphics 605:
10.5  fps
low 1024x768
UHD Graphics 605:
14.3  fps
med. 1366x768
UHD Graphics 605:
9.5  fps
low 1024x768
HD Graphics 510:
135.5  fps
UHD Graphics 605:
58.5  fps
med. 1366x768
HD Graphics 510:
32.8  fps
UHD Graphics 605:
16.5  fps
high 1920x1080
UHD Graphics 605:
12.5  fps
low 1024x768
HD Graphics 510:
33.4  fps
med. 1366x768
HD Graphics 510:
22.5  fps
high 1366x768
HD Graphics 510:
15.9  fps
GRID 2

GRID 2

2013
low 1024x768
UHD Graphics 605:
34.7  fps
med. 1366x768
UHD Graphics 605:
17.1  fps
low 1280x720
HD Graphics 510:
39  fps
UHD Graphics 605:
14.8 20.1 23.5 24.4 25.3 26.4 26.9 27.4 33.2 ~ 25 fps
med. 1366x768
HD Graphics 510:
20.1  fps
UHD Graphics 605:
10.8 11.1 13.2 13.5 13.7 14.7 16.6 17.2 ~ 14 fps
high 1366x768
HD Graphics 510:
17.7  fps
UHD Graphics 605:
9.4 9.5 10.4 11.6 11.6 12.2 12.9 15.2 ~ 12 fps
ultra 1920x1080
UHD Graphics 605:
2.8 3.3 4.2 4.3 ~ 4 fps
low 1024x768
HD Graphics 510:
52.7  fps
UHD Graphics 605:
31.6  fps
med. 1366x768
HD Graphics 510:
23.9  fps
UHD Graphics 605:
18.5  fps
high 1366x768
HD Graphics 510:
16.2  fps
UHD Graphics 605:
12.5  fps
low 1024x768
UHD Graphics 605:
32.3  fps
med. 1366x768
UHD Graphics 605:
17.1  fps
high 1366x768
UHD Graphics 605:
14.1  fps
low 1024x768
UHD Graphics 605:
44.4 48.4 ~ 46 fps
med. 1366x768
UHD Graphics 605:
26.4 27.5 ~ 27 fps
high 1366x768
UHD Graphics 605:
16.4 17.1 ~ 17 fps
low 1024x768
UHD Graphics 605:
28.8  fps
med. 1366x768
UHD Graphics 605:
21.1  fps
high 1366x768
UHD Graphics 605:
18.6  fps
ultra 1920x1080
UHD Graphics 605:
12.5  fps
Anno 2070

Anno 2070

2011
low 1024x768
UHD Graphics 605:
35  fps
med. 1366x768
UHD Graphics 605:
18  fps
high 1366x768
UHD Graphics 605:
11.4  fps
low 1280x720
UHD Graphics 605:
19.9  fps
med. 1366x768
UHD Graphics 605:
12.3  fps
high 1366x768
UHD Graphics 605:
7.5  fps
low 1024x768
UHD Graphics 605:
27.4  fps
high 1366x768
UHD Graphics 605:
21.2  fps
ultra 1920x1080
UHD Graphics 605:
6.7  fps
Dirt 3

Dirt 3

2011
low 800x600
UHD Graphics 605:
55.6  fps
med. 1024x768
UHD Graphics 605:
22.7  fps
high 1360x768
UHD Graphics 605:
15.2  fps
ultra 1920x1080
UHD Graphics 605:
12.5  fps
low 1024x768
UHD Graphics 605:
78.7  fps
med. 1360x768
UHD Graphics 605:
17.4  fps
high 1360x768
UHD Graphics 605:
10  fps
ultra 1920x1080
UHD Graphics 605:
3.9  fps
Intel UHD Graphics 605lowmed.highultraQHD4K
Hearthstone31.1
F1 20198
League of Legends49.83926.624.923.615
Total War: Three Kingdoms9
Anno 18005.8
The Division 21
Dirt Rally 2.015
Far Cry New Dawn1
Apex Legends7.2
Assassin´s Creed Odyssey4
Forza Horizon 44
Shadow of the Tomb Raider4
Strange Brigade8.5
F1 201812
Monster Hunter World4.6
The Crew 28.8
Far Cry 53
World of Tanks enCore538.9
X-Plane 11.11755
Kingdom Come: Deliverance5.5
Final Fantasy XV Benchmark53.27
ELEX5.2
Middle-earth: Shadow of War7
F1 201713
Team Fortress 2403618
Dirt 418.8
Rocket League2610
Prey5.5
Ghost Recon Wildlands3.2
For Honor9
Resident Evil 77.9
Civilization VI12.75.5
Overwatch11.48.3
The Division4.3
Rise of the Tomb Raider6.9
Rainbow Six Siege12.3
World of Warships2414.3
Metal Gear Solid V21.615.8
Dota 2 Reborn371588
The Witcher 31.2
Dirt Rally4212.5
GTA V119.29
Battlefield Hardline10.99.54
Dragon Age: Inquisition7.86.2
F1 2014312013
Alien: Isolation17.513.1
Middle-earth: Shadow of Mordor14.49.3
Sims 496.921.810.5
Risen 3: Titan Lords14.39.5
GRID: Autosport58.516.512.5
GRID 234.717.1
BioShock Infinite2514124
Tomb Raider31.618.512.5
Dead Space 332.317.114.1
Counter-Strike: GO462717
Diablo III28.821.118.612.5
Anno 2070351811.4
The Elder Scrolls V: Skyrim19.912.37.5
Deus Ex Human Revolution27.421.26.7
Dirt 355.622.715.212.5
StarCraft 278.717.4103.9
< 30 fps
< 60 fps
< 120 fps
≥ 120 fps
44
14
2
29
2

18


8


1


1


Intel HD Graphics 510lowmed.highultraQHD4K
Resident Evil 718.3
Titanfall 219.915.4
Farming Simulator 1770.641.3
Civilization VI24.59.4
The Division13.47.7
Rise of the Tomb Raider11.17
Rainbow Six Siege2515.9
Anno 220519.911
World of Warships48.729.2
Metal Gear Solid V38.925.2
Dota 2 Reborn66.241.8
Dirt Rally110.419.3
GTA V30.926.8
Battlefield Hardline31.522.2
F1 20147247
Sims 4173.732.2
GRID: Autosport135.532.8
Battlefield 433.422.515.9
BioShock Infinite3920.117.7
Tomb Raider52.723.916.2
< 30 fps
< 60 fps
< 120 fps
≥ 120 fps
7
7
4
2
14
5

3


Eine Liste mit weiteren Spielen und allen Grafikkarten finden Sie auf unserer Seite: Welches Spiel ist mit welcher Grafikkarte spielbar?

v1.26
log 23. 08:58:42

#0 checking url part for id 7172 +0s ... 0s

#1 checking url part for id 6475 +0s ... 0s

#2 checking url part for id 8270 +0s ... 0s

#3 not redirecting to Ajax server +0s ... 0s

#4 did not recreate cache, as it is less than 5 days old! Created at Mon, 22 Apr 2024 05:40:21 +0200 +0.001s ... 0.001s

#5 composed specs +0.12s ... 0.121s

#6 did output specs +0s ... 0.121s

#7 start showIntegratedCPUs +0s ... 0.121s

#8 getting avg benchmarks for device 7172 +0.035s ... 0.156s

#9 got single benchmarks 7172 +0.006s ... 0.162s

#10 getting avg benchmarks for device 6475 +0.017s ... 0.178s

#11 got single benchmarks 6475 +0.015s ... 0.193s

#12 getting avg benchmarks for device 8270 +0.015s ... 0.209s

#13 got single benchmarks 8270 +0.046s ... 0.255s

#14 got avg benchmarks for devices +0s ... 0.255s

#15 min, max, avg, median took s +0.286s ... 0.541s

#16 before gaming benchmark output +0s ... 0.541s

#17 Got 231 rows for game benchmarks. +0.025s ... 0.566s

#18 composed SQL query for gamebenchmarks +0s ... 0.566s

#19 got data and put it in $dataArray +0.043s ... 0.61s

#20 benchmarks composed for output. +0.148s ... 0.758s

#21 calculated avg scores. +0s ... 0.758s

#22 return log +0.003s ... 0.761s

Teilen Sie diesen Artikel, um uns zu unterstützen. Jeder Link hilft!
> Notebook Test, Laptop Test und News > Benchmarks / Technik > Benchmarks / Technik > Grafikkarten Vergleich - Head 2 Head
Autor: Klaus Hinum,  8.09.2017 (Update:  1.07.2023)