Notebookcheck Logo

Apple M1 7-Core GPU vs Apple M1 Max 24-Core GPU

Apple M1 7-Core GPU

► remove from comparison Apple M1 7-Core GPU

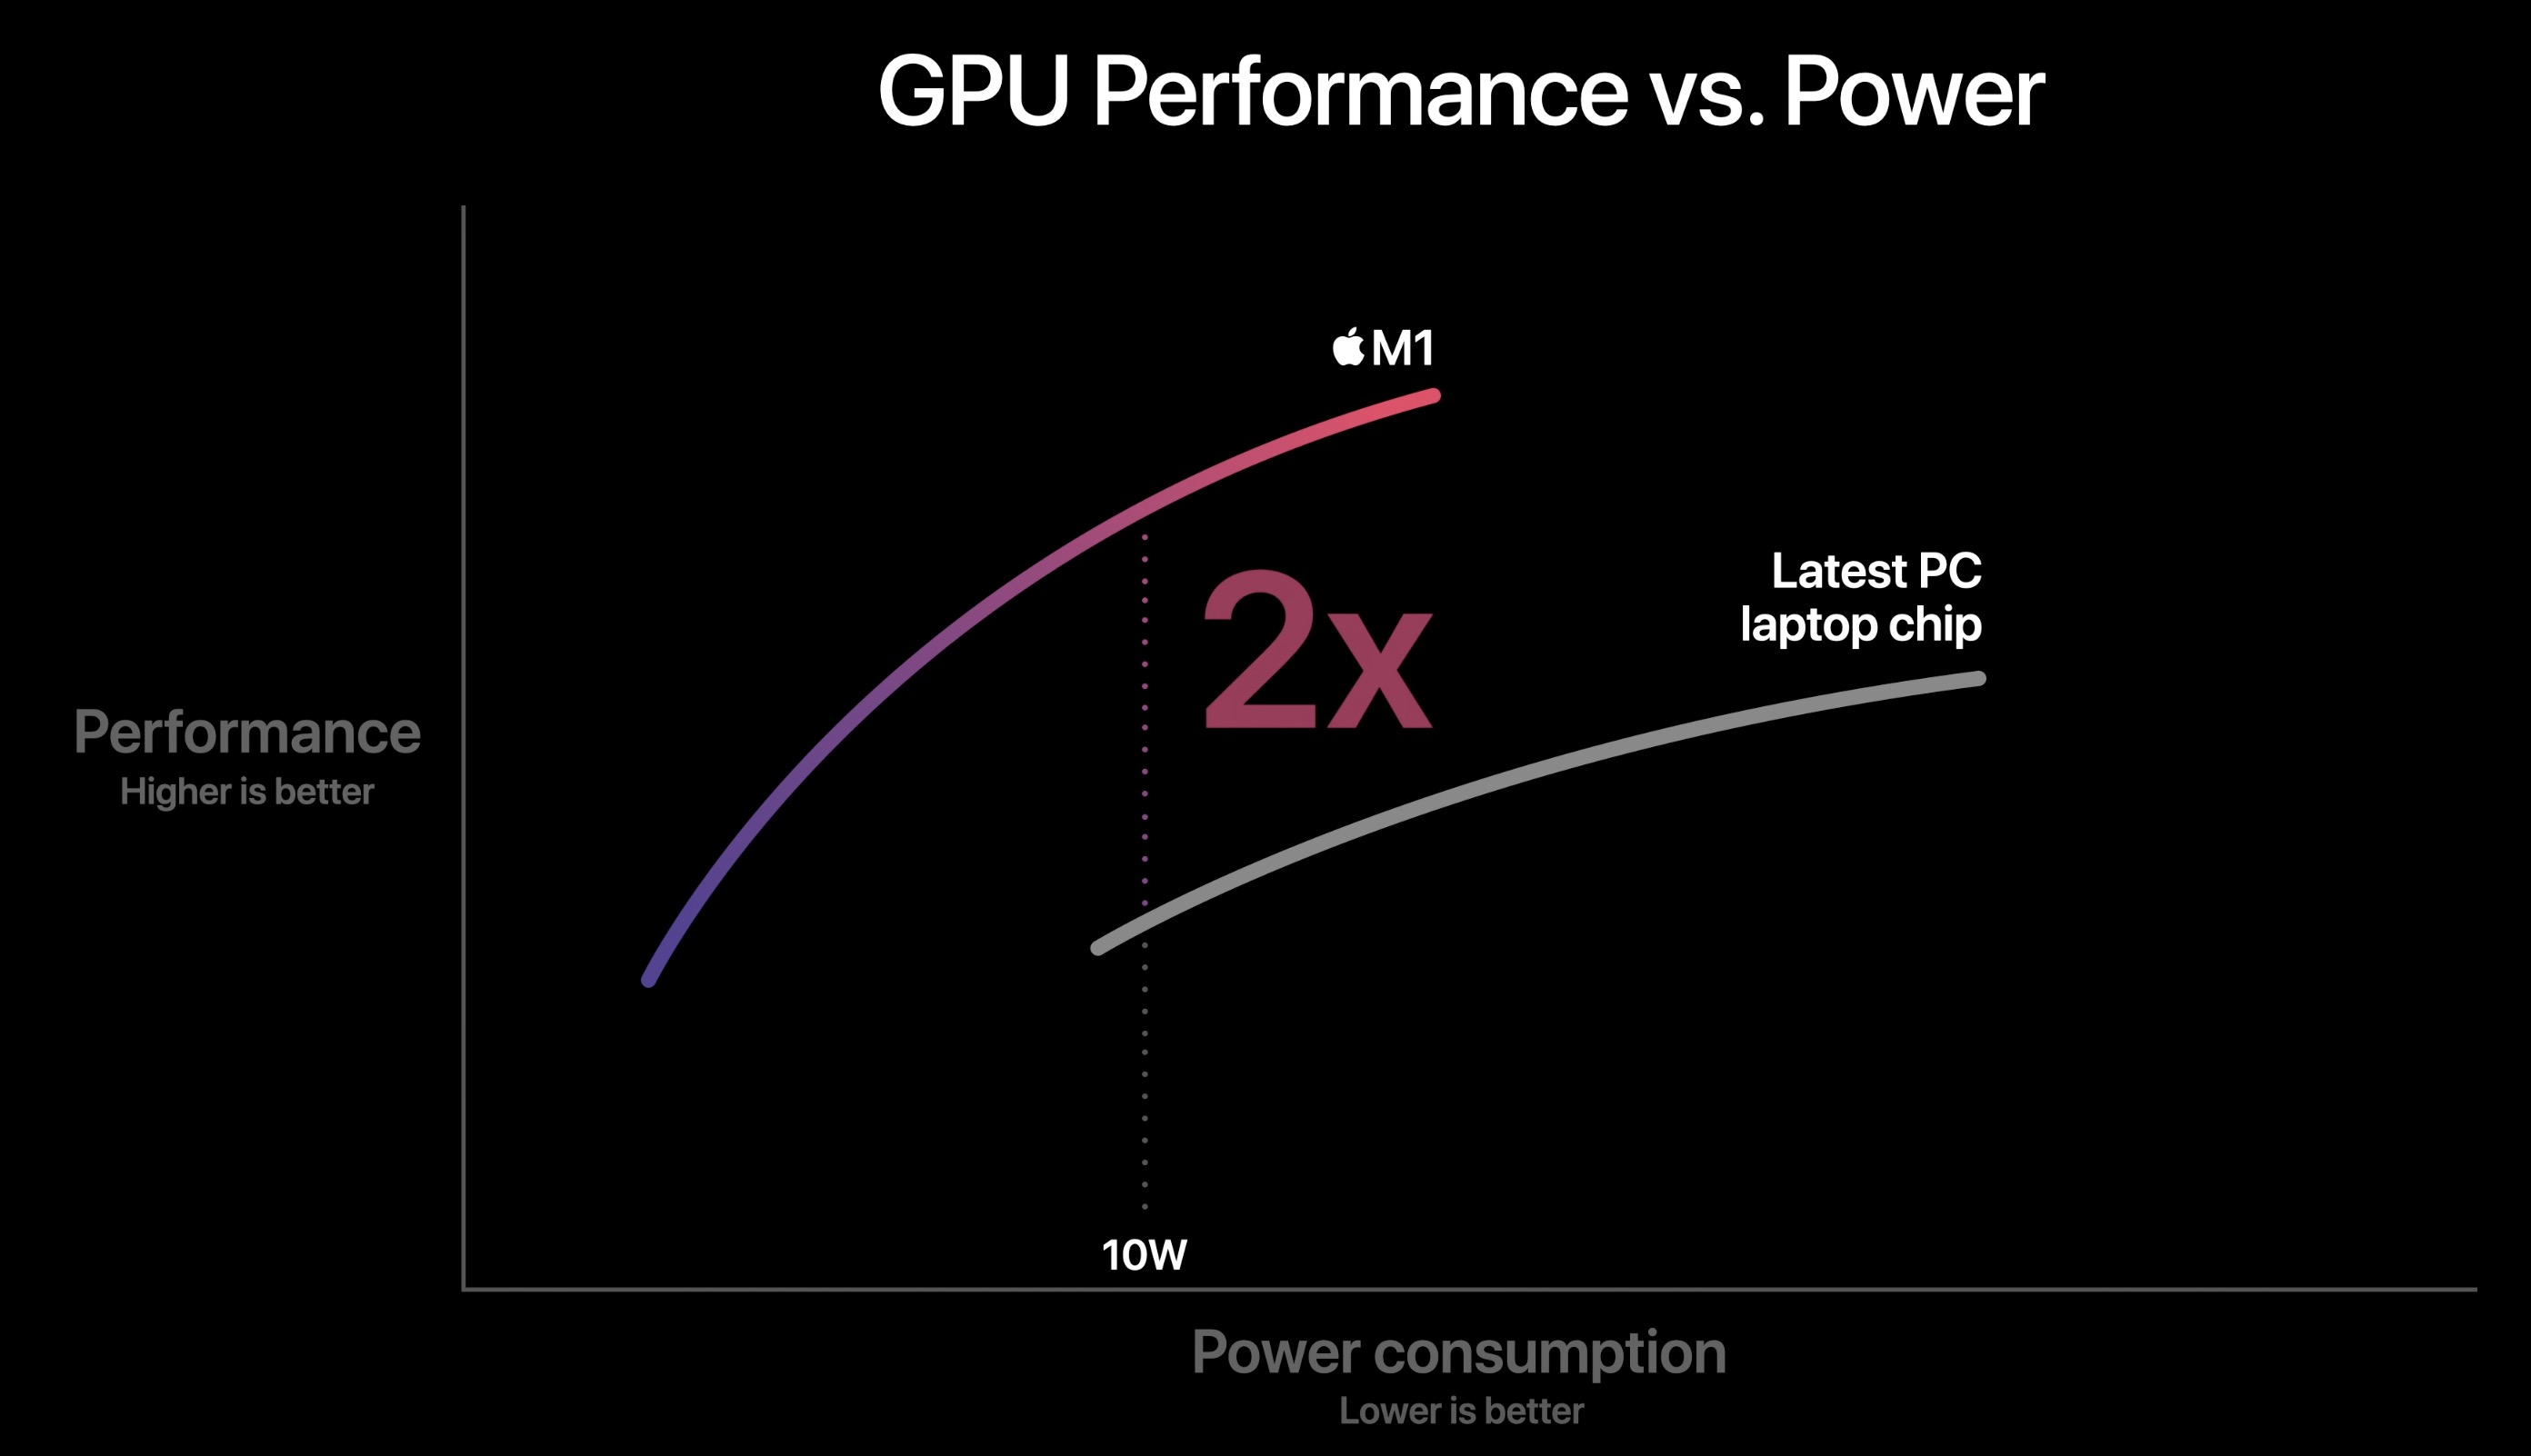
Die Apple M1 GPU ist eine selbst designte Grafikkarte im Apple M1 SoC und laut Apple mit siebender acht Kernen (im Einstiegs-MacBook Air). Die 7-Kern-Variante bietet 112 Ausführungseinheiten und eine theoretische Maximalleistung von ca. 2,3 Teraflops. Laut Apple soll die GPU schneller sein als z.b. die iGPU in Tiger Lake.

Sie unterstützt Apple's Metal 2 Schnittstelle und dürfte eine ähnliche Architektur wie die älteren PowerVR Grafikeinheiten (z.B. im Apple A10) aufweisen.

Da der SoC im 5nm Prozess bei TSMC hergestellt wird, sollte die Energieeffizienz hervorragend sein. Der Chip wird im MacBook Air mit 10 Watt betrieben (passiv gekühlt).

Apple M1 Max 24-Core GPU

► remove from comparison Apple M1 Max 24-Core GPU

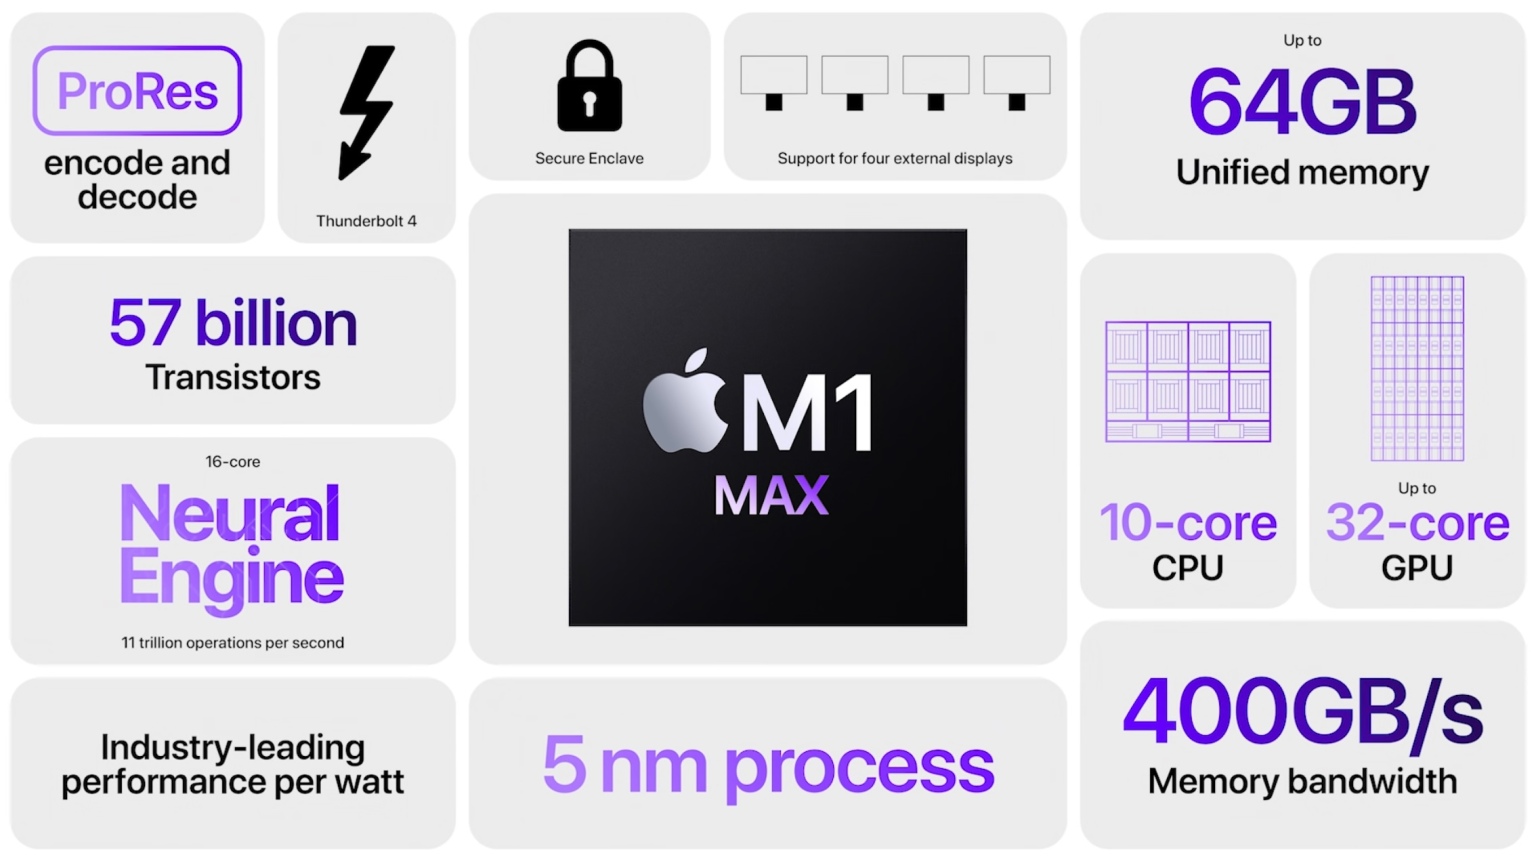
Die Apple M1 Max 24-Core GPU ist eine von Apple selbst designte Grafikkarte im Apple M1 Pro SoC und bietet 24 der 32 im Chip integrierten Grafikkerne (daher 3.072 der 4.096 ALUs). Die 32-Kern-Variante bietet eine theoretische Maximalleistung von 10,4 Teraflops, wodurch die 24-Kern-Variante ca 8 Teraflops bieten soll. Im Vergleich zum kleineren M1 Pro mit 16-Kern-GPU bietet der Max-Chip auch eine doppelt so breite Speicheranbindung (512 Bit - 400 GB/s) and den schnellen LPDDR5-6400 Unified Memory.

Die GPU kann in allen M1 Pro und Max Varianten von 389 - 1296 MHz takten und bietet keinen kurzzeitlichen Turbo (389, 486, 648, 778, 972, 1296 MHz Stufen laut Powermetrics).

Sie unterstützt Apple's Metal 2 Schnittstelle und dürfte eine ähnliche Architektur wie die älteren PowerVR Grafikeinheiten (z.B. im Apple A10) aufweisen.

Da der SoC im 5nm Prozess bei TSMC hergestellt wird, sollte die Energieeffizienz hervorragend sein.

Apple M1 7-Core GPUApple M1 Max 24-Core GPU
Apple M1 Serie
M1 Max 32-Core GPU compare 32 @ 1.3 GHz512 Bit
M1 Max 24-Core GPU 24 @ 1.3 GHz
M1 Pro 16-Core GPU compare 16 @ 1.3 GHz
M1 Pro 14-Core GPU compare 14 @ 1.3 GHz
M1 8-Core GPU compare 8 @ 1.28 GHz
M1 7-Core GPU 7 @ 1.28 GHz
M1 Max 32-Core GPU compare 32 @ 1.3 GHz512 Bit
M1 Max 24-Core GPU 24 @ 1.3 GHz
M1 Pro 16-Core GPU compare 16 @ 1.3 GHz
M1 Pro 14-Core GPU compare 14 @ 1.3 GHz
M1 8-Core GPU compare 8 @ 1.28 GHz
M1 7-Core GPU 7 @ 1.28 GHz
Pipelines7 - unified24 - unified
Kerntakt1278 MHz1296 MHz
SpeichertypLPDDR4X-4266LPDDR5-6400
Shared Memoryneinnein
Herstellungsprozess5 nm5 nm
Erscheinungsdatum10.11.2020 10.11.2020
Stromverbrauch10 Watt

Benchmarks

3DMark - 3DMark Wild Life Unlimited
16159 Points (8%)
3DMark - 3DMark Wild Life Extreme Unlimited
4515 Points (5%)
15730 Points (18%)
Unigine Heaven 3.0 - Unigine Heaven 3.0 OpenGL
36.4 fps (16%)
Blender - Blender 3.3 Classroom METAL *
956 Seconds (100%)
Cinebench R15
Cinebench R15 OpenGL 64 Bit + Apple M1 7-Core GPU
Cinebench R15 - Cinebench R15 OpenGL 64 Bit
90 fps (5%)
Cinebench R15 OpenGL 64 Bit + Apple M1 Max 24-Core GPU
94 fps (5%)
Cinebench R15 OpenGL Ref. Match 64 Bit + Apple M1 7-Core GPU
Cinebench R15 - Cinebench R15 OpenGL Ref. Match 64 Bit
99.5 % (100%)
Cinebench R15 OpenGL Ref. Match 64 Bit + Apple M1 Max 24-Core GPU
99.5 % (100%)
GFXBench - GFXBench 5.0 Aztec Ruins High Tier Offscreen
72.4 fps (13%)
240 fps (44%)
GFXBench - GFXBench 5.0 Aztec Ruins Normal Tier Offscreen
192 fps (14%)
636 fps (47%)
GFXBench - GFXBench Car Chase Offscreen
162 fps (18%)
416 fps (47%)
GFXBench 3.1 - GFXBench Manhattan ES 3.1 Offscreen
240 fps (5%)
686 fps (15%)
GFXBench 3.0 - GFXBench 3.0 Manhattan Offscreen
376 fps (22%)
1153 fps (68%)
GFXBench (DX / GLBenchmark) 2.7
GFXBench T-Rex HD Offscreen C24Z16 + Apple M1 7-Core GPU
GFXBench (DX / GLBenchmark) 2.7 - GFXBench T-Rex HD Offscreen C24Z16
620 fps (5%)
GFXBench T-Rex HD Offscreen C24Z16 + Apple M1 Max 24-Core GPU
2027 fps (16%)
Geekbench 6.2 - Geekbench 6.2 GPU OpenCL
18341 Points (5%)
Geekbench 6.2 - Geekbench 6.2 GPU Metal
30112 Points (19%)
Power Consumption - The Witcher 3 Power Consumption - external Monitor *
60 Watt (8%)
Power Consumption - Witcher 3 Power Consumption *
76.3 Watt (17%)
Power Consumption - GFXBench Aztec Ruins Normal Tier Offscreen Power Consumption 150cd *
19.5 Watt (8%)
Emissions Witcher 3 Fan Noise + Apple M1 Max 24-Core GPU
Emissions - Witcher 3 Fan Noise
35.8 dB(A) (57%)

Average Benchmarks Apple M1 7-Core GPU → 100% n=9

Average Benchmarks Apple M1 Max 24-Core GPU → 266% n=9

- Bereich der Benchmarkergebnisse für diese Grafikkarte
- Durchschnittliche Benchmarkergebnisse für diese Grafikkarte
* Smaller numbers mean a higher performance
1 This benchmark is not used for the average calculation

Spiele-Benchmarks

Die folgenden Benchmarks basieren auf unseren Spieletests mit Testnotebooks. Die Performance dieser Grafikkarte bei den gelisteten Spielen ist abhängig von der verwendeten CPU, Speicherausstattung, Treiber und auch Betriebssystem. Dadurch müssen die untenstehenden Werte nicht repräsentativ sein. Detaillierte Informationen über das verwendete System sehen Sie nach einem Klick auf den fps-Wert.

QHD 2560x1440
100%
M1 7-Core GPU:
58  fps
low 1280x720
100%
M1 7-Core GPU:
45.2  fps
127%
M1 Max 24-Core GPU:
57.2  fps
med. 1920x1080
100%
M1 7-Core GPU:
28  fps
170%
M1 Max 24-Core GPU:
47.7  fps
high 1920x1080
100%
M1 7-Core GPU:
17.7  fps
230%
M1 Max 24-Core GPU:
40.7  fps
ultra 1920x1080
M1 Max 24-Core GPU:
34.6  fps
low 1280x720
100%
M1 7-Core GPU:
95.2 (!)  fps
211%
M1 Max 24-Core GPU:
201  fps
med. 1920x1080
100%
M1 7-Core GPU:
26.3 (!)  fps
365%
M1 Max 24-Core GPU:
96  fps
high 1920x1080
100%
M1 7-Core GPU:
17.4 (!)  fps
356%
M1 Max 24-Core GPU:
62  fps
ultra 1920x1080
M1 Max 24-Core GPU:
46  fps
low 1280x720
100%
M1 7-Core GPU:
65  fps
217%
M1 Max 24-Core GPU:
141  fps
med. 1920x1080
100%
M1 7-Core GPU:
22  fps
386%
M1 Max 24-Core GPU:
85  fps
high 1920x1080
M1 Max 24-Core GPU:
79  fps
ultra 1920x1080
M1 Max 24-Core GPU:
77  fps
F1 2017

F1 2017

2017
low 1280x720
100%
M1 7-Core GPU:
60  fps
med. 1920x1080
100%
M1 7-Core GPU:
54  fps
high 1920x1080
100%
M1 7-Core GPU:
43  fps
low 1280x720
100%
M1 7-Core GPU:
43.9  fps
med. 1920x1080
100%
M1 7-Core GPU:
32.5  fps
low 1024x768
100%
M1 7-Core GPU:
80.3  fps
high 1920x1080
100%
M1 7-Core GPU:
30.1  fps
ultra 1920x1080
100%
M1 7-Core GPU:
27  fps
4K 3840x2160
100%
M1 7-Core GPU:
15.8  fps
low 1280x720
100%
M1 7-Core GPU:
47.6  fps
med. 1366x768
100%
M1 7-Core GPU:
35.3  fps
high 1920x1080
100%
M1 7-Core GPU:
19  fps
low 1024x768
100%
M1 7-Core GPU:
109  fps
high 1366x768
100%
M1 7-Core GPU:
69  fps
ultra 1920x1080
100%
M1 7-Core GPU:
44.4  fps
high 1366x768
100%
M1 7-Core GPU:
86  fps
ultra 1920x1080
100%
M1 7-Core GPU:
47  fps

Average Gaming Apple M1 7-Core GPU → 100%

Average Gaming 30-70 fps → 100%

Average Gaming Apple M1 Max 24-Core GPU → 258%

Average Gaming 30-70 fps → 221%

Apple M1 7-Core GPUlowmed.highultraQHD4K
Hearthstone58
Borderlands 345.22817.7
Total War: Three Kingdoms95.226.317.4
Shadow of the Tomb Raider6522
F1 2017605443
Warhammer 40.000: Dawn of War III43.932.5
Civilization VI80.330.12715.8
Deus Ex Mankind Divided47.635.319
Counter-Strike: GO1096944.4
Batman: Arkham City8647
< 30 fps
< 60 fps
< 120 fps
≥ 120 fps

3
5
3
3

3
2
2
1
2


1

1


Apple M1 Max 24-Core GPUlowmed.highultraQHD4K
Borderlands 357.247.740.734.6
Total War: Three Kingdoms201966246
Shadow of the Tomb Raider141857977
< 30 fps
< 60 fps
< 120 fps
≥ 120 fps

1

2

1
2

1
2

2
1


Eine Liste mit weiteren Spielen und allen Grafikkarten finden Sie auf unserer Seite: Welches Spiel ist mit welcher Grafikkarte spielbar?

Add one or more devices and compare

In the following list you can select (and also search for) devices that should be added to the comparison. You can select more than one device.

restrict list:

show all (including archived), 2024, 2023
v1.26
log 20. 00:28:34

#0 checking url part for id 10560 +0s ... 0s

#1 checking url part for id 10967 +0s ... 0s

#2 not redirecting to Ajax server +0s ... 0s

#3 did not recreate cache, as it is less than 5 days old! Created at Fri, 19 Apr 2024 05:40:26 +0200 +0.001s ... 0.001s

#4 composed specs +0.078s ... 0.079s

#5 did output specs +0s ... 0.079s

#6 start showIntegratedCPUs +0s ... 0.079s

#7 getting avg benchmarks for device 10560 +0.026s ... 0.105s

#8 got single benchmarks 10560 +0.006s ... 0.111s

#9 getting avg benchmarks for device 10967 +0.002s ... 0.113s

#10 got single benchmarks 10967 +0.006s ... 0.119s

#11 got avg benchmarks for devices +0s ... 0.119s

#12 min, max, avg, median took s +0.056s ... 0.175s

#13 before gaming benchmark output +0s ... 0.175s

#14 Got 38 rows for game benchmarks. +0.007s ... 0.183s

#15 composed SQL query for gamebenchmarks +0s ... 0.183s

#16 got data and put it in $dataArray +0.008s ... 0.191s

#17 benchmarks composed for output. +0.025s ... 0.216s

#18 calculated avg scores. +0s ... 0.216s

#19 return log +0.058s ... 0.273s

Teilen Sie diesen Artikel, um uns zu unterstützen. Jeder Link hilft!
> Notebook Test, Laptop Test und News > Benchmarks / Technik > Benchmarks / Technik > Grafikkarten Vergleich - Head 2 Head
Autor: Klaus Hinum,  8.09.2017 (Update:  1.07.2023)