Die Apple M1 GPU ist eine selbst designte Grafikkarte im Apple M1 SoC und laut Apple mit siebender acht Kernen (im Einstiegs-MacBook Air). Die 7-Kern-Variante bietet 112 Ausführungseinheiten und eine theoretische Maximalleistung von ca. 2,3 Teraflops. Laut Apple soll die GPU schneller sein als z.b. die iGPU in Tiger Lake.
Sie unterstützt Apple's Metal 2 Schnittstelle und dürfte eine ähnliche Architektur wie die älteren PowerVR Grafikeinheiten (z.B. im Apple A10) aufweisen.
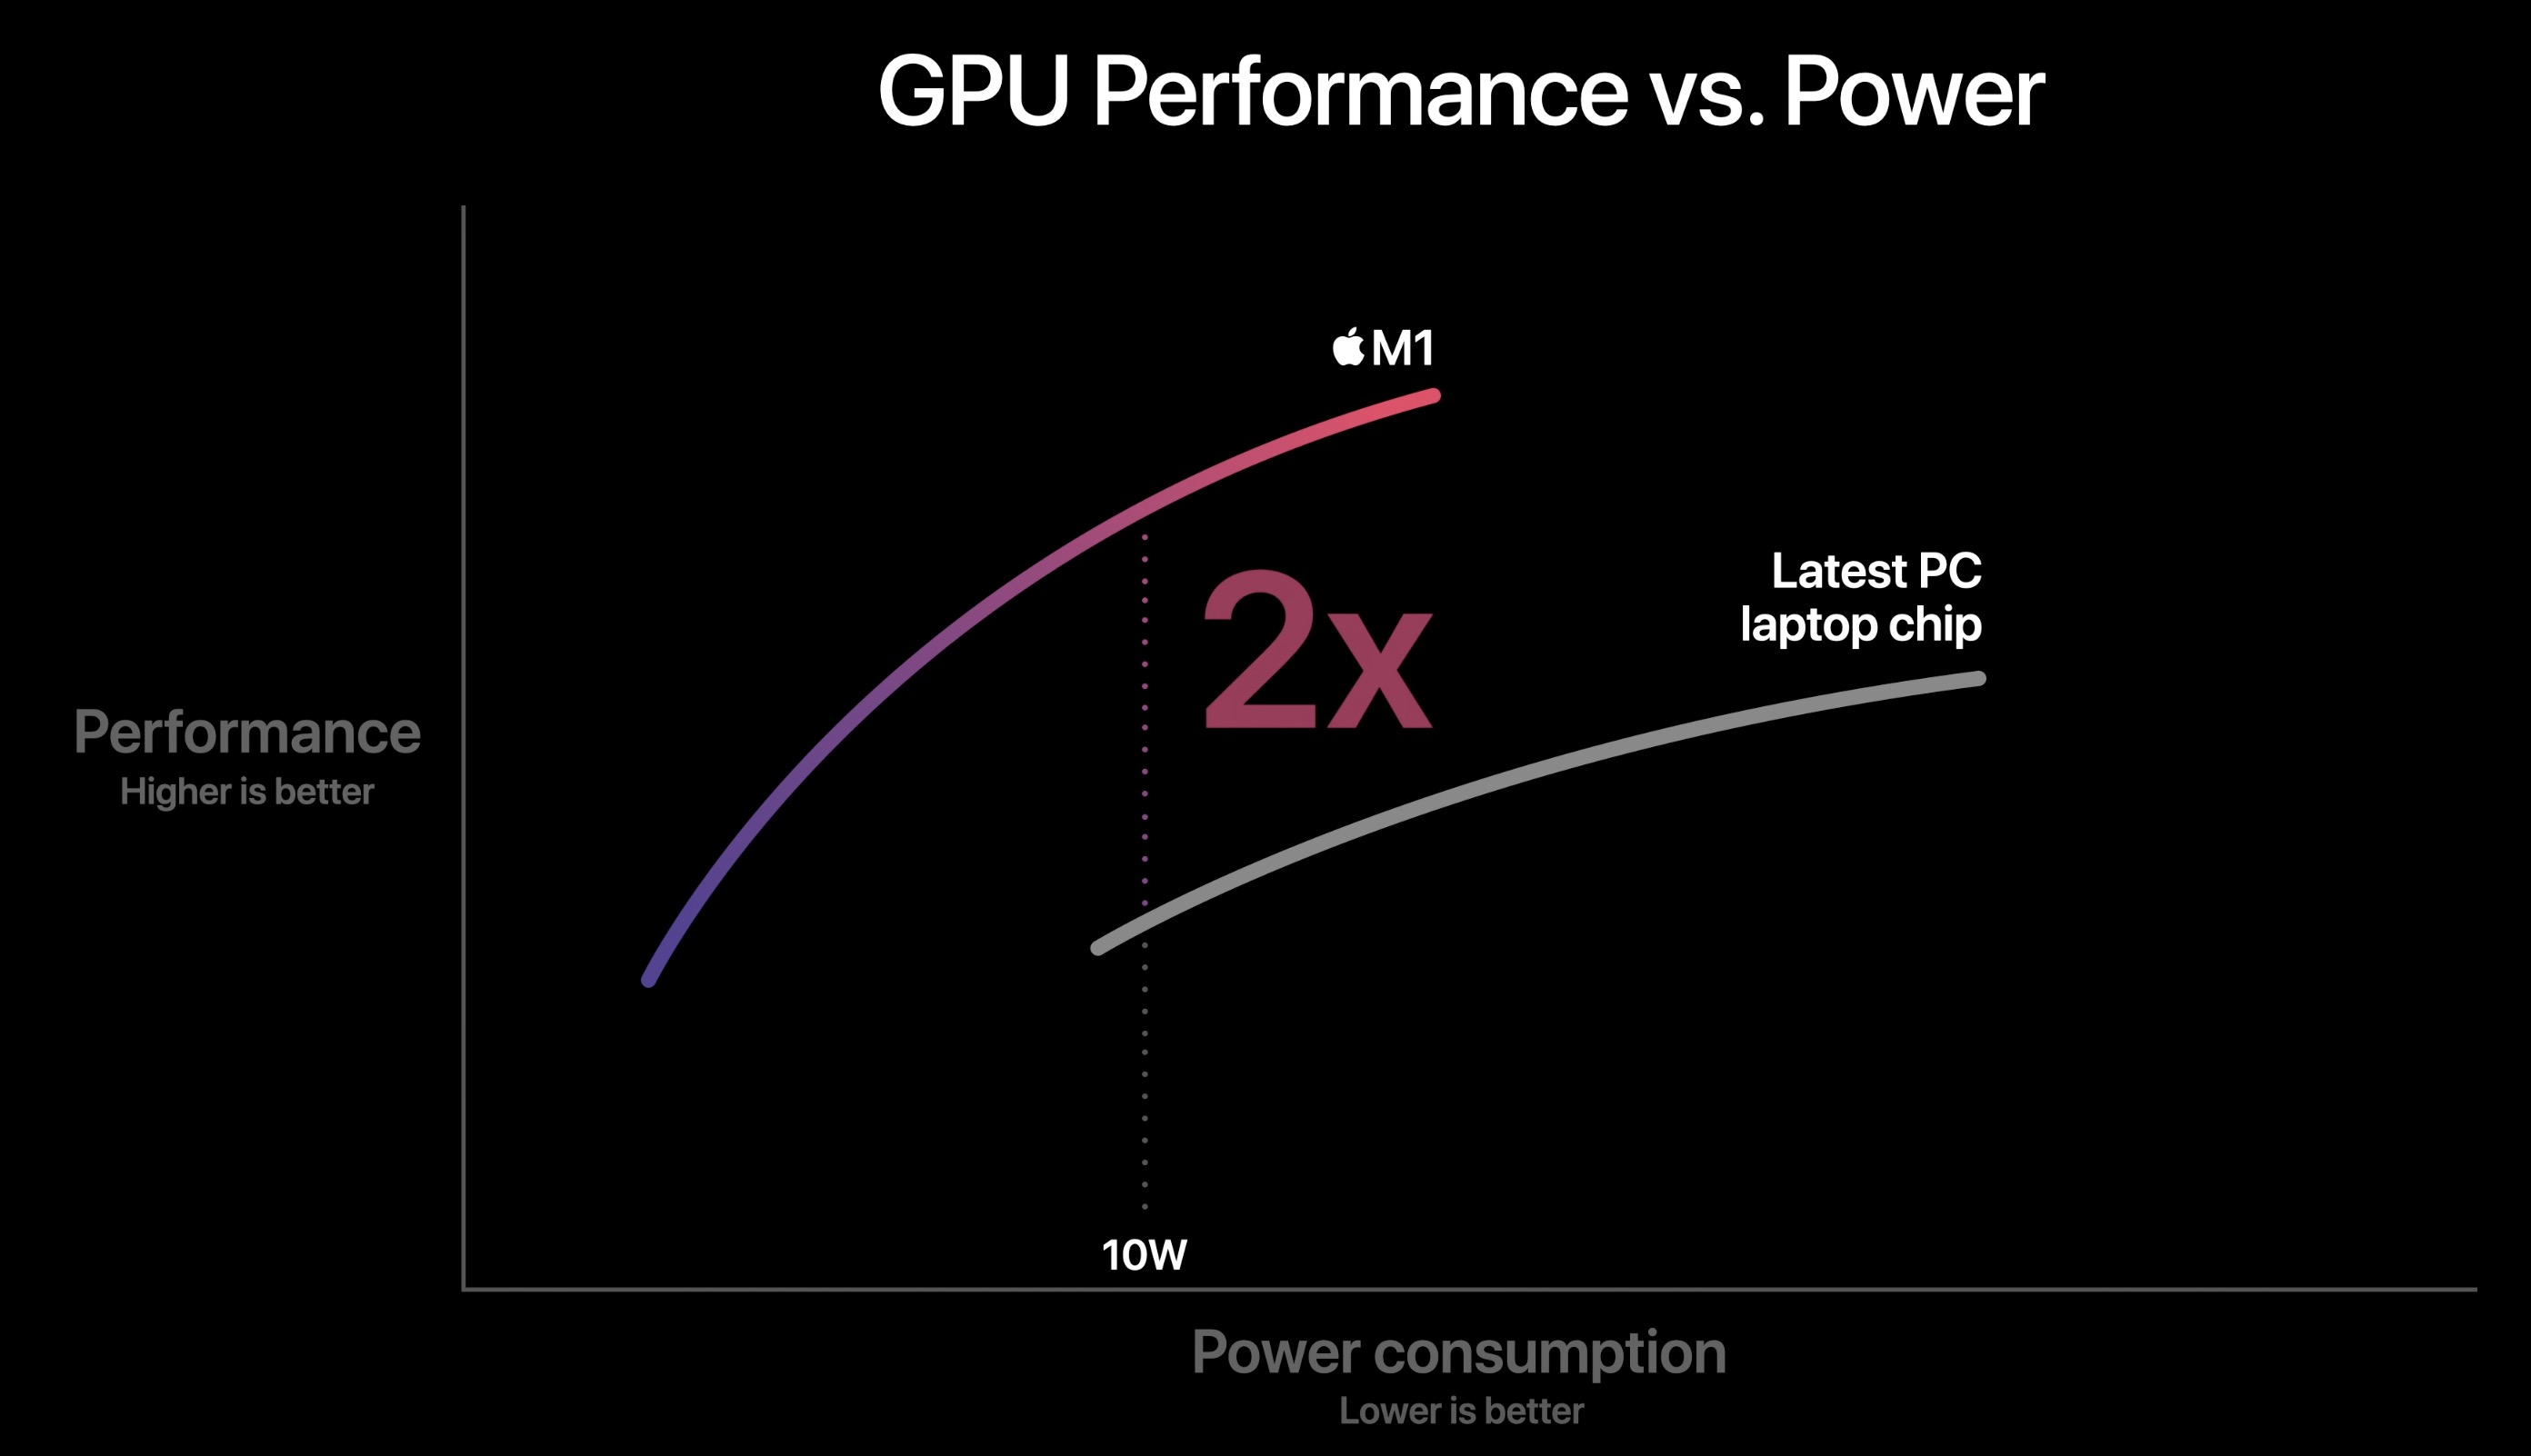
Da der SoC im 5nm Prozess bei TSMC hergestellt wird, sollte die Energieeffizienz hervorragend sein. Der Chip wird im MacBook Air mit 10 Watt betrieben (passiv gekühlt).
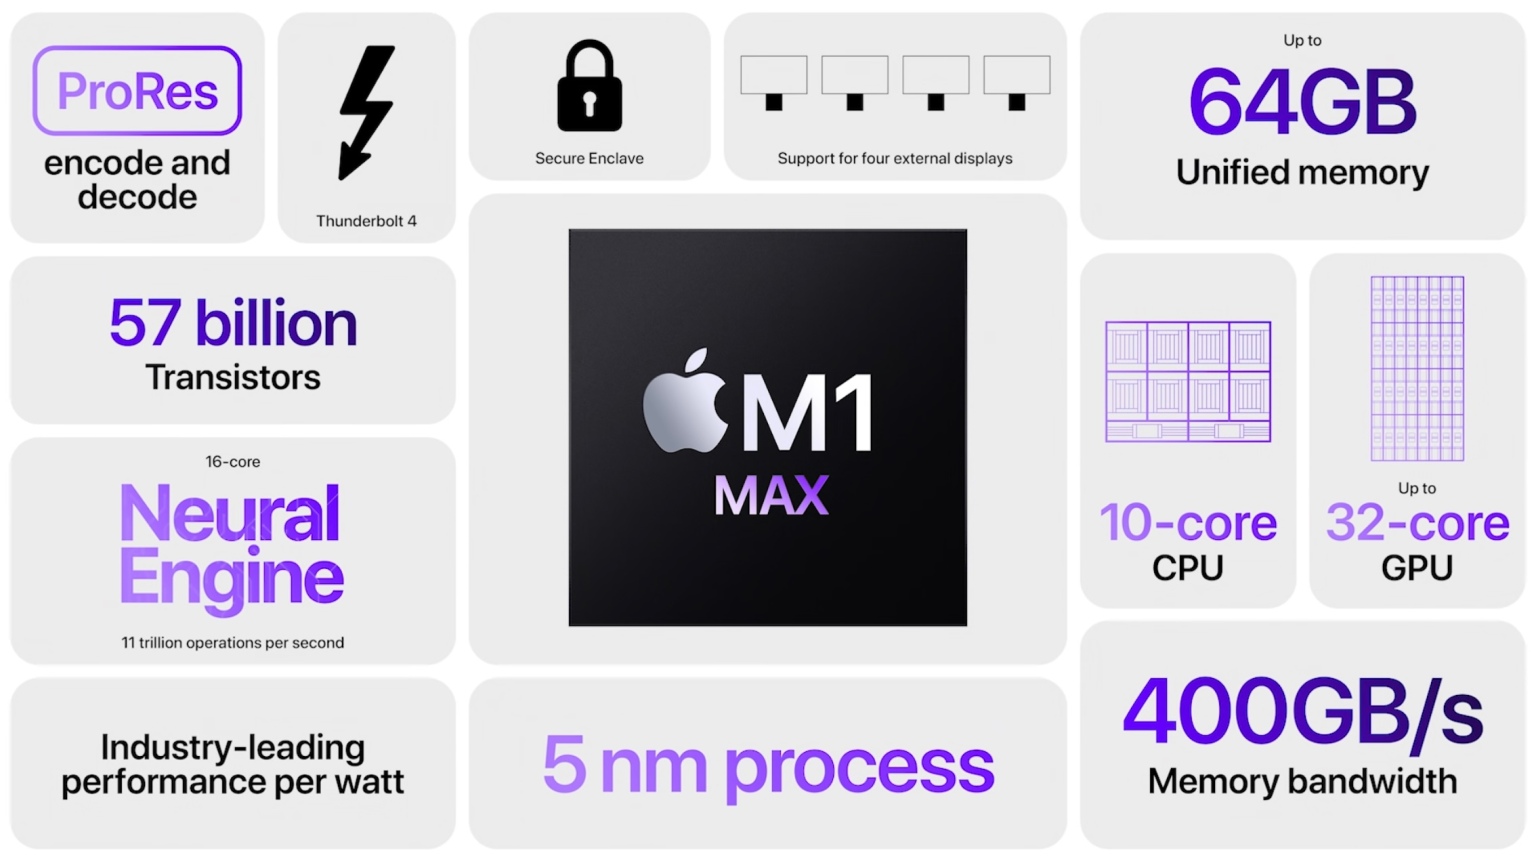
Die Apple M1 Max 32-Core GPU ist eine von Apple selbst designte Grafikkarte im Apple M1 Pro SoC und bietet alle 32 im Chip integrierten Grafikkerne (4.096 ALUs). Die 32-Kern-Variante bietet eine theoretische Maximalleistung von 10,4 Teraflops. Im Vergleich zum kleineren M1 Pro mit 16-Kern-GPU bietet der Max-Chip auch eine doppelt so breite Speicheranbindung (512 Bit - 400 GB/s) zum schnellen unified Memory (32 oder 64 GB LPDDR5-6400).
Die GPU kann in allen M1 Pro und Max Varianten von 389 - 1296 MHz takten und bietet keinen kurzzeitlichen Turbo (389, 486, 648, 778, 972, 1296 MHz Stufen laut Powermetrics).
Die GPU unterstützt Apple's Metal 2 Schnittstelle und dürfte eine ähnliche Architektur wie die älteren PowerVR Grafikeinheiten (z.B. im Apple A10) aufweisen.
Da der SoC im 5nm Prozess bei TSMC hergestellt wird, sollte die Energieeffizienz hervorragend sein.
Average Benchmarks Apple M1 Max 32-Core GPU → 325%n=10
- Bereich der Benchmarkergebnisse für diese Grafikkarte - Durchschnittliche Benchmarkergebnisse für diese Grafikkarte * Smaller numbers mean a higher performance 1 This benchmark is not used for the average calculation
Spiele-Benchmarks
Die folgenden Benchmarks basieren auf unseren Spieletests mit Testnotebooks. Die Performance dieser Grafikkarte bei den gelisteten Spielen ist abhängig von der verwendeten CPU, Speicherausstattung, Treiber und auch Betriebssystem. Dadurch müssen die untenstehenden Werte nicht repräsentativ sein. Detaillierte Informationen über das verwendete System sehen Sie nach einem Klick auf den fps-Wert.
[X]Apple MacBook Air 2020 M1 Entry Apple M1 2.1GHz M1 7-Core GPU Problem during benchmarking occured: Leichte grafische Probleme smog not perfect min: 88 fps, max: 102 fps
[X]Apple MacBook Air 2020 M1 Entry Apple M1 2.1GHz M1 7-Core GPU Problem during benchmarking occured: Schwere grafische Probleme black squares min: 22 fps, max: 28 fps
[X]Apple MacBook Air 2020 M1 Entry Apple M1 2.1GHz M1 7-Core GPU Problem during benchmarking occured: Schwere grafische Probleme min: 15 fps, max: 19 fps
 Deutsch
 English
 Español
 Français
 Italiano
 Nederlands
 Polski
 Português
 Русский
 Türkçe
 Svenska
 Chinese
 Magyar