Notebookcheck Logo

Apple M2 Max 38-Core GPU vs Apple M2 Pro 16-Core GPU

Apple M2 Max 38-Core GPU

► remove from comparison Apple M2 Max 38-Core GPU

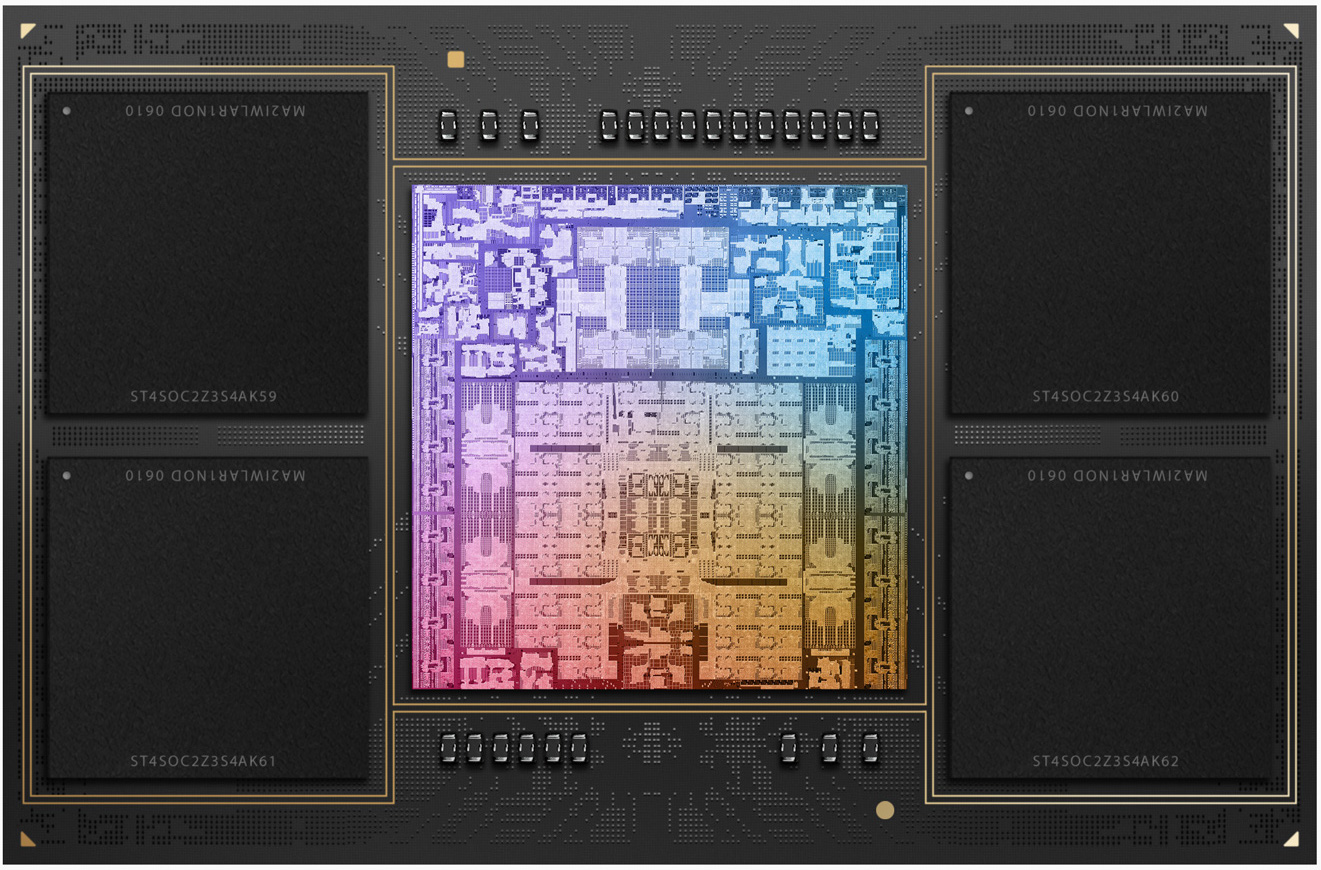
Die Apple M2 Max 38-Core GPU ist eine von Apple selbst designte Grafikkarte im Apple M2 Max SoC und laut Apple mit allen 38 Kernen. Die GPU hat keinen dedizierten Grafikspeicher aber kann auf den schnellen gemeinsamen LPDDR5-6400? Speicher (unified Memory, 32 bis 96 GB, 400 GBit Bandbreite) zugreifen.

Neu ist beim M2 Pro und Max der Support für HDMI 2.1 (8K Displays).

Die iGPU unterstützt Apple's Metal 2 Schnittstelle und dürfte eine ähnliche Architektur wie die älteren PowerVR Grafikeinheiten (z.B. im Apple A10) aufweisen.

Da der SoC im 5nm Prozess bei TSMC hergestellt wird, sollte die Energieeffizienz hervorragend sein. Laut powermetrics braucht die GPU bis zu 53,6 Watt (Chip inkl. CPU gesamt 89 Watt).

Apple M2 Pro 16-Core GPU

► remove from comparison Apple M2 Pro 16-Core GPU

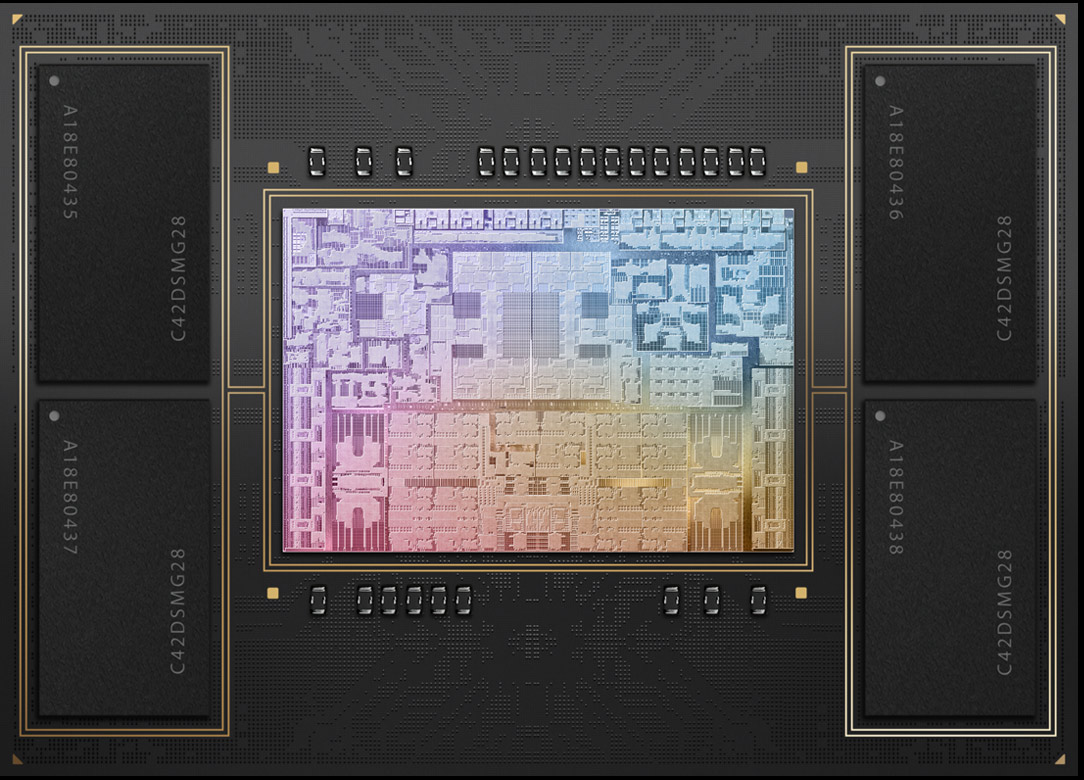
Die Apple M2 Pro 16-Core GPU ist eine von Apple selbst designte Grafikkarte im Apple M2 Pro 10-Kern SoC und laut Apple mit 16 der 19 Kernen aktiviert (aktuell im Einstiegs-MacBook Pro 14 verbaut). Die GPU hat keinen dedizierten Grafikspeicher aber kann auf den schnellen gemeinsamen LPDDR5-6400? Speicher (unified Memory, 16 oder 32 GB) zugreifen.

Laut Apple soll die 19-Kern-Variante GPU 30% schneller sein als die alte 16-Kern GPU im M1 Pro sein. Daher sollte die 16-Kern-Variante ebenfalls schneller sein als die 16-Kern GPU im M1 Pro (aber nur minimal) und natürlich den direkten Vorgänger mit 14-Kernen deutlich abhängen.

Neu ist beim M2 Pro der Support für HDMI 2.1 (8K Displays).

Die iGPU unterstützt Apple's Metal 2 Schnittstelle und dürfte eine ähnliche Architektur wie die älteren PowerVR Grafikeinheiten (z.B. im Apple A10) aufweisen.

Da der SoC im 5nm Prozess bei TSMC hergestellt wird, sollte die Energieeffizienz hervorragend sein.

Apple M2 Max 38-Core GPUApple M2 Pro 16-Core GPU
Apple M2 Serie
M2 Max 38-Core GPU 38
M2 Max 30-Core GPU compare 30
M2 Pro 19-Core GPU compare 19 @ 0.44 - 1.4 GHz
M2 Pro 16-Core GPU 16
M2 10-Core GPU compare 10 @ 1.4 GHz
M2 8-Core GPU compare 8 @ 1.4 GHz
M2 Max 38-Core GPU 38
M2 Max 30-Core GPU compare 30
M2 Pro 19-Core GPU compare 19 @ 0.44 - 1.4 GHz
M2 Pro 16-Core GPU 16
M2 10-Core GPU compare 10 @ 1.4 GHz
M2 8-Core GPU compare 8 @ 1.4 GHz
Pipelines38 - unified16 - unified
SpeichertypLPDDR5-6400LPDDR5-6400
Shared Memoryneinnein
Stromverbrauch53 Watt
Herstellungsprozess5 nm5 nm
Notebookgrößemittel (15.4" z.B.)mittel (15.4" z.B.)
Erscheinungsdatum17.01.2023 17.01.2023
CPU in M2 Max 38-Core GPUGPU Base SpeedGPU Boost / Turbo
Apple M2 Max12 x 2424 MHz, 79 W? MHz? MHz
CPU in M2 Pro 16-Core GPUGPU Base SpeedGPU Boost / Turbo
Apple M2 Pro 10-Core10 x 2424 MHz? MHz? MHz

Benchmarks

3DMark - 3DMark Wild Life Extreme Unlimited
25103 Points (29%)
11224 Points (13%)
Blender - Blender 3.3 Classroom METAL *
51.2 Seconds (5%)
132 Seconds (14%)
Cinebench R15
Cinebench R15 OpenGL 64 Bit + Apple M2 Max 38-Core GPU
Cinebench R15 - Cinebench R15 OpenGL 64 Bit
147.5 fps (9%)
Cinebench R15 OpenGL 64 Bit + Apple M2 Pro 16-Core GPU
141.9 fps (8%)
Cinebench R15 OpenGL Ref. Match 64 Bit + Apple M2 Max 38-Core GPU
Cinebench R15 - Cinebench R15 OpenGL Ref. Match 64 Bit
99.5 % (100%)
Cinebench R15 OpenGL Ref. Match 64 Bit + Apple M2 Pro 16-Core GPU
99.5 % (100%)
GFXBench - GFXBench 5.0 4K Aztec Ruins High Tier Offscreen
179.9 fps (73%)
78.7 fps (32%)
GFXBench - GFXBench 5.0 Aztec Ruins High Tier Offscreen
397.6 fps (72%)
181.1 fps (33%)
GFXBench - GFXBench 5.0 Aztec Ruins Normal Tier Offscreen
950 fps (70%)
493 fps (37%)
GFXBench - GFXBench Car Chase Offscreen
585 fps (66%)
389 fps (44%)
GFXBench 3.1 - GFXBench Manhattan ES 3.1 Offscreen
1294 fps (27%)
659 fps (14%)
GFXBench 3.0 - GFXBench 3.0 Manhattan Offscreen
1708 fps (100%)
1011 fps (59%)
GFXBench (DX / GLBenchmark) 2.7
GFXBench T-Rex HD Offscreen C24Z16 + Apple M2 Max 38-Core GPU
GFXBench (DX / GLBenchmark) 2.7 - GFXBench T-Rex HD Offscreen C24Z16
3185 fps (25%)
GFXBench T-Rex HD Offscreen C24Z16 + Apple M2 Pro 16-Core GPU
1815 fps (14%)
Power Consumption - The Witcher 3 Power Consumption - external Monitor *
80.7 Watt (11%)
47.8 Watt (7%)
Power Consumption - Witcher 3 Power Consumption *
92 Watt (20%)
46.6 Watt (10%)
Power Consumption - Witcher 3 ultra Power Efficiency
1 fps per Watt (96%)
Power Consumption - Witcher 3 ultra Power Efficiency - external Monitor
0.9 fps per Watt (78%)
Emissions Witcher 3 Fan Noise + Apple M2 Max 38-Core GPU
Emissions - Witcher 3 Fan Noise
35.1 dB(A) (56%)

Average Benchmarks Apple M2 Max 38-Core GPU → 100% n=11

Average Benchmarks Apple M2 Pro 16-Core GPU → 64% n=11

- Bereich der Benchmarkergebnisse für diese Grafikkarte
- Durchschnittliche Benchmarkergebnisse für diese Grafikkarte
* Smaller numbers mean a higher performance
1 This benchmark is not used for the average calculation

Spiele-Benchmarks

Die folgenden Benchmarks basieren auf unseren Spieletests mit Testnotebooks. Die Performance dieser Grafikkarte bei den gelisteten Spielen ist abhängig von der verwendeten CPU, Speicherausstattung, Treiber und auch Betriebssystem. Dadurch müssen die untenstehenden Werte nicht repräsentativ sein. Detaillierte Informationen über das verwendete System sehen Sie nach einem Klick auf den fps-Wert.

low 1280x720
M2 Pro 16-Core GPU:
80.8  fps
med. 1920x1080
100%
M2 Max 38-Core GPU:
72  fps
72%
M2 Pro 16-Core GPU:
52  fps
high 1920x1080
100%
M2 Max 38-Core GPU:
60.2  fps
63%
M2 Pro 16-Core GPU:
38  fps
ultra 1920x1080
100%
M2 Max 38-Core GPU:
48.6  fps
59%
M2 Pro 16-Core GPU:
28.9  fps
low 1280x720
100%
M2 Max 38-Core GPU:
330  fps
78%
M2 Pro 16-Core GPU:
258  fps
med. 1920x1080
100%
M2 Max 38-Core GPU:
147  fps
51%
M2 Pro 16-Core GPU:
75  fps
high 1920x1080
100%
M2 Max 38-Core GPU:
96  fps
50%
M2 Pro 16-Core GPU:
48  fps
ultra 1920x1080
100%
M2 Max 38-Core GPU:
71  fps
51%
M2 Pro 16-Core GPU:
36  fps
QHD 2560x1440
100%
M2 Max 38-Core GPU:
47  fps
47%
M2 Pro 16-Core GPU:
22  fps
low 1280x720
100%
M2 Max 38-Core GPU:
182  fps
87%
M2 Pro 16-Core GPU:
159  fps
med. 1920x1080
100%
M2 Max 38-Core GPU:
131  fps
55%
M2 Pro 16-Core GPU:
72  fps
high 1920x1080
100%
M2 Max 38-Core GPU:
122  fps
53%
M2 Pro 16-Core GPU:
65  fps
ultra 1920x1080
100%
M2 Max 38-Core GPU:
109  fps
52%
M2 Pro 16-Core GPU:
57  fps
QHD 2560x1440
100%
M2 Max 38-Core GPU:
78  fps
46%
M2 Pro 16-Core GPU:
36  fps
high 1920x1080
100%
M2 Max 38-Core GPU:
83  fps
61%
M2 Pro 16-Core GPU:
51  fps
ultra 1920x1080
100%
M2 Max 38-Core GPU:
76  fps
59%
M2 Pro 16-Core GPU:
45  fps
GTA V

GTA V

2015
low 1024x768
100%
M2 Max 38-Core GPU:
84  fps
90%
M2 Pro 16-Core GPU:
76  fps
med. 1366x768
100%
M2 Max 38-Core GPU:
81  fps
90%
M2 Pro 16-Core GPU:
73  fps
high 1920x1080
100%
M2 Max 38-Core GPU:
57  fps
81%
M2 Pro 16-Core GPU:
46  fps

Average Gaming Apple M2 Max 38-Core GPU → 100%

Average Gaming 30-70 fps → 100%

Average Gaming Apple M2 Pro 16-Core GPU → 64%

Average Gaming 30-70 fps → 59%

Apple M2 Pro 16-Core GPUlowmed.highultraQHD4K
Borderlands 380.8523828.9
Total War: Three Kingdoms25875483622
Shadow of the Tomb Raider15972655736
The Witcher 35145
GTA V767346
< 30 fps
< 60 fps
< 120 fps
≥ 120 fps


2
2

1
3

4
1
1
3

1
1


Apple M2 Max 38-Core GPUlowmed.highultraQHD4K
Borderlands 37260.248.6
Total War: Three Kingdoms330147967147
Shadow of the Tomb Raider18213112210978
The Witcher 38376
GTA V848157
< 30 fps
< 60 fps
< 120 fps
≥ 120 fps


1
2


2
2

1
3
1

1
3

1
1


Eine Liste mit weiteren Spielen und allen Grafikkarten finden Sie auf unserer Seite: Welches Spiel ist mit welcher Grafikkarte spielbar?

Add one or more devices and compare

In the following list you can select (and also search for) devices that should be added to the comparison. You can select more than one device.

restrict list:

show all (including archived), 2024, 2023
v1.26
log 24. 11:24:04

#0 checking url part for id 11574 +0s ... 0s

#1 checking url part for id 11570 +0s ... 0s

#2 not redirecting to Ajax server +0s ... 0s

#3 did not recreate cache, as it is less than 5 days old! Created at Mon, 22 Apr 2024 05:40:21 +0200 +0.001s ... 0.001s

#4 composed specs +0.1s ... 0.101s

#5 did output specs +0s ... 0.101s

#6 start showIntegratedCPUs +0s ... 0.101s

#7 getting avg benchmarks for device 11574 +0.026s ... 0.127s

#8 got single benchmarks 11574 +0.008s ... 0.136s

#9 getting avg benchmarks for device 11570 +0.002s ... 0.138s

#10 got single benchmarks 11570 +0.008s ... 0.145s

#11 got avg benchmarks for devices +0s ... 0.145s

#12 min, max, avg, median took s +0.065s ... 0.21s

#13 before gaming benchmark output +0s ... 0.21s

#14 Got 55 rows for game benchmarks. +0.009s ... 0.219s

#15 composed SQL query for gamebenchmarks +0s ... 0.219s

#16 got data and put it in $dataArray +0.004s ... 0.223s

#17 benchmarks composed for output. +0.013s ... 0.236s

#18 calculated avg scores. +0s ... 0.236s

#19 return log +0.066s ... 0.303s

Teilen Sie diesen Artikel, um uns zu unterstützen. Jeder Link hilft!
> Notebook Test, Laptop Test und News > Benchmarks / Technik > Benchmarks / Technik > Grafikkarten Vergleich - Head 2 Head
Autor: Klaus Hinum,  8.09.2017 (Update:  1.07.2023)