Notebookcheck Logo

Mediatek MT6582M vs Mediatek MT6580M

Mediatek MT6582M

► remove from comparison  MT6582M

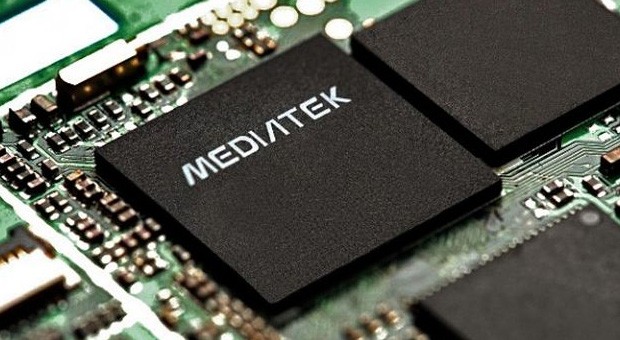
Der Mediatek MT6582M ist ein System-on-a-Chip (SoC) für preisgünstige Tablets und Smartphones. Er wird in 28 nm gefertigt und bietet einen Quad-Core Cortex-A7 Prozessorteil sowie eine ARM Mali-400 MP2 Grafikeinheit. Desweiteren unterstützt der Chip Dual-SIM, UMTS und HSPA+, WLAN, FM, Bluetooth und GPS.

Die CPU-Performance des MT6582M entspricht anderen Cortex-A7-SoCs mit ähnlicher Taktfrequenz und siedelt sich im Einstiegsbereich an. Je nach Benchmark ist die Rechenleistung in etwa mit Nvidias Tegra 3 vergleichbar, was für Alltagsanwendungen wie Browsing vollkommen ausreicht. Die GPU bewältigt nur einfache Android-Spiele in moderaten Auflösungen.

Mediatek MT6580M

► remove from comparison  MT6580M

Der Mediatek MT6580M ist ein System-on-a-Chip (SoC) für preisgünstige Tablets und Smartphones. Er wird in 28 nm gefertigt und bietet einen Quad-Core Cortex-A7 Prozessorteil sowie eine ARM Mali-400 (MP2?) Grafikeinheit. Des weiteren unterstützt der Chip Dual-SIM, UMTS und HSPA+, WLAN, FM, Bluetooth und GPS.

Die CPU-Performance des MT6580M entspricht anderen Cortex-A7-SoCs mit ähnlicher Taktfrequenz und siedelt sich im Einstiegsbereich an. Je nach Benchmark ist die Rechenleistung in etwa mit Nvidias Tegra 3 vergleichbar, was für Alltagsanwendungen wie Browsing vollkommen ausreicht. Die GPU bewältigt nur einfache Android-Spiele in moderaten Auflösungen.

ModelMediatek MT6582MMediatek MT6580M
Series Mediatek Mediatek
CodenameCortex-A7Cortex-A7
Serie: Mediatek Cortex-A7
Mediatek MT6592 compare1.7 GHz8 / 8 cores Cortex-A7
Mediatek MT8127 compare1.5 GHz4 / 4 cores Cortex-A7
Mediatek MT6589T compare1.5 GHz4 / 4 cores Cortex-A7
Mediatek MT8389 compare1.2 GHz4 / 4 cores Cortex-A7
Mediatek MT8125 compare1.2 GHz4 / 4 cores Cortex-A7
Mediatek MT8321 compare1.3 GHz4 / 4 cores Cortex-A7
Mediatek MT8121 compare1.3 GHz4 / 4 cores Cortex-A7
Mediatek MT6582 compare1.3 GHz4 / 4 cores Cortex-A7
Mediatek MT6582M « 1.3 GHz4 / 4 cores Cortex-A7
Mediatek MT6580M1.3 GHz4 / 4 cores Cortex-A7
Mediatek MT6589 compare1.2 GHz4 / 4 cores Cortex-A7
MediaTek MT6572 compare1.2 GHz2 / 2 cores Cortex-A7
Mediatek MT6592 compare1.7 GHz8 / 8 cores Cortex-A7
Mediatek MT8127 compare1.5 GHz4 / 4 cores Cortex-A7
Mediatek MT6589T compare1.5 GHz4 / 4 cores Cortex-A7
Mediatek MT8389 compare1.2 GHz4 / 4 cores Cortex-A7
Mediatek MT8125 compare1.2 GHz4 / 4 cores Cortex-A7
Mediatek MT8321 compare1.3 GHz4 / 4 cores Cortex-A7
Mediatek MT8121 compare1.3 GHz4 / 4 cores Cortex-A7
Mediatek MT6582 compare1.3 GHz4 / 4 cores Cortex-A7
Mediatek MT6582M1.3 GHz4 / 4 cores Cortex-A7
Mediatek MT6580M « 1.3 GHz4 / 4 cores Cortex-A7
Mediatek MT6589 compare1.2 GHz4 / 4 cores Cortex-A7
MediaTek MT6572 compare1.2 GHz2 / 2 cores Cortex-A7
Clock1300 MHz1300 MHz
L1 Cache128 KB128 KB
L2 Cache512 KB512 KB
Cores / Threads4 / 44 / 4
Technology28 nm28 nm
FeaturesMali-400 MP2 @ 416 MHz, HSPA+, TD-SCDMA, Wi-Fi, Bluetooth, GPS, FMMali-400 MP2 @ 416 MHz, HSPA+, TD-SCDMA, Wi-Fi, Bluetooth, GPS, FM
iGPUARM Mali-400 MP2 (416 MHz)ARM Mali-400 MP2 (416 MHz)
ArchitectureARMARM
Announced
Manufacturerwww.mediatek.comwww.mediatek.com

Benchmarks

3DMark - 3DMark Ice Storm Physics
min: 7360     avg: 7757     median: 7782 (6%)     max: 8128 Points
min: 7465     avg: 7576     median: 7575.5 (6%)     max: 7686 Points
3DMark - 3DMark Ice Storm Extreme Physics
min: 7516     avg: 7961     median: 8016 (7%)     max: 8350 Points
min: 7371     avg: 7572     median: 7572 (6%)     max: 7773 Points
3DMark - 3DMark Ice Storm Unlimited Physics
min: 8505     avg: 8558     median: 8558 (7%)     max: 8611 Points
3DMark - 3DMark Sling Shot Extreme (ES 3.1) Unlimited Physics
0 Points (0%)
3DMark - 3DMark Sling Shot (ES 3.0) Unlimited Physics
0 Points (0%)
Geekbench 5.5 - Geekbench 5.1 - 5.4 64 Bit Single-Core
100%
1 MT6580M +
63 Points (3%)
Geekbench 5.5 - Geekbench 5.1 - 5.4 64 Bit Multi-Core
100%
1 MT6580M +
248 Points (0%)
Geekbench 4.4 - Geekbench 4.1 - 4.4 64 Bit Single-Core
100%
1 MT6580M +
min: 394     avg: 421     median: 426 (4%)     max: 437 Points
Geekbench 4.4 - Geekbench 4.1 - 4.4 64 Bit Multi-Core
100%
1 MT6580M +
min: 1131     avg: 1167     median: 1161.5 (1%)     max: 1237 Points
Geekbench 4.0 - Geekbench 4.0 64 Bit Single-Core
100%
1 MT6580M +
407 Points (6%)
Geekbench 4.0 - Geekbench 4.0 64 Bit Multi-Core
100%
1 MT6580M +
1166 Points (3%)
Geekbench 3 - Geekbench 3 32 Bit Multi-Core
min: 1157     avg: 1173     median: 1179 (2%)     max: 1182 Points
min: 1135     avg: 1165     median: 1170.5 (2%)     max: 1184 Points
Geekbench 3 - Geekbench 3 32 Bit Single-Core
min: 346     avg: 349.7     median: 350 (7%)     max: 353 Points
min: 354     avg: 355.5     median: 356 (7%)     max: 356 Points
Geekbench 3 - Geekbench 3 64 Bit Multi-Core
100%
1 MT6580M +
1171 Points (2%)
Geekbench 3 - Geekbench 3 64 Bit Single-Core
100%
1 MT6580M +
350 Points (5%)
Geekbench 2 - 32 Bit - Geekbench Stream
100%
1 MT6582M +
377 Points (3%)
Geekbench 2 - 32 Bit - Geekbench Memory
100%
1 MT6582M +
1015 Points (9%)
Geekbench 2 - 32 Bit - Geekbench Floating Point
100%
1 MT6582M +
2127 Points (4%)
Geekbench 2 - 32 Bit - Geekbench Integer
100%
1 MT6582M +
1255 Points (3%)
Geekbench 2 - 32 Bit - Geekbench Total Score
100%
1 MT6582M +
1424 Points (4%)
Linpack Android / IOS - Linpack Multi Thread
100%
1 MT6582M +
min: 168     avg: 220.2     median: 238.2 (8%)     max: 254.4 MFLOPS
Linpack Android / IOS - Linpack Single Thread
100%
1 MT6582M +
min: 81.7     avg: 95.4     median: 87.8 (9%)     max: 116.6 MFLOPS
Mozilla Kraken 1.1 - Kraken 1.1 Total Score *
min: 15717     avg: 16521     median: 15906 (19%)     max: 17941 ms
min: 14579     avg: 16993     median: 15157 (18%)     max: 21257 ms
Sunspider - Sunspider 1.0 Total Score *
100%
1 MT6582M +
min: 1331     avg: 1442     median: 1441.5 (16%)     max: 1552 ms
Sunspider - Sunspider 0.9.1 Total Score *
100%
1 MT6582M +
min: 1578     avg: 1728     median: 1727.5 (16%)     max: 1877 ms
Octane V2 - Octane V2 Total Score
min: 1424     avg: 1925     median: 2172 (2%)     max: 2179 Points
min: 1645     avg: 2066     median: 2138.5 (2%)     max: 2280 Points
Vellamo 3.x - Vellamo 3.x Metal
100%
1 MT6582M +
719 Points (19%)
Vellamo 3.x - Vellamo 3.x Multicore Beta
100%
1 MT6582M +
1210 Points (27%)
Vellamo 3.x - Vellamo 3.x Browser
100%
1 MT6582M +
1734 Points (23%)
Quadrant Standard Edition 2.0 - Quadrant Standard 2.0 Total Score
100%
1 MT6582M +
min: 5841     avg: 6498     median: 6498 (15%)     max: 7155 points
AnTuTu v4 - AnTuTu v4 Total Score
100%
1 MT6582M +
min: 17300     avg: 17304     median: 17304 (40%)     max: 17308 Points
AnTuTu v5 - AnTuTu v5 Total Score
100%
1 MT6582M +
18409 Points (19%)
AnTuTu v6 - AnTuTu v6 Total Score
100%
1 MT6580M +
min: 15185     avg: 22450     median: 23956.5 (8%)     max: 25237 Points
AnTuTu v7 - AnTuTu v7 MEM
100%
1 MT6580M +
min: 2654     avg: 2929     median: 2969 (9%)     max: 3122 Points
AnTuTu v7 - AnTuTu v7 UX
100%
1 MT6580M +
min: 6403     avg: 8560     median: 8949 (11%)     max: 9938 Points
AnTuTu v7 - AnTuTu v7 CPU
100%
1 MT6580M +
min: 7527     avg: 7814     median: 7615.5 (5%)     max: 8496 Points
AnTuTu v7 - AnTuTu v7 Total Score
100%
1 MT6580M +
min: 17073     avg: 19302     median: 19523 (3%)     max: 21088 Points
AndEBench - AndEBench Java
100%
1 MT6582M +
min: 326     avg: 343.7     median: 347 (11%)     max: 358 Iter./s
AndEBench - AndEBench Native
100%
1 MT6582M +
min: 6115     avg: 6635     median: 6790 (22%)     max: 7001 Iter./s
PassMark PerformanceTest Mobile V1 - PerformanceTest Mobile V1 CPU Tests
100%
1 MT6582M +
min: 9254     avg: 9564     median: 9264 (1%)     max: 10173 Points
PCMark for Android - PCM f. Android Work Score
1938 Points (10%)
PCMark for Android - PCM f. Android Work Score 2.0
0 Points (0%)

Average Benchmarks Mediatek MT6582M → 100% n=8

Average Benchmarks Mediatek MT6580M → 103% n=8

- Bereich der Benchmarkergebnisse für diese Grafikkarte
- Durchschnittliche Benchmarkergebnisse für diese Grafikkarte
* Smaller numbers mean a higher performance
1 This benchmark is not used for the average calculation

Add one or more devices and compare

In the following list you can select (and also search for) devices that should be added to the comparison. You can select more than one device.

restrict list:

show all (including archived), 2024, 2023
v1.26
log 24. 07:52:37

#0 checking url part for id 5842 +0s ... 0s

#1 checking url part for id 8081 +0s ... 0s

#2 not redirecting to Ajax server +0s ... 0s

#3 did not recreate cache, as it is less than 5 days old! Created at Tue, 23 Apr 2024 05:40:15 +0200 +0.001s ... 0.001s

#4 composed specs +0.018s ... 0.019s

#5 did output specs +0s ... 0.019s

#6 getting avg benchmarks for device 5842 +0.003s ... 0.022s

#7 got single benchmarks 5842 +0.019s ... 0.042s

#8 getting avg benchmarks for device 8081 +0.003s ... 0.045s

#9 got single benchmarks 8081 +0.077s ... 0.122s

#10 got avg benchmarks for devices +0s ... 0.122s

#11 No cached benchmark found, getting uncached values +0.055s ... 0.177s

#12 No cached benchmark found, getting uncached values +0.007s ... 0.184s

#13 No cached benchmark found, getting uncached values +0.096s ... 0.28s

#14 No cached benchmark found, getting uncached values +0.015s ... 0.295s

#15 min, max, avg, median took s +0s ... 0.295s

#16 return log +0.031s ... 0.326s

Teilen Sie diesen Artikel, um uns zu unterstützen. Jeder Link hilft!
> Notebook Test, Laptop Test und News > Benchmarks / Technik > Benchmarks / Technik > Prozessor Vergleich - Head 2 Head
Autor: Klaus Hinum,  8.09.2017 (Update:  1.07.2023)