Notebookcheck Logo

Texas Instruments OMAP 4460 vs Apple A5

Texas Instruments OMAP 4460

► remove from comparison  OMAP 4460

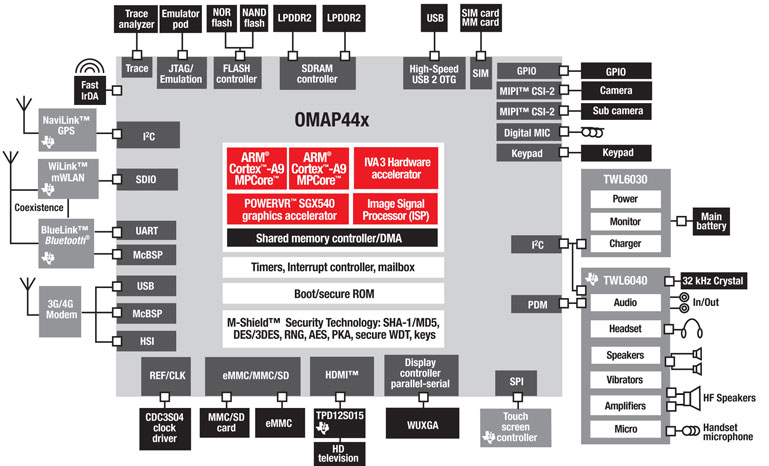
Der Texas Instruments (TI) OMAP 4460 ist ein SoC (System on a Chip) für Handys und Tablet PCs. Er beinhaltet zwei ARM Cortex-A9 (ARM v7 Instruction Set) Rechenkernen mit 1.2-1.5 GHz und ARMs SIMD Engine NEON. Die integrierte PowerVR SGX540 Grafikkarte wird mit 384 MHz getaktet und kann wie die zwei Prozessorkerne auf den Dual Channel LPDDR2 Speicherkontroller (max 400MHz) zugreifen. Im Vergleich zum OMAP 4430, ist beim 4460 daher CPU und GPU Teil höher getaktet.


Apple A5

► remove from comparison

Der Apple A5 ist ein Dual Core ARM Prozessor mit Corex A9 basierenden Rechenkernen. Sie sind beide im iPad 2 und iPad Mini mit maximal 1000 MHz getaktet. Im iPhone jedoch nur mit 900 Mhz. Im SoC integriert ist die relativ schnelle PowerVR SGX 543MP2 Grafikkarte. Im selben Package befinden sich 512MB RAM (beim iPad 2).

Verwendet wird der Chip z.B. beim Apple iPad 2, 2,5 und iPhone 4s Tablet und Apple wirbt mit bis zu 2x Rechenleistung im Vergleich zum 1 GHz A4 Single Core. Gefertigt wurde der A5 anfangs noch in 40nm. Mit dem erscheinen des iPad 3, kam im iPad 2 aber eine 32nm Variante zum Einsatz, welche wahrscheinlich auch im iPad Mini eingesetzt wird.

ModelTexas Instruments OMAP 4460Apple A5
Series Apple
CodenameCortex A9Cortex A9
Serie: Cortex A9
Texas Instruments OMAP 4470 compare1.5 GHz2 / 2 cores Cortex A9
Texas Instruments OMAP 4460 « 1.2 GHz2 / 2 cores Cortex A9
Broadcom BCM28155 compare1.2 GHz2 / 2 cores Cortex A9
Texas Instruments OMAP 4430 compare1 GHz2 / 2 cores Cortex A9
Apple A5x compare1 GHzcores Cortex A9
Apple A51 GHzcores Cortex A9
Texas Instruments OMAP 4470 compare1.5 GHz2 / 2 cores Cortex A9
Texas Instruments OMAP 44601.2 GHz2 / 2 cores Cortex A9
Broadcom BCM28155 compare1.2 GHz2 / 2 cores Cortex A9
Texas Instruments OMAP 4430 compare1 GHz2 / 2 cores Cortex A9
Apple A5x compare1 GHzcores Cortex A9
Apple A5 « 1 GHzcores Cortex A9
Clock1200 MHz1000 MHz
L1 Cache1 MB
Cores / Threads2 / 22
TDP0.6 Watt
Technology45 nm40, 32 nm
FeaturesDual Channel LPDDR 400MHz Memory Controller, IVA 3 Multimedia Accelerator, PowerVR SGX 540 Graphics Core, Image Signal Processor
ArchitectureARMARM
Announced

Benchmarks

Geekbench 3 - Geekbench 3 32 Bit Multi-Core
796 Points (1%)
Geekbench 3 - Geekbench 3 32 Bit Single-Core
427 Points (8%)
Geekbench 2 - 32 Bit - Geekbench Stream
min: 418     avg: 426     median: 426 (3%)     max: 434 Points
76%
A5 +
min: 297     avg: 317.7     median: 323 (3%)     max: 333 Points
Geekbench 2 - 32 Bit - Geekbench Memory
min: 1123     avg: 1207     median: 1206.5 (11%)     max: 1290 Points
69%
A5 +
min: 751     avg: 807     median: 833 (8%)     max: 838 Points
Geekbench 2 - 32 Bit - Geekbench Floating Point
min: 1573     avg: 1730     median: 1730 (3%)     max: 1887 Points
52%
A5 +
min: 737     avg: 855     median: 906 (2%)     max: 923 Points
Geekbench 2 - 32 Bit - Geekbench Integer
min: 917     avg: 1013     median: 1013 (2%)     max: 1109 Points
66%
A5 +
min: 552     avg: 638     median: 671 (1%)     max: 691 Points
Geekbench 2 - 32 Bit - Geekbench Total Score
min: 1137     avg: 1244     median: 1243.5 (3%)     max: 1350 Points
60%
A5 +
min: 631     avg: 715     median: 750 (2%)     max: 764 Points
Linpack Android / IOS - Linpack Multi Thread
min: 73.8     avg: 75.2     median: 75.2 (3%)     max: 76.6 MFLOPS
169%
A5 +
min: 124.4     avg: 127.1     median: 127.1 (4%)     max: 129.8 MFLOPS
Linpack Android / IOS - Linpack Single Thread
min: 44.38     avg: 48.6     median: 48.6 (5%)     max: 52.9 MFLOPS
168%
A5 +
min: 78.1     avg: 81.8     median: 81.8 (8%)     max: 85.4 MFLOPS
Sunspider - Sunspider 1.0 Total Score *
1096 ms (12%)
Sunspider - Sunspider 0.9.1 Total Score *
min: 1102     avg: 1445     median: 1444.5 (14%)     max: 1787 ms
95%
A5 +
min: 1557     avg: 1863     median: 1888.5 (18%)     max: 2118 ms
Quadrant Standard Edition 2.0 - Quadrant Standard 2.0 Total Score
min: 2226     avg: 2586     median: 2585.5 (6%)     max: 2945 points
AnTuTu v4 - AnTuTu v4 Total Score
12347 Points (29%)
AndEBench - AndEBench Java
224 Iter./s (7%)
AndEBench - AndEBench Native
5481 Iter./s (18%)
PassMark PerformanceTest Mobile V1 - PerformanceTest Mobile V1 CPU Tests
5787 Points (1%)

Average Benchmarks Texas Instruments OMAP 4460 → 100% n=8

Average Benchmarks Apple A5 → 94% n=8

- Bereich der Benchmarkergebnisse für diese Grafikkarte
- Durchschnittliche Benchmarkergebnisse für diese Grafikkarte
* Smaller numbers mean a higher performance
1 This benchmark is not used for the average calculation

Add one or more devices and compare

In the following list you can select (and also search for) devices that should be added to the comparison. You can select more than one device.

restrict list:

show all (including archived), 2024, 2023
v1.26
log 19. 19:51:43

#0 checking url part for id 3601 +0s ... 0s

#1 checking url part for id 2331 +0s ... 0s

#2 not redirecting to Ajax server +0s ... 0s

#3 did not recreate cache, as it is less than 5 days old! Created at Fri, 19 Apr 2024 05:38:49 +0200 +0.001s ... 0.001s

#4 composed specs +0.085s ... 0.086s

#5 did output specs +0s ... 0.086s

#6 getting avg benchmarks for device 3601 +0.003s ... 0.089s

#7 got single benchmarks 3601 +0.01s ... 0.099s

#8 getting avg benchmarks for device 2331 +0.002s ... 0.101s

#9 got single benchmarks 2331 +0.01s ... 0.111s

#10 got avg benchmarks for devices +0s ... 0.111s

#11 min, max, avg, median took s +0.049s ... 0.16s

#12 return log +0.025s ... 0.185s

Teilen Sie diesen Artikel, um uns zu unterstützen. Jeder Link hilft!
> Notebook Test, Laptop Test und News > Benchmarks / Technik > Benchmarks / Technik > Prozessor Vergleich - Head 2 Head
Autor: Klaus Hinum,  8.09.2017 (Update:  1.07.2023)