Notebookcheck Logo

NVIDIA Quadro FX 1600M vs NVIDIA Quadro FX 2800M vs NVIDIA Quadro FX 770M

NVIDIA Quadro FX 1600M

► remove from comparison

Highend Workstation Grafikchip mit DirectX 10 Unterstützung wahrscheinlich auf 8700M GT basierend.

Gedacht für Digital Content Creators, Ingenieure, Geowissenschaftler und andere professionelle 3D Anwendungen.

Zertifizierte Treiber garantieren die fehlerfreie und schnellere (im Vergleich zu 8700M) Darstellung von professionellen Programmen (CAD, CCD, Visualisierungssoftware).

NVIDIA Quadro FX 2800M

► remove from comparison NVIDIA Quadro FX 2800M

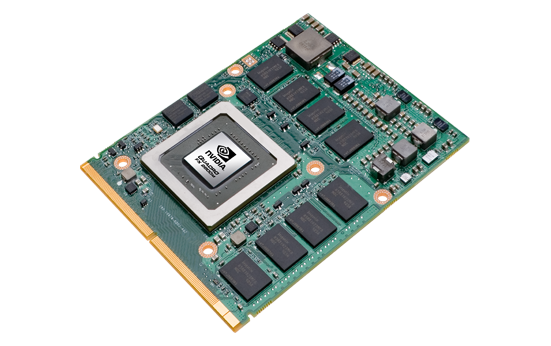
Die Nvidia Quadro FX 2800M ist eine mobile Grafikkarte für Workstation-Laptops. Sie basiert auf die selbe Architektur wie die GeForce 9800M GT, bietet jedoch eine höheren Kerntakt.

Die zertifizierten Treiber der Quadro FX Serie sorgen für eine optimierten Stabilität, Kompatibilität und Performance bei Professionellen Anwendungen (CAD-, DCC-, Medizin- und Prospektionsanwendungen). Besonders die OpenGL Performance soll bei den Quadro FX Karten im Vergleich zu GeForce Modellen deutlich besser sein.

Die Quadro FX2800M wird in mobilen Workstations, wie etwa dem Dell M6500 eingesetzt und unterstützt DirectX 10.0 und OpenGL 2.1. Sie kann maximal zwei Displays ansteuern (DisplayPort bis 2560x1600, HDMI/DVI bis 1920x1200). Dell gibt einen TDP von 65 Watt (Nvidia 75 Watt) an. Eventuell wird die FX2800M daher schon in 55nm gefertigt.

Durch den maximalen Stromverbrauch von 65/75 Watt (Idle 10 Watt) eignet sich die Grafikkarte nur für große und schwere Notebooks (minimal 15").

NVIDIA Quadro FX 770M

► remove from comparison NVIDIA Quadro FX 770M

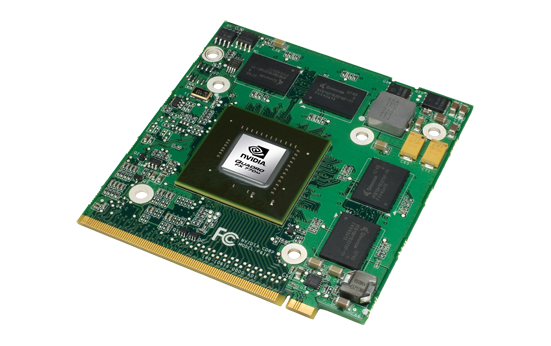
Die Quadro FX 770M ist eine professionelle Midrange Grafikkarte für Notebooks / mobile Workstations. Der Haupteinsatzzweck der FX770M sind CAD, DCC und Visualisierungsapplikationen. Für die populärsten Anwendungen sind die Treiber der Quadro Serie auch zertifiziert (garantieren den einwandfreien Betrieb).

Technisch basiert die Quadro FX 770M auf den Chip der GeForce 9600M GT und bietet daher die selben Features (PureVideo HD). Auch die theoretische Spieleleistung ist vergleichbar, jedoch kann es zu einer schlechteren Performance (durch die auf Anwendungen / OpenGL optimierten Treiber) kommen.

Speziell bei OpenGL zeigt die Quadro eine deutlich bessere Performance als die Consumer 9600M GT. Im Cinebench R10 OpenGL Test rechnet die 770M ungefähr doppelt so schnell wie die 9600M GT.

Wie die gesamte GeForce 9000M Serie, bietet die 770M auch CUDA Unterstützung. 

NVIDIA Quadro FX 1600MNVIDIA Quadro FX 2800MNVIDIA Quadro FX 770M
Quadro FX Serie
Quadro FX 3800M 128 @ 0.68 GHz256 Bit @ 1000 MHz
Quadro FX 3700M 128 @ 0.55 GHz256 Bit @ 800 MHz
Quadro FX 2800M 96 @ 0.6 GHz256 Bit @ 1000 MHz
Quadro FX 3600M 96 @ 0.5 GHz256 Bit @ 800 MHz
Quadro FX 1800M 72 @ 0.56 GHz128 Bit @ 1100 MHz
Quadro FX 2700M 48 @ 0.53 GHz256 Bit @ 800 MHz
Quadro FX 880M 48 @ 0.55 GHz128 Bit @ 790 MHz
Quadro FX 3500M 24/8 cores @ 0.58 GHz256 Bit @ 700 MHz
Quadro FX 2500M 24/8 cores @ 0.5 GHz256 Bit @ 600 MHz
Quadro FX 1700M 32 @ 0.63 GHz128 Bit @ 800 MHz
Quadro FX 1600M 32 @ 0.63 GHz128 Bit @ 800 MHz
Quadro FX 1500M 20/7 cores @ 0.38 GHz256 Bit @ 500 MHz
Quadro FX 770M 32 @ 0.5 GHz128 Bit @ 800 MHz
Quadro FX 570M 32 @ 0.48 GHz128 Bit @ 700 MHz
Quadro FX 380M 16 @ 0.63 GHz64 Bit @ 800 MHz
Quadro FX 370M 8 @ 0.58 GHz64 Bit @ 700 MHz
Quadro FX 360M 16 @ 0.4 GHz64 Bit @ 600 MHz
Quadro FX 350M 4/3 cores @ 0.45 GHz64 Bit @ 350 MHz
CodenameNB8P-GLMNB10-GLM3NB9P-GLM
ArchitekturG8xG9xG9x
Pipelines32 - unified96 - unified32 - unified
Kerntakt625 MHz600 MHz500 MHz
Shadertakt1250 MHz1500 MHz1250 MHz
Speichertakt800 MHz1000 MHz800 MHz
Speicherbandbreite128 Bit256 Bit128 Bit
SpeichertypGDDR3GDDR3GDDR2 / GDDR3
Max. Speichergröße512 MB1024 MB512 MB
Shared Memoryneinneinnein
APIDirectX 10, Shader 4.0DirectX 10, Shader 4.0DirectX 10, Shader 4.0
Stromverbrauch50 Watt75 Watt35 Watt
Transistors289 Million754 Million314 Million
Herstellungsprozess80 nm55 nm65 nm
FeaturesOpenGL 2.1, PureVideo HD, Powermizer 7.0, mögliche Schnittstellen: LVDS, DVI, VGA, HDTV, HDCP, HDMIOpenGL 2.1, CUDA, PowerMizer 8.0OpenGL 2.1, PowerMizer 8.0, 12-Bit Subpixel-Präzision, 128 Bit Grafikpipeline
Notebookgrößegroß (17" z.B.)groß (17" z.B.)mittel (15.4" z.B.)
Erscheinungsdatum01.06.2007 01.12.2009 14.08.2008
InformationenCG Shading Hochsprache, 32 Bit Gleitkommapräzision, 12 Bit Subpixel Präzision, 128 Bit Genauigkeit der Grafikpipeline, Vertex und Pixelshader Programmierbarkeit, PCI-E Interface, FSAA mit gedrehtem Raster, nView Multidisplay Support, High-Precision Dynamic-Range (HPDR) Technologie, Hardware 3D Clipping nach Fensterkennung, Vollbild Antialiasing
Herstellerseitewww.nvidia.dewww.nvidia.comwww.nvidia.com

Benchmarks

3DMark Vantage
3DM Vant. Perf. total + NVIDIA Quadro FX 2800M
3DMark Vantage - 3DM Vant. Perf. total
min: 5779     avg: 5783     median: 5783 (2%)     max: 5787 Points
3DM Vant. Perf. GPU no PhysX + NVIDIA Quadro FX 2800M
3DMark Vantage - 3DM Vant. Perf. GPU no PhysX
min: 5000     avg: 5037     median: 5037 (3%)     max: 5074 Points
3DMark 2001SE - 3DMark 2001 - Standard
min: 27822     avg: 32843     median: 35198 (37%)     max: 35509 Points
34844 Points (36%)
34871 Points (36%)
3DMark 03 - 3DMark 03 - Standard
min: 15060     avg: 16009     median: 15915 (8%)     max: 17144 Points
33900 Points (18%)
17192 Points (9%)
3DMark 05 - 3DMark 05 - Standard
min: 9344     avg: 9963     median: 9873 (11%)     max: 10375 Points
min: 16310     avg: 16936     median: 16935.5 (19%)     max: 17561 Points
11161 Points (12%)
3DMark 06 3DMark 06 - Score Unknown Settings + NVIDIA Quadro FX 1600M
3DMark 06
min: 4535     avg: 4623     median: 4622.5 (6%)     max: 4710 Points
3DMark 06 - Standard 1280x1024 + NVIDIA Quadro FX 1600M
3DMark 06
min: 4798     avg: 4916     median: 4915.5 (6%)     max: 5033 Points
3DMark 06 - Standard 1280x1024 + NVIDIA Quadro FX 2800M
min: 11162     avg: 11359     median: 11358.5 (15%)     max: 11555 Points
3DMark 06 - Standard 1280x1024 + NVIDIA Quadro FX 770M
min: 5230     avg: 5297     median: 5296.5 (7%)     max: 5363 Points
3DMark 06 - Standard 1280x800 + NVIDIA Quadro FX 1600M
3DMark 06
5608 Points (7%)
SPEC Viewperf 10.0 - SPEC Viewperf 10.0 - 3dsmax
32.3 Points (67%)
33.1 Points (69%)
SPEC Viewperf 10.0 - SPEC Viewperf 10.0 - Catia
39 Points (82%)
40.1 Points (84%)
SPEC Viewperf 10.0 - SPEC Viewperf 10.0 - EnSight
44 Points (93%)
31.7 Points (67%)
SPEC Viewperf 10.0 - SPEC Viewperf 10.0 - Maya
59.6 Points (32%)
85.1 Points (46%)
SPEC Viewperf 10.0 - SPEC Viewperf 10.0 - Pro/Engeneer
42.6 Points (83%)
36.1 Points (71%)
SPEC Viewperf 10.0 - SPEC Viewperf 10.0 - SolidWorks
59.5 Points (88%)
55 Points (81%)
SPEC Viewperf 10.0 - SPEC Viewperf 10.0 - UGS Teamcenter
35.2 Points (91%)
19 Points (49%)
SPEC Viewperf 10.0 - SPEC Viewperf 10.0 - UGS NX
31.3 Points (64%)
17.5 Points (36%)
SPECviewperf 11
specvp11 snx-01 + NVIDIA Quadro FX 2800M
SPECviewperf 11 - specvp11 snx-01
min: 13.58     avg: 14.7     median: 13.9 (8%)     max: 16.55 fps
specvp11 tcvis-02 + NVIDIA Quadro FX 2800M
SPECviewperf 11 - specvp11 tcvis-02
min: 15.1     avg: 16     median: 15.3 (9%)     max: 17.4 fps
specvp11 sw-02 + NVIDIA Quadro FX 2800M
SPECviewperf 11 - specvp11 sw-02
min: 6.73     avg: 14.1     median: 7.5 (6%)     max: 28 fps
specvp11 proe-05 + NVIDIA Quadro FX 2800M
SPECviewperf 11 - specvp11 proe-05
min: 4.67     avg: 5.1     median: 4.7 (6%)     max: 5.89 fps
specvp11 maya-03 + NVIDIA Quadro FX 2800M
SPECviewperf 11 - specvp11 maya-03
min: 6.2     avg: 7     median: 7.4 (6%)     max: 7.5 fps
specvp11 lightwave-01 + NVIDIA Quadro FX 2800M
SPECviewperf 11 - specvp11 lightwave-01
min: 7.99     avg: 16.2     median: 8.5 (9%)     max: 32 fps
specvp11 ensight-04 + NVIDIA Quadro FX 2800M
SPECviewperf 11 - specvp11 ensight-04
min: 10.8     avg: 11.9     median: 11.1 (5%)     max: 13.7 fps
specvp11 catia-03 + NVIDIA Quadro FX 2800M
SPECviewperf 11 - specvp11 catia-03
min: 9.53     avg: 13.4     median: 9.7 (5%)     max: 20.92 fps
Windows Vista Experience Index - Windows Vista Leistungsindex - Grafik (Spiele)
6.8 Points (100%)
Windows Vista Experience Index - Windows Vista Leistungsindex - Grafik
6.8 Points (100%)
Cinebench R10 Cinebench R10 Shading (32bit) + NVIDIA Quadro FX 1600M
Cinebench R10 - Cinebench R10 Shading (32bit)
min: 3899     avg: 4670     median: 4885 (3%)     max: 5226 Points
Cinebench R10 Shading (32bit) + NVIDIA Quadro FX 770M
6180 Points (4%)
Cinebench R11.5 Cinebench R11.5 OpenGL 64 Bit + NVIDIA Quadro FX 2800M
Cinebench R11.5 - Cinebench R11.5 OpenGL 64 Bit
min: 28.16     avg: 28.8     median: 28.8 (10%)     max: 29.36 fps

Average Benchmarks NVIDIA Quadro FX 1600M → 100% n=4

Average Benchmarks NVIDIA Quadro FX 2800M → 179% n=4

Average Benchmarks NVIDIA Quadro FX 770M → 107% n=4

- Bereich der Benchmarkergebnisse für diese Grafikkarte
- Durchschnittliche Benchmarkergebnisse für diese Grafikkarte
* Smaller numbers mean a higher performance
1 This benchmark is not used for the average calculation

Spiele-Benchmarks

Die folgenden Benchmarks basieren auf unseren Spieletests mit Testnotebooks. Die Performance dieser Grafikkarte bei den gelisteten Spielen ist abhängig von der verwendeten CPU, Speicherausstattung, Treiber und auch Betriebssystem. Dadurch müssen die untenstehenden Werte nicht repräsentativ sein. Detaillierte Informationen über das verwendete System sehen Sie nach einem Klick auf den fps-Wert.

Mafia 2

Mafia 2

2010
low 800x600
Quadro FX 2800M:
63.2  fps
med. 1024x768
Quadro FX 2800M:
56.1  fps
high 1360x768
Quadro FX 2800M:
48.9  fps
ultra 1920x1080
Quadro FX 2800M:
30.8  fps
low 1024x768
Quadro FX 2800M:
158  fps
med. 1360x768
Quadro FX 2800M:
60  fps
high 1360x768
Quadro FX 2800M:
52  fps
ultra 1920x1080
Quadro FX 2800M:
29.6  fps
med. 1366x768
Quadro FX 2800M:
58.9  fps
high 1366x768
Quadro FX 2800M:
41.5  fps
ultra 1920x1080
Quadro FX 2800M:
23.1  fps
low 800x600
Quadro FX 2800M:
158.1  fps
med. 1024x768
Quadro FX 2800M:
78.9  fps
high 1366x768
Quadro FX 2800M:
66.7  fps
ultra 1920x1080
Quadro FX 2800M:
41.2  fps
Colin McRae: DIRT 2

Colin McRae: DIRT 2

2009
low 800x600
Quadro FX 2800M:
96.3  fps
med. 1024x768
Quadro FX 2800M:
89.5  fps
high 1360x768
Quadro FX 2800M:
62.6  fps
ultra 1920x1080
Quadro FX 2800M:
30.7  fps
Crysis - GPU Benchmark

Crysis - GPU Benchmark

2007
low 1024x768
100%
Quadro FX 1600M:
83.2 84.2 ~ 84 fps
112%
Quadro FX 770M:
94.2  fps
med. 1024x768
100%
Quadro FX 1600M:
31.5 33.3 ~ 32 fps
122%
Quadro FX 770M:
39  fps
high 1024x768
100%
Quadro FX 1600M:
13.6 14.4 15.9 ~ 15 fps
130%
Quadro FX 770M:
19.5  fps
Crysis - CPU Benchmark

Crysis - CPU Benchmark

2007
low 1024x768
100%
Quadro FX 1600M:
12.7 72.2 73.1 ~ 53 fps
160%
Quadro FX 770M:
84.7  fps
med. 1024x768
100%
Quadro FX 1600M:
23.5 29.6 ~ 27 fps
131%
Quadro FX 770M:
35.4  fps
high 1024x768
100%
Quadro FX 1600M:
13.2 15.6 ~ 14 fps
129%
Quadro FX 770M:
18.1  fps
World in Conflict - Benchmark

World in Conflict - Benchmark

2007
med. 1024x768
100%
Quadro FX 1600M:
36 37 ~ 37 fps
high 1024x768
100%
Quadro FX 1600M:
21 23 ~ 22 fps
F.E.A.R.

F.E.A.R.

2005
low 640x480
100%
Quadro FX 1600M:
444 476 493 ~ 471 fps
med. 800x600
100%
Quadro FX 1600M:
153 162 167 ~ 161 fps
high 1024x768
100%
Quadro FX 1600M:
56 56 59 ~ 57 fps
Doom 3

Doom 3

2004
low 640x480
100%
Quadro FX 1600M:
160.8 173.6 ~ 167 fps
99%
Quadro FX 770M:
165.2  fps
med. 640x480
100%
Quadro FX 1600M:
164.3 174 ~ 169 fps
101%
Quadro FX 770M:
171.3  fps
high 800x600
100%
Quadro FX 1600M:
160.6 165 ~ 163 fps
97%
Quadro FX 770M:
158.7  fps
ultra 1024x768
100%
Quadro FX 1600M:
129.1 129.2 ~ 129 fps
98%
Quadro FX 770M:
126.1  fps
Quake 3 Arena - Timedemo

Quake 3 Arena - Timedemo

1999
high 1024x768
100%
Quadro FX 1600M:
549  fps

Average Gaming NVIDIA Quadro FX 1600M → 100%

Average Gaming 30-70 fps → 100%

Average Gaming NVIDIA Quadro FX 770M → 118%

Average Gaming 30-70 fps → 126%

NVIDIA Quadro FX 2800Mlowmed.highultraQHD4K
Mafia 263.256.148.930.8
StarCraft 2158605229.6
Battlefield: Bad Company 258.941.5323.07
CoD Modern Warfare 2158.178.966.741.2
Colin McRae: DIRT 296.389.562.630.7
< 30 fps
< 60 fps
< 120 fps
≥ 120 fps


2
2

2
3

3
2
2
3


NVIDIA Quadro FX 1600Mlowmed.highultraQHD4K
Crysis - GPU Benchmark843215
Crysis - CPU Benchmark532714
World in Conflict - Benchmark3722
F.E.A.R.47116157
Doom 3167169163129
Quake 3 Arena - Timedemo549
< 30 fps
< 60 fps
< 120 fps
≥ 120 fps

1
1
2
1
2

2
3
1

2


1


NVIDIA Quadro FX 770Mlowmed.highultraQHD4K
Crysis - GPU Benchmark94.23919.5
Crysis - CPU Benchmark84.735.418.1
Doom 3165.2171.3158.7126.1
< 30 fps
< 60 fps
< 120 fps
≥ 120 fps


2
1

2

1
2


1


1


Eine Liste mit weiteren Spielen und allen Grafikkarten finden Sie auf unserer Seite: Welches Spiel ist mit welcher Grafikkarte spielbar?

v1.26
log 19. 05:04:20

#0 checking url part for id 183 +0s ... 0s

#1 checking url part for id 1544 +0s ... 0s

#2 checking url part for id 884 +0s ... 0s

#3 not redirecting to Ajax server +0s ... 0s

#4 did not recreate cache, as it is less than 5 days old! Created at Tue, 16 Apr 2024 05:39:00 +0200 +0.001s ... 0.001s

#5 composed specs +0.128s ... 0.129s

#6 did output specs +0s ... 0.129s

#7 start showIntegratedCPUs +0s ... 0.129s

#8 getting avg benchmarks for device 183 +0.036s ... 0.165s

#9 got single benchmarks 183 +0.01s ... 0.176s

#10 getting avg benchmarks for device 1544 +0.001s ... 0.177s

#11 got single benchmarks 1544 +0.009s ... 0.186s

#12 getting avg benchmarks for device 884 +0.001s ... 0.188s

#13 got single benchmarks 884 +0.009s ... 0.197s

#14 got avg benchmarks for devices +0s ... 0.197s

#15 min, max, avg, median took s +0.28s ... 0.478s

#16 before gaming benchmark output +0s ... 0.478s

#17 Got 65 rows for game benchmarks. +0.01s ... 0.487s

#18 composed SQL query for gamebenchmarks +0s ... 0.487s

#19 got data and put it in $dataArray +0.006s ... 0.493s

#20 benchmarks composed for output. +0.027s ... 0.521s

#21 calculated avg scores. +0s ... 0.521s

#22 return log +0.002s ... 0.522s

Teilen Sie diesen Artikel, um uns zu unterstützen. Jeder Link hilft!
> Notebook Test, Laptop Test und News > Benchmarks / Technik > Benchmarks / Technik > Grafikkarten Vergleich - Head 2 Head
Autor: Klaus Hinum,  8.09.2017 (Update:  1.07.2023)