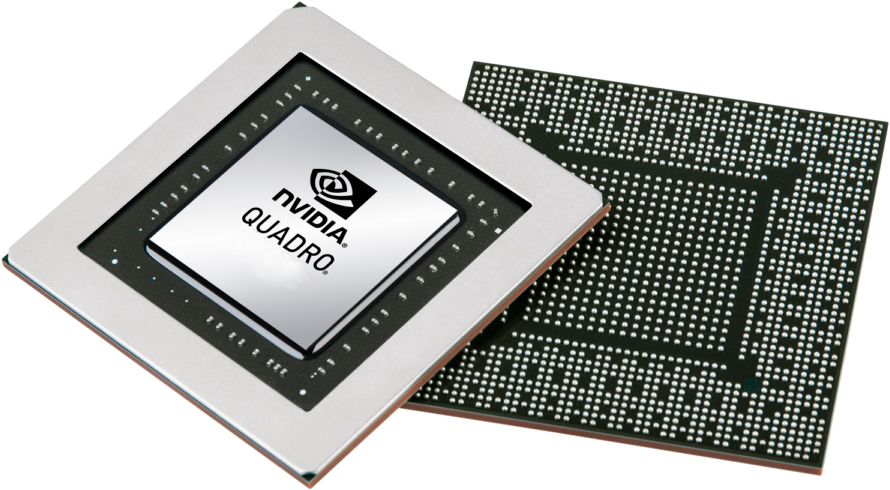
NVIDIA Quadro P4000 vs NVIDIA Quadro P620 vs NVIDIA Quadro P2000
NVIDIA Quadro P4000 ► remove from comparison
Die Nvidia Quadro P4000 ist eine mobile High-End-Workstation-Grafikkarte für Notebooks. Sie basiert derzeit auf keiner Consumer Karte direkt und positioniert sich zwischen Quadro P3000 (GTX 1060) und Quadro P5000 (GTX 1070) ein. Sie bietet 1792 Shader und dürfte daher auf den selben GP104 Chip der P5000 (2048 Shader) basieren. Sie bietet 8 GB GDDR5 bei gleicher Bandbreite und ist ebenfalls mit 100 Watt TGP (73.4 W TDP) von Nvidia spezifiziert.
Die Quadro-Grafikkarten bieten zertifizierte Treiber , welche auf Stabiltität und Performance bei professionellen Anwendungen (CAD-, DCC-, Medizin-, Prospektions-, Visualisierungsanwendungen) optimiert sind. Dadurch ist die Performance im Vergleich zu den Consumergrafikkarten mit gleichem Chip in diesen Bereichen deutlich besser.
NVIDIA Quadro P620 ► remove from comparison
Die Nvidia Quadro P620 ist eine mobile Workstation-Grafikkarte für Notebooks. Sie basiert auf den GP107 Pascal Chip mit 128 Bit Speicherbus und ist daher ähnlich zur älteren Quadro P1000 mit reduzierten Taktraten. Verglichen mit Consumer Chips, positioniert sich die Quadro P620 mit ihren 512 Shadern zwischen GeForce MX250 (384) und GTX 1050 (640).
Die Quadro-Grafikkarten bieten zertifizierte Treiber , welche auf Stabiltität und Performance bei professionellen Anwendungen (CAD-, DCC-, Medizin-, Prospektions-, Visualisierungsanwendungen) optimiert sind. Dadurch ist die Performance im Vergleich zu den Consumergrafikkarten mit gleichem Chip in diesen Bereichen deutlich besser.
NVIDIA Quadro P2000 ► remove from comparison
Die Nvidia Quadro P2000 ist eine mobile Mittelklasse-Workstation-Grafikkarte für Notebooks. Sie basiert auf wie die Consumer GeForce GTX 1050 Ti (Laptop) auf den GP107 Chip mit 768 Shader. Die Grafikkarte ist für die Kaby-Lake-Generation gedacht.
Die Quadro-Grafikkarten bieten zertifizierte Treiber , welche auf Stabiltität und Performance bei professionellen Anwendungen (CAD-, DCC-, Medizin-, Prospektions-, Visualisierungsanwendungen) optimiert sind. Dadurch ist die Performance im Vergleich zu den Consumergrafikkarten mit gleichem Chip in diesen Bereichen deutlich besser.
Leistung
Die theoretische Leistung sollte vergleichbar zur GTX 1050 Ti (Max-Q ?) sein (falls die Taktraten nicht massiv verringert wurden).
NVIDIA Quadro P4000 NVIDIA Quadro P620 NVIDIA Quadro P2000 Quadro P Serie Codename N17E-Q3 GP107GL Architektur Pascal Pascal Pascal Pipelines 1792 - unified 512 - unified 768 - unified Kerntakt 1202 - 1228 (Boost) MHz 1177 - 1442 (Boost) MHz 1215 - 1468 (Boost) MHz Speichertakt 6006 MHz 6000 MHz 6008 MHz Speicherbandbreite 256 Bit 128 Bit 128 Bit Speichertyp GDDR5 GDDR5 GDDR5 Max. Speichergröße 16 GB 4 GB 4 GB Shared Memory nein nein nein API DirectX 12_1, Shader 5.0, OpenGL 4.5 DirectX 12_1, OpenGL 4.5 DirectX 12_1, Shader 5.0, OpenGL 4.5 Stromverbrauch 73.4 Watt 25 Watt Herstellungsprozess 16 nm 14 nm 14 nm Features Optimus,
PhysX, 3D Vision Pro, nView, Optimus Vulkan, Multi Monitor Optimus,
PhysX, 3D Vision Pro, nView, Optimus Notebookgröße groß (17" z.B.) groß (17" z.B.) mittel (15.4" z.B.) Erscheinungsdatum 11.01.2017 27.05.2019 05.07.2017 Herstellerseite www.nvidia.com
Benchmarks Performance Rating - 3DMark 11 + Fire Strike + Time Spy - Quadro P4000
5.6 pt (17%)
...
...
max:
Performance Rating - 3DMark 11 + Fire Strike + Time Spy - Quadro P620
2.1 pt (6%)
...
...
max:
Performance Rating - 3DMark 11 + Fire Strike + Time Spy - Quadro P2000
3.1 pt (9%)
...
...
max:
3DMark - 3DMark Time Spy Score
3825 Points (11%)
min: 1572 avg: 1583 median: 1582.5 (5%) max: 1593 Points
2259 Points (7%)
3DMark - 3DMark Time Spy Graphics
3960 Points (10%)
min: 1383 avg: 1388 median: 1388 (4%) max: 1393 Points
2046 Points (5%)
3DMark - 3DMark Ice Storm Unlimited Graphics
369407 Points (42%)
310112 Points (35%)
350317 Points (40%)
3DMark - 3DMark Ice Storm Extreme Graphics
119547 Points (15%)
75457 Points (10%)
3DMark - 3DMark Cloud Gate Score
18726 Points (20%)
min: 22501 avg: 23292 median: 23291.5 (25%) max: 24082 Points
min: 23632 avg: 24335 median: 24335 (26%) max: 25038 Points
3DMark - 3DMark Cloud Gate Graphics
53834 Points (14%)
min: 29746 avg: 30410 median: 30409.5 (8%) max: 31073 Points
min: 42598 avg: 43566 median: 43565.5 (11%) max: 44533 Points
3DMark - 3DMark Fire Strike Standard Score
10158 Points (18%)
min: 4402 avg: 4448 median: 4447.5 (8%) max: 4493 Points
min: 6116 avg: 6160 median: 6160 (11%) max: 6204 Points
3DMark - 3DMark Fire Strike Standard Graphics
12259 Points (14%)
min: 4600 avg: 4673 median: 4672.5 (5%) max: 4745 Points
min: 6741 avg: 6847 median: 6847 (8%) max: 6953 Points
3DMark - 3DMark Ice Storm Graphics
81998 Points (10%)
124567 Points (15%)
51884 Points (6%)
3DMark 11 - 3DM11 Performance Score
12346 Points (17%)
min: 6492 avg: 6552 median: 6519 (9%) max: 6645 Points
min: 8660 avg: 8699 median: 8699 (12%) max: 8738 Points
3DMark 11 - 3DM11 Performance GPU
15433 Points (13%)
min: 5850 avg: 5939 median: 5909 (5%) max: 6059 Points
min: 8201 avg: 8387 median: 8387 (7%) max: 8573 Points
3DMark Vantage + NVIDIA Quadro P4000 3DMark Vantage - 3DM Vant. Perf. total
36260 Points (11%)
3DM Vant. Perf. total + NVIDIA Quadro P620
25105 Points (7%)
3DM Vant. Perf. total + NVIDIA Quadro P2000
32964 Points (10%)
3DM Vant. Perf. GPU no PhysX + NVIDIA Quadro P4000 3DMark Vantage - 3DM Vant. Perf. GPU no PhysX
42370 Points (24%)
3DM Vant. Perf. GPU no PhysX + NVIDIA Quadro P620
21759 Points (12%)
3DM Vant. Perf. GPU no PhysX + NVIDIA Quadro P2000
31451 Points (18%)
3DMark 06 3DMark 06 - Standard 1280x1024 + NVIDIA Quadro P4000
29155 Points (38%)
3DMark 06 - Standard 1280x1024 + NVIDIA Quadro P620
min: 34862 avg: 35092 median: 35092 (46%) max: 35322 Points
3DMark 06 - Standard 1280x1024 + NVIDIA Quadro P2000
33795 Points (44%)
Unigine Valley 1.0 - Unigine Valley 1.0 DX
34.6 fps (11%)
Unigine Heaven 2.1 - Heaven 2.1 high
86.1 fps (16%)
SPECviewperf 11 + NVIDIA Quadro P4000 SPECviewperf 11 - specvp11 snx-01
53 fps (32%)
specvp11 tcvis-02 + NVIDIA Quadro P4000 SPECviewperf 11 - specvp11 tcvis-02
49.9 fps (28%)
specvp11 sw-02 + NVIDIA Quadro P4000 SPECviewperf 11 - specvp11 sw-02
50.9 fps (39%)
specvp11 proe-05 + NVIDIA Quadro P4000 SPECviewperf 11 - specvp11 proe-05
19.7 fps (23%)
specvp11 maya-03 + NVIDIA Quadro P4000 SPECviewperf 11 - specvp11 maya-03
57.8 fps (44%)
specvp11 lightwave-01 + NVIDIA Quadro P4000 SPECviewperf 11 - specvp11 lightwave-01
52.2 fps (56%)
specvp11 ensight-04 + NVIDIA Quadro P4000 SPECviewperf 11 - specvp11 ensight-04
59.2 fps (28%)
specvp11 catia-03 + NVIDIA Quadro P4000 SPECviewperf 11 - specvp11 catia-03
48.4 fps (25%)
SPECviewperf 12 + NVIDIA Quadro P4000 SPECviewperf 12 - specvp12 sw-03
117.1 fps (29%)
specvp12 sw-03 + NVIDIA Quadro P620
min: 77.7 avg: 83.4 median: 78.7 (20%) max: 93.9 fps
specvp12 sw-03 + NVIDIA Quadro P2000
min: 103.8 avg: 103.9 median: 103.9 (26%) max: 104 fps
specvp12 snx-02 + NVIDIA Quadro P4000 SPECviewperf 12 - specvp12 snx-02
83.1 fps (12%)
specvp12 snx-02 + NVIDIA Quadro P620
min: 49.5 avg: 50.1 median: 50.3 (7%) max: 50.6 fps
specvp12 snx-02 + NVIDIA Quadro P2000
min: 65.8 avg: 66.7 median: 66.7 (10%) max: 67.6 fps
specvp12 showcase-01 + NVIDIA Quadro P4000 SPECviewperf 12 - specvp12 showcase-01
67.2 fps (15%)
specvp12 showcase-01 + NVIDIA Quadro P620
min: 25.23 avg: 26 median: 25.8 (6%) max: 26.84 fps
specvp12 showcase-01 + NVIDIA Quadro P2000
min: 30.42 avg: 30.6 median: 30.6 (7%) max: 30.73 fps
specvp12 mediacal-01 + NVIDIA Quadro P4000 SPECviewperf 12 - specvp12 mediacal-01
39.4 fps (10%)
specvp12 mediacal-01 + NVIDIA Quadro P620
min: 14.32 avg: 14.5 median: 14.5 (4%) max: 14.65 fps
specvp12 mediacal-01 + NVIDIA Quadro P2000
min: 22.84 avg: 23 median: 23 (6%) max: 23.11 fps
specvp12 maya-04 + NVIDIA Quadro P4000 SPECviewperf 12 - specvp12 maya-04
77.9 fps (21%)
specvp12 maya-04 + NVIDIA Quadro P620
min: 40.7 avg: 40.9 median: 40.9 (11%) max: 41.03 fps
specvp12 maya-04 + NVIDIA Quadro P2000
min: 59.2 avg: 59.8 median: 59.8 (16%) max: 60.3 fps
specvp12 energy-01 + NVIDIA Quadro P4000 SPECviewperf 12 - specvp12 energy-01
10.3 fps (9%)
specvp12 energy-01 + NVIDIA Quadro P620
min: 3.86 avg: 3.9 median: 3.9 (3%) max: 3.93 fps
specvp12 energy-01 + NVIDIA Quadro P2000
min: 5.27 avg: 5.4 median: 5.4 (5%) max: 5.62 fps
specvp12 creo-01 + NVIDIA Quadro P4000 SPECviewperf 12 - specvp12 creo-01
97.1 fps (39%)
specvp12 creo-01 + NVIDIA Quadro P620
min: 59 avg: 59.5 median: 59.3 (24%) max: 60.3 fps
specvp12 creo-01 + NVIDIA Quadro P2000
min: 65 avg: 65.1 median: 65.1 (26%) max: 65.2 fps
specvp12 catia-04 + NVIDIA Quadro P4000 SPECviewperf 12 - specvp12 catia-04
115.2 fps (19%)
specvp12 catia-04 + NVIDIA Quadro P620
min: 53.2 avg: 54.2 median: 54.2 (9%) max: 55.1 fps
specvp12 catia-04 + NVIDIA Quadro P2000
min: 69.6 avg: 70.2 median: 70.2 (12%) max: 70.8 fps
specvp12 3dsmax-05 + NVIDIA Quadro P4000 SPECviewperf 12 - specvp12 3dsmax-05
93.6 fps (16%)
specvp12 3dsmax-05 + NVIDIA Quadro P620
57.5 fps (10%)
specvp12 3dsmax-05 + NVIDIA Quadro P2000
71.9 fps (13%)
SPECviewperf 13 specvp13 sw-04 + NVIDIA Quadro P620 SPECviewperf 13 - specvp13 sw-04
min: 78.5 avg: 81.7 median: 79.8 (21%) max: 86.7 fps
specvp13 sw-04 + NVIDIA Quadro P2000
96.1 fps (26%)
specvp13 snx-03 + NVIDIA Quadro P620 SPECviewperf 13 - specvp13 snx-03
min: 89 avg: 90.4 median: 90.4 (10%) max: 91.9 fps
specvp13 snx-03 + NVIDIA Quadro P2000
121.9 fps (14%)
specvp13 showcase-02 + NVIDIA Quadro P620 SPECviewperf 13 - specvp13 showcase-02
min: 25.23 avg: 26 median: 25.3 (6%) max: 27.4 fps
specvp13 showcase-02 + NVIDIA Quadro P2000
30.3 fps (7%)
specvp13 medical-02 + NVIDIA Quadro P620 SPECviewperf 13 - specvp13 medical-02
min: 13.05 avg: 19.1 median: 19.1 (4%) max: 25.1 fps
specvp13 medical-02 + NVIDIA Quadro P2000
18.5 fps (4%)
specvp13 maya-05 + NVIDIA Quadro P620 SPECviewperf 13 - specvp13 maya-05
min: 68.3 avg: 68.8 median: 68.8 (8%) max: 69.2 fps
specvp13 maya-05 + NVIDIA Quadro P2000
89.3 fps (10%)
specvp13 energy-02 + NVIDIA Quadro P620 SPECviewperf 13 - specvp13 energy-02
min: 7.29 avg: 7.7 median: 7.7 (2%) max: 8.07 fps
specvp13 energy-02 + NVIDIA Quadro P2000
5.3 fps (2%)
specvp13 creo-02 + NVIDIA Quadro P620 SPECviewperf 13 - specvp13 creo-02
min: 66.2 avg: 67.3 median: 67.7 (10%) max: 68 fps
specvp13 creo-02 + NVIDIA Quadro P2000
82.1 fps (12%)
specvp13 catia-05 + NVIDIA Quadro P620 SPECviewperf 13 - specvp13 catia-05
min: 76.6 avg: 77.4 median: 77.1 (9%) max: 78.4 fps
specvp13 catia-05 + NVIDIA Quadro P2000
104 fps (12%)
specvp13 3dsmax-06 + NVIDIA Quadro P620 SPECviewperf 13 - specvp13 3dsmax-06
min: 55.2 avg: 56.4 median: 56.7 (10%) max: 57.2 fps
specvp13 3dsmax-06 + NVIDIA Quadro P2000
71.7 fps (12%)
Cinebench R10 Cinebench R10 Shading (32bit) + NVIDIA Quadro P4000 Cinebench R10 - Cinebench R10 Shading (32bit)
6831 Points (5%)
Cinebench R10 Shading (32bit) + NVIDIA Quadro P620
6822 Points (5%)
Cinebench R10 Shading (32bit) + NVIDIA Quadro P2000
6782 Points (5%)
Cinebench R11.5 Cinebench R11.5 OpenGL 64 Bit + NVIDIA Quadro P4000 Cinebench R11.5 - Cinebench R11.5 OpenGL 64 Bit
105.6 fps (37%)
Cinebench R11.5 OpenGL 64 Bit + NVIDIA Quadro P620
126.4 fps (44%)
Cinebench R11.5 OpenGL 64 Bit + NVIDIA Quadro P2000
133.3 fps (46%)
Cinebench R15 + NVIDIA Quadro P4000 Cinebench R15 - Cinebench R15 OpenGL 64 Bit
107.2 fps (6%)
Cinebench R15 OpenGL 64 Bit + NVIDIA Quadro P620
min: 143 avg: 159.4 median: 166.3 (10%) max: 169 fps
Cinebench R15 OpenGL 64 Bit + NVIDIA Quadro P2000
min: 165.5 avg: 180.9 median: 180.9 (11%) max: 196.2 fps
Cinebench R15 OpenGL Ref. Match 64 Bit + NVIDIA Quadro P4000 Cinebench R15 - Cinebench R15 OpenGL Ref. Match 64 Bit
99.6 % (100%)
Cinebench R15 OpenGL Ref. Match 64 Bit + NVIDIA Quadro P620
99.6 % (100%)
Cinebench R15 OpenGL Ref. Match 64 Bit + NVIDIA Quadro P2000
99.6 % (100%)
GFXBench - GFXBench Car Chase Offscreen
209.8 fps (24%)
92.4 fps (10%)
GFXBench 3.1 - GFXBench Manhattan ES 3.1 Offscreen
318 fps (7%)
GFXBench 3.0 - GFXBench 3.0 Manhattan Offscreen
408.4 fps (24%)
GFXBench (DX / GLBenchmark) 2.7 + NVIDIA Quadro P4000 GFXBench (DX / GLBenchmark) 2.7 - GFXBench T-Rex HD Offscreen C24Z16
1114 fps (9%)
LuxMark v2.0 64Bit - LuxMark v2.0 Room GPU
1847 Samples/s (8%)
1107 Samples/s (5%)
min: 870 avg: 1075 median: 1075 (5%) max: 1280 Samples/s
LuxMark v2.0 64Bit - LuxMark v2.0 Sala GPU
3564 Samples/s (6%)
2058 Samples/s (4%)
min: 2636 avg: 2692 median: 2691.5 (5%) max: 2747 Samples/s
ComputeMark v2.1 - ComputeMark v2.1 Result
8609 Points (9%)
3516 Points (4%)
min: 4723 avg: 4859 median: 4858.5 (5%) max: 4994 Points
Power Consumption - Furmark Stress Test Power Consumption - external Monitor *
80.8 Watt (11%)
66.6 Watt (9%)
Power Consumption - The Witcher 3 Power Consumption - external Monitor *
99.5 Watt (14%)
Power Consumption - Witcher 3 Power Consumption *
min: 56 avg: 59.8 median: 59.8 (13%) max: 63.5 Watt
76.5 Watt (17%)
Power Consumption - Witcher 3 ultra Power Efficiency
min: 0.285 avg: 0.3 median: 0.3 (29%) max: 0.2946 fps per Watt
0.3 fps per Watt (34%)
Power Consumption - Witcher 3 ultra Power Efficiency - external Monitor
0.4 fps per Watt (34%)
Emissions Witcher 3 Fan Noise + NVIDIA Quadro P620 Emissions - Witcher 3 Fan Noise
min: 38.7 avg: 40.7 median: 40.7 (65%) max: 42.7 dB(A)
Witcher 3 Fan Noise + NVIDIA Quadro P2000
46.5 dB(A) (74%)
Average Benchmarks NVIDIA Quadro P4000 → 100% n=29 Average Benchmarks NVIDIA Quadro P620 → 69% n=29 Average Benchmarks NVIDIA Quadro P2000 → 79% n=29
- Bereich der Benchmarkergebnisse für diese Grafikkarte
- Durchschnittliche Benchmarkergebnisse für diese Grafikkarte
* Smaller numbers mean a higher performance
1 This benchmark is not used for the average calculation
Spiele-Benchmarks Die folgenden Benchmarks basieren auf unseren Spieletests mit Testnotebooks. Die Performance dieser Grafikkarte bei den gelisteten Spielen ist abhängig von der verwendeten CPU, Speicherausstattung, Treiber und auch Betriebssystem. Dadurch müssen die untenstehenden Werte nicht repräsentativ sein. Detaillierte Informationen über das verwendete System sehen Sie nach einem Klick auf den fps-Wert.
Quadro P620:
166 [X] MSI WP65 Intel Core i7-9750H 2.6GHz
Quadro P620
fps
Quadro P620:
117.8 [X] MSI WP65 Intel Core i7-9750H 2.6GHz
Quadro P620
fps
Quadro P620:
112 [X] MSI WP65 Intel Core i7-9750H 2.6GHz
Quadro P620
fps
Quadro P620:
92.4 [X] MSI WP65 Intel Core i7-9750H 2.6GHz
Quadro P620
fps
Quadro P620:
75.8 [X] MSI WP65 Intel Core i7-9750H 2.6GHz
Quadro P620
fps
Quadro P620:
29.7 [X] MSI WP65 Intel Core i7-9750H 2.6GHz
Quadro P620
fps
Quadro P620:
19.3 [X] MSI WP65 Intel Core i7-9750H 2.6GHz
Quadro P620
fps
Quadro P620:
14.5 [X] MSI WP65 Intel Core i7-9750H 2.6GHz
Quadro P620
fps
Quadro P620:
102 [X] MSI WP65 Intel Core i7-9750H 2.6GHz
Quadro P620
fps
Quadro P620:
46 [X] MSI WP65 Intel Core i7-9750H 2.6GHz
Quadro P620
fps
Quadro P620:
39 [X] MSI WP65 Intel Core i7-9750H 2.6GHz
Quadro P620
fps
Quadro P620:
26 [X] MSI WP65 Intel Core i7-9750H 2.6GHz
Quadro P620
fps
Quadro P620:
46.6 [X] MSI WP65 Intel Core i7-9750H 2.6GHz
Quadro P620
fps
Quadro P620:
21.4 [X] MSI WP65 Intel Core i7-9750H 2.6GHz
Quadro P620
fps
Quadro P620:
15.5 [X] MSI WP65 Intel Core i7-9750H 2.6GHz
Quadro P620
fps
Quadro P620:
12.9 [X] MSI WP65 Intel Core i7-9750H 2.6GHz
Quadro P620
fps
Quadro P620:
88.4 [X] MSI WP65 Intel Core i7-9750H 2.6GHz
Quadro P620
fps
Quadro P620:
35.2 [X] MSI WP65 Intel Core i7-9750H 2.6GHz
Quadro P620
fps
Quadro P620:
29.1 [X] MSI WP65 Intel Core i7-9750H 2.6GHz
Quadro P620
fps
Quadro P620:
26 [X] MSI WP65 Intel Core i7-9750H 2.6GHz
Quadro P620
fps
Quadro P620:
70 [X] MSI WP65 Intel Core i7-9750H 2.6GHz
Quadro P620
fps
Quadro P620:
16 [X] MSI WP65 Intel Core i7-9750H 2.6GHz
Quadro P620
fps
Quadro P620:
14 [X] MSI WP65 Intel Core i7-9750H 2.6GHz
Quadro P620
fps
Quadro P620:
12 [X] MSI WP65 Intel Core i7-9750H 2.6GHz
Quadro P620
fps
Quadro P620:
106 [X] MSI WP65 Intel Core i7-9750H 2.6GHz
Quadro P620
fps
Quadro P620:
55 [X] MSI WP65 Intel Core i7-9750H 2.6GHz
Quadro P620
fps
Quadro P620:
42 [X] MSI WP65 Intel Core i7-9750H 2.6GHz
Quadro P620
fps
Quadro P620:
25 [X] MSI WP65 Intel Core i7-9750H 2.6GHz
Quadro P620
fps
Quadro P620:
51.7 51.9 [X] MSI WP65 Intel Core i7-9750H 2.6GHz
Quadro P620
~ 52 fps
Quadro P620:
25.6 [X] MSI WP65 Intel Core i7-9750H 2.6GHz
Quadro P620
25.8 ~ 26 fps
Quadro P620:
18.3 [X] MSI WP65 Intel Core i7-9750H 2.6GHz
Quadro P620
18.5 ~ 18 fps
Quadro P620:
183.6 [X] MSI WP65 Intel Core i7-9750H 2.6GHz
Quadro P620
fps
Quadro P620:
113.2 [X] MSI WP65 Intel Core i7-9750H 2.6GHz
Quadro P620
fps
Quadro P620:
41.9 [X] MSI WP65 Intel Core i7-9750H 2.6GHz
Quadro P620
fps
Quadro P620:
29.3 [X] MSI WP65 Intel Core i7-9750H 2.6GHz
Quadro P620
fps
Quadro P620:
100.5 [X] MSI WP65 Intel Core i7-9750H 2.6GHz
Quadro P620
fps
Quadro P620:
48.6 [X] MSI WP65 Intel Core i7-9750H 2.6GHz
Quadro P620
fps
Quadro P620:
37.6 [X] MSI WP65 Intel Core i7-9750H 2.6GHz
Quadro P620
fps
Quadro P620:
30.1 [X] MSI WP65 Intel Core i7-9750H 2.6GHz
Quadro P620
fps
Quadro P620:
96 [X] MSI WP65 Intel Core i7-9750H 2.6GHz
Quadro P620
fps
Quadro P620:
37 [X] MSI WP65 Intel Core i7-9750H 2.6GHz
Quadro P620
fps
Quadro P620:
27 [X] MSI WP65 Intel Core i7-9750H 2.6GHz
Quadro P620
fps
Quadro P620:
20 [X] MSI WP65 Intel Core i7-9750H 2.6GHz
Quadro P620
fps
Quadro P620:
248.9 [X] MSI WP65 Intel Core i7-9750H 2.6GHz
Quadro P620
fps
Quadro P620:
153.5 [X] MSI WP65 Intel Core i7-9750H 2.6GHz
Quadro P620
fps
Quadro P620:
96.5 [X] MSI WP65 Intel Core i7-9750H 2.6GHz
Quadro P620
fps
Quadro P620:
144.7 [X] MSI WP65 Intel Core i7-9750H 2.6GHz
Quadro P620
fps
Quadro P620:
74.8 [X] MSI WP65 Intel Core i7-9750H 2.6GHz
Quadro P620
fps
Quadro P620:
56.7 [X] MSI WP65 Intel Core i7-9750H 2.6GHz
Quadro P620
fps
100%
Quadro P4000:
70.3 fps
100%
Quadro P4000:
61.6 fps
100%
Quadro P4000:
58.8 fps
100%
Quadro P4000:
66.7 fps
174%
Quadro P2000:
116 fps
100%
Quadro P4000:
55.2 fps
100%
Quadro P4000:
45.1 fps
100%
Quadro P4000:
43.7 fps
Quadro P620:
261.8 [X] MSI WP65 Intel Core i7-9750H 2.6GHz
Quadro P620
fps
Quadro P620:
169 [X] MSI WP65 Intel Core i7-9750H 2.6GHz
Quadro P620
fps
Quadro P620:
77 [X] MSI WP65 Intel Core i7-9750H 2.6GHz
Quadro P620
fps
100%
Quadro P4000:
119.5 fps
81%
Quadro P620:
96.7 [X] MSI WP65 Intel Core i7-9750H 2.6GHz
Quadro P620
fps
100%
Quadro P4000:
112.4 fps
68%
Quadro P620:
76.3 [X] MSI WP65 Intel Core i7-9750H 2.6GHz
Quadro P620
fps
48%
Quadro P620:
44.1 [X] MSI WP65 Intel Core i7-9750H 2.6GHz
Quadro P620
fps
100%
Quadro P4000:
87.1 fps
Quadro P620:
50.6 [X] MSI WP65 Intel Core i7-9750H 2.6GHz
Quadro P620
fps
Quadro P620:
29.2 [X] MSI WP65 Intel Core i7-9750H 2.6GHz
Quadro P620
fps
Quadro P620:
25.4 [X] MSI WP65 Intel Core i7-9750H 2.6GHz
Quadro P620
fps
100%
Quadro P4000:
115.9 fps
88%
Quadro P620:
101.9 [X] MSI WP65 Intel Core i7-9750H 2.6GHz
Quadro P620
fps
100%
Quadro P4000:
103.2 fps
61%
Quadro P620:
62.9 [X] MSI WP65 Intel Core i7-9750H 2.6GHz
Quadro P620
fps
100%
Quadro P4000:
76.8 fps
44%
Quadro P620:
33.7 [X] MSI WP65 Intel Core i7-9750H 2.6GHz
Quadro P620
fps
100%
Quadro P4000:
65.5 fps
40%
Quadro P620:
26.4 [X] MSI WP65 Intel Core i7-9750H 2.6GHz
Quadro P620
fps
100%
Quadro P4000:
122.5 fps
100%
Quadro P4000:
116.4 fps
100%
Quadro P4000:
89.2 fps
100%
Quadro P4000:
85.7 fps
100%
Quadro P4000:
159.7 fps
60%
Quadro P620:
90.7 101 [X] MSI WP65 Intel Core i7-9750H 2.6GHz
Quadro P620
~ 96 fps
100%
Quadro P4000:
113.6 fps
48%
Quadro P620:
51.7 57.7 [X] MSI WP65 Intel Core i7-9750H 2.6GHz
Quadro P620
~ 55 fps
65%
Quadro P2000:
71 76.1 ~ 74 fps
100%
Quadro P4000:
77.2 fps
41%
Quadro P620:
31.5 33 [X] MSI WP65 Intel Core i7-9750H 2.6GHz
Quadro P620
~ 32 fps
49%
Quadro P2000:
33 43.2 ~ 38 fps
100%
Quadro P4000:
41.1 fps
41%
Quadro P620:
16.5 18.1 [X] MSI WP65 Intel Core i7-9750H 2.6GHz
Quadro P620
~ 17 fps
61%
Quadro P2000:
24.3 26 ~ 25 fps
100%
Quadro P4000:
153.8 fps
100%
Quadro P4000:
106.3 fps
100%
Quadro P4000:
96.9 fps
100%
Quadro P4000:
84.5 fps
100%
Quadro P4000:
236.7 fps
100%
Quadro P4000:
184.1 fps
100%
Quadro P4000:
151.4 fps
100%
Quadro P4000:
63.3 fps
100%
Quadro P4000:
67.6 fps
100%
Quadro P4000:
61.1 fps
100%
Quadro P4000:
59.7 fps
100%
Quadro P4000:
44.9 fps
100%
Quadro P4000:
196.9 fps
153%
Quadro P620:
301.7 [X] MSI WP65 Intel Core i7-9750H 2.6GHz
Quadro P620
fps
161%
Quadro P2000:
317 fps
100%
Quadro P4000:
174.4 fps
92%
Quadro P620:
160.9 [X] MSI WP65 Intel Core i7-9750H 2.6GHz
Quadro P620
fps
122%
Quadro P2000:
213 fps
100%
Quadro P4000:
162.4 fps
86%
Quadro P620:
140 [X] MSI WP65 Intel Core i7-9750H 2.6GHz
Quadro P620
fps
113%
Quadro P2000:
184 fps
55%
Quadro P620:
52.8 [X] MSI WP65 Intel Core i7-9750H 2.6GHz
Quadro P620
fps
Quadro P620:
542 [X] MSI WP65 Intel Core i7-9750H 2.6GHz
Quadro P620
fps
Quadro P620:
258.9 [X] MSI WP65 Intel Core i7-9750H 2.6GHz
Quadro P620
fps
Quadro P620:
156.8 [X] MSI WP65 Intel Core i7-9750H 2.6GHz
Quadro P620
fps
Quadro P620:
82.4 [X] MSI WP65 Intel Core i7-9750H 2.6GHz
Quadro P620
fps
Quadro P620:
149.9 [X] MSI WP65 Intel Core i7-9750H 2.6GHz
Quadro P620
fps
Quadro P620:
73.1 [X] MSI WP65 Intel Core i7-9750H 2.6GHz
Quadro P620
fps
Quadro P620:
28.4 [X] MSI WP65 Intel Core i7-9750H 2.6GHz
Quadro P620
fps
Average Gaming NVIDIA Quadro P4000 → 100% Average Gaming 30-70 fps → 100%
Average Gaming NVIDIA Quadro P620 → 67% Average Gaming 30-70 fps → 50%
Average Gaming NVIDIA Quadro P2000 → 90% Average Gaming 30-70 fps → 69%
 Deutsch
 English
 Español
 Français
 Italiano
 Nederlands
 Polski
 Português
 Русский
 Türkçe
 Svenska
 Chinese
 Magyar