Notebookcheck Logo

Rockchip RK3066 1.5 GHz vs MediaTek MT8163 V/A 1.5 GHz

Rockchip RK3066 1.5 GHz

► remove from comparison  RK3066

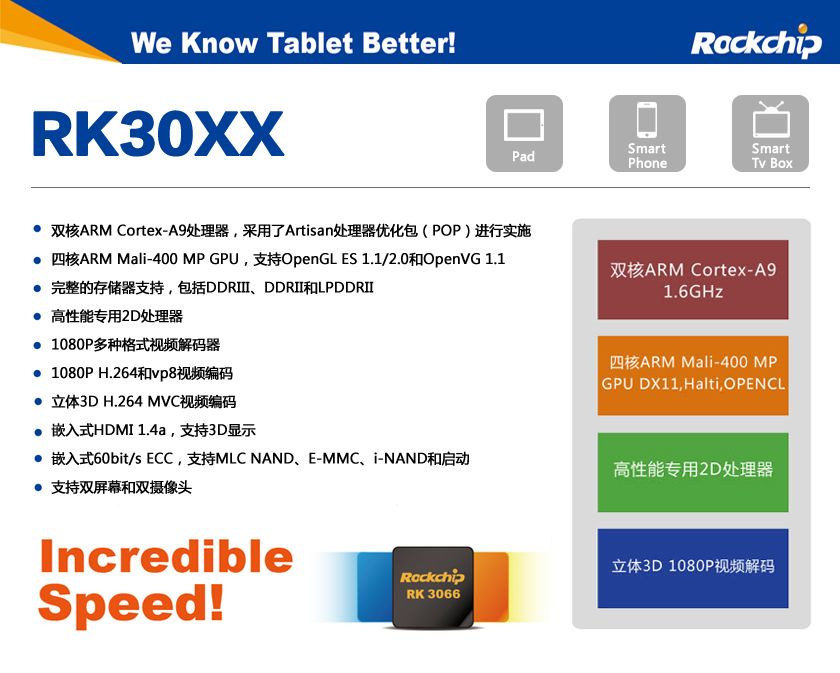
Der Rockchip RK3066 ist ein günstiger SoC für Tablets und Smartphones. Er bietet zwei ARM Cortex-A9 CPU Kerne mit NEON Erweiterungen, eine ARM Mali 400MP4 (Quad-Core mit 250 MHz getaktet) Grafikkarte und einen Video De- und Encoder. Der integrierte Speicherkontroller unterstützt maximal 2 GB DDR1-3.

Weitere Features lt Wikipedia

  • VPU (Video Processing Unit) Multi-Media Processor supporting 1080p image and video decoding
  • HDMI 1.4 Interface
  • 2-channels TFT LCD Interface with 5 layers and 3D Display (1920×1080 Maximum Display Size)
  • USB 2.0 Interface
  • SD/MMC Interface

MediaTek MT8163 V/A 1.5 GHz

► remove from comparison

Der MediaTek MT8163 V/A ist ein ARM basierender SoC für (Android) Tablets. Er bietet vier ARM Cortex-A53 Prozessorkerne mit bis zu 1.5 GHz, eine ARM Mali-T720 MP2 Grafikkarte mit 600 MHz und einen DDR3x32 1600Mbps Speicherkontroller. An drahtlosen Schnittstellen bietet der SoC Bluetooth 4.0, Dual Band 802.11 b/g/n WLAN, FM und GPS.

Im Vergleich zum langsameren MT8163 V/B taktet die CPU höher (1,5 versus 1,3 GHz) und auch die GPU (600 versus 520 MHz).

Die vier 64 Bit Cortex-A53 Kerne positionieren den SoC im Einstiegs-Mittelklasse Bereich in 2015.

ModelRockchip RK3066 1.5 GHzMediaTek MT8163 V/A 1.5 GHz
Series Mediatek
Serie: Cortex-A53
HiSilicon Kirin 9000W compare1.53 - 2.49 GHz12 / 12 cores
UNISOC Tiger T310 compare1.8 - 2 GHz4 / 4 cores
Rockchip RK3288 compare1.8 GHz4 / 4 cores
Apple A6x compare1.4 GHzcores
Apple A6 compare1 GHzcores
Apple S5 compare2 / 2 cores
HiSilicon k3v2 Hi3620 compare1.2 GHz4 / 4 cores
Rockchip RK3066 1.5 GHz « 1.5 GHz2 / 2 cores
Amlogic AML8726-MX compare1.5 GHz2 / 2 cores
Rockchip RK3168 compare1.2 GHz2 / 2 cores
Rockchip RK2918 1.2 GHz compare1.2 GHz1 / 1 cores
ARM Cortex A8 1.2 GHz compare1.2 GHz1 / 1 cores
Telechips TCC8803 1GHz compare1 GHz1 / 1 cores
Loongson 2F 900MHz compare0.9 GHz1 / 1 cores
CSR8670 compare0.08 GHzcores
ARM Cortex-M4 compare cores
HiSilicon Hi6262 compare cores
DK3.5+ST comparecores
unknown compare cores
JLQ JR510 compare1.5 - 2 GHz8 / 8 cores Cortex-A53
HiSilicon Kirin 935 compare2.2 GHz8 / 8 cores Cortex-A53
HiSilicon Kirin 659 compare2.36 GHz8 / 8 cores Cortex-A53
HiSilicon Kirin 658 compare2.35 GHz8 / 8 cores Cortex-A53
HiSilicon Kirin 655 compare2.1 GHz8 / 8 cores Cortex-A53
HiSilicon Kirin 650 compare2 GHz8 / 8 cores Cortex-A53
HiSilicon Kirin 930 compare2 GHz8 / 8 cores Cortex-A53
HiSilicon Kirin 620 compare1.2 GHz8 / 8 cores Cortex-A53
MediaTek MT8163 V/A 1.5 GHz « 1.5 GHz4 / 4 cores Cortex-A53
MediaTek MT8163 V/B 1.3 GHz compare1.3 GHz4 / 4 cores Cortex-A53
MediaTek MT8161 compare1.3 GHz4 / 4 cores Cortex-A53
Marvell Armada PXA1908 compare1.2 GHz4 / 4 cores Cortex-A53
Clock1500 MHz1500 MHz
L2 Cache512 KB
Cores / Threads2 / 24 / 4
Technology40 nm28 nm
FeaturesMali-400 MP4, Single Channel DDR3 Memory ControllerDDR3x32 memory controller 1600Mbps, T720 MP2@520MHz, internal Display up to 1366x768, HMID up to 1080p, H.265 1080p video decode, 13MP image signal processor, WiFi 802.11 a/b/g/n, embedded GPS module, Bluetooth 4.0, FM radio support, ARM TrustZone
iGPUARM Mali-400 MP4 (250 MHz)ARM Mali-T720 MP2 (600 MHz)
ArchitectureARMARM
Announced
Manufacturerwww.rock-chips.com
CodenameCortex-A53

Benchmarks

3DMark - 3DMark Ice Storm Physics
100%
1 RK3066 +
min: 4687     avg: 4990     median: 5059 (4%)     max: 5161 Points
3DMark - 3DMark Ice Storm Extreme Physics
100%
1 RK3066 +
4890 Points (4%)
3DMark - 3DMark Ice Storm Unlimited Physics
min: 8790     avg: 10063     median: 9926 (8%)     max: 11472 Points
3DMark - 3DMark Sling Shot Extreme (ES 3.1) Unlimited Physics
776 Points (9%)
3DMark - 3DMark Sling Shot (ES 3.0) Unlimited Physics
min: 768     avg: 831     median: 781 (9%)     max: 945 Points
Geekbench 5.0 - Geekbench 5.0 64 Bit Single-Core
134 Points (1%)
Geekbench 5.0 - Geekbench 5.0 64 Bit Multi-Core
375 Points (1%)
Geekbench 4.4 - Geekbench 4.1 - 4.4 64 Bit Single-Core
min: 549     avg: 636     median: 636 (6%)     max: 723 Points
Geekbench 4.4 - Geekbench 4.1 - 4.4 64 Bit Multi-Core
min: 1553     avg: 1781     median: 1781 (2%)     max: 2009 Points
Mozilla Kraken 1.1 - Kraken 1.1 Total Score *
min: 12550     avg: 14061     median: 14060.5 (16%)     max: 15571 ms
Sunspider - Sunspider 1.0 Total Score *
100%
1 RK3066 +
1959 ms (21%)
Octane V2 - Octane V2 Total Score
min: 2972     avg: 3261     median: 3261 (3%)     max: 3550 Points
Quadrant Standard Edition 2.0 - Quadrant Standard 2.0 Total Score
100%
1 RK3066 +
min: 3105     avg: 3862     median: 3974 (9%)     max: 4257 points
AnTuTu v6 - AnTuTu v6 Total Score
min: 33452     avg: 37816     median: 37815.5 (13%)     max: 42179 Points
AnTuTu v7 - AnTuTu v7 MEM
min: 4042     avg: 4277     median: 4276.5 (13%)     max: 4511 Points
AnTuTu v7 - AnTuTu v7 UX
min: 13724     avg: 15979     median: 15979 (20%)     max: 18234 Points
AnTuTu v7 - AnTuTu v7 GPU
min: 2431     avg: 2672     median: 2671.5 (1%)     max: 2912 Points
AnTuTu v7 - AnTuTu v7 CPU
min: 19354     avg: 21013     median: 21013 (13%)     max: 22672 Points
AnTuTu v7 - AnTuTu v7 Total Score
min: 39551     avg: 43893     median: 43892.5 (8%)     max: 48234 Points
PassMark PerformanceTest Mobile V1 - PerformanceTest Mobile V1 CPU Tests
100%
1 RK3066 +
5852 Points (1%)
PCMark for Android - PCM f. Android Computer Vision
2133 Points (11%)
PCMark for Android - PCM f. Android Storage
1923 Points (4%)
PCMark for Android - PCM f. Android Work Score 2.0
min: 3071     avg: 3328     median: 3424 (22%)     max: 3489 Points
PCMark for Android - PCM f. Android Work Score
4576 Points (23%)

Average Benchmarks Rockchip RK3066 1.5 GHz → 0% n=

Average Benchmarks MediaTek MT8163 V/A 1.5 GHz → 0% n=

- Bereich der Benchmarkergebnisse für diese Grafikkarte
- Durchschnittliche Benchmarkergebnisse für diese Grafikkarte
* Smaller numbers mean a higher performance
1 This benchmark is not used for the average calculation

Add one or more devices and compare

In the following list you can select (and also search for) devices that should be added to the comparison. You can select more than one device.

restrict list:

show all (including archived), 2024, 2023
v1.26
log 23. 13:29:06

#0 checking url part for id 3576 +0s ... 0s

#1 checking url part for id 8109 +0s ... 0s

#2 not redirecting to Ajax server +0s ... 0s

#3 did not recreate cache, as it is less than 5 days old! Created at Tue, 23 Apr 2024 05:40:15 +0200 +0.001s ... 0.001s

#4 composed specs +0.102s ... 0.103s

#5 did output specs +0s ... 0.103s

#6 getting avg benchmarks for device 3576 +0.003s ... 0.106s

#7 got single benchmarks 3576 +0.022s ... 0.128s

#8 getting avg benchmarks for device 8109 +0.003s ... 0.131s

#9 got single benchmarks 8109 +0.012s ... 0.143s

#10 got avg benchmarks for devices +0s ... 0.143s

#11 min, max, avg, median took s +0.077s ... 0.22s

#12 return log +0.022s ... 0.242s

Teilen Sie diesen Artikel, um uns zu unterstützen. Jeder Link hilft!
> Notebook Test, Laptop Test und News > Benchmarks / Technik > Benchmarks / Technik > Prozessor Vergleich - Head 2 Head
Autor: Klaus Hinum,  8.09.2017 (Update:  1.07.2023)