Intel UHD Graphics 600 vs Intel UHD Graphics 610 vs Intel HD Graphics 515
Intel UHD Graphics 600 ► remove from comparison
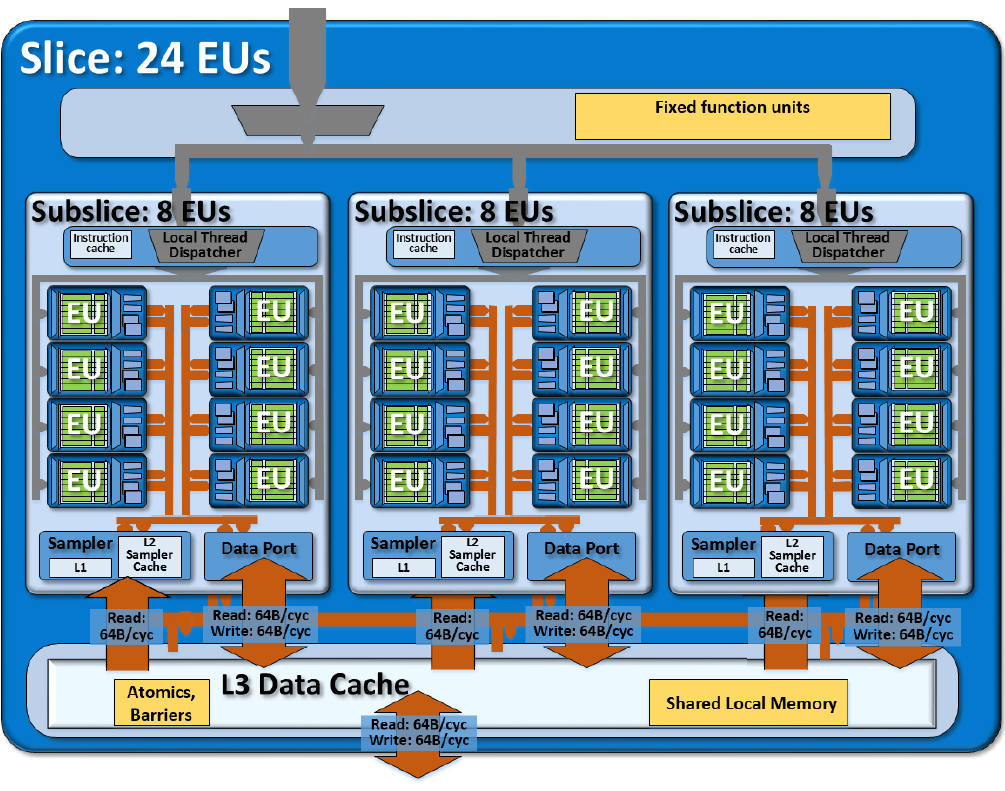
Die Intel UHD Graphics 600 ist eine Prozessorgrafikkarte der Ende 2017 vorgestellten Gemini-Lake-Generation (z.B. Celeron N4100). Zwar glänzt die GPU mit einer sehr niedrigen Leistungsaufnahme, allerdings siedelt sich die Performance nur im untersten Low-End-Segment an und ist für neuere Spiele zumeist nicht ausreichend. Als teildeaktivierte Variante der Gemini-Lake-GPU verfügt die UHD Graphics 600 nur über 12 Execution Units (UHD Graphics 605: 18 EUs), die je nach Modell mit bis zu 650 bis 750 MHz takten. Technisch basiert die GPU auf der Intel-Gen9-Architektur, die auch bei der teureren Skylake-Serie und der alten HD Graphics 500 zum Einsatz kommt. Im Vergleich zur HD Graphics 500 haben sich daher nur die möglichen die Displayanschlüsse geändert (Gen 10 nun mit wahrscheinlich HDMI 2.0 nativ).
Mangels eigenem Grafikspeicher oder eDRAM-Cache greift die UHD Graphics 600 über das Interface des Prozessors auf den System-RAM zu (2x 64 Bit DDR3L / LPDDR4-2400).
Performance
Die Performance der UHD Graphics 600 sollte bei gleicher Taktrate auf dem selben Niveau wie bei der HD Graphics 500 sein. Dadurch positioniert sich die UHD Graphics 600 nur im absoluten Einstiegsbereich und kann nur wenige aktuelle Spiele flüssig darstellen. Die HD Graphics 500 im Spin 1 schaffte z.b. nur Sims 4, Dirt 3 und World of Warcraft. Selbst Counter-Strike: Go war im EZbook 3 z.B. nicht flüssig spielbar.
Features
Der überarbeitete Videodecoder decodiert und encodiert H.265-/HEVC-Videos (8b und 10b) sowie VP9 vollständig in Hardware und arbeitet dadurch deutlich effizienter als bislang. Bei der Bildausgabe unterstützt der SoC dank Gen.10 nun auch HDMI 2.0a mit HDCP 2.2 un DisplayPort 1.2a nativ.
Leistungsaufnahme
Die TDP des gesamten SoCs liegt bei standardmäßig bei 6 Watt, sodass die GPU vor allem in (oftmals passiv gekühlten) Netbooks oder schlanken Notebooks zu finden ist. Optional kann die TDP auch auf 4,8 Watt abgesenkt werden, wodurch allerdings die Performance sinkt.
Intel UHD Graphics 610 ► remove from comparison
Die Intel UHD Graphics 610 (GT1) ist eine Prozessorgrafikkarte in den schwächeren Pentium Modellen (z.b. Whiskey Lake basierter Pentium Gold 6405U ). Im Vergleich zur älteren HD Graphics 610 (z. B. in Kaby-Lake Pentium CPUs), wurde nur der Name geändert. Zwar glänzt die GPU mit einer niedrigen Leistungsaufnahme, allerdings siedelt sich die Performance nur im Low-End-Segment an und ist für neuere Spiele selten ausreichend. Als sogenannte GT1-Ausbaustufe der verfügt die UHD Graphics 610 über 12 Execution Units (EUs), die je nach Modell mit bis zu 950 MHz takten.
Mangels eigenem Grafikspeicher oder eDRAM-Cache greift die HD Graphics 610 über das Interface des Prozessors auf den System-RAM zu (2x 64 Bit DDR4-2133/DDR3L-1600/LPDDR3-1866).
Performance - Nur wenige Spiele laufen flüssig
Die Leistung der UHD Graphics 610 ist vergleichbar mit der identischen HD Graphics 610 und sehr ähnlichen HD Graphics 510 und dadurch nur für sehr anspruchslose Spiele geeignet. Farming Simulator 17, World of Warships oder Dota 2 Reborn sind z.B. Spiele die in niedrigster Detailstufe spielbar sein sollten.
Features - H.265 in Hardware
Anders als Skylake kann Kaby Lake und dere Nachfolger nun auch H.265/HEVC im Main10-Profil mit 10 Bit Farbtiefe sowie Googles VP9-Codec in Hardware decodieren. Die Kaby-Lake Pentium Modelle sollten auch schon HDCP 2.2 unterstützen, was beispielsweise für die Ausgabe von Netflix-Videos in 4K benötigt wird. HDMI 2.0 unterstützt die HD Graphics 620 jedoch weiterhin nur per Wandler (LSPCon) über den DisplayPort.
Leistungsaufnahme
Die TDP des gesamten Chips liegt standardmäßig bei 15 Watt, sodass die GPU vor allem in Ultrabooks oder oder schlanken Notebooks zu finden ist. Teils kann die TDP auch auf 10 Watt abgesenkt werden, wodurch allerdings die Performance sinkt.
Intel HD Graphics 515 ► remove from comparison
Die Intel HD Graphics 515 (GT2) ist eine Prozessorgrafikkarte der im September 2015 vorgestellten Core-m-CPUs der Skylake-Generation (z.B. Core m7-6Y75 ). Zwar glänzt die GPU mit einer extrem niedrigen Leistungsaufnahme, allerdings siedelt sich die Performance nur im absoluten Low-End-Segment an und ist für neuere Spiele kaum ausreichend. Als sogenannte GT2-Ausbaustufe der Skylake-GPU verfügt die HD Graphics 515 über 24 Execution Units (EUs), die je nach Modell mit bis zu 1.000 MHz takten.
Mangels eigenem Grafikspeicher oder eDRAM-Cache greift die HD Graphics 515 über das Interface des Prozessors auf den System-RAM zu (2x 64 Bit DDR3L-1600/LPDDR3-1866).
Performance
Die exakte Leistung der HD Graphics 515 hängt stark vom jeweiligen CPU-Modell und Endgerät ab, da sich Maximaltaktrate und TDP-Einstellung unterscheiden können. Zum anderen bestimmt auch der eingesetzte Speicher die Performance.
Im Optimalfall übertrifft die HD 515 sogar leicht die ältere HD Graphics 4400 , kann aktuelle Spiele (Stand 2015) aber dennoch allenfalls in niedrigsten Einstellungen flüssig darstellen.
Features
Der überarbeitete Videodecoder decodiert nun auch H.265-/HEVC-Videos vollständig in Hardware und arbeitet dadurch deutlich effizienter als bislang. Die Bildausgabe erfolgt über DP 1.2/eDP 1.3 (max. 3.840 x 2.160 @ 60 Hz), wohingegen HDMI nur in der älteren Version 1.4a angeboten wird. Ein HDMI-2.0-Anschluss kann aber mittels Konverter von DisplayPort ergänzt werden. Maximal lassen sich drei Displays parallel angesteuern.
Leistungsaufnahme
Die TDP des gesamten Chips liegt standardmäßig bei 4,5 Watt, sodass viele Ultrabooks oder 2-in-1-Geräte mit einer rein passiven Kühlung auskommen. Teils kann die TDP auch auf niedrigere (3,5/3,8 Watt) oder höhere Werte (7 Watt) angepasst werden.
Intel UHD Graphics 600 Intel UHD Graphics 610 Intel HD Graphics 515 Gen. 9 Serie Codename Gemini Lake Kaby Lake GT1 Skylake GT2 Architektur Gen. 9 Gemini Lake Gen. 9 Kaby Lake Gen. 9 Skylake Pipelines 12 - unified 12 - unified 24 - unified Kerntakt 300 - 700 (Boost) MHz 300 - 950 (Boost) MHz 300 - 1000 (Boost) MHz Speicherbandbreite 64/128 Bit 64/128 Bit 64/128 Bit Speichertyp DDR4 / LPDDR4 DDR3/DDR4 DDR3L/LPDDR3 Shared Memory ja ja ja API DirectX 12_1, OpenGL 4.4 DirectX 12_1, OpenGL 4.4 DirectX 12_1, OpenGL 4.4 Herstellungsprozess 14 nm 14 nm 14 nm Features QuickSync QuickSync QuickSync Erscheinungsdatum 11.12.2017 01.01.2019 01.09.2015
CPU in UHD Graphics 600 GPU Base Speed GPU Boost / Turbo Intel Celeron J4125 4 x 2000 MHz, 10 W 250 MHz 750 MHz Intel Celeron J4105 4 x 1500 MHz, 10 W 250 MHz 750 MHz Intel Celeron J4005 2 x 2000 MHz, 10 W 250 MHz 700 MHz » show 6 more Intel Celeron N4120 4 x 1100 MHz, 6 W 200 MHz 700 MHz Intel Celeron J4115 4 x 1800 MHz, 10 W 250 MHz 750 MHz Intel Celeron N4100 4 x 1100 MHz, 6 W 200 MHz 700 MHz Intel Celeron J4025 2 x 2000 MHz, 10 W 250 MHz 700 MHz Intel Celeron N4020 2 x 1100 MHz, 6 W 200 MHz 650 MHz Intel Celeron N4000 2 x 1100 MHz, 6 W 200 MHz 650 MHz min. - max. 200 - 250 MHz 650 - 750 MHz
CPU in UHD Graphics 610 GPU Base Speed GPU Boost / Turbo Intel Core i5-10200H 4 x 2400 MHz, 45 W 350 MHz 1050 MHz Intel Pentium Gold 6405U 2 x 2400 MHz, 15 W 300 MHz 900 MHz Intel Pentium Gold 5405U 2 x 2300 MHz, 15 W 300 MHz 950 MHz Intel Celeron 5205U 2 x 1900 MHz, 15 W 300 MHz 900 MHz min. - max. 200 - 350 MHz 650 - 1050 MHz
CPU in HD Graphics 515 GPU Base Speed GPU Boost / Turbo Intel Core m7-6Y75 2 x 1200 MHz, 4.5 W 300 MHz 1000 MHz Intel Core m5-6Y57 2 x 1100 MHz, 4.5 W 300 MHz 900 MHz Intel Core m5-6Y54 2 x 1100 MHz, 4.5 W 300 MHz 900 MHz Intel Core m3-6Y30 2 x 900 MHz, 4.5 W 300 MHz 850 MHz min. - max. 200 - 350 MHz 650 - 1050 MHz
Benchmarks Performance Rating - 3DMark 11 + Fire Strike + Time Spy - UHD Graphics 600
0.2 pt (1%)
...
...
max:
Performance Rating - 3DMark 11 + Fire Strike + Time Spy - UHD Graphics 610
0.3 pt (1%)
...
...
max:
Performance Rating - 3DMark 11 + Fire Strike + Time Spy - HD Graphics 515
0.3 pt (1%)
...
...
max:
3DMark - 3DMark Time Spy Score
min: 97 avg: 123 median: 125 (0%) max: 143 Points
222 Points (1%)
3DMark - 3DMark Time Spy Graphics
min: 85 avg: 107.5 median: 109 (0%) max: 124 Points
194 Points (1%)
3DMark - 3DMark Ice Storm Unlimited Graphics
min: 17048 avg: 27966 median: 30149 (3%) max: 43067 Points
min: 41521 avg: 42713 median: 42712.5 (5%) max: 43904 Points
min: 43449 avg: 58940 median: 56787 (6%) max: 78808 Points
3DMark - 3DMark Ice Storm Extreme Graphics
min: 8277 avg: 13725 median: 14480 (2%) max: 19919 Points
20443 Points (3%)
min: 18749 avg: 24669 median: 23314 (3%) max: 33413 Points
3DMark - 3DMark Cloud Gate Score
min: 1932 avg: 2983 median: 3124 (3%) max: 4616 Points
min: 4244 avg: 4334 median: 4333.5 (5%) max: 4423 Points
min: 2705 avg: 3940 median: 3850.5 (4%) max: 5257 Points
3DMark - 3DMark Cloud Gate Graphics
min: 2346 avg: 3365 median: 3435.5 (1%) max: 4958 Points
min: 5139 avg: 5277 median: 5276.5 (1%) max: 5414 Points
min: 3982 avg: 5440 median: 5467 (1%) max: 7035 Points
3DMark - 3DMark Fire Strike Standard Score
min: 277 avg: 395.9 median: 401.5 (1%) max: 619 Points
min: 597 avg: 616 median: 616 (1%) max: 635 Points
min: 453 avg: 617 median: 623.5 (1%) max: 780 Points
3DMark - 3DMark Fire Strike Standard Graphics
min: 307 avg: 421.2 median: 433 (0%) max: 637 Points
min: 634 avg: 664 median: 663.5 (1%) max: 693 Points
min: 494 avg: 679 median: 691.5 (1%) max: 892 Points
3DMark - 3DMark Ice Storm Graphics
min: 14412 avg: 23582 median: 24012 (3%) max: 35101 Points
min: 33154 avg: 36325 median: 36325 (4%) max: 39496 Points
min: 31627 avg: 44439 median: 45108 (5%) max: 54558 Points
3DMark - 3DMark Sling Shot (ES 3.0) Unlimited
2272 Points (10%)
3DMark - 3DMark Sling Shot (ES 3.0) Unlimited Graphics
2776 Points (6%)
3DMark - 3DMark Night Raid
1774 Points (2%)
2629 Points (2%)
3DMark - 3DMark Night Raid Graphics Score
1917 Points (1%)
2850 Points (1%)
3DMark 11 - 3DM11 Performance Score
min: 472 avg: 624 median: 647.5 (1%) max: 985 Points
min: 1026 avg: 1046 median: 1045.5 (1%) max: 1065 Points
min: 785 avg: 1105 median: 1115 (2%) max: 1360 Points
3DMark 11 - 3DM11 Performance GPU
min: 410 avg: 558 median: 578 (0%) max: 854 Points
min: 915 avg: 923 median: 922.5 (1%) max: 930 Points
min: 714 avg: 1013 median: 1014 (1%) max: 1254 Points
3DMark Vantage + Intel UHD Graphics 600 3DMark Vantage - 3DM Vant. Perf. total
min: 1856 avg: 2189 median: 2189 (1%) max: 2522 Points
3DM Vant. Perf. total + Intel UHD Graphics 610
3996 Points (1%)
3DM Vant. Perf. total + Intel HD Graphics 515
4672 Points (1%)
3DM Vant. Perf. GPU no PhysX + Intel UHD Graphics 600 3DMark Vantage - 3DM Vant. Perf. GPU no PhysX
min: 1603 avg: 1836 median: 1836 (1%) max: 2069 Points
3DM Vant. Perf. GPU no PhysX + Intel UHD Graphics 610
3375 Points (2%)
3DM Vant. Perf. GPU no PhysX + Intel HD Graphics 515
4218 Points (2%)
3DMark 2001SE - 3DMark 2001 - Standard
20345 Points (21%)
3DMark 03 - 3DMark 03 - Standard
18019 Points (9%)
3DMark 05 - 3DMark 05 - Standard
min: 6084 avg: 6352 median: 6351.5 (7%) max: 6619 Points
12054 Points (13%)
9173 Points (10%)
3DMark 06 3DMark 06 - Standard 1280x1024 + Intel UHD Graphics 600
min: 3052 avg: 3884 median: 3960 (5%) max: 4713 Points
3DMark 06 - Standard 1280x1024 + Intel UHD Graphics 610
min: 6026 avg: 6902 median: 6902 (9%) max: 7778 Points
3DMark 06 - Standard 1280x1024 + Intel HD Graphics 515
min: 4968 avg: 6621 median: 6446 (8%) max: 7912 Points
Unigine Valley 1.0 - Unigine Valley 1.0 DX
1.1 fps (0%)
min: 3 avg: 3.4 median: 3.4 (1%) max: 3.7 fps
Unigine Heaven 3.0 - Unigine Heaven 3.0 DX 11
10.2 fps (3%)
Unigine Heaven 2.1 - Heaven 2.1 high
min: 15.7 avg: 16.9 median: 16.9 (3%) max: 18 fps
SPECviewperf 12 + Intel HD Graphics 515 SPECviewperf 12 - specvp12 sw-03
17.6 fps (4%)
specvp12 snx-02 + Intel HD Graphics 515 SPECviewperf 12 - specvp12 snx-02
2.1 fps (0%)
specvp12 showcase-01 + Intel HD Graphics 515 SPECviewperf 12 - specvp12 showcase-01
5 fps (1%)
specvp12 mediacal-01 + Intel HD Graphics 515 SPECviewperf 12 - specvp12 mediacal-01
1.8 fps (0%)
specvp12 maya-04 + Intel HD Graphics 515 SPECviewperf 12 - specvp12 maya-04
9 fps (2%)
specvp12 energy-01 + Intel HD Graphics 515 SPECviewperf 12 - specvp12 energy-01
0.1 fps (0%)
specvp12 creo-01 + Intel HD Graphics 515 SPECviewperf 12 - specvp12 creo-01
7.9 fps (3%)
specvp12 catia-04 + Intel HD Graphics 515 SPECviewperf 12 - specvp12 catia-04
9.8 fps (2%)
Cinebench R10 Cinebench R10 Shading (32bit) + Intel UHD Graphics 600 Cinebench R10 - Cinebench R10 Shading (32bit)
min: 3002 avg: 3471 median: 3504 (2%) max: 3825 Points
Cinebench R10 Shading (32bit) + Intel UHD Graphics 610
min: 4516 avg: 5210 median: 5209.5 (4%) max: 5903 Points
Cinebench R10 Shading (32bit) + Intel HD Graphics 515
min: 4740 avg: 6063 median: 6088 (4%) max: 7263 Points
Cinebench R11.5 Cinebench R11.5 OpenGL 64 Bit + Intel UHD Graphics 600 Cinebench R11.5 - Cinebench R11.5 OpenGL 64 Bit
min: 7.51 avg: 10.2 median: 10.8 (4%) max: 12.17 fps
Cinebench R11.5 OpenGL 64 Bit + Intel UHD Graphics 610
17.3 fps (6%)
Cinebench R11.5 OpenGL 64 Bit + Intel HD Graphics 515
min: 16.86 avg: 23.6 median: 23.1 (8%) max: 31.86 fps
Cinebench R15 + Intel UHD Graphics 600 Cinebench R15 - Cinebench R15 OpenGL 64 Bit
min: 6.47 avg: 15.3 median: 16.4 (1%) max: 20.26 fps
Cinebench R15 OpenGL 64 Bit + Intel UHD Graphics 610
min: 27.5 avg: 28.4 median: 28.4 (2%) max: 29.24 fps
Cinebench R15 OpenGL 64 Bit + Intel HD Graphics 515
min: 18.93 avg: 28.6 median: 29.4 (2%) max: 35.98 fps
Cinebench R15 OpenGL Ref. Match 64 Bit + Intel UHD Graphics 600 Cinebench R15 - Cinebench R15 OpenGL Ref. Match 64 Bit
97.8 % (98%)
Cinebench R15 OpenGL Ref. Match 64 Bit + Intel UHD Graphics 610
97.8 % (98%)
Cinebench R15 OpenGL Ref. Match 64 Bit + Intel HD Graphics 515
min: 97.7 avg: 98 median: 97.8 (98%) max: 99.3 %
GFXBench - GFXBench 5.0 Aztec Ruins High Tier Offscreen
min: 3.4 avg: 3.7 median: 3.7 (1%) max: 3.9 fps
5.4 fps (1%)
GFXBench - GFXBench 5.0 Aztec Ruins Normal Tier Offscreen
min: 9 avg: 10 median: 9.9 (1%) max: 11 fps
15.3 fps (1%)
GFXBench - GFXBench Car Chase Offscreen
min: 5.4 avg: 7.7 median: 8.1 (1%) max: 9.2 fps
16.7 fps (2%)
20.9 fps (2%)
GFXBench 3.1 - GFXBench Manhattan ES 3.1 Offscreen
min: 13.4 avg: 14.5 median: 15 (0%) max: 15 fps
23.1 fps (0%)
min: 25.5 avg: 27.7 median: 27.7 (1%) max: 29.9 fps
GFXBench 3.0 - GFXBench 3.0 Manhattan Offscreen
min: 18.2 avg: 19.4 median: 19 (1%) max: 21 fps
33.1 fps (2%)
min: 31.9 avg: 36.5 median: 36.7 (2%) max: 43.6 fps
GFXBench (DX / GLBenchmark) 2.7 + Intel UHD Graphics 600 GFXBench (DX / GLBenchmark) 2.7 - GFXBench T-Rex HD Offscreen C24Z16
min: 33.3 avg: 37.2 median: 37.2 (0%) max: 41 fps
GFXBench T-Rex HD Offscreen C24Z16 + Intel UHD Graphics 610
71.9 fps (1%)
GFXBench T-Rex HD Offscreen C24Z16 + Intel HD Graphics 515
min: 70 avg: 75.4 median: 73.2 (1%) max: 87 fps
Basemark GPU 1.2 - Basemark GPU 1.2 Vulkan Official Medium Offscreen 1080
min: 15.5 avg: 15.8 median: 15.8 (0%) max: 16 fps
25.5 fps (0%)
Basemark GPU 1.2 - Basemark GPU 1.2 Vulkan Official High Offscreen 2160
1.3 fps (0%)
LuxMark v2.0 64Bit - LuxMark v2.0 Room GPU
min: 70 avg: 78.3 median: 76 (0%) max: 89 Samples/s
min: 144 avg: 157 median: 157 (1%) max: 170 Samples/s
min: 173 avg: 183 median: 183 (1%) max: 193 Samples/s
LuxMark v2.0 64Bit - LuxMark v2.0 Sala GPU
min: 122 avg: 135.3 median: 129 (0%) max: 155 Samples/s
min: 295 avg: 304.5 median: 304.5 (1%) max: 314 Samples/s
min: 395 avg: 413.5 median: 416 (1%) max: 427 Samples/s
ComputeMark v2.1 - ComputeMark v2.1 Result
min: 337 avg: 357.5 median: 358 (0%) max: 377 Points
min: 480 avg: 481.5 median: 481.5 (1%) max: 483 Points
min: 476 avg: 660 median: 704 (1%) max: 741 Points
Power Consumption - Furmark Stress Test Power Consumption - external Monitor *
min: 8.15 avg: 10.2 median: 10 (1%) max: 12.6 Watt
min: 18 avg: 23.1 median: 23.1 (3%) max: 28.2 Watt
Power Consumption - Witcher 3 Power Consumption *
14.7 Watt (3%)
25.6 Watt (6%)
Clock Speed - GPU Clock Speed Furmark
min: 500 avg: 519 median: 519 (21%) max: 538 MHz
948 MHz (38%)
Average Benchmarks Intel UHD Graphics 600 → 100% n=24 Average Benchmarks Intel UHD Graphics 610 → 166% n=24 Average Benchmarks Intel HD Graphics 515 → 187% n=24
- Bereich der Benchmarkergebnisse für diese Grafikkarte
- Durchschnittliche Benchmarkergebnisse für diese Grafikkarte
* Smaller numbers mean a higher performance
1 This benchmark is not used for the average calculation
Spiele-Benchmarks Die folgenden Benchmarks basieren auf unseren Spieletests mit Testnotebooks. Die Performance dieser Grafikkarte bei den gelisteten Spielen ist abhängig von der verwendeten CPU, Speicherausstattung, Treiber und auch Betriebssystem. Dadurch müssen die untenstehenden Werte nicht repräsentativ sein. Detaillierte Informationen über das verwendete System sehen Sie nach einem Klick auf den fps-Wert.
UHD Graphics 610:
19.7 [X] Nofflink M500-5405U 874931
Intel Pentium Gold 5405U 2.3GHz
UHD Graphics 610
min:
4 fps, P1:
11 fps, max:
23 fps
fps
UHD Graphics 610:
7.9 [X] Nofflink M500-5405U 874931
Intel Pentium Gold 5405U 2.3GHz
UHD Graphics 610
min:
2 fps, P1:
5 fps, max:
9 fps
fps
UHD Graphics 610:
6.3 [X] Nofflink M500-5405U 874931
Intel Pentium Gold 5405U 2.3GHz
UHD Graphics 610
min:
3 fps, P1:
4 fps, max:
7 fps
fps
UHD Graphics 610:
17.6 fps
100%
UHD Graphics 600:
31.9 fps
100%
UHD Graphics 600:
12.8 fps
100%
UHD Graphics 600:
11.3 fps
100%
UHD Graphics 600:
5.1 fps
304%
UHD Graphics 610:
15.5 fps
UHD Graphics 610:
0 (!) fps
100%
UHD Graphics 600:
29 fps
100%
UHD Graphics 600:
28.9 fps
105%
UHD Graphics 610:
30.4 fps
100%
UHD Graphics 600:
14.9 fps
147%
UHD Graphics 610:
21.9 fps
100%
UHD Graphics 600:
11.3 [X] BMAX MaxBook Y11 H1M6 Intel Celeron N4100 1.1GHz
UHD Graphics 600
min:
3.96 fps, P0.1:
4.94 fps, P1:
8.44 fps, max:
91 fps
fps
100%
UHD Graphics 600:
5.7 9 ~ 7 fps
237%
UHD Graphics 610:
16.6 fps
100%
UHD Graphics 600:
42.5 fps
100%
UHD Graphics 600:
29.8 fps
100%
UHD Graphics 600:
22 fps
100%
UHD Graphics 600:
19.2 fps
100%
UHD Graphics 600:
9.8 fps
172%
UHD Graphics 610:
16.9 fps
100%
UHD Graphics 600:
8.3 fps
125%
UHD Graphics 610:
10.4 fps
100%
UHD Graphics 600:
0 (!) [X] Chuwi LapBook SE Intel Celeron N4100 1.1GHz
UHD Graphics 600
2 ~ 1 fps
100%
UHD Graphics 600:
17.7 fps
136%
UHD Graphics 610:
23.6 24.7 ~ 24 fps
100%
UHD Graphics 600:
1 fps
800%
UHD Graphics 610:
7 8 ~ 8 fps
100%
UHD Graphics 600:
7.8 fps
100%
UHD Graphics 600:
3 fps
100%
UHD Graphics 600:
7 fps
100%
UHD Graphics 600:
4 fps
100%
UHD Graphics 600:
0 (!) [X] Chuwi LapBook SE Intel Celeron N4100 1.1GHz
UHD Graphics 600
4 5.1 ~ 3 fps
HD Graphics 515:
21 (!) [X] Cube i9 Intel Core m3-6Y30 0.9GHz
HD Graphics 515
max:
30 fps
fps
100%
UHD Graphics 600:
4 fps
225%
UHD Graphics 610:
9 fps
100%
UHD Graphics 600:
8 9.5 [X] 1.47.22.14 D3D12
Intel Celeron N4100 1.1GHz
UHD Graphics 600
min:
5 fps, P1:
5 fps, max:
98.6 fps
~ 9 fps
203%
UHD Graphics 610:
18.3 [X] Nofflink M500-5405U 1.47.22.14 D3D12
Intel Pentium Gold 5405U 2.3GHz
UHD Graphics 610
min:
5 fps, P1:
6.15 fps, max:
195.1 fps
fps
100%
UHD Graphics 600:
6.1 [X] 1.47.22.14 D3D12
Intel Celeron N4100 1.1GHz
UHD Graphics 600
min:
5 fps, P1:
5 fps, max:
60.1 fps
fps
126%
UHD Graphics 610:
7.7 [X] Nofflink M500-5405U 1.47.22.14 D3D12
Intel Pentium Gold 5405U 2.3GHz
UHD Graphics 610
min:
5 fps, P1:
5 fps, max:
169.3 fps
fps
100%
UHD Graphics 600:
5.8 [X] 1.47.22.14 D3D12
Intel Celeron N4100 1.1GHz
UHD Graphics 600
min:
5 fps, P1:
5 fps, max:
100 fps
fps
172%
UHD Graphics 610:
10 [X] Nofflink M500-5405U 1.47.22.14 D3D12
Intel Pentium Gold 5405U 2.3GHz
UHD Graphics 610
min:
5 fps, P1:
5 fps, max:
151.2 fps
fps
100%
UHD Graphics 600:
3.6 [X] 1.47.22.14 D3D12
Intel Celeron N4100 1.1GHz
UHD Graphics 600
min:
5 fps, P1:
5 fps, max:
74.6 fps
fps
378%
UHD Graphics 610:
13.6 [X] Nofflink M500-5405U 1.47.22.14 D3D12
Intel Pentium Gold 5405U 2.3GHz
UHD Graphics 610
min:
5 fps, P1:
5 fps, max:
158.2 fps
fps
100%
UHD Graphics 600:
12 fps
100%
UHD Graphics 600:
3 fps
267%
UHD Graphics 610:
7 8 ~ 8 fps
100%
UHD Graphics 600:
34.8 34.8 ~ 35 fps
100%
UHD Graphics 600:
4.6 4.8 ~ 5 fps
100%
UHD Graphics 600:
0 (!) [X] Chuwi LapBook SE Intel Celeron N4100 1.1GHz
UHD Graphics 600
3.9 5 5.9 6.2 6.2 6.4 [X] Blackview AceBook 1 Intel Celeron N4120 1.1GHz
UHD Graphics 600
6.4 [X] Intel Celeron J4125 2GHz
UHD Graphics 600
6.5 [X] Intel Celeron N4100 1.1GHz
UHD Graphics 600
6.7 6.9 6.9 7.1 7.2 7.7 [X] GMK NucBox 3 Intel Celeron J4125 2GHz
UHD Graphics 600
7.7 8.1 [X] Intel NUC7CJYSAMN Intel Celeron J4025 2GHz
UHD Graphics 600
8.6 [X] Teclast F7 Air Intel Celeron N4120 1.1GHz
UHD Graphics 600
8.9 ~ 6 fps
167%
UHD Graphics 610:
9.6 10.9 ~ 10 fps
240%
HD Graphics 515:
14.4 [X] Cube i9 Intel Core m3-6Y30 0.9GHz
HD Graphics 515
fps
100%
UHD Graphics 600:
3.4 3.4 3.5 4 4.2 4.2 [X] Blackview AceBook 1 Intel Celeron N4120 1.1GHz
UHD Graphics 600
4.7 4.8 [X] GMK NucBox 3 Intel Celeron J4125 2GHz
UHD Graphics 600
4.8 [X] Intel Celeron J4125 2GHz
UHD Graphics 600
4.9 4.9 [X] Intel Celeron N4100 1.1GHz
UHD Graphics 600
4.9 5 5.3 5.4 5.6 [X] Teclast F7 Air Intel Celeron N4120 1.1GHz
UHD Graphics 600
5.7 [X] Intel NUC7CJYSAMN Intel Celeron J4025 2GHz
UHD Graphics 600
5.8 ~ 5 fps
180%
UHD Graphics 610:
7.5 10.5 ~ 9 fps
100%
UHD Graphics 600:
3.1 3.2 3.4 3.6 3.8 [X] Blackview AceBook 1 Intel Celeron N4120 1.1GHz
UHD Graphics 600
3.9 4.3 4.3 4.4 [X] Intel Celeron J4125 2GHz
UHD Graphics 600
4.4 [X] Intel Celeron N4100 1.1GHz
UHD Graphics 600
4.5 [X] GMK NucBox 3 Intel Celeron J4125 2GHz
UHD Graphics 600
4.5 4.6 4.7 4.9 [X] Teclast F7 Air Intel Celeron N4120 1.1GHz
UHD Graphics 600
5 5.2 [X] Intel NUC7CJYSAMN Intel Celeron J4025 2GHz
UHD Graphics 600
5.4 ~ 4 fps
175%
UHD Graphics 610:
6.9 7.3 ~ 7 fps
100%
UHD Graphics 600:
2.9 3.6 4 4.1 [X] GMK NucBox 3 1.3
Intel Celeron J4125 2GHz
UHD Graphics 600
4.5 [X] 1.3
Intel Celeron N4100 1.1GHz
UHD Graphics 600
4.8 [X] Teclast F7 Air 1.3
Intel Celeron N4120 1.1GHz
UHD Graphics 600
5.2 [X] 1.3
Intel Celeron J4125 2GHz
UHD Graphics 600
5.3 5.5 [X] Intel NUC7CJYSAMN 1.3
Intel Celeron J4025 2GHz
UHD Graphics 600
~ 4 fps
193%
UHD Graphics 610:
7.7 fps
100%
UHD Graphics 600:
2.1 [X] 1.3
Intel Celeron J4125 2GHz
UHD Graphics 600
2.2 [X] 1.3
Intel Celeron N4100 1.1GHz
UHD Graphics 600
2.3 2.4 [X] Intel NUC7CJYSAMN 1.3
Intel Celeron J4025 2GHz
UHD Graphics 600
~ 2 fps
177%
UHD Graphics 610:
3.5 fps
100%
UHD Graphics 600:
1.5 [X] 1.3
Intel Celeron J4125 2GHz
UHD Graphics 600
1.6 [X] 1.3
Intel Celeron N4100 1.1GHz
UHD Graphics 600
1.6 ~ 2 fps
177%
UHD Graphics 610:
3.5 fps
100%
UHD Graphics 600:
1.1 [X] 1.3
Intel Celeron N4100 1.1GHz
UHD Graphics 600
fps
UHD Graphics 610:
23.8 (!) [X] Lenovo V340-17IWL 81RG001YGE Intel Pentium Gold 5405U 2.3GHz
UHD Graphics 610
min:
7 fps, max:
36 fps
fps
100%
UHD Graphics 600:
9 fps
156%
UHD Graphics 610:
14 fps
100%
UHD Graphics 600:
5.5 fps
100%
UHD Graphics 600:
35.3 fps
127%
HD Graphics 515:
42 48 [X] Cube i9 Intel Core m3-6Y30 0.9GHz
HD Graphics 515
min:
42 fps
~ 45 fps
100%
UHD Graphics 600:
28.7 fps
115%
HD Graphics 515:
30 36 [X] Cube i9 Intel Core m3-6Y30 0.9GHz
HD Graphics 515
min:
32 fps
~ 33 fps
HD Graphics 515:
14 24 [X] Cube i9 Intel Core m3-6Y30 0.9GHz
HD Graphics 515
min:
20 fps
~ 19 fps
HD Graphics 515:
26.6 [X] Cube i9 Intel Core m3-6Y30 0.9GHz
HD Graphics 515
min:
23 fps, max:
29 fps
fps
102%
UHD Graphics 610:
20.3 fps
145%
HD Graphics 515:
28 30.1 [X] Cube i9 Intel Core m3-6Y30 0.9GHz
HD Graphics 515
min:
15 fps, max:
44 fps
~ 29 fps
100%
UHD Graphics 600:
8.8 14.6 ~ 12 fps
92%
HD Graphics 515:
10.7 [X] Cube i9 Intel Core m3-6Y30 0.9GHz
HD Graphics 515
max:
16 fps
11 ~ 11 fps
100%
UHD Graphics 600:
9.3 fps
100%
UHD Graphics 600:
9.3 fps
185%
HD Graphics 515:
17.2 fps
100%
UHD Graphics 600:
3 fps
220%
HD Graphics 515:
6.6 fps
HD Graphics 515:
48 [X] Cube i9 Intel Core m3-6Y30 0.9GHz
HD Graphics 515
min:
42 fps, max:
60 fps
fps
HD Graphics 515:
24.1 [X] Cube i9 Intel Core m3-6Y30 0.9GHz
HD Graphics 515
min:
19 fps, max:
30 fps
fps
HD Graphics 515:
10.1 [X] Cube i9 Intel Core m3-6Y30 0.9GHz
HD Graphics 515
min:
8 fps, max:
14 fps
fps
HD Graphics 515:
11.4 [X] Cube i9 Intel Core m3-6Y30 0.9GHz
HD Graphics 515
min:
5 fps, max:
15 fps
fps
100%
UHD Graphics 600:
5 fps
496%
UHD Graphics 610:
24.8 fps
360%
HD Graphics 515:
13.8 21.7 [X] Cube i9 Intel Core m3-6Y30 0.9GHz
HD Graphics 515
min:
14 fps, max:
30 fps
~ 18 fps
100%
UHD Graphics 600:
3 fps
590%
UHD Graphics 610:
17.7 fps
280%
HD Graphics 515:
8.4 fps
HD Graphics 515:
6.1 8.4 ~ 7 fps
100%
UHD Graphics 600:
17.1 fps
142%
UHD Graphics 610:
24.2 fps
150%
HD Graphics 515:
25.7 fps
100%
UHD Graphics 600:
10.8 fps
140%
UHD Graphics 610:
15.1 fps
141%
HD Graphics 515:
15.2 fps
100%
UHD Graphics 600:
20 fps
180%
HD Graphics 515:
32 [X] Cube i9 Intel Core m3-6Y30 0.9GHz
HD Graphics 515
min:
13 fps, max:
48 fps
32.1 42.8 ~ 36 fps
100%
UHD Graphics 600:
13.1 fps
206%
HD Graphics 515:
23.6 [X] Cube i9 Intel Core m3-6Y30 0.9GHz
HD Graphics 515
min:
10 fps, max:
42 fps
26.3 30.2 ~ 27 fps
100%
UHD Graphics 600:
15.5 18.3 19.1 [X] Chuwi Hi10 X Intel Celeron N4100 1.1GHz
UHD Graphics 600
min:
17.6 fps, max:
-1 fps
26.5 26.5 30 31 32.2 32.8 [X] GMK NucBox K1 Intel Celeron J4125 2GHz
UHD Graphics 600
min:
28.4 fps, max:
-1 fps
34.3 [X] GMK NucBox 3 Intel Celeron J4125 2GHz
UHD Graphics 600
min:
29.9 fps, max:
-1 fps
37.4 [X] Blackview AceBook 1 Intel Celeron N4120 1.1GHz
UHD Graphics 600
min:
32.3 fps, max:
-1 fps
37.5 38.5 [X] Teclast F7 Air Intel Celeron N4120 1.1GHz
UHD Graphics 600
min:
32.2 fps, max:
-1 fps
38.9 40.2 [X] Intel Celeron N4100 1.1GHz
UHD Graphics 600
min:
34.3 fps, max:
-1 fps
41.3 41.5 [X] Intel Celeron J4125 2GHz
UHD Graphics 600
min:
35.8 fps, max:
-1 fps
41.8 [X] Intel NUC7CJYSAMN Intel Celeron J4025 2GHz
UHD Graphics 600
min:
33.2 fps, max:
-1 fps
42.9 ~ 33 fps
179%
UHD Graphics 610:
54.4 63.1 ~ 59 fps
145%
HD Graphics 515:
48 [X] Cube i9 Intel Core m3-6Y30 0.9GHz
HD Graphics 515
min:
42.2 fps
fps
100%
UHD Graphics 600:
6.9 9.7 11.9 12 12.4 [X] Chuwi Hi10 X Intel Celeron N4100 1.1GHz
UHD Graphics 600
min:
9.3 fps, max:
-1 fps
12.5 14.2 [X] GMK NucBox 3 Intel Celeron J4125 2GHz
UHD Graphics 600
min:
9.9 fps, max:
-1 fps
14.4 15.2 15.3 [X] Blackview AceBook 1 Intel Celeron N4120 1.1GHz
UHD Graphics 600
min:
10.9 fps, max:
-1 fps
15.5 15.8 16 [X] GMK NucBox K1 Intel Celeron J4125 2GHz
UHD Graphics 600
min:
12 fps, max:
-1 fps
17.2 [X] Teclast F7 Air Intel Celeron N4120 1.1GHz
UHD Graphics 600
min:
12.1 fps, max:
-1 fps
17.2 [X] Intel Celeron J4125 2GHz
UHD Graphics 600
min:
12.6 fps, max:
-1 fps
17.4 [X] Intel Celeron N4100 1.1GHz
UHD Graphics 600
min:
13.2 fps, max:
-1 fps
18.4 19.5 20.8 [X] Intel NUC7CJYSAMN Intel Celeron J4025 2GHz
UHD Graphics 600
min:
14.4 fps, max:
-1 fps
~ 15 fps
180%
UHD Graphics 610:
23.1 31.7 ~ 27 fps
187%
HD Graphics 515:
25.4 [X] Cube i9 Intel Core m3-6Y30 0.9GHz
HD Graphics 515
min:
21.5 fps
30 [X] Cube i9 Intel Core m3-6Y30 0.9GHz
HD Graphics 515
~ 28 fps
100%
UHD Graphics 600:
5.5 5.5 5.8 5.9 [X] Chuwi Hi10 X Intel Celeron N4100 1.1GHz
UHD Graphics 600
min:
3.3 fps, max:
-1 fps
6 6.1 6.5 6.8 [X] GMK NucBox K1 Intel Celeron J4125 2GHz
UHD Graphics 600
min:
5.7 fps, max:
-1 fps
6.8 [X] GMK NucBox 3 Intel Celeron J4125 2GHz
UHD Graphics 600
min:
5.2 fps, max:
-1 fps
7.3 [X] Intel Celeron N4100 1.1GHz
UHD Graphics 600
min:
6.1 fps, max:
-1 fps
7.7 7.9 [X] Blackview AceBook 1 Intel Celeron N4120 1.1GHz
UHD Graphics 600
min:
6.8 fps, max:
-1 fps
8 8.1 [X] Intel Celeron J4125 2GHz
UHD Graphics 600
min:
6.8 fps, max:
-1 fps
8.2 [X] Teclast F7 Air Intel Celeron N4120 1.1GHz
UHD Graphics 600
min:
6.7 fps, max:
-1 fps
8.6 8.8 8.8 [X] Intel NUC7CJYSAMN Intel Celeron J4025 2GHz
UHD Graphics 600
min:
4.1 fps, max:
-1 fps
~ 7 fps
171%
UHD Graphics 610:
10.6 12.8 ~ 12 fps
134%
HD Graphics 515:
9.4 [X] Cube i9 Intel Core m3-6Y30 0.9GHz
HD Graphics 515
min:
8.7 fps
fps
100%
UHD Graphics 600:
5.2 5.4 5.5 5.7 5.7 [X] Chuwi Hi10 X Intel Celeron N4100 1.1GHz
UHD Graphics 600
min:
2.7 fps, max:
-1 fps
5.8 5.9 6.1 [X] GMK NucBox K1 Intel Celeron J4125 2GHz
UHD Graphics 600
min:
5.1 fps, max:
-1 fps
6.3 [X] GMK NucBox 3 Intel Celeron J4125 2GHz
UHD Graphics 600
min:
4.4 fps, max:
-1 fps
6.9 [X] Intel Celeron N4100 1.1GHz
UHD Graphics 600
min:
5.5 fps, max:
-1 fps
7.1 7.2 [X] Blackview AceBook 1 Intel Celeron N4120 1.1GHz
UHD Graphics 600
min:
6 fps, max:
-1 fps
7.4 7.4 [X] Teclast F7 Air Intel Celeron N4120 1.1GHz
UHD Graphics 600
min:
5.9 fps, max:
-1 fps
7.4 [X] Intel Celeron J4125 2GHz
UHD Graphics 600
min:
6.3 fps, max:
-1 fps
7.7 7.8 [X] Intel NUC7CJYSAMN Intel Celeron J4025 2GHz
UHD Graphics 600
min:
4.9 fps, max:
-1 fps
8 ~ 7 fps
157%
UHD Graphics 610:
9.7 11.6 ~ 11 fps
116%
HD Graphics 515:
8.1 [X] Cube i9 Intel Core m3-6Y30 0.9GHz
HD Graphics 515
min:
7.1 fps
fps
100%
UHD Graphics 600:
4.7 fps
213%
UHD Graphics 610:
9.2 11.3 [X] Nofflink M500-5405U Intel Pentium Gold 5405U 2.3GHz
UHD Graphics 610
min:
1.234 fps, P0.1:
2.27 fps, P1:
5.1 fps, max:
60.3 fps
~ 10 fps
UHD Graphics 610:
7.7 [X] Nofflink M500-5405U Intel Pentium Gold 5405U 2.3GHz
UHD Graphics 610
min:
6.08 fps, P0.1:
6.31 fps, P1:
7.15 fps, max:
8.32 fps
fps
UHD Graphics 610:
4.2 [X] Nofflink M500-5405U Intel Pentium Gold 5405U 2.3GHz
UHD Graphics 610
min:
3.82 fps, P0.1:
3.85 fps, P1:
4.05 fps, max:
4.39 fps
fps
100%
UHD Graphics 600:
43.3 fps
143%
HD Graphics 515:
57 [X] Dell Latitude 12 E7275 Intel Core m7-6Y75 1.2GHz
HD Graphics 515
57.8 65.7 67.2 ~ 62 fps
100%
UHD Graphics 600:
12.5 fps
120%
HD Graphics 515:
13.9 [X] Dell Latitude 12 E7275 Intel Core m7-6Y75 1.2GHz
HD Graphics 515
14.4 15.8 16 ~ 15 fps
100%
UHD Graphics 600:
12.5 fps
100%
UHD Graphics 600:
12.6 16 ~ 14 fps
164%
UHD Graphics 610:
17.9 28.5 [X] Nofflink M500-5405U Intel Pentium Gold 5405U 2.3GHz
UHD Graphics 610
min:
9.02 fps, P1:
18.2 fps, max:
49.6 fps
~ 23 fps
100%
UHD Graphics 600:
11.6 fps
181%
UHD Graphics 610:
16.7 25.4 [X] Nofflink M500-5405U Intel Pentium Gold 5405U 2.3GHz
UHD Graphics 610
min:
11 fps, P1:
15.2 fps, max:
41.5 fps
~ 21 fps
UHD Graphics 610:
6 [X] Nofflink M500-5405U Intel Pentium Gold 5405U 2.3GHz
UHD Graphics 610
min:
0.798 fps, P1:
4.46 fps, max:
19.1 fps
fps
HD Graphics 515:
6.8 8.3 ~ 8 fps
HD Graphics 515:
41 41 ~ 41 fps
HD Graphics 515:
27 28 ~ 28 fps
HD Graphics 515:
15 17 ~ 16 fps
100%
UHD Graphics 600:
77.8 fps
207%
HD Graphics 515:
161.1 fps
100%
UHD Graphics 600:
17.7 fps
221%
HD Graphics 515:
39.2 fps
100%
UHD Graphics 600:
10.2 fps
168%
HD Graphics 515:
17.1 fps
100%
UHD Graphics 600:
66.8 fps
129%
HD Graphics 515:
86.5 fps
100%
UHD Graphics 600:
18 fps
146%
HD Graphics 515:
26.3 fps
100%
UHD Graphics 600:
12.5 fps
119%
HD Graphics 515:
14.9 fps
100%
UHD Graphics 600:
9 9.2 [X] Lenovo Flex 6-11IGM Intel Celeron N4000 1.1GHz
UHD Graphics 600
10 10 11.5 13.2 13.3 ~ 11 fps
100%
UHD Graphics 600:
2 3.3 3.3 ~ 3 fps
100%
UHD Graphics 600:
78.8 fps
103%
HD Graphics 515:
80.8 fps
100%
UHD Graphics 600:
16.3 fps
153%
HD Graphics 515:
24.9 fps
100%
UHD Graphics 600:
33 33.9 ~ 33 fps
100%
UHD Graphics 600:
16.2 16.4 ~ 16 fps
100%
UHD Graphics 600:
10.7 11.2 ~ 11 fps
100%
UHD Graphics 600:
5 fps
200%
UHD Graphics 610:
57.9 fps
264%
HD Graphics 515:
76.7 fps
UHD Graphics 610:
42.1 fps
100%
UHD Graphics 600:
24.6 fps
158%
UHD Graphics 610:
38.9 fps
252%
HD Graphics 515:
61.9 fps
100%
UHD Graphics 600:
15.8 fps
166%
UHD Graphics 610:
26.2 fps
265%
HD Graphics 515:
41.8 fps
100%
UHD Graphics 600:
38 fps
100%
UHD Graphics 600:
18.5 fps
100%
UHD Graphics 600:
12.2 fps
100%
UHD Graphics 600:
19.2 fps
162%
HD Graphics 515:
31.1 fps
100%
UHD Graphics 600:
12.9 fps
145%
HD Graphics 515:
18.7 fps
100%
UHD Graphics 600:
9.6 fps
121%
HD Graphics 515:
11.6 fps
100%
UHD Graphics 600:
61.6 fps
100%
UHD Graphics 600:
14.9 fps
100%
UHD Graphics 600:
10.6 fps
100%
UHD Graphics 600:
153 fps
100%
UHD Graphics 600:
25.1 fps
100%
UHD Graphics 600:
12.3 fps
100%
UHD Graphics 600:
43.9 fps
100%
UHD Graphics 600:
3.3 fps
Average Gaming Intel UHD Graphics 600 → 100% Average Gaming 30-70 fps → 100%
Average Gaming Intel UHD Graphics 610 → 218% Average Gaming 30-70 fps → 160%
Average Gaming Intel HD Graphics 515 → 167% Average Gaming 30-70 fps → 170%
v1.26
log 24. 08:17:35
#0 checking url part for id 8272 +0s ... 0s
#1 checking url part for id 10401 +0s ... 0s
#2 checking url part for id 6450 +0s ... 0s
#3 not redirecting to Ajax server +0s ... 0s
#4 did not recreate cache, as it is less than 5 days old! Created at Mon, 22 Apr 2024 05:40:21 +0200 +0.002s ... 0.002s
#5 composed specs +0.257s ... 0.258s
#6 did output specs +0s ... 0.258s
#7 start showIntegratedCPUs +0s ... 0.258s
#8 getting avg benchmarks for device 8272 +0.101s ... 0.36s
#9 got single benchmarks 8272 +0.223s ... 0.583s
#10 getting avg benchmarks for device 10401 +0.028s ... 0.611s
#11 got single benchmarks 10401 +0.025s ... 0.636s
#12 getting avg benchmarks for device 6450 +0.021s ... 0.656s
#13 got single benchmarks 6450 +0.164s ... 0.82s
#14 got avg benchmarks for devices +0s ... 0.82s
#15 min, max, avg, median took s +0.737s ... 1.557s
#16 before gaming benchmark output +0s ... 1.557s
#17 Got 638 rows for game benchmarks. +0.443s ... 2s
#18 composed SQL query for gamebenchmarks +0s ... 2s
#19 got data and put it in $dataArray +0.081s ... 2.081s
#20 benchmarks composed for output. +0.235s ... 2.316s
#21 calculated avg scores. +0s ... 2.316s
#22 return log +0.004s ... 2.32s
Teilen Sie diesen Artikel, um uns zu unterstützen. Jeder Link hilft!
Autor: Klaus Hinum, 8.09.2017 (Update: 1.07.2023)
 Deutsch
 English
 Español
 Français
 Italiano
 Nederlands
 Polski
 Português
 Русский
 Türkçe
 Svenska
 Chinese
 Magyar