Notebookcheck Logo

Intel UHD Graphics (Elkhart Lake 16 EU) vs Intel UHD Graphics G4 (Lakefield GT1 48 EU)

Intel UHD Graphics (Elkhart Lake 16 EU)

► remove from comparison Intel UHD Graphics (Elkhart Lake 16 EU)

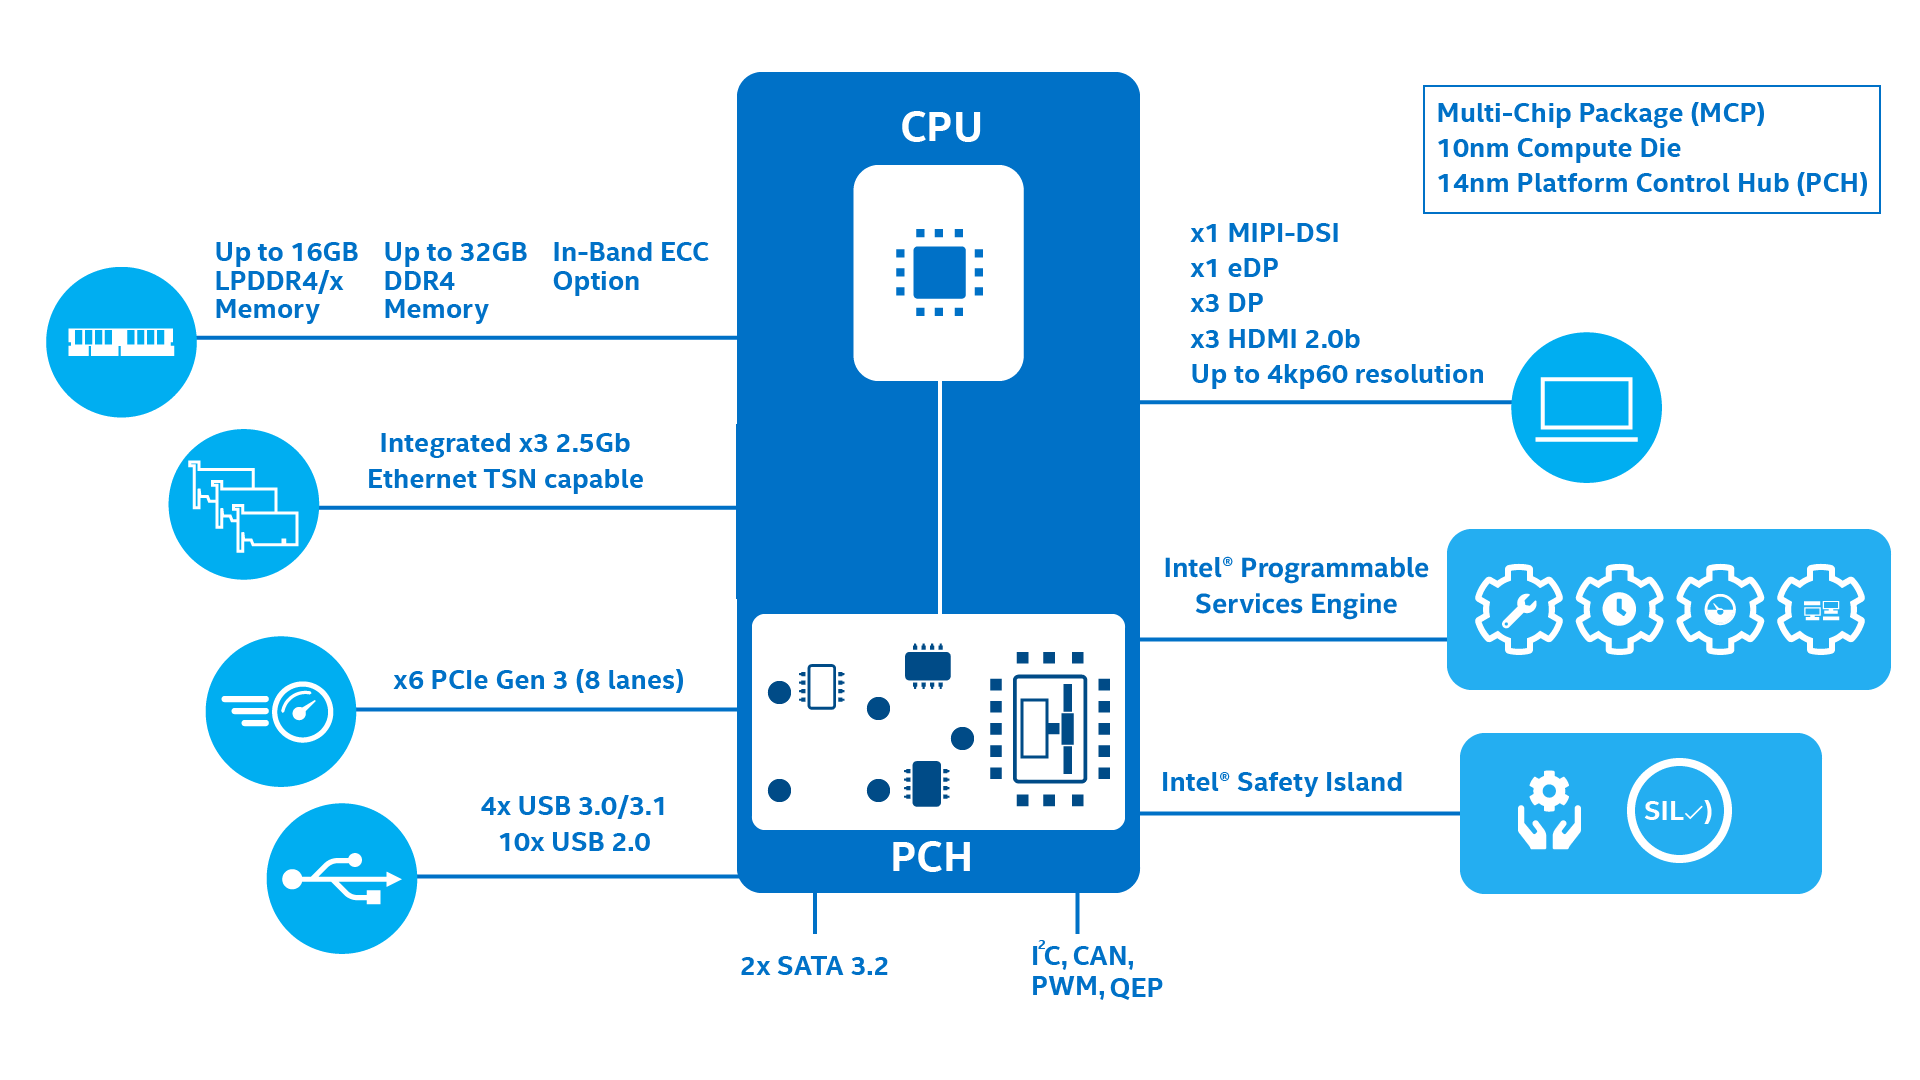
Die Intel UHD Graphics 16 EUs (Elkhart Lake, Gen. 11) ist eine Prozessorgrafikkarte, die im Januar 2021 vorgestellt wurde. Sie wird in den Low-End-Modellen der Elkhart Lake Prozessoren genutzt (Pentium/Celeron) und bietet 16 der 32 EUs (Executing Units - Shader Cluster). Weiterhin hat die iGPU keinen eigenen dedizierten Grafikspeicher. Die Taktung ist abhängig vom CPU-Modell und variiert von 250 - 850 MHz (minimaler Basis bis maximaler Boost-Takt).

Intel UHD Graphics G4 (Lakefield GT1 48 EU)

► remove from comparison Intel UHD Graphics G4 (Lakefield GT1 48 EU)

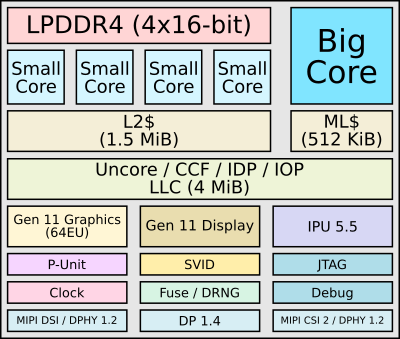
Die Intel UHD Graphics G4 (Lakefield GT1 mit 48 EUs) ist eine Prozessorgrafikkarte, die im Mai 2020 vorgestellt wurde. Sie wird in den Einstiegs-Modellen der Lakefield-Serie verbaut (anfangs im Intel Core i3-L13G4) und bietet 48 EUs (Executing Units - Shader Cluster) und keinen eigenen dedizierten Grafikspeicher. Technisch sollte die GPU vergleichbar mit der in Ice-Lake-CPUs integrierten Iris Plus G4 sein, jedoch bei deutlich geringeren Taktraten.

Intel Gen.11 Graphics CardsCoresBaseBoost
Intel Iris Plus Graphics G7 Ice-Lake64 EUs300 MHz1100 MHz
Intel Iris Plus Graphics G4 Ice-Lake48 EUs300 MHz1050 MHz
Intel UHD Graphics G1 Ice-Lake32 EUs300 MHz1050 MHz
Intel UHD Graphics G7 Lakefield 64 EUs200 MHz500 MHz
Intel UHD Graphics G4 Lakefield 48 EUs200 MHz500 MHz

Die Leistung ist durch die geringere Kernanzahl und vergleichbare Taktraten deutlich unterhalb der G7 Variante. Diese kann sich auf dem Niveau einer Intel UHD Graphics 630 positionieren, wodurch die G4 wohl eher unterhalb einer UHD Graphics 620 sich einsortieren sollte. Damit sind nur sehr anspruchslose Spiele wie League of Legends flüssig spielbar.

Als besonderes Feature hebt Intel das neue Variable Rate Shading (VRS) der Gen11 Grafik hervor. Damit kann der Spieleentwickler Bereiche definieren die mit weniger Genauigkeit geshaded werden (z.B. weit entfernte Objekte, oder Objekte im Nebel) und somit bei gleicher visueller Qualität deutlich Performance gewinnen. Hier können je nach Szene bis zu 20 - 30% (Unreal Engine bzw Civ6) an Leistung gewonnen werden. Bis jetzt unterstütz VRS lediglich Nvidia mit Turing (GTX 1650 und aufwärts).

Die UHD Graphics G4 wird im modernen 10nm Prozess bei Intel gefertigt und soll mit TSMCs 7nm Prozess mithalten können.

Intel UHD Graphics (Elkhart Lake 16 EU)Intel UHD Graphics G4 (Lakefield GT1 48 EU)
Gen. 11 Serie
Iris Plus Graphics G7 (Ice Lake 64 EU) compare 64 @ 0.3 - 1.1 GHz
Iris Plus Graphics G4 (Ice Lake 48 EU) compare 48 @ 0.3 - 1.1 GHz
UHD Graphics G1 (Ice Lake 32 EU) compare 32 @ 0.3 - 1.1 GHz
UHD Graphics G7 (Lakefield GT2 64 EU) compare 64 @ 0.2 - 0.5 GHz
UHD Graphics G4 (Lakefield GT1 48 EU) 48 @ 0.2 - 0.5 GHz
UHD Graphics (Jasper Lake 32 EU) compare 32 @ 0.35 - 0.9 GHz
UHD Graphics (Elkhart Lake 32 EU) compare 32 @ 0.4 - 0.85 GHz
UHD Graphics (Jasper Lake 24 EU) compare 24 @ 0.35 - 0.8 GHz
UHD Graphics (Elkhart Lake 16 EU) 16 @ 0.25 - 0.85 GHz
UHD Graphics (Jasper Lake 16 EU) compare 24 @ 0.35 - 0.8 GHz
CodenameGen. 11Lakefield GT1
Pipelines16 - unified48 - unified
Kerntakt250 - 850 (Boost) MHz200 - 500 (Boost) MHz
Shared Memoryjaja
APIDirectX 12_1, OpenGL 4.5, OpenCL 1.2DirectX 12_1, OpenGL 4.5
Stromverbrauch4.8 - 10 Watt7 Watt
Herstellungsprozess10 nm10 nm
Displays3 Displays (max.)
FeaturesQuickSyncQuickSync
Erscheinungsdatum11.01.2021 28.05.2020
PredecessorUHD Graphics 600
ArchitekturGen. 11 Ice Lake
SpeichertypDDR4
CPU in UHD Graphics G4 (Lakefield GT1 48 EU)GPU Base SpeedGPU Boost / Turbo
Intel Core i3-L13G45 x 800 MHz, 10 W200 MHz500 MHz

Benchmarks

Performance Rating - 3DMark 11 + Fire Strike + Time Spy - UHD Graphics (Elkhart Lake 16 EU)
0.2 pt (1%)
3DMark - 3DMark Ice Storm Unlimited Graphics
30044 Points (3%)
3DMark - 3DMark Ice Storm Extreme Graphics
14650 Points (2%)
3DMark - 3DMark Cloud Gate Score
2873 Points (3%)
3DMark - 3DMark Cloud Gate Graphics
3762 Points (1%)
3DMark - 3DMark Fire Strike Standard Score
489 Points (1%)
3DMark - 3DMark Fire Strike Standard Graphics
523 Points (1%)
3DMark - 3DMark Ice Storm Graphics
22836 Points (3%)
3DMark 11 - 3DM11 Performance Score
701 Points (1%)
3DMark 11 - 3DM11 Performance GPU
650 Points (1%)
Cinebench R10 Cinebench R10 Shading (32bit) + Intel UHD Graphics (Elkhart Lake 16 EU)
Cinebench R10 - Cinebench R10 Shading (32bit)
4048 Points (3%)
Cinebench R11.5 Cinebench R11.5 OpenGL 64 Bit + Intel UHD Graphics (Elkhart Lake 16 EU)
Cinebench R11.5 - Cinebench R11.5 OpenGL 64 Bit
10.6 fps (4%)
Cinebench R15
Cinebench R15 OpenGL 64 Bit + Intel UHD Graphics (Elkhart Lake 16 EU)
Cinebench R15 - Cinebench R15 OpenGL 64 Bit
14.2 fps (1%)
Cinebench R15 OpenGL Ref. Match 64 Bit + Intel UHD Graphics (Elkhart Lake 16 EU)
Cinebench R15 - Cinebench R15 OpenGL Ref. Match 64 Bit
97.8 % (98%)
LuxMark v2.0 64Bit - LuxMark v2.0 Room GPU
81 Samples/s (0%)
LuxMark v2.0 64Bit - LuxMark v2.0 Sala GPU
147 Samples/s (0%)
ComputeMark v2.1 - ComputeMark v2.1 Result
476 Points (1%)
Power Consumption - Furmark Stress Test Power Consumption - external Monitor *
11.3 Watt (2%)

Average Benchmarks Intel UHD Graphics (Elkhart Lake 16 EU) → 0% n=

- Bereich der Benchmarkergebnisse für diese Grafikkarte
- Durchschnittliche Benchmarkergebnisse für diese Grafikkarte
* Smaller numbers mean a higher performance
1 This benchmark is not used for the average calculation

Spiele-Benchmarks

Die folgenden Benchmarks basieren auf unseren Spieletests mit Testnotebooks. Die Performance dieser Grafikkarte bei den gelisteten Spielen ist abhängig von der verwendeten CPU, Speicherausstattung, Treiber und auch Betriebssystem. Dadurch müssen die untenstehenden Werte nicht repräsentativ sein. Detaillierte Informationen über das verwendete System sehen Sie nach einem Klick auf den fps-Wert.

Strange Brigade

Strange Brigade

2018
low 1280x720
100%
UHD Graphics (Elkhart Lake 16 EU):
9.2  fps
low 1280x720
100%
UHD Graphics (Elkhart Lake 16 EU):
7.8  fps
med. 1920x1080
100%
UHD Graphics (Elkhart Lake 16 EU):
5  fps
high 1920x1080
100%
UHD Graphics (Elkhart Lake 16 EU):
4.6  fps
low 1280x720
100%
UHD Graphics (Elkhart Lake 16 EU):
3.5  fps
med. 1920x1080
100%
UHD Graphics (Elkhart Lake 16 EU):
1.7  fps
low 1280x720
100%
UHD Graphics (Elkhart Lake 16 EU):
24.3  fps
med. 1366x768
100%
UHD Graphics (Elkhart Lake 16 EU):
10.9  fps
high 1920x1080
100%
UHD Graphics (Elkhart Lake 16 EU):
5.8  fps
ultra 1920x1080
100%
UHD Graphics (Elkhart Lake 16 EU):
5.2  fps

Average Gaming Intel UHD Graphics (Elkhart Lake 16 EU) → 100%

Intel UHD Graphics (Elkhart Lake 16 EU)lowmed.highultraQHD4K
Strange Brigade9.2
X-Plane 11.117.764.974.64
Final Fantasy XV Benchmark3.451.66
Dota 2 Reborn24.310.95.85.2
< 30 fps
< 60 fps
< 120 fps
≥ 120 fps
4


3


2


1


Eine Liste mit weiteren Spielen und allen Grafikkarten finden Sie auf unserer Seite: Welches Spiel ist mit welcher Grafikkarte spielbar?

Add one or more devices and compare

In the following list you can select (and also search for) devices that should be added to the comparison. You can select more than one device.

restrict list:

show all (including archived), 2024, 2023
v1.26
log 18. 11:01:40

#0 checking url part for id 11377 +0s ... 0s

#1 checking url part for id 10408 +0s ... 0s

#2 not redirecting to Ajax server +0s ... 0s

#3 did not recreate cache, as it is less than 5 days old! Created at Tue, 16 Apr 2024 05:39:00 +0200 +0.001s ... 0.001s

#4 composed specs +0.121s ... 0.122s

#5 did output specs +0s ... 0.122s

#6 start showIntegratedCPUs +0s ... 0.122s

#7 getting avg benchmarks for device 11377 +0.04s ... 0.162s

#8 got single benchmarks 11377 +0.006s ... 0.168s

#9 getting avg benchmarks for device 10408 +0.002s ... 0.17s

#10 got single benchmarks 10408 +0.004s ... 0.174s

#11 got avg benchmarks for devices +0s ... 0.174s

#12 min, max, avg, median took s +0.052s ... 0.226s

#13 before gaming benchmark output +0s ... 0.226s

#14 Got 10 rows for game benchmarks. +0.003s ... 0.229s

#15 composed SQL query for gamebenchmarks +0s ... 0.229s

#16 got data and put it in $dataArray +0.002s ... 0.231s

#17 benchmarks composed for output. +0.008s ... 0.239s

#18 calculated avg scores. +0s ... 0.239s

#19 return log +0.045s ... 0.284s

Teilen Sie diesen Artikel, um uns zu unterstützen. Jeder Link hilft!
> Notebook Test, Laptop Test und News > Benchmarks / Technik > Benchmarks / Technik > Grafikkarten Vergleich - Head 2 Head
Autor: Klaus Hinum,  8.09.2017 (Update:  1.07.2023)