Intel UHD Graphics Xe 16EUs (Tiger Lake-H) vs Intel UHD Graphics Xe 750 32EUs (Rocket Lake)
Intel UHD Graphics Xe 16EUs (Tiger Lake-H) ► remove from comparison
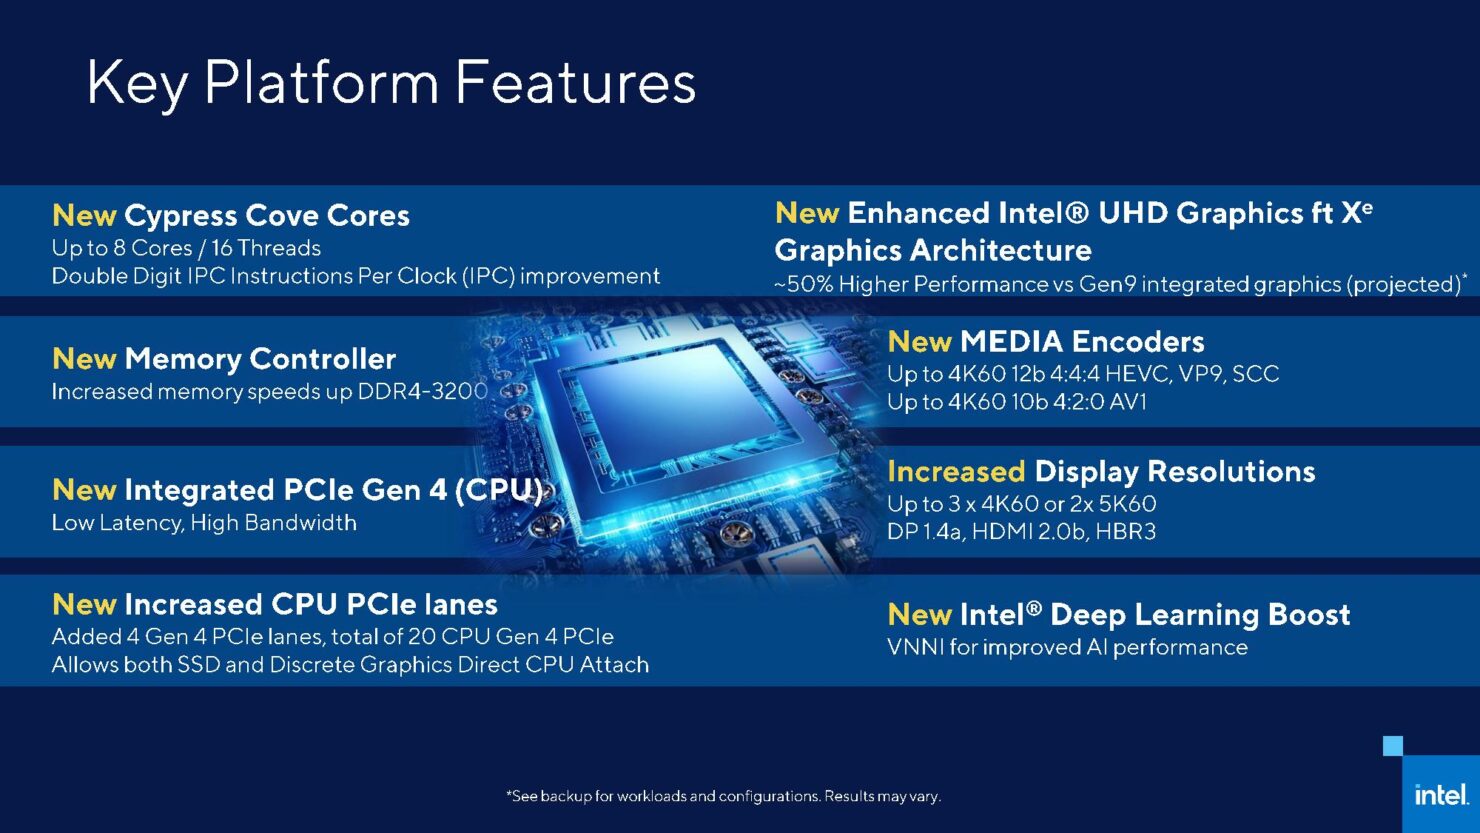
Die Intel UHD Graphics Xe (Rocket-Lake mit 16 EUs) ist eine Prozessorgrafikkarte, welche im Mai 2021 vorgestellt wurde. Sie basiert auf die neue Xe Architektur (Gen12) und bietet eine deutlich höhere Leistung als die Vorgängergenerationen. Die Leistung ist abhängig von der Taktrate (je nach Prozessormodell) und dem verwendeten Hauptspeicher (da shared Memory). Die 16EU-Variante (=128 Shader) ist die kleinere Ausbaustufe und bietet nur die Hälfte der 32 EUs in den stärkeren Tiger Lake-H-Prozessoren .
Die Spiele-Leistung ist nur im Einsteigersegment angeordnet und daher nur für geringe Detailstufen in anspruchslosen Spielen geeignet.
Intel UHD Graphics Xe 750 32EUs (Rocket Lake) ► remove from comparison
Die Intel UHD Graphics Xe 750 (Rocket-Lake mit 32 EUs) ist eine Prozessorgrafikkarte, welche im März 2021 vorgestellt wurde. Sie basiert auf die neue Xe Architektur (Gen12, wie auch Tiger Lake) und bietet eine deutlich höhere Leistung als die Vorgängergenerationen. Die Leistung ist abhängig von der Taktrate (je nach Prozessormodell) und dem verwendeten Hauptspeicher (da shared Memory). Die Xe 750 ist die stärkere Variante mit 32 EUs = 256 Shadern.
Die Spiele-Leistung ist nur im Einsteigersegment angeordnet und daher nur für geringe Detailstufen in anspruchslosen Spielen geeignet.
Im Unterschied zur Xe Graphics in Tiger-Lake, wird die Xe 750 in Rocket Lake noch im alten 14nm+++ Prozess gefertigt.
Intel UHD Graphics Xe 16EUs (Tiger Lake-H) Intel UHD Graphics Xe 750 32EUs (Rocket Lake) Gen. 12 / Xe Serie Codename Tiger Lake Xe Rocket Lake Xe Architektur Gen. 12 Gen. 12 Pipelines 16 - unified 32 - unified Kerntakt 350 - 1450 (Boost) MHz 350 - 1450 (Boost) MHz Shared Memory ja ja API DirectX 12_1, OpenGL 4.6 DirectX 12_1, OpenGL 4.6 Herstellungsprozess 10 nm 14 nm Features QuickSync QuickSync Erscheinungsdatum 30.03.2021 30.03.2021
CPU in UHD Graphics Xe 16EUs (Tiger Lake-H) GPU Base Speed GPU Boost / Turbo Intel Core i7-13650HX 14 x 1900 MHz, 55 W ? MHz 1550 MHz Intel Core i5-13500HX 14 x 1800 MHz, 55 W ? MHz 1500 MHz Intel Core i5-14450HX 10 x 1800 MHz, 55 W ? MHz 1500 MHz » show 6 more Intel Core i5-13450HX 10 x 1800 MHz, 55 W ? MHz 1450 MHz Intel Core i5-12450HX 8 x 1800 MHz, 55 W ? MHz 1300 MHz Intel Core i5-11400H 6 x 2700 MHz, 45 W 350 MHz 1450 MHz Intel Core i5-11260H 6 x 2600 MHz, 45 W 350 MHz 1400 MHz Intel Processor N95 4 x ? MHz, 15 W ? MHz 1200 MHz Intel Processor N50 2 x 1000 MHz, 6 W ? MHz 750 MHz min. - max. ? - 350 MHz 750 - 1550 MHz
CPU in UHD Graphics Xe 750 32EUs GPU Base Speed GPU Boost / Turbo Intel Core i9-11900K 8 x 3500 MHz, 125 W 350 MHz 1300 MHz Intel Core i7-11700K 8 x 3600 MHz, 125 W 350 MHz 1300 MHz Intel Core i5-11600K 6 x 3900 MHz, 125 W 350 MHz 1300 MHz » show 2 more Intel Core i3-N300 8 x ? MHz, 7 W ? MHz 1250 MHz Intel Processor N200 4 x 1000 MHz, 6 W 450 MHz 750 MHz min. - max. 450 MHz 750 - 1550 MHz
Benchmarks Performance Rating - 3DMark 11 + Fire Strike + Time Spy - UHD Graphics Xe 16EUs (Tiger Lake-H)
0.5 pt (2%)
...
Intel UHD Graphics Xe 16EUs (Tiger Lake-H)
...
max:
Performance Rating - 3DMark 11 + Fire Strike + Time Spy - UHD Graphics Xe 750 32EUs
1 pt (3%)
...
Intel UHD Graphics Xe 750 32EUs (Rocket Lake)
...
max:
3DMark - 3DMark Time Spy Score
min: 359 avg: 398.7 median: 404 (1%) max: 433 Points
min: 383 avg: 622 median: 735 (2%) max: 747 Points
3DMark - 3DMark Time Spy Graphics
min: 313 avg: 344.7 median: 348 (1%) max: 373 Points
min: 342 avg: 539 median: 634 (2%) max: 642 Points
3DMark - 3DMark Ice Storm Unlimited Graphics
min: 52786 avg: 61319 median: 64701 (7%) max: 66471 Points
50628 Points (6%)
3DMark - 3DMark Ice Storm Extreme Graphics
min: 19751 avg: 22257 median: 22256.5 (3%) max: 24762 Points
min: 25463 avg: 29673 median: 29673 (4%) max: 33883 Points
3DMark - 3DMark Cloud Gate Score
min: 6660 avg: 8390 median: 8223 (9%) max: 10288 Points
min: 5545 avg: 10811 median: 12119 (13%) max: 13460 Points
3DMark - 3DMark Cloud Gate Graphics
min: 7779 avg: 8628 median: 7982 (2%) max: 10124 Points
min: 7604 avg: 10689 median: 11315 (3%) max: 12523 Points
3DMark - 3DMark Fire Strike Standard Score
min: 1022 avg: 1157 median: 1151 (2%) max: 1298 Points
min: 1024 avg: 1860 median: 2094 (4%) max: 2227 Points
3DMark - 3DMark Fire Strike Standard Graphics
min: 1089 avg: 1220 median: 1203 (1%) max: 1368 Points
min: 1144 avg: 1955 median: 2174.5 (2%) max: 2327 Points
3DMark - 3DMark Ice Storm Graphics
min: 22104 avg: 37415 median: 35681 (4%) max: 54459 Points
min: 35756 avg: 39116 median: 38682.5 (5%) max: 43344 Points
3DMark - 3DMark Wild Life Unlimited
2660 Points (1%)
3DMark - 3DMark Wild Life Extreme Unlimited
732 Points (1%)
3DMark - 3DMark Night Raid
3692 Points (3%)
3DMark - 3DMark Night Raid Graphics Score
4435 Points (2%)
3DMark 11 - 3DM11 Performance Score
min: 1684 avg: 1865 median: 1933 (3%) max: 1979 Points
min: 1407 avg: 2653 median: 3264 (5%) max: 3289 Points
3DMark 11 - 3DM11 Performance GPU
min: 1474 avg: 1602 median: 1654 (1%) max: 1679 Points
min: 1349 avg: 2328 median: 2811 (2%) max: 2824 Points
3DMark Vantage + Intel UHD Graphics Xe 16EUs (Tiger Lake-H) 3DMark Vantage - 3DM Vant. Perf. total
min: 5508 avg: 6769 median: 7190 (2%) max: 7609 Points
3DM Vant. Perf. total + Intel UHD Graphics Xe 750 32EUs (Rocket Lake)
5134 Points (1%)
3DM Vant. Perf. GPU no PhysX + Intel UHD Graphics Xe 16EUs (Tiger Lake-H) 3DMark Vantage - 3DM Vant. Perf. GPU no PhysX
min: 4561 avg: 5372 median: 5589 (3%) max: 5966 Points
3DM Vant. Perf. GPU no PhysX + Intel UHD Graphics Xe 750 32EUs (Rocket Lake)
4452 Points (3%)
3DMark 05 - 3DMark 05 - Standard
min: 15740 avg: 19694 median: 19694 (22%) max: 23648 Points
8935 Points (10%)
3DMark 06 3DMark 06 - Standard 1280x1024 + Intel UHD Graphics Xe 16EUs (Tiger Lake-H)
min: 9852 avg: 11702 median: 12452 (16%) max: 12803 Points
3DMark 06 - Standard 1280x1024 + Intel UHD Graphics Xe 750 32EUs (Rocket Lake)
min: 8090 avg: 14361 median: 17392 (23%) max: 17601 Points
Unigine Valley 1.0 - Unigine Valley 1.0 DX
min: 4.4 avg: 4.8 median: 4.8 (2%) max: 5.1 fps
3.5 fps (1%)
SPECviewperf 12 + Intel UHD Graphics Xe 16EUs (Tiger Lake-H) SPECviewperf 12 - specvp12 sw-03
25.7 fps (6%)
specvp12 snx-02 + Intel UHD Graphics Xe 16EUs (Tiger Lake-H) SPECviewperf 12 - specvp12 snx-02
3.6 fps (1%)
specvp12 showcase-01 + Intel UHD Graphics Xe 16EUs (Tiger Lake-H) SPECviewperf 12 - specvp12 showcase-01
6.6 fps (1%)
specvp12 mediacal-01 + Intel UHD Graphics Xe 16EUs (Tiger Lake-H) SPECviewperf 12 - specvp12 mediacal-01
2.8 fps (1%)
specvp12 maya-04 + Intel UHD Graphics Xe 16EUs (Tiger Lake-H) SPECviewperf 12 - specvp12 maya-04
12.8 fps (3%)
specvp12 energy-01 + Intel UHD Graphics Xe 16EUs (Tiger Lake-H) SPECviewperf 12 - specvp12 energy-01
0.2 fps (0%)
specvp12 creo-01 + Intel UHD Graphics Xe 16EUs (Tiger Lake-H) SPECviewperf 12 - specvp12 creo-01
4 fps (2%)
specvp12 catia-04 + Intel UHD Graphics Xe 16EUs (Tiger Lake-H) SPECviewperf 12 - specvp12 catia-04
14.6 fps (2%)
specvp12 3dsmax-05 + Intel UHD Graphics Xe 16EUs (Tiger Lake-H) SPECviewperf 12 - specvp12 3dsmax-05
16.8 fps (3%)
SPECviewperf 13 specvp13 sw-04 + Intel UHD Graphics Xe 16EUs (Tiger Lake-H) SPECviewperf 13 - specvp13 sw-04
34.1 fps (9%)
specvp13 snx-03 + Intel UHD Graphics Xe 16EUs (Tiger Lake-H) SPECviewperf 13 - specvp13 snx-03
6.5 fps (1%)
specvp13 showcase-02 + Intel UHD Graphics Xe 16EUs (Tiger Lake-H) SPECviewperf 13 - specvp13 showcase-02
6.6 fps (1%)
specvp13 medical-02 + Intel UHD Graphics Xe 16EUs (Tiger Lake-H) SPECviewperf 13 - specvp13 medical-02
2.6 fps (1%)
specvp13 maya-05 + Intel UHD Graphics Xe 16EUs (Tiger Lake-H) SPECviewperf 13 - specvp13 maya-05
18.8 fps (2%)
specvp13 creo-02 + Intel UHD Graphics Xe 16EUs (Tiger Lake-H) SPECviewperf 13 - specvp13 creo-02
12.8 fps (2%)
specvp13 catia-05 + Intel UHD Graphics Xe 16EUs (Tiger Lake-H) SPECviewperf 13 - specvp13 catia-05
21.5 fps (2%)
specvp13 3dsmax-06 + Intel UHD Graphics Xe 16EUs (Tiger Lake-H) SPECviewperf 13 - specvp13 3dsmax-06
16.7 fps (3%)
Cinebench R10 Cinebench R10 Shading (32bit) + Intel UHD Graphics Xe 16EUs (Tiger Lake-H) Cinebench R10 - Cinebench R10 Shading (32bit)
min: 4461 avg: 9517 median: 12011 (9%) max: 12078 Points
Cinebench R10 Shading (32bit) + Intel UHD Graphics Xe 750 32EUs (Rocket Lake)
6088 Points (4%)
Cinebench R11.5 Cinebench R11.5 OpenGL 64 Bit + Intel UHD Graphics Xe 16EUs (Tiger Lake-H) Cinebench R11.5 - Cinebench R11.5 OpenGL 64 Bit
min: 23.53 avg: 36.2 median: 41.6 (14%) max: 43.57 fps
Cinebench R11.5 OpenGL 64 Bit + Intel UHD Graphics Xe 750 32EUs (Rocket Lake)
min: 22.96 avg: 25.5 median: 25.5 (9%) max: 28.12 fps
Cinebench R15 + Intel UHD Graphics Xe 16EUs (Tiger Lake-H) Cinebench R15 - Cinebench R15 OpenGL 64 Bit
min: 30.59 avg: 42 median: 46.3 (3%) max: 49.1 fps
Cinebench R15 OpenGL 64 Bit + Intel UHD Graphics Xe 750 32EUs (Rocket Lake)
min: 27.38 avg: 29.8 median: 28 (2%) max: 34.1 fps
Cinebench R15 OpenGL Ref. Match 64 Bit + Intel UHD Graphics Xe 16EUs (Tiger Lake-H) Cinebench R15 - Cinebench R15 OpenGL Ref. Match 64 Bit
97.8 % (98%)
Cinebench R15 OpenGL Ref. Match 64 Bit + Intel UHD Graphics Xe 750 32EUs (Rocket Lake)
97.8 % (98%)
GFXBench - GFXBench 5.0 Aztec Ruins High Tier Offscreen
11.4 fps (2%)
GFXBench - GFXBench 5.0 Aztec Ruins Normal Tier Offscreen
33.6 fps (2%)
GFXBench - GFXBench Car Chase Offscreen
31.1 fps (4%)
GFXBench 3.1 - GFXBench Manhattan ES 3.1 Offscreen
41.9 fps (1%)
GFXBench 3.0 - GFXBench 3.0 Manhattan Offscreen
77.3 fps (5%)
GFXBench (DX / GLBenchmark) 2.7 + Intel UHD Graphics Xe 16EUs (Tiger Lake-H) GFXBench (DX / GLBenchmark) 2.7 - GFXBench T-Rex HD Offscreen C24Z16
123.6 fps (1%)
Basemark GPU 1.2 - Basemark GPU 1.2 Vulkan Official Medium Offscreen 1080
52.8 fps (0%)
31.7 fps (0%)
Basemark GPU 1.2 - Basemark GPU 1.2 Vulkan Official High Offscreen 2160
4.1 fps (1%)
3 fps (1%)
Geekbench 6.2 - Geekbench 6.2 GPU OpenCL
min: 3191 avg: 3474 median: 3473.5 (1%) max: 3756 Points
2902 Points (1%)
Geekbench 6.2 - Geekbench 6.2 GPU Vulkan
min: 3619 avg: 3947 median: 3946.5 (1%) max: 4274 Points
3872 Points (1%)
LuxMark v2.0 64Bit - LuxMark v2.0 Room GPU
292 Samples/s (1%)
min: 129 avg: 336 median: 336 (2%) max: 543 Samples/s
LuxMark v2.0 64Bit - LuxMark v2.0 Sala GPU
601 Samples/s (1%)
min: 369 avg: 742 median: 742 (1%) max: 1115 Samples/s
ComputeMark v2.1 - ComputeMark v2.1 Result
min: 634 avg: 726 median: 745 (1%) max: 800 Points
min: 700 avg: 1024 median: 1024 (1%) max: 1348 Points
Power Consumption - Furmark Stress Test Power Consumption - external Monitor *
min: 18.5 avg: 24.6 median: 23.4 (3%) max: 31.8 Watt
min: 14.2 avg: 44.8 median: 56.9 (8%) max: 63.4 Watt
Power Consumption - The Witcher 3 Power Consumption - external Monitor *
27.5 Watt (4%)
min: 70 avg: 86.4 median: 92.9 (13%) max: 96.2 Watt
Power Consumption - Witcher 3 Power Consumption *
min: 30.6 avg: 37.7 median: 37.7 (8%) max: 44.8 Watt
Power Consumption - Witcher 3 ultra Power Efficiency
0.2 fps per Watt (16%)
Power Consumption - Witcher 3 ultra Power Efficiency - external Monitor
0.2 fps per Watt (15%)
Emissions Witcher 3 Fan Noise + Intel UHD Graphics Xe 16EUs (Tiger Lake-H) Emissions - Witcher 3 Fan Noise
33.2 dB(A) (53%)
Average Benchmarks Intel UHD Graphics Xe 16EUs (Tiger Lake-H) → 100% n=27 Average Benchmarks Intel UHD Graphics Xe 750 32EUs (Rocket Lake) → 113% n=27
- Bereich der Benchmarkergebnisse für diese Grafikkarte
- Durchschnittliche Benchmarkergebnisse für diese Grafikkarte
* Smaller numbers mean a higher performance
1 This benchmark is not used for the average calculation
Spiele-Benchmarks Die folgenden Benchmarks basieren auf unseren Spieletests mit Testnotebooks. Die Performance dieser Grafikkarte bei den gelisteten Spielen ist abhängig von der verwendeten CPU, Speicherausstattung, Treiber und auch Betriebssystem. Dadurch müssen die untenstehenden Werte nicht repräsentativ sein. Detaillierte Informationen über das verwendete System sehen Sie nach einem Klick auf den fps-Wert.
100%
UHD Graphics Xe 16EUs (Tiger Lake-H):
39.9 [X] Lenovo ThinkBook 15p G2 ITH 21B1000WGE Intel Core i5-11400H 2.7GHz
UHD Graphics Xe 16EUs (Tiger Lake-H)
min:
11.5 fps, P0.1:
11.6 fps, P1:
27.4 fps, max:
107.6 fps
fps
100%
UHD Graphics Xe 16EUs (Tiger Lake-H):
26.9 [X] Lenovo ThinkBook 15p G2 ITH 21B1000WGE Intel Core i5-11400H 2.7GHz
UHD Graphics Xe 16EUs (Tiger Lake-H)
min:
9.24 fps, P0.1:
9.72 fps, P1:
17.3 fps, max:
121.1 fps
fps
100%
UHD Graphics Xe 16EUs (Tiger Lake-H):
24.8 [X] Lenovo ThinkBook 15p G2 ITH 21B1000WGE Intel Core i5-11400H 2.7GHz
UHD Graphics Xe 16EUs (Tiger Lake-H)
min:
9.37 fps, P0.1:
9.61 fps, P1:
15.8 fps, max:
93.6 fps
fps
100%
UHD Graphics Xe 16EUs (Tiger Lake-H):
9.7 [X] Lenovo ThinkBook 15p G2 ITH 21B1000WGE Intel Core i5-11400H 2.7GHz
UHD Graphics Xe 16EUs (Tiger Lake-H)
min:
4.3 fps, P0.1:
4.84 fps, P1:
6.93 fps, max:
25.8 fps
fps
100%
UHD Graphics Xe 16EUs (Tiger Lake-H):
9.9 [X] Lenovo ThinkBook 15p G2 ITH 21B1000WGE Intel Core i5-11400H 2.7GHz
UHD Graphics Xe 16EUs (Tiger Lake-H)
min:
7.99 fps, P0.1:
8.06 fps, P1:
8.22 fps, max:
11.5 fps
fps
100%
UHD Graphics Xe 16EUs (Tiger Lake-H):
5 (!) [X] Lenovo ThinkBook 15p G2 ITH 21B1000WGE Intel Core i5-11400H 2.7GHz
UHD Graphics Xe 16EUs (Tiger Lake-H)
min:
4 fps
fps
100%
UHD Graphics Xe 16EUs (Tiger Lake-H):
6.6 [X] Lenovo ThinkBook 15p G2 ITH 21B1000WGE Intel Core i5-11400H 2.7GHz
UHD Graphics Xe 16EUs (Tiger Lake-H)
min:
3.14 fps, P0.1:
3.16 fps, P1:
3.29 fps, max:
158.1 fps
fps
100%
UHD Graphics Xe 16EUs (Tiger Lake-H):
17.8 [X] Lenovo ThinkBook 15p G2 ITH 21B1000WGE Intel Core i5-11400H 2.7GHz
UHD Graphics Xe 16EUs (Tiger Lake-H)
fps
100%
UHD Graphics Xe 16EUs (Tiger Lake-H):
13.5 [X] Lenovo ThinkBook 15p G2 ITH 21B1000WGE Intel Core i5-11400H 2.7GHz
UHD Graphics Xe 16EUs (Tiger Lake-H)
fps
100%
UHD Graphics Xe 16EUs (Tiger Lake-H):
6 [X] Lenovo ThinkBook 15p G2 ITH 21B1000WGE Intel Core i5-11400H 2.7GHz
UHD Graphics Xe 16EUs (Tiger Lake-H)
min:
5 fps, max:
7 fps
fps
100%
UHD Graphics Xe 16EUs (Tiger Lake-H):
10.7 [X] Lenovo ThinkBook 15p G2 ITH 21B1000WGE Intel Core i5-11400H 2.7GHz
UHD Graphics Xe 16EUs (Tiger Lake-H)
min:
1.406 fps, P0.1:
3.82 fps, P1:
10.1 fps, max:
111.7 fps
fps
100%
UHD Graphics Xe 16EUs (Tiger Lake-H):
23.4 [X] Lenovo ThinkBook 15p G2 ITH 21B1000WGE Intel Core i5-11400H 2.7GHz
UHD Graphics Xe 16EUs (Tiger Lake-H)
min:
16 fps, P0.1:
16 fps, P1:
16.2 fps, max:
42.4 fps
fps
100%
UHD Graphics Xe 16EUs (Tiger Lake-H):
16.7 [X] Lenovo ThinkBook 15p G2 ITH 21B1000WGE Intel Core i5-11400H 2.7GHz
UHD Graphics Xe 16EUs (Tiger Lake-H)
min:
11.9 fps, P0.1:
11.9 fps, P1:
12 fps, max:
33.4 fps
fps
100%
UHD Graphics Xe 16EUs (Tiger Lake-H):
9 [X] Lenovo ThinkBook 15p G2 ITH 21B1000WGE Intel Core i5-11400H 2.7GHz
UHD Graphics Xe 16EUs (Tiger Lake-H)
min:
5.74 fps, P0.1:
5.84 fps, P1:
6.75 fps, max:
18.8 fps
fps
100%
UHD Graphics Xe 16EUs (Tiger Lake-H):
4.7 [X] Lenovo ThinkBook 15p G2 ITH 21B1000WGE 2.02
Intel Core i5-11400H 2.7GHz
UHD Graphics Xe 16EUs (Tiger Lake-H)
min:
3.23 fps, max:
6.5 fps
fps
100%
UHD Graphics Xe 16EUs (Tiger Lake-H):
5.4 [X] Lenovo ThinkBook 15p G2 ITH 21B1000WGE Intel Core i5-11400H 2.7GHz
UHD Graphics Xe 16EUs (Tiger Lake-H)
min:
2.4 fps, P0.1:
2.41 fps, P1:
2.49 fps, max:
126.5 fps
fps
100%
UHD Graphics Xe 16EUs (Tiger Lake-H):
10.1 [X] Lenovo ThinkBook 15p G2 ITH 21B1000WGE Intel Core i5-11400H 2.7GHz
UHD Graphics Xe 16EUs (Tiger Lake-H)
min:
2.16 fps, P0.1:
2.92 fps, P1:
8.81 fps, max:
54.1 fps
fps
100%
UHD Graphics Xe 16EUs (Tiger Lake-H):
5.4 [X] Lenovo ThinkBook 15p G2 ITH 21B1000WGE Intel Core i5-11400H 2.7GHz
UHD Graphics Xe 16EUs (Tiger Lake-H)
min:
4.57 fps, P0.1:
4.57 fps, P1:
4.62 fps, max:
6.84 fps
fps
100%
UHD Graphics Xe 16EUs (Tiger Lake-H):
10.6 [X] Lenovo ThinkBook 15p G2 ITH 21B1000WGE 1070925
Intel Core i5-11400H 2.7GHz
UHD Graphics Xe 16EUs (Tiger Lake-H)
min:
9 fps, P1:
9 fps, max:
12 fps
fps
100%
UHD Graphics Xe 16EUs (Tiger Lake-H):
9.6 [X] Lenovo ThinkBook 15p G2 ITH 21B1000WGE 1070925
Intel Core i5-11400H 2.7GHz
UHD Graphics Xe 16EUs (Tiger Lake-H)
min:
8 fps, P1:
8 fps, max:
10 fps
fps
100%
UHD Graphics Xe 16EUs (Tiger Lake-H):
6.5 [X] Lenovo ThinkBook 15p G2 ITH 21B1000WGE 1070925
Intel Core i5-11400H 2.7GHz
UHD Graphics Xe 16EUs (Tiger Lake-H)
min:
5 fps, P1:
5 fps, max:
7 fps
fps
100%
UHD Graphics Xe 16EUs (Tiger Lake-H):
11.2 [X] Lenovo ThinkBook 15p G2 ITH 21B1000WGE Intel Core i5-11400H 2.7GHz
UHD Graphics Xe 16EUs (Tiger Lake-H)
min:
8.07 fps, P0.1:
8.26 fps, P1:
9.08 fps, max:
13.1 fps
fps
100%
UHD Graphics Xe 16EUs (Tiger Lake-H):
9.6 [X] Lenovo ThinkBook 15p G2 ITH 21B1000WGE Intel Core i5-11400H 2.7GHz
UHD Graphics Xe 16EUs (Tiger Lake-H)
min:
4.45 fps, P0.1:
4.49 fps, P1:
4.67 fps, max:
151.9 fps
fps
100%
UHD Graphics Xe 16EUs (Tiger Lake-H):
3.3 [X] Lenovo ThinkBook 15p G2 ITH 21B1000WGE Intel Core i5-11400H 2.7GHz
UHD Graphics Xe 16EUs (Tiger Lake-H)
min:
2.39 fps, P0.1:
2.39 fps, P1:
2.4 fps, max:
5.36 fps
fps
100%
UHD Graphics Xe 16EUs (Tiger Lake-H):
5.6 [X] Lenovo ThinkBook 15p G2 ITH 21B1000WGE Intel Core i5-11400H 2.7GHz
UHD Graphics Xe 16EUs (Tiger Lake-H)
min:
4.55 fps, P0.1:
4.56 fps, P1:
4.64 fps, max:
7.94 fps
fps
100%
UHD Graphics Xe 16EUs (Tiger Lake-H):
6.8 [X] Lenovo ThinkBook 15p G2 ITH 21B1000WGE Intel Core i5-11400H 2.7GHz
UHD Graphics Xe 16EUs (Tiger Lake-H)
min:
6.15 fps, P0.1:
6.17 fps, P1:
6.24 fps, max:
7.36 fps
fps
100%
UHD Graphics Xe 16EUs (Tiger Lake-H):
3.5 [X] Lenovo ThinkBook 15p G2 ITH 21B1000WGE Intel Core i5-11400H 2.7GHz
UHD Graphics Xe 16EUs (Tiger Lake-H)
min:
0.931 fps, P0.1:
1.008 fps, P1:
2.54 fps, max:
168.2 fps
fps
100%
UHD Graphics Xe 16EUs (Tiger Lake-H):
9.8 [X] Lenovo ThinkBook 15p G2 ITH 21B1000WGE Intel Core i5-11400H 2.7GHz
UHD Graphics Xe 16EUs (Tiger Lake-H)
min:
5.03 fps, P0.1:
6.57 fps, P1:
7.95 fps, max:
100.7 fps
fps
100%
UHD Graphics Xe 16EUs (Tiger Lake-H):
9.8 [X] Lenovo ThinkBook 15p G2 ITH 21B1000WGE Intel Core i5-11400H 2.7GHz
UHD Graphics Xe 16EUs (Tiger Lake-H)
min:
3.86 fps, P0.1:
3.9 fps, P1:
4.11 fps, max:
137.8 fps
fps
100%
UHD Graphics Xe 16EUs (Tiger Lake-H):
6.2 [X] Lenovo ThinkBook 15p G2 ITH 21B1000WGE Intel Core i5-11400H 2.7GHz
UHD Graphics Xe 16EUs (Tiger Lake-H)
min:
3.7 fps, P0.1:
4.44 fps, P1:
5.31 fps, max:
168.4 fps
fps
100%
UHD Graphics Xe 16EUs (Tiger Lake-H):
6.7 [X] Lenovo ThinkBook 15p G2 ITH 21B1000WGE Intel Core i5-11400H 2.7GHz
UHD Graphics Xe 16EUs (Tiger Lake-H)
min:
4.59 fps, P0.1:
4.61 fps, P1:
4.94 fps, max:
14.6 fps
fps
100%
UHD Graphics Xe 16EUs (Tiger Lake-H):
3.4 [X] Lenovo ThinkBook 15p G2 ITH 21B1000WGE Intel Core i5-11400H 2.7GHz
UHD Graphics Xe 16EUs (Tiger Lake-H)
min:
1.594 fps, P0.1:
1.616 fps, P1:
1.837 fps, max:
62.4 fps
fps
100%
UHD Graphics Xe 16EUs (Tiger Lake-H):
4.1 [X] Lenovo ThinkBook 15p G2 ITH 21B1000WGE Intel Core i5-11400H 2.7GHz
UHD Graphics Xe 16EUs (Tiger Lake-H)
min:
2.12 fps, P0.1:
2.34 fps, P1:
2.89 fps, max:
5.4 fps
fps
100%
UHD Graphics Xe 16EUs (Tiger Lake-H):
3.5 [X] Lenovo ThinkBook 15p G2 ITH 21B1000WGE Intel Core i5-11400H 2.7GHz
UHD Graphics Xe 16EUs (Tiger Lake-H)
min:
2.69 fps, P0.1:
2.71 fps, P1:
2.83 fps, max:
4.73 fps
fps
100%
UHD Graphics Xe 16EUs (Tiger Lake-H):
12.1 [X] Lenovo ThinkBook 15p G2 ITH 21B1000WGE 959964
Intel Core i5-11400H 2.7GHz
UHD Graphics Xe 16EUs (Tiger Lake-H)
min:
10 fps, P1:
10 fps, max:
13 fps
fps
174%
UHD Graphics Xe 750 32EUs:
21.1 [X] Asus ROG Maximus XIII Hero, Intel Xe 750 918016
Intel Core i9-11900K 3.5GHz
UHD Graphics Xe 750 32EUs
min:
18 fps, P1:
18 fps, max:
24 fps
fps
100%
UHD Graphics Xe 16EUs (Tiger Lake-H):
10.9 [X] Lenovo ThinkBook 15p G2 ITH 21B1000WGE 959964
Intel Core i5-11400H 2.7GHz
UHD Graphics Xe 16EUs (Tiger Lake-H)
min:
9 fps, P1:
9 fps, max:
12 fps
fps
172%
UHD Graphics Xe 750 32EUs:
18.8 [X] Asus ROG Maximus XIII Hero, Intel Xe 750 918016
Intel Core i9-11900K 3.5GHz
UHD Graphics Xe 750 32EUs
min:
16 fps, P1:
16 fps, max:
21 fps
fps
100%
UHD Graphics Xe 16EUs (Tiger Lake-H):
7.7 [X] Lenovo ThinkBook 15p G2 ITH 21B1000WGE 959964
Intel Core i5-11400H 2.7GHz
UHD Graphics Xe 16EUs (Tiger Lake-H)
min:
6 fps, P1:
6 fps, max:
8 fps
fps
100%
UHD Graphics Xe 16EUs (Tiger Lake-H):
6 [X] Lenovo ThinkBook 15p G2 ITH 21B1000WGE 959964
Intel Core i5-11400H 2.7GHz
UHD Graphics Xe 16EUs (Tiger Lake-H)
min:
5 fps, P1:
5 fps, max:
6 fps
fps
100%
UHD Graphics Xe 16EUs (Tiger Lake-H):
18.6 [X] Lenovo ThinkBook 15p G2 ITH 21B1000WGE Intel Core i5-11400H 2.7GHz
UHD Graphics Xe 16EUs (Tiger Lake-H)
min:
13.9 fps, P0.1:
14.3 fps, P1:
14.9 fps, max:
24.4 fps
fps
100%
UHD Graphics Xe 16EUs (Tiger Lake-H):
10.9 [X] Lenovo ThinkBook 15p G2 ITH 21B1000WGE Intel Core i5-11400H 2.7GHz
UHD Graphics Xe 16EUs (Tiger Lake-H)
min:
6.82 fps, P0.1:
6.88 fps, P1:
8.69 fps, max:
74.4 fps
fps
100%
UHD Graphics Xe 16EUs (Tiger Lake-H):
5.7 [X] Lenovo ThinkBook 15p G2 ITH 21B1000WGE Intel Core i5-11400H 2.7GHz
UHD Graphics Xe 16EUs (Tiger Lake-H)
min:
2.66 fps, P0.1:
2.7 fps, P1:
2.78 fps, max:
113.7 fps
fps
100%
UHD Graphics Xe 16EUs (Tiger Lake-H):
7.5 [X] Lenovo ThinkBook 15p G2 ITH 21B1000WGE Intel Core i5-11400H 2.7GHz
UHD Graphics Xe 16EUs (Tiger Lake-H)
fps
100%
UHD Graphics Xe 16EUs (Tiger Lake-H):
20.1 [X] Lenovo ThinkBook 15p G2 ITH 21B1000WGE Intel Core i5-11400H 2.7GHz
UHD Graphics Xe 16EUs (Tiger Lake-H)
min:
14.6 fps, max:
26.4 fps
fps
100%
UHD Graphics Xe 16EUs (Tiger Lake-H):
15.5 [X] Lenovo ThinkBook 15p G2 ITH 21B1000WGE Intel Core i5-11400H 2.7GHz
UHD Graphics Xe 16EUs (Tiger Lake-H)
min:
11.9 fps, max:
21 fps
fps
100%
UHD Graphics Xe 16EUs (Tiger Lake-H):
10.3 [X] Lenovo ThinkBook 15p G2 ITH 21B1000WGE Intel Core i5-11400H 2.7GHz
UHD Graphics Xe 16EUs (Tiger Lake-H)
min:
6.85 fps, P0.1:
7.68 fps, P1:
8.68 fps, max:
21.5 fps
fps
100%
UHD Graphics Xe 16EUs (Tiger Lake-H):
6.4 [X] Lenovo ThinkBook 15p G2 ITH 21B1000WGE Intel Core i5-11400H 2.7GHz
UHD Graphics Xe 16EUs (Tiger Lake-H)
min:
3.9 fps, P0.1:
3.95 fps, P1:
4.58 fps, max:
12.2 fps
fps
201%
UHD Graphics Xe 750 32EUs:
12.9 (!) [X] Asus ROG Maximus XIII Hero, Intel Xe 750 Intel Core i9-11900K 3.5GHz
UHD Graphics Xe 750 32EUs
min:
7.82 fps, P0.1:
7.9 fps, P1:
8.9 fps, max:
26.4 fps
fps
100%
UHD Graphics Xe 16EUs (Tiger Lake-H):
34.7 [X] Lenovo ThinkBook 15p G2 ITH 21B1000WGE Intel Core i5-11400H 2.7GHz
UHD Graphics Xe 16EUs (Tiger Lake-H)
min:
4.85 fps, P0.1:
8.72 fps, P1:
11.1 fps, max:
164.9 fps
fps
100%
UHD Graphics Xe 16EUs (Tiger Lake-H):
14 [X] Lenovo ThinkBook 15p G2 ITH 21B1000WGE Intel Core i5-11400H 2.7GHz
UHD Graphics Xe 16EUs (Tiger Lake-H)
min:
4.05 fps, P0.1:
4.28 fps, P1:
8.42 fps, max:
108.6 fps
fps
100%
UHD Graphics Xe 16EUs (Tiger Lake-H):
23 [X] Gigabyte G5 GD Intel Core i5-11400H 2.7GHz
UHD Graphics Xe 16EUs (Tiger Lake-H)
fps
100%
UHD Graphics Xe 16EUs (Tiger Lake-H):
9 [X] Gigabyte G5 GD Intel Core i5-11400H 2.7GHz
UHD Graphics Xe 16EUs (Tiger Lake-H)
fps
100%
UHD Graphics Xe 16EUs (Tiger Lake-H):
13 [X] Gigabyte G5 GD Intel Core i5-11400H 2.7GHz
UHD Graphics Xe 16EUs (Tiger Lake-H)
min:
10 fps, max:
16 fps
fps
100%
UHD Graphics Xe 16EUs (Tiger Lake-H):
19 [X] Gigabyte G5 GD Intel Core i5-11400H 2.7GHz
UHD Graphics Xe 16EUs (Tiger Lake-H)
min:
4.45 fps, P0.1:
5.75 fps, P1:
7.32 fps, max:
305 fps
fps
100%
UHD Graphics Xe 16EUs (Tiger Lake-H):
9.3 [X] Gigabyte G5 GD Intel Core i5-11400H 2.7GHz
UHD Graphics Xe 16EUs (Tiger Lake-H)
min:
3.84 fps, P0.1:
3.9 fps, P1:
4.21 fps, max:
206 fps
fps
100%
UHD Graphics Xe 16EUs (Tiger Lake-H):
21.7 [X] Gigabyte G5 GD Intel Core i5-11400H 2.7GHz
UHD Graphics Xe 16EUs (Tiger Lake-H)
min:
9.01 fps, P0.1:
9.46 fps, P1:
18.7 fps, max:
132 fps
fps
100%
UHD Graphics Xe 16EUs (Tiger Lake-H):
34 36.6 [X] Gigabyte G5 GD 815237
Intel Core i5-11400H 2.7GHz
UHD Graphics Xe 16EUs (Tiger Lake-H)
min:
29 fps, P1:
29 fps, max:
44 fps
~ 35 fps
100%
UHD Graphics Xe 16EUs (Tiger Lake-H):
14.7 [X] Gigabyte G5 GD 815237
Intel Core i5-11400H 2.7GHz
UHD Graphics Xe 16EUs (Tiger Lake-H)
min:
12 fps, P1:
12 fps, max:
16 fps
fps
100%
UHD Graphics Xe 16EUs (Tiger Lake-H):
11.9 [X] Gigabyte G5 GD 815237
Intel Core i5-11400H 2.7GHz
UHD Graphics Xe 16EUs (Tiger Lake-H)
min:
10 fps, P1:
10 fps, max:
13 fps
fps
100%
UHD Graphics Xe 16EUs (Tiger Lake-H):
48.9 [X] Gigabyte G5 GD Intel Core i5-11400H 2.7GHz
UHD Graphics Xe 16EUs (Tiger Lake-H)
min:
36.8 fps, P0.1:
36.9 fps, P1:
38.5 fps, max:
65.9 fps
fps
100%
UHD Graphics Xe 16EUs (Tiger Lake-H):
25.1 [X] Gigabyte G5 GD Intel Core i5-11400H 2.7GHz
UHD Graphics Xe 16EUs (Tiger Lake-H)
min:
20.8 fps, P0.1:
20.9 fps, P1:
21.7 fps, max:
31 fps
fps
100%
UHD Graphics Xe 16EUs (Tiger Lake-H):
21 [X] Gigabyte G5 GD Intel Core i5-11400H 2.7GHz
UHD Graphics Xe 16EUs (Tiger Lake-H)
min:
17.5 fps, P0.1:
17.7 fps, P1:
18.4 fps, max:
24.9 fps
fps
100%
UHD Graphics Xe 16EUs (Tiger Lake-H):
13 [X] Gigabyte G5 GD Intel Core i5-11400H 2.7GHz
UHD Graphics Xe 16EUs (Tiger Lake-H)
min:
5.84 fps, P0.1:
6.1 fps, P1:
8.93 fps, max:
93.1 fps
fps
100%
UHD Graphics Xe 16EUs (Tiger Lake-H):
22 [X] Gigabyte G5 GD Intel Core i5-11400H 2.7GHz
UHD Graphics Xe 16EUs (Tiger Lake-H)
min:
6.25 fps, P0.1:
7.03 fps, P1:
8.53 fps, max:
119 fps
fps
100%
UHD Graphics Xe 16EUs (Tiger Lake-H):
13 [X] Gigabyte G5 GD Intel Core i5-11400H 2.7GHz
UHD Graphics Xe 16EUs (Tiger Lake-H)
min:
2.97 fps, P0.1:
3.13 fps, P1:
4.72 fps, max:
151 fps
fps
100%
UHD Graphics Xe 16EUs (Tiger Lake-H):
22.7 [X] Gigabyte G5 GD Intel Core i5-11400H 2.7GHz
UHD Graphics Xe 16EUs (Tiger Lake-H)
fps
100%
UHD Graphics Xe 16EUs (Tiger Lake-H):
13 [X] Gigabyte G5 GD Intel Core i5-11400H 2.7GHz
UHD Graphics Xe 16EUs (Tiger Lake-H)
min:
7 fps, max:
26 fps
fps
100%
UHD Graphics Xe 16EUs (Tiger Lake-H):
15.6 [X] Lenovo ThinkBook 15p G2 ITH 21B1000WGE Intel Core i5-11400H 2.7GHz
UHD Graphics Xe 16EUs (Tiger Lake-H)
min:
5.02 fps, P0.1:
6.08 fps, P1:
8.36 fps, max:
53 fps
fps
100%
UHD Graphics Xe 16EUs (Tiger Lake-H):
12 [X] Gigabyte G5 GD Intel Core i5-11400H 2.7GHz
UHD Graphics Xe 16EUs (Tiger Lake-H)
min:
9 fps, max:
69 fps
fps
100%
UHD Graphics Xe 16EUs (Tiger Lake-H):
14.3 [X] Gigabyte G5 GD Intel Core i5-11400H 2.7GHz
UHD Graphics Xe 16EUs (Tiger Lake-H)
min:
10.7 fps, P0.1:
11.2 fps, P1:
12.3 fps, max:
17.5 fps
fps
100%
UHD Graphics Xe 16EUs (Tiger Lake-H):
8 [X] Gigabyte G5 GD Intel Core i5-11400H 2.7GHz
UHD Graphics Xe 16EUs (Tiger Lake-H)
min:
5.8 fps, P0.1:
6.2 fps, P1:
6.4 fps, max:
10 fps
fps
100%
UHD Graphics Xe 16EUs (Tiger Lake-H):
12.3 [X] Gigabyte G5 GD Intel Core i5-11400H 2.7GHz
UHD Graphics Xe 16EUs (Tiger Lake-H)
min:
6.21 fps, P1:
9.53 fps, max:
15.79 fps
fps
100%
UHD Graphics Xe 16EUs (Tiger Lake-H):
6.2 [X] Gigabyte G5 GD Intel Core i5-11400H 2.7GHz
UHD Graphics Xe 16EUs (Tiger Lake-H)
min:
2.95 fps, P1:
4.72 fps, max:
8 fps
fps
100%
UHD Graphics Xe 16EUs (Tiger Lake-H):
44.1 [X] Gigabyte G5 GD Intel Core i5-11400H 2.7GHz
UHD Graphics Xe 16EUs (Tiger Lake-H)
min:
22.6 fps, P0.1:
23.6 fps, P1:
25.6 fps, max:
129 fps
fps
100%
UHD Graphics Xe 16EUs (Tiger Lake-H):
17.1 [X] Gigabyte G5 GD Intel Core i5-11400H 2.7GHz
UHD Graphics Xe 16EUs (Tiger Lake-H)
min:
8.62 fps, P0.1:
8.67 fps, P1:
9.69 fps, max:
85.9 fps
fps
100%
UHD Graphics Xe 16EUs (Tiger Lake-H):
14.8 [X] Gigabyte G5 GD Intel Core i5-11400H 2.7GHz
UHD Graphics Xe 16EUs (Tiger Lake-H)
min:
7.22 fps, P0.1:
7.36 fps, P1:
8.21 fps, max:
149 fps
fps
100%
UHD Graphics Xe 16EUs (Tiger Lake-H):
13.7 [X] Gigabyte G5 GD Intel Core i5-11400H 2.7GHz
UHD Graphics Xe 16EUs (Tiger Lake-H)
min:
6.66 fps, P0.1:
6.73 fps, P1:
7.63 fps, max:
150 fps
fps
100%
UHD Graphics Xe 16EUs (Tiger Lake-H):
33.7 [X] Gigabyte G5 GD Intel Core i5-11400H 2.7GHz
UHD Graphics Xe 16EUs (Tiger Lake-H)
min:
10.4 fps, P0.1:
12 fps, P1:
22.2 fps, max:
157 fps
fps
100%
UHD Graphics Xe 16EUs (Tiger Lake-H):
6.1 [X] Gigabyte G5 GD Intel Core i5-11400H 2.7GHz
UHD Graphics Xe 16EUs (Tiger Lake-H)
min:
1.062 fps, P0.1:
1.283 fps, P1:
2.34 fps, max:
91.2 fps
fps
100%
UHD Graphics Xe 16EUs (Tiger Lake-H):
27.2 [X] Lenovo ThinkBook 15p G2 ITH 21B1000WGE Intel Core i5-11400H 2.7GHz
UHD Graphics Xe 16EUs (Tiger Lake-H)
min:
11.9 fps, P0.1:
12.3 fps, P1:
13 fps, max:
188.5 fps
27.2 [X] Lenovo ThinkBook 15p G2 ITH 21B1000WGE Intel Core i5-11400H 2.7GHz
UHD Graphics Xe 16EUs (Tiger Lake-H)
min:
11.9 fps, P0.1:
12.3 fps, P1:
13 fps, max:
188.5 fps
~ 27 fps
100%
UHD Graphics Xe 16EUs (Tiger Lake-H):
11.4 [X] Lenovo ThinkBook 15p G2 ITH 21B1000WGE Intel Core i5-11400H 2.7GHz
UHD Graphics Xe 16EUs (Tiger Lake-H)
min:
5.54 fps, P0.1:
5.54 fps, P1:
5.9 fps, max:
151.3 fps
11.4 [X] Lenovo ThinkBook 15p G2 ITH 21B1000WGE Intel Core i5-11400H 2.7GHz
UHD Graphics Xe 16EUs (Tiger Lake-H)
min:
5.54 fps, P0.1:
5.54 fps, P1:
5.9 fps, max:
151.3 fps
~ 11 fps
100%
UHD Graphics Xe 16EUs (Tiger Lake-H):
9.9 [X] Lenovo ThinkBook 15p G2 ITH 21B1000WGE Intel Core i5-11400H 2.7GHz
UHD Graphics Xe 16EUs (Tiger Lake-H)
min:
7.44 fps, P0.1:
7.55 fps, P1:
8.12 fps, max:
10.5 fps
fps
100%
UHD Graphics Xe 16EUs (Tiger Lake-H):
14 [X] Gigabyte G5 GD Intel Core i5-11400H 2.7GHz
UHD Graphics Xe 16EUs (Tiger Lake-H)
min:
8 fps, max:
20 fps
fps
100%
UHD Graphics Xe 16EUs (Tiger Lake-H):
7 [X] Gigabyte G5 GD Intel Core i5-11400H 2.7GHz
UHD Graphics Xe 16EUs (Tiger Lake-H)
min:
4 fps, max:
9 fps
fps
100%
UHD Graphics Xe 16EUs (Tiger Lake-H):
15.8 [X] Gigabyte G5 GD Intel Core i5-11400H 2.7GHz
UHD Graphics Xe 16EUs (Tiger Lake-H)
min:
12.9 fps, P0.1:
13 fps, P1:
13.4 fps, max:
28.4 fps
fps
100%
UHD Graphics Xe 16EUs (Tiger Lake-H):
8.4 [X] Gigabyte G5 GD Intel Core i5-11400H 2.7GHz
UHD Graphics Xe 16EUs (Tiger Lake-H)
min:
7.27 fps, P0.1:
7.3 fps, P1:
7.56 fps, max:
9.59 fps
fps
100%
UHD Graphics Xe 16EUs (Tiger Lake-H):
26 fps
100%
UHD Graphics Xe 16EUs (Tiger Lake-H):
12 fps
UHD Graphics Xe 750 32EUs:
198.3 [X] Asus ROG Maximus XIII Hero, Intel Xe 750 Intel Core i9-11900K 3.5GHz
UHD Graphics Xe 750 32EUs
min:
5.35 fps, P0.1:
75.2 fps, P1:
112.9 fps, max:
501 fps
fps
UHD Graphics Xe 750 32EUs:
64.1 [X] Asus ROG Maximus XIII Hero, Intel Xe 750 Intel Core i9-11900K 3.5GHz
UHD Graphics Xe 750 32EUs
min:
5.06 fps, P0.1:
43.2 fps, P1:
48.2 fps, max:
163 fps
fps
UHD Graphics Xe 750 32EUs:
50.8 [X] Asus ROG Maximus XIII Hero, Intel Xe 750 Intel Core i9-11900K 3.5GHz
UHD Graphics Xe 750 32EUs
min:
21.1 fps, P0.1:
37.3 fps, P1:
39 fps, max:
95.6 fps
fps
UHD Graphics Xe 750 32EUs:
36.1 [X] Asus ROG Maximus XIII Hero, Intel Xe 750 Intel Core i9-11900K 3.5GHz
UHD Graphics Xe 750 32EUs
min:
27.9 fps, P0.1:
28.2 fps, P1:
28.9 fps, max:
46.8 fps
fps
100%
UHD Graphics Xe 16EUs (Tiger Lake-H):
38.2 [X] Gigabyte G5 GD Intel Core i5-11400H 2.7GHz
UHD Graphics Xe 16EUs (Tiger Lake-H)
fps
100%
UHD Graphics Xe 16EUs (Tiger Lake-H):
12.8 [X] Gigabyte G5 GD Intel Core i5-11400H 2.7GHz
UHD Graphics Xe 16EUs (Tiger Lake-H)
fps
100%
UHD Graphics Xe 16EUs (Tiger Lake-H):
7.8 [X] Gigabyte G5 GD Intel Core i5-11400H 2.7GHz
UHD Graphics Xe 16EUs (Tiger Lake-H)
fps
100%
UHD Graphics Xe 16EUs (Tiger Lake-H):
17.1 [X] Lenovo ThinkBook 15p G2 ITH 21B1000WGE Intel Core i5-11400H 2.7GHz
UHD Graphics Xe 16EUs (Tiger Lake-H)
min:
12.8 fps, P0.1:
12.9 fps, P1:
13.2 fps, max:
20.6 fps
fps
100%
UHD Graphics Xe 16EUs (Tiger Lake-H):
8.1 [X] Lenovo ThinkBook 15p G2 ITH 21B1000WGE Intel Core i5-11400H 2.7GHz
UHD Graphics Xe 16EUs (Tiger Lake-H)
min:
6.35 fps, P0.1:
6.35 fps, P1:
6.43 fps, max:
9.62 fps
fps
100%
UHD Graphics Xe 16EUs (Tiger Lake-H):
13.4 14.4 [X] Gigabyte G5 GD Intel Core i5-11400H 2.7GHz
UHD Graphics Xe 16EUs (Tiger Lake-H)
~ 14 fps
100%
UHD Graphics Xe 16EUs (Tiger Lake-H):
5.8 fps
100%
UHD Graphics Xe 16EUs (Tiger Lake-H):
3.3 fps
100%
UHD Graphics Xe 16EUs (Tiger Lake-H):
15.4 [X] Lenovo ThinkBook 15p G2 ITH 21B1000WGE Intel Core i5-11400H 2.7GHz
UHD Graphics Xe 16EUs (Tiger Lake-H)
min:
5.42 fps, P0.1:
6.05 fps, P1:
9.93 fps, max:
84.5 fps
fps
100%
UHD Graphics Xe 16EUs (Tiger Lake-H):
4.8 [X] Lenovo ThinkBook 15p G2 ITH 21B1000WGE Intel Core i5-11400H 2.7GHz
UHD Graphics Xe 16EUs (Tiger Lake-H)
min:
2.68 fps, P0.1:
2.69 fps, P1:
2.78 fps, max:
23.3 fps
fps
100%
UHD Graphics Xe 16EUs (Tiger Lake-H):
25.5 [X] Gigabyte G5 GD Intel Core i5-11400H 2.7GHz
UHD Graphics Xe 16EUs (Tiger Lake-H)
min:
14.3 fps, P0.1:
14.7 fps, P1:
17.7 fps, max:
41.1 fps
fps
100%
UHD Graphics Xe 16EUs (Tiger Lake-H):
7.9 [X] Gigabyte G5 GD Intel Core i5-11400H 2.7GHz
UHD Graphics Xe 16EUs (Tiger Lake-H)
min:
4.73 fps, P0.1:
4.9 fps, P1:
6.04 fps, max:
14.7 fps
fps
100%
UHD Graphics Xe 16EUs (Tiger Lake-H):
15 [X] Blackview MP200 Intel Core i5-11400H 2.7GHz
UHD Graphics Xe 16EUs (Tiger Lake-H)
min:
11 fps, max:
19 fps
fps
100%
UHD Graphics Xe 16EUs (Tiger Lake-H):
7 [X] Blackview MP200 Intel Core i5-11400H 2.7GHz
UHD Graphics Xe 16EUs (Tiger Lake-H)
min:
6 fps, max:
9 fps
fps
100%
UHD Graphics Xe 16EUs (Tiger Lake-H):
7 [X] Blackview MP200 Intel Core i5-11400H 2.7GHz
UHD Graphics Xe 16EUs (Tiger Lake-H)
min:
5 fps, max:
9 fps
fps
100%
UHD Graphics Xe 16EUs (Tiger Lake-H):
6 [X] Blackview MP200 Intel Core i5-11400H 2.7GHz
UHD Graphics Xe 16EUs (Tiger Lake-H)
min:
5 fps, max:
8 fps
fps
UHD Graphics Xe 750 32EUs:
24 [X] Intel Core i9-11900K Intel Core i9-11900K 3.5GHz
UHD Graphics Xe 750 32EUs
min:
14.19 fps, max:
36.89 fps
fps
UHD Graphics Xe 750 32EUs:
10.6 [X] Intel Core i9-11900K Intel Core i9-11900K 3.5GHz
UHD Graphics Xe 750 32EUs
min:
5.39 fps, max:
15.76 fps
fps
UHD Graphics Xe 750 32EUs:
7.7 [X] Intel Core i9-11900K Intel Core i9-11900K 3.5GHz
UHD Graphics Xe 750 32EUs
min:
3.83 fps, max:
11.85 fps
fps
100%
UHD Graphics Xe 16EUs (Tiger Lake-H):
28.4 [X] Gigabyte G5 GD Intel Core i5-11400H 2.7GHz
UHD Graphics Xe 16EUs (Tiger Lake-H)
min:
12.8 fps, P0.1:
13.2 fps, P1:
21.7 fps, max:
96.3 fps
fps
100%
UHD Graphics Xe 16EUs (Tiger Lake-H):
10.4 [X] Gigabyte G5 GD Intel Core i5-11400H 2.7GHz
UHD Graphics Xe 16EUs (Tiger Lake-H)
min:
9.04 fps, P0.1:
9.04 fps, P1:
9.07 fps, max:
15.2 fps
fps
100%
UHD Graphics Xe 16EUs (Tiger Lake-H):
15.8 fps
100%
UHD Graphics Xe 16EUs (Tiger Lake-H):
6.7 fps
100%
UHD Graphics Xe 16EUs (Tiger Lake-H):
31 31.5 [X] Blackview MP200 1.47.22.14 D3D12
Intel Core i5-11400H 2.7GHz
UHD Graphics Xe 16EUs (Tiger Lake-H)
min:
7.3 fps, P1:
9.39 fps, max:
338 fps
33.9 [X] Gigabyte G5 GD 1.47.22.14 D3D12
Intel Core i5-11400H 2.7GHz
UHD Graphics Xe 16EUs (Tiger Lake-H)
min:
7.7 fps, P1:
10.7 fps, max:
467 fps
~ 32 fps
119%
UHD Graphics Xe 750 32EUs:
25.2 51.1 [X] Intel Core i9-11900K 1.47.22.14 D3D12
Intel Core i9-11900K 3.5GHz
UHD Graphics Xe 750 32EUs
min:
10.4 fps, P1:
14.5 fps, max:
566 fps
~ 38 fps
100%
UHD Graphics Xe 16EUs (Tiger Lake-H):
11.7 [X] Blackview MP200 1.47.22.14 D3D12
Intel Core i5-11400H 2.7GHz
UHD Graphics Xe 16EUs (Tiger Lake-H)
min:
5 fps, P1:
5 fps, max:
282 fps
12 12.3 [X] Gigabyte G5 GD 1.47.22.14 D3D12
Intel Core i5-11400H 2.7GHz
UHD Graphics Xe 16EUs (Tiger Lake-H)
min:
5 fps, P1:
5.03 fps, max:
298 fps
~ 12 fps
125%
UHD Graphics Xe 750 32EUs:
10.1 19 [X] Intel Core i9-11900K 1.47.22.14 D3D12
Intel Core i9-11900K 3.5GHz
UHD Graphics Xe 750 32EUs
min:
5 fps, P1:
5 fps, max:
430 fps
~ 15 fps
100%
UHD Graphics Xe 16EUs (Tiger Lake-H):
10.9 [X] Gigabyte G5 GD 1.47.22.14 D3D12
Intel Core i5-11400H 2.7GHz
UHD Graphics Xe 16EUs (Tiger Lake-H)
min:
5 fps, P1:
5 fps, max:
362 fps
11 11.9 [X] Blackview MP200 1.47.22.14 D3D12
Intel Core i5-11400H 2.7GHz
UHD Graphics Xe 16EUs (Tiger Lake-H)
min:
5 fps, P1:
5 fps, max:
294 fps
~ 11 fps
109%
UHD Graphics Xe 750 32EUs:
9.2 15 [X] Intel Core i9-11900K 1.47.22.14 D3D12
Intel Core i9-11900K 3.5GHz
UHD Graphics Xe 750 32EUs
min:
5 fps, P1:
5 fps, max:
446 fps
~ 12 fps
100%
UHD Graphics Xe 16EUs (Tiger Lake-H):
7 13.8 [X] Gigabyte G5 GD 1.47.22.14 D3D12
Intel Core i5-11400H 2.7GHz
UHD Graphics Xe 16EUs (Tiger Lake-H)
min:
5 fps, P1:
5 fps, max:
423 fps
15 [X] Blackview MP200 1.47.22.14 D3D12
Intel Core i5-11400H 2.7GHz
UHD Graphics Xe 16EUs (Tiger Lake-H)
min:
5 fps, P1:
5 fps, max:
320 fps
~ 12 fps
110%
UHD Graphics Xe 750 32EUs:
13.2 [X] Intel Core i9-11900K 1.47.22.14 D3D12
Intel Core i9-11900K 3.5GHz
UHD Graphics Xe 750 32EUs
min:
5 fps, P1:
5 fps, max:
512 fps
fps
100%
UHD Graphics Xe 16EUs (Tiger Lake-H):
16 [X] Blackview MP200 Intel Core i5-11400H 2.7GHz
UHD Graphics Xe 16EUs (Tiger Lake-H)
min:
14 fps, max:
19 fps
18 [X] Gigabyte G5 GD Intel Core i5-11400H 2.7GHz
UHD Graphics Xe 16EUs (Tiger Lake-H)
min:
15 fps, max:
21 fps
~ 17 fps
100%
UHD Graphics Xe 16EUs (Tiger Lake-H):
7 [X] Blackview MP200 Intel Core i5-11400H 2.7GHz
UHD Graphics Xe 16EUs (Tiger Lake-H)
min:
6 fps, max:
9 fps
8 [X] Gigabyte G5 GD Intel Core i5-11400H 2.7GHz
UHD Graphics Xe 16EUs (Tiger Lake-H)
min:
6 fps, max:
10 fps
~ 8 fps
100%
UHD Graphics Xe 16EUs (Tiger Lake-H):
7 [X] Blackview MP200 Intel Core i5-11400H 2.7GHz
UHD Graphics Xe 16EUs (Tiger Lake-H)
min:
6 fps, max:
8 fps
fps
100%
UHD Graphics Xe 16EUs (Tiger Lake-H):
14.7 18.4 18.8 [X] Gigabyte G5 GD Intel Core i5-11400H 2.7GHz
UHD Graphics Xe 16EUs (Tiger Lake-H)
29.1 ~ 20 fps
80%
UHD Graphics Xe 750 32EUs:
11.3 17.6 [X] Asus ROG Maximus XIII Hero, Intel Xe 750 Intel Core i5-11600K 3.9GHz
UHD Graphics Xe 750 32EUs
18.3 [X] Asus Maximus XIII Hero Intel Core i7-11700K 3.6GHz
UHD Graphics Xe 750 32EUs
~ 16 fps
100%
UHD Graphics Xe 16EUs (Tiger Lake-H):
10.1 14.8 [X] Gigabyte G5 GD Intel Core i5-11400H 2.7GHz
UHD Graphics Xe 16EUs (Tiger Lake-H)
16.8 17.2 ~ 15 fps
100%
UHD Graphics Xe 750 32EUs:
8.5 17.3 [X] Asus Maximus XIII Hero Intel Core i7-11700K 3.6GHz
UHD Graphics Xe 750 32EUs
18.8 [X] Asus ROG Maximus XIII Hero, Intel Xe 750 Intel Core i5-11600K 3.9GHz
UHD Graphics Xe 750 32EUs
~ 15 fps
100%
UHD Graphics Xe 16EUs (Tiger Lake-H):
8.9 13.7 [X] Gigabyte G5 GD Intel Core i5-11400H 2.7GHz
UHD Graphics Xe 16EUs (Tiger Lake-H)
15.4 15.8 ~ 13 fps
108%
UHD Graphics Xe 750 32EUs:
7.6 16.4 [X] Asus Maximus XIII Hero Intel Core i7-11700K 3.6GHz
UHD Graphics Xe 750 32EUs
18 [X] Asus ROG Maximus XIII Hero, Intel Xe 750 Intel Core i5-11600K 3.9GHz
UHD Graphics Xe 750 32EUs
~ 14 fps
100%
UHD Graphics Xe 16EUs (Tiger Lake-H):
12.1 14 14.6 14.9 [X] Gigabyte G5 GD 1.3
Intel Core i5-11400H 2.7GHz
UHD Graphics Xe 16EUs (Tiger Lake-H)
~ 14 fps
129%
UHD Graphics Xe 750 32EUs:
5.9 23 [X] Intel Core i9-11900K 1.3
Intel Core i9-11900K 3.5GHz
UHD Graphics Xe 750 32EUs
23.6 [X] Asus ROG Maximus XIII Hero, Intel Xe 750 1.3
Intel Core i9-11900K 3.5GHz
UHD Graphics Xe 750 32EUs
~ 18 fps
100%
UHD Graphics Xe 16EUs (Tiger Lake-H):
5.8 6.6 6.9 ~ 6 fps
150%
UHD Graphics Xe 750 32EUs:
3.5 12.3 [X] Asus ROG Maximus XIII Hero, Intel Xe 750 1.3
Intel Core i9-11900K 3.5GHz
UHD Graphics Xe 750 32EUs
12.4 [X] Intel Core i9-11900K 1.3
Intel Core i9-11900K 3.5GHz
UHD Graphics Xe 750 32EUs
~ 9 fps
100%
UHD Graphics Xe 16EUs (Tiger Lake-H):
4.2 4.7 4.8 ~ 5 fps
120%
UHD Graphics Xe 750 32EUs:
2.5 8.4 [X] Asus ROG Maximus XIII Hero, Intel Xe 750 1.3
Intel Core i9-11900K 3.5GHz
UHD Graphics Xe 750 32EUs
8.5 [X] Intel Core i9-11900K 1.3
Intel Core i9-11900K 3.5GHz
UHD Graphics Xe 750 32EUs
~ 6 fps
UHD Graphics Xe 750 32EUs:
6 [X] Asus ROG Maximus XIII Hero, Intel Xe 750 1.3
Intel Core i9-11900K 3.5GHz
UHD Graphics Xe 750 32EUs
fps
UHD Graphics Xe 750 32EUs:
3.5 [X] Asus ROG Maximus XIII Hero, Intel Xe 750 1.3
Intel Core i9-11900K 3.5GHz
UHD Graphics Xe 750 32EUs
fps
100%
UHD Graphics Xe 16EUs (Tiger Lake-H):
53.2 98.7 [X] Blackview MP200 Intel Core i5-11400H 2.7GHz
UHD Graphics Xe 16EUs (Tiger Lake-H)
min:
85.5 fps, max:
-1 fps
108 114 [X] Gigabyte G5 GD Intel Core i5-11400H 2.7GHz
UHD Graphics Xe 16EUs (Tiger Lake-H)
min:
92.2 fps, max:
-1 fps
~ 93 fps
110%
UHD Graphics Xe 750 32EUs:
35.1 84.8 [X] Intel Core i9-11900K Intel Core i9-11900K 3.5GHz
UHD Graphics Xe 750 32EUs
min:
31.6 fps, max:
-1 fps
126 [X] Asus ROG Maximus XIII Hero, Intel Xe 750 Intel Core i5-11600K 3.9GHz
UHD Graphics Xe 750 32EUs
min:
108.5 fps, max:
-1 fps
132 [X] Asus ROG Maximus XIII Hero, Intel Xe 750 Intel Core i9-11900K 3.5GHz
UHD Graphics Xe 750 32EUs
min:
109.7 fps, max:
-1 fps
133 [X] Asus Maximus XIII Hero Intel Core i7-11700K 3.6GHz
UHD Graphics Xe 750 32EUs
min:
107.7 fps, max:
-1 fps
~ 102 fps
100%
UHD Graphics Xe 16EUs (Tiger Lake-H):
37.6 53.7 [X] Blackview MP200 Intel Core i5-11400H 2.7GHz
UHD Graphics Xe 16EUs (Tiger Lake-H)
min:
47.9 fps, max:
-1 fps
57 58.1 [X] Gigabyte G5 GD Intel Core i5-11400H 2.7GHz
UHD Graphics Xe 16EUs (Tiger Lake-H)
min:
51.9 fps, max:
-1 fps
~ 52 fps
117%
UHD Graphics Xe 750 32EUs:
20.6 60.3 [X] Intel Core i9-11900K Intel Core i9-11900K 3.5GHz
UHD Graphics Xe 750 32EUs
min:
29.5 fps, max:
-1 fps
73.8 [X] Asus ROG Maximus XIII Hero, Intel Xe 750 Intel Core i9-11900K 3.5GHz
UHD Graphics Xe 750 32EUs
min:
64.6 fps, max:
-1 fps
74.2 [X] Asus Maximus XIII Hero Intel Core i7-11700K 3.6GHz
UHD Graphics Xe 750 32EUs
min:
65.4 fps, max:
-1 fps
74.7 [X] Asus ROG Maximus XIII Hero, Intel Xe 750 Intel Core i5-11600K 3.9GHz
UHD Graphics Xe 750 32EUs
min:
66.1 fps, max:
-1 fps
~ 61 fps
100%
UHD Graphics Xe 16EUs (Tiger Lake-H):
18.5 22.6 [X] Blackview MP200 Intel Core i5-11400H 2.7GHz
UHD Graphics Xe 16EUs (Tiger Lake-H)
min:
20.6 fps, max:
-1 fps
23.1 23.8 [X] Gigabyte G5 GD Intel Core i5-11400H 2.7GHz
UHD Graphics Xe 16EUs (Tiger Lake-H)
min:
21.7 fps, max:
-1 fps
~ 22 fps
136%
UHD Graphics Xe 750 32EUs:
10.9 32.6 [X] Intel Core i9-11900K Intel Core i9-11900K 3.5GHz
UHD Graphics Xe 750 32EUs
min:
7.8 fps, max:
-1 fps
34.9 [X] Asus ROG Maximus XIII Hero, Intel Xe 750 Intel Core i5-11600K 3.9GHz
UHD Graphics Xe 750 32EUs
min:
31.8 fps, max:
-1 fps
35.5 [X] Asus Maximus XIII Hero Intel Core i7-11700K 3.6GHz
UHD Graphics Xe 750 32EUs
min:
32.4 fps, max:
-1 fps
35.6 [X] Asus ROG Maximus XIII Hero, Intel Xe 750 Intel Core i9-11900K 3.5GHz
UHD Graphics Xe 750 32EUs
min:
32.3 fps, max:
-1 fps
~ 30 fps
100%
UHD Graphics Xe 16EUs (Tiger Lake-H):
17.1 20.9 [X] Blackview MP200 Intel Core i5-11400H 2.7GHz
UHD Graphics Xe 16EUs (Tiger Lake-H)
min:
19 fps, max:
-1 fps
21.5 22 [X] Gigabyte G5 GD Intel Core i5-11400H 2.7GHz
UHD Graphics Xe 16EUs (Tiger Lake-H)
min:
19.9 fps, max:
-1 fps
~ 20 fps
135%
UHD Graphics Xe 750 32EUs:
9.9 30 [X] Intel Core i9-11900K Intel Core i9-11900K 3.5GHz
UHD Graphics Xe 750 32EUs
min:
11.4 fps, max:
-1 fps
31.9 [X] Asus ROG Maximus XIII Hero, Intel Xe 750 Intel Core i5-11600K 3.9GHz
UHD Graphics Xe 750 32EUs
min:
29.2 fps, max:
-1 fps
32.5 [X] Asus Maximus XIII Hero Intel Core i7-11700K 3.6GHz
UHD Graphics Xe 750 32EUs
min:
29.6 fps, max:
-1 fps
32.6 [X] Asus ROG Maximus XIII Hero, Intel Xe 750 Intel Core i9-11900K 3.5GHz
UHD Graphics Xe 750 32EUs
min:
29.7 fps, max:
-1 fps
~ 27 fps
UHD Graphics Xe 750 32EUs:
12.4 [X] Asus ROG Maximus XIII Hero, Intel Xe 750 Intel Core i9-11900K 3.5GHz
UHD Graphics Xe 750 32EUs
min:
11.5 fps, max:
-1 fps
fps
100%
UHD Graphics Xe 16EUs (Tiger Lake-H):
24.5 27 ~ 26 fps
100%
UHD Graphics Xe 16EUs (Tiger Lake-H):
17 fps
100%
UHD Graphics Xe 16EUs (Tiger Lake-H):
8.3 9 ~ 9 fps
100%
UHD Graphics Xe 16EUs (Tiger Lake-H):
5 fps
100%
UHD Graphics Xe 16EUs (Tiger Lake-H):
59.3 [X] Blackview MP200 Intel Core i5-11400H 2.7GHz
UHD Graphics Xe 16EUs (Tiger Lake-H)
min:
9.5 fps, P1:
33.3 fps, max:
110.9 fps
62.8 ~ 61 fps
60%
UHD Graphics Xe 750 32EUs:
36.8 fps
100%
UHD Graphics Xe 16EUs (Tiger Lake-H):
46.9 [X] Blackview MP200 Intel Core i5-11400H 2.7GHz
UHD Graphics Xe 16EUs (Tiger Lake-H)
min:
11.4 fps, P1:
27 fps, max:
188.7 fps
50 ~ 48 fps
71%
UHD Graphics Xe 750 32EUs:
34.1 fps
100%
UHD Graphics Xe 16EUs (Tiger Lake-H):
8.6 [X] Blackview MP200 Intel Core i5-11400H 2.7GHz
UHD Graphics Xe 16EUs (Tiger Lake-H)
min:
3.34 fps, P1:
6.21 fps, max:
247 fps
9.2 ~ 9 fps
100%
UHD Graphics Xe 16EUs (Tiger Lake-H):
3.5 [X] Blackview MP200 Intel Core i5-11400H 2.7GHz
UHD Graphics Xe 16EUs (Tiger Lake-H)
min:
1.639 fps, P1:
2.12 fps, max:
21.2 fps
3.6 [X] Blackview MP200 Intel Core i5-11400H 2.7GHz
UHD Graphics Xe 16EUs (Tiger Lake-H)
min:
1.706 fps, P1:
2.11 fps, max:
17.5 fps
~ 4 fps
Average Gaming Intel UHD Graphics Xe 16EUs (Tiger Lake-H) → 100% Average Gaming 30-70 fps → 100%
Average Gaming Intel UHD Graphics Xe 750 32EUs (Rocket Lake) → 122% Average Gaming 30-70 fps → 92%
Intel UHD Graphics Xe 750 32EUs (Rocket Lake) low med. high ultra QHD 4K F1 22 21.1 18.8 God of War 12.9 Valorant 198.3 64.1 50.8 36.1 Metro Exodus 24 10.6 7.74 Strange Brigade 38 15 12 13.2 X-Plane 11.11 16 15 14 Final Fantasy XV Benchmark 18 9 6 6 3.48 Dota 2 Reborn 102 61 30 27 12.4 GTA V 36.8 34.1 < 30 fps < 60 fps < 120 fps ≥ 120 fps 5 2 1 1 5 1 2 4 2 2 1 1 2
v1.26
log 19. 22:53:47
#0 checking url part for id 10941 +0s ... 0s
#1 checking url part for id 10943 +0s ... 0s
#2 not redirecting to Ajax server +0s ... 0s
#3 did not recreate cache, as it is less than 5 days old! Created at Fri, 19 Apr 2024 05:40:26 +0200 +0.001s ... 0.001s
#4 composed specs +0.115s ... 0.116s
#5 did output specs +0s ... 0.116s
#6 start showIntegratedCPUs +0s ... 0.116s
#7 getting avg benchmarks for device 10941 +0.05s ... 0.166s
#8 got single benchmarks 10941 +0.017s ... 0.183s
#9 getting avg benchmarks for device 10943 +0.021s ... 0.204s
#10 got single benchmarks 10943 +0.022s ... 0.227s
#11 got avg benchmarks for devices +0s ... 0.227s
#12 min, max, avg, median took s +0.402s ... 0.628s
#13 before gaming benchmark output +0s ... 0.628s
#14 Got 239 rows for game benchmarks. +0.043s ... 0.671s
#15 composed SQL query for gamebenchmarks +0s ... 0.671s
#16 got data and put it in $dataArray +0.061s ... 0.732s
#17 benchmarks composed for output. +0.185s ... 0.917s
#18 calculated avg scores. +0s ... 0.917s
#19 return log +0.046s ... 0.963s
Teilen Sie diesen Artikel, um uns zu unterstützen. Jeder Link hilft!
Autor: Klaus Hinum, 8.09.2017 (Update: 1.07.2023)
 Deutsch
 English
 Español
 Français
 Italiano
 Nederlands
 Polski
 Português
 Русский
 Türkçe
 Svenska
 Chinese
 Magyar