Notebookcheck Logo

Telechips TCC8803 1GHz vs WonderMedia PRIZM WM8950 vs Marvell PXA986

Telechips TCC8803 1GHz

► remove from comparison  TCC8803 1GHz

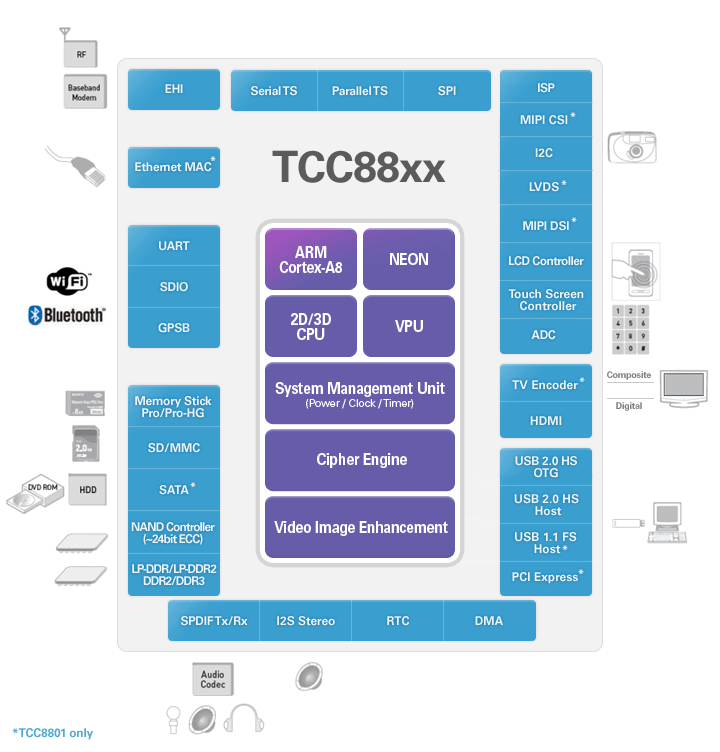
ARM Mali 2D/3D graphics accelerator, DDR / DDR2 / LP-DDR2 / LP-DDR2 memory interface, LVDS Transmitter, HDMI 1.4, Composite TV-Out (NTSC / PAL), USB 2.0 HS OTG, USB 2.0 host, USB 1.1 HOST, EHI (External Host Interface), UART, NAND Flash Interface

Telechips' TCC88xx application processor will redefine the mobile device of tomorrow with new' innovative user experience by PC-like web browsing, 1080p full HD video record & playback, intuitive user interfaces, location based services and next generation social networking applications. TCC88xx supports development of planned features for the Tablet PC and HMP of tomorrow with tremendous performance and programmability to support new applications yet to be imagined. TCC88xx is equipped with hardwired VPU/GPU/ISP to maximize multimedia experience at its peak level.


WonderMedia PRIZM WM8950

► remove from comparison  WM8950

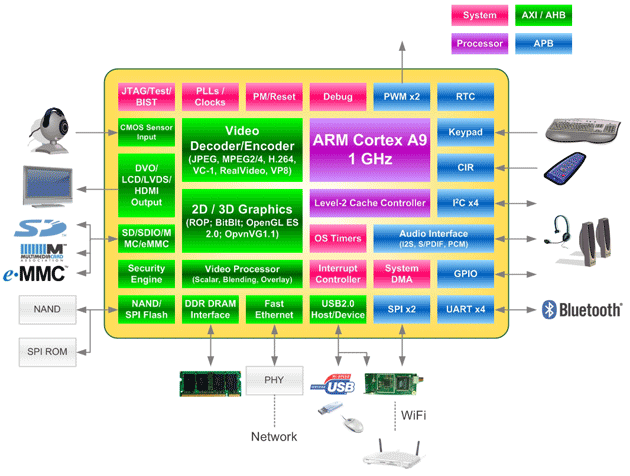
Der VIA WonderMedia PRIZM WM8950 ist ein günstiger Einsteiger-SoC für Tablets und Smartphones. Er ist hauptsächlich für Android 4.x und Windows CE gedacht und bietet folgende Komponenten: 

  • Einzelkern Cortex-A9 Prozessor mit 1GHz Taktrate
  • ARM Mali 400(MP2?) Grafikkarte
  • Multi-Standard 1080p Video Decoding, H.264 Video Encoding
  • DDR3/LPDDR2 Speicherkontroller
  • Hardware Security Engine

Marvell PXA986

► remove from comparison Marvell Technology Group PXA986

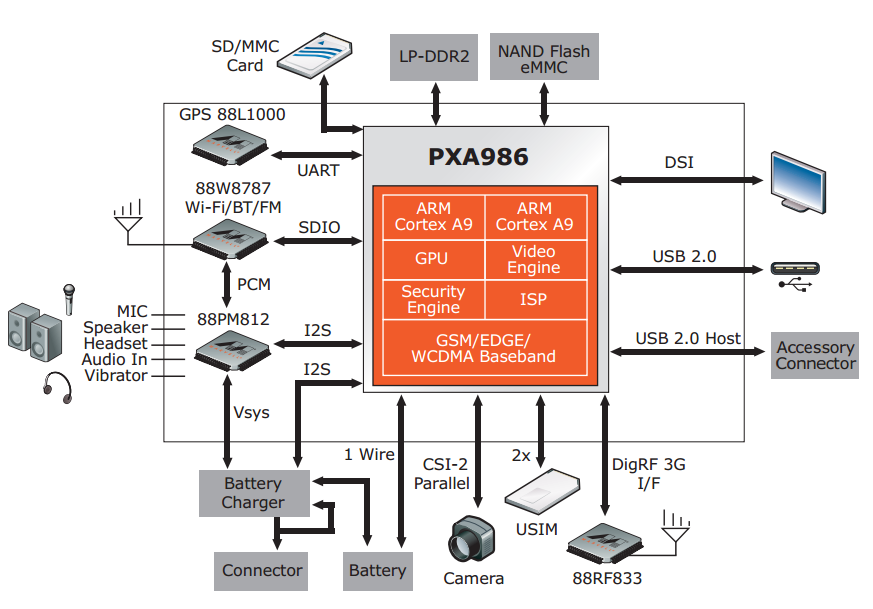
Der Marvell PXA986 ist ein ARM basierter Dual-Core SoC für Smartphones und Tablets. Er bietet zwei Cortex-A9 Kerne mit meist 1.2 GHz Takt, eine Vivante GC1000 Grafikkarte, einen Video-Prozessor für 720p30 Wiedergabe von H.263, H.264 BP und MPEG4- SP und ein WCDMA+HSDPA Modem.

ModelTelechips TCC8803 1GHzWonderMedia PRIZM WM8950Marvell PXA986
Series Marvell Technology Group
Serie: Cortex-A9
newitem cores
HiSilicon Kirin 9000W1.53 - 2.49 GHz12 / 12 cores
UNISOC Tiger T3101.8 - 2 GHz4 / 4 cores
Rockchip RK32881.8 GHz4 / 4 cores
Apple A6x1.4 GHzcores
Apple A61 GHzcores
Apple S52 / 2 cores
HiSilicon k3v2 Hi36201.2 GHz4 / 4 cores
Rockchip RK3066 1.5 GHz1.5 GHz2 / 2 cores
Amlogic AML8726-MX1.5 GHz2 / 2 cores
Rockchip RK31681.2 GHz2 / 2 cores
Rockchip RK2918 1.2 GHz1.2 GHz1 / 1 cores
ARM Cortex A8 1.2 GHz1.2 GHz1 / 1 cores
Telechips TCC8803 1GHz « 1 GHz1 / 1 cores
Loongson 2F 900MHz0.9 GHz1 / 1 cores
CSR86700.08 GHzcores
ARM Cortex-M4 cores
HiSilicon Hi6262 cores
DK3.5+STcores
unknown cores
HiSilicon Kirin 910T1.8 GHz4 / 4 cores Cortex-A9
Rockchip RK31881.8 GHz4 / 4 cores Cortex-A9
HiSilicon Kirin 9101.6 GHz4 / 4 cores Cortex-A9
Renesas MP52321.5 GHz2 / 2 cores Cortex-A9
Broadcom BCM21664T1.2 GHz2 / 2 cores Cortex-A9
Marvell PXA9861.2 GHz2 / 2 cores Cortex-A9
NXP i.MX 6SLL1 GHz1 / 1 cores Cortex-A9
WonderMedia PRIZM WM8950 « 1 GHz1 / 1 cores Cortex-A9
HiSilicon Kirin 910T1.8 GHz4 / 4 cores Cortex-A9
Rockchip RK31881.8 GHz4 / 4 cores Cortex-A9
HiSilicon Kirin 9101.6 GHz4 / 4 cores Cortex-A9
Renesas MP52321.5 GHz2 / 2 cores Cortex-A9
Broadcom BCM21664T1.2 GHz2 / 2 cores Cortex-A9
Marvell PXA986 « 1.2 GHz2 / 2 cores Cortex-A9
NXP i.MX 6SLL1 GHz1 / 1 cores Cortex-A9
WonderMedia PRIZM WM89501 GHz1 / 1 cores Cortex-A9
Clock1000 MHz1000 MHz1200 MHz
Cores / Threads1 / 11 / 12 / 2
Technology65 nm45 nm
ArchitectureARMARMARM
Announced
CodenameCortex-A9Cortex-A9
iGPUARM Mali-400 MP
Manufacturerwww.wondermedia.com.twwww.marvell.com

Benchmarks

3DMark - 3DMark Ice Storm Physics
100%
1 PXA986 +
min: 2623     avg: 2874     median: 2740 (2%)     max: 3258 Points
3DMark - 3DMark Ice Storm Extreme Physics
100%
1 PXA986 +
min: 2709     avg: 2985     median: 2985 (2%)     max: 3261 Points
3DMark - 3DMark Ice Storm Unlimited Physics
100%
1 PXA986 +
3675 Points (3%)
Geekbench 3 - Geekbench 3 32 Bit Multi-Core
100%
1 PXA986 +
min: 631     avg: 647     median: 646.5 (1%)     max: 662 Points
Geekbench 3 - Geekbench 3 32 Bit Single-Core
100%
1 PXA986 +
min: 376     avg: 379.5     median: 379.5 (7%)     max: 383 Points
Geekbench 2 - 32 Bit - Geekbench Stream
100%
1 PXA986 +
min: 437     avg: 439.5     median: 439.5 (4%)     max: 442 Points
Geekbench 2 - 32 Bit - Geekbench Memory
100%
1 PXA986 +
min: 1337     avg: 1448     median: 1448 (13%)     max: 1559 Points
Geekbench 2 - 32 Bit - Geekbench Floating Point
100%
1 PXA986 +
min: 1275     avg: 1284     median: 1284 (3%)     max: 1293 Points
Geekbench 2 - 32 Bit - Geekbench Integer
100%
1 PXA986 +
min: 709     avg: 720     median: 720 (1%)     max: 731 Points
Geekbench 2 - 32 Bit - Geekbench Total Score
100%
1 PXA986 +
min: 1005     avg: 1035     median: 1034.5 (3%)     max: 1064 Points
Linpack Android / IOS - Linpack Single Thread
13.4 MFLOPS (1%)
37.5 MFLOPS (4%)
min: 39.83     avg: 41.6     median: 41.4 (4%)     max: 43.69 MFLOPS
Linpack Android / IOS - Linpack Multi Thread
100%
1 WM8950 +
30.8 MFLOPS (1%)
240%
1 PXA986 +
min: 73.7     avg: 74.3     median: 74 (3%)     max: 75.3 MFLOPS
Mozilla Kraken 1.1 - Kraken 1.1 Total Score *
100%
1 PXA986 +
min: 23941     avg: 25315     median: 25315 (30%)     max: 26689 ms
Sunspider - Sunspider 0.9.1 Total Score *
100%
1 WM8950 +
2410 ms (23%)
111%
1 PXA986 +
min: 1453     avg: 1531     median: 1530.5 (15%)     max: 1608 ms
Sunspider - Sunspider 1.0 Total Score *
100%
1 PXA986 +
min: 1428     avg: 1608     median: 1624 (18%)     max: 1771 ms
Octane V2 - Octane V2 Total Score
100%
1 PXA986 +
1448 Points (1%)
Quadrant Standard Edition 2.0 - Quadrant Standard 2.0 Total Score
100%
1 WM8950 +
2140 points (5%)
164%
1 PXA986 +
min: 3257     avg: 3515     median: 3514.5 (8%)     max: 3772 points
AnTuTu v3 - AnTuTu v3 CPU
100%
1 WM8950 +
1282 Points (8%)
230%
1 PXA986 +
2945 Points (19%)
AnTuTu v4 - AnTuTu v4 Total Score
100%
1 PXA986 +
min: 11051     avg: 11392     median: 11392 (26%)     max: 11733 Points
AndEBench - AndEBench Java
100%
1 PXA986 +
min: 137     avg: 160     median: 159 (5%)     max: 184 Iter./s
AndEBench - AndEBench Native
100%
1 PXA986 +
min: 4077     avg: 4208     median: 4266 (14%)     max: 4281 Iter./s
PassMark PerformanceTest Mobile V1 - PerformanceTest Mobile V1 CPU Tests
100%
1 PXA986 +
min: 3273     avg: 3820     median: 3976 (1%)     max: 4210 Points

Average Benchmarks Telechips TCC8803 1GHz → 100% n=1

Average Benchmarks WonderMedia PRIZM WM8950 → 280% n=1

Average Benchmarks Marvell PXA986 → 310% n=1

- Bereich der Benchmarkergebnisse für diese Grafikkarte
- Durchschnittliche Benchmarkergebnisse für diese Grafikkarte
* Smaller numbers mean a higher performance
1 This benchmark is not used for the average calculation

v1.26
log 02. 01:51:07

#0 checking url part for id 3327 +0s ... 0s

#1 checking url part for id 3778 +0s ... 0s

#2 checking url part for id 4461 +0s ... 0s

#3 not redirecting to Ajax server +0s ... 0s

#4 did not recreate cache, as it is less than 5 days old! Created at Sat, 01 Jun 2024 05:37:57 +0200 +0.001s ... 0.001s

#5 composed specs +0.134s ... 0.135s

#6 did output specs +0s ... 0.135s

#7 getting avg benchmarks for device 3327 +0.003s ... 0.138s

#8 got single benchmarks 3327 +0.009s ... 0.147s

#9 getting avg benchmarks for device 3778 +0.003s ... 0.15s

#10 got single benchmarks 3778 +0.008s ... 0.159s

#11 getting avg benchmarks for device 4461 +0.003s ... 0.161s

#12 got single benchmarks 4461 +0.012s ... 0.173s

#13 got avg benchmarks for devices +0s ... 0.173s

#14 min, max, avg, median took s +0.075s ... 0.248s

#15 return log +0s ... 0.248s

Teilen Sie diesen Artikel, um uns zu unterstützen. Jeder Link hilft!
> Notebook Test, Laptop Test und News > Benchmarks / Technik > Benchmarks / Technik > Prozessor Vergleich - Head 2 Head
Autor: Klaus Hinum,  8.09.2017 (Update:  1.07.2023)