Kingston A2000 M.2 NVMe SSD Benchmarked
NVMe SSDs have been slowly replacing SATA SSDs on most laptops. Unfortunately, entry-level NVMe SSDs like the SK Hynix PC401 or Toshiba BG3 tend to offer nowhere the performance of more well-known NVMe SSDs like the Samsung PM981 or WD SN720. Sequential write rates for these budget NVMe drives can sometimes be under 500 MB/s to be slower than a standard SATA III SSD.
Kingston hopes to break this trend with the A2000 series of M.2 2280 NVMe SSDs. These drives are self-encrypting with a base 5-year limited warranty and they are already available on Amazon in 250 GB, 500 GB, and 1 TB solutions ranging from $40 to $130 USD. We recommend checking out the official product page here to learn more about the specifications of the A2000 series.
| Storage Capacity | Max Sequential Read (MB/s) | Max Sequential Write (MB/s) | Read IOPS | Write IOPS |
|---|---|---|---|---|
| 250 GB | 2000 | 1100 | 150K | 180K |
| 500 GB | 2200 | 2000 | 180K | 200K |
| 1 TB | 2200 | 2000 | 250K | 220K |
Test System
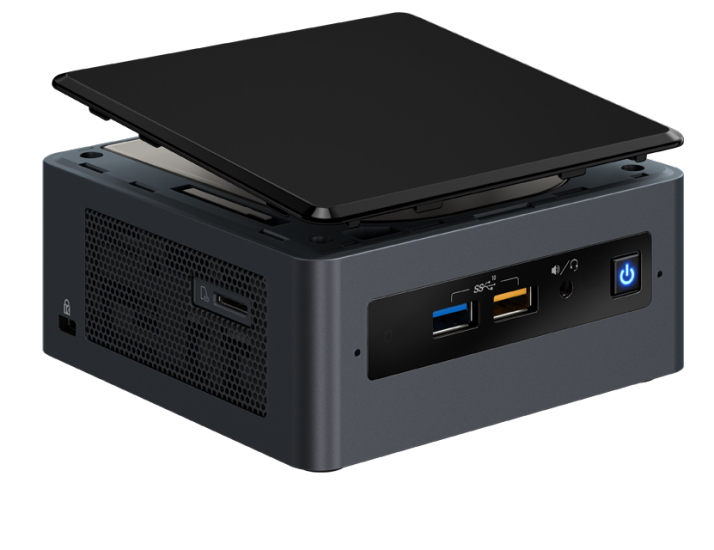
Our test system is the Intel NUC8i7BEH able to house a primary 2.5-inch SATA III drive and a secondary M.2 PCIe x4 SSD. While the Kingston A2000 SSD installs with no issues, the packaging comes with no screws to secure the drive in place. Keep in mind that most laptops do not include the appropriate screw, either. At least Kingston includes a free activation key for Acronis True Image HD in each box.
See our review on the Intel NUC8i7BEH to learn more about the mini PC.
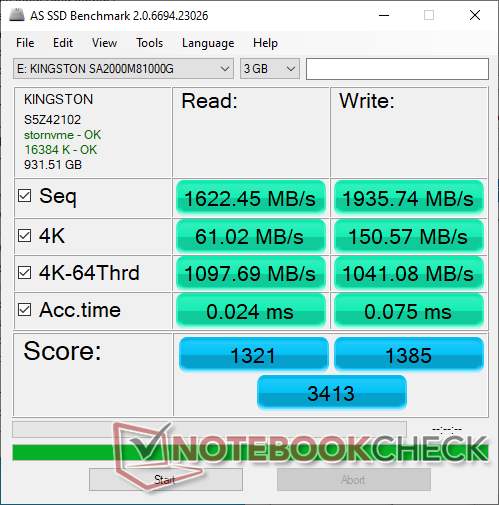
AS SSD & CrystalDiskMark
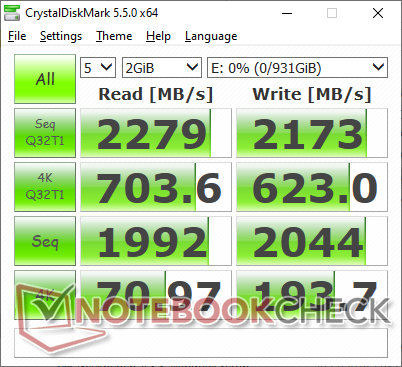
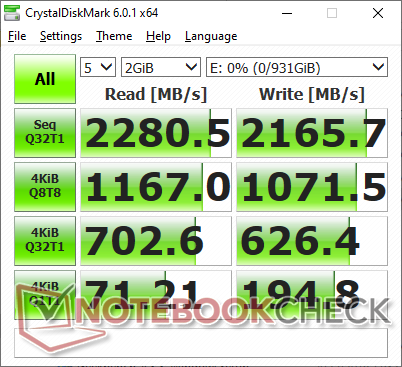
Kingston advertises sequential read and write rates of 2200 MB/s and 2000 MB/s, respectively, and CrystalDiskMark results essentially confirm the claims. These speeds are comparable to the costlier Samsung PM981 found on many flagship Ultrabooks.
Sequential read of small Q32T1 block sizes is perhaps the weakest aspect of the Kingston at about 2300 MB/s compared to 3000 MB/s or more on the Asura Genesis, Samsung PM981, or Toshiba XG6.
| Kingston A2000 Kingston SA2000M81000G | Intel NUC8i7BEH Asura NVMe SSD Asura Genesis Xtreme NVMe M.2 SSD 1 TB | Dell XPS 15 7590 9980HK GTX 1650 Toshiba XG6 KXG60ZNV1T02 | Dell G7 7590 Toshiba BG3 KBG30ZMS256G | Asus ROG G703GXR Samsung SSD PM981 MZVLB512HAJQ | Asus ZenBook Pro Duo UX581GV Samsung SSD PM981 MZVLB1T0HALR | Dell Latitude 5300 SK Hynix PC401 512GB M.2 (HFS512GD9TNG) | |
|---|---|---|---|---|---|---|---|
| CrystalDiskMark 5.2 / 6 | 14% | -14% | -65% | -16% | -19% | -30% | |
| Write 4K (MB/s) | 193.7 | 272.4 41% | 104.3 -46% | 77 -60% | 99.3 -49% | 104 -46% | 119.2 -38% |
| Read 4K (MB/s) | 71 | 57.1 -20% | 45.23 -36% | 31.39 -56% | 40.25 -43% | 41.12 -42% | 41.43 -42% |
| Write Seq (MB/s) | 2044 | 2019 -1% | 1729 -15% | 230.1 -89% | 2001 -2% | 1898 -7% | 1240 -39% |
| Read Seq (MB/s) | 1992 | 1701 -15% | 1861 -7% | 848 -57% | 2107 6% | 1618 -19% | 1668 -16% |
| Write 4K Q32T1 (MB/s) | 623 | 844 35% | 509 -18% | 152.1 -76% | 348.3 -44% | 408.7 -34% | 381.7 -39% |
| Read 4K Q32T1 (MB/s) | 704 | 884 26% | 388.5 -45% | 316.6 -55% | 391.5 -44% | 358.5 -49% | 371.5 -47% |
| Write Seq Q32T1 (MB/s) | 2173 | 2110 -3% | 2813 29% | 226.8 -90% | 2003 -8% | 2397 10% | 1369 -37% |
| Read Seq Q32T1 (MB/s) | 2279 | 3463 52% | 2906 28% | 1395 -39% | 3482 53% | 3158 39% | 2652 16% |
| Write 4K Q8T8 (MB/s) | 1072 | ||||||
| Read 4K Q8T8 (MB/s) | 1167 | ||||||
| AS SSD | 17% | -7% | -136% | -17% | -9% | -26% | |
| Seq Read (MB/s) | 1622 | 2288 41% | 1723 6% | 1013 -38% | 1030 -36% | 1409 -13% | 2123 31% |
| Seq Write (MB/s) | 1936 | 1908 -1% | 1386 -28% | 203.8 -89% | 1888 -2% | 1316 -32% | 744 -62% |
| 4K Read (MB/s) | 61 | 51.9 -15% | 43.25 -29% | 29.57 -52% | 43.83 -28% | 44.99 -26% | 43.02 -29% |
| 4K Write (MB/s) | 150.6 | 173.3 15% | 98.3 -35% | 71.4 -53% | 97.1 -36% | 93 -38% | 117.4 -22% |
| 4K-64 Read (MB/s) | 1098 | 1222 11% | 1078 -2% | 332.1 -70% | 1092 -1% | 1092 -1% | 680 -38% |
| 4K-64 Write (MB/s) | 1041 | 1829 76% | 1456 40% | 152.9 -85% | 1647 58% | 1810 74% | 1039 0% |
| Access Time Read * (ms) | 0.024 | 0.031 -29% | 0.05 -108% | 0.183 -663% | 0.082 -242% | 0.041 -71% | 0.057 -138% |
| Access Time Write * (ms) | 0.075 | 0.083 -11% | 0.039 48% | 0.248 -231% | 0.038 49% | 0.118 -57% | 0.051 32% |
| Score Read (Points) | 1321 | 1502 14% | 1294 -2% | 463 -65% | 1238 -6% | 1278 -3% | 935 -29% |
| Score Write (Points) | 1385 | 2193 58% | 1693 22% | 245 -82% | 1933 40% | 2034 47% | 1230 -11% |
| Score Total (Points) | 3413 | 4454 31% | 3638 7% | 913 -73% | 3856 13% | 3970 16% | 2586 -24% |
| Durchschnitt gesamt (Programm / Settings) | 16% /
16% | -11% /
-10% | -101% /
-106% | -17% /
-17% | -14% /
-13% | -28% /
-28% |
* ... kleinere Werte sind besser
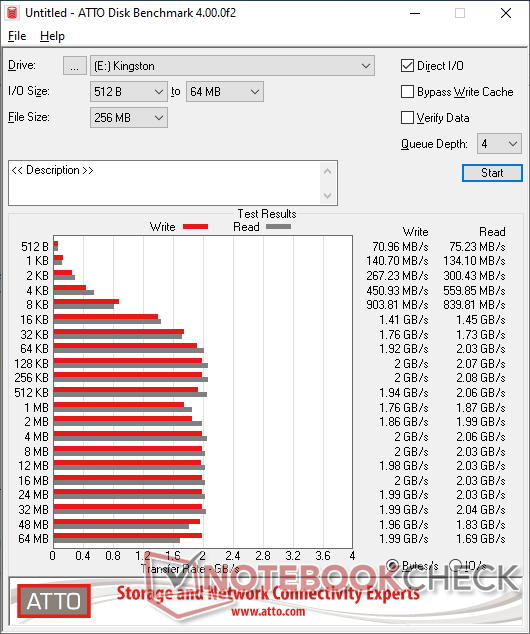
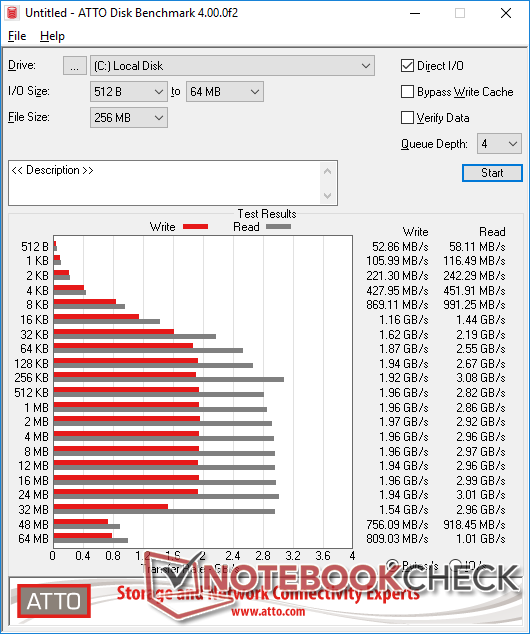
ATTO
The slower read rates of smaller blocks as mentioned above become more apparent when running ATTO which tests performance across a wider range of block sizes. Read rates top out at 2 GB/s from 64 KB and higher compared to over 3 GB/s on the Asura Genesis or the Samsung 970 EVO Plus.
| Kingston A2000 | Samsung 970 Evo Plus SSD (500 GB) | Samsung 960 Pro 1TB | Intel NUC8i7BEH Asura NVMe SSD | Dell Latitude 7285 | |
|---|---|---|---|---|---|
| ATTO Disk Benchmark | 44% | 23% | 18% | -58% | |
| 8192KB write (KB/s) | 2000000 | 3322220 66% | 2079890 4% | 1960000 -2% | 554109 -72% |
| 4096KB write (KB/s) | 2000000 | 3322220 66% | 2090010 5% | 1960000 -2% | 564467 -72% |
| 2048KB write (KB/s) | 1860000 | 3297730 77% | 2090010 12% | 1970000 6% | 557948 -70% |
| 1024KB write (KB/s) | 1760000 | 3205200 82% | 2100230 19% | 1960000 11% | 586388 -67% |
| 16KB write (KB/s) | 1410000 | 1153140 -18% | 1102410 -22% | 1160000 -18% | 524483 -63% |
| 8192KB read (KB/s) | 2030000 | 2975270 47% | 2960680 46% | 2970000 46% | 1099620 -46% |
| 4096KB read (KB/s) | 2060000 | 2975270 44% | 3019900 47% | 2960000 44% | 1187170 -42% |
| 2048KB read (KB/s) | 1990000 | 2960680 49% | 3026480 52% | 2920000 47% | 1351830 -32% |
| 1024KB read (KB/s) | 1870000 | 2811540 50% | 3263860 75% | 2860000 53% | 1231950 -34% |
| 16KB read (KB/s) | 1450000 | 1173620 -19% | 1257110 -13% | 1440000 -1% | 306332 -79% |
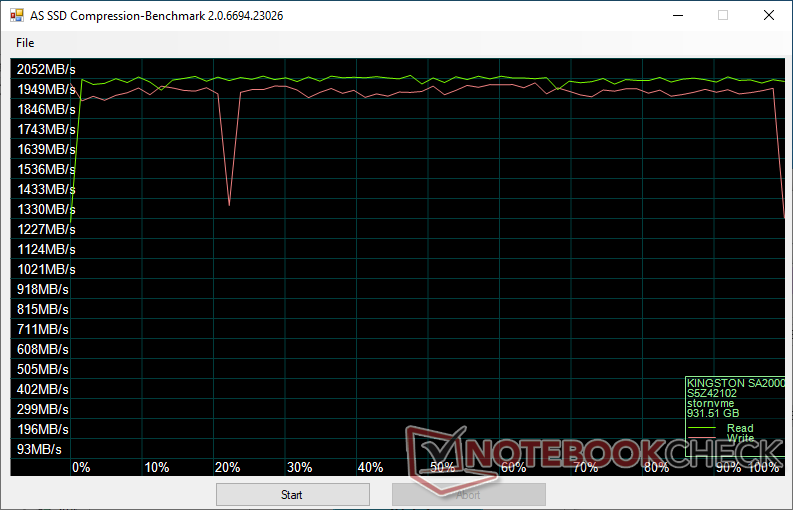
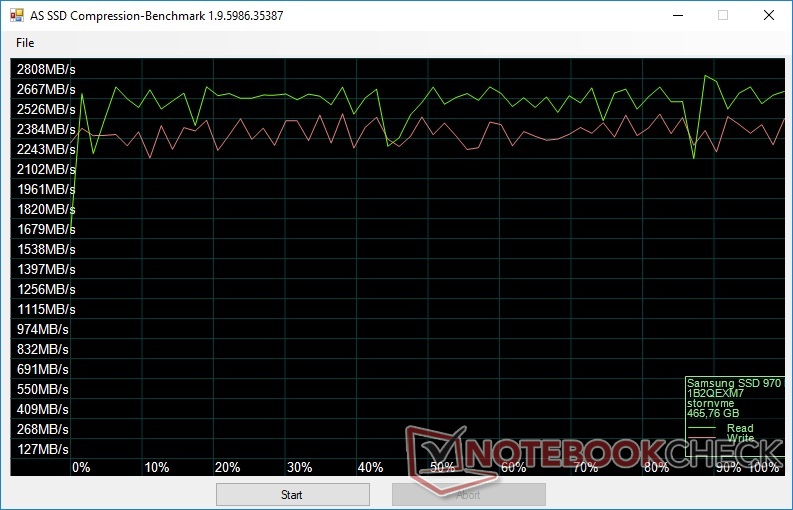
Data Compression
The Kingston drive is able to maintain more stable read and write rates throughout the test when compared to the Samsung 970 EVO Plus with the exception of a short-lived dip to about 1330 MB/s as shown by the results below. This peculiar dip would repeat on subsequent reruns.
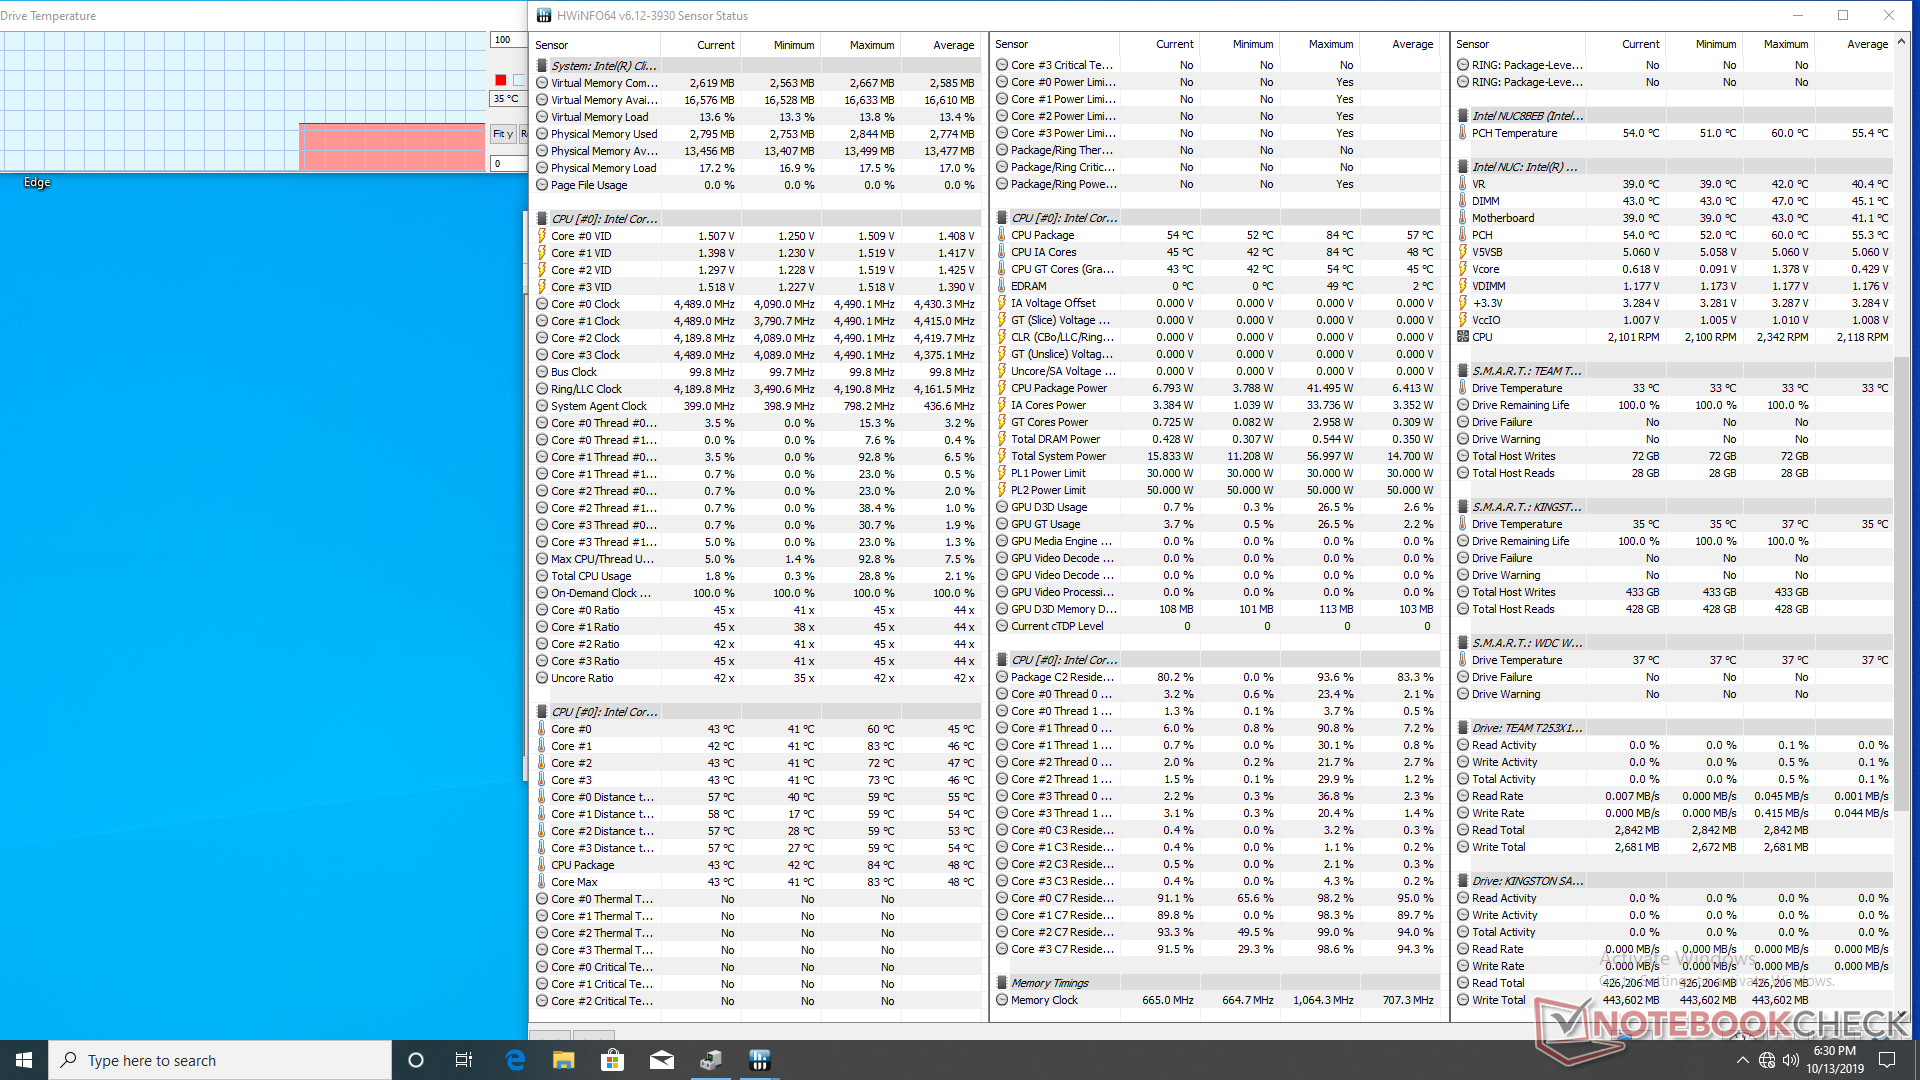
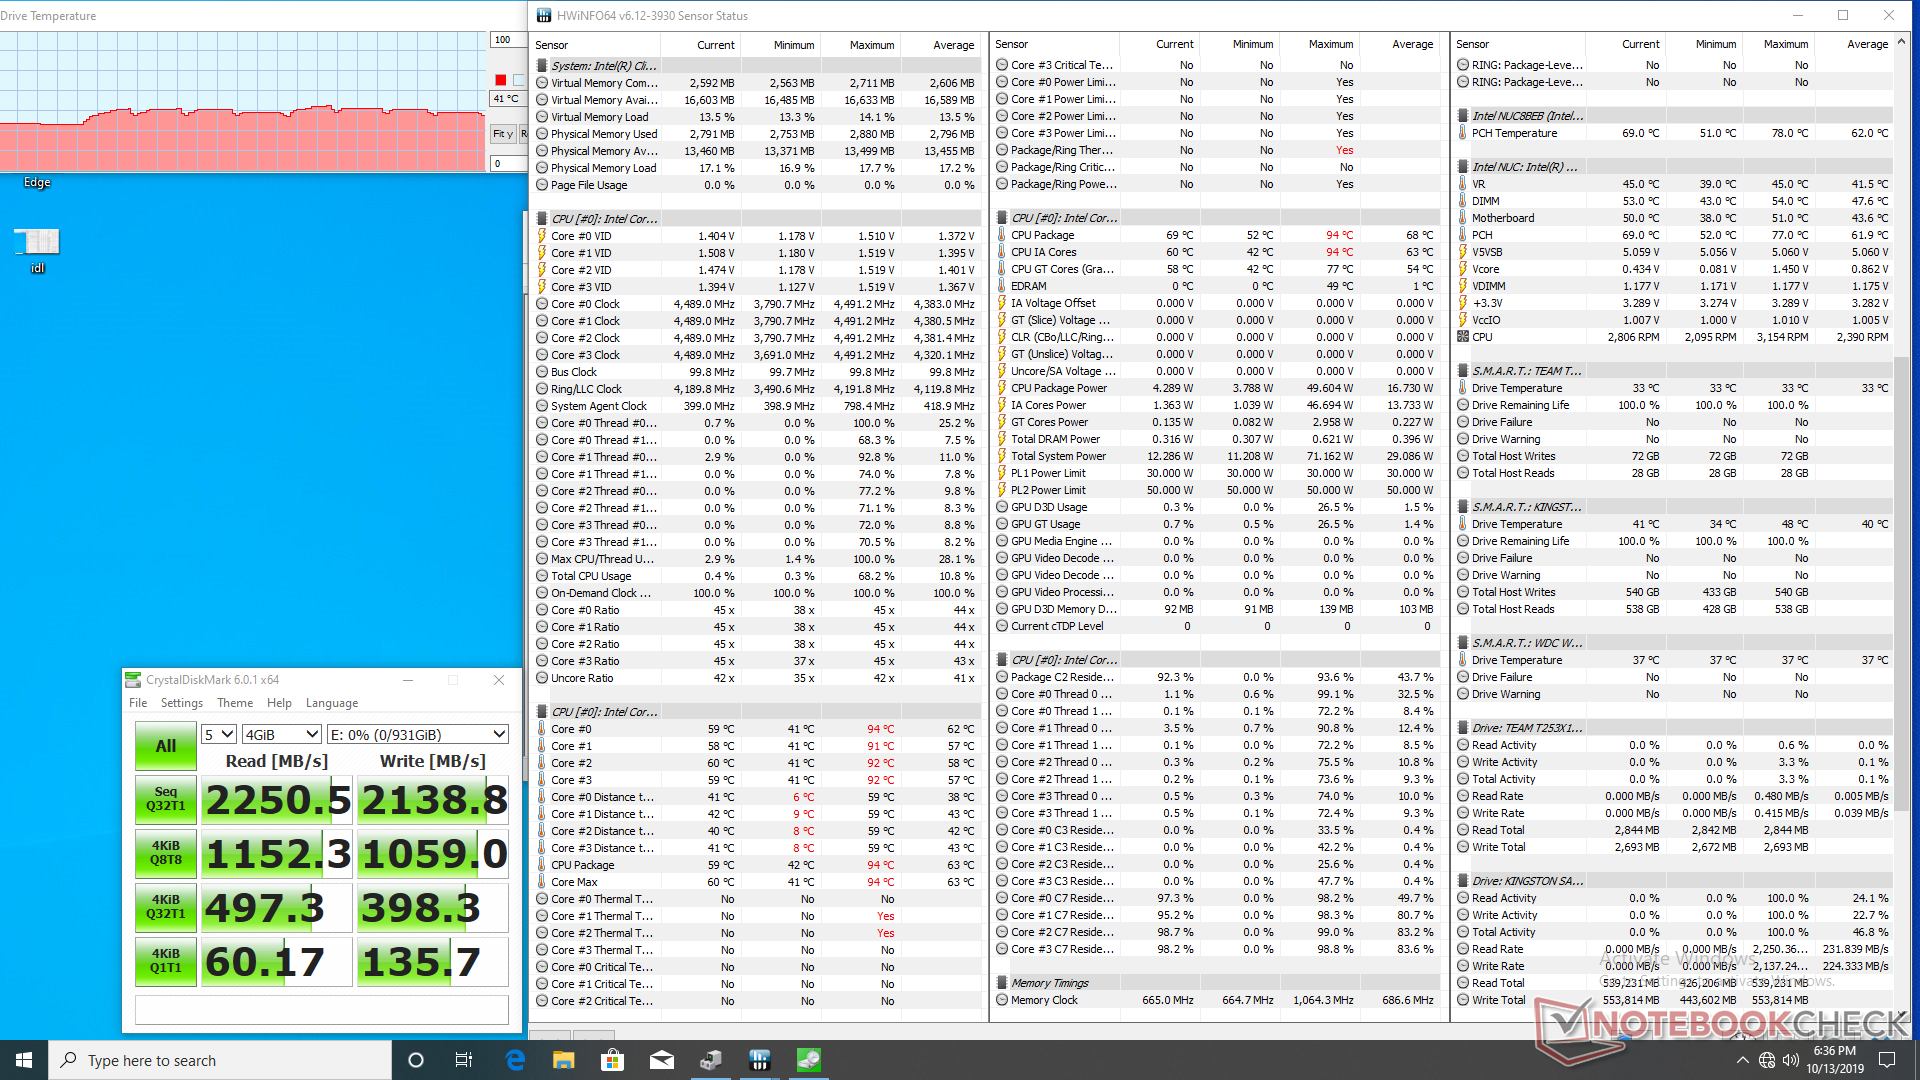
Temperature
HWiNFO reveals an idling temperature of 35 C compared to just 21 C on the Asura Genesis M.2 SSD which ships with a heat sink jacket. CrystalDiskMark stress causes SSD temperature to peak at 48 C to be warmer than what we recorded on the Asura Genesis by a few degrees. Keep in mind that the Asura is the faster drive as well.
Verdict
The popular 1 TB Samsung PM981 retails for closer to $200 USD compared to just $130 for the 1 TB Kingston A2000. If you want higher performance-per-dollar, then the Kingston A2000 will be your best bet. This is a drive that performs nearly as well as an enthusiast offering but at a more affordable price point.
Sequential read rates top out at about 2 GB/s compared to 3 GB/s on pricier drives, but the difference is actually marginal during day-to-day workloads. Super enthusiasts who do a lot of editing or gaming where very large file sizes are often involved may want to spring for something higher than the Kingston in the long run. For everyone else, this drive will do the trick and have longer legs than those cheaper SK Hynix or Toshiba BG3 alternatives.
Preisvergleich
