Notebookcheck Logo

Rockchip RK3066 1.5 GHz vs Renesas MP5232

Rockchip RK3066 1.5 GHz

► remove from comparison  RK3066

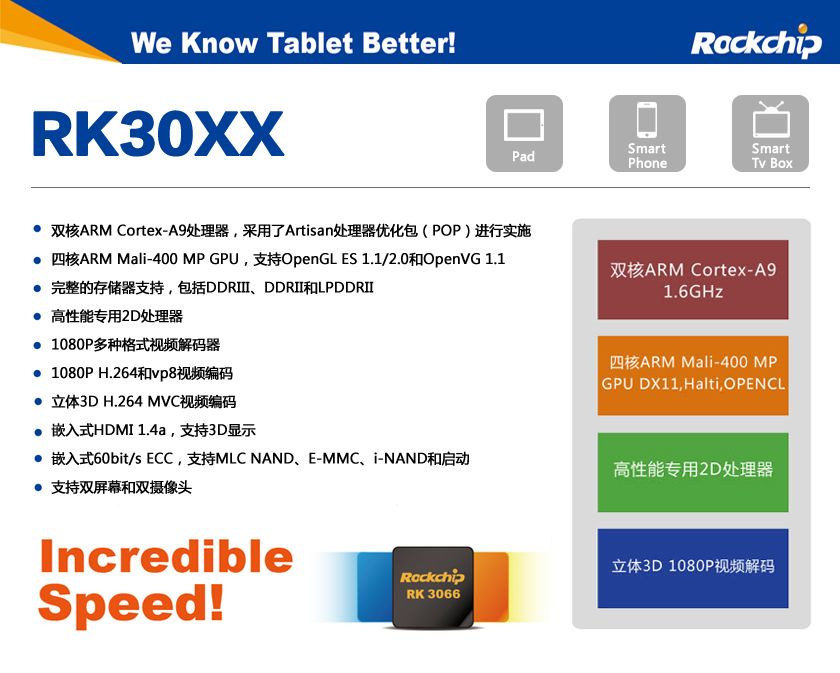
Der Rockchip RK3066 ist ein günstiger SoC für Tablets und Smartphones. Er bietet zwei ARM Cortex-A9 CPU Kerne mit NEON Erweiterungen, eine ARM Mali 400MP4 (Quad-Core mit 250 MHz getaktet) Grafikkarte und einen Video De- und Encoder. Der integrierte Speicherkontroller unterstützt maximal 2 GB DDR1-3.

Weitere Features lt Wikipedia

  • VPU (Video Processing Unit) Multi-Media Processor supporting 1080p image and video decoding
  • HDMI 1.4 Interface
  • 2-channels TFT LCD Interface with 5 layers and 3D Display (1920×1080 Maximum Display Size)
  • USB 2.0 Interface
  • SD/MMC Interface

Renesas MP5232

► remove from comparison  MP5232

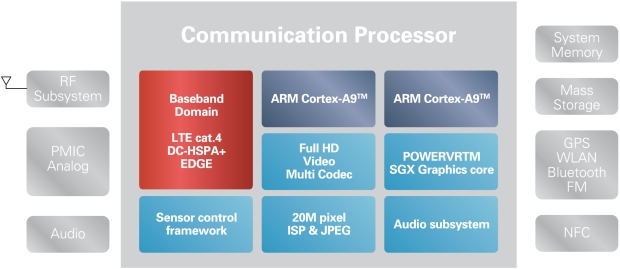
Der Renesas MP5232 ist ein günstiger Dual-Core ARM SoC mit LTE Unterstützung. Er zielt hauptsächlich auf Einstiegs-LTE-Smartphones mit Android im Bereich von 150 - 300 Euro ab. Als Prozessorpart sind zwei ARM Cortex-A9 mit bis zu 1.5 GHz integriert. Im Samsung Galaxy Core LTE SM-G386F werden diese jedoch z.B. nur mit maximal 1.2 GHz betrieben. Weiters findet man eine PowerVR SGX544 Grafikkarte und die oben erwähnten LTE Cat. 4 und 3G (DC-HSPA+, Edge) Einheiten im SoC. Auch ein integrierter 1080p Video De- und Encoder, 20 MP ISP und Audio Subsystem sind im MP5232 verbaut.

Quellen: Test Samsung Galaxy Core LTE SM-G386F, Renesas

ModelRockchip RK3066 1.5 GHzRenesas MP5232
Series
Serie: Cortex-A9
HiSilicon Kirin 9000W compare1.53 - 2.49 GHz12 / 12 cores
UNISOC Tiger T310 compare1.8 - 2 GHz4 / 4 cores
Rockchip RK3288 compare1.8 GHz4 / 4 cores
Apple A6x compare1.4 GHzcores
Apple A6 compare1 GHzcores
Apple S5 compare2 / 2 cores
HiSilicon k3v2 Hi3620 compare1.2 GHz4 / 4 cores
Rockchip RK3066 1.5 GHz « 1.5 GHz2 / 2 cores
Amlogic AML8726-MX compare1.5 GHz2 / 2 cores
Rockchip RK3168 compare1.2 GHz2 / 2 cores
Rockchip RK2918 1.2 GHz compare1.2 GHz1 / 1 cores
ARM Cortex A8 1.2 GHz compare1.2 GHz1 / 1 cores
Telechips TCC8803 1GHz compare1 GHz1 / 1 cores
Loongson 2F 900MHz compare0.9 GHz1 / 1 cores
CSR8670 compare0.08 GHzcores
ARM Cortex-M4 compare cores
HiSilicon Hi6262 compare cores
DK3.5+ST comparecores
unknown compare cores
HiSilicon Kirin 910T compare1.8 GHz4 / 4 cores Cortex-A9
Rockchip RK3188 compare1.8 GHz4 / 4 cores Cortex-A9
HiSilicon Kirin 910 compare1.6 GHz4 / 4 cores Cortex-A9
Renesas MP5232 « 1.5 GHz2 / 2 cores Cortex-A9
Broadcom BCM21664T compare1.2 GHz2 / 2 cores Cortex-A9
Marvell PXA986 compare1.2 GHz2 / 2 cores Cortex-A9
NXP i.MX 6SLL compare1 GHz1 / 1 cores Cortex-A9
WonderMedia PRIZM WM8950 compare1 GHz1 / 1 cores Cortex-A9
Clock1500 MHz1500 MHz
L2 Cache512 KB
Cores / Threads2 / 22 / 2
Technology40 nm
FeaturesMali-400 MP4, Single Channel DDR3 Memory Controller
iGPUARM Mali-400 MP4 (250 MHz)
ArchitectureARMARM
Announced
Manufacturerwww.rock-chips.comwww.renesas.com
CodenameCortex-A9

Benchmarks

3DMark - 3DMark Ice Storm Physics
min: 4687     avg: 4990     median: 5059 (4%)     max: 5161 Points
4163 Points (3%)
3DMark - 3DMark Ice Storm Extreme Physics
4890 Points (4%)
4147 Points (3%)
Geekbench 3 - Geekbench 3 32 Bit Multi-Core
100%
1 MP5232 +
654 Points (1%)
Geekbench 3 - Geekbench 3 32 Bit Single-Core
100%
1 MP5232 +
373 Points (7%)
70.2 MFLOPS (2%)
11.7 MFLOPS (1%)
Mozilla Kraken 1.1 - Kraken 1.1 Total Score *
100%
1 MP5232 +
21760 ms (25%)
Sunspider - Sunspider 1.0 Total Score *
1959 ms (21%)
1525 ms (17%)
1480 ms (14%)
Octane V2 - Octane V2 Total Score
100%
1 MP5232 +
1547 Points (1%)
Quadrant Standard Edition 2.0 - Quadrant Standard 2.0 Total Score
min: 3105     avg: 3862     median: 3974 (9%)     max: 4257 points
3959 points (9%)
AnTuTu v4 - AnTuTu v4 Total Score
100%
1 MP5232 +
12246 Points (28%)
AndEBench - AndEBench Java
100%
1 MP5232 +
209 Iter./s (6%)
AndEBench - AndEBench Native
100%
1 MP5232 +
4260 Iter./s (14%)
PassMark PerformanceTest Mobile V1 - PerformanceTest Mobile V1 CPU Tests
5852 Points (1%)
4557 Points (1%)

Average Benchmarks Rockchip RK3066 1.5 GHz → 100% n=8

Average Benchmarks Renesas MP5232 → 82% n=8

- Bereich der Benchmarkergebnisse für diese Grafikkarte
- Durchschnittliche Benchmarkergebnisse für diese Grafikkarte
* Smaller numbers mean a higher performance
1 This benchmark is not used for the average calculation

Add one or more devices and compare

In the following list you can select (and also search for) devices that should be added to the comparison. You can select more than one device.

restrict list:

show all (including archived), 2024, 2023
v1.26
log 17. 03:21:20

#0 checking url part for id 3576 +0s ... 0s

#1 checking url part for id 5844 +0s ... 0s

#2 not redirecting to Ajax server +0s ... 0s

#3 did not recreate cache, as it is less than 5 days old! Created at Thu, 16 May 2024 05:39:24 +0200 +0.001s ... 0.001s

#4 composed specs +0.099s ... 0.1s

#5 did output specs +0s ... 0.1s

#6 getting avg benchmarks for device 3576 +0.002s ... 0.103s

#7 got single benchmarks 3576 +0.021s ... 0.124s

#8 getting avg benchmarks for device 5844 +0.003s ... 0.126s

#9 got single benchmarks 5844 +0.007s ... 0.133s

#10 got avg benchmarks for devices +0s ... 0.133s

#11 min, max, avg, median took s +0.078s ... 0.211s

#12 return log +0.026s ... 0.237s

Teilen Sie diesen Artikel, um uns zu unterstützen. Jeder Link hilft!
> Notebook Test, Laptop Test und News > Benchmarks / Technik > Benchmarks / Technik > Prozessor Vergleich - Head 2 Head
Autor: Klaus Hinum,  8.09.2017 (Update:  1.07.2023)