Notebookcheck Logo

HiSilicon k3v2 Hi3620 vs NXP i.MX 6SLL

HiSilicon k3v2 Hi3620

► remove from comparison

Coretex A9 Quad-Core - max 1.5 GHz, im Huawei Mediapad 10 FHD mit 1.2 GHz

NXP i.MX 6SLL

 i.MX 6SLL

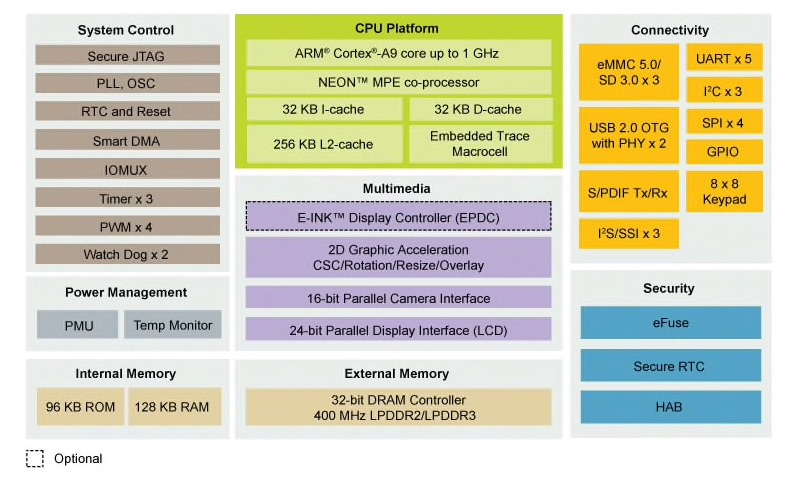
Der NXP i.MX 6SLL oder i.MX6SLL (i.MX 6 Series, MCIMX6V7DVN10AB Part Number) ist ein low-End Single-Core-Chip für e-Reader. Er integriert einen einzelnen ARM Cortex-A9 Kern mit bis zu 1 GHz Taktfrequenz und einen Grafikkarte mit 2D Beschleunigung namens Pixel Processor PXP (inkl. E-INK Display Controller EPDC mit bis zu 2332x1650 5 Bit Graustufen-Support). Der integrierte Speichercontroller kann laut NXP mit 400 MHz LPDDR2 und LPDDR3 umgehen (32 Bit Interface). Festspeicher kann durch die drei Verbindungen mit eMMC 5.0 oder SD 3.0 angebunden werden. Ausserdem können 2x USB 2.0 OTG mit PHY nach aussen geführt werden. WLAN, Bluetooth, GPS und Camera Sensoren müssen durch externe Chips angebunden werden.

Der i.MX 6SLL ist Pin-kompatibel mit dem i.MX 6SoloLite.

ModelHiSilicon k3v2 Hi3620NXP i.MX 6SLL
Series
Serie: Cortex-A9
newitem compare cores
HiSilicon Kirin 9000W compare1.53 - 2.49 GHz12 / 12 cores
UNISOC Tiger T310 compare1.8 - 2 GHz4 / 4 cores
Rockchip RK3288 compare1.8 GHz4 / 4 cores
Apple A6x compare1.4 GHzcores
Apple A6 compare1 GHzcores
Apple S5 compare2 / 2 cores
HiSilicon k3v2 Hi3620 « 1.2 GHz4 / 4 cores
Rockchip RK3066 1.5 GHz compare1.5 GHz2 / 2 cores
Amlogic AML8726-MX compare1.5 GHz2 / 2 cores
Rockchip RK3168 compare1.2 GHz2 / 2 cores
Rockchip RK2918 1.2 GHz compare1.2 GHz1 / 1 cores
ARM Cortex A8 1.2 GHz compare1.2 GHz1 / 1 cores
Telechips TCC8803 1GHz compare1 GHz1 / 1 cores
Loongson 2F 900MHz compare0.9 GHz1 / 1 cores
CSR8670 compare0.08 GHzcores
ARM Cortex-M4 compare cores
HiSilicon Hi6262 compare cores
DK3.5+ST comparecores
unknown compare cores
HiSilicon Kirin 910T compare1.8 GHz4 / 4 cores Cortex-A9
Rockchip RK3188 compare1.8 GHz4 / 4 cores Cortex-A9
HiSilicon Kirin 910 compare1.6 GHz4 / 4 cores Cortex-A9
Renesas MP5232 compare1.5 GHz2 / 2 cores Cortex-A9
Broadcom BCM21664T compare1.2 GHz2 / 2 cores Cortex-A9
Marvell PXA986 compare1.2 GHz2 / 2 cores Cortex-A9
NXP i.MX 6SLL « 1 GHz1 / 1 cores Cortex-A9
WonderMedia PRIZM WM8950 compare1 GHz1 / 1 cores Cortex-A9
Clock1200 MHz1000 MHz
Cores / Threads4 / 41 / 1
Technology40 nm40 nm
FeaturesARMv732-Bit DRAM Controller 400 MHz LPDDR2/LPDDR3, E-INK Display Controller, 2D Graphics Acceleration, eMMC 5.0, USB 2.0 OTG
ArchitectureARMARM
Announced
CodenameCortex-A9
L1 Cache64 KB
L2 Cache256 KB
iGPUNXP PXP
Manufacturerwww.nxp.com

Benchmarks

3DMark - 3DMark Ice Storm Physics
min: 3209     avg: 4477     median: 4894 (4%)     max: 5167 Points
3DMark - 3DMark Ice Storm Extreme Physics
min: 5354     avg: 5357     median: 5357 (4%)     max: 5360 Points
Geekbench 3 - Geekbench 3 32 Bit Multi-Core
1094 Points (2%)
Geekbench 3 - Geekbench 3 32 Bit Single-Core
327 Points (6%)
Geekbench 2 - 32 Bit - Geekbench Stream
min: 439     avg: 489.9     median: 500 (4%)     max: 547 Points
Geekbench 2 - 32 Bit - Geekbench Memory
min: 940     avg: 1187     median: 1218 (11%)     max: 1290 Points
Geekbench 2 - 32 Bit - Geekbench Floating Point
min: 1793     avg: 2360     median: 2351 (5%)     max: 2731 Points
Geekbench 2 - 32 Bit - Geekbench Integer
min: 1000     avg: 1317     median: 1275 (3%)     max: 1591 Points
Geekbench 2 - 32 Bit - Geekbench Total Score
min: 1209     avg: 1573     median: 1557 (4%)     max: 1819 Points
Linpack Android / IOS - Linpack Multi Thread
min: 92.3     avg: 133.3     median: 138.1 (5%)     max: 151.8 MFLOPS
Linpack Android / IOS - Linpack Single Thread
min: 37.8     avg: 44.2     median: 46.6 (5%)     max: 48.71 MFLOPS
Mozilla Kraken 1.1 - Kraken 1.1 Total Score *
26477 ms (31%)
Sunspider - Sunspider 1.0 Total Score *
min: 856     avg: 2197     median: 1610 (18%)     max: 4026 ms
6771 ms (74%)
Sunspider - Sunspider 0.9.1 Total Score *
min: 1522     avg: 1643     median: 1540 (15%)     max: 2080 ms
Quadrant Standard Edition 2.0 - Quadrant Standard 2.0 Total Score
min: 4404     avg: 4736     median: 4736 (11%)     max: 5068 points
AnTuTu v3 - AnTuTu v3 CPU
min: 4820     avg: 5667     median: 5662 (37%)     max: 6713 Points
AnTuTu v4 - AnTuTu v4 Total Score
14434 Points (34%)
AndEBench - AndEBench Java
min: 92     avg: 191     median: 191 (6%)     max: 290 Iter./s
AndEBench - AndEBench Native
min: 8740     avg: 8897     median: 8897 (29%)     max: 9054 Iter./s
PassMark PerformanceTest Mobile V1 - PerformanceTest Mobile V1 CPU Tests
min: 8223     avg: 8737     median: 8678 (1%)     max: 9118 Points

Average Benchmarks HiSilicon k3v2 Hi3620 → 100% n=1

Average Benchmarks NXP i.MX 6SLL → 31% n=1

- Bereich der Benchmarkergebnisse für diese Grafikkarte
- Durchschnittliche Benchmarkergebnisse für diese Grafikkarte
* Smaller numbers mean a higher performance
1 This benchmark is not used for the average calculation

Add one or more devices and compare

In the following list you can select (and also search for) devices that should be added to the comparison. You can select more than one device.

restrict list:

show all (including archived), 2024, 2023
v1.26
log 27. 19:08:56

#0 checking url part for id 3613 +0s ... 0s

#1 checking url part for id 11524 +0s ... 0s

#2 not redirecting to Ajax server +0s ... 0s

#3 did not recreate cache, as it is less than 5 days old! Created at Sat, 25 May 2024 05:38:31 +0200 +0.001s ... 0.001s

#4 composed specs +0.066s ... 0.067s

#5 did output specs +0s ... 0.067s

#6 getting avg benchmarks for device 3613 +0.002s ... 0.069s

#7 got single benchmarks 3613 +0.014s ... 0.083s

#8 getting avg benchmarks for device 11524 +0.002s ... 0.085s

#9 got single benchmarks 11524 +0.005s ... 0.091s

#10 got avg benchmarks for devices +0s ... 0.091s

#11 min, max, avg, median took s +0.045s ... 0.136s

#12 return log +0.021s ... 0.157s

Teilen Sie diesen Artikel, um uns zu unterstützen. Jeder Link hilft!
> Notebook Test, Laptop Test und News > Benchmarks / Technik > Benchmarks / Technik > Prozessor Vergleich - Head 2 Head
Autor: Klaus Hinum,  8.09.2017 (Update:  1.07.2023)