Notebookcheck Logo

Telechips TCC8803 1GHz vs Marvell PXA986 vs HiSilicon Kirin 910T

Telechips TCC8803 1GHz

► remove from comparison  TCC8803 1GHz

ARM Mali 2D/3D graphics accelerator, DDR / DDR2 / LP-DDR2 / LP-DDR2 memory interface, LVDS Transmitter, HDMI 1.4, Composite TV-Out (NTSC / PAL), USB 2.0 HS OTG, USB 2.0 host, USB 1.1 HOST, EHI (External Host Interface), UART, NAND Flash Interface

Telechips' TCC88xx application processor will redefine the mobile device of tomorrow with new' innovative user experience by PC-like web browsing, 1080p full HD video record & playback, intuitive user interfaces, location based services and next generation social networking applications. TCC88xx supports development of planned features for the Tablet PC and HMP of tomorrow with tremendous performance and programmability to support new applications yet to be imagined. TCC88xx is equipped with hardwired VPU/GPU/ISP to maximize multimedia experience at its peak level.


Marvell PXA986

► remove from comparison Marvell Technology Group PXA986

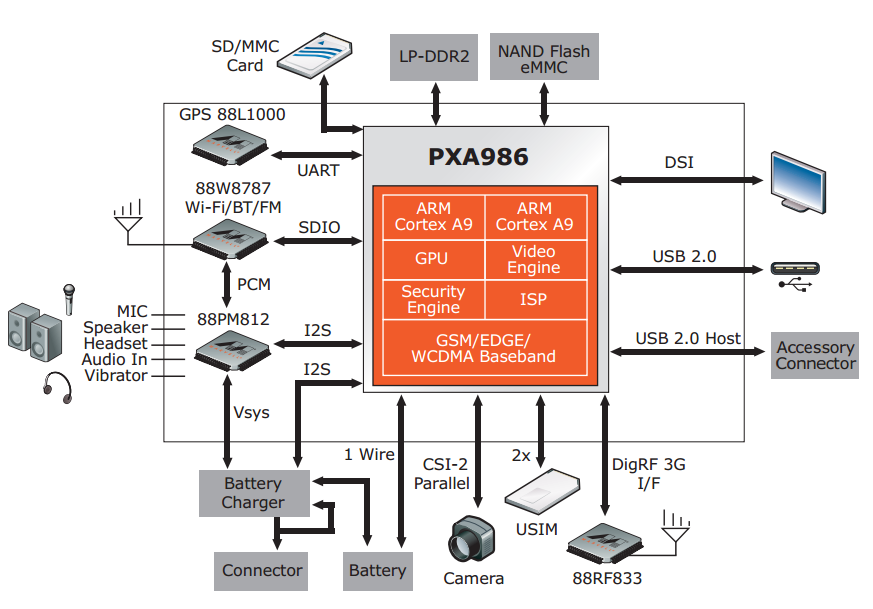
Der Marvell PXA986 ist ein ARM basierter Dual-Core SoC für Smartphones und Tablets. Er bietet zwei Cortex-A9 Kerne mit meist 1.2 GHz Takt, eine Vivante GC1000 Grafikkarte, einen Video-Prozessor für 720p30 Wiedergabe von H.263, H.264 BP und MPEG4- SP und ein WCDMA+HSDPA Modem.

HiSilicon Kirin 910T

► remove from comparison

Der HiSilicon Kirin 910T ist ein ARM-basierter Quad-Core-SoC für (Android-)Smartphones und Tablets, der im ersten Halbjahr 2014 zusammen mit dem Huawei Ascend P7 vorgestellt wurde. Neben vier Cortex-A9-Kernen (max. 1,8 GHz) integriert der Chip auch eine Mali-450 MP4 Grafikeinheit, einen Single-Channel LPDDR3-1600-Speichercontroller sowie ein LTE Cat. 4 Modem.

Die CPU-Performance ordnet sich dank der hochtaktenden Cortex-A9-Kerne im oberen Mittelfeld ein, sodass der 910T in etwa mit einem Qualcomm Snapdragon 600 (1,7 - 1,9 GHz Krait) vergleichbar ist. Dies genügt, um Browsing und andere typische Android-Anwendungen zügig zu bewältigen.

Die mit 533 MHz taktende Mali-450 MP4 sorgt für eine ansprechende Grafikleistung auf dem Niveau der Qualcomm Adreno 320. Damit werden auch anspruchsvolle Android-Spiele in hoher Auflösung zumeist flüssig dargestellt.

Trotz Fertigung in einem aktuellen 28-Nanometer-Prozess (TSMC HPM) dürfte die Leistungsaufnahme des Kirin 910T durchschnittlich bis hoch ausfallen, was auf die vergleichsweise hohen Taktraten zurückzuführen ist. Demzufolge kann der SoC in mittelgroßen Smartphones, aber auch Tablets eingesetzt werden.

ModelTelechips TCC8803 1GHzMarvell PXA986HiSilicon Kirin 910T
Series Marvell Technology Group
Serie: Cortex-A9
newitem cores
HiSilicon Kirin 9000W1.53 - 2.49 GHz12 / 12 cores
UNISOC Tiger T3101.8 - 2 GHz4 / 4 cores
Rockchip RK32881.8 GHz4 / 4 cores
Apple A6x1.4 GHzcores
Apple A61 GHzcores
Apple S52 / 2 cores
HiSilicon k3v2 Hi36201.2 GHz4 / 4 cores
Rockchip RK3066 1.5 GHz1.5 GHz2 / 2 cores
Amlogic AML8726-MX1.5 GHz2 / 2 cores
Rockchip RK31681.2 GHz2 / 2 cores
Rockchip RK2918 1.2 GHz1.2 GHz1 / 1 cores
ARM Cortex A8 1.2 GHz1.2 GHz1 / 1 cores
Telechips TCC8803 1GHz « 1 GHz1 / 1 cores
Loongson 2F 900MHz0.9 GHz1 / 1 cores
CSR86700.08 GHzcores
ARM Cortex-M4 cores
HiSilicon Hi6262 cores
DK3.5+STcores
unknown cores
HiSilicon Kirin 910T1.8 GHz4 / 4 cores Cortex-A9
Rockchip RK31881.8 GHz4 / 4 cores Cortex-A9
HiSilicon Kirin 9101.6 GHz4 / 4 cores Cortex-A9
Renesas MP52321.5 GHz2 / 2 cores Cortex-A9
Broadcom BCM21664T1.2 GHz2 / 2 cores Cortex-A9
Marvell PXA986 « 1.2 GHz2 / 2 cores Cortex-A9
NXP i.MX 6SLL1 GHz1 / 1 cores Cortex-A9
WonderMedia PRIZM WM89501 GHz1 / 1 cores Cortex-A9
HiSilicon Kirin 910T « 1.8 GHz4 / 4 cores Cortex-A9
Rockchip RK31881.8 GHz4 / 4 cores Cortex-A9
HiSilicon Kirin 9101.6 GHz4 / 4 cores Cortex-A9
Renesas MP52321.5 GHz2 / 2 cores Cortex-A9
Broadcom BCM21664T1.2 GHz2 / 2 cores Cortex-A9
Marvell PXA9861.2 GHz2 / 2 cores Cortex-A9
NXP i.MX 6SLL1 GHz1 / 1 cores Cortex-A9
WonderMedia PRIZM WM89501 GHz1 / 1 cores Cortex-A9
Clock1000 MHz1200 MHz1800 MHz
Cores / Threads1 / 12 / 24 / 4
Technology65 nm45 nm28 nm
ArchitectureARMARMARM
Announced
CodenameCortex-A9Cortex-A9
Manufacturerwww.marvell.com
FeaturesARMv7, Mali-450 MP4 (533 MHz), LTE (Cat. 4), Single-Channel LPDDR3-1600 (6.4 GB/s)

Benchmarks

3DMark - 3DMark Ice Storm Physics
100%
1 PXA986 +
min: 2623     avg: 2874     median: 2740 (2%)     max: 3258 Points
11572 Points (9%)
3DMark - 3DMark Ice Storm Extreme Physics
100%
1 PXA986 +
min: 2709     avg: 2985     median: 2985 (2%)     max: 3261 Points
11485 Points (9%)
3DMark - 3DMark Ice Storm Unlimited Physics
100%
1 PXA986 +
3675 Points (3%)
13330 Points (11%)
Geekbench 3 - Geekbench 3 32 Bit Multi-Core
100%
1 PXA986 +
min: 631     avg: 647     median: 646.5 (1%)     max: 662 Points
1796 Points (3%)
Geekbench 3 - Geekbench 3 32 Bit Single-Core
100%
1 PXA986 +
min: 376     avg: 379.5     median: 379.5 (7%)     max: 383 Points
599 Points (12%)
Geekbench 2 - 32 Bit - Geekbench Stream
100%
1 PXA986 +
min: 437     avg: 439.5     median: 439.5 (4%)     max: 442 Points
Geekbench 2 - 32 Bit - Geekbench Memory
100%
1 PXA986 +
min: 1337     avg: 1448     median: 1448 (13%)     max: 1559 Points
Geekbench 2 - 32 Bit - Geekbench Floating Point
100%
1 PXA986 +
min: 1275     avg: 1284     median: 1284 (3%)     max: 1293 Points
Geekbench 2 - 32 Bit - Geekbench Integer
100%
1 PXA986 +
min: 709     avg: 720     median: 720 (1%)     max: 731 Points
Geekbench 2 - 32 Bit - Geekbench Total Score
100%
1 PXA986 +
min: 1005     avg: 1035     median: 1034.5 (3%)     max: 1064 Points
Linpack Android / IOS - Linpack Single Thread
13.4 MFLOPS (1%)
min: 39.83     avg: 41.6     median: 41.4 (4%)     max: 43.69 MFLOPS
83.2 MFLOPS (8%)
Linpack Android / IOS - Linpack Multi Thread
100%
1 PXA986 +
min: 73.7     avg: 74.3     median: 74 (3%)     max: 75.3 MFLOPS
254 MFLOPS (9%)
Mozilla Kraken 1.1 - Kraken 1.1 Total Score *
100%
1 PXA986 +
min: 23941     avg: 25315     median: 25315 (30%)     max: 26689 ms
16135 ms (19%)
Sunspider - Sunspider 1.0 Total Score *
100%
1 PXA986 +
min: 1428     avg: 1608     median: 1624 (18%)     max: 1771 ms
1043 ms (11%)
Sunspider - Sunspider 0.9.1 Total Score *
100%
1 PXA986 +
min: 1453     avg: 1531     median: 1530.5 (15%)     max: 1608 ms
Octane V2 - Octane V2 Total Score
100%
1 PXA986 +
1448 Points (1%)
2775 Points (2%)
Quadrant Standard Edition 2.0 - Quadrant Standard 2.0 Total Score
100%
1 PXA986 +
min: 3257     avg: 3515     median: 3514.5 (8%)     max: 3772 points
7189 points (17%)
AnTuTu v3 - AnTuTu v3 CPU
100%
1 PXA986 +
2945 Points (19%)
AnTuTu v4 - AnTuTu v4 Total Score
100%
1 PXA986 +
min: 11051     avg: 11392     median: 11392 (26%)     max: 11733 Points
23864 Points (56%)
AndEBench - AndEBench Java
100%
1 PXA986 +
min: 137     avg: 160     median: 159 (5%)     max: 184 Iter./s
584 Iter./s (18%)
AndEBench - AndEBench Native
100%
1 PXA986 +
min: 4077     avg: 4208     median: 4266 (14%)     max: 4281 Iter./s
13307 Iter./s (44%)
PassMark PerformanceTest Mobile V1 - PerformanceTest Mobile V1 CPU Tests
100%
1 PXA986 +
min: 3273     avg: 3820     median: 3976 (1%)     max: 4210 Points
12178 Points (2%)

Average Benchmarks Telechips TCC8803 1GHz → 100% n=1

Average Benchmarks Marvell PXA986 → 310% n=1

Average Benchmarks HiSilicon Kirin 910T → 622% n=1

- Bereich der Benchmarkergebnisse für diese Grafikkarte
- Durchschnittliche Benchmarkergebnisse für diese Grafikkarte
* Smaller numbers mean a higher performance
1 This benchmark is not used for the average calculation

v1.26
log 02. 04:26:27

#0 checking url part for id 3327 +0s ... 0s

#1 checking url part for id 4461 +0s ... 0s

#2 checking url part for id 6191 +0s ... 0s

#3 not redirecting to Ajax server +0s ... 0s

#4 did not recreate cache, as it is less than 5 days old! Created at Sat, 01 Jun 2024 05:37:57 +0200 +0.001s ... 0.001s

#5 composed specs +0.223s ... 0.225s

#6 did output specs +0s ... 0.225s

#7 getting avg benchmarks for device 3327 +0.003s ... 0.228s

#8 got single benchmarks 3327 +0.008s ... 0.236s

#9 getting avg benchmarks for device 4461 +0.003s ... 0.239s

#10 got single benchmarks 4461 +0.011s ... 0.25s

#11 getting avg benchmarks for device 6191 +0.003s ... 0.254s

#12 got single benchmarks 6191 +0.008s ... 0.262s

#13 got avg benchmarks for devices +0s ... 0.262s

#14 min, max, avg, median took s +0.117s ... 0.379s

#15 return log +0s ... 0.379s

Teilen Sie diesen Artikel, um uns zu unterstützen. Jeder Link hilft!
> Notebook Test, Laptop Test und News > Benchmarks / Technik > Benchmarks / Technik > Prozessor Vergleich - Head 2 Head
Autor: Klaus Hinum,  8.09.2017 (Update:  1.07.2023)