Notebookcheck Logo

HiSilicon k3v2 Hi3620 vs Marvell PXA986 vs UNISOC Tiger T310

HiSilicon k3v2 Hi3620

► remove from comparison

Coretex A9 Quad-Core - max 1.5 GHz, im Huawei Mediapad 10 FHD mit 1.2 GHz

Marvell PXA986

► remove from comparison Marvell Technology Group PXA986

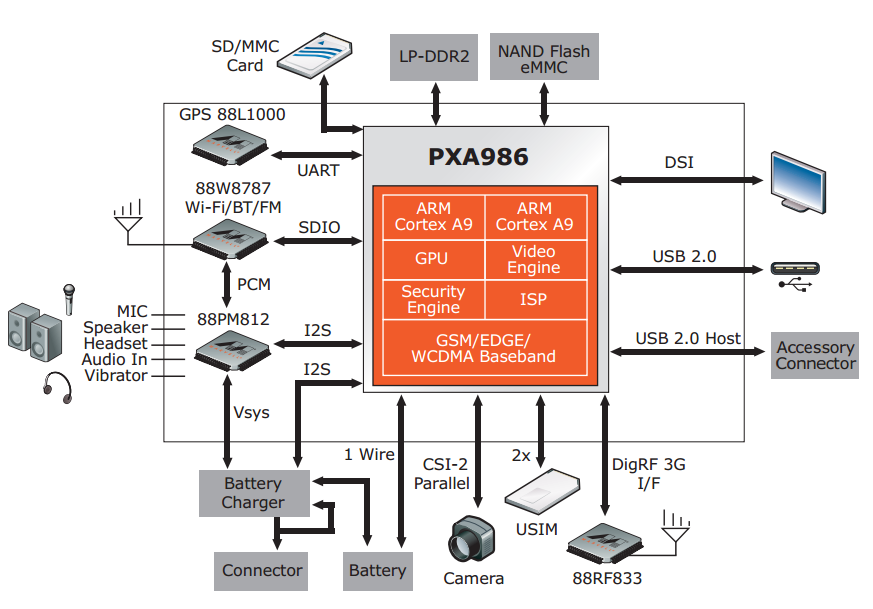
Der Marvell PXA986 ist ein ARM basierter Dual-Core SoC für Smartphones und Tablets. Er bietet zwei Cortex-A9 Kerne mit meist 1.2 GHz Takt, eine Vivante GC1000 Grafikkarte, einen Video-Prozessor für 720p30 Wiedergabe von H.263, H.264 BP und MPEG4- SP und ein WCDMA+HSDPA Modem.

UNISOC Tiger T310

► remove from comparison  T310

Der Unisoc Tiger T310 ist ein Prozessor der Einstiegsklasse mit einem schnellen ARM Cortex-A75-Kern und bis zu 2 GHz Taktrate. Die zusätzlichen 3 Cortex-A55-Stromsparkerne takten mit bis zu 1,8 GHz. 

Das SoC integriert ein LTE Modem (TDD-LTE, FDD-LTE, TDSCDMA, WCDMA, CDMA, GSM) und unterstützt maximal zwei Kameras mit 16 und 8 Megapixel, sowie die Full-HD-Videoaufzeichnung mit maximal 30 fps.

Der Speicherkontroller kann mit LPDDR4x zusammenarbeiten, liefert dabei allerdings maximal eine Taktrate von 1333 MHz. Als Massenspeicher wird eMMC 5.1 unterstützt.

Die integrierte PowerVR GE8300 Grafikkarte bietet eine Taktrate von maximal 800 MHz und steuert den Bildschirm mit bis zu 1.600 x 720 Pixel Auflösung an.

Das SoC wird bei TSMC im 12nm FinFet Prozess hergestellt. 

ModelHiSilicon k3v2 Hi3620Marvell PXA986UNISOC Tiger T310
Series Marvell Technology Group
Serie:
newitem cores
HiSilicon Kirin 9000W1.53 - 2.49 GHz12 / 12 cores
UNISOC Tiger T3101.8 - 2 GHz4 / 4 cores
Rockchip RK32881.8 GHz4 / 4 cores
Apple A6x1.4 GHzcores
Apple A61 GHzcores
Apple S52 / 2 cores
HiSilicon k3v2 Hi3620 « 1.2 GHz4 / 4 cores
Rockchip RK3066 1.5 GHz1.5 GHz2 / 2 cores
Amlogic AML8726-MX1.5 GHz2 / 2 cores
Rockchip RK31681.2 GHz2 / 2 cores
Rockchip RK2918 1.2 GHz1.2 GHz1 / 1 cores
ARM Cortex A8 1.2 GHz1.2 GHz1 / 1 cores
Telechips TCC8803 1GHz1 GHz1 / 1 cores
Loongson 2F 900MHz0.9 GHz1 / 1 cores
CSR86700.08 GHzcores
ARM Cortex-M4 cores
HiSilicon Hi6262 cores
DK3.5+STcores
unknown cores
HiSilicon Kirin 910T1.8 GHz4 / 4 cores Cortex-A9
Rockchip RK31881.8 GHz4 / 4 cores Cortex-A9
HiSilicon Kirin 9101.6 GHz4 / 4 cores Cortex-A9
Renesas MP52321.5 GHz2 / 2 cores Cortex-A9
Broadcom BCM21664T1.2 GHz2 / 2 cores Cortex-A9
Marvell PXA986 « 1.2 GHz2 / 2 cores Cortex-A9
NXP i.MX 6SLL1 GHz1 / 1 cores Cortex-A9
WonderMedia PRIZM WM89501 GHz1 / 1 cores Cortex-A9
newitem cores
HiSilicon Kirin 9000W1.53 - 2.49 GHz12 / 12 cores
UNISOC Tiger T310 « 1.8 - 2 GHz4 / 4 cores
Rockchip RK32881.8 GHz4 / 4 cores
Apple A6x1.4 GHzcores
Apple A61 GHzcores
Apple S52 / 2 cores
HiSilicon k3v2 Hi36201.2 GHz4 / 4 cores
Rockchip RK3066 1.5 GHz1.5 GHz2 / 2 cores
Amlogic AML8726-MX1.5 GHz2 / 2 cores
Rockchip RK31681.2 GHz2 / 2 cores
Rockchip RK2918 1.2 GHz1.2 GHz1 / 1 cores
ARM Cortex A8 1.2 GHz1.2 GHz1 / 1 cores
Telechips TCC8803 1GHz1 GHz1 / 1 cores
Loongson 2F 900MHz0.9 GHz1 / 1 cores
CSR86700.08 GHzcores
ARM Cortex-M4 cores
HiSilicon Hi6262 cores
DK3.5+STcores
unknown cores
Clock1200 MHz1200 MHz1800 - 2000 MHz
Cores / Threads4 / 42 / 24 / 4
Technology40 nm45 nm12 nm
FeaturesARMv7LTE Cat.7, BT 5.0, WiFi ac, GNSS, eMMC 5.1, LPDDR3 933, LPDDR4x 1333 MHz
ArchitectureARMARMARM
Announced
CodenameCortex-A9
Manufacturerwww.marvell.comwww.unisoc.com
iGPUPowerVR GE8300 ( - 800 MHz)

Benchmarks

3DMark - 3DMark Ice Storm Physics
min: 3209     avg: 4477     median: 4894 (4%)     max: 5167 Points
56%
1 PXA986 +
min: 2623     avg: 2874     median: 2740 (2%)     max: 3258 Points
3DMark - 3DMark Ice Storm Extreme Physics
min: 5354     avg: 5357     median: 5357 (4%)     max: 5360 Points
56%
1 PXA986 +
min: 2709     avg: 2985     median: 2985 (2%)     max: 3261 Points
3DMark - 3DMark Ice Storm Unlimited Physics
100%
1 PXA986 +
3675 Points (3%)
3DMark - 3DMark Sling Shot Extreme (ES 3.1) Unlimited Physics
100%
1 T310 +
1588 Points (19%)
3DMark - 3DMark Sling Shot (ES 3.0) Unlimited Physics
100%
1 T310 +
1590 Points (18%)
Geekbench 5.5 - Geekbench 5.1 - 5.4 64 Bit Single-Core
100%
1 T310 +
376 Points (16%)
Geekbench 5.5 - Geekbench 5.1 - 5.4 64 Bit Multi-Core
100%
1 T310 +
756 Points (1%)
Geekbench 4.4 - Geekbench 4.1 - 4.4 64 Bit Single-Core
100%
1 T310 +
1687 Points (17%)
Geekbench 4.4 - Geekbench 4.1 - 4.4 64 Bit Multi-Core
100%
1 T310 +
2969 Points (3%)
Geekbench 3 - Geekbench 3 32 Bit Multi-Core
1094 Points (2%)
59%
1 PXA986 +
min: 631     avg: 647     median: 646.5 (1%)     max: 662 Points
Geekbench 3 - Geekbench 3 32 Bit Single-Core
327 Points (6%)
116%
1 PXA986 +
min: 376     avg: 379.5     median: 379.5 (7%)     max: 383 Points
Geekbench 3 - Geekbench 3 64 Bit Multi-Core
100%
1 T310 +
2987 Points (5%)
Geekbench 3 - Geekbench 3 64 Bit Single-Core
100%
1 T310 +
1656 Points (25%)
Geekbench 2 - 32 Bit - Geekbench Stream
min: 439     avg: 489.9     median: 500 (4%)     max: 547 Points
88%
1 PXA986 +
min: 437     avg: 439.5     median: 439.5 (4%)     max: 442 Points
Geekbench 2 - 32 Bit - Geekbench Memory
min: 940     avg: 1187     median: 1218 (11%)     max: 1290 Points
119%
1 PXA986 +
min: 1337     avg: 1448     median: 1448 (13%)     max: 1559 Points
Geekbench 2 - 32 Bit - Geekbench Floating Point
min: 1793     avg: 2360     median: 2351 (5%)     max: 2731 Points
55%
1 PXA986 +
min: 1275     avg: 1284     median: 1284 (3%)     max: 1293 Points
Geekbench 2 - 32 Bit - Geekbench Integer
min: 1000     avg: 1317     median: 1275 (3%)     max: 1591 Points
56%
1 PXA986 +
min: 709     avg: 720     median: 720 (1%)     max: 731 Points
Geekbench 2 - 32 Bit - Geekbench Total Score
min: 1209     avg: 1573     median: 1557 (4%)     max: 1819 Points
66%
1 PXA986 +
min: 1005     avg: 1035     median: 1034.5 (3%)     max: 1064 Points
Linpack Android / IOS - Linpack Multi Thread
min: 92.3     avg: 133.3     median: 138.1 (5%)     max: 151.8 MFLOPS
54%
1 PXA986 +
min: 73.7     avg: 74.3     median: 74 (3%)     max: 75.3 MFLOPS
Linpack Android / IOS - Linpack Single Thread
min: 37.8     avg: 44.2     median: 46.6 (5%)     max: 48.71 MFLOPS
89%
1 PXA986 +
min: 39.83     avg: 41.6     median: 41.4 (4%)     max: 43.69 MFLOPS
Mozilla Kraken 1.1 - Kraken 1.1 Total Score *
26477 ms (31%)
min: 23941     avg: 25315     median: 25315 (30%)     max: 26689 ms
139%
T310 +
3239 ms (4%)
Sunspider - Sunspider 1.0 Total Score *
min: 856     avg: 2197     median: 1610 (18%)     max: 4026 ms
100%
1 PXA986 +
min: 1428     avg: 1608     median: 1624 (18%)     max: 1771 ms
Sunspider - Sunspider 0.9.1 Total Score *
min: 1522     avg: 1643     median: 1540 (15%)     max: 2080 ms
100%
1 PXA986 +
min: 1453     avg: 1531     median: 1530.5 (15%)     max: 1608 ms
Octane V2 - Octane V2 Total Score
100%
1 PXA986 +
1448 Points (1%)
828%
1 T310 +
11986 Points (11%)
WebXPRT 4 - WebXPRT 4 Score
100%
1 T310 +
45 Points (13%)
WebXPRT 3 - WebXPRT 3 Score
100%
1 T310 +
63 Points (13%)
Quadrant Standard Edition 2.0 - Quadrant Standard 2.0 Total Score
min: 4404     avg: 4736     median: 4736 (11%)     max: 5068 points
74%
1 PXA986 +
min: 3257     avg: 3515     median: 3514.5 (8%)     max: 3772 points
AnTuTu v3 - AnTuTu v3 CPU
min: 4820     avg: 5667     median: 5662 (37%)     max: 6713 Points
52%
1 PXA986 +
2945 Points (19%)
AnTuTu v4 - AnTuTu v4 Total Score
14434 Points (34%)
79%
1 PXA986 +
min: 11051     avg: 11392     median: 11392 (26%)     max: 11733 Points
Antutu v9 - AnTuTu v9 Total Score
100%
1 T310 +
162595 Points (10%)
Antutu v9 - AnTuTu v9 CPU
100%
1 T310 +
57138 Points (16%)
AndEBench - AndEBench Java
min: 92     avg: 191     median: 191 (6%)     max: 290 Iter./s
83%
1 PXA986 +
min: 137     avg: 160     median: 159 (5%)     max: 184 Iter./s
AndEBench - AndEBench Native
min: 8740     avg: 8897     median: 8897 (29%)     max: 9054 Iter./s
48%
1 PXA986 +
min: 4077     avg: 4208     median: 4266 (14%)     max: 4281 Iter./s
PassMark PerformanceTest Mobile V1 - PerformanceTest Mobile V1 CPU Tests
min: 8223     avg: 8737     median: 8678 (1%)     max: 9118 Points
min: 3273     avg: 3820     median: 3976 (1%)     max: 4210 Points
1653 Points (0%)
PCMark for Android - PCM f. Android Storage 2.0 score
100%
1 T310 +
9900 Points (16%)
PCMark for Android - PCM f. Android Work Score 3.0
100%
1 T310 +
6866 Points (32%)
Power Consumption - Geekbench 5.5 Power Consumption 150cd *
100%
1 T310 +
3.7 Watt (2%)
Power Consumption - Idle Power Consumption 150cd 1min *
100%
1 T310 +
1.6 Watt (2%)

Average Benchmarks HiSilicon k3v2 Hi3620 → 100% n=2

Average Benchmarks Marvell PXA986 → 74% n=2

Average Benchmarks UNISOC Tiger T310 → 79% n=2

- Bereich der Benchmarkergebnisse für diese Grafikkarte
- Durchschnittliche Benchmarkergebnisse für diese Grafikkarte
* Smaller numbers mean a higher performance
1 This benchmark is not used for the average calculation

v1.26
log 02. 16:11:17

#0 checking url part for id 3613 +0s ... 0s

#1 checking url part for id 4461 +0s ... 0s

#2 checking url part for id 14530 +0s ... 0s

#3 not redirecting to Ajax server +0s ... 0s

#4 did not recreate cache, as it is less than 5 days old! Created at Sat, 01 Jun 2024 05:37:57 +0200 +0.001s ... 0.001s

#5 composed specs +0.127s ... 0.128s

#6 did output specs +0s ... 0.128s

#7 getting avg benchmarks for device 3613 +0.003s ... 0.131s

#8 got single benchmarks 3613 +0.016s ... 0.147s

#9 getting avg benchmarks for device 4461 +0.003s ... 0.15s

#10 got single benchmarks 4461 +0.013s ... 0.163s

#11 getting avg benchmarks for device 14530 +0.003s ... 0.165s

#12 got single benchmarks 14530 +0.008s ... 0.174s

#13 got avg benchmarks for devices +0s ... 0.174s

#14 min, max, avg, median took s +0.158s ... 0.332s

#15 return log +0s ... 0.332s

Teilen Sie diesen Artikel, um uns zu unterstützen. Jeder Link hilft!
> Notebook Test, Laptop Test und News > Benchmarks / Technik > Benchmarks / Technik > Prozessor Vergleich - Head 2 Head
Autor: Klaus Hinum,  8.09.2017 (Update:  1.07.2023)