Notebookcheck Logo

Apple A6 vs Mediatek MT8766B

Apple A6

► remove from comparison

Der Apple A6 ist ein Zwei-Kern-SoC (System-on-a-Chip), mit ARM-kompatiblen Rechenkernen. Beim A6 handelt se sich erstmals um eine Eigenentwicklung von Apple, dessen Kerne sowohl den ARMv7-Befehlssatz als auch die erweiterte Version ARMv7s. Teil der v7s-Spezifikation ist die VFPv4-Erweiterung (Vector-Floating-Point), die im Apple A6 mit einem 16-Bit-Register arbeitet. Die Strukturbreite beträgt 32 Nanometer. Die Taktfrequenz ist lastabhängig gesteuert und liegt zwischen 800 und 1200 MHz. Der Cache beträgt laut Geekbench 2 jeweils 32 KB für Level-1 und Level-2. 

Bei der im A6-Chip integrierten Grafiklösung setzt Apple auf eine GPU aus dem Hause Imagination. Es handelt sich um das Modell PowerVR SGX 543MP3, eine Dreikern-GPU mit 266 MHz Taktfrequenz.

Zum Einsatz kommt der Apple A6 erstmals im iPhone 5, das am 12. September 2012 vorgestellt wurde. Im Verglich zum A5-Chip aus dem iPhone 4S erzielt der A6 mehr als eine Verdopplung der Performance. Der Zuwachs an Grafikleistung ist ebenfalls signifikant.

Mediatek MT8766B

► remove from comparison  Helio MT8766B

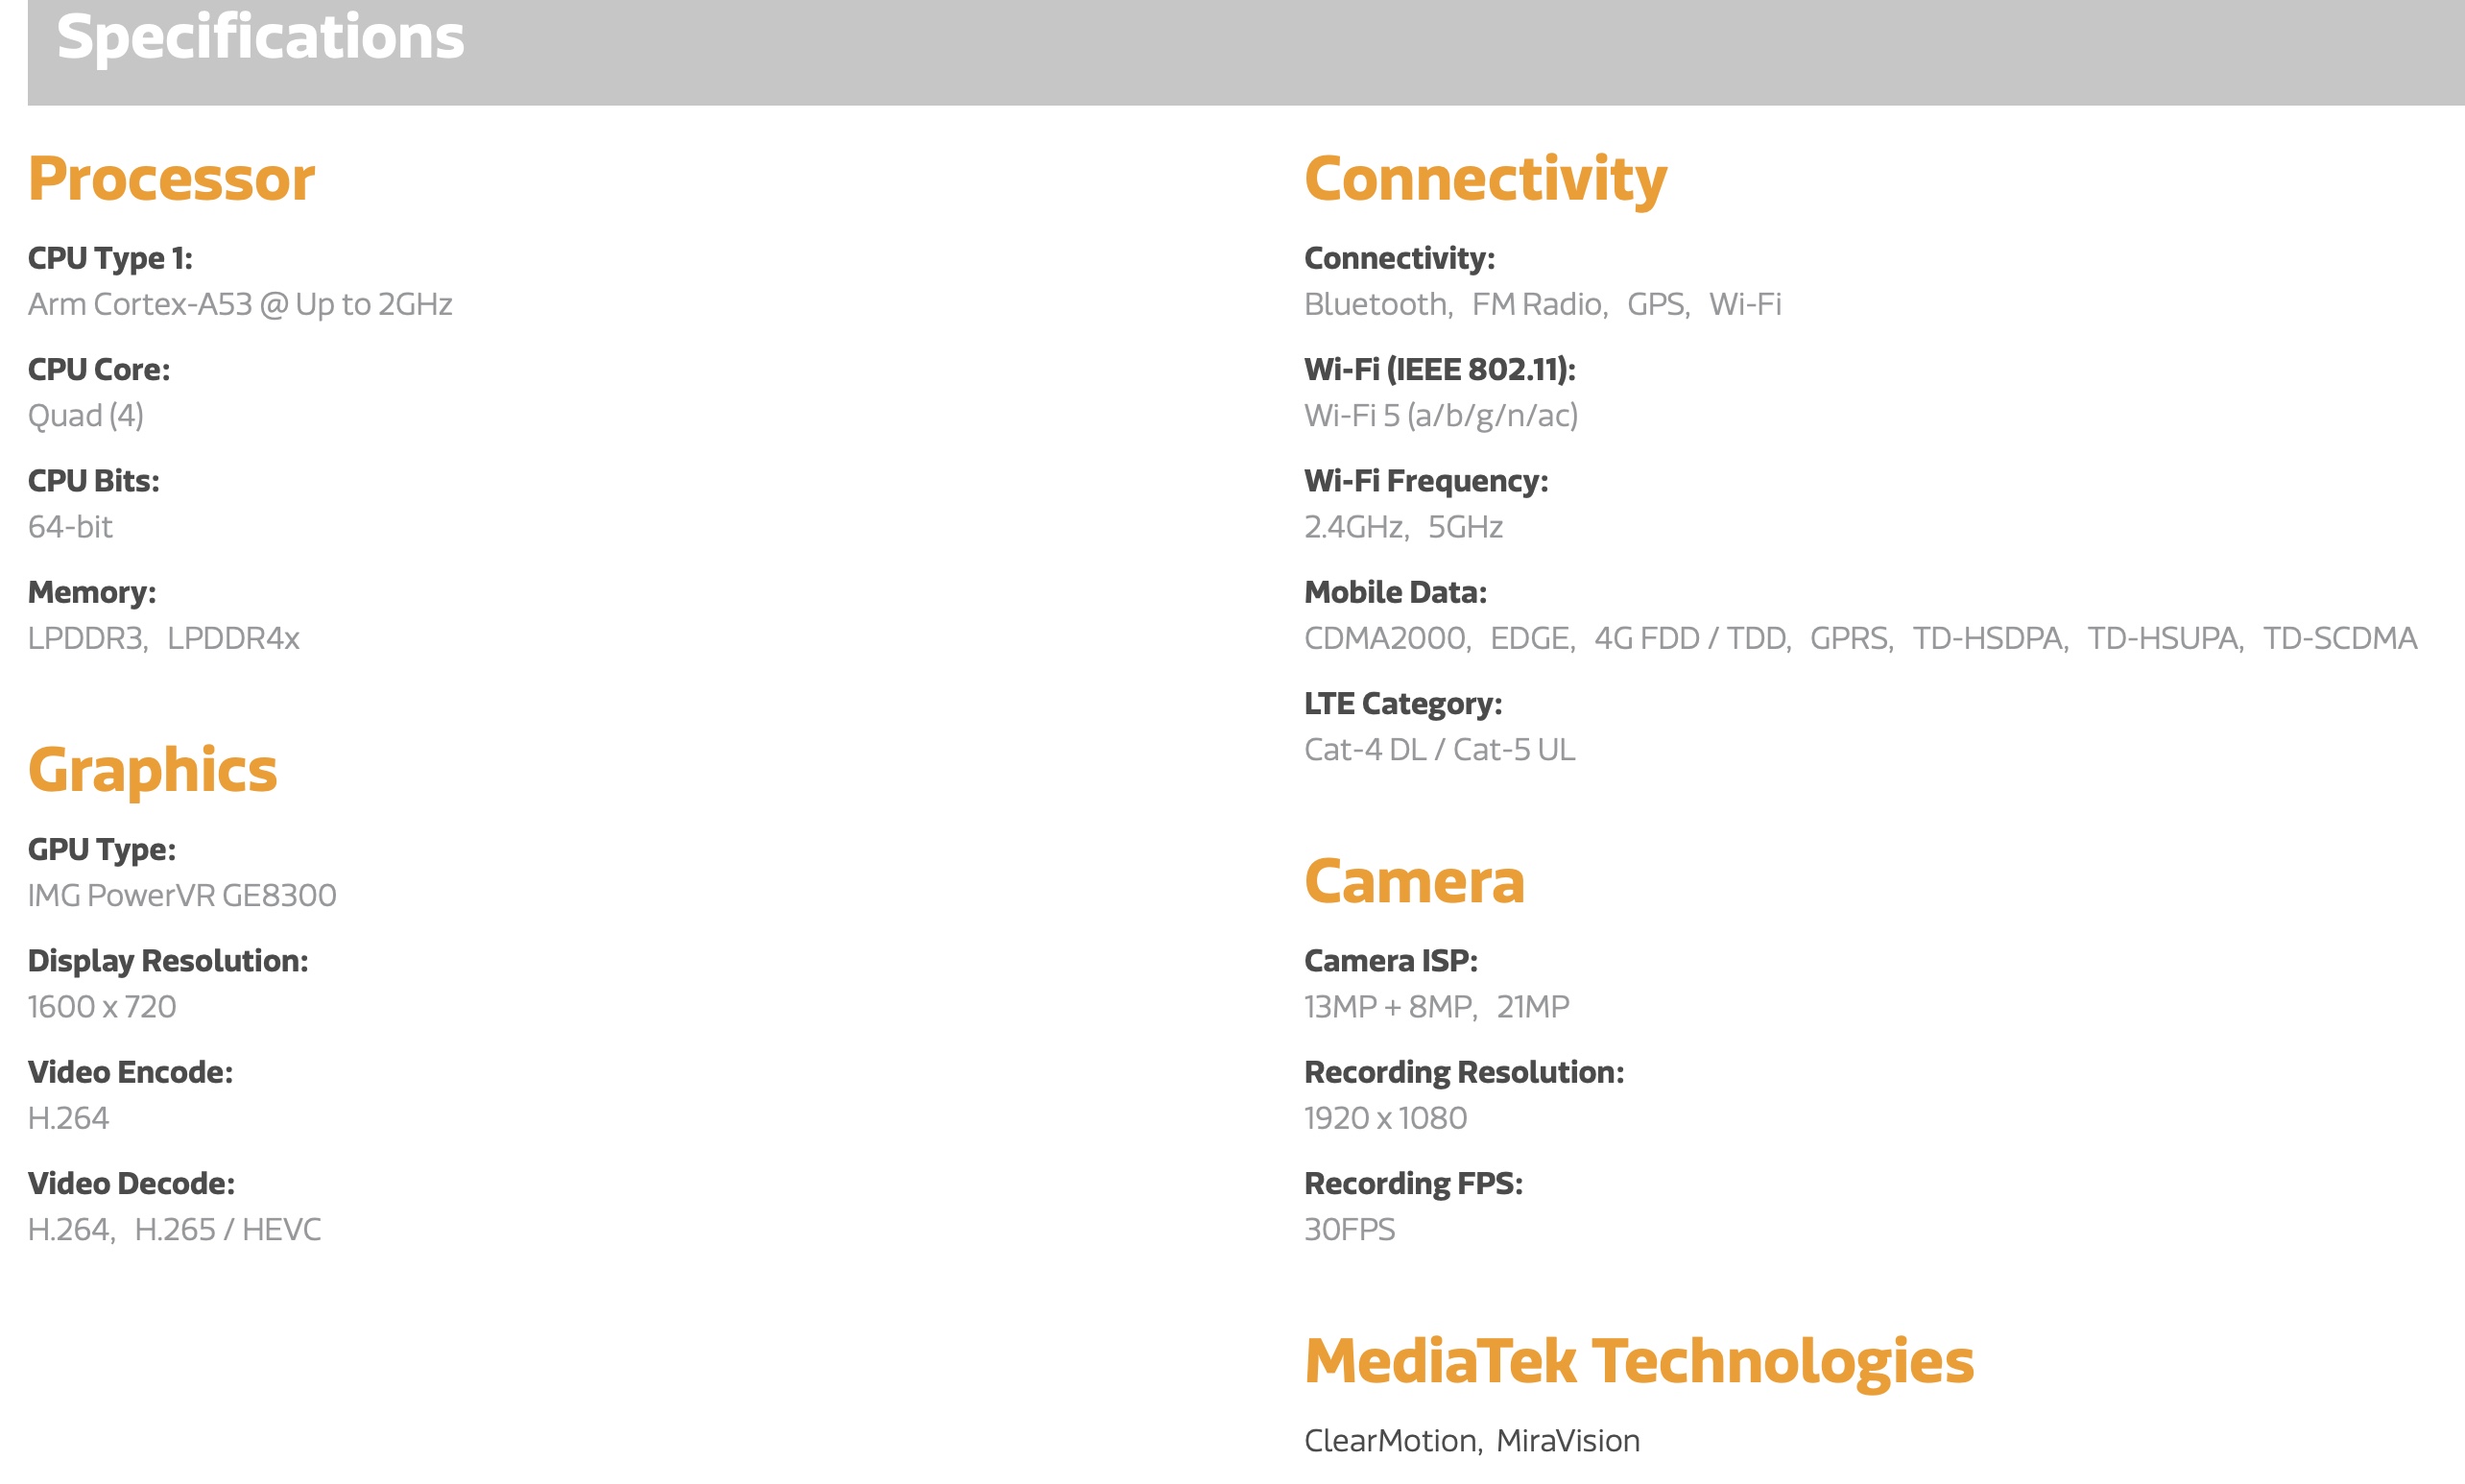
Der MediaTek MT8766B Helio A20 ist eine ARM-SoC für günstige Android-Smartphones und -tablets der Einsteiger-Klasse. Das SoC besitzt 4 Cortex-A53-Kerne mit bis zu 2 GHz Takt und ähnelt daher dem Helios A20 (1.8 GHz).

Als Grafikchip kommt ein PowerVR GE8300 zum Einsatz (max. 1600x720 Pixel), der Speichercontroller unterstützt LPDDR3/LPDDR4X.

Das integrierte LTE-Modem unterstützt 4G mit bis zu 150 Mbps Download (Cat-4) und 75 Mbps Upload (Cat-5). Bluetooth 5.0 (?) und die WLAN-Standards bis Wi-Fi 5 werden unterstützt.

Das SoC wird wahrscheinlich wie der A20 im 12nm-FinFET-Herstellungsverfahrens produziert.

ModelApple A6Mediatek MT8766B
SeriesApple Mediatek MT8
Serie: Mediatek MT8 Cortex-A53
newitem compare cores
HiSilicon Kirin 9000W compare1.53 - 2.49 GHz12 / 12 cores
UNISOC Tiger T310 compare1.8 - 2 GHz4 / 4 cores
Rockchip RK3288 compare1.8 GHz4 / 4 cores
Apple A6x compare1.4 GHzcores
Apple A6 « 1 GHzcores
Apple S5 compare2 / 2 cores
HiSilicon k3v2 Hi3620 compare1.2 GHz4 / 4 cores
Rockchip RK3066 1.5 GHz compare1.5 GHz2 / 2 cores
Amlogic AML8726-MX compare1.5 GHz2 / 2 cores
Rockchip RK3168 compare1.2 GHz2 / 2 cores
Rockchip RK2918 1.2 GHz compare1.2 GHz1 / 1 cores
ARM Cortex A8 1.2 GHz compare1.2 GHz1 / 1 cores
Telechips TCC8803 1GHz compare1 GHz1 / 1 cores
Loongson 2F 900MHz compare0.9 GHz1 / 1 cores
CSR8670 compare0.08 GHzcores
ARM Cortex-M4 compare cores
HiSilicon Hi6262 compare cores
DK3.5+ST comparecores
unknown compare cores
Mediatek MT8768 compare1.5 - 2 GHz8 / 8 cores Cortex-A53
MediaTek MT8168 compare2 GHz4 / 4 cores Cortex-A53
Mediatek MT8766B « 2 GHz4 / 4 cores Cortex-A53
Clock1000 MHz2000 MHz
Cores / Threads24 / 4
Technology32 nm12 nm
ArchitectureARMARM
Announced
CodenameCortex-A53
FeaturesPowerVR GE8300, Dual-Channel LPDDR3 / LPDDR4X, Wi-Fi 5, Bluetooth, LTE Cat-4 DL / Cat-5 UL, H.264 Encode, H.265 Decode
iGPUPowerVR GE8300
Manufacturerwww.mediatek.com

Benchmarks

Performance Rating - Geekbench 5.5, PCM Work, Sling Shot Physics, Antutu v8 CPU - Helio MT8766B
0.2 pt (13%)
3DMark - 3DMark Ice Storm Physics
100%
1 A6 +
7961 Points (6%)
3DMark - 3DMark Ice Storm Extreme Physics
100%
1 A6 +
7816 Points (6%)
3DMark - 3DMark Ice Storm Unlimited Physics
13779 Points (12%)
3DMark - 3DMark Sling Shot Extreme (ES 3.1) Unlimited Physics
853 Points (10%)
3DMark - 3DMark Sling Shot (ES 3.0) Unlimited Physics
860 Points (10%)
Geekbench 5.5 - Geekbench 5.1 - 5.4 64 Bit Single-Core
133 Points (6%)
Geekbench 5.5 - Geekbench 5.1 - 5.4 64 Bit Multi-Core
455 Points (1%)
Geekbench 4.4 - Geekbench 4.1 - 4.4 64 Bit Single-Core
783 Points (8%)
Geekbench 4.4 - Geekbench 4.1 - 4.4 64 Bit Multi-Core
2217 Points (2%)
Geekbench 4.0 - Geekbench 4.0 64 Bit Single-Core
741 Points (10%)
Geekbench 4.0 - Geekbench 4.0 64 Bit Multi-Core
2043 Points (5%)
Geekbench 3 - Geekbench 3 32 Bit Multi-Core
100%
1 A6 +
1273 Points (2%)
Geekbench 3 - Geekbench 3 32 Bit Single-Core
100%
1 A6 +
min: 701     avg: 706     median: 705.5 (14%)     max: 710 Points
Geekbench 3 - Geekbench 3 64 Bit Multi-Core
2112 Points (3%)
Geekbench 3 - Geekbench 3 64 Bit Single-Core
722 Points (11%)
Geekbench 2 - 32 Bit - Geekbench Stream
100%
A6 +
940 Points (8%)
725 Points (6%)
Geekbench 2 - 32 Bit - Geekbench Memory
100%
A6 +
1867 Points (17%)
1727 Points (16%)
Geekbench 2 - 32 Bit - Geekbench Floating Point
100%
A6 +
2114 Points (4%)
3305 Points (6%)
Geekbench 2 - 32 Bit - Geekbench Integer
100%
A6 +
1261 Points (3%)
1865 Points (4%)
Geekbench 2 - 32 Bit - Geekbench Total Score
100%
A6 +
1648 Points (4%)
2227 Points (6%)
Linpack Android / IOS - Linpack Multi Thread
100%
1 A6 +
min: 484     avg: 530     median: 529.5 (18%)     max: 575 MFLOPS
Linpack Android / IOS - Linpack Single Thread
100%
1 A6 +
min: 309.4     avg: 337.3     median: 337.3 (33%)     max: 365.2 MFLOPS
Mozilla Kraken 1.1 - Kraken 1.1 Total Score *
100%
A6 +
14535 ms (17%)
11505 ms (13%)
Sunspider - Sunspider 1.0 Total Score *
100%
A6 +
min: 714     avg: 722     median: 722 (8%)     max: 730 ms
1609 ms (18%)
Sunspider - Sunspider 0.9.1 Total Score *
100%
1 A6 +
935 ms (9%)
Octane V2 - Octane V2 Total Score
3920 Points (4%)
WebXPRT 3 - WebXPRT 3 Score
27 Points (6%)
AnTuTu v8 - AnTuTu v8 UX
15424 Points (13%)
AnTuTu v8 - AnTuTu v8 MEM
24878 Points (20%)
AnTuTu v8 - AnTuTu v8 GPU
4722 Points (1%)
AnTuTu v8 - AnTuTu v8 CPU
30304 Points (11%)
AnTuTu v8 - AnTuTu v8 Total Score
75328 Points (7%)
PassMark PerformanceTest Mobile V1 - PerformanceTest Mobile V1 CPU Tests
100%
1 A6 +
24996 Points (3%)
PCMark for Android - PCM f. Android Computer Vision
2761 Points (15%)
PCMark for Android - PCM f. Android Storage
6844 Points (15%)
PCMark for Android - PCM f. Android Work Score 2.0
4808 Points (31%)
PCMark for Android - PCM f. Android Work Score
6431 Points (32%)

Average Benchmarks Apple A6 → 100% n=7

Average Benchmarks Mediatek MT8766B → 115% n=7

- Bereich der Benchmarkergebnisse für diese Grafikkarte
- Durchschnittliche Benchmarkergebnisse für diese Grafikkarte
* Smaller numbers mean a higher performance
1 This benchmark is not used for the average calculation

Add one or more devices and compare

In the following list you can select (and also search for) devices that should be added to the comparison. You can select more than one device.

restrict list:

show all (including archived), 2024, 2023
v1.27
log 17. 08:34:46

#0 checking url part for id 3551 +0s ... 0s

#1 checking url part for id 13125 +0s ... 0s

#2 not redirecting to Ajax server +0s ... 0s

#3 did not recreate cache, as it is less than 5 days old! Created at Sun, 16 Jun 2024 05:37:17 +0200 +0.001s ... 0.001s

#4 composed specs +0.055s ... 0.056s

#5 did output specs +0s ... 0.056s

#6 getting avg benchmarks for device 3551 +0.003s ... 0.059s

#7 got single benchmarks 3551 +0.008s ... 0.067s

#8 getting avg benchmarks for device 13125 +0.014s ... 0.082s

#9 got single benchmarks 13125 +0.01s ... 0.092s

#10 got avg benchmarks for devices +0s ... 0.092s

#11 min, max, avg, median took s +0.143s ... 0.235s

#12 return log +0.056s ... 0.291s

Teilen Sie diesen Artikel, um uns zu unterstützen. Jeder Link hilft!
> Notebook Test, Laptop Test und News > Benchmarks / Technik > Benchmarks / Technik > Prozessor Vergleich - Head 2 Head
Autor: Klaus Hinum,  8.09.2017 (Update:  1.07.2023)