AMD Ryzen 3 3100 und Ryzen 3 3300X mit 4 Kernen und 8 Threads im Test
Der einfache Gamer braucht nicht zwangsläufig eine CPU mit 12 oder gar 16 Kernen, welche als Topmodell für die AM4-Plattform angeboten wird. Vielmehr reichen vier Kerne mit einem hohen Takt. Dies war bislang auch immer das Argument, welches gezählt hatte. Intel war diesbezüglich aufgrund der deutlich besseren IPC AMD immer einen Schritt voraus, was sich aber mit Einführung der Zen2-Architektur etwas geändert hat. AMD konnte hier deutlich aufschließen und nun profitieren auch die Einstiegs-CPUs von diesen Vorteilen. Anders als Intel bieten diese aber auch SMT womit in Summe nun 8 Threads gleichzeitig verarbeitet werden können, denn beide, der Ryzen 3 3100 und auch der Ryzen 3 3300X, sind beides native Vierkerner. Wie sich die neuen AMD-CPUs gegen die bereits angekündigten Comet-Lake-Prozessoren schlagen, bleibt abzuwarten, denn auch Intel hat dazugelernt und setzt bei fast allen neuen Prozessoren auf Hyper-Threading.
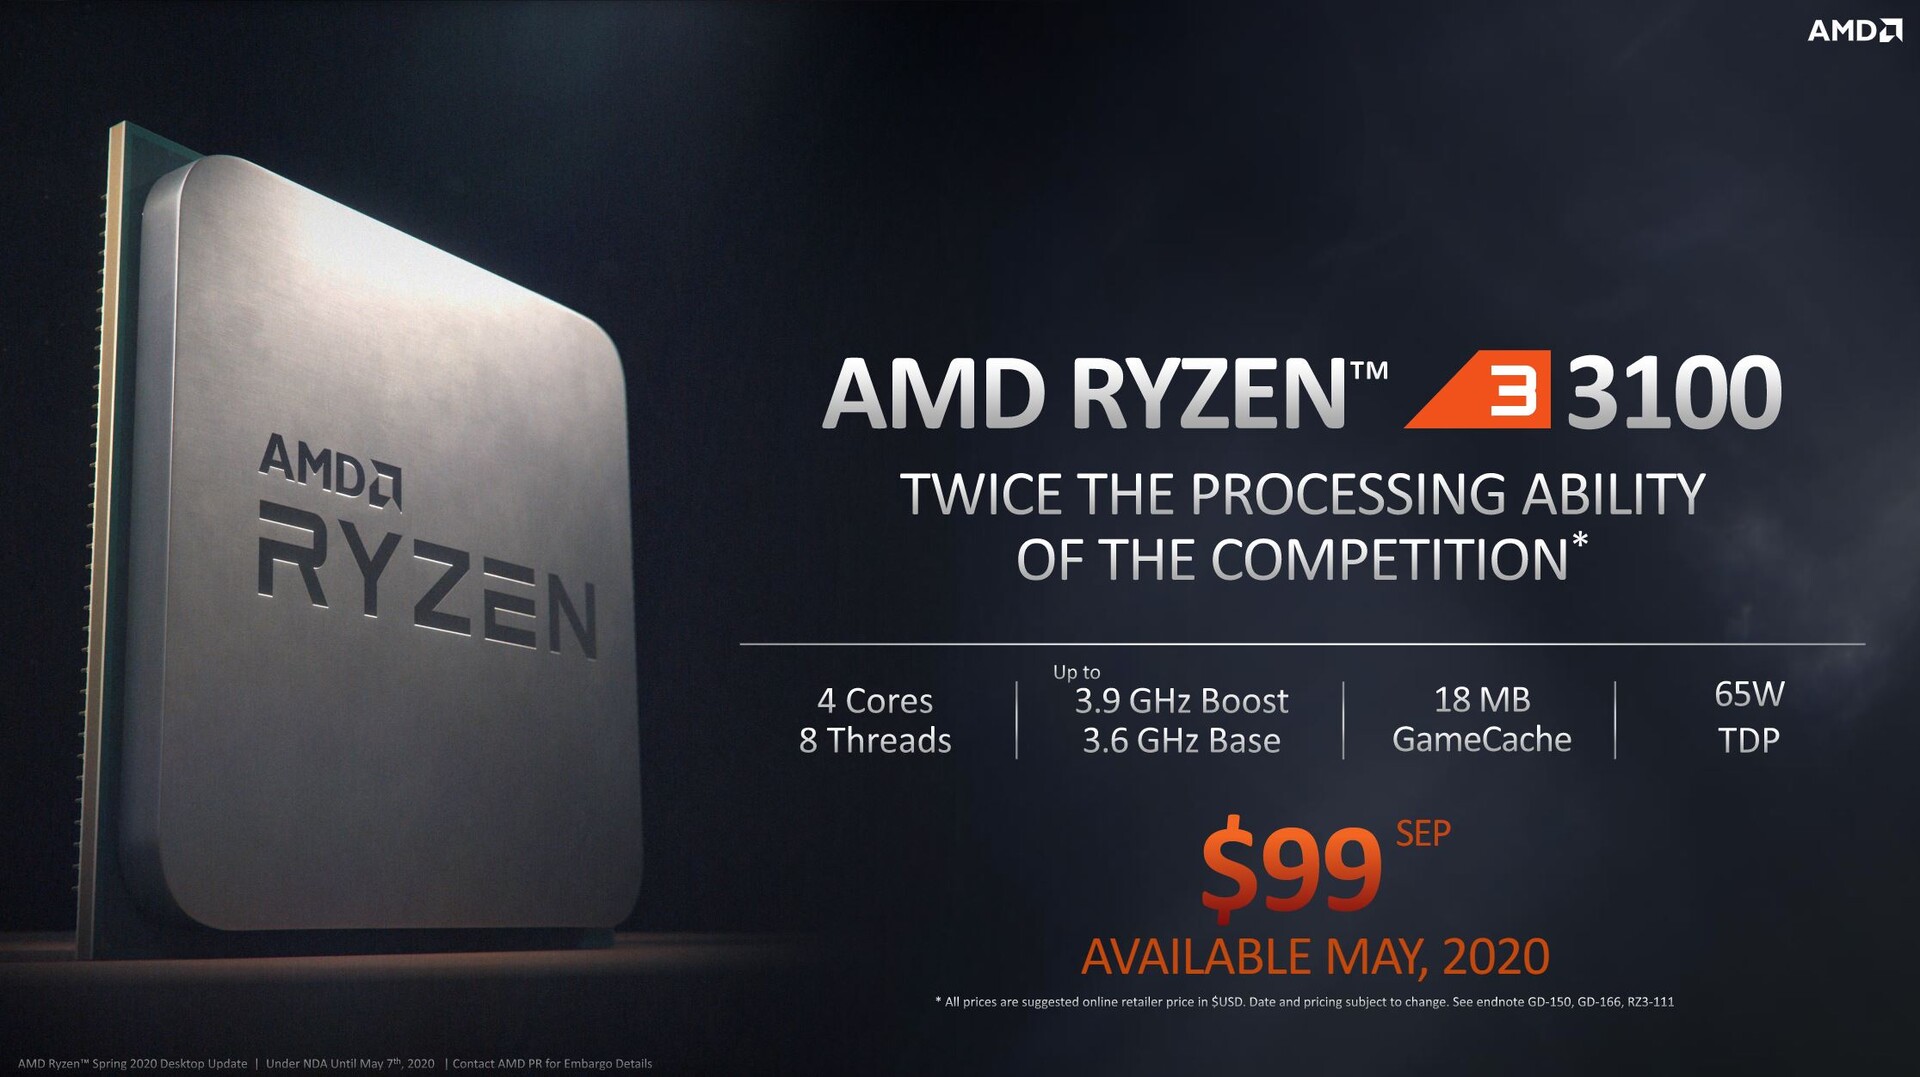
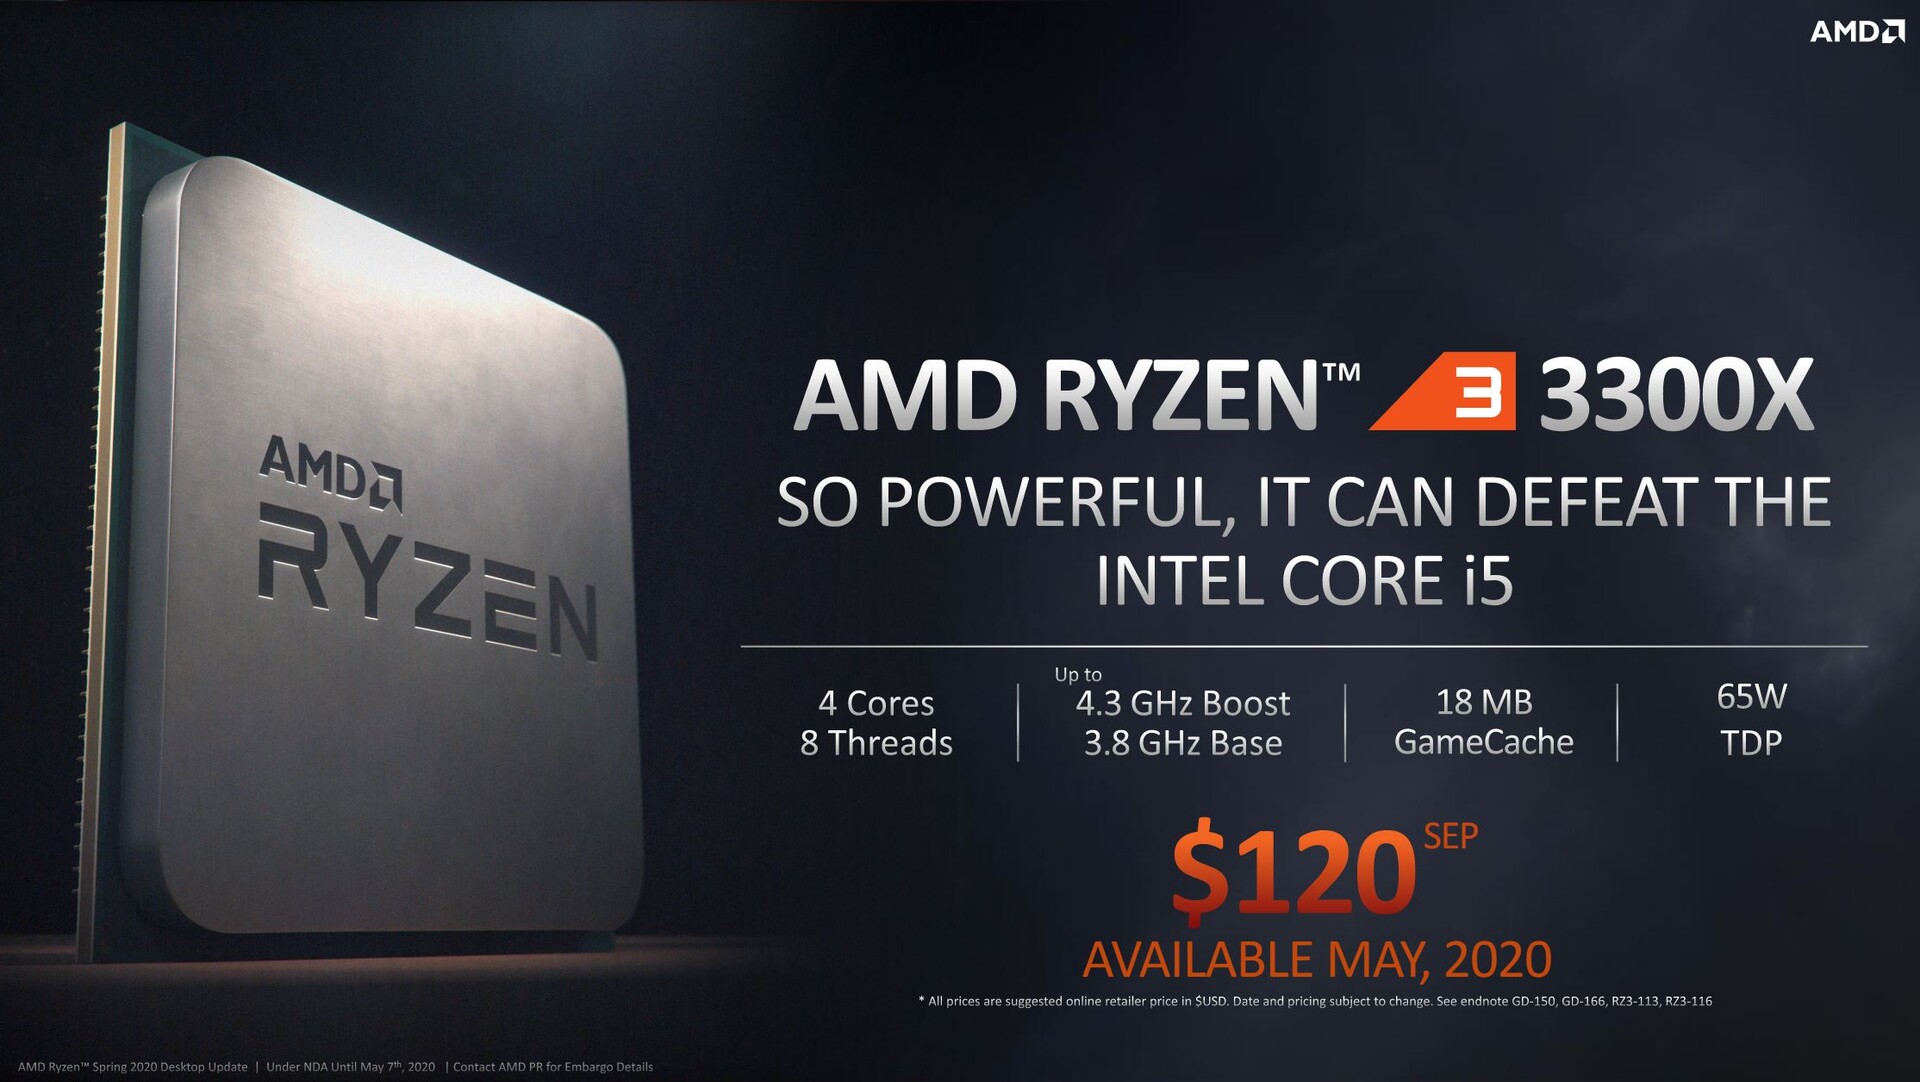
AMD hat Intel in letzter Zeit ordentlich unter Druck gesetzt, was sich letztlich auch im Preis niedergeschlagen hat. Den Weg verfolgt AMD weiter und der Ryzen 3 3100 kostet zum Release knapp 110 Euro wenngleich der Ryzen 3 3300X mit knapp 130 Euro nur knapp 20 Euro mehr kostet. Gegenüber Intel ist dies eine klare Kampfansage, denn der Intel Core i5-9400F kostet zum Testzeitpunkt rund 160 Euro.
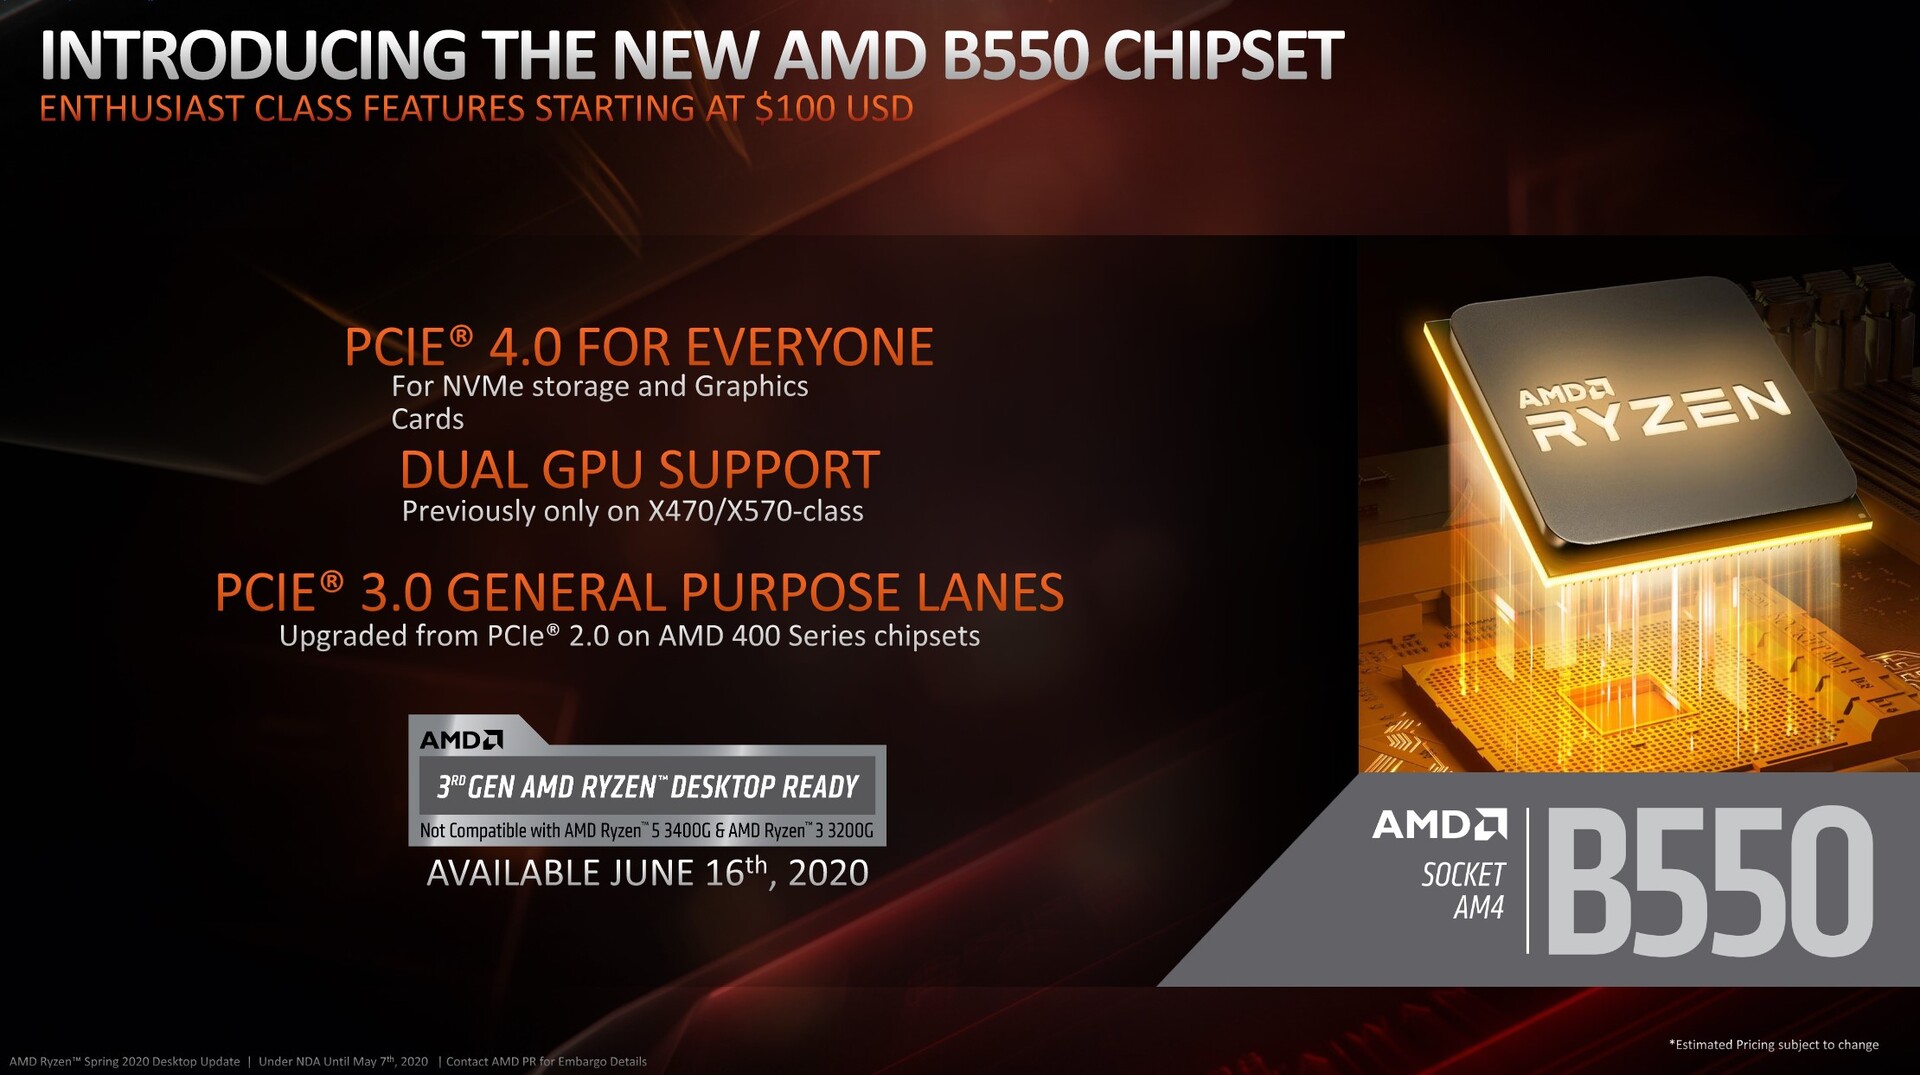
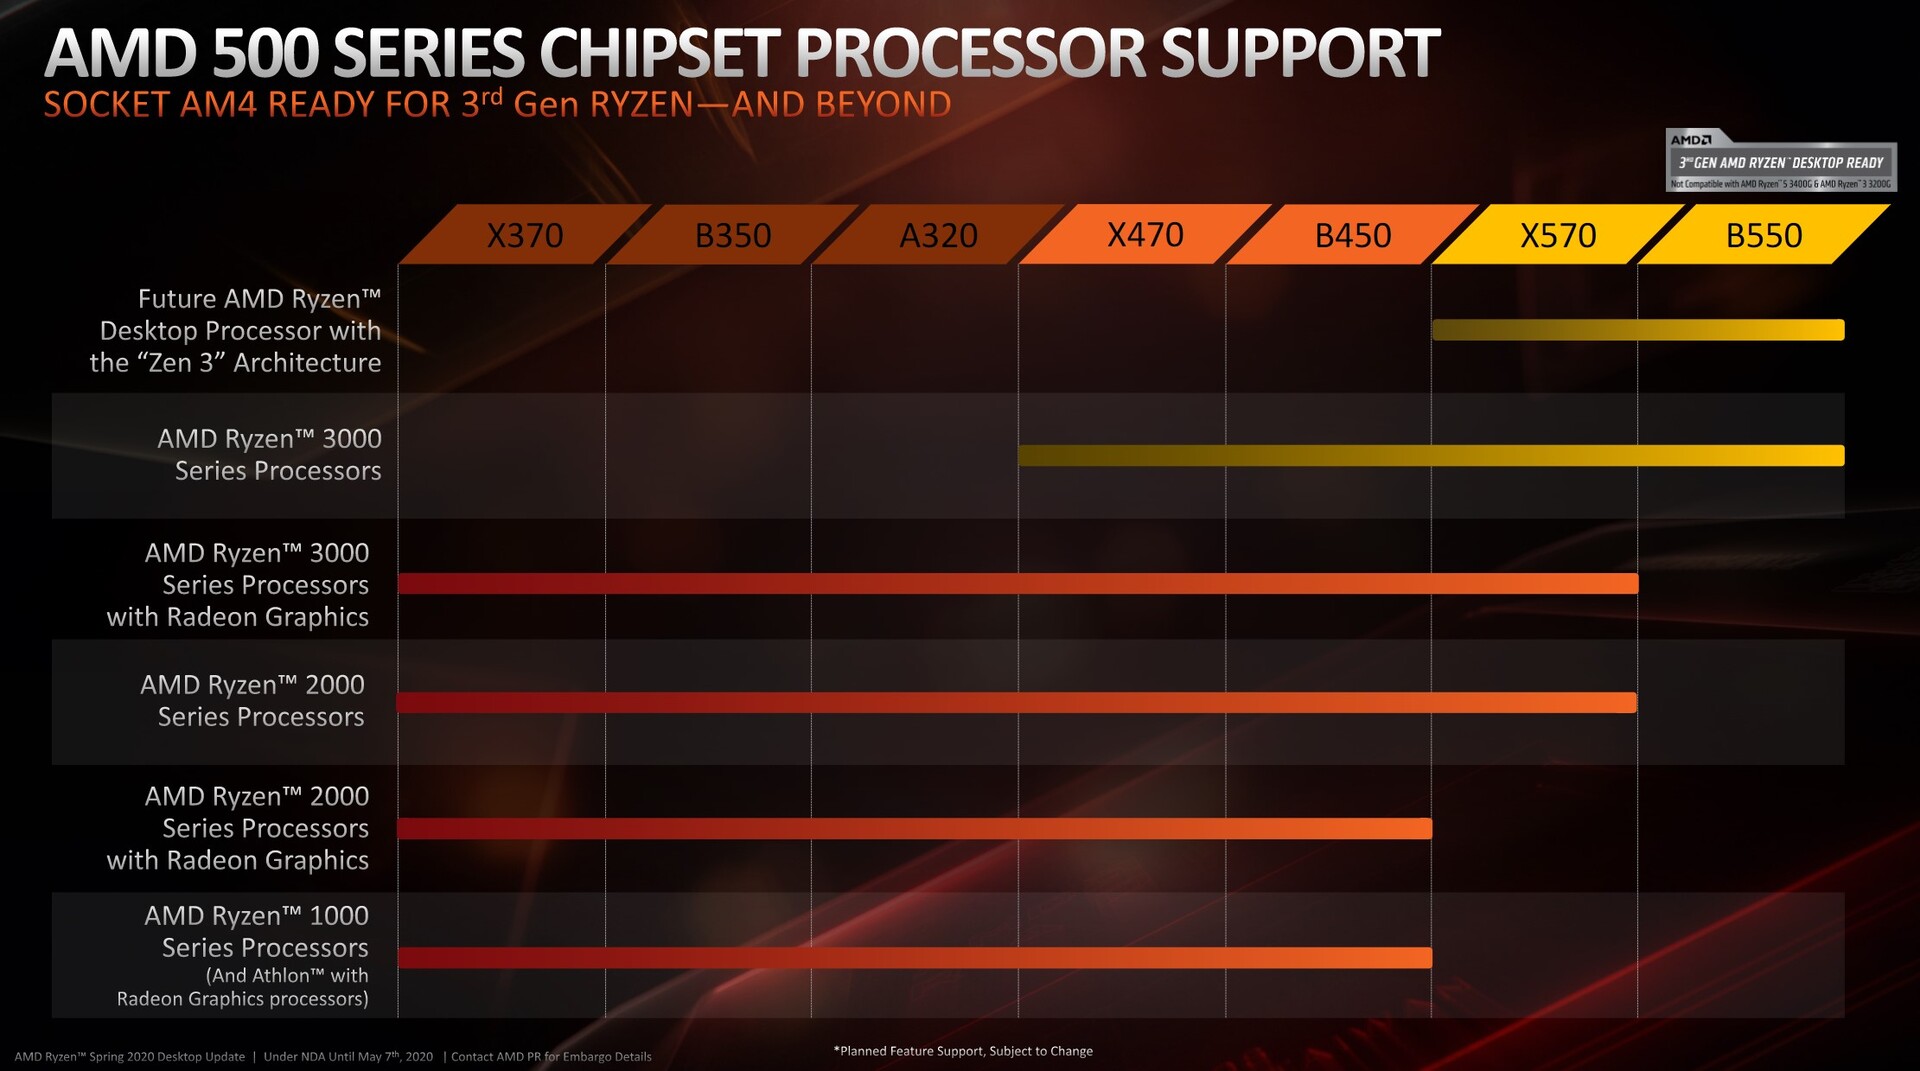
Wer die neuen Ryzen 3 3000 Serie benutzen möchte, muss nicht zwangsläufig eine teure X570-Platine verbauen. Mit dem Release der beiden neuen Ryzen-Modelle stellte AMD auch den B550-Chipsatz vor, welcher deutlich preiswertere Mainboards ermöglicht. Wer jedoch noch ein Mainboard mit X470- oder B450-Chipsatz sein Eigen nennt, hat Glück, denn auch diese sind nach einem Bios-Update kompatibel. Zukünftige Zen3-Prozessoren werden aber nur von den derzeit neuesten Chipsätzen unterstützt.
Die AMD-Ryzen-Prozessoren im Überblick
| Modell | Kerne / Threads |
Basistakt | Turbotakt | L3-Cache | TDP | Launch-Preis |
|---|---|---|---|---|---|---|
| Ryzen R9 3900X | 12/24 | 3,8 GHz | 4,6 GHz | 64 MB | 105 Watt | 529 Euro |
| Ryzen R7 3800X | 8/16 | 3,9 GHz | 4,5 GHz | 32 MB | 105 Watt | 429 Euro |
| Ryzen R7 3700X | 8/16 | 3,6 GHz | 4,4 GHz | 32 MB | 65 Watt | 349 Euro |
| Ryzen R5 3600X | 6/12 | 3,8 GHz | 4,4 GHz | 32 MB | 95 Watt | 265 Euro |
| Ryzen R5 3600 | 6/12 | 3,6 GHz | 4,2 GHz | 32 MB | 65 Watt | 209 Euro |
| Ryzen R3 3300X | 4/8 | 3,8 GHz | 4,3 GHz | 16 MB | 65 Watt | 129 Euro |
| Ryzen R3 3100 | 4/8 | 3,6 GHz | 3,9 GHz | 16 MB | 65 Watt | 109 Euro |
AMD Ryzen 3 3100 und AMD Ryzen 3 3300 im Detail
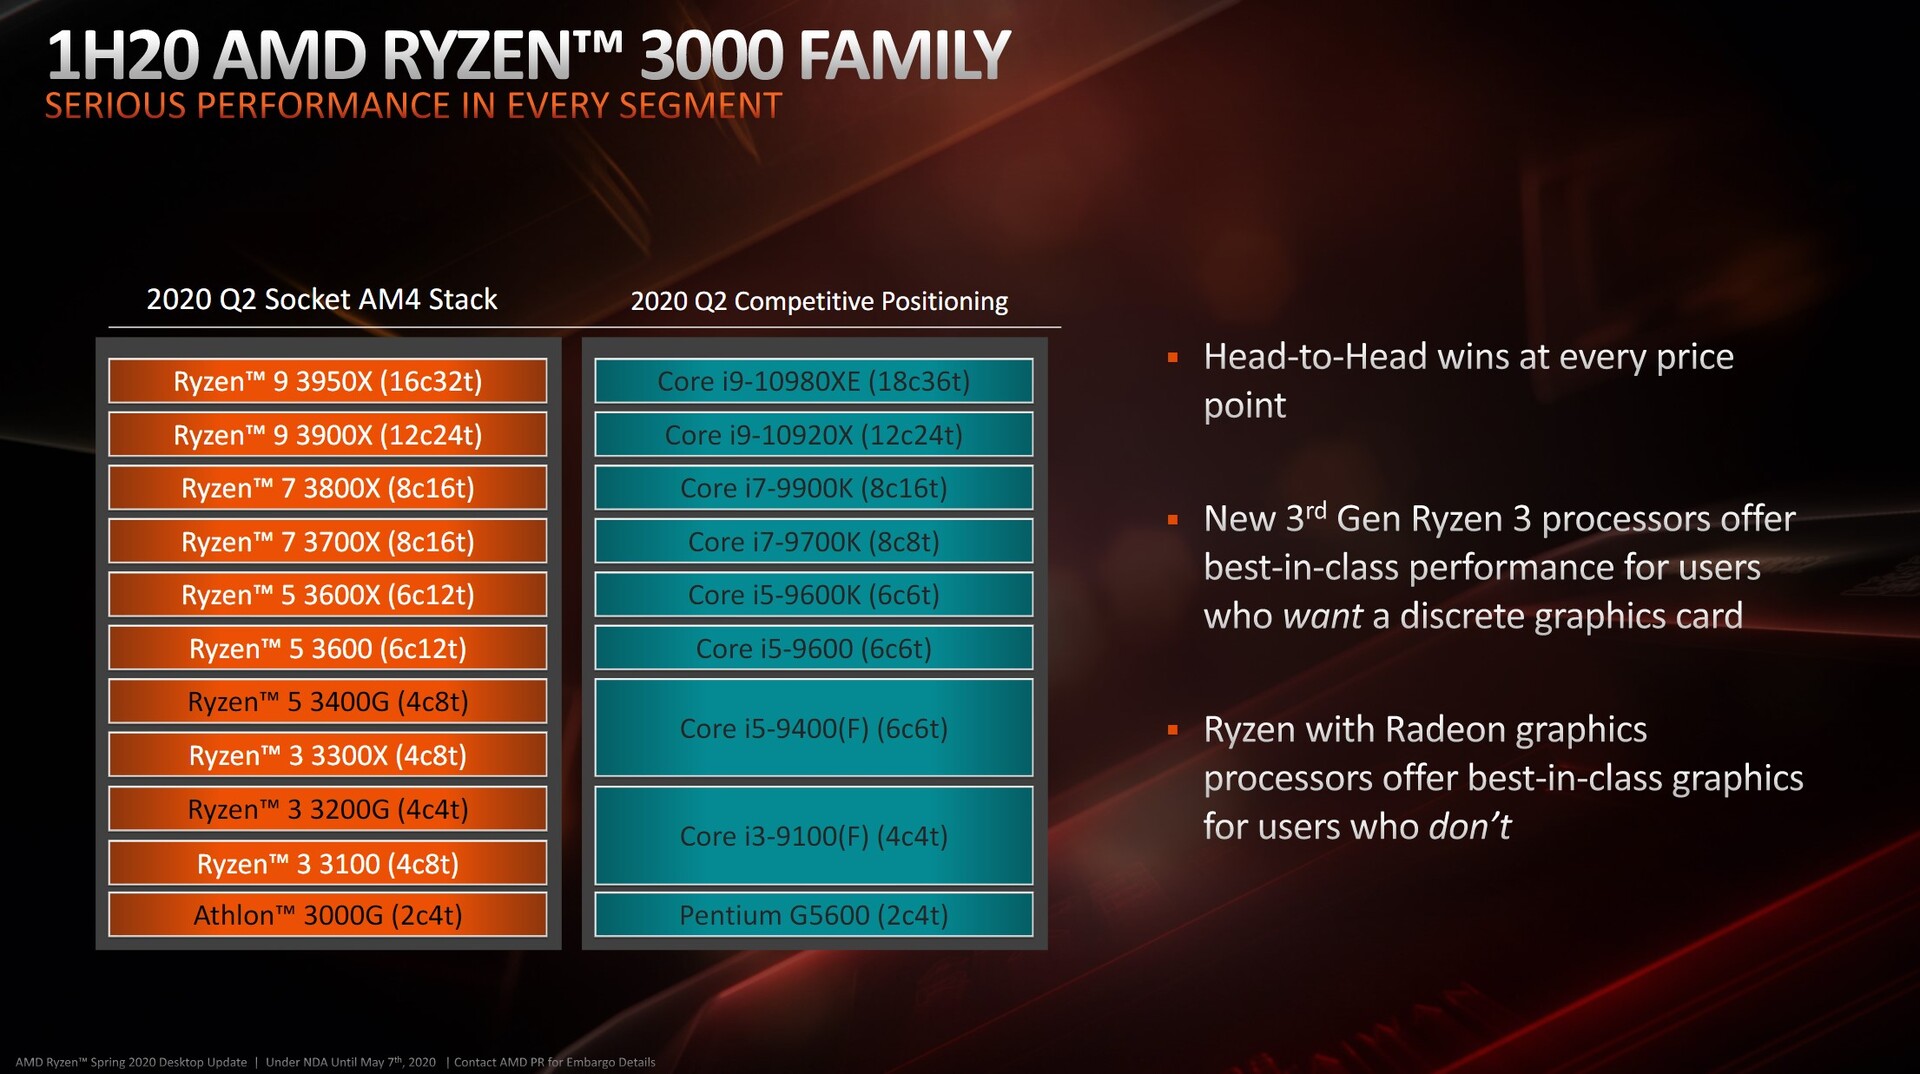
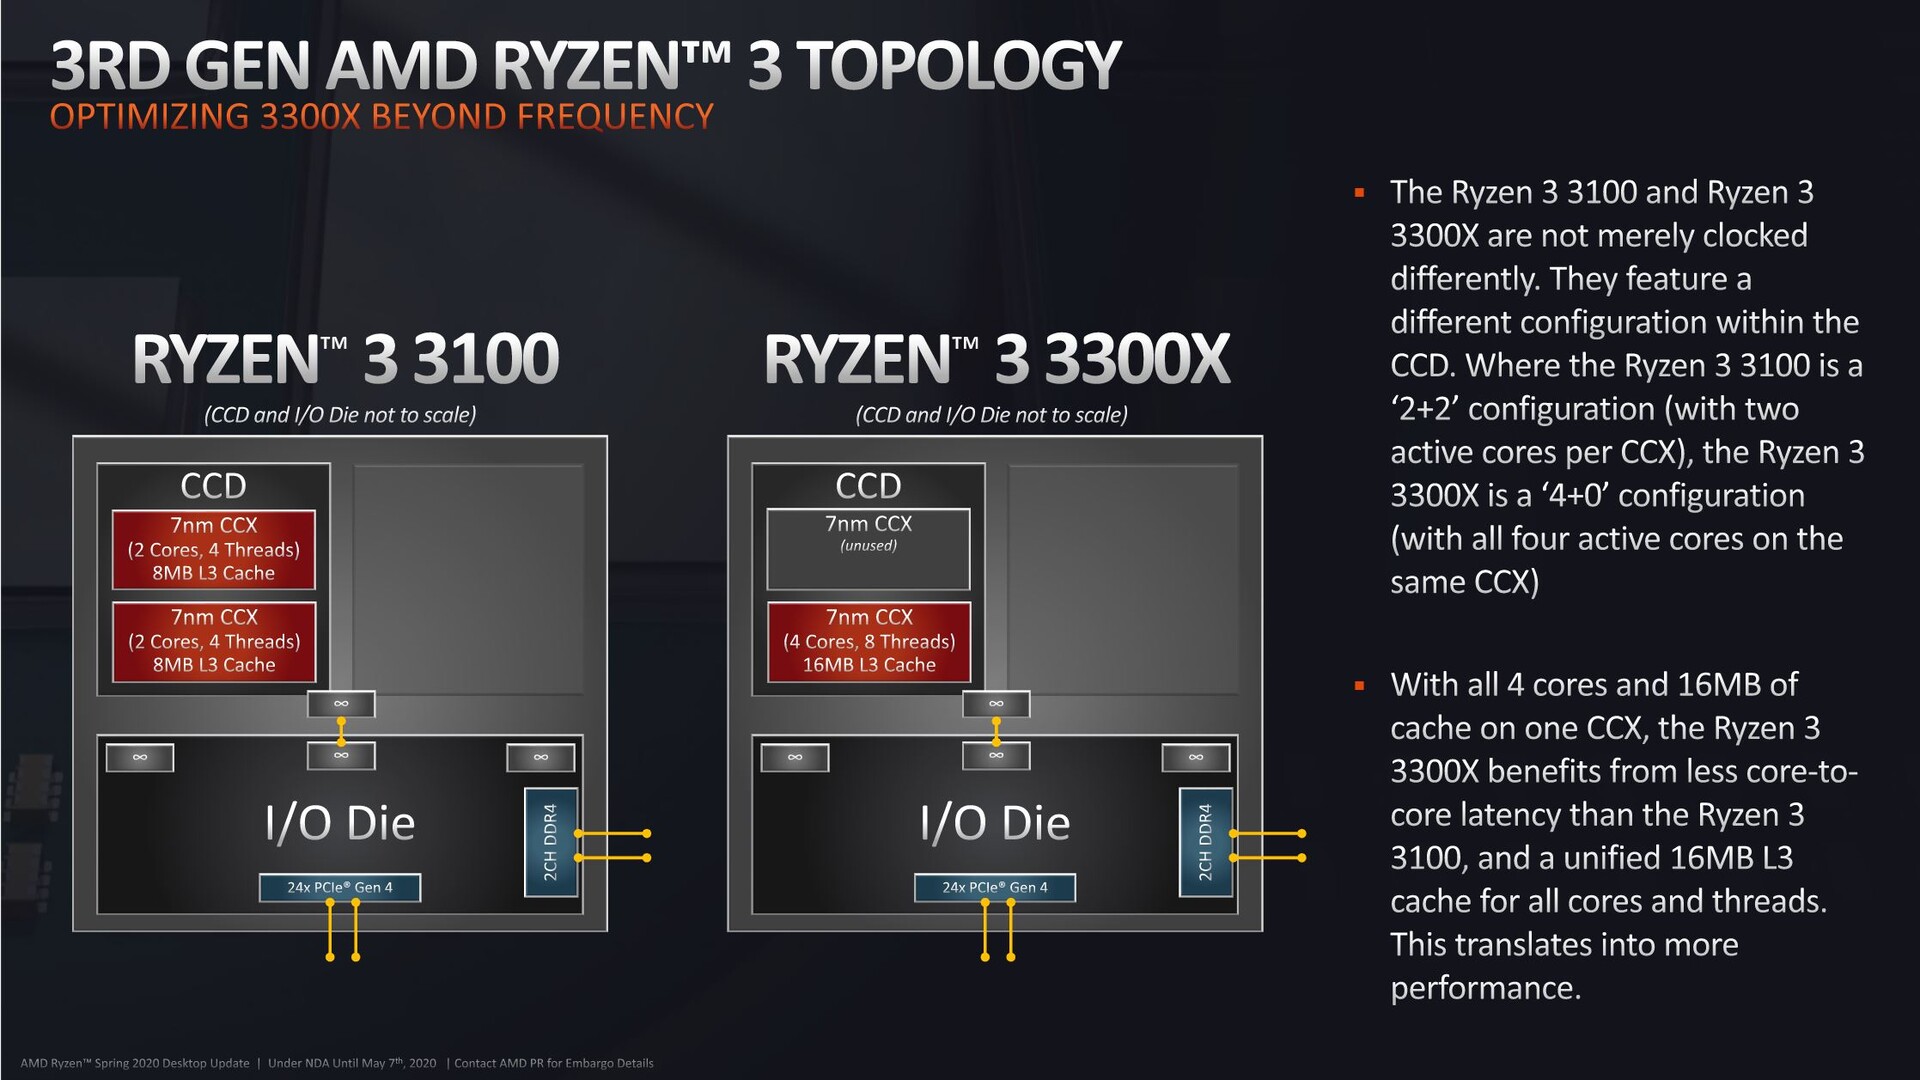
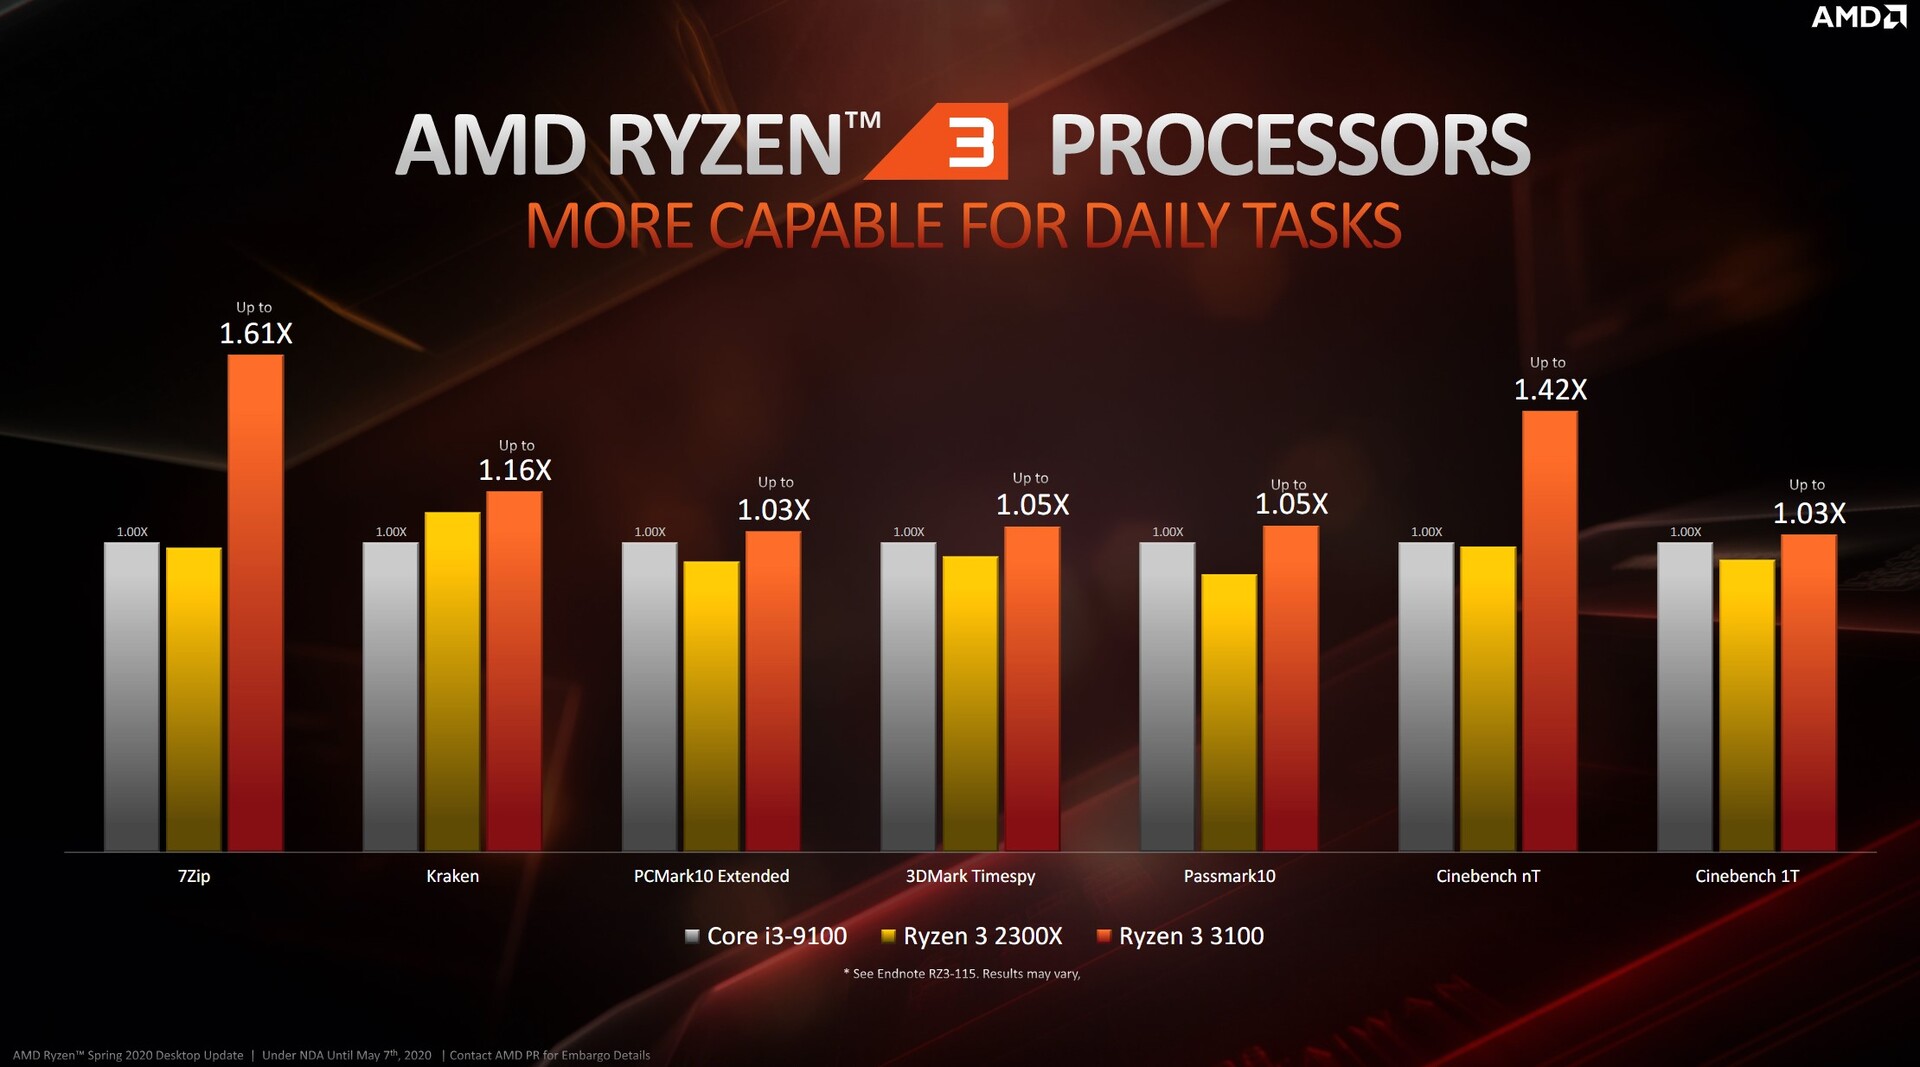
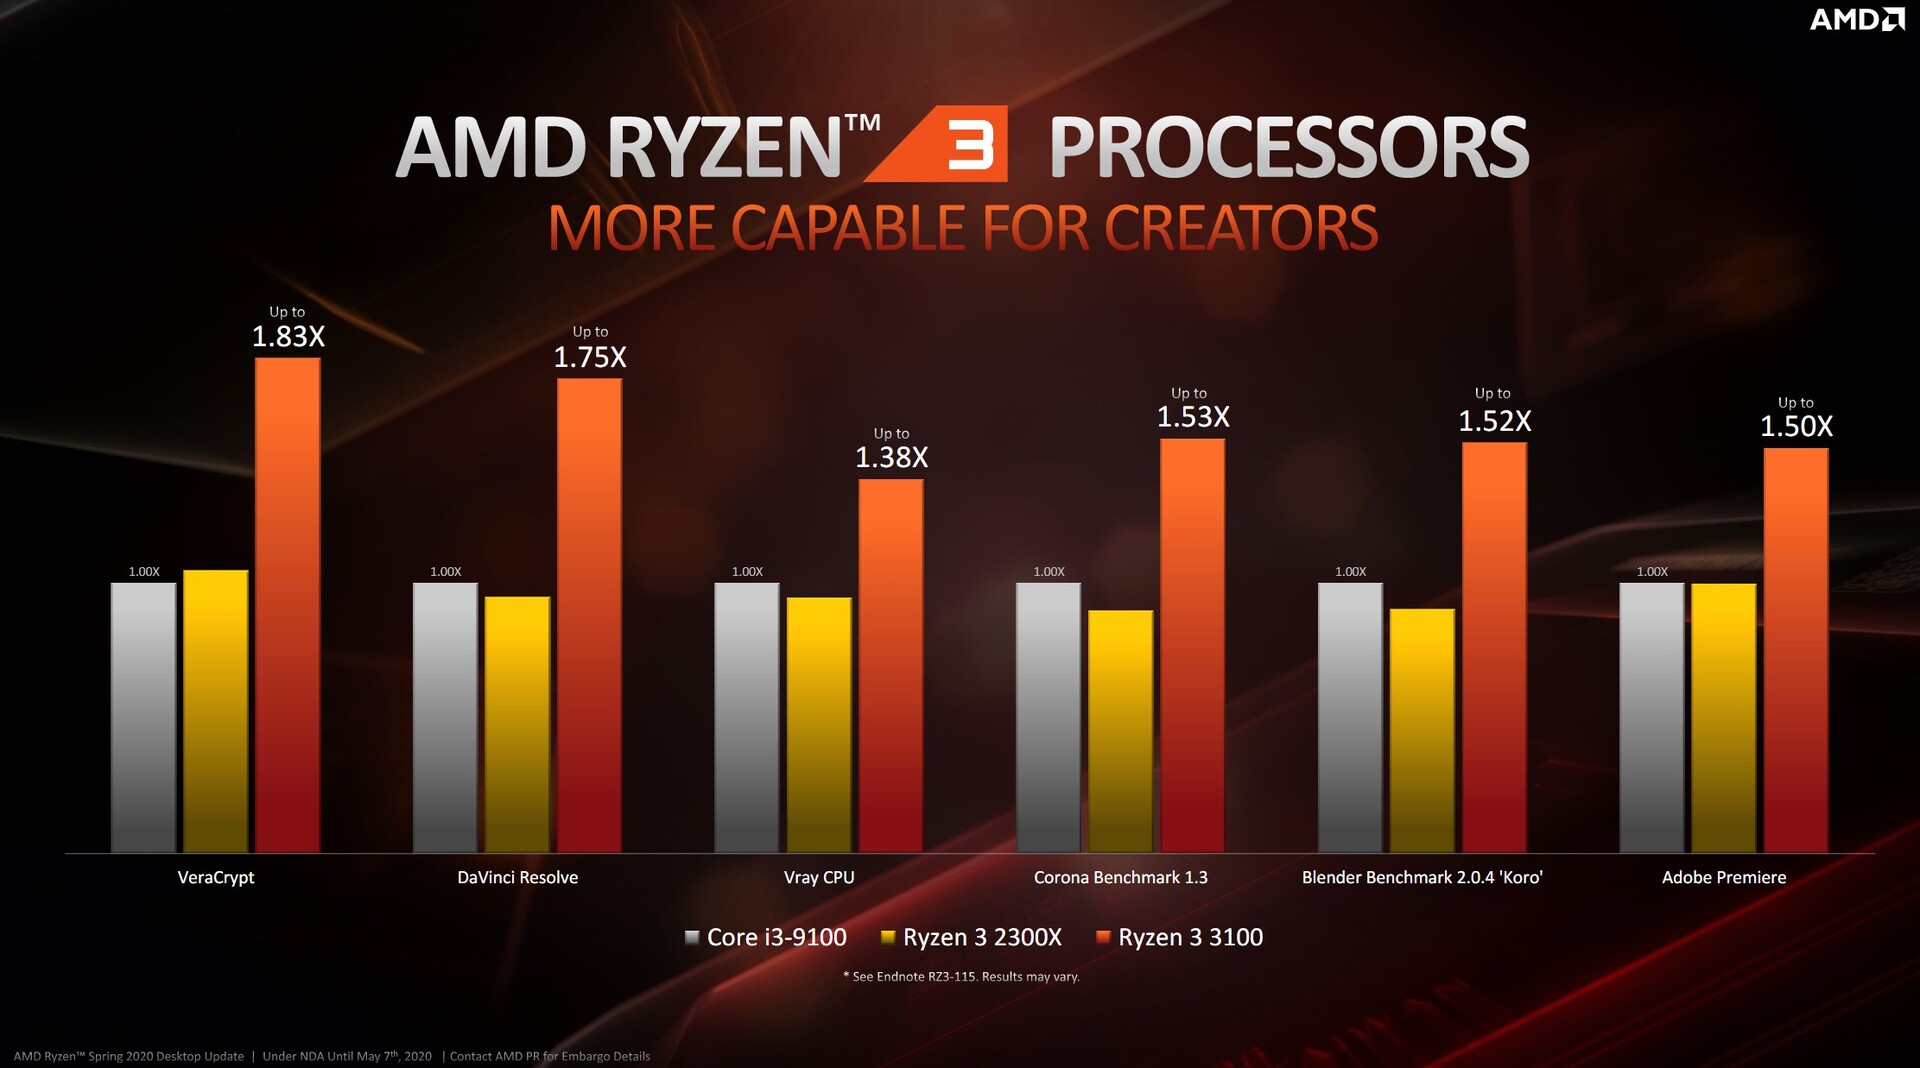
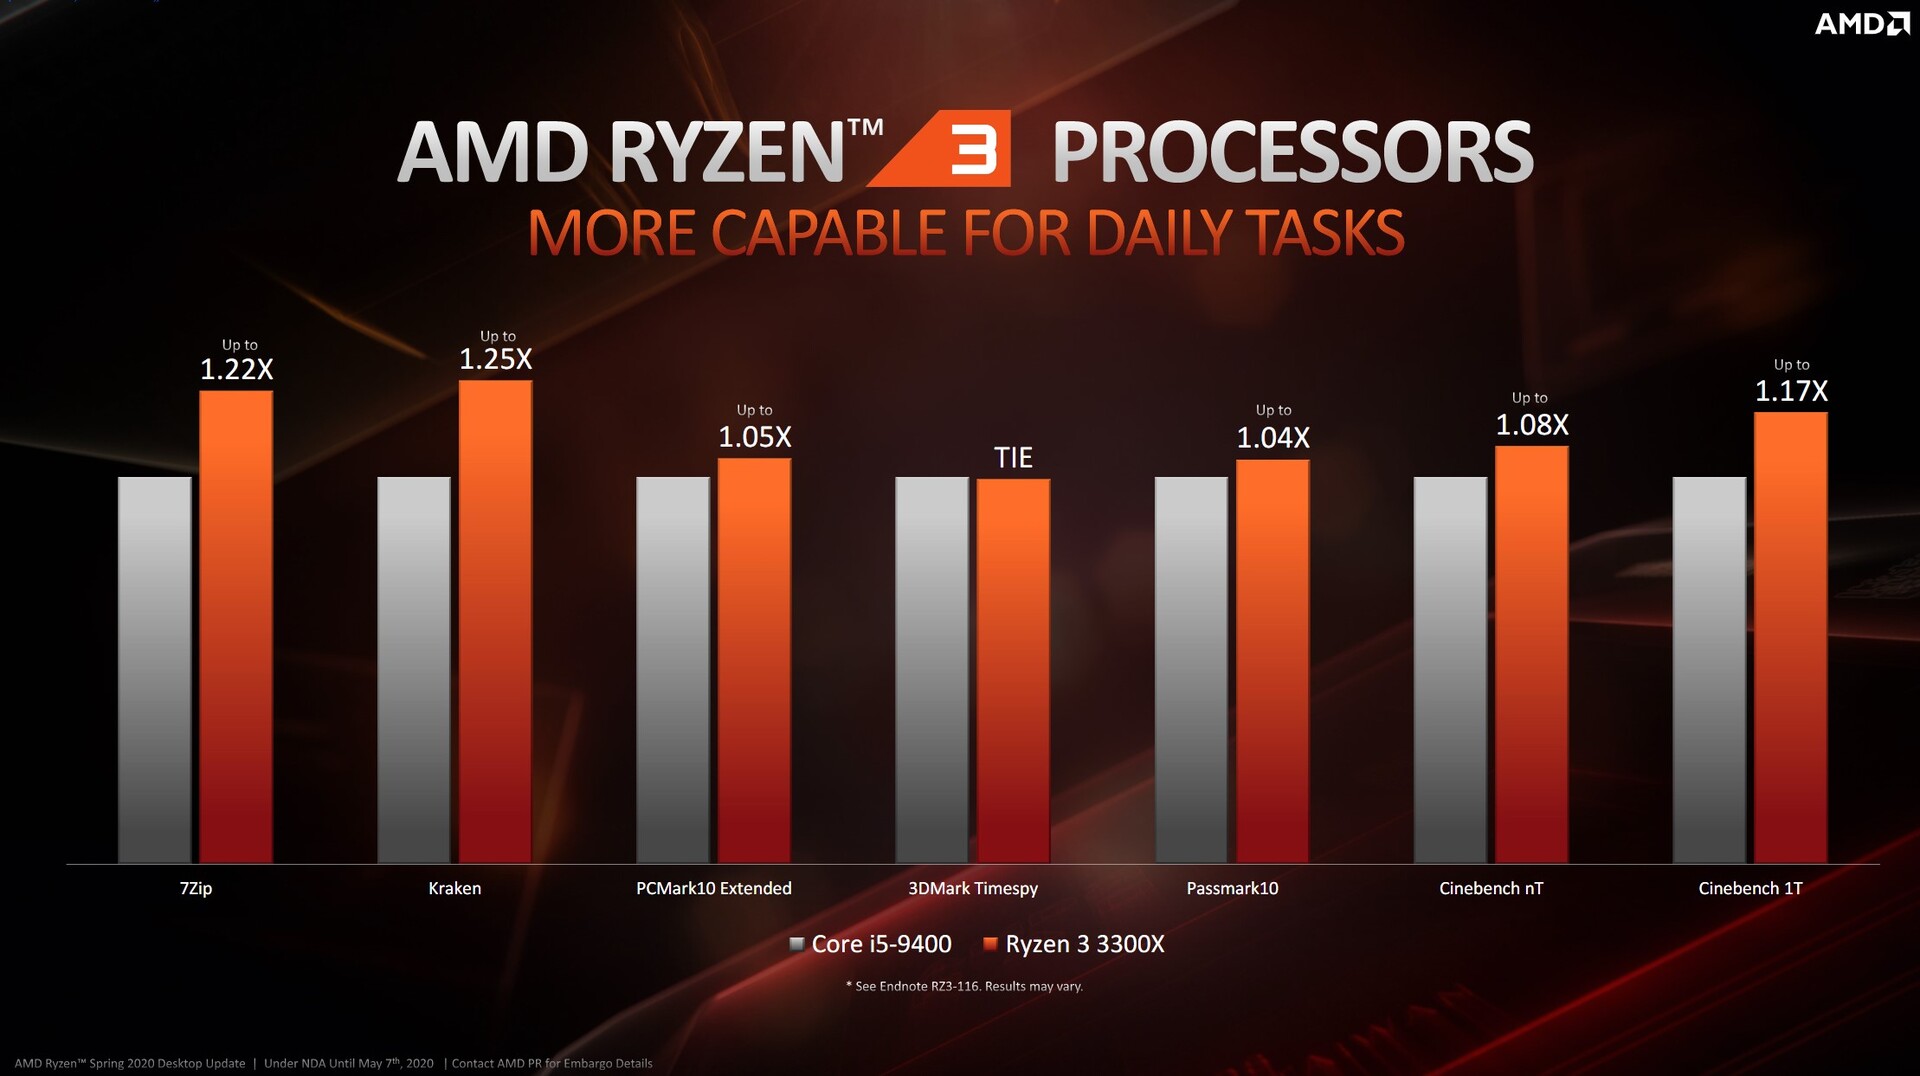
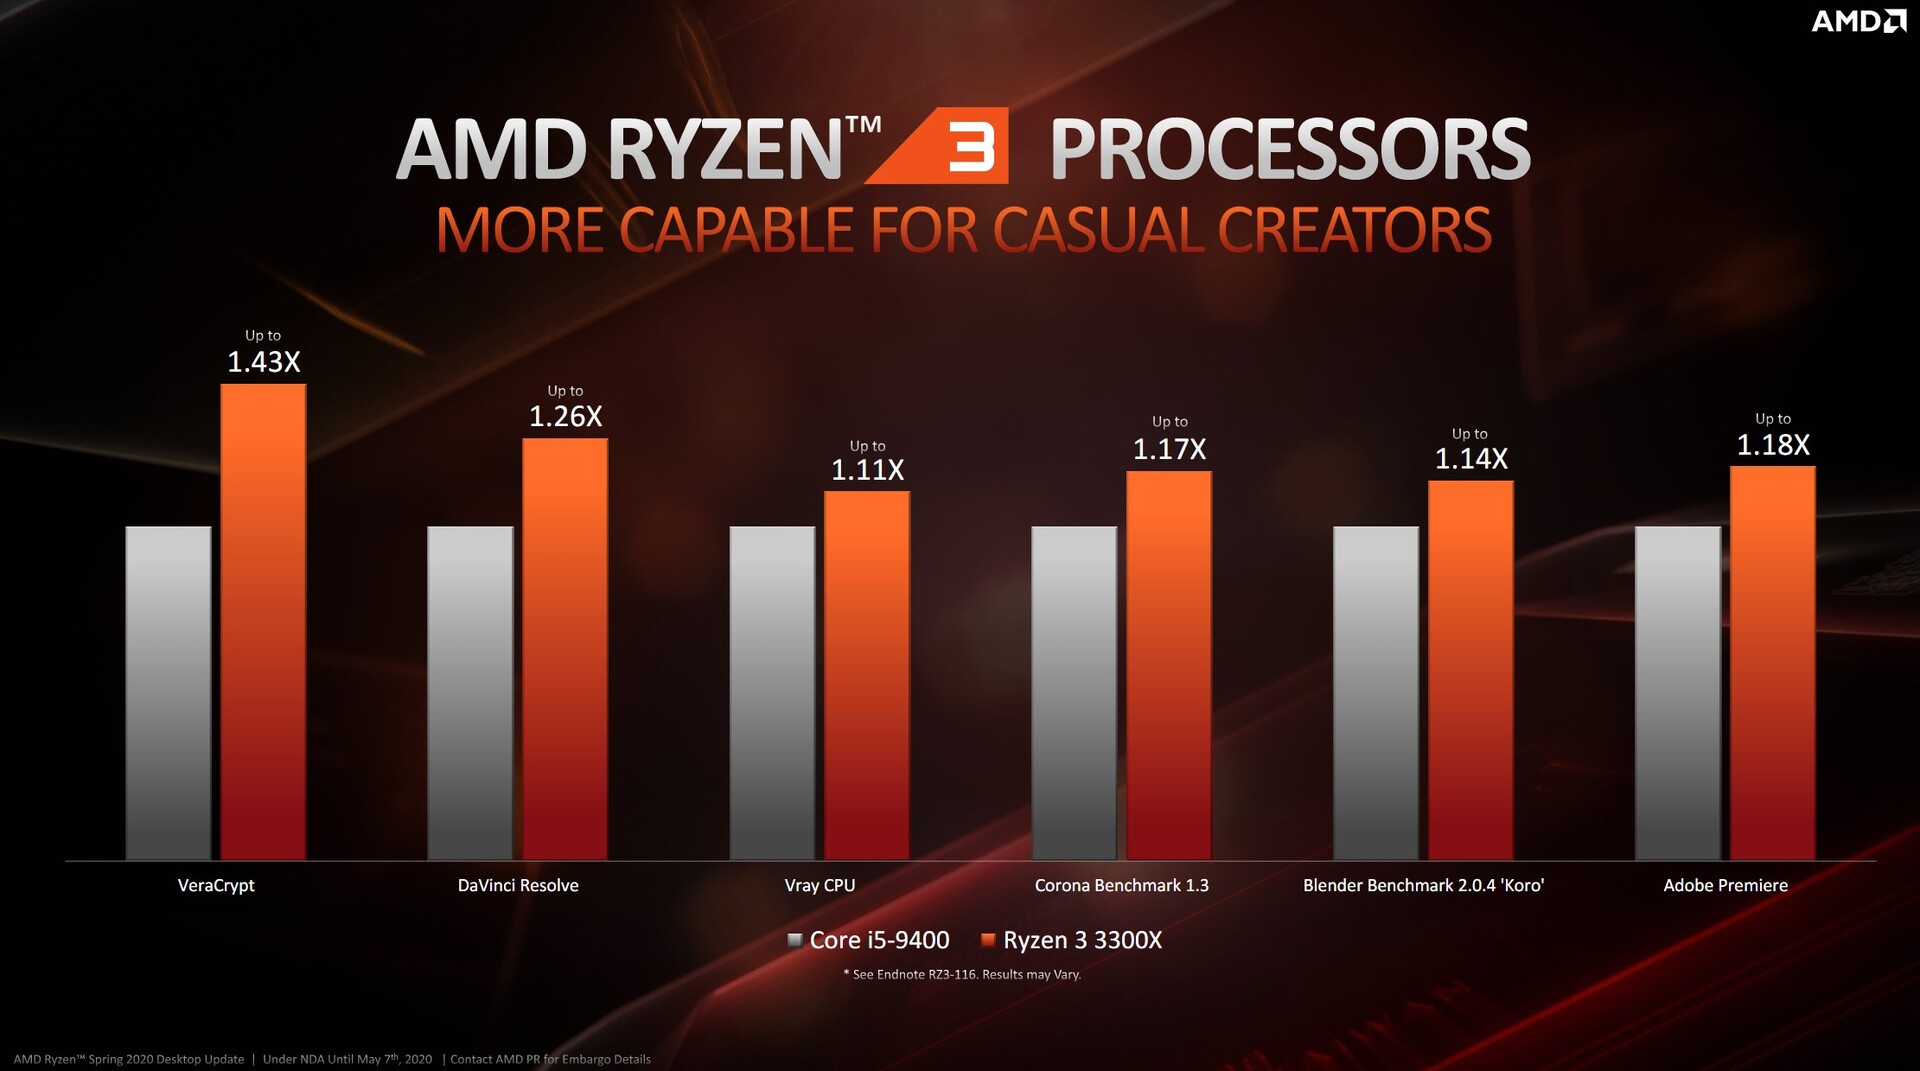
Wie schon erwähnt, nutzen beide Ryzen 3 vier Zen2-Kerne samt SMT (Simultaneous Multithreading). Dennoch gibt es klare Unterschiede beim Aufbau bzw. bei der Nutzung der nativen Kerne. Auf der von AMD bereitgestellten Grafik ist ersichtlich, dass der Ryzen 3 3100 zwei aktive CCX-Cluster besitzt bei denen jeweils zwei Kerne aktiv sind. Ein CCX-Cluster bietet maximal vier Kerne, so wie es beim Beispiel des Ryzen 3 3300X der Fall ist, denn dieser hat nur einen aktiven CCX-Cluster. Zudem unterscheiden sich die beiden Prozessoren in ihren Taktraten, was ebenfalls dazu beiträgt, die verschiedenen Leistungsklassen zu definieren. Bei beiden Prozessoren gibt AMD aber mit 65 Watt eine identische TDP an. Bezüglich Preis-Leistung hat AMD selbst ein Ranking erstellt, was uns dazu bewogen hat die direkten Kontrahenten (Intel Core i3-9100F und Intel Core i5-9400F) für diesen Test heranzuziehen.
Details zu unserem Testsystem - AMD vs. Intel
Für die folgenden Benchmarks und Tests nutzen wir folgendes System:
- Raijintek Pean Benchtable
- AMD Ryzen 3 3100 / AMD Ryzen 3 3300X
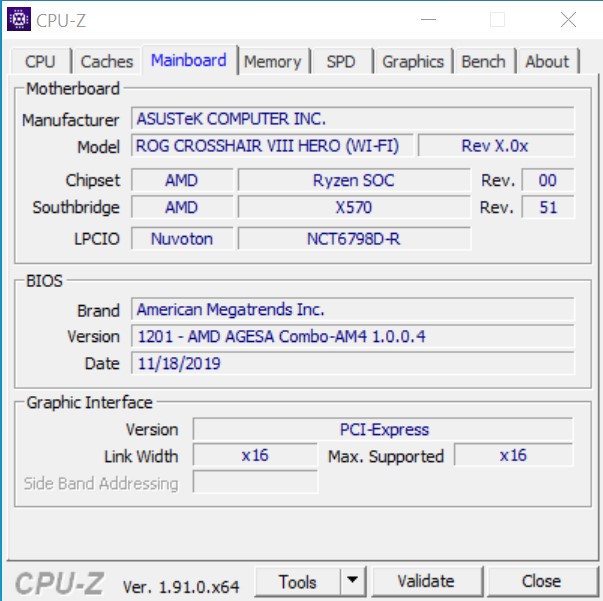
- Asus ROG Crosshair VIII Hero X570
- Intel Core i3-9100F / Intel Corei 5-9400F
- Asus ROG Stix Z390E-Gaming
- Alphacool Eisbear 280 AiO
- Nvidia Titan RTX
- Corsair RM 1000X Netzteil
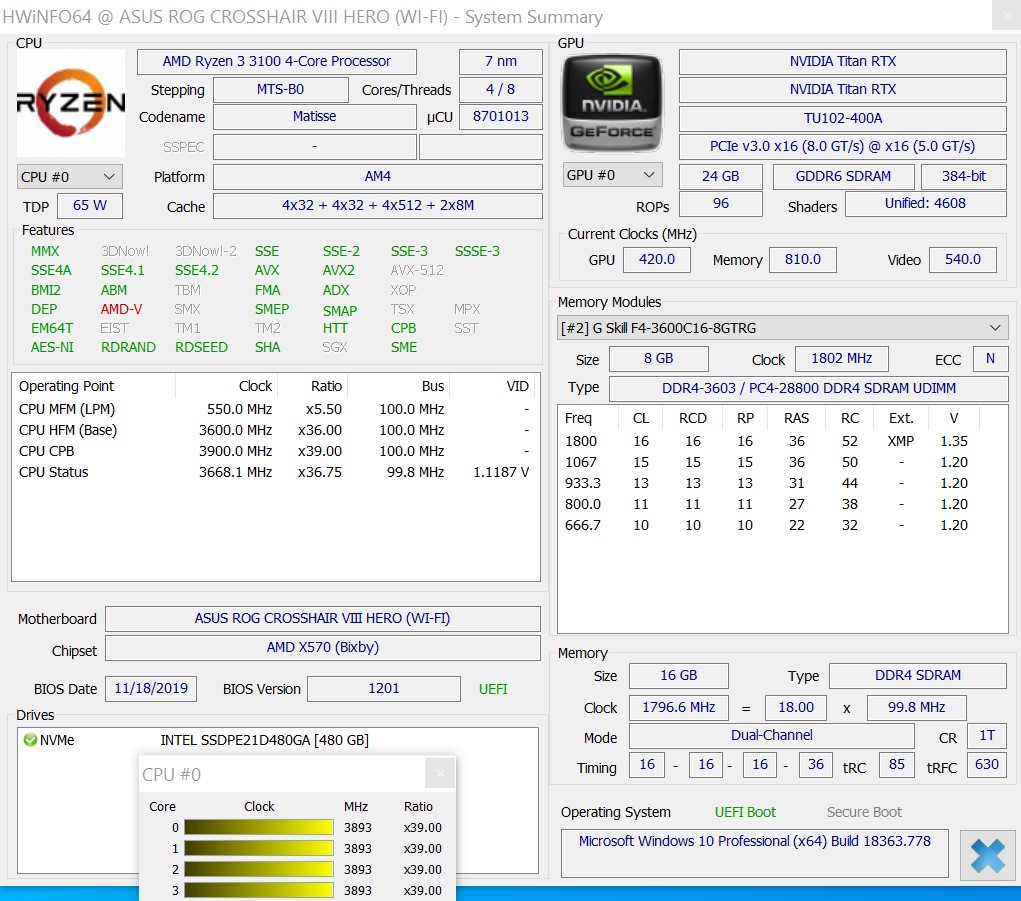
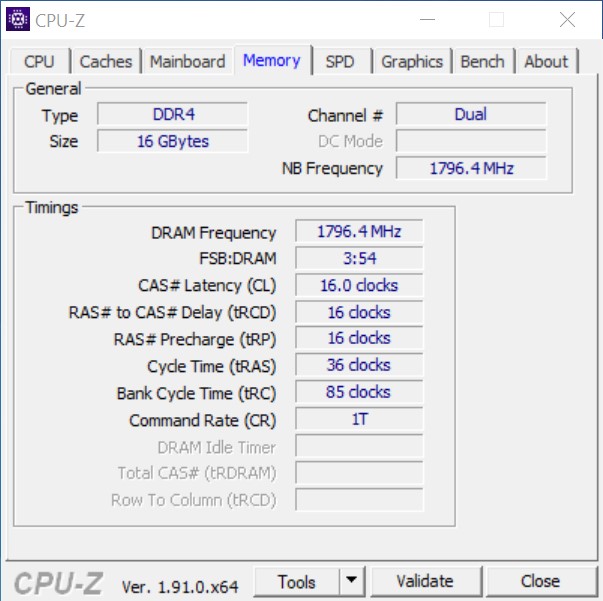
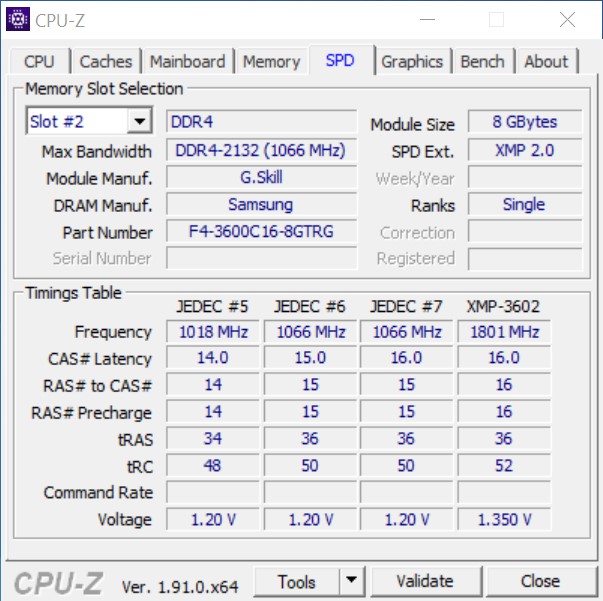
- G-Skill Trident Z Royal gold DDR4-3600 Speicherkit 2 x 8 GB, eingestellt auf DDR4-3600 CL16-16-16-36
- Intel Optane 905P 480GB PCIe-SSD
- Microsoft Windows 10 Professional 64-Bit (Version 1909)
Die für diesen Test zur Verfügung gestellten Komponenten wie Mainboard und der Arbeitsspeicher sowie die CPUs stammen direkt von AMD. Einen Dank geht an dieser Stelle auch an Asus für die Leihgabe des Z390 Mainboards, welche uns als Intel-Unterbau dient. Die Kühlung stammt von Alphacool welche wir ebenfalls schon ausführlich im Test hatten und das Gehäuse ist in Zusammenarbeit mit Caseking entstanden.
Prozessor-Benchmarks
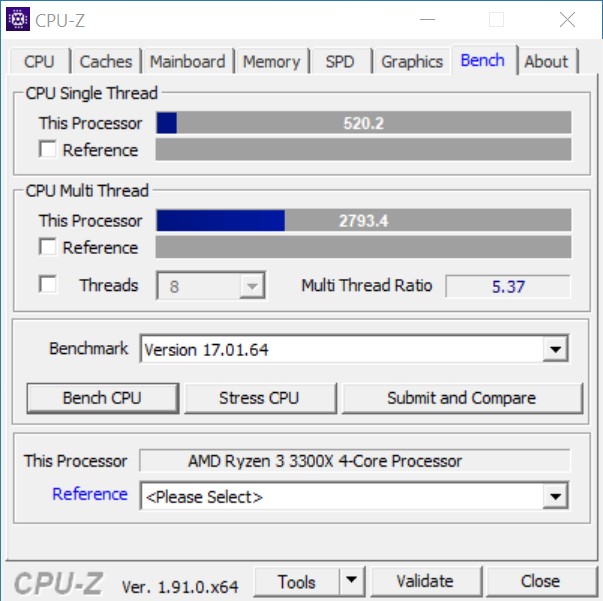
Beim Blick auf die reinen CPU-Benchmarks gibt der AMD Ryzen 3 3300X eindeutig den Ton an. Gleichwohl kann der Intel Core i5-9400F bei den Geekbench-Multi-Tests seine Stärken ausspielen und sich leicht vor den AMD Ryzen 3 3300X schieben. Hier scheinen sich die sechs physikalischen Rechenkerne des Intel Core i5 etwas auszuzahlen. Insgesamt kann sich der native Sechskerner gegen den AMD Ryzen 3 3300X nicht durchsetzen. Der Intel Core i3-9100F muss sich in fast allen Tests mit dem letzten Platz zufriedengeben. Hier zeigt sich eindeutig, dass ein Quad-Core-Prozessor ohne HT in modernen Systemen gnadenlos untergehen. Das unterstreicht einmal mehr den Schritt den AMD mit den neuen Ryzen 3 gemacht hat und dem auch Intel in naher Zukunft folgen wird.
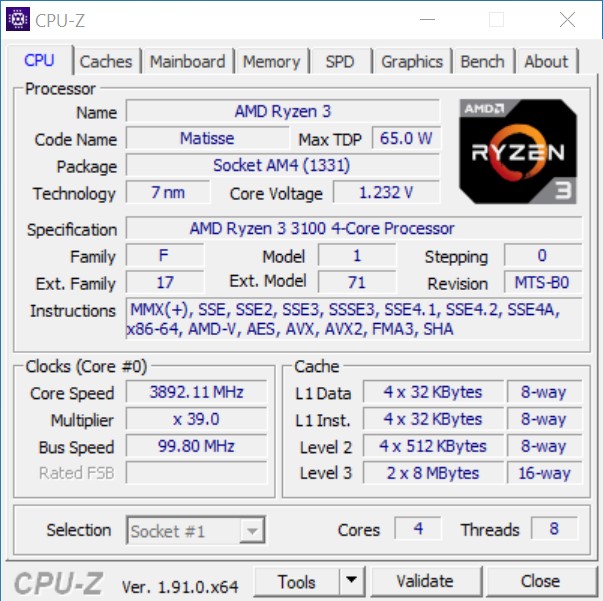
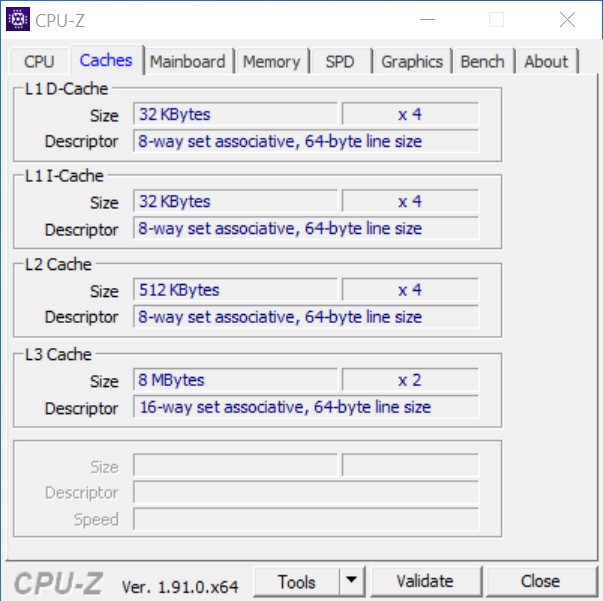
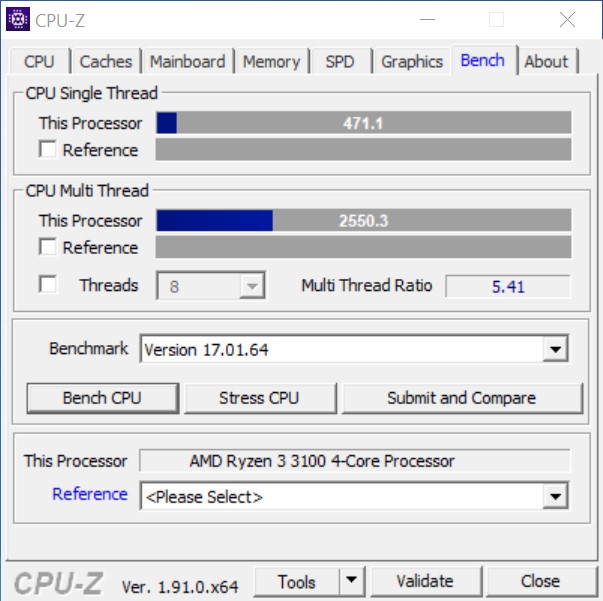
AMD Ryzen 3 3100


AMD Ryzen 3 3300X


| Performance Rating - Percent | |
| Durchschnittliche Intel Core i7-7740X | |
| AMD Ryzen 3 3300X | |
| Intel Core i5-9400F | |
| AMD Ryzen 3 3100 | |
| AMD Ryzen 5 1600 | |
| Intel Core i3-9100F | |
| Cinebench R10 | |
| Rendering Single CPUs 64Bit | |
| AMD Ryzen 3 3300X | |
| Durchschnittliche Intel Core i7-7740X (n=1) | |
| AMD Ryzen 3 3100 | |
| Intel Core i3-9100F | |
| Intel Core i5-9400F | |
| AMD Ryzen 5 1600 | |
| Rendering Multiple CPUs 64Bit | |
| AMD Ryzen 5 1600 | |
| AMD Ryzen 3 3300X | |
| Intel Core i5-9400F | |
| Durchschnittliche Intel Core i7-7740X (n=1) | |
| AMD Ryzen 3 3100 | |
| Intel Core i3-9100F | |
| Blender - v2.79 BMW27 CPU | |
| Intel Core i3-9100F | |
| AMD Ryzen 3 3100 | |
| Intel Core i5-9400F | |
| Durchschnittliche Intel Core i7-7740X (n=1) | |
| AMD Ryzen 3 3300X | |
| AMD Ryzen 5 1600 | |
| WinRAR - Result | |
| AMD Ryzen 3 3300X | |
| Durchschnittliche Intel Core i7-7740X (n=1) | |
| Intel Core i5-9400F | |
| AMD Ryzen 3 3100 | |
| AMD Ryzen 5 1600 | |
| Intel Core i3-9100F | |
| Geekbench 4.4 | |
| 64 Bit Single-Core Score | |
| Durchschnittliche Intel Core i7-7740X (n=1) | |
| AMD Ryzen 3 3300X | |
| Intel Core i5-9400F | |
| Intel Core i3-9100F | |
| AMD Ryzen 3 3100 | |
| AMD Ryzen 5 1600 | |
| 64 Bit Multi-Core Score | |
| Intel Core i5-9400F | |
| AMD Ryzen 5 1600 | |
| AMD Ryzen 3 3300X | |
| Durchschnittliche Intel Core i7-7740X (n=1) | |
| AMD Ryzen 3 3100 | |
| Intel Core i3-9100F | |
| 3DMark 11 - 1280x720 Performance Physics | |
| AMD Ryzen 3 3300X | |
| Durchschnittliche Intel Core i7-7740X (12196 - 12488, n=6) | |
| AMD Ryzen 5 1600 | |
| Intel Core i5-9400F | |
| AMD Ryzen 3 3100 | |
| Intel Core i3-9100F | |
| HWBOT x265 Benchmark v2.2 - 4k Preset | |
| Intel Core i5-9400F | |
| Durchschnittliche Intel Core i7-7740X (n=1) | |
| AMD Ryzen 3 3300X | |
| AMD Ryzen 3 3100 | |
| AMD Ryzen 5 1600 | |
| Intel Core i3-9100F | |
| R Benchmark 2.5 - Overall mean | |
| Intel Core i5-9400F | |
| Intel Core i3-9100F | |
| AMD Ryzen 5 1600 | |
| AMD Ryzen 3 3100 | |
| Durchschnittliche Intel Core i7-7740X (n=1) | |
| AMD Ryzen 3 3300X | |
| LibreOffice - 20 Documents To PDF | |
| AMD Ryzen 5 1600 | |
| Intel Core i3-9100F | |
| AMD Ryzen 3 3100 | |
| Intel Core i5-9400F | |
| Durchschnittliche Intel Core i7-7740X (n=1) | |
| AMD Ryzen 3 3300X | |
| WebXPRT 3 - Overall | |
| Durchschnittliche Intel Core i7-7740X (247 - 265, n=2) | |
| AMD Ryzen 3 3300X | |
| Intel Core i5-9400F | |
| AMD Ryzen 3 3100 | |
| Intel Core i3-9100F | |
| AMD Ryzen 5 1600 | |
| Mozilla Kraken 1.1 - Total | |
| AMD Ryzen 5 1600 | |
| Intel Core i5-9400F | |
| Intel Core i3-9100F | |
| AMD Ryzen 3 3100 | |
| Durchschnittliche Intel Core i7-7740X (n=1) | |
| AMD Ryzen 3 3300X | |
* ... kleinere Werte sind besser
Die Probanden in der Cinebench-R15-Multi-Schleife
Beim Belastungstest mit der Cinebench-R15-Multi-Schleife sorgt die schon fast überdimensionierte AiO dafür, dass alle Messwerte stabil bleiben. Hier im Test können sich beide Ryzen 3 Modelle sogar vor der Konkurrenz aus dem Hause Intel schieben. Selbst der Core i5-9400F muss sich mit seinen sechs Kernen dem kleinen Ryzen 3 3100 mit nur vier geschlagen geben. Der neu aufgelegte Ryzen 5 1600 (in 12 nm) führt das Feld dank seiner sechs Kerne inklusive SMT klar an.
Anwendungsleistung
Im Alltag performen alle Systeme gut und arbeiten sehr flott. Doch im Detail zeigen sich dann doch die kleinen Feinheiten, welche die Zen2-Platform zu bieten hat. Im Vergleich zum beliebten AMD Ryzen 5 1600, welcher mit Zen+ ein Revival erleben durfte, können sich die neuen Zen2-Prozessoren deutlich absetzen. Auch Intel geriet aufgrund der Neuerungen von AMD immer mehr unter Druck. Mit Comet Lake-S stehen aber schon die Nachfolger der Coffee-Lake-R-CPUs in den Startlöchern.
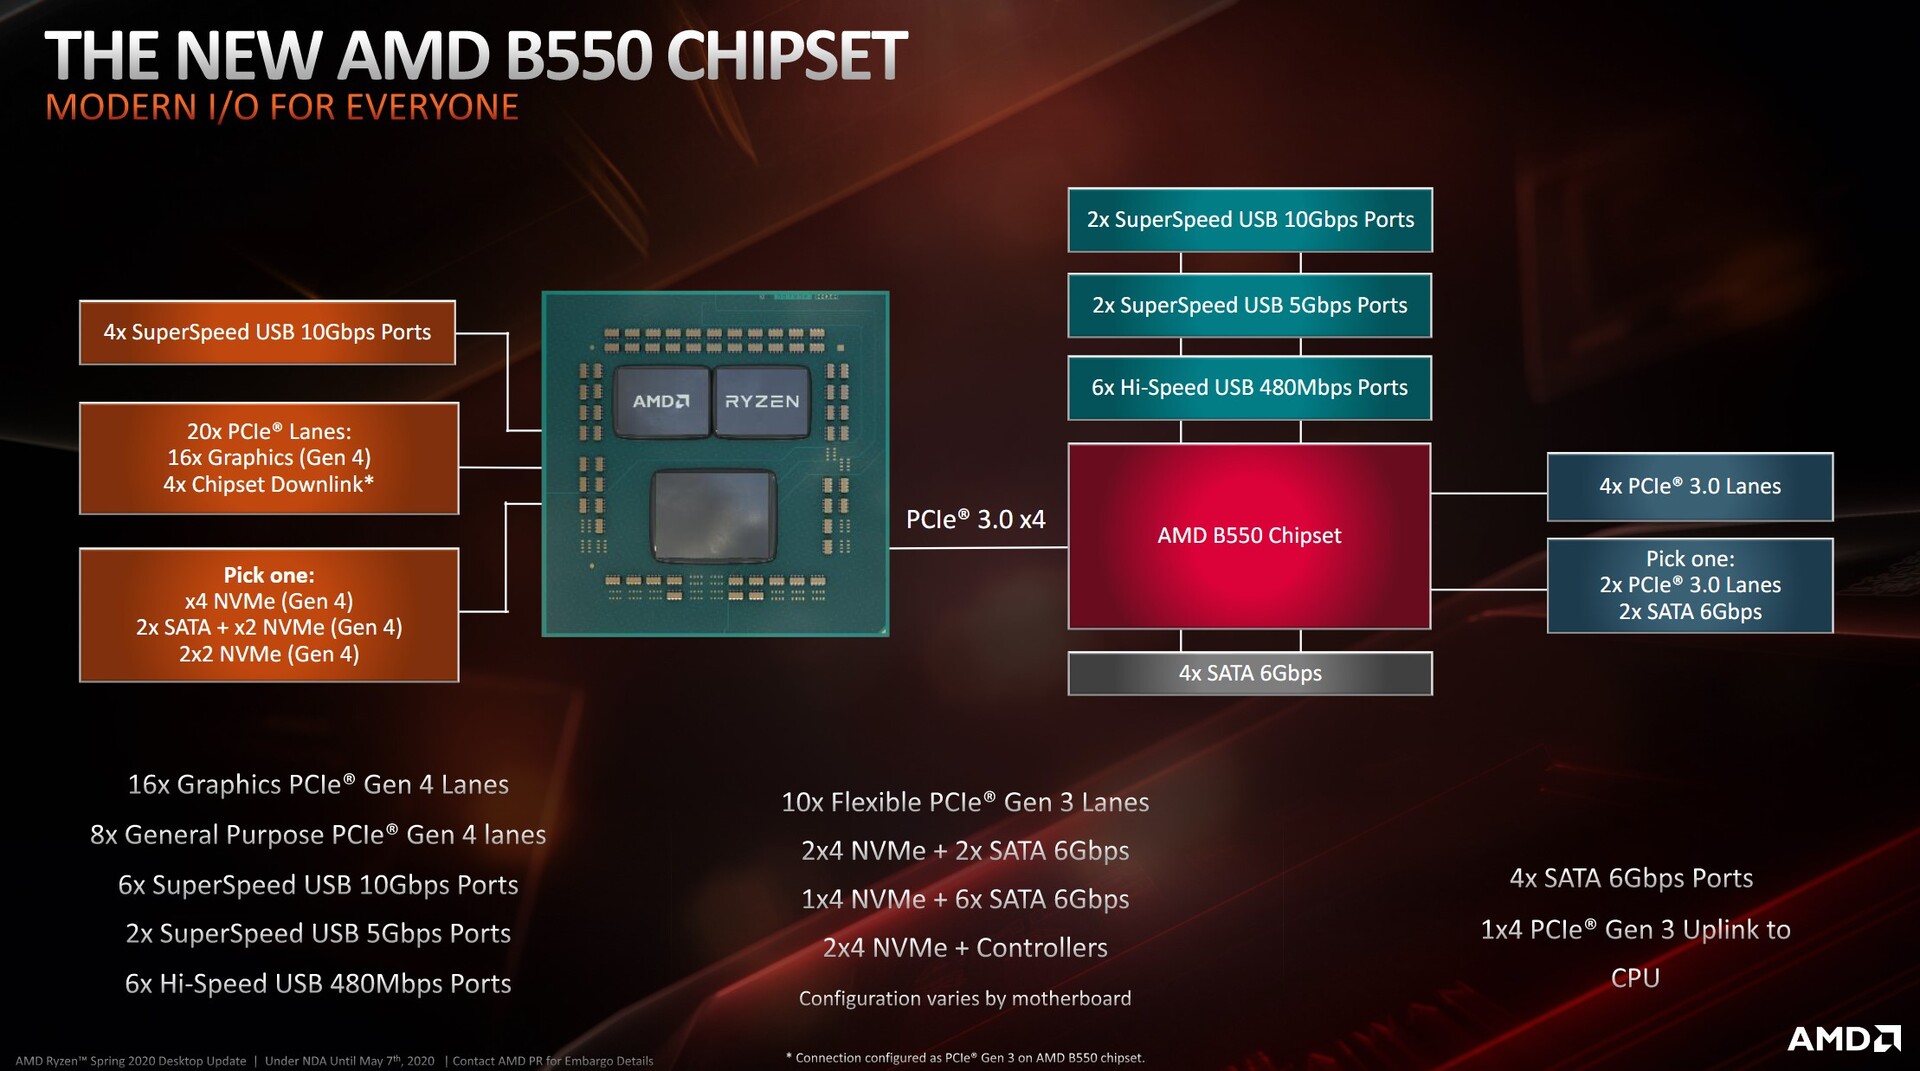
Als unschlagbares Kaufargument kann AMD noch immer mit PCI-Express 4.0 punkten, denn Intel bietet auch bei Comet Lake-S keine Unterstützung an. Auch neue B550-Chipsatz sorgt dafür, dass auch preiswerte Systeme nicht auf den neuen Standard verzichten müssen.
| PCMark 10 - Score | |
| AMD Ryzen 3 3300X | |
| Intel Core i5-9400F | |
| AMD Ryzen 3 3100 | |
| Intel Core i3-9100F | |
| AMD Ryzen 5 1600 | |
| PCMark 8 | |
| Work Score Accelerated v2 | |
| AMD Ryzen 3 3300X | |
| Intel Core i3-9100F | |
| Intel Core i5-9400F | |
| AMD Ryzen 3 3100 | |
| AMD Ryzen 5 1600 | |
| Creative Score Accelerated v2 | |
| AMD Ryzen 3 3300X | |
| Intel Core i5-9400F | |
| AMD Ryzen 3 3100 | |
| Intel Core i3-9100F | |
| AMD Ryzen 5 1600 | |
| Home Score Accelerated v2 | |
| AMD Ryzen 3 3300X | |
| Intel Core i5-9400F | |
| Intel Core i3-9100F | |
| AMD Ryzen 3 3100 | |
| AMD Ryzen 5 1600 | |
| Performance Rating - Percent | |
| AMD Ryzen 3 3300X | |
| Intel Core i5-9400F | |
| AMD Ryzen 5 1600 | |
| AMD Ryzen 3 3100 | |
| Intel Core i3-9100F | |
| 3DMark 11 | |
| 1280x720 Performance | |
| AMD Ryzen 3 3300X | |
| Intel Core i5-9400F | |
| AMD Ryzen 5 1600 | |
| AMD Ryzen 3 3100 | |
| Intel Core i3-9100F | |
| 1280x720 Performance GPU | |
| Intel Core i3-9100F | |
| Intel Core i5-9400F | |
| AMD Ryzen 3 3300X | |
| AMD Ryzen 5 1600 | |
| AMD Ryzen 3 3100 | |
| 3DMark | |
| 1920x1080 Fire Strike Score | |
| AMD Ryzen 3 3300X | |
| Intel Core i5-9400F | |
| AMD Ryzen 5 1600 | |
| AMD Ryzen 3 3100 | |
| Intel Core i3-9100F | |
| 1920x1080 Fire Strike Graphics | |
| Intel Core i3-9100F | |
| Intel Core i5-9400F | |
| AMD Ryzen 3 3100 | |
| AMD Ryzen 3 3300X | |
| AMD Ryzen 5 1600 | |
| 3840x2160 Fire Strike Ultra Score | |
| AMD Ryzen 3 3300X | |
| Intel Core i5-9400F | |
| AMD Ryzen 5 1600 | |
| AMD Ryzen 3 3100 | |
| Intel Core i3-9100F | |
| 2560x1440 Time Spy Graphics | |
| Intel Core i5-9400F | |
| AMD Ryzen 3 3300X | |
| Intel Core i3-9100F | |
| AMD Ryzen 5 1600 | |
| AMD Ryzen 3 3100 | |
| 2560x1440 Time Spy Score | |
| Intel Core i5-9400F | |
| AMD Ryzen 5 1600 | |
| AMD Ryzen 3 3300X | |
| AMD Ryzen 3 3100 | |
| Intel Core i3-9100F | |
Die neuen Ryzen-CPUs im Spieletest
Anders als bei den reinen CPU-Benchmarks zeigt sich, dass bei den durchgeführten Spieletests AMD hier nicht so überlegen ist. Intel ist mit dem älteren Core i3 und Core i5 ebenfalls gut aufgestellt und speziell der Intel Core i5-9400F konnte in Spieletests die höchsten Frameraten erzeugen. In höheren Auflösungen schrumpft der Leistungsvorsprung, da hier mehr und mehr die Grafikkarte zum entscheidenden Faktor wird. Deutlich erkennbar ist aber, dass die neuere Zen2-Architektur gegenüber Zen+ einen deutlichen Leistungsvorteil mit sich bringt. Der Ryzen 5 1600 bietet ebenso wie der Core i5-9400F sechs Kerne. Aufgrund der geringeren IPC ist der Ryzen 5 fast immer auf dem letzten Platz zu finden.
| Performance Rating - Percent | |
| Intel Core i5 9400F | |
| AMD Ryzen 3 3300X | |
| Intel Core i3 9100F | |
| AMD Ryzen 3 3100 | |
| AMD Ryzen 5 1600 (12nm) | |
| Borderlands 3 | |
| 1280x720 Very Low Overall Quality (DX11) | |
| Intel Core i5 9400F | |
| AMD Ryzen 3 3300X | |
| Intel Core i3 9100F | |
| AMD Ryzen 3 3100 | |
| AMD Ryzen 5 1600 (12nm) | |
| 1920x1080 Badass Overall Quality (DX11) | |
| Intel Core i5 9400F | |
| AMD Ryzen 3 3300X | |
| Intel Core i3 9100F | |
| AMD Ryzen 3 3100 | |
| AMD Ryzen 5 1600 (12nm) | |
| Metro Exodus | |
| 1280x720 Low Quality AF:4x | |
| Intel Core i5 9400F | |
| AMD Ryzen 3 3300X | |
| AMD Ryzen 3 3100 | |
| AMD Ryzen 5 1600 (12nm) | |
| Intel Core i3 9100F | |
| 1920x1080 Ultra Quality AF:16x | |
| Intel Core i5 9400F | |
| AMD Ryzen 3 3300X | |
| AMD Ryzen 3 3100 | |
| AMD Ryzen 5 1600 (12nm) | |
| Intel Core i3 9100F | |
| Far Cry New Dawn | |
| 1280x720 Low Preset | |
| Intel Core i5 9400F | |
| AMD Ryzen 3 3300X | |
| Intel Core i3 9100F | |
| AMD Ryzen 5 1600 (12nm) | |
| AMD Ryzen 3 3100 | |
| 1920x1080 Ultra Preset | |
| Intel Core i5 9400F | |
| Intel Core i3 9100F | |
| AMD Ryzen 3 3300X | |
| AMD Ryzen 3 3100 | |
| AMD Ryzen 5 1600 (12nm) | |
| Forza Horizon 4 | |
| 1280x720 Very Low Preset | |
| Intel Core i5 9400F | |
| AMD Ryzen 3 3300X | |
| Intel Core i3 9100F | |
| AMD Ryzen 3 3100 | |
| AMD Ryzen 5 1600 (12nm) | |
| 1920x1080 Ultra Preset AA:2xMS | |
| Intel Core i5 9400F | |
| AMD Ryzen 3 3300X | |
| Intel Core i3 9100F | |
| AMD Ryzen 3 3100 | |
| AMD Ryzen 5 1600 (12nm) | |
| Shadow of the Tomb Raider | |
| 1280x720 Lowest Preset | |
| Intel Core i5 9400F | |
| AMD Ryzen 3 3300X | |
| Intel Core i3 9100F | |
| AMD Ryzen 3 3100 | |
| AMD Ryzen 5 1600 (12nm) | |
| 1920x1080 Highest Preset AA:T | |
| Intel Core i5 9400F | |
| AMD Ryzen 3 3300X | |
| AMD Ryzen 3 3100 | |
| AMD Ryzen 5 1600 (12nm) | |
| Intel Core i3 9100F | |
| Far Cry 5 | |
| 1280x720 Low Preset AA:T | |
| AMD Ryzen 3 3300X | |
| Intel Core i5 9400F | |
| AMD Ryzen 3 3100 | |
| AMD Ryzen 5 1600 (12nm) | |
| Intel Core i3 9100F | |
| 1920x1080 Ultra Preset AA:T | |
| Intel Core i5 9400F | |
| AMD Ryzen 3 3300X | |
| AMD Ryzen 3 3100 | |
| AMD Ryzen 5 1600 (12nm) | |
| Intel Core i3 9100F | |
| X-Plane 11.11 | |
| 1280x720 low (fps_test=1) | |
| Intel Core i5 9400F | |
| AMD Ryzen 3 3300X | |
| Intel Core i3 9100F | |
| AMD Ryzen 3 3100 | |
| AMD Ryzen 5 1600 (12nm) | |
| 1920x1080 high (fps_test=3) | |
| Intel Core i5 9400F | |
| AMD Ryzen 3 3300X | |
| Intel Core i3 9100F | |
| AMD Ryzen 3 3100 | |
| AMD Ryzen 5 1600 (12nm) | |
| Final Fantasy XV Benchmark | |
| 1280x720 Lite Quality | |
| Intel Core i5 9400F | |
| AMD Ryzen 3 3300X | |
| AMD Ryzen 3 3100 | |
| AMD Ryzen 5 1600 (12nm) | |
| Intel Core i3 9100F | |
| 1920x1080 High Quality | |
| Intel Core i5 9400F | |
| AMD Ryzen 3 3300X | |
| AMD Ryzen 5 1600 (12nm) | |
| AMD Ryzen 3 3100 | |
| Intel Core i3 9100F | |
| Dota 2 Reborn | |
| 1280x720 min (0/3) fastest | |
| Intel Core i5 9400F | |
| Intel Core i3 9100F | |
| AMD Ryzen 3 3300X | |
| AMD Ryzen 5 1600 (12nm) | |
| AMD Ryzen 3 3100 | |
| 1920x1080 ultra (3/3) best looking | |
| Intel Core i5 9400F | |
| Intel Core i3 9100F | |
| AMD Ryzen 3 3300X | |
| AMD Ryzen 5 1600 (12nm) | |
| AMD Ryzen 3 3100 | |
| The Witcher 3 | |
| 1024x768 Low Graphics & Postprocessing | |
| Intel Core i5 9400F | |
| AMD Ryzen 3 3300X | |
| AMD Ryzen 5 1600 (12nm) | |
| AMD Ryzen 3 3100 | |
| Intel Core i3 9100F | |
| 1920x1080 Ultra Graphics & Postprocessing (HBAO+) | |
| Intel Core i5 9400F | |
| AMD Ryzen 5 1600 (12nm) | |
| AMD Ryzen 3 3300X | |
| Intel Core i3 9100F | |
| AMD Ryzen 3 3100 | |
Energieverbrauch - wie sparsam sind die neuen 4-Kerner
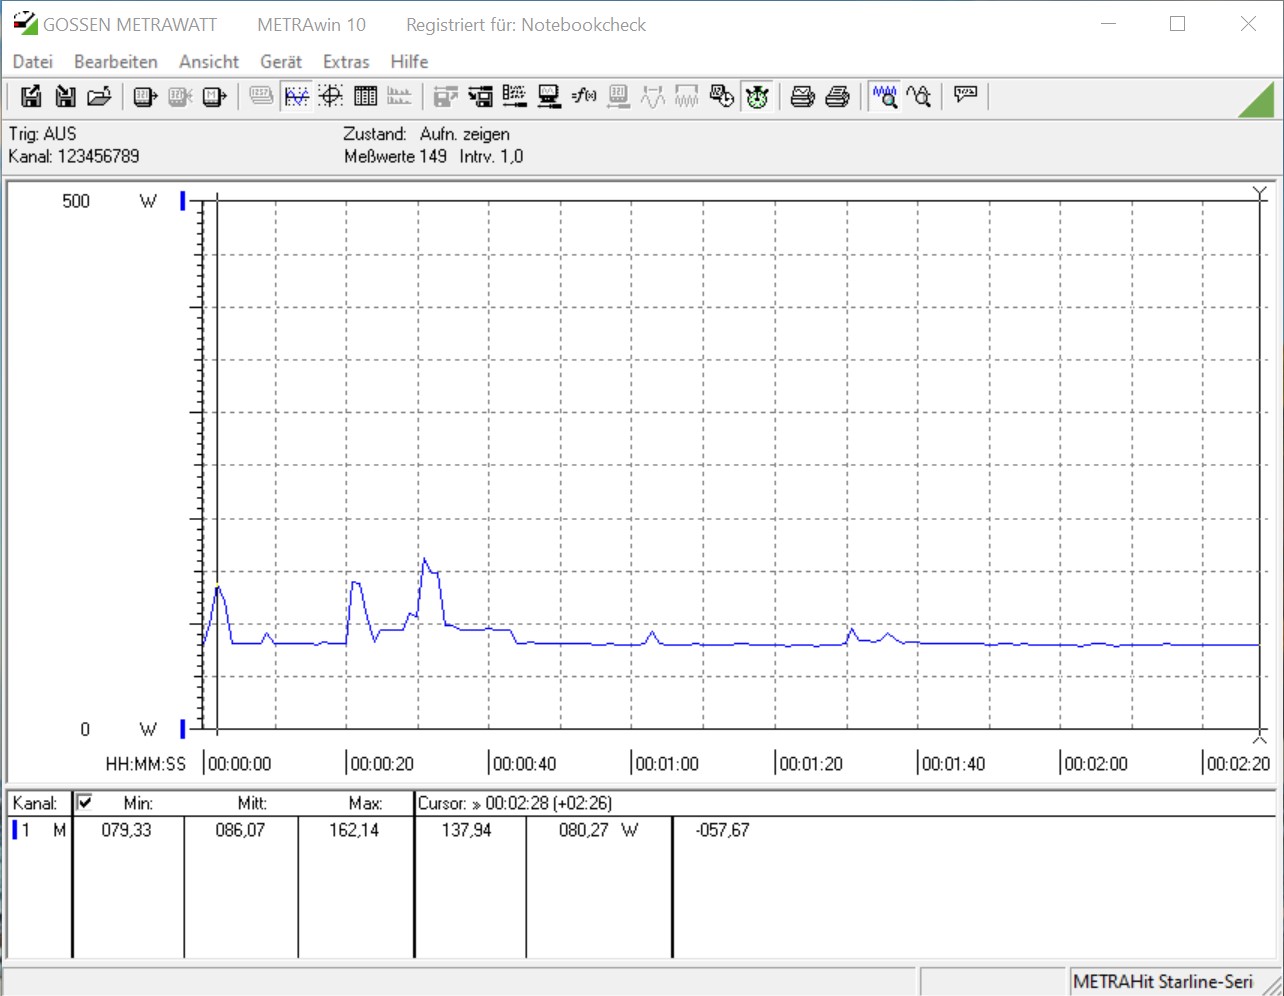
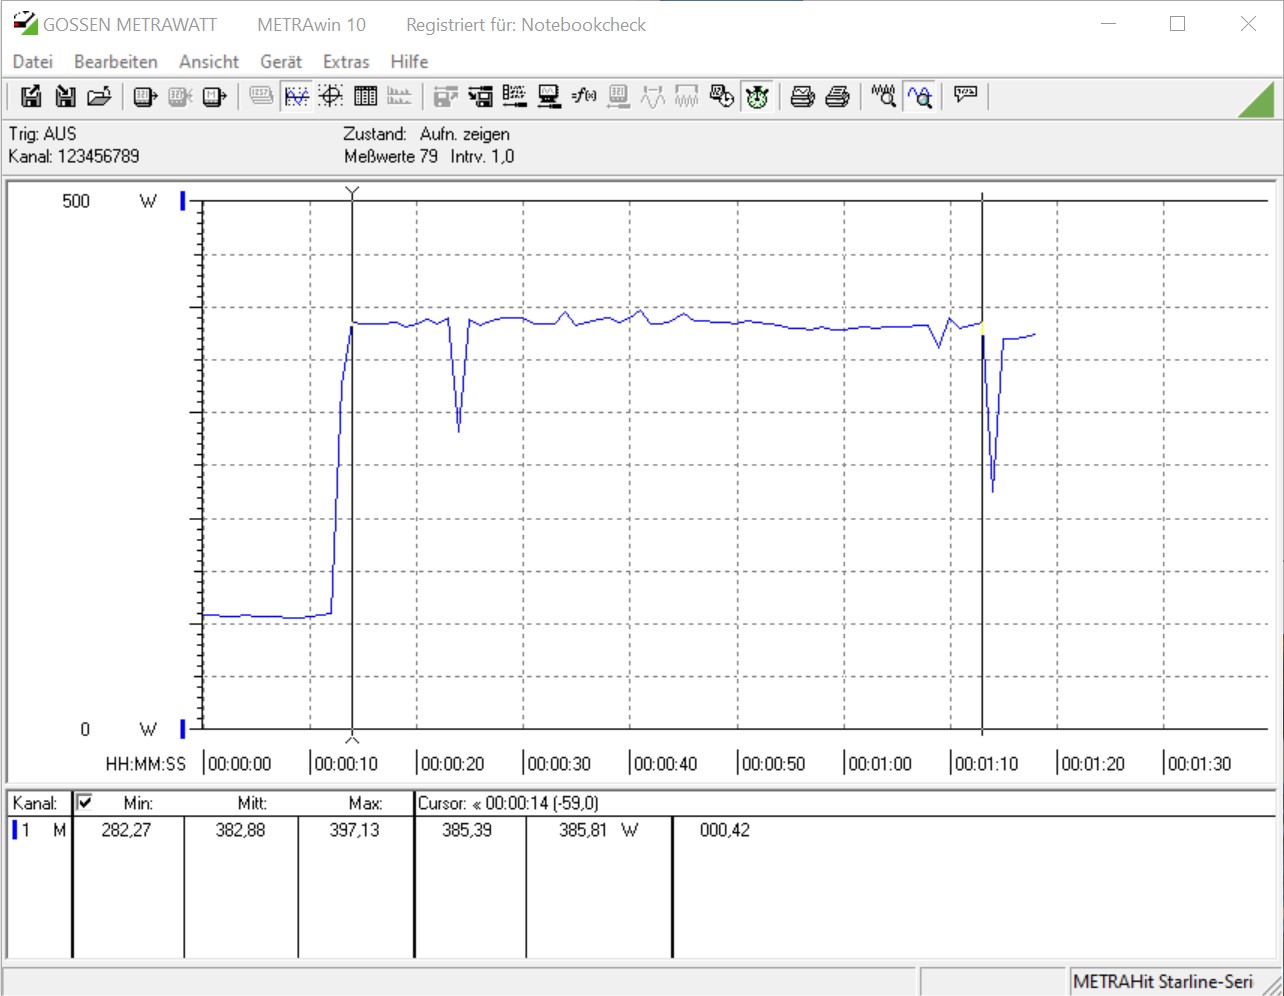
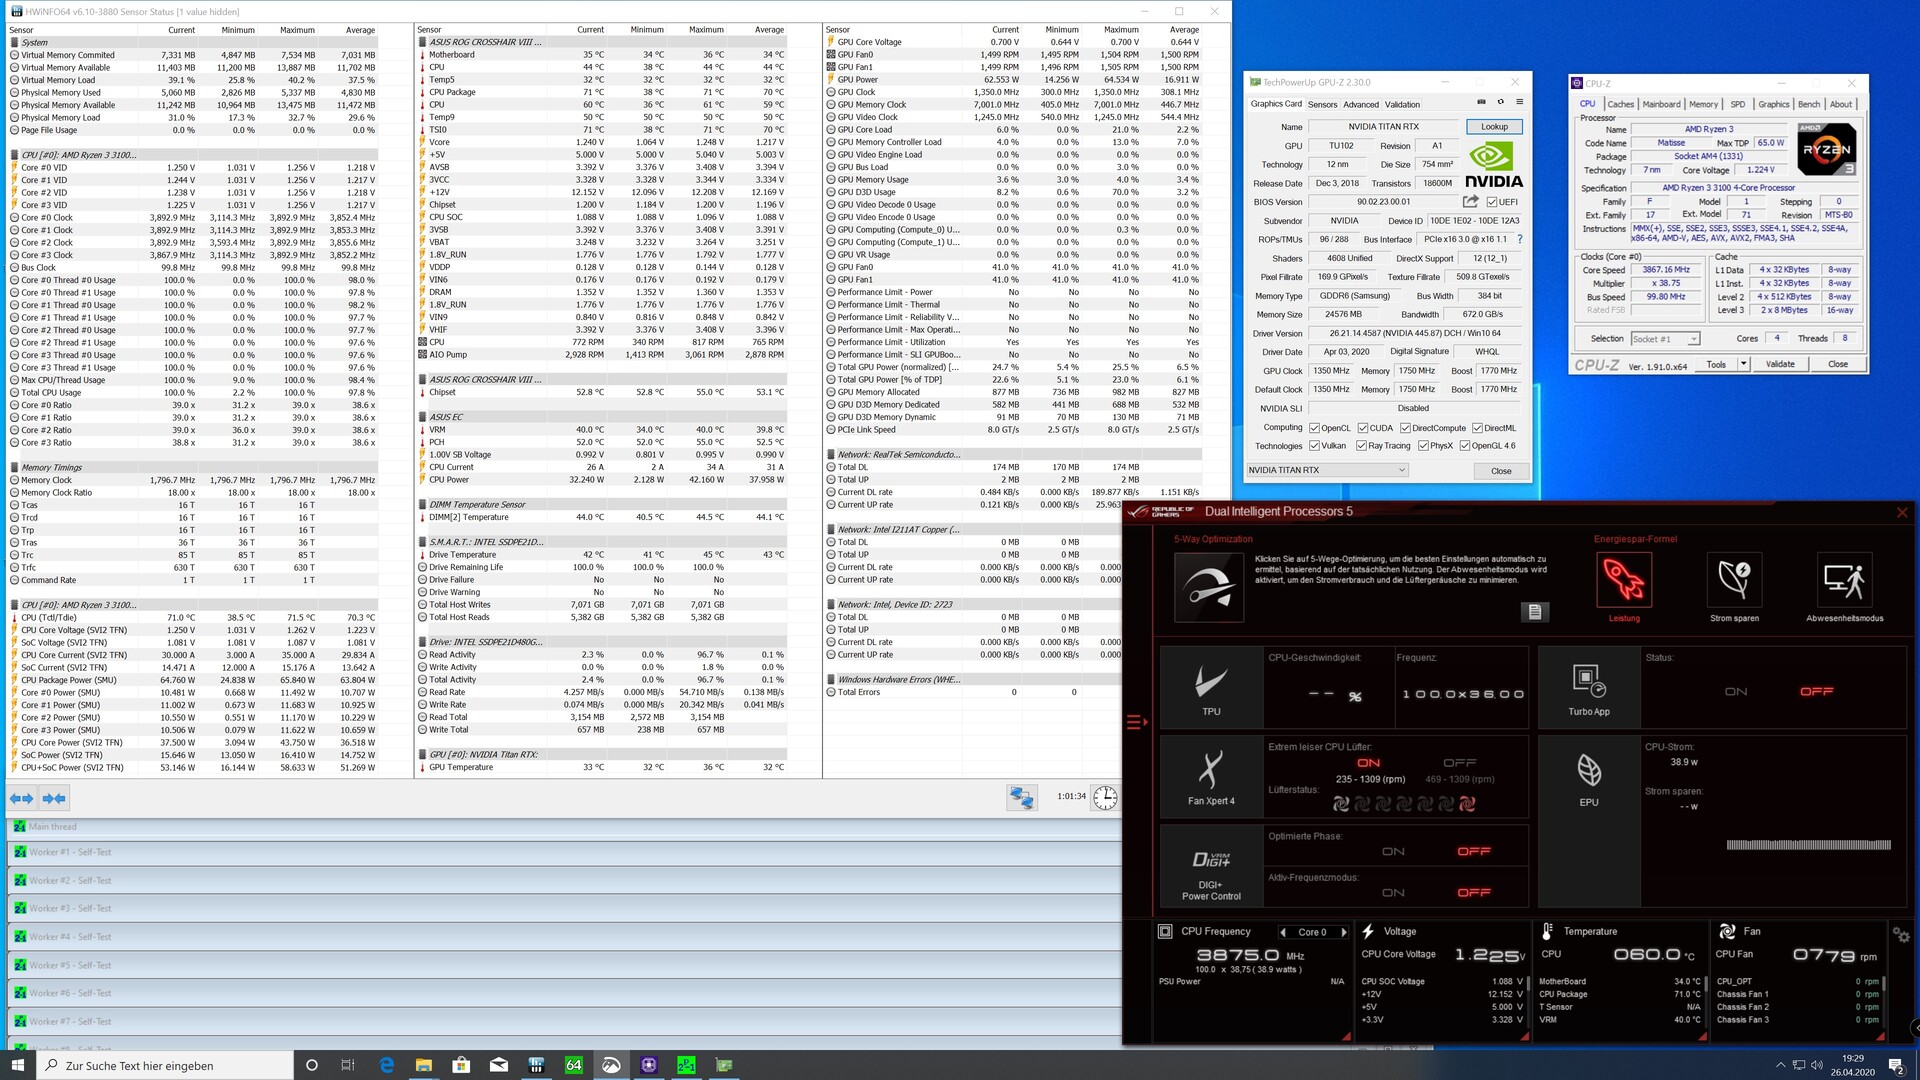
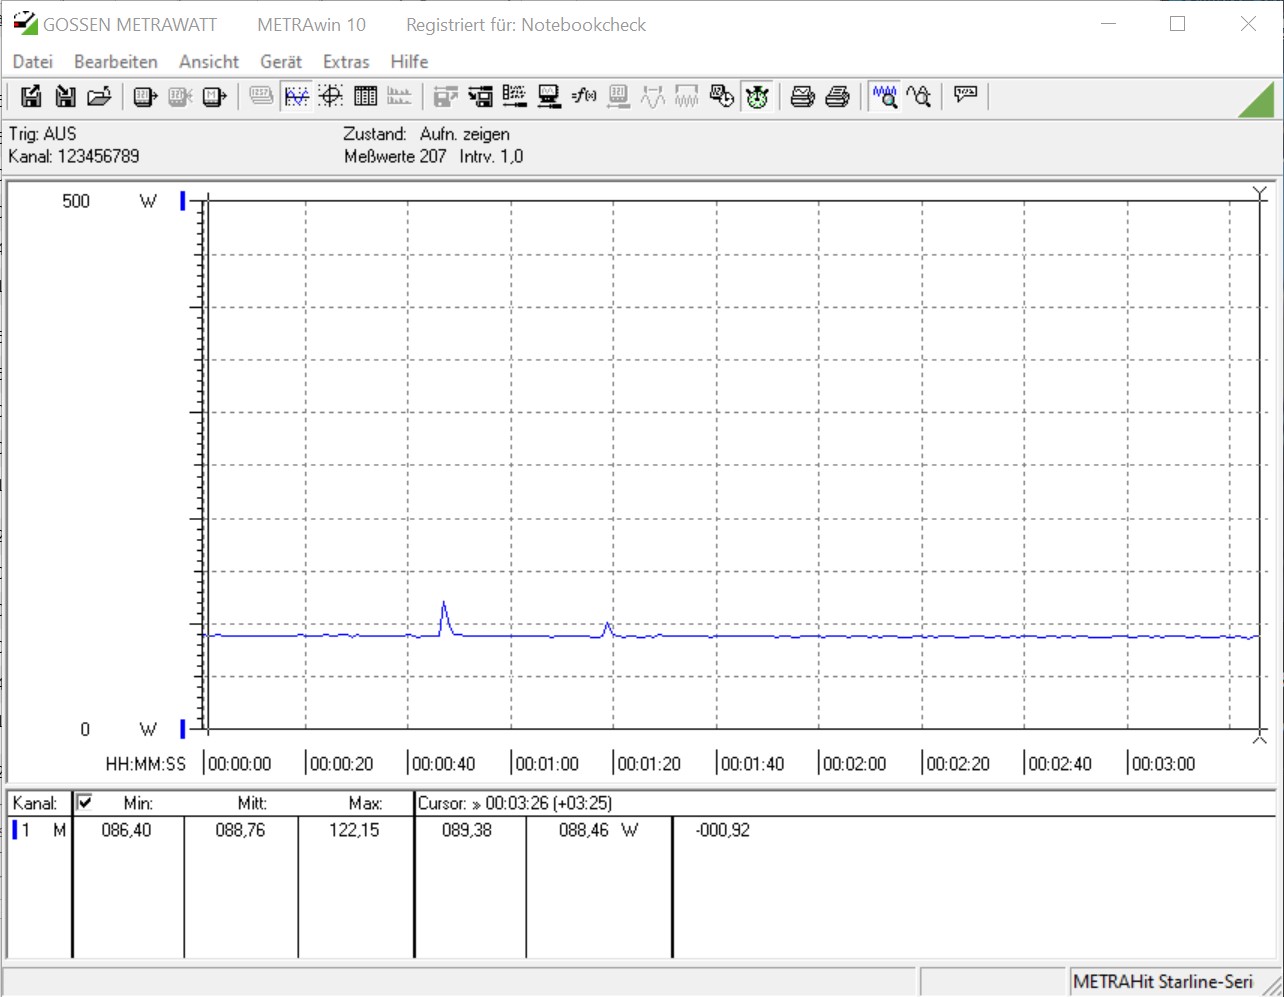
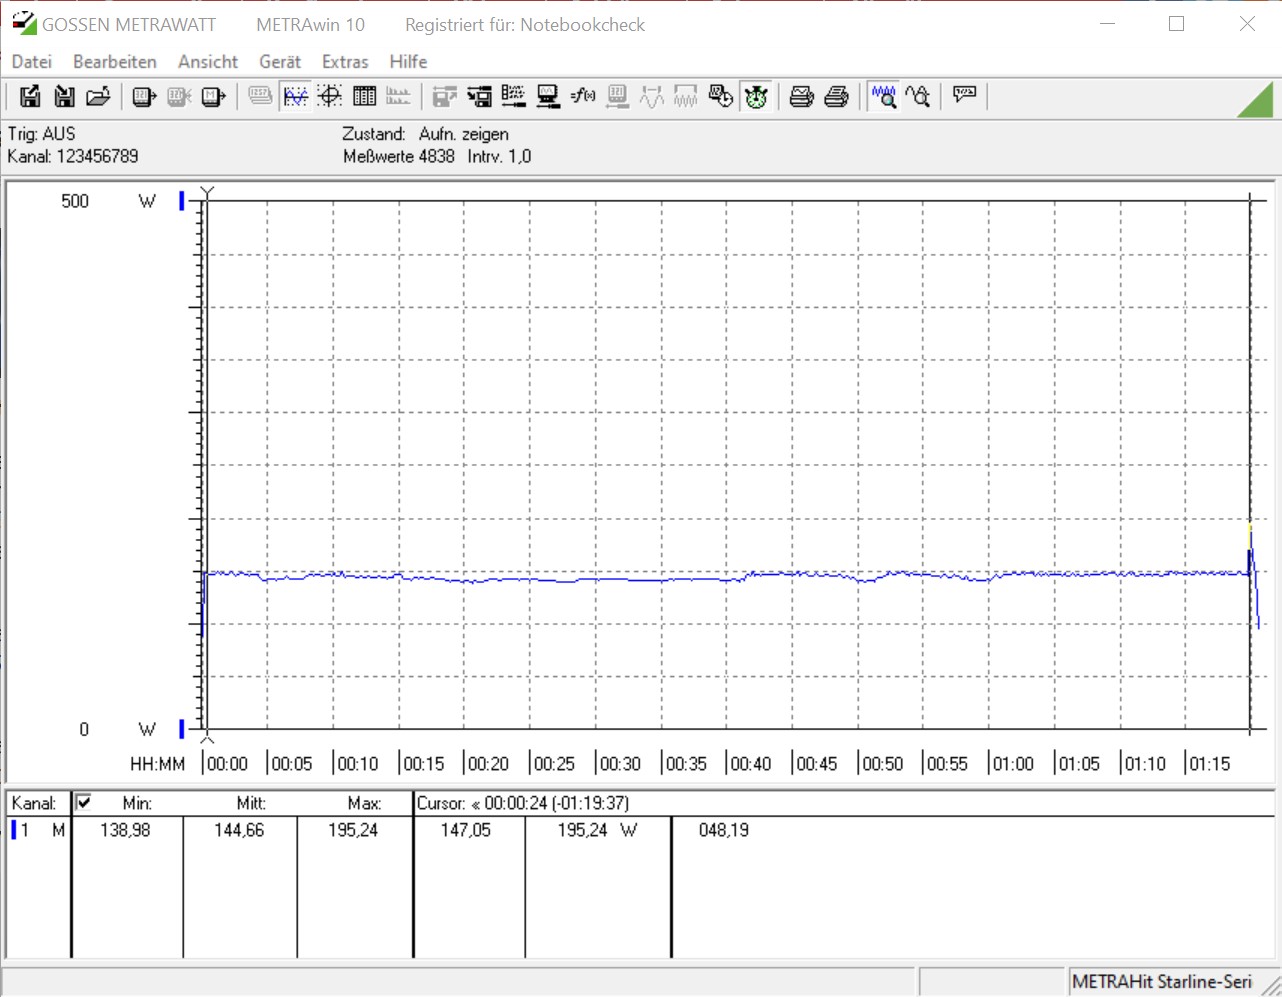
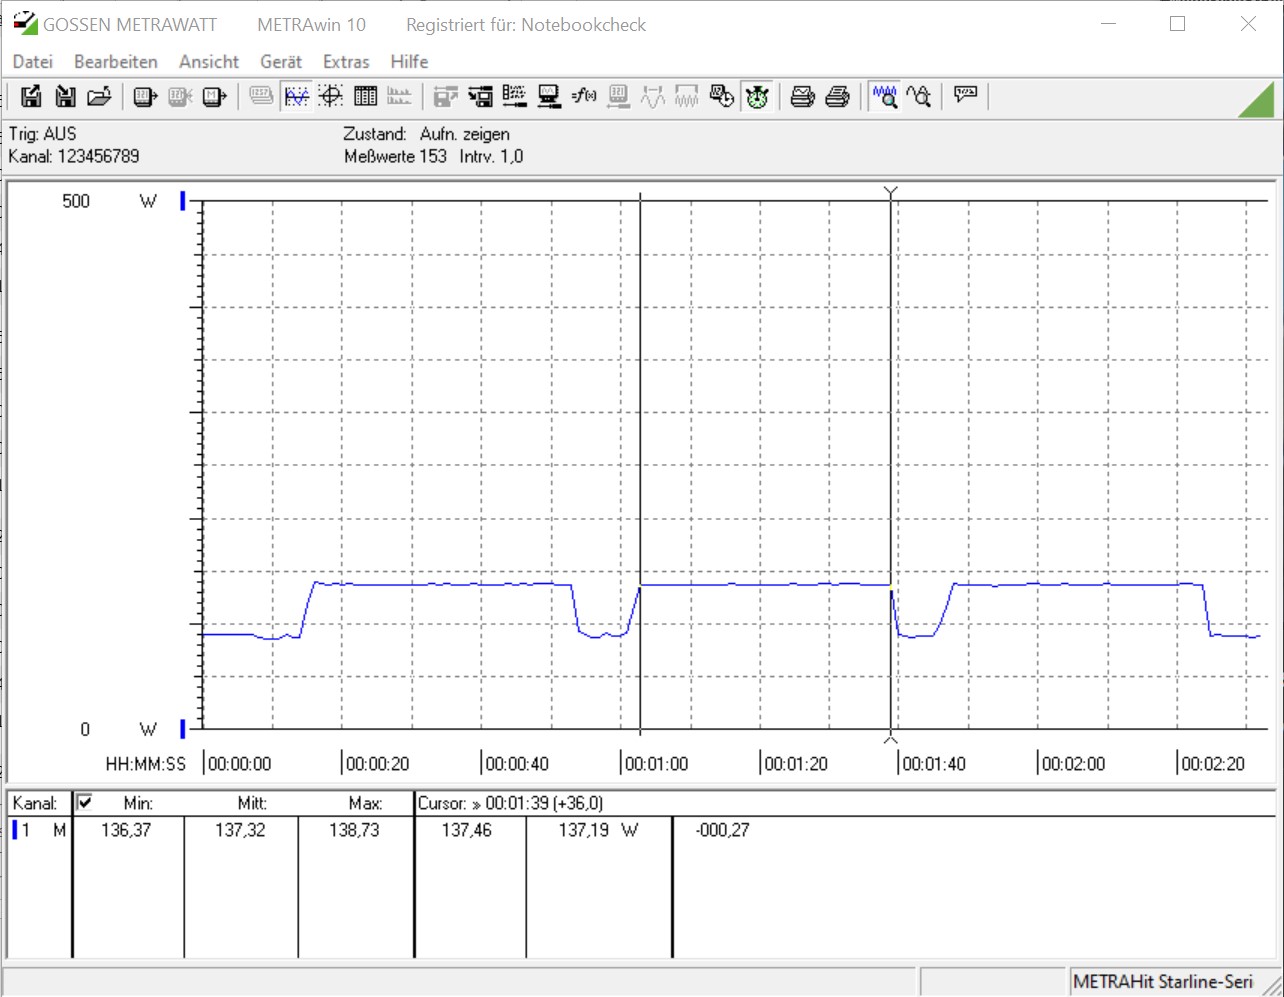
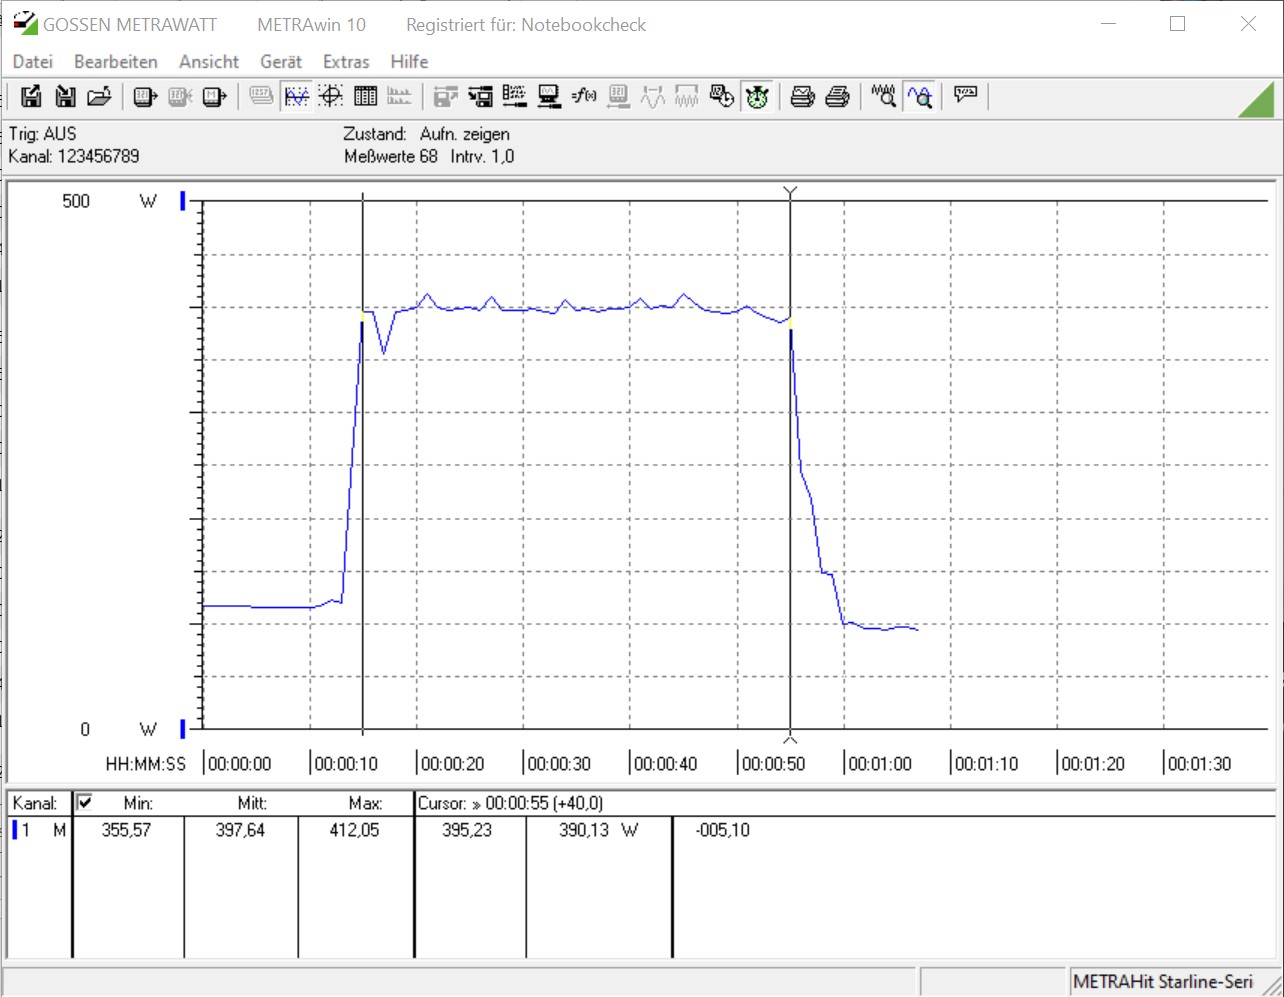
Beide neuen Ryzen 3 Modelle sind laut AMD mit einer TDP von maximal 65 Watt spezifiziert, was im Test bei unserem Stresstest auch eingehalten wurde. Im Leerlauf muss AMD allerdings noch einige Hausaufgaben erledigen, wenn sie Intel hier weiter unter Druck setzen möchten. Mit 86 und 88 Watt verbraucht das AMD-System ohne Last knapp 30 Watt mehr Energie als unsere Intel-Plattform. Da Mainboard und die dazugehörigen Bios-Settings spielen ebenso eine wichtige Rolle bei dieser Bewertung, sodass man den AMD-CPUs nicht allein die Schuld für den höheren Energiebedarf geben sollte.
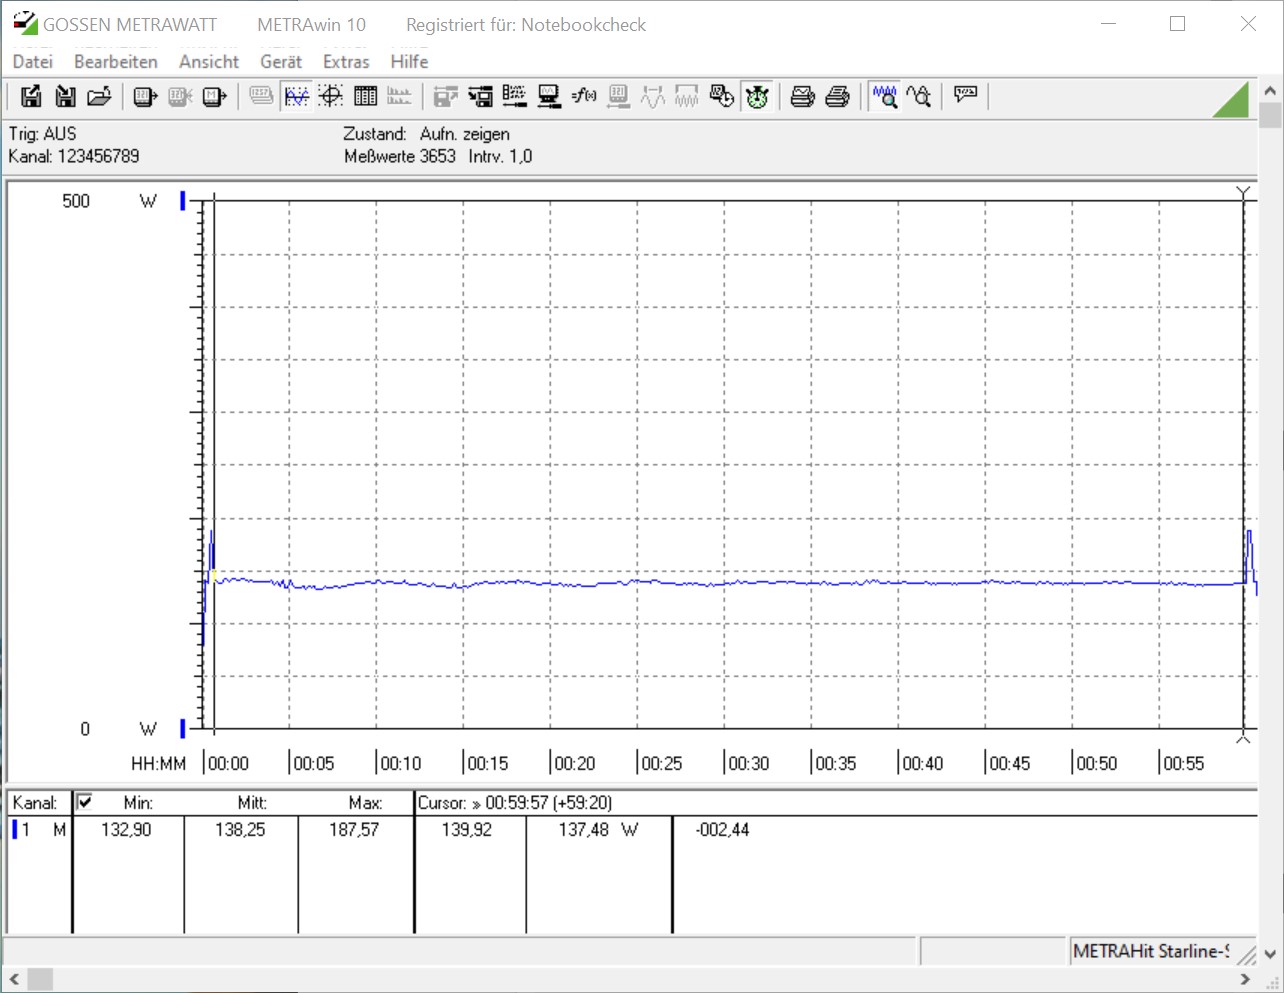
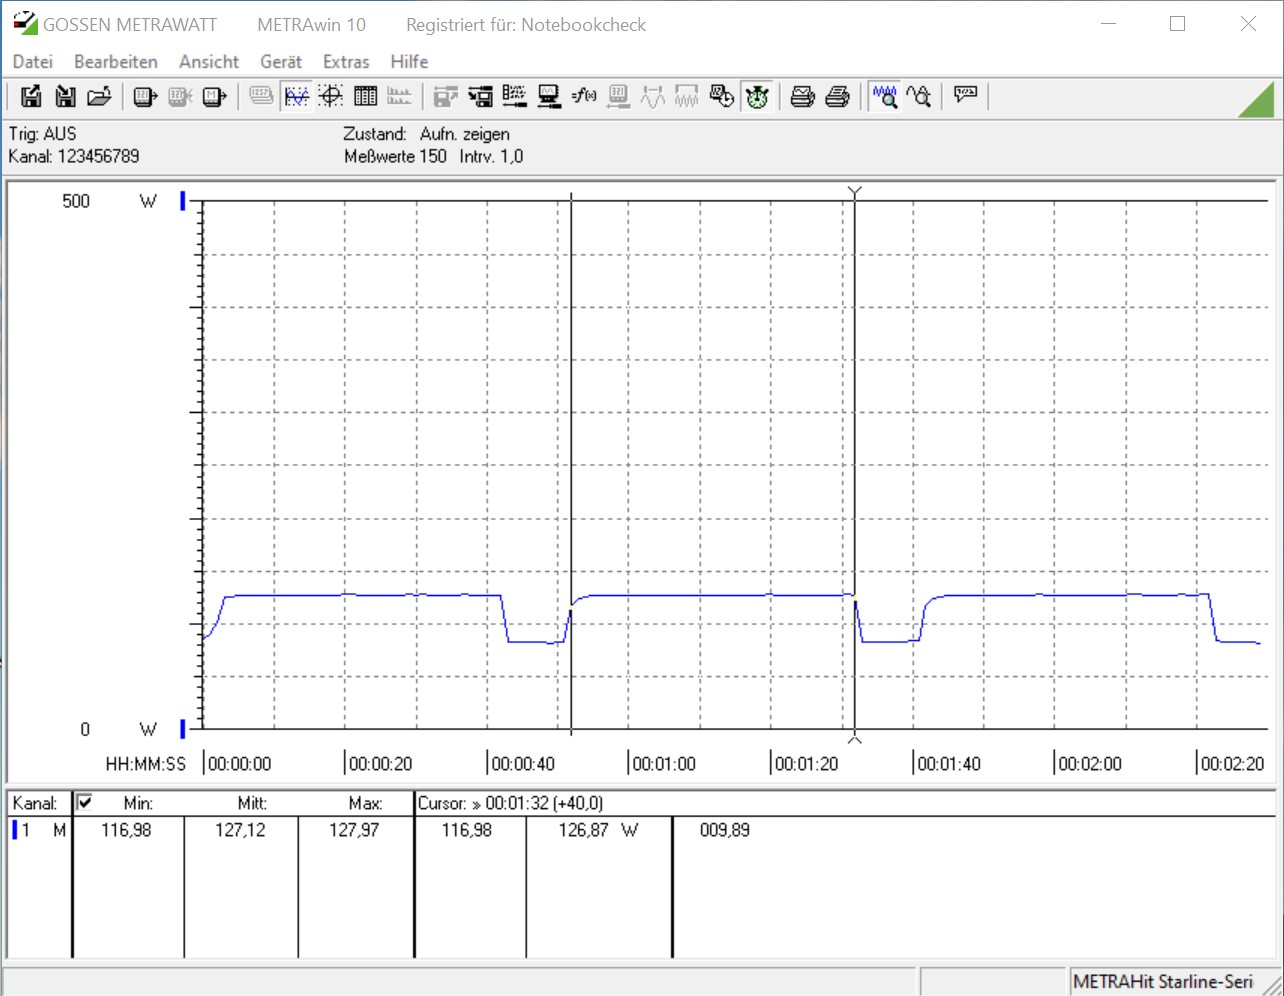
In der Praxis ist der AMD Ryzen 3 3100 etwas sparsamer als der AMD Ryzen 3 3300X. Gleichwohl zeigt Intel an dieser Stelle, dass ihr Powermanagement recht gut funktioniert. Beim Spielen, bei dem die Grafikkarte (Nvidia Titan RTX ca. 280 Watt) den Großteil ausmacht, liegen alle Systeme dicht beisammen.
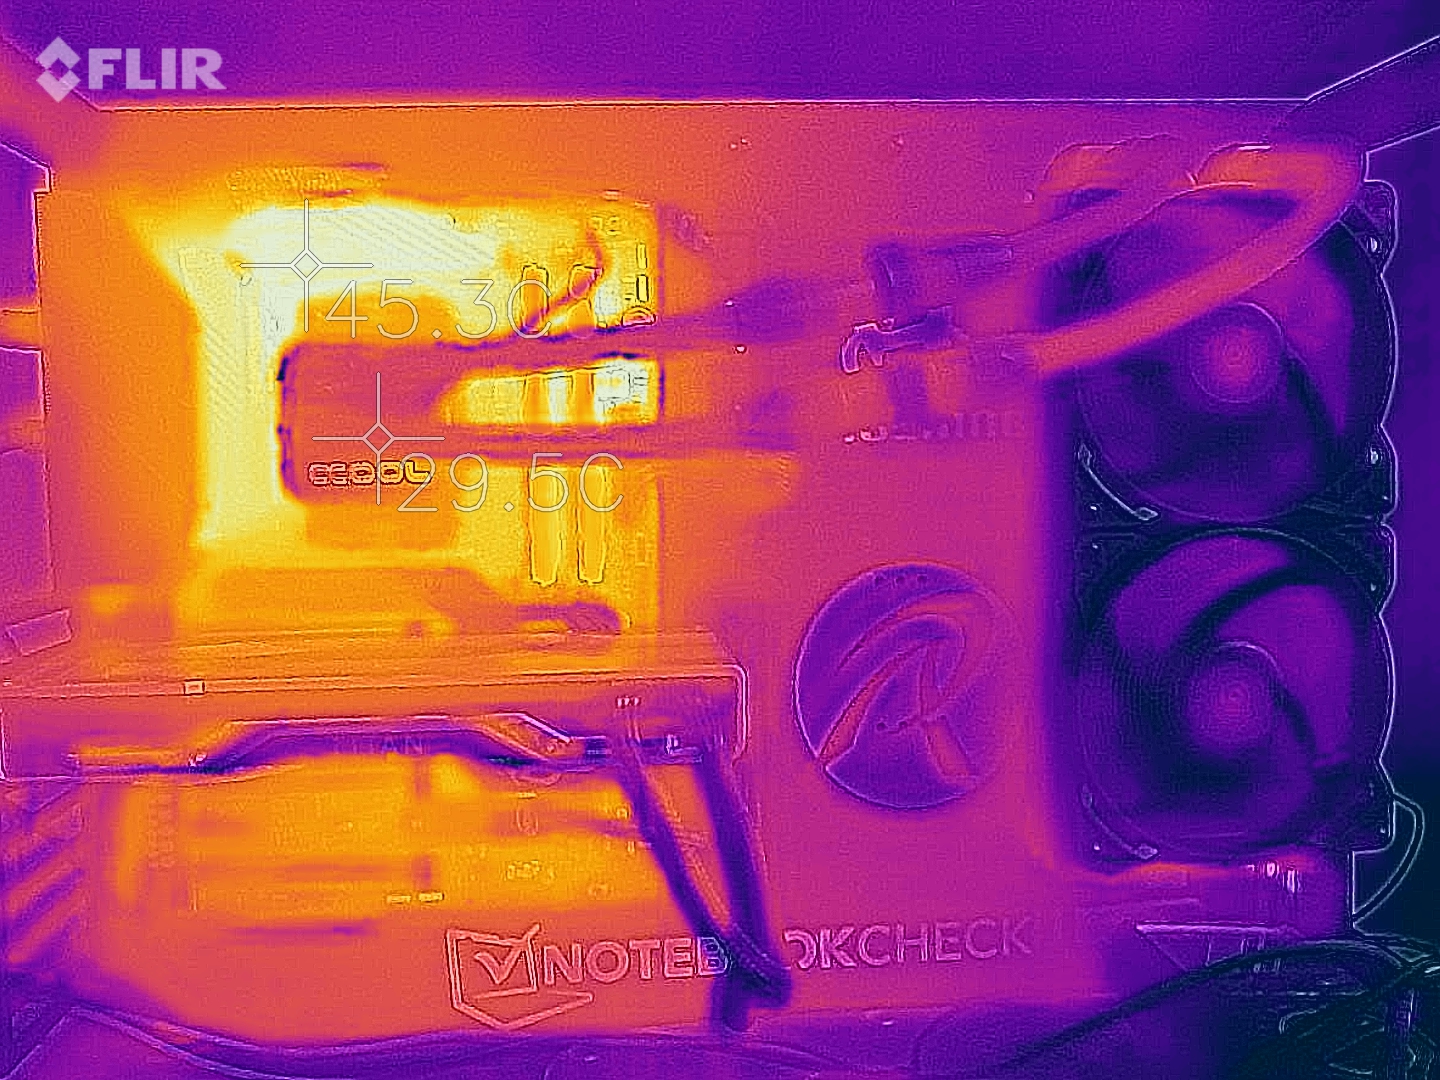
Die gemessenen Temperaturen sind beim Stresstest aufgrund der Alphacool Eisbear 280 AiO zu jeder Zeit in unkritischen Bereichen. Am wärmsten wurde der AMD Ryzen 3 330X mit 77,5 °C. Da hier nur ein CCX-Cluster aktiv ist, konzentriert sich die Wärme auf einen kleineren Punkt, was vermutlich auch der Grund sein dürfte, warum der Prozessor im Test etwas wärmer wurde als der AMD Ryzen 3 3100 (70,3 °C).
Hinweis: Bei den ermittelten Energieverbräuchen wurde das gesamte Testsystem ohne Monitor betrachtet.
| Power Consumption | |
| 1920x1080 The Witcher 3 ultra (external Monitor) | |
| AMD Ryzen 5 1600 (12nm) (Idle: 85.9 W) | |
| AMD Ryzen 3 3300X (Idle: 88.8 W) | |
| AMD Ryzen 3 3100 (Idle: 86 W) | |
| Intel Core i5 9400F (Idle: 57 W) | |
| Intel Core i3 9100F (Idle: 56 W) | |
| Prime95 V2810 Stress (external Monitor) | |
| AMD Ryzen 5 1600 (12nm) (Idle: 85.9 W) | |
| AMD Ryzen 3 3300X (Idle: 88.8 W) | |
| Intel Core i3 9100F (Idle: 56 W) | |
| AMD Ryzen 3 3100 (Idle: 86 W) | |
| Intel Core i5 9400F (Idle: 57 W) | |
| Cinebench R15 Multi (external Monitor) | |
| AMD Ryzen 5 1600 (12nm) (Idle: 85.9 W) | |
| AMD Ryzen 3 3300X (Idle: 88.8 W) | |
| AMD Ryzen 3 3100 (Idle: 86 W) | |
| Intel Core i5 9400F (Idle: 57 W) | |
| Intel Core i3 9100F (Idle: 56 W) | |
| Temperatures - CPU Temperature Prime95 | |
| AMD Ryzen 3 3300X | |
| Intel Core i3 9100F | |
| AMD Ryzen 3 3100 | |
| AMD Ryzen 5 1600 (12nm) | |
| Intel Core i5 9400F | |
* ... kleinere Werte sind besser
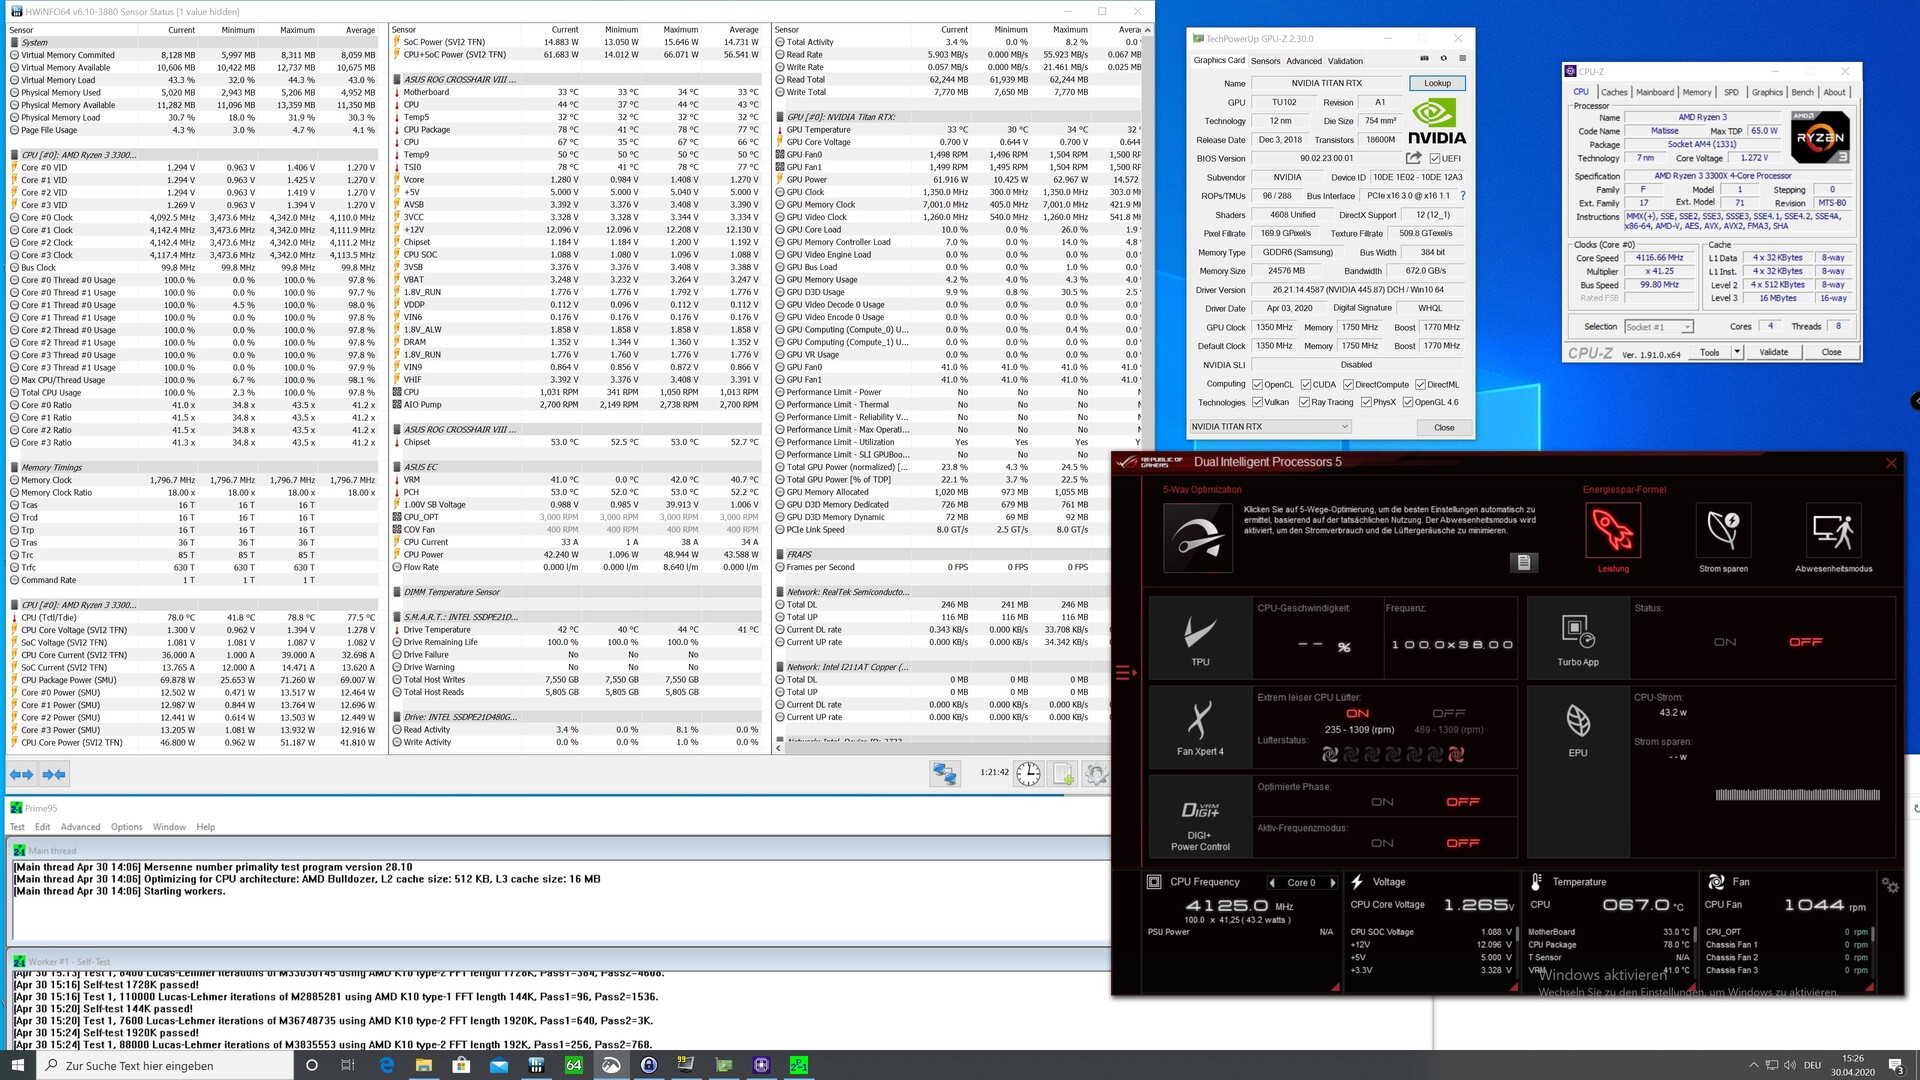
Overclocking - versteckte Reserven entlocken
Wer noch etwas mehr Leistung aus dem Prozessor kitzeln möchte, bleibt nur die Möglichkeit des Übertaktens. Dies haben wir auch mit den beiden Ryzen 3 Modellen gemacht und ein Leistungsplus von bis zu 14 Prozent erreichen können. Dabei macht der AMD Ryzen 3 3100 aufgrund des geringeren Basistaktes den größeren Leistungssprung.
Beide Prozessoren ließen sich problemlos und ohne viel Aufwand mit 4,4 GHz auf allen Kernen betreiben. Bei 4,5 GHz war allerdings kein stabiler Betrieb mehr möglich. Voraussetzung hierfür ist jedoch eine ausreichende Kühlung, um einen stabilen Betrieb zu gewährleisten. Von der besseren CPU-Leistung konnte die im test verwendete Nvidia Titan RTX allerdings nicht profitieren.
| Performance Rating - Percent | |
| AMD Ryzen 3 3300X @ 4.4 GHz | |
| AMD Ryzen 3 3300X | |
| AMD Ryzen 3 3100 @ 4.4 GHz | |
| AMD Ryzen 5 1600 (12nm) | |
| Intel Core i5 9400F | |
| AMD Ryzen 3 3100 | |
| Intel Core i3 9100F | |
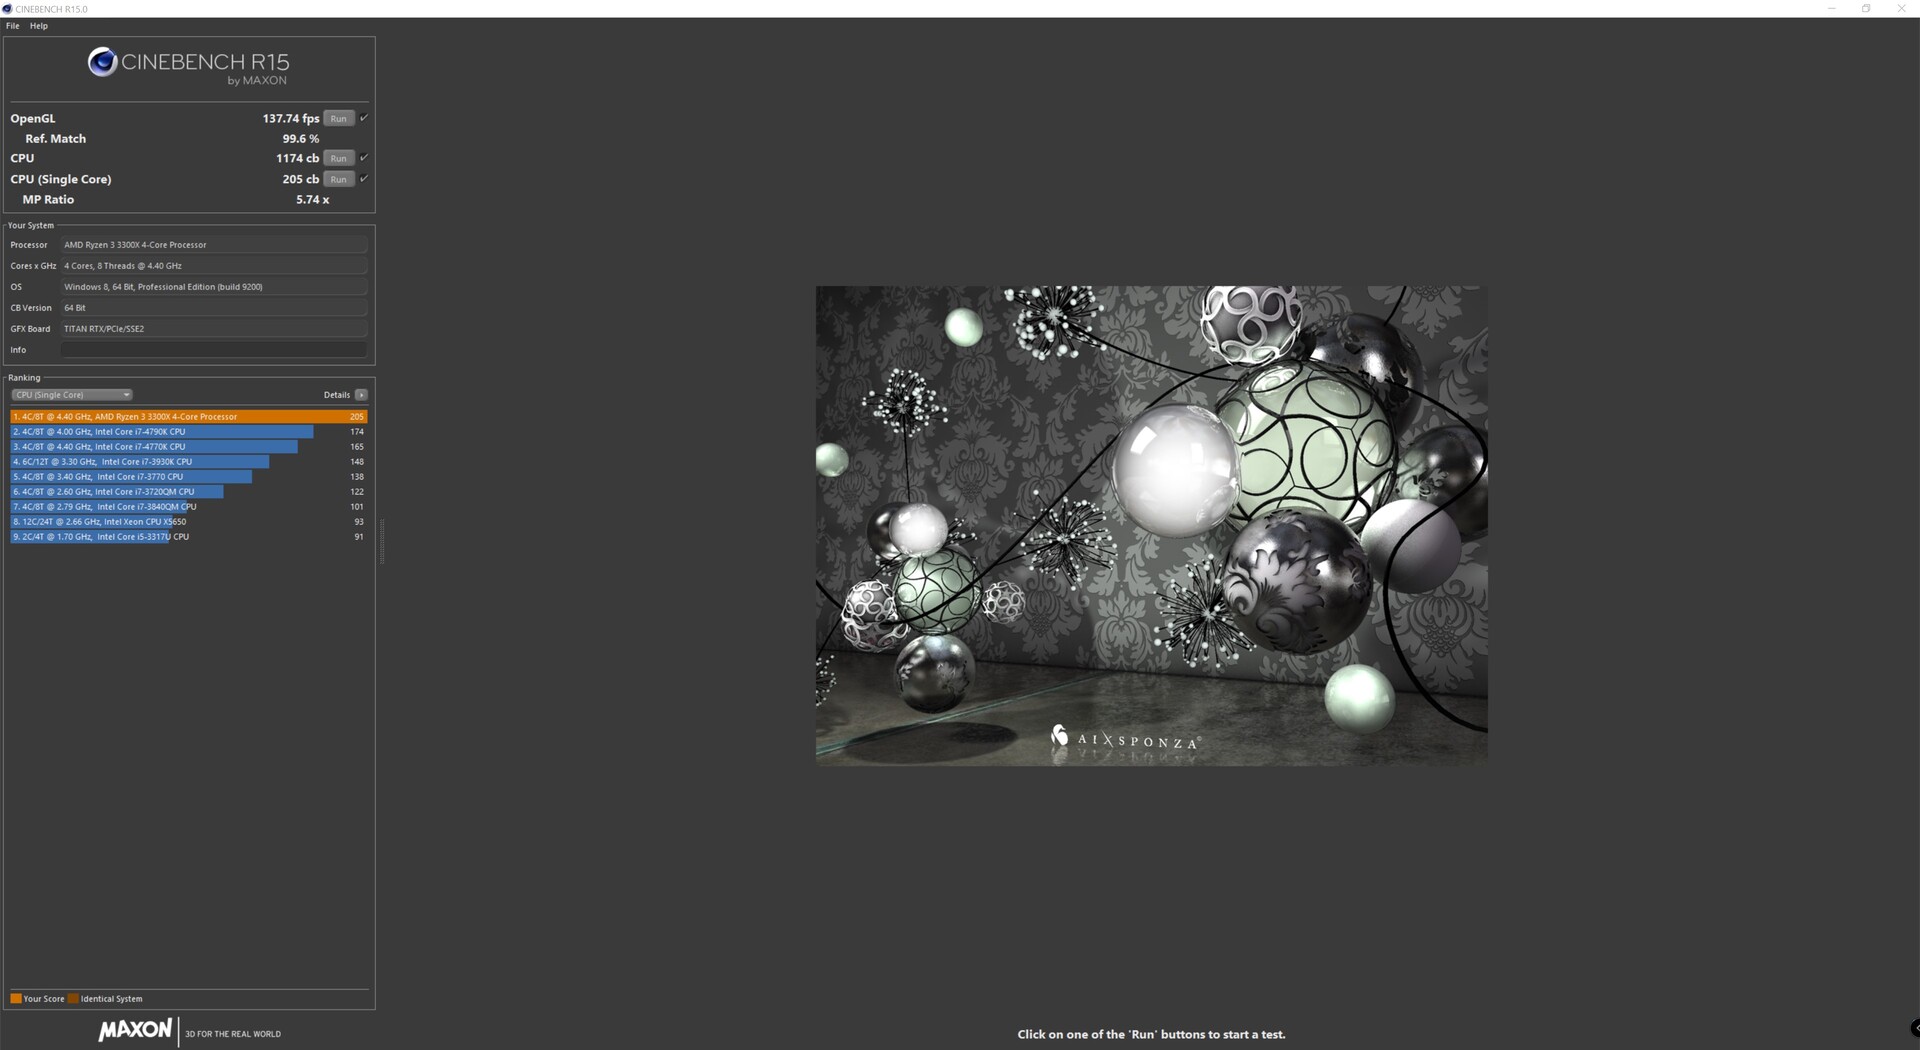
| Cinebench R15 | |
| CPU Single 64Bit | |
| AMD Ryzen 3 3300X @ 4.4 GHz | |
| AMD Ryzen 3 3100 @ 4.4 GHz | |
| AMD Ryzen 3 3300X | |
| AMD Ryzen 3 3100 | |
| Intel Core i5 9400F | |
| Intel Core i3 9100F | |
| AMD Ryzen 5 1600 (12nm) | |
| CPU Multi 64Bit | |
| AMD Ryzen 5 1600 (12nm) | |
| AMD Ryzen 3 3300X @ 4.4 GHz | |
| AMD Ryzen 3 3100 @ 4.4 GHz | |
| AMD Ryzen 3 3300X | |
| AMD Ryzen 3 3100 | |
| Intel Core i5 9400F | |
| Intel Core i3 9100F | |
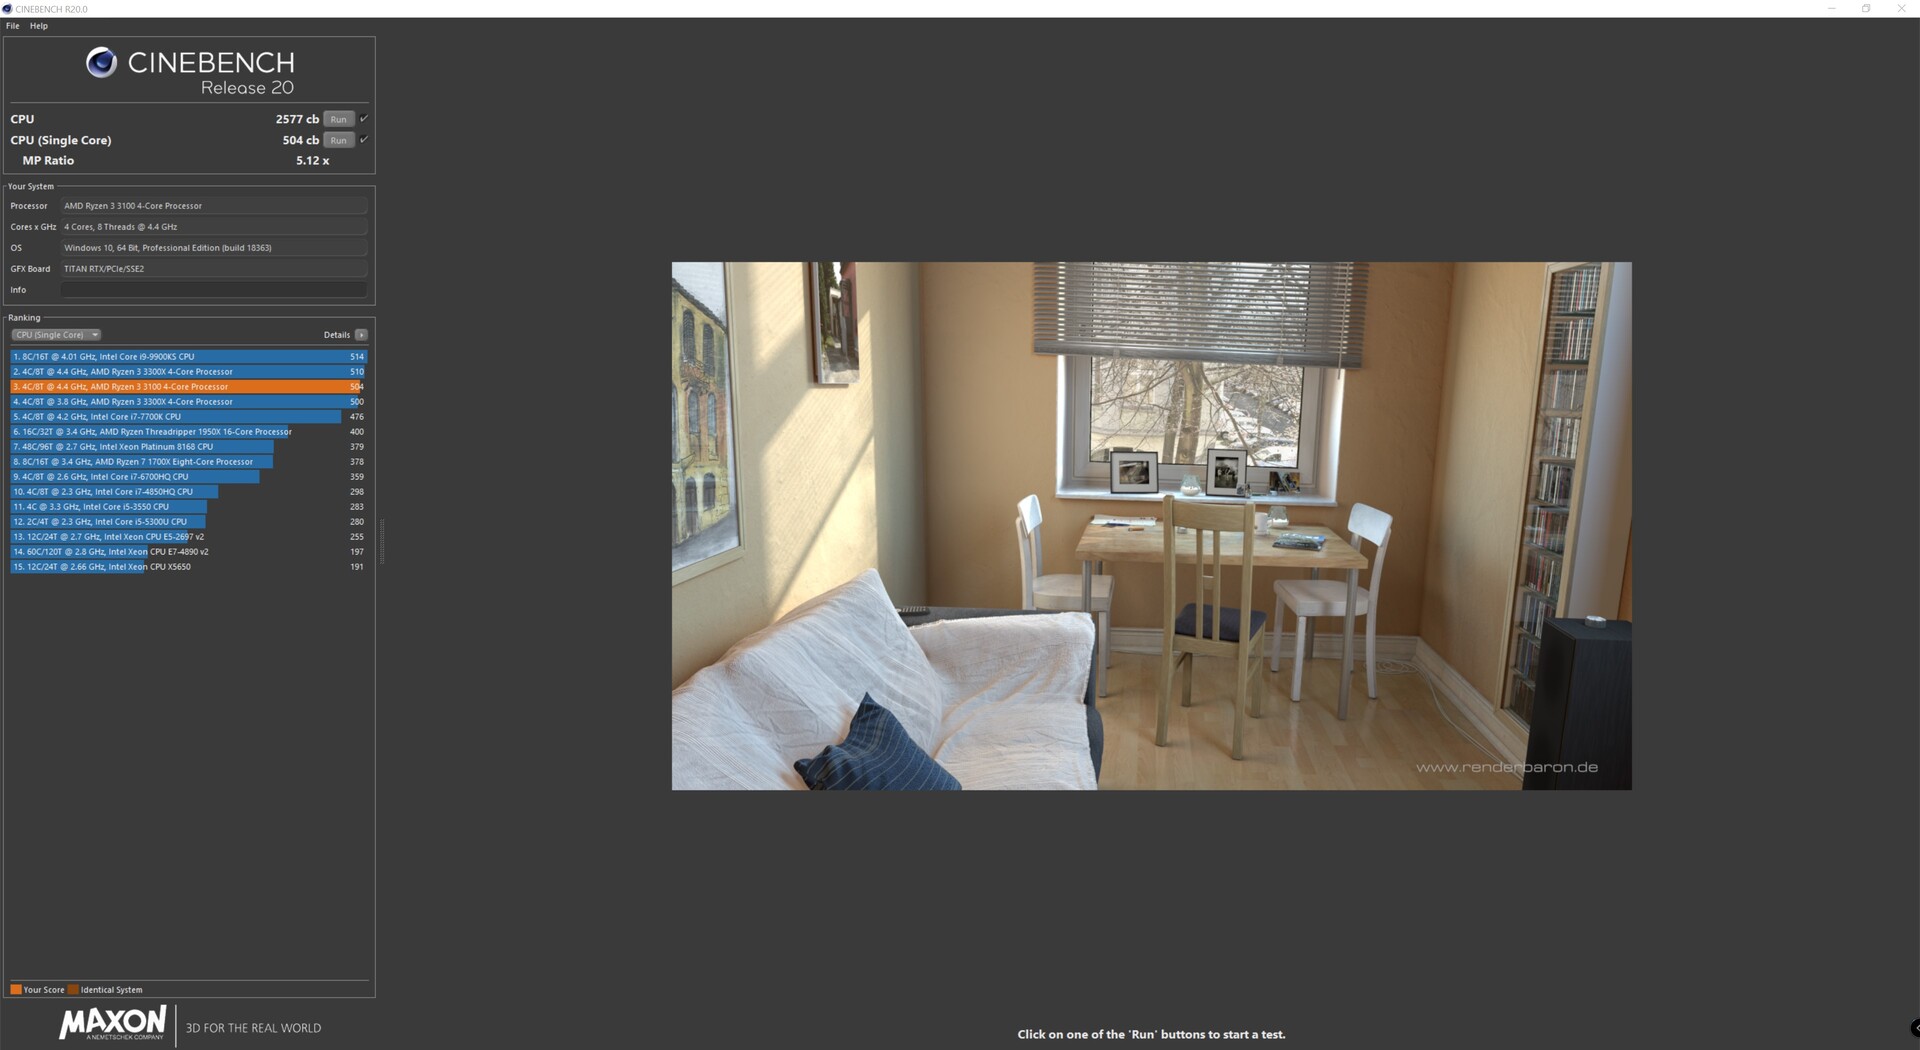
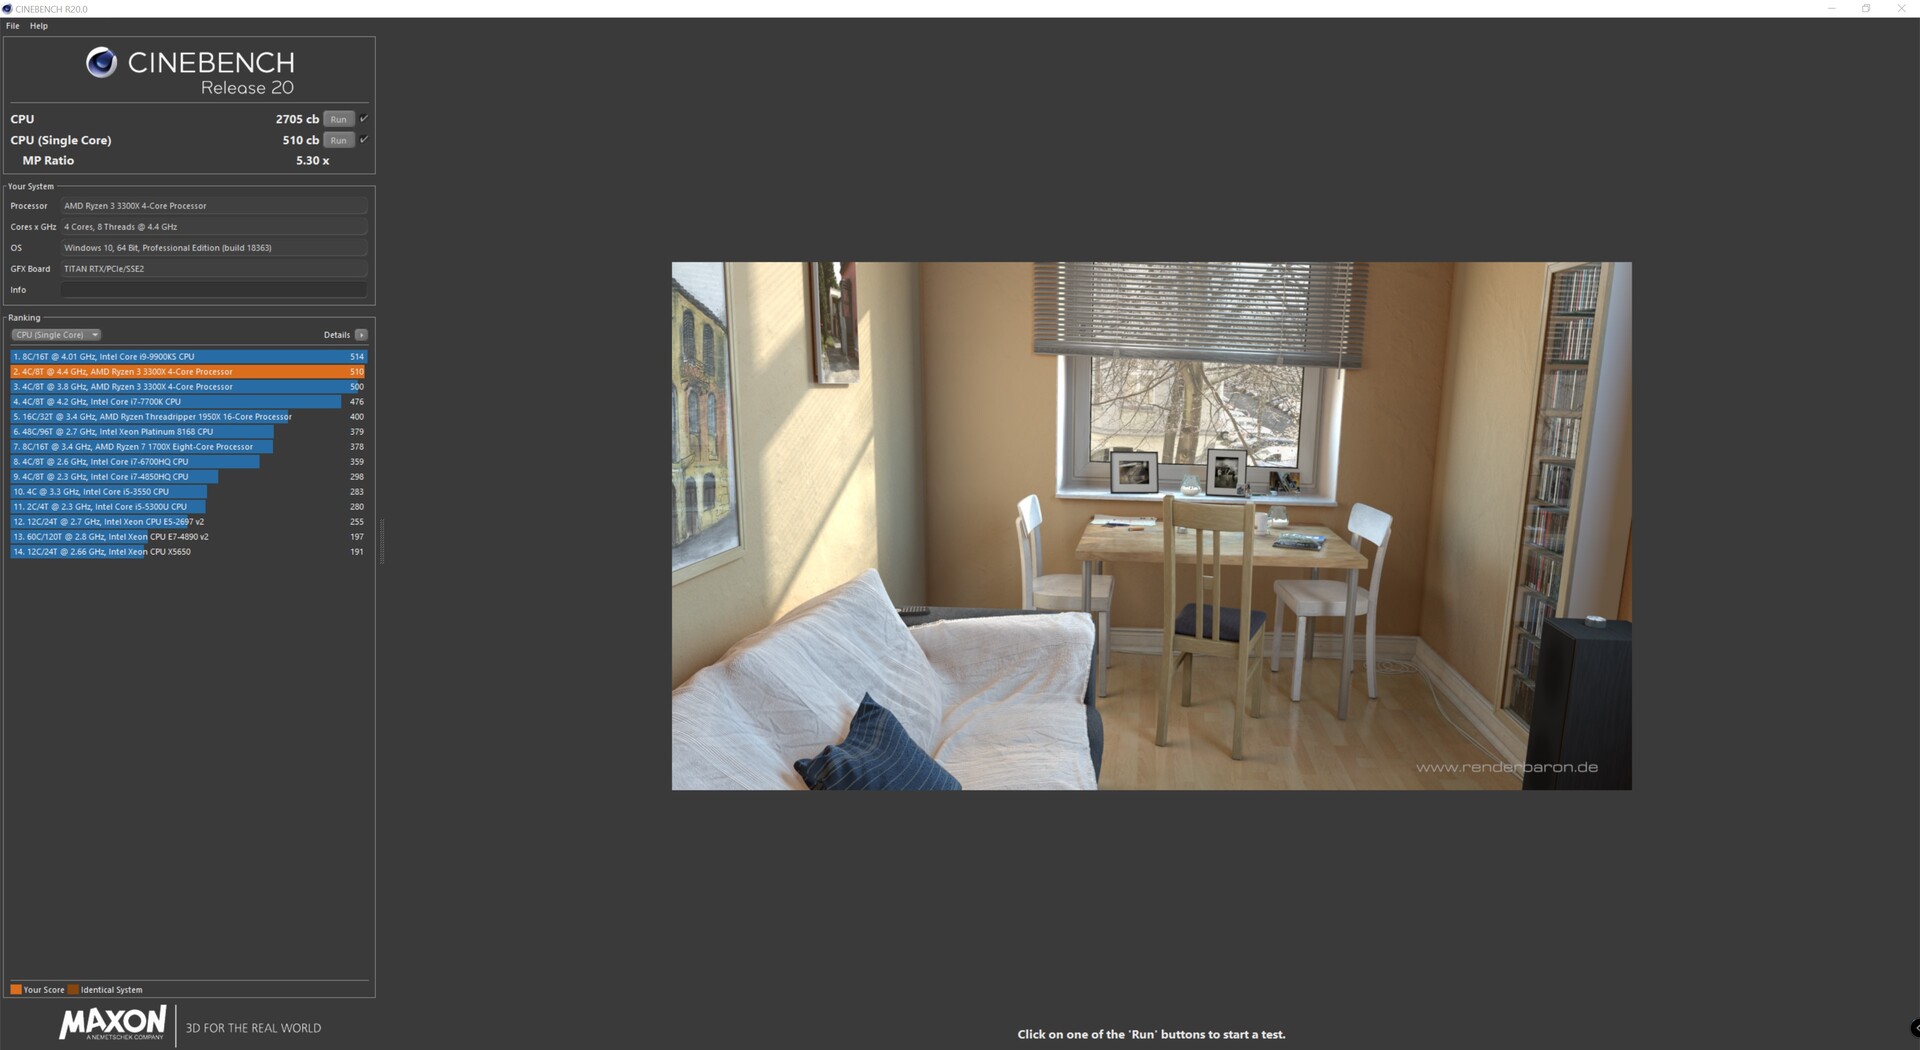
| Cinebench R20 | |
| CPU (Single Core) | |
| AMD Ryzen 3 3300X @ 4.4 GHz | |
| AMD Ryzen 3 3100 @ 4.4 GHz | |
| AMD Ryzen 3 3300X | |
| AMD Ryzen 3 3100 | |
| Intel Core i5 9400F | |
| Intel Core i3 9100F | |
| AMD Ryzen 5 1600 (12nm) | |
| CPU (Multi Core) | |
| AMD Ryzen 3 3300X @ 4.4 GHz | |
| AMD Ryzen 5 1600 (12nm) | |
| AMD Ryzen 3 3100 @ 4.4 GHz | |
| AMD Ryzen 3 3300X | |
| Intel Core i5 9400F | |
| AMD Ryzen 3 3100 | |
| Intel Core i3 9100F | |
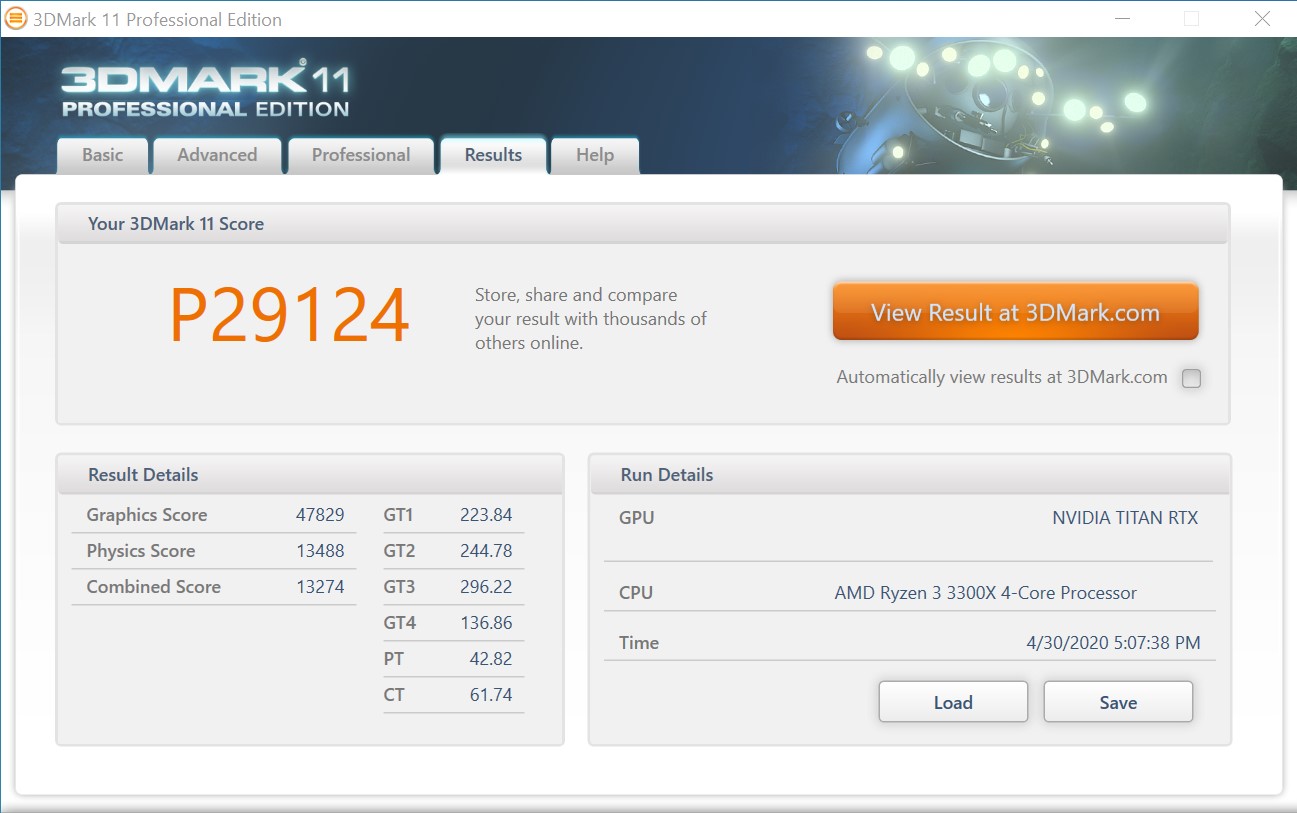
| 3DMark 11 | |
| 1280x720 Performance | |
| AMD Ryzen 3 3300X @ 4.4 GHz | |
| AMD Ryzen 3 3300X | |
| AMD Ryzen 3 3100 @ 4.4 GHz | |
| Intel Core i5 9400F | |
| AMD Ryzen 5 1600 (12nm) | |
| AMD Ryzen 3 3100 | |
| Intel Core i3 9100F | |
| 1280x720 Performance GPU | |
| Intel Core i3 9100F | |
| Intel Core i5 9400F | |
| AMD Ryzen 3 3300X | |
| AMD Ryzen 3 3100 @ 4.4 GHz | |
| AMD Ryzen 3 3300X @ 4.4 GHz | |
| AMD Ryzen 5 1600 (12nm) | |
| AMD Ryzen 3 3100 | |
| 1280x720 Performance Physics | |
| AMD Ryzen 3 3300X @ 4.4 GHz | |
| AMD Ryzen 3 3300X | |
| AMD Ryzen 5 1600 (12nm) | |
| AMD Ryzen 3 3100 @ 4.4 GHz | |
| Intel Core i5 9400F | |
| AMD Ryzen 3 3100 | |
| Intel Core i3 9100F | |
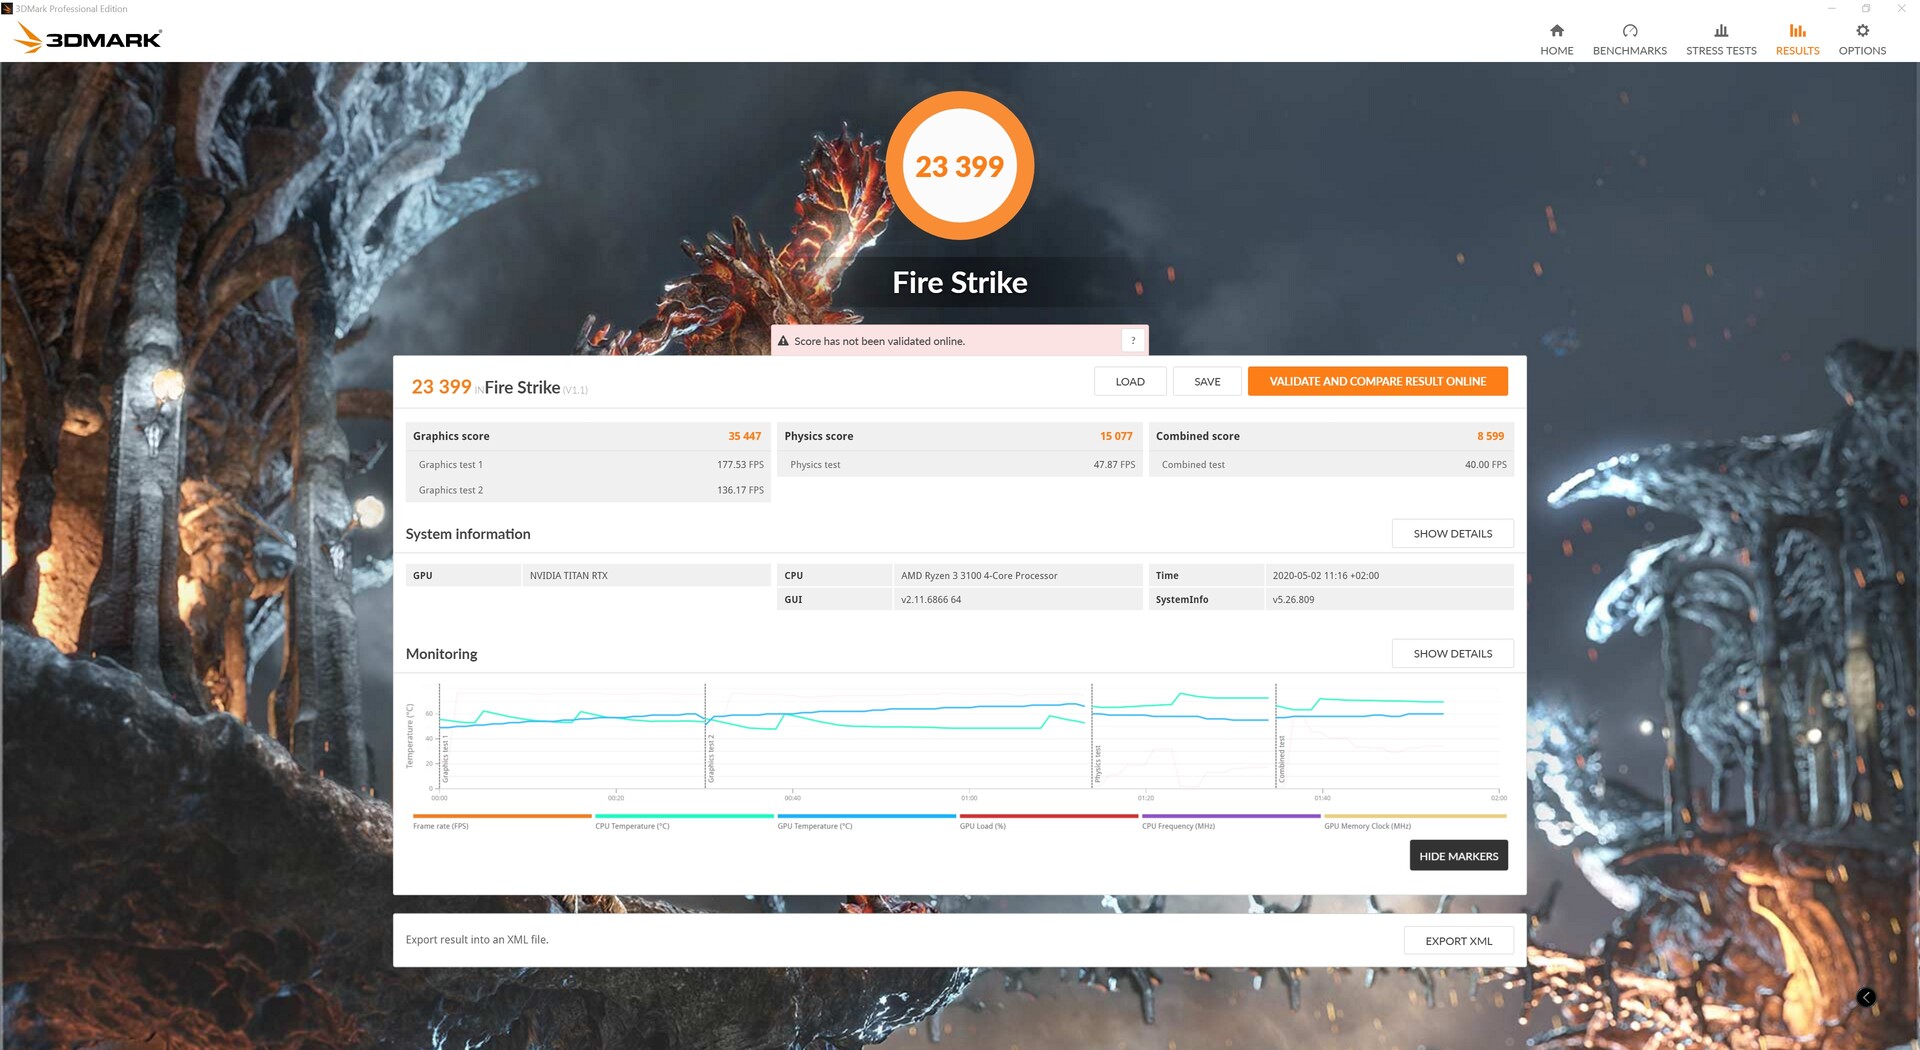
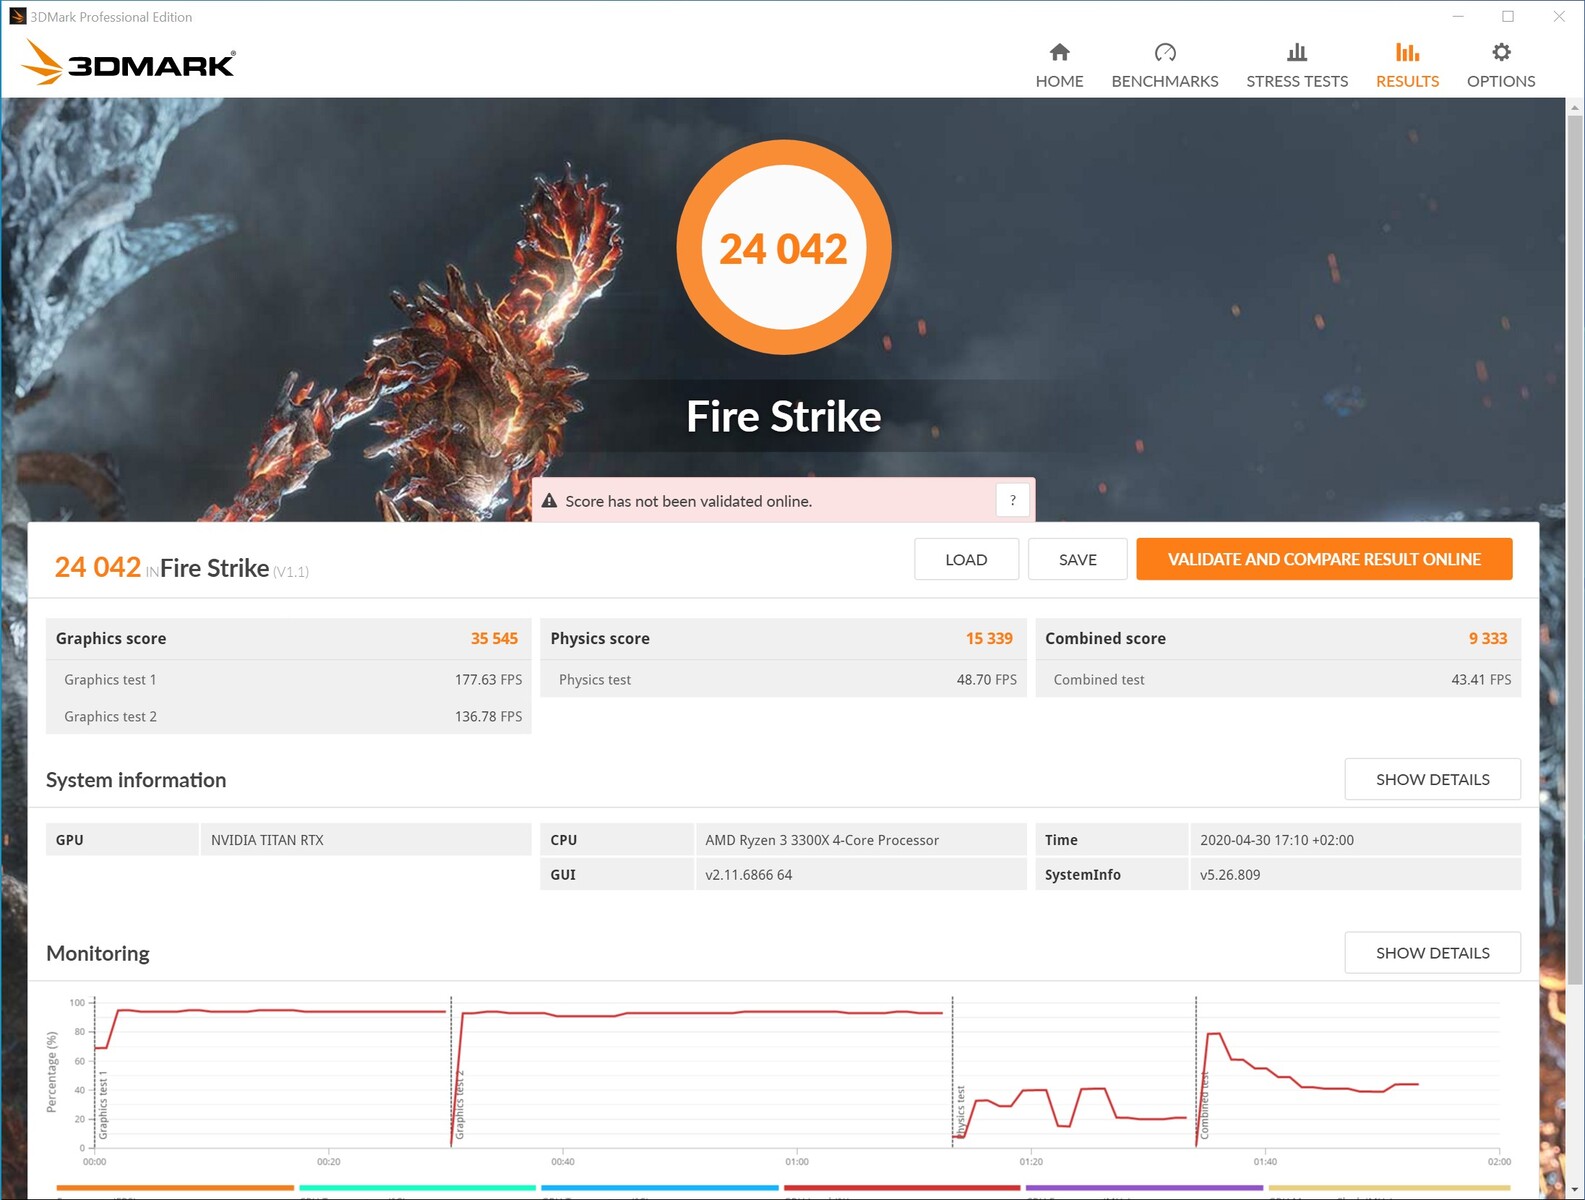
| 3DMark | |
| 1920x1080 Fire Strike Score | |
| AMD Ryzen 3 3300X @ 4.4 GHz | |
| AMD Ryzen 3 3300X | |
| AMD Ryzen 3 3100 @ 4.4 GHz | |
| Intel Core i5 9400F | |
| AMD Ryzen 5 1600 (12nm) | |
| AMD Ryzen 3 3100 | |
| Intel Core i3 9100F | |
| 1920x1080 Fire Strike Graphics | |
| Intel Core i3 9100F | |
| Intel Core i5 9400F | |
| AMD Ryzen 3 3100 | |
| AMD Ryzen 3 3300X @ 4.4 GHz | |
| AMD Ryzen 3 3100 @ 4.4 GHz | |
| AMD Ryzen 3 3300X | |
| AMD Ryzen 5 1600 (12nm) | |
| 1920x1080 Fire Strike Physics | |
| AMD Ryzen 5 1600 (12nm) | |
| AMD Ryzen 3 3300X @ 4.4 GHz | |
| AMD Ryzen 3 3100 @ 4.4 GHz | |
| AMD Ryzen 3 3300X | |
| AMD Ryzen 3 3100 | |
| Intel Core i5 9400F | |
| Intel Core i3 9100F | |
Ryzen 3 3100 @ 4,4 GHz


Ryzen 3 3300X @ 4,4 GHz
Pro
Contra
Fazit - viel Leistung zum kleinen Preis
AMD zeigt mit den neuen Ryzen 3 einmal mehr, was mit Zen2 möglich ist. Die Leistung konnte im Vergleich zur Vorgängergeneration auf Zen+ Basis deutlich gesteigert werden. Auch Intel geriet nun mehr und mehr unter Druck, was aber schon nächste Woche wieder anders aussehen kann, denn Comet Lake-S steht schon in den Startlöchern. Aus diesem Grund könne man fast schon denken, dass AMD den Start der neuen Ryzen 3 Generation etwas verschlafen hat, denn Zen2 ist schon eine Weile am Markt. AMD kann aber weiterhin auf PCI-Express-4.0 als Alleinstellungsmerkmal setzten, da auch Intels 10. Generation dies nicht unterstützen wird. Dass nun auch die Ryzen 3 mit SMT ausgestattet sind, erfreut nicht nur uns, sondern wurde schon lange gefordert. Dies bringt nochmals einige Prozente im Leistungsvergleich, den AMD mit den neuen Prozessoren gegenüber Intel oftmals gewinnt.
Die Sparversion der neuen Ryzen 3 Prozessoren entpuppt sich aufgrund der guten Übertaktbarkeit als wahrer Preis-Leistungs-Sieger.
Rein leistungstechnisch arbeiten beide Ryzen Modelle schnell, wenngleich in Spielen die sechs nativen Kerne des Intel Core i5-9400F für etwas bessere Frameraten sorgen. Preislich liegen beide Modelle dicht beisammen und sind deutlich preiswerter als der Intel Core i5-9400F. Mit 109 Euro macht der AMD Ryzen 3 3100 den Anfang und bietet eine solide Leistung, um ein flottes System auf die Beine zu stellen. Aufgrund des geringeren Basis- und Turbotaktes fehlt es dem Ryzen 3 3100 gegenüber dem Ryzen 3 3300X etwas an IPC, wodurch der Ryzen 3 3300X zusammen mit der Nvidia Titan RTX in Spielen deutlich bessere Frameraten erreichte. Nur 20 Euro mehr muss man für das schnellere Modell auf den Tisch legen, was wir gerechtfertigt finden.
Eine Kaufempfehlung bekommen aber beide Modelle, da sie für den jeweiligen Einsatz eine sehr gute Leistung abliefern, ohne ein tiefes Loch in den Geldbeutel zu reißen. Zudem kommt die gute Übertaktbarkeit des Ryzen 3 3100, welcher durch ein paar gekonnte Einstellungen die Leistung eines Ryzen 3 3300X erreicht. Das Übertaktungspotenzial des Ryzen 3 3300X fällt deutlich geringer aus.
