Intel Core i3-10100 Desktop-Prozessor
Intel Core i3-10100
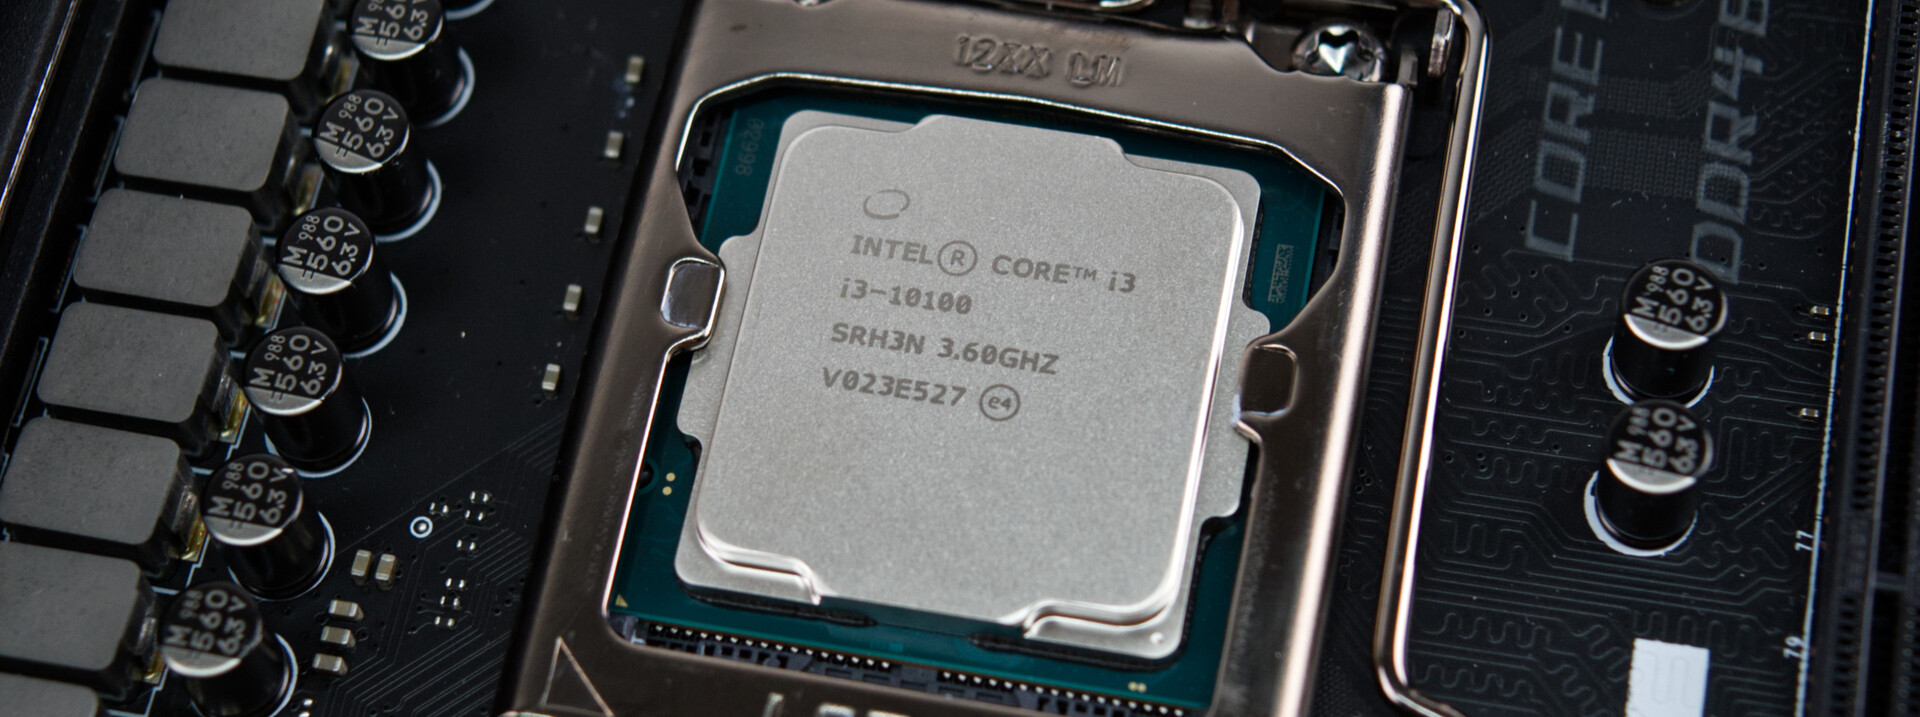
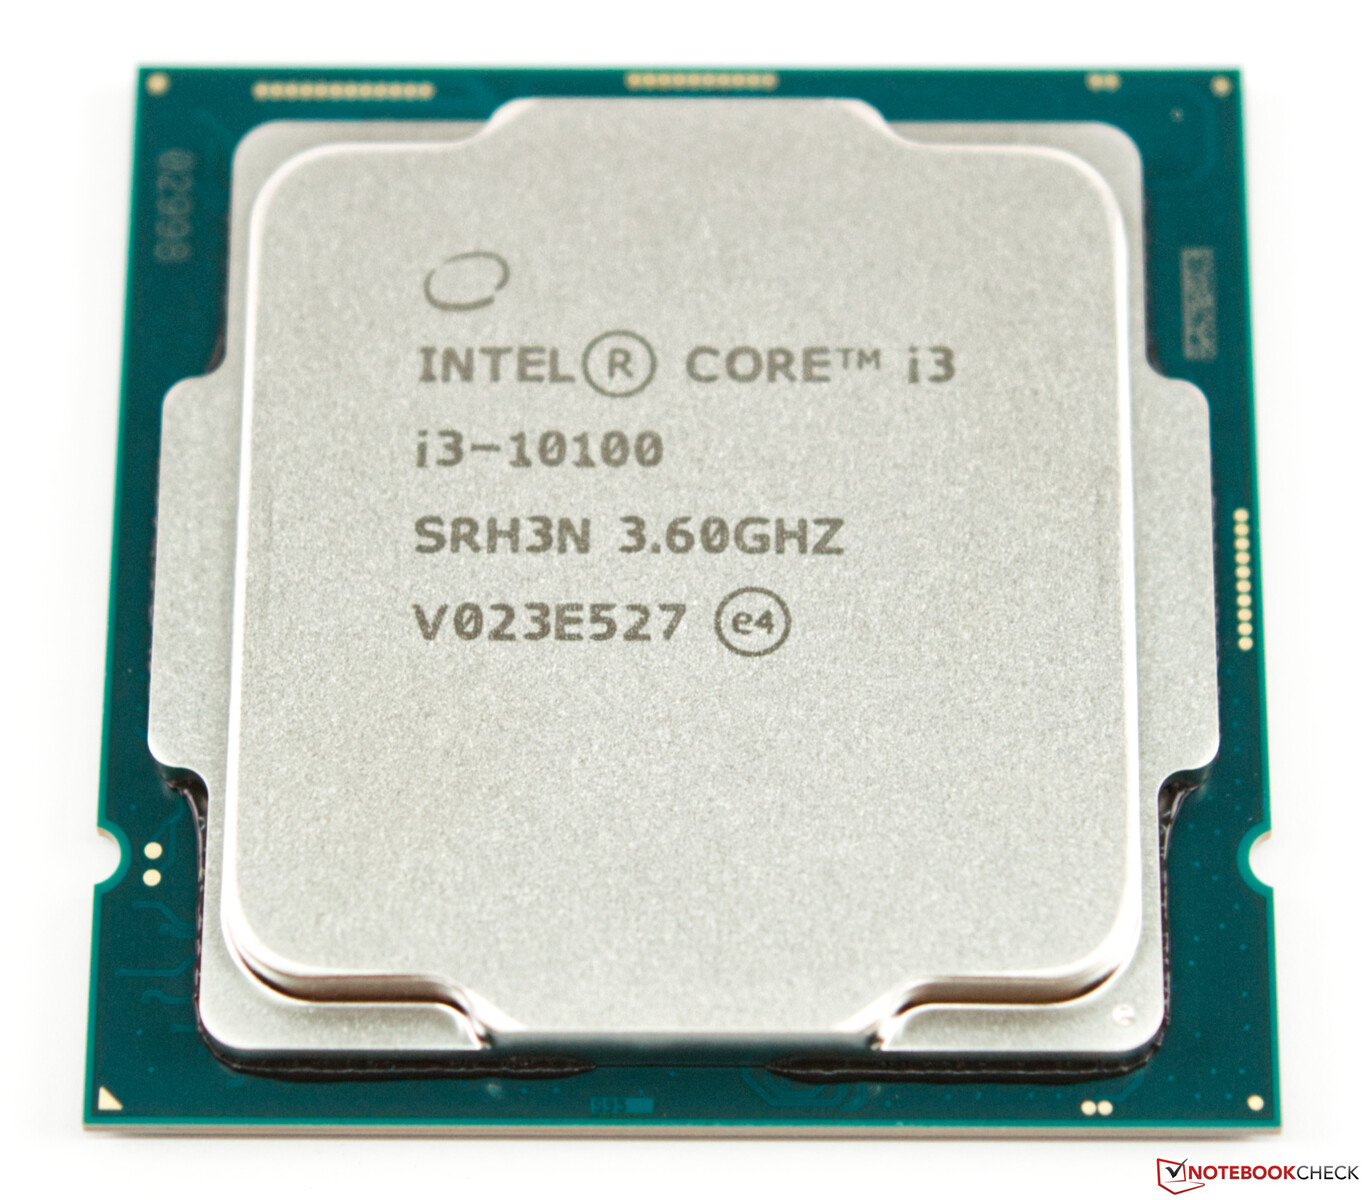
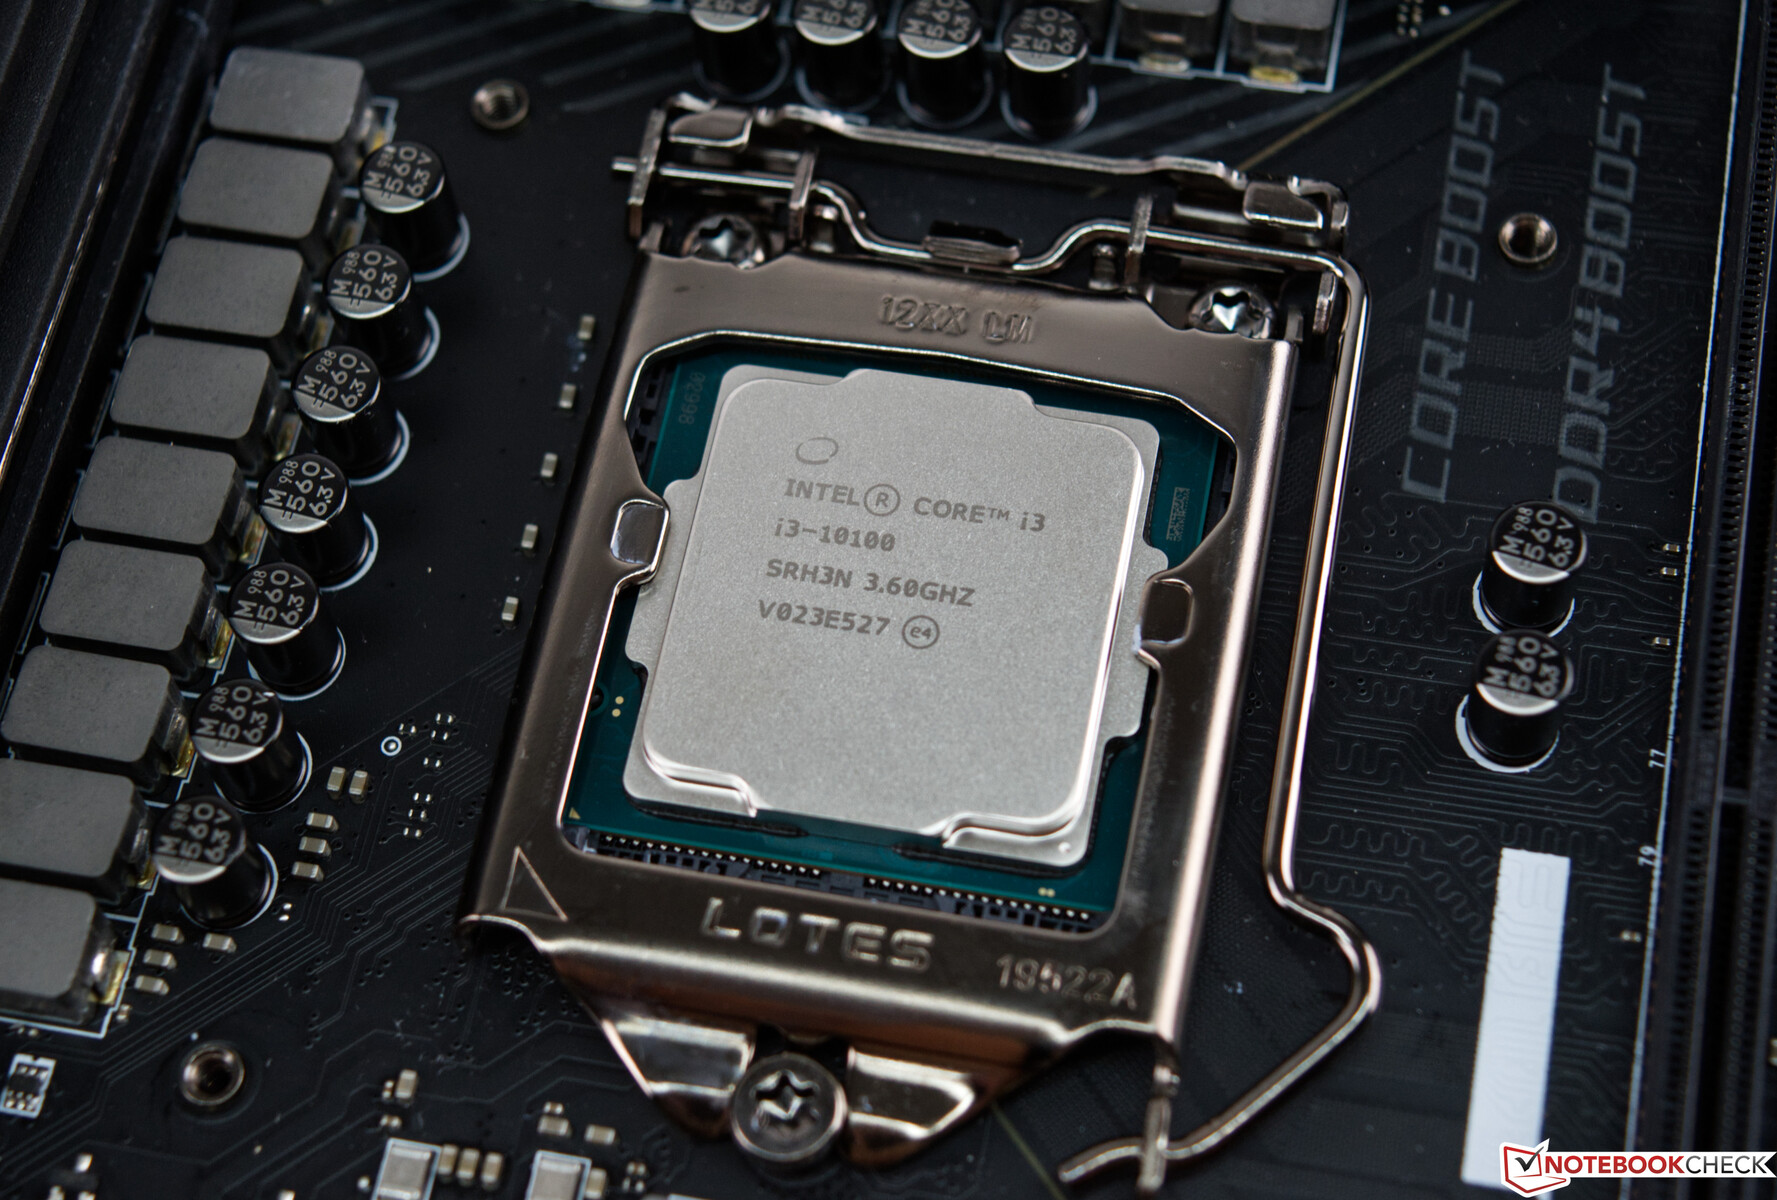
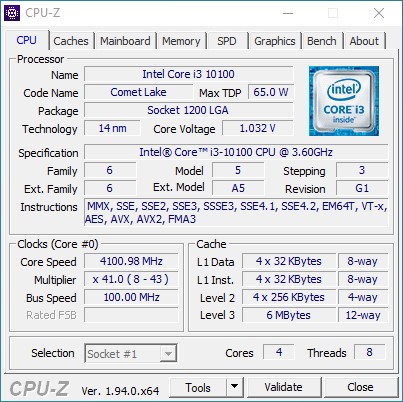
Der Intel Core i3-10100 ist ein Desktop-Prozessor mit vier Kernen auf Basis der Comet Lake S-Architektur. Der Prozessor taktet mit 3,6-4,3 GHz und kann insgesamt bis zu 8 Threads gleichzeitig bearbeiten. Gefertigt wird der Intel Core i3-10100 im verbesserten 14-nm-Prozess (14nm++). Im Vergleich zum älteren i3-9100 (Comet Lake-S) bietet der 10100 einen 100 MHz höheren Turbo-Takt, Multithreading und Support für schnelleren DDR4-2666 Speicher.
Performance
Die Leistung sollte nur leicht oberhalb des Core i3-9100 im Einstiegsbereich für Desktop-CPUs liegen. Dadurch reicht die Leistung für Office und anspruchsloses Gaming.
Grafikeinheit
Beim Intel Core i3-10100 handelt es sich um einen Prozessor mit integrierter Grafikeinheit (Intel UHD Graphics 630).
Leistungsaufnahme
Intel beziffert die Thermal Design Power (TDP) auf 65 Watt. Somit Bedarf es keiner großen Kühlsysteme, was auch den Einbau in sehr kompakten Gehäusen ermöglicht.
| Codename | Comet Lake-S | ||||||||||||||||
| Serie | Intel Comet Lake | ||||||||||||||||
Serie: Comet Lake Comet Lake-S
| |||||||||||||||||
| Taktung | 3600 - 4300 MHz | ||||||||||||||||
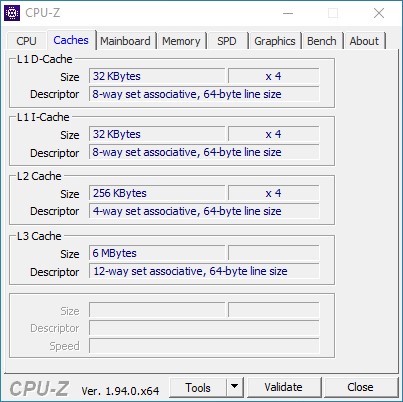
| Level 1 Cache | 256 KB | ||||||||||||||||
| Level 2 Cache | 1 MB | ||||||||||||||||
| Level 3 Cache | 6 MB | ||||||||||||||||
| Anzahl von Kernen / Threads | 4 / 8 | ||||||||||||||||
| Stromverbrauch (TDP = Thermal Design Power) | 65 Watt | ||||||||||||||||
| Herstellungstechnologie | 14 nm | ||||||||||||||||
| Die Größe | 126 mm2 | ||||||||||||||||
| Max. Temperatur | 100 °C | ||||||||||||||||
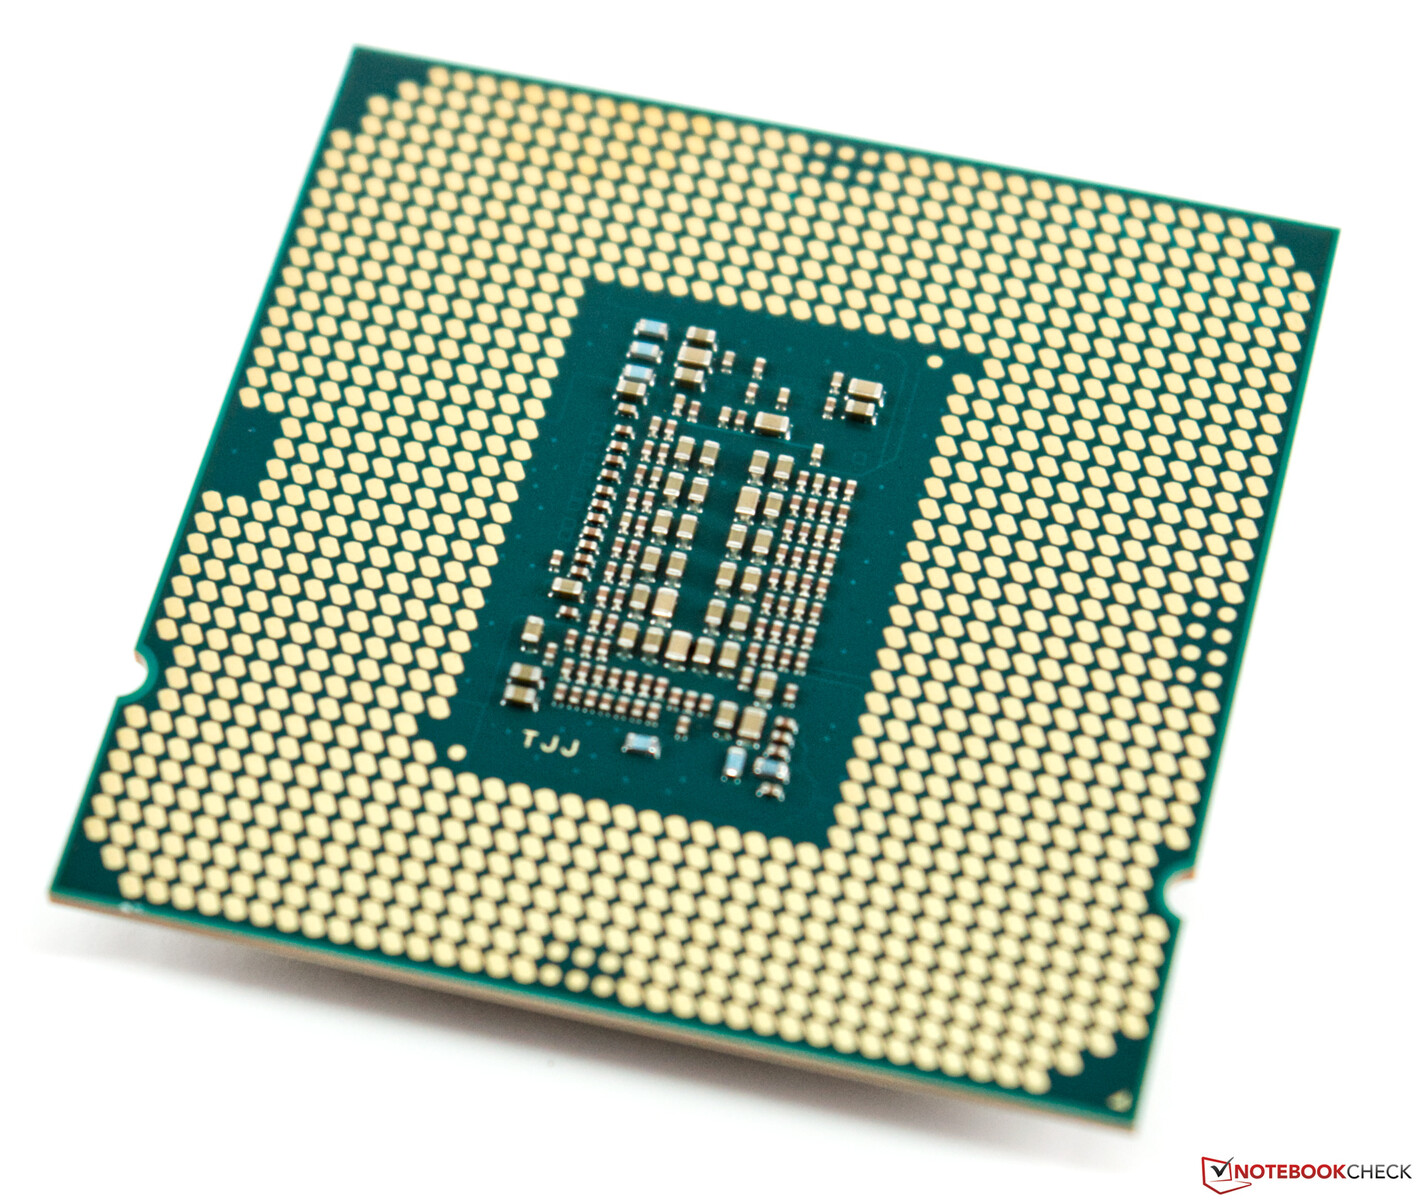
| Socket | FCLGA1200 | ||||||||||||||||
| Features | Dual-Channel DDR4-2666 Memory Controller, AVX, AVX2, AES-NI, TSX, Quick Sync, Virtualization | ||||||||||||||||
| 64 Bit | 64 Bit wird unterstützt | ||||||||||||||||
| Architecture | x86 | ||||||||||||||||
| Anfangspreis | $130 U.S. | ||||||||||||||||
| Vorgestellt am | 30.04.2020 | ||||||||||||||||

Details zu unserem Testsystem
Für die folgenden Benchmarks und Tests nutzen wir folgendes System:
- Raijintek Pean Benchtable
- Intel Core i3-10100
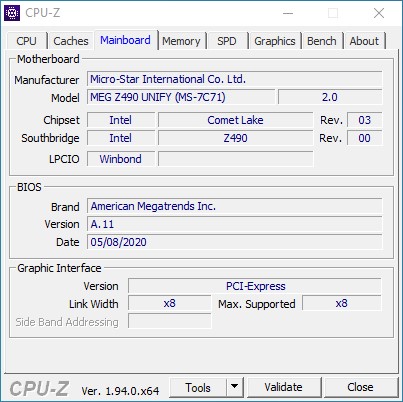
- MSI Z490 Unify
- Alphacool Eisbear 280 AiO
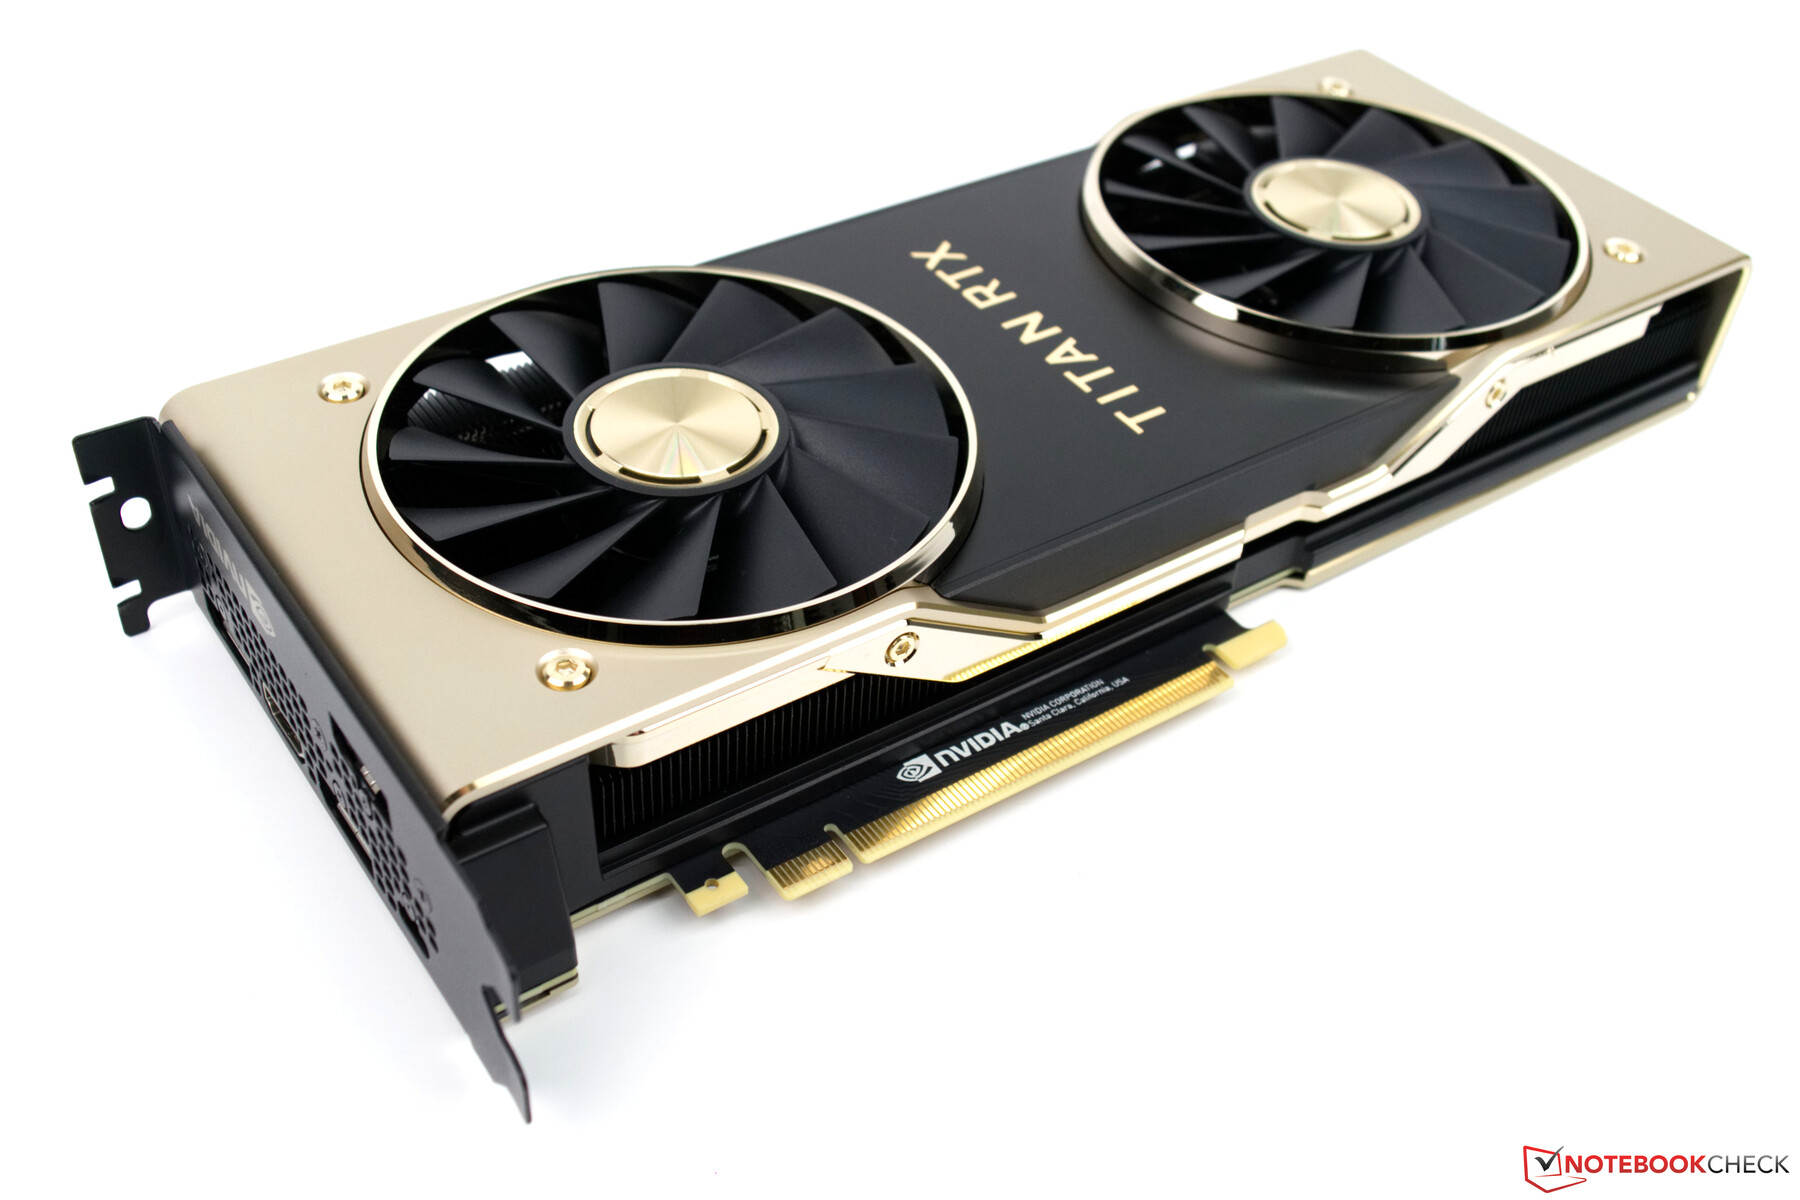
- Nvidia Titan RTX (Nvidia 456.71)
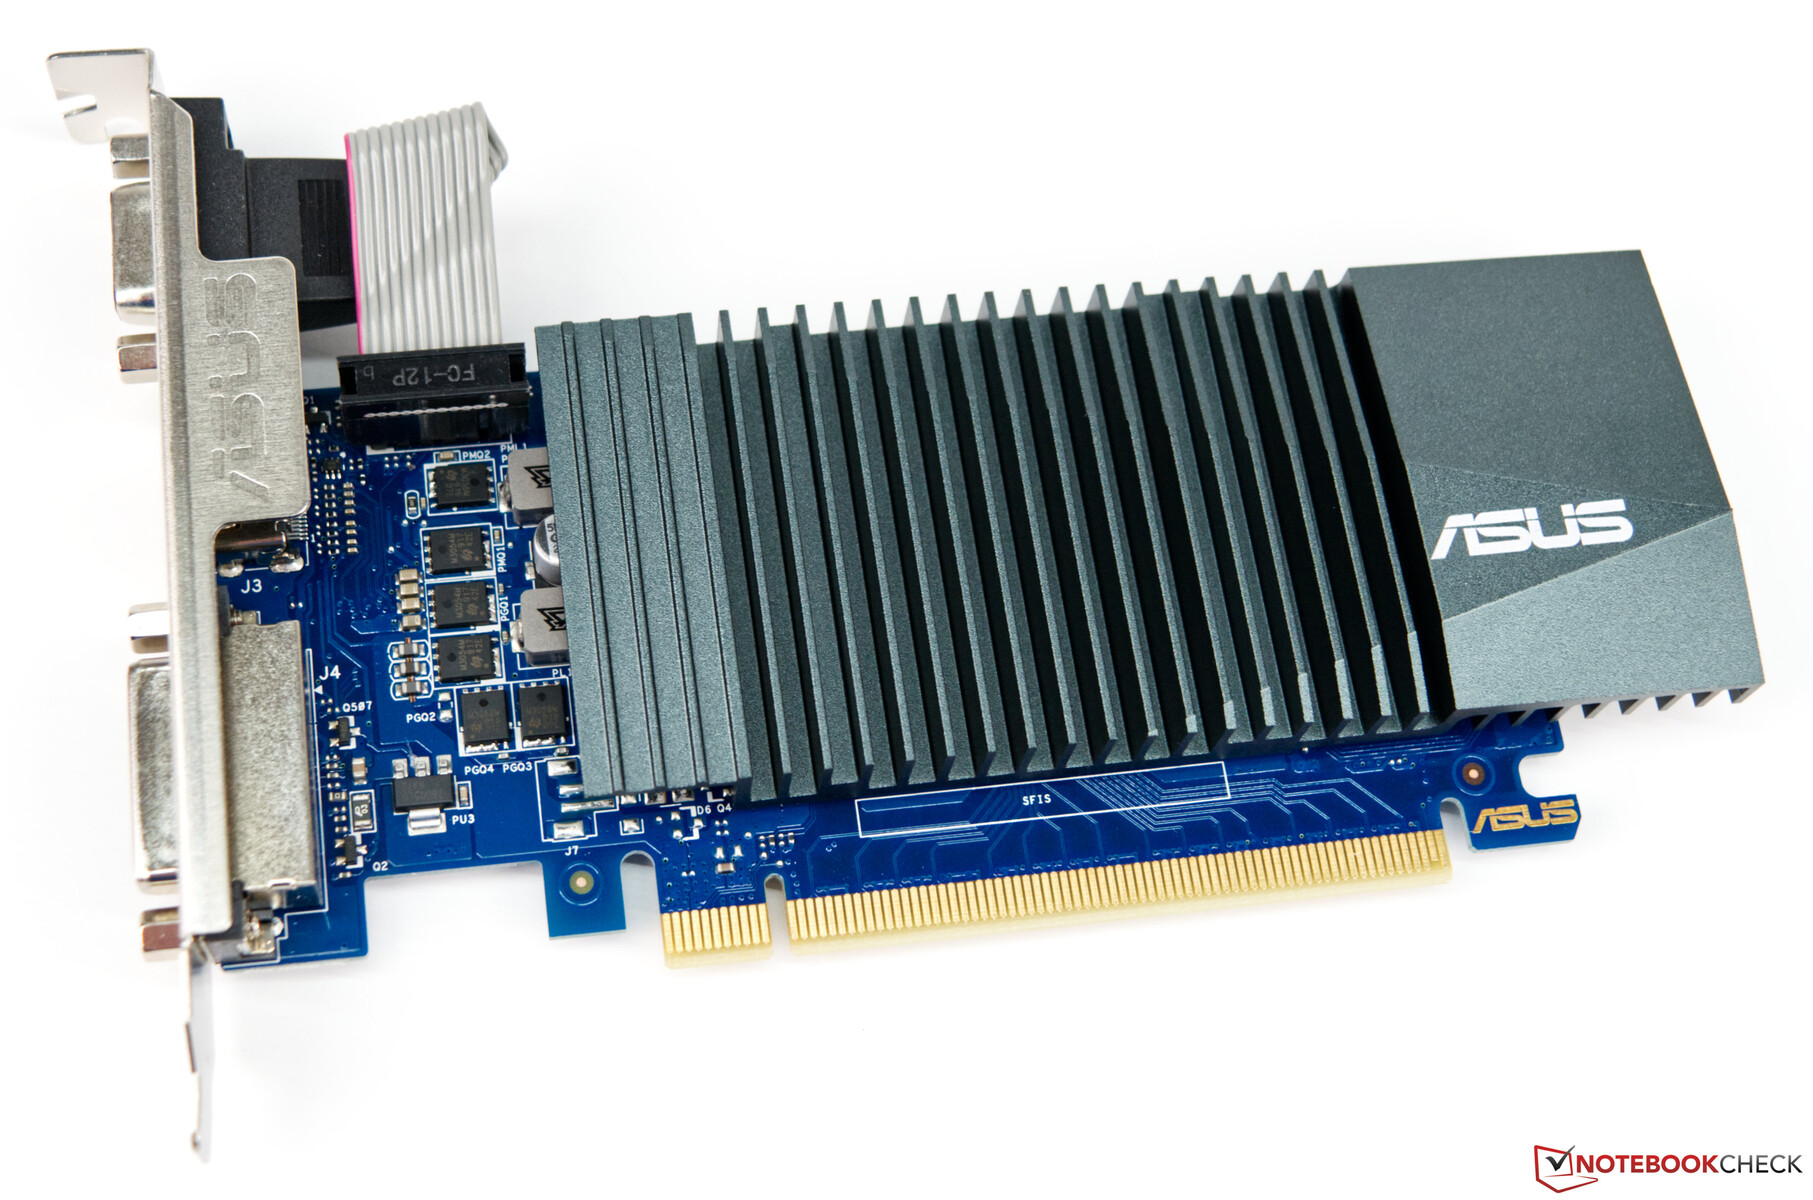
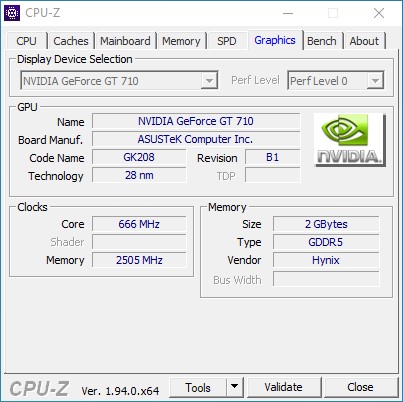
- Asus GeForce GT 710 (Nvidia 456.71)
- Corsair HX 1200i Netzteil
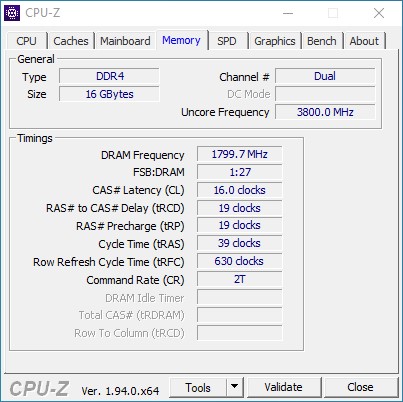
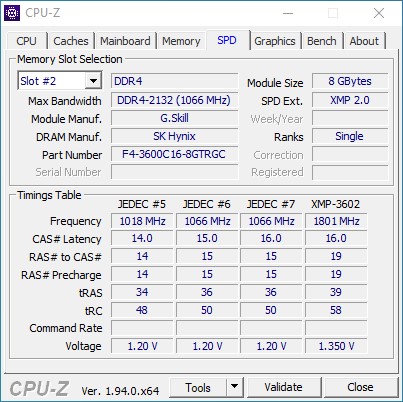
- G-Skill Trident Z Royal Gold DDR4-3600 Speicherkit 2 x 8 GB, eingestellt auf DDR4-3800 CL16-19-19-39
- Intel Optane 905P 480GB PCIe-SSD
- Microsoft Windows 10 Professional 64-Bit (Version 20H2)
Von Intel stammt der Core i3-10100. Als weiteres hat uns MSI mit dem Mainboard unterstützt und von Caseking stammt das Raijintek Pean Showcase. Als Kühlung nutzen wir die Alphacool Eisbear 280 AiO.
Prozessor-Benchmarks
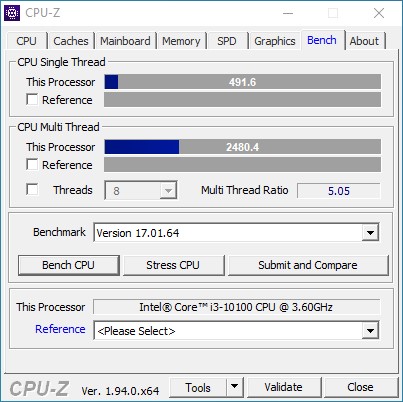
Den direkten Vergleich mit dem Intel Core i3-9100F gewinnt der Core i3-10100 ganz klar. Dennoch kann unsere Testsample bei der Single-Core-Performance keinen großen Vorsprung herausholen, wenngleich die Multi-Core-Leistung aufgrund von Hyper-Threading nun deutlich besser ausfällt. Einige Prozessoren der 9. Generation mussten auf dieses Feature leider verzichten. Bei unsern CPU-Benchmarks kann sich der Core i3-10100 sogar des Öfteren vor dem Intel Core i5-9400F setzen, obwohl dieser über sechs physikalische Recheneinheiten verfügt. Gegen die kleinen AMD Ryzen-3-Modelle hat es Intel schwer mitzuhalten. Der AMD Ryzen 3 3100 liegt in den Multi-Core-Tests fast immer vor unserem Testsample. Als spürbar würden wir den Leistungsunterschied zwischen den beiden Prozessoren aber nicht beschreiben.
Weitere CPU-Benchmarks finden Sie hier in unserem Benchmarkvergleich von CPUs.
| Blender - v2.79 BMW27 CPU | |
| Intel Core i3-9100F, NVIDIA Titan RTX | |
| AMD Ryzen 5 2400G, AMD Radeon RX Vega 11 | |
| Intel Core i3-10100, NVIDIA Titan RTX | |
| Intel Core i3-10100, NVIDIA GeForce GT 710 | |
| AMD Ryzen 3 3100, NVIDIA Titan RTX | |
| Intel Core i5-9400F, NVIDIA Titan RTX | |
| AMD Ryzen 3 3300X, NVIDIA Titan RTX | |
| Intel Core i5-10600K, NVIDIA Titan RTX | |
| Geekbench 5.5 | |
| Multi-Core | |
| Intel Core i5-10600K, NVIDIA Titan RTX | |
| AMD Ryzen 5 2400G, AMD Radeon RX Vega 11 | |
| AMD Ryzen 5 2400G, AMD Radeon RX Vega 11 | |
| Intel Core i5-9400F, NVIDIA Titan RTX | |
| AMD Ryzen 3 3300X, NVIDIA Titan RTX | |
| AMD Ryzen 3 3100, NVIDIA Titan RTX | |
| Intel Core i3-10100, NVIDIA GeForce GT 710 | |
| Intel Core i3-10100, NVIDIA Titan RTX | |
| Intel Core i3-9100F, NVIDIA Titan RTX | |
| Single-Core | |
| AMD Ryzen 3 3300X, NVIDIA Titan RTX | |
| Intel Core i5-10600K, NVIDIA Titan RTX | |
| AMD Ryzen 5 2400G, AMD Radeon RX Vega 11 | |
| AMD Ryzen 5 2400G, AMD Radeon RX Vega 11 | |
| Intel Core i3-10100, NVIDIA GeForce GT 710 | |
| Intel Core i3-10100, NVIDIA Titan RTX | |
| Intel Core i3-9100F, NVIDIA Titan RTX | |
| Intel Core i5-9400F, NVIDIA Titan RTX | |
| AMD Ryzen 3 3100, NVIDIA Titan RTX | |
| Geekbench 4.4 | |
| 64 Bit Single-Core Score | |
| Intel Core i5-10600K, NVIDIA Titan RTX | |
| AMD Ryzen 3 3300X, NVIDIA Titan RTX | |
| Intel Core i3-10100, NVIDIA GeForce GT 710 | |
| Intel Core i3-10100, NVIDIA Titan RTX | |
| Intel Core i5-9400F, NVIDIA Titan RTX | |
| Intel Core i3-9100F, NVIDIA Titan RTX | |
| AMD Ryzen 3 3100, NVIDIA Titan RTX | |
| AMD Ryzen 5 2400G, AMD Radeon RX Vega 11 | |
| 64 Bit Multi-Core Score | |
| Intel Core i5-10600K, NVIDIA Titan RTX | |
| Intel Core i5-9400F, NVIDIA Titan RTX | |
| AMD Ryzen 3 3300X, NVIDIA Titan RTX | |
| Intel Core i3-10100, NVIDIA GeForce GT 710 | |
| AMD Ryzen 3 3100, NVIDIA Titan RTX | |
| Intel Core i3-10100, NVIDIA Titan RTX | |
| Intel Core i3-9100F, NVIDIA Titan RTX | |
| AMD Ryzen 5 2400G, AMD Radeon RX Vega 11 | |
| HWBOT x265 Benchmark v2.2 - 4k Preset | |
| Intel Core i5-10600K, NVIDIA Titan RTX | |
| Intel Core i5-9400F, NVIDIA Titan RTX | |
| AMD Ryzen 3 3300X, NVIDIA Titan RTX | |
| Intel Core i3-10100, NVIDIA GeForce GT 710 | |
| Intel Core i3-10100, NVIDIA Titan RTX | |
| AMD Ryzen 3 3100, NVIDIA Titan RTX | |
| Intel Core i3-9100F, NVIDIA Titan RTX | |
| AMD Ryzen 5 2400G, AMD Radeon RX Vega 11 | |
| R Benchmark 2.5 - Overall mean | |
| AMD Ryzen 5 2400G, AMD Radeon RX Vega 11 | |
| Intel Core i5-9400F, NVIDIA Titan RTX | |
| Intel Core i3-9100F, NVIDIA Titan RTX | |
| Intel Core i3-10100, NVIDIA Titan RTX | |
| Intel Core i3-10100, NVIDIA GeForce GT 710 | |
| AMD Ryzen 3 3100, NVIDIA Titan RTX | |
| Intel Core i5-10600K, NVIDIA Titan RTX | |
| AMD Ryzen 3 3300X, NVIDIA Titan RTX | |
| LibreOffice - 20 Documents To PDF | |
| AMD Ryzen 5 2400G, AMD Radeon RX Vega 11 | |
| Intel Core i3-9100F, NVIDIA Titan RTX | |
| AMD Ryzen 3 3100, NVIDIA Titan RTX | |
| Intel Core i5-9400F, NVIDIA Titan RTX | |
| Intel Core i3-10100, NVIDIA Titan RTX | |
| Intel Core i3-10100, NVIDIA GeForce GT 710 | |
| AMD Ryzen 3 3300X, NVIDIA Titan RTX | |
| Intel Core i5-10600K, NVIDIA Titan RTX | |
| Mozilla Kraken 1.1 - Total | |
| AMD Ryzen 5 2400G, AMD Radeon RX Vega 11 | |
| Intel Core i5-9400F, NVIDIA Titan RTX | |
| Intel Core i3-9100F, NVIDIA Titan RTX | |
| Intel Core i3-10100, NVIDIA Titan RTX | |
| Intel Core i3-10100, NVIDIA GeForce GT 710 | |
| AMD Ryzen 3 3100, NVIDIA Titan RTX | |
| Intel Core i5-10600K, NVIDIA Titan RTX | |
| AMD Ryzen 3 3300X, NVIDIA Titan RTX | |
* ... kleinere Werte sind besser
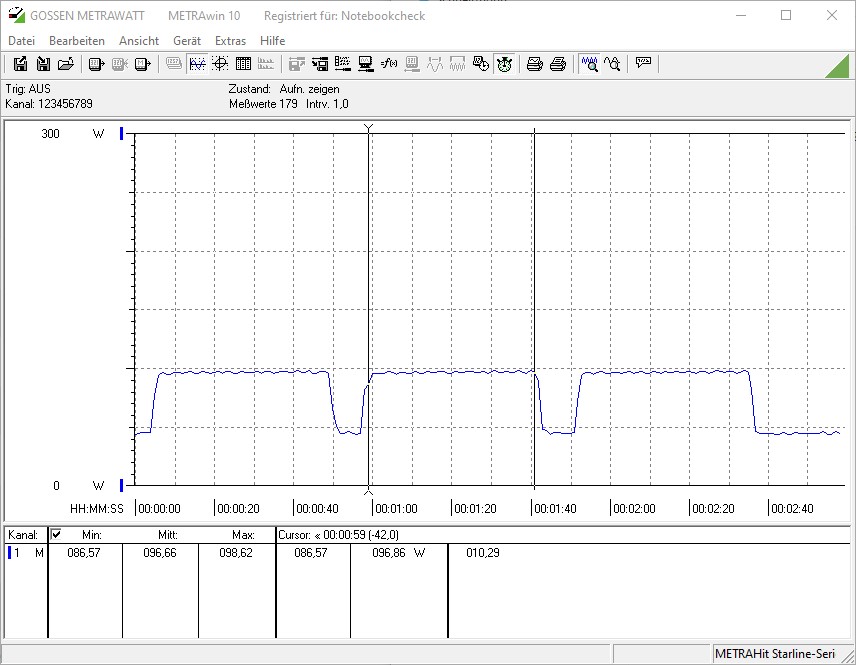
Cinebench-R15-Multi-Schleife
Anwendungsleistung und Gaming-Performance
Bei den Anwendungsbenchmarks kann der Core i3-10100 zusammen mit der sehr schnellen Nvidia Titan RTX sehr gute Ergebnisse erzielen. Wird das gleiche System mit einer sehr schwachen Grafikkarte (GeForce GT 710) betrieben, sinken auch die Benchmark-Ergebnisse drastisch. Ein AMD Ryzen 5 2400G, welcher etwa genauso viel kostet wie die Intel/Nvidia-Kombination, liefert durchweg etwas mehr Leistung im PCMark 10 und dem 3DMark.
| PCMark 10 - Score | |
| Intel Core i3-10100 | |
| AMD Ryzen 3 3300X | |
| Intel Core i5-9400F | |
| AMD Ryzen 3 3100 | |
| Intel Core i3-9100F | |
| AMD Ryzen 5 2400G | |
| Intel Core i3-10100 | |
| 3DMark | |
| 1920x1080 Fire Strike Score | |
| Intel Core i3-10100 | |
| AMD Ryzen 3 3300X | |
| Intel Core i5-9400F | |
| AMD Ryzen 3 3100 | |
| Intel Core i3-9100F | |
| AMD Ryzen 5 2400G | |
| Intel Core i3-10100 | |
| 1920x1080 Fire Strike Graphics | |
| Intel Core i3-10100 | |
| Intel Core i3-9100F | |
| Intel Core i5-9400F | |
| AMD Ryzen 3 3100 | |
| AMD Ryzen 3 3300X | |
| Intel Core i3-10100 | |
| 2560x1440 Time Spy Score | |
| Intel Core i5-9400F | |
| Intel Core i3-10100 | |
| AMD Ryzen 3 3300X | |
| AMD Ryzen 3 3100 | |
| Intel Core i3-9100F | |
| AMD Ryzen 5 2400G | |
| Intel Core i3-10100 | |
| 2560x1440 Time Spy Graphics | |
| Intel Core i3-10100 | |
| Intel Core i5-9400F | |
| AMD Ryzen 3 3300X | |
| Intel Core i3-9100F | |
| AMD Ryzen 3 3100 | |
| AMD Ryzen 5 2400G | |
| Intel Core i3-10100 | |
| 1280x720 Cloud Gate Standard Physics | |
| Intel Core i3-10100 | |
| AMD Ryzen 3 3300X | |
| Intel Core i3-10100 | |
| AMD Ryzen 3 3100 | |
| Intel Core i5-9400F | |
| AMD Ryzen 5 2400G | |
| Intel Core i3-9100F | |
| 1280x720 Cloud Gate Standard Graphics | |
| Intel Core i3-10100 | |
| Intel Core i5-9400F | |
| AMD Ryzen 3 3300X | |
| Intel Core i3-9100F | |
| AMD Ryzen 3 3100 | |
| AMD Ryzen 5 2400G | |
| Intel Core i3-10100 | |
| GTA V | |
| 1024x768 Lowest Settings possible | |
| Intel Core i3-10100 | |
| AMD Ryzen 5 2400G | |
| Intel Core i3-10100 | |
| 1366x768 Normal/Off AF:4x | |
| Intel Core i3-10100 | |
| AMD Ryzen 5 2400G | |
| Intel Core i3-10100 | |
| 1920x1080 High/On (Advanced Graphics Off) AA:2xMSAA + FX AF:8x | |
| Intel Core i3-10100 | |
| AMD Ryzen 5 2400G | |
| Intel Core i3-10100 | |
| The Witcher 3 | |
| 1024x768 Low Graphics & Postprocessing | |
| Intel Core i3-10100 | |
| AMD Ryzen 5 2400G | |
| Intel Core i3-10100 | |
| 1366x768 Medium Graphics & Postprocessing | |
| Intel Core i3-10100 | |
| Intel Core i3-10100 | |
| 1920x1080 High Graphics & Postprocessing (Nvidia HairWorks Off) | |
| Intel Core i3-10100 | |
| AMD Ryzen 5 2400G | |
| Intel Core i3-10100 | |
| Dota 2 Reborn | |
| 1280x720 min (0/3) fastest | |
| Intel Core i3-10100 | |
| Intel Core i3-10100 | |
| AMD Ryzen 5 2400G | |
| 1366x768 med (1/3) | |
| Intel Core i3-10100 | |
| AMD Ryzen 5 2400G | |
| Intel Core i3-10100 | |
| 1920x1080 high (2/3) | |
| Intel Core i3-10100 | |
| AMD Ryzen 5 2400G | |
| Intel Core i3-10100 | |
| Final Fantasy XV Benchmark | |
| 1280x720 Lite Quality | |
| Intel Core i3-10100 (1.3) | |
| AMD Ryzen 5 2400G (1.3) | |
| Intel Core i3-10100 (1.3) | |
| 1920x1080 Standard Quality | |
| Intel Core i3-10100 (1.3) | |
| AMD Ryzen 5 2400G (1.3) | |
| Intel Core i3-10100 (1.3) | |
| 1920x1080 High Quality | |
| Intel Core i3-10100 (1.3) | |
| AMD Ryzen 5 2400G (1.3) | |
| Intel Core i3-10100 (1.3) | |
| X-Plane 11.11 | |
| 1280x720 low (fps_test=1) | |
| Intel Core i3-10100 | |
| AMD Ryzen 5 2400G | |
| Intel Core i3-10100 | |
| 1920x1080 med (fps_test=2) | |
| Intel Core i3-10100 | |
| AMD Ryzen 5 2400G | |
| Intel Core i3-10100 | |
| 1920x1080 high (fps_test=3) | |
| Intel Core i3-10100 | |
| AMD Ryzen 5 2400G | |
| Intel Core i3-10100 | |
| Far Cry 5 | |
| 1280x720 Low Preset AA:T | |
| Intel Core i3-10100 | |
| AMD Ryzen 5 2400G | |
| Intel Core i3-10100 | |
| 1920x1080 Medium Preset AA:T | |
| Intel Core i3-10100 | |
| AMD Ryzen 5 2400G | |
| Intel Core i3-10100 | |
| 1920x1080 High Preset AA:T | |
| Intel Core i3-10100 | |
| AMD Ryzen 5 2400G | |
| Intel Core i3-10100 | |
| Far Cry New Dawn | |
| 1280x720 Low Preset | |
| Intel Core i3-10100 | |
| AMD Ryzen 5 2400G | |
| Intel Core i3-10100 | |
| 1920x1080 Medium Preset | |
| Intel Core i3-10100 | |
| AMD Ryzen 5 2400G | |
| Intel Core i3-10100 | |
| 1920x1080 High Preset | |
| Intel Core i3-10100 | |
| AMD Ryzen 5 2400G | |
| Intel Core i3-10100 | |
| Strange Brigade | |
| 1280x720 lowest AF:1 | |
| Intel Core i3-10100 (1.47.22.14 D3D12) | |
| AMD Ryzen 5 2400G (1.47.22.14 D3D12) | |
| Intel Core i3-10100 (1.47.22.14 D3D12) | |
| 1920x1080 medium AA:medium AF:4 | |
| Intel Core i3-10100 (1.47.22.14 D3D12) | |
| AMD Ryzen 5 2400G (1.47.22.14 D3D12) | |
| Intel Core i3-10100 (1.47.22.14 D3D12) | |
| 1920x1080 high AA:high AF:8 | |
| Intel Core i3-10100 (1.47.22.14 D3D12) | |
| AMD Ryzen 5 2400G (1.47.22.14 D3D12) | |
| Intel Core i3-10100 (1.47.22.14 D3D12) | |
| Metro Exodus | |
| 1280x720 Low Quality AF:4x | |
| Intel Core i3-10100 | |
| AMD Ryzen 5 2400G | |
| Intel Core i3-10100 | |
| 1920x1080 Medium Quality AF:4x | |
| Intel Core i3-10100 | |
| AMD Ryzen 5 2400G | |
| Intel Core i3-10100 | |
| 1920x1080 High Quality AF:16x | |
| Intel Core i3-10100 | |
| AMD Ryzen 5 2400G | |
| Intel Core i3-10100 | |
| Borderlands 3 | |
| 1280x720 Very Low Overall Quality (DX11) | |
| Intel Core i3-10100 | |
| AMD Ryzen 5 2400G | |
| Intel Core i3-10100 | |
| 1920x1080 Medium Overall Quality (DX11) | |
| Intel Core i3-10100 | |
| AMD Ryzen 5 2400G | |
| Intel Core i3-10100 | |
| 1920x1080 High Overall Quality (DX11) | |
| Intel Core i3-10100 | |
| AMD Ryzen 5 2400G | |
| Intel Core i3-10100 | |
Intel Core i3-10100 + Nvidia Titan RTX
| min. | mittel | hoch | max. | QHD | 4K | |
|---|---|---|---|---|---|---|
| GTA V (2015) | 179 | 173 | 157 | 92.4 | 87.5 | 125 |
| The Witcher 3 (2015) | 338 | 297 | 250 | 142 | 105 | |
| Dota 2 Reborn (2015) | 148.5 | 132.8 | 128.9 | 124.9 | 122.1 | |
| Final Fantasy XV Benchmark (2018) | 158 | 148 | 120 | 105 | 63.3 | |
| X-Plane 11.11 (2018) | 94.8 | 87.8 | 76.3 | 67.7 | ||
| Far Cry 5 (2018) | 151 | 135 | 128 | 120 | 116 | 80 |
| Strange Brigade (2018) | 376 | 316 | 284 | 242 | 181 | 106 |
| Far Cry New Dawn (2019) | 130 | 115 | 111 | 101 | 99 | 81 |
| Metro Exodus (2019) | 159 | 138 | 120 | 101 | 55.3 | |
| Borderlands 3 (2019) | 143 | 127 | 116 | 103 | 82.1 | 46 |
Intel Core i3-10100 + Nvidia GeForce GT 710
| min. | mittel | hoch | max. | QHD | 4K | |
|---|---|---|---|---|---|---|
| GTA V (2015) | 58.5 | 48.6 | 11.5 | 5.9 | ||
| The Witcher 3 (2015) | 15.8 | 9.63 | 5.39 | 2.82 | ||
| Dota 2 Reborn (2015) | 113.8 | 49.5 | 19.5 | 18.1 | 7.3 | |
| Final Fantasy XV Benchmark (2018) | 8.41 | 3.68 | 2.93 | 1.89 | 1.89 | |
| X-Plane 11.11 (2018) | 27.9 | 16.3 | 14.8 | 14.7 | ||
| Far Cry 5 (2018) | 11 | 5 | 4 | 4 | ||
| Strange Brigade (2018) | 19.6 | 7.7 | 5.4 | 5.1 | 5 | 5 |
| Far Cry New Dawn (2019) | 11 | 5 | 5 | |||
| Metro Exodus (2019) | 7.67 | 3.81 | 2.97 | 2.42 | ||
| Borderlands 3 (2019) | 13.7 | 5.28 | 3.33 | 2.37 |
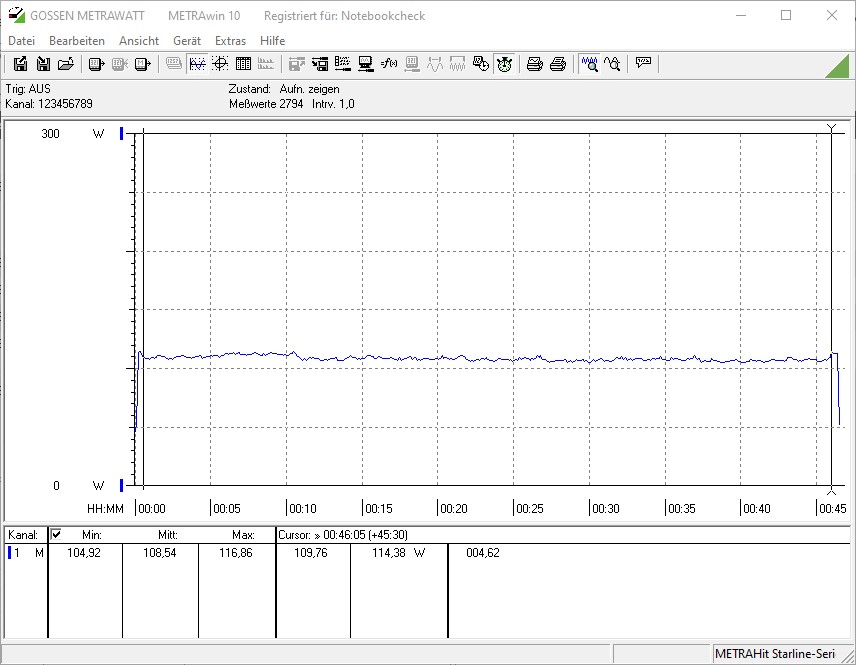
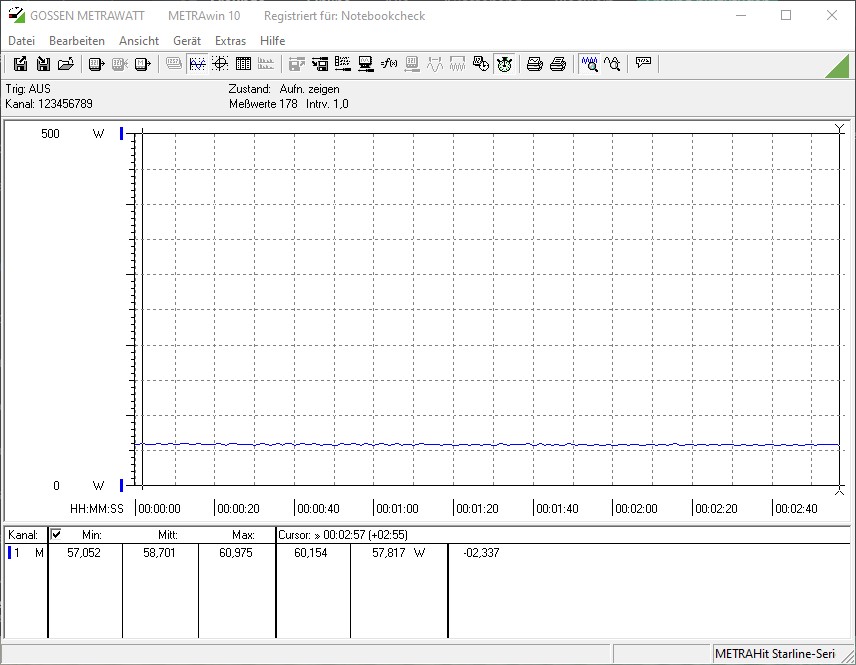
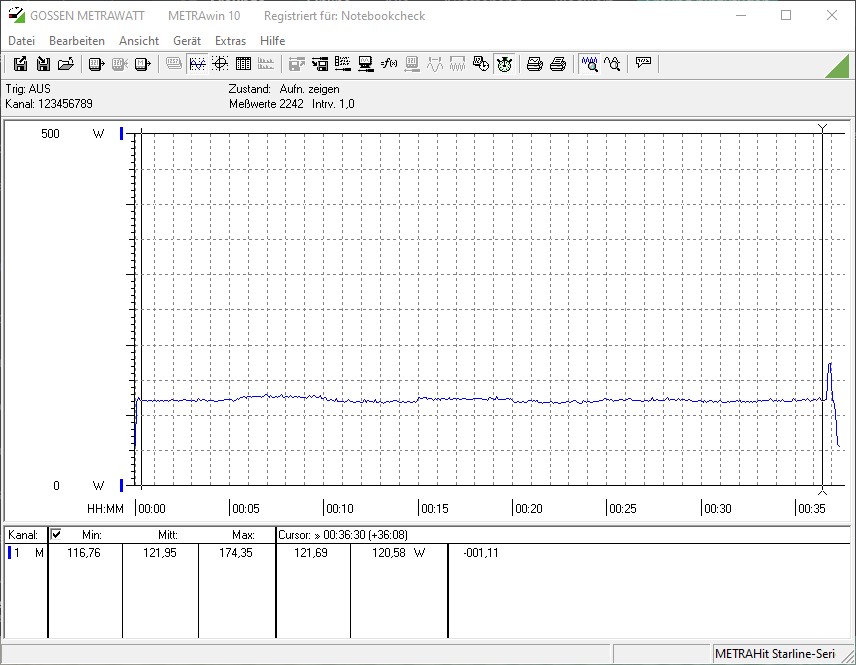
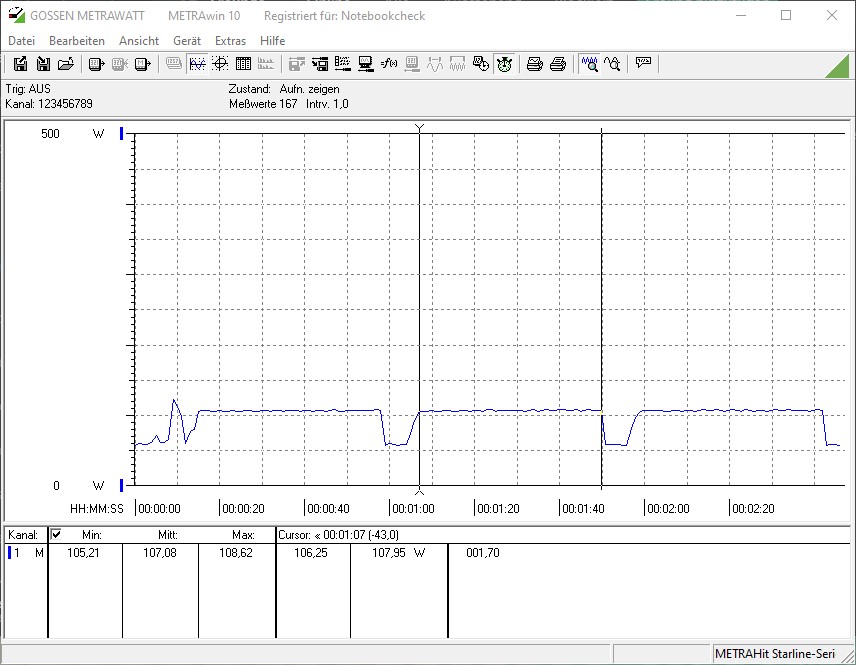
Energieverbrauch
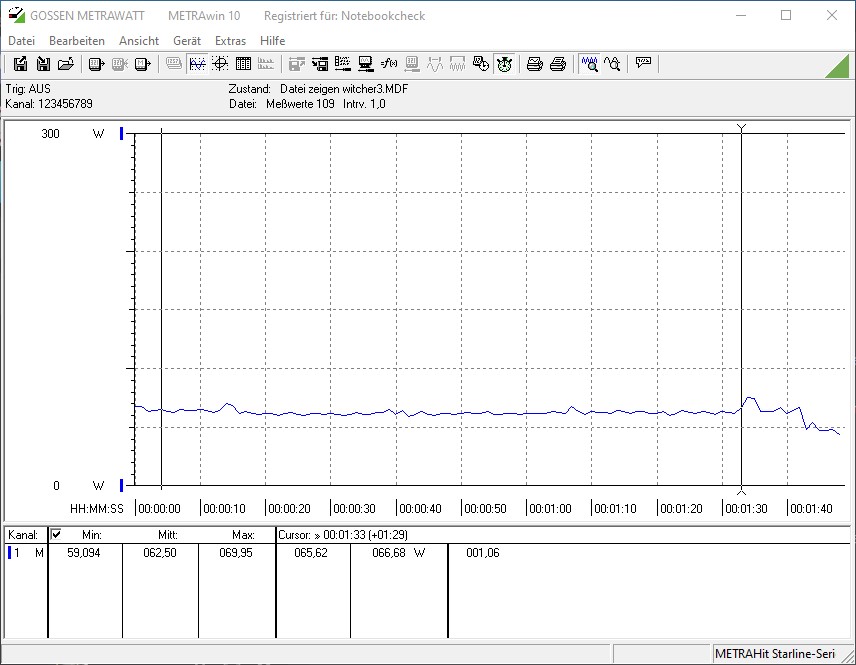
Wer einen sparsamen PC zusammenbauen möchte, ist mit einem Intel Core i3-10100 gut beraten. Im Leerlauf begnügt sich das System mit ca. 46 Watt bei Verwendung der GeForce GT 710. Nur 12 Watt mehr sind es mit der Nvidia Titan RTX. Das System auf Basis des Ryzen 5 2400G ist mit 19 Watt im Leerlauf aber nochmals sparsamer. Unter Last, beim Cinebench-R15-Multi-Test, ändert sich dies aber zugunsten des Intel Core i3-10100. Beim Stresstest und dem Spieletest ist das AMD-System wiederum etwas sparsamer. Gleichwohl sind die Unterschiede aber sehr gering. Gegenüber dem Core i3-9100F gewinnt der Core i3-10100 und ist trotz deutlichem Leistungszuwachs sparsamer geworden.
Intel Core i3-10100 + Nvidia GeForce GT 710

Intel Core i3-10100 + Nvidia Titan RTX
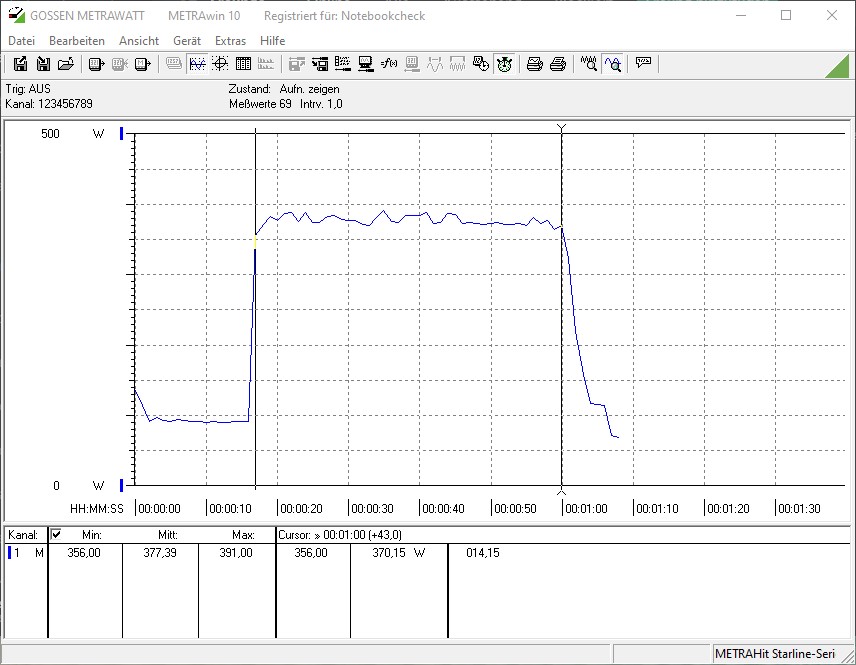
| Power Consumption / Cinebench R15 Multi (external Monitor) | |
| AMD Ryzen 3 3300X (Idle: 88.8 W) | |
| AMD Ryzen 3 3100 (Idle: 86 W) | |
| Intel Core i5 9400F (Idle: 57 W) | |
| Intel Core i3-10100 (Idle: 58.7 W) | |
| AMD Ryzen 5 2400G (Idle: 19.1 W) | |
| Intel Core i3 9100F (Idle: 56 W) | |
| Intel Core i3-10100 (Idle: 46.1 W) | |
| Power Consumption / Prime95 V2810 Stress (external Monitor) | |
| AMD Ryzen 3 3300X (Idle: 88.8 W) | |
| Intel Core i3 9100F (Idle: 56 W) | |
| AMD Ryzen 3 3100 (Idle: 86 W) | |
| Intel Core i5 9400F (Idle: 57 W) | |
| Intel Core i3-10100 (Idle: 58.7 W) | |
| Intel Core i3-10100 (Idle: 46.1 W) | |
| AMD Ryzen 5 2400G (Idle: 19.1 W) | |
| Power Consumption / The Witcher 3 ultra (external Monitor) | |
| AMD Ryzen 3 3300X (Idle: 88.8 W) | |
| AMD Ryzen 3 3100 (Idle: 86 W) | |
| Intel Core i5 9400F (Idle: 57 W) | |
| Intel Core i3-10100 (Idle: 58.7 W) | |
| Intel Core i3 9100F (Idle: 56 W) | |
| Intel Core i3-10100 (Idle: 46.1 W) | |
| AMD Ryzen 5 2400G (Idle: 19.1 W) | |
* ... kleinere Werte sind besser
Fazit - Gutes Preis-Leistungs-Verhältnis
Mit den aktuellen Comet Lake-S Prozessoren hat Intel dieses Jahr viele neue Prozessoren auf den Markt gebracht. Mit dem Intel Core i3-10100 hatten wir nun die Gelegenheit das kleinste Modell der Serie auf Herz und Nieren zu testen. Aktuell kostet der Intel Core i3-10100 ca. 105 Euro. Dafür bietet der Prozessor Hyperthreading und eine integrierte Grafikeinheit, womit das Modell für kleine Office-Systeme sehr interessant ist. AMD hat mit den APU’s Ryzen 5 2400G oder dem Ryzen 5 3400G ähnliche Produkte im Portfolio. Deren iGPU ist aber deutlich leistungsstärker, wie wir im Test gesehen haben. Selbst die GeForce GT 710 ist zusammen mit dem Core i3-10100 langsamer als das Vergleichssystem auf Basis eines AMD Ryzen 5 2400G.
Mit dem Intel Core i3-10100 bietet Intel einen schnellen und sparsamen Desktop-Prozessor für Office-Systeme an.
Wer den Intel Core i3-10100 trotzdem in ein Gaming-System packt, wird mit einer schnellen Grafikkarte aber trotzdem mit guten Frameraten belohnt. Nur CPU-lastige Spiele geraten im Vergleich mit schnelleren Prozessoren ins Hintertreffen. Die Kernkompetenz des Core i3-10100 sind aber alltägliche Office-Arbeiten, welche zudem mit einem geringen Energiebedarf erledigt werden.
Preisvergleich
Benchmarks

* Kleinere Werte sind besser
Testberichte für den Intel Core i3-10100 Prozessor
Intel Core i3-10100: NVIDIA Titan RTX, 32.00"
» Intel Core i3-10100 Desktop-Prozessor
» Vergleich mobiler Prozessoren
Alle CPU Serien für Notebooks mit kurzer Beschreibung
» Mobile Prozessoren - Benchmarkliste
Sortier- und filterbare Benchmark-Liste