Testberichte für den Intel Core Ultra 9 386H Prozessor
Eines der besten kompakten Gaming-Notebooks erhält ein helleres OLED-Display – Asus ROG Zephyrus G14 2026 im Test
Asus hat beim neuen ROG Zephyrus G14 auf Intel-CPUs umgestellt. Ausgestattet mit der GeForce RTX 5070 Ti gehört er nach wie vor zu den leistungsstärksten 14-Zoll-Laptops auf dem Markt. Zudem erreicht das 120-Hz-OLED-Display nun Helligkeitswerte von über 1.000 Nits.
Intel Core Ultra 9 386H, NVIDIA GeForce RTX 5070 Ti Laptop, 14", 1.6 kgDer perfekte Begleiter für unterwegs? MSI Prestige 13 AI+ Laptop im Test
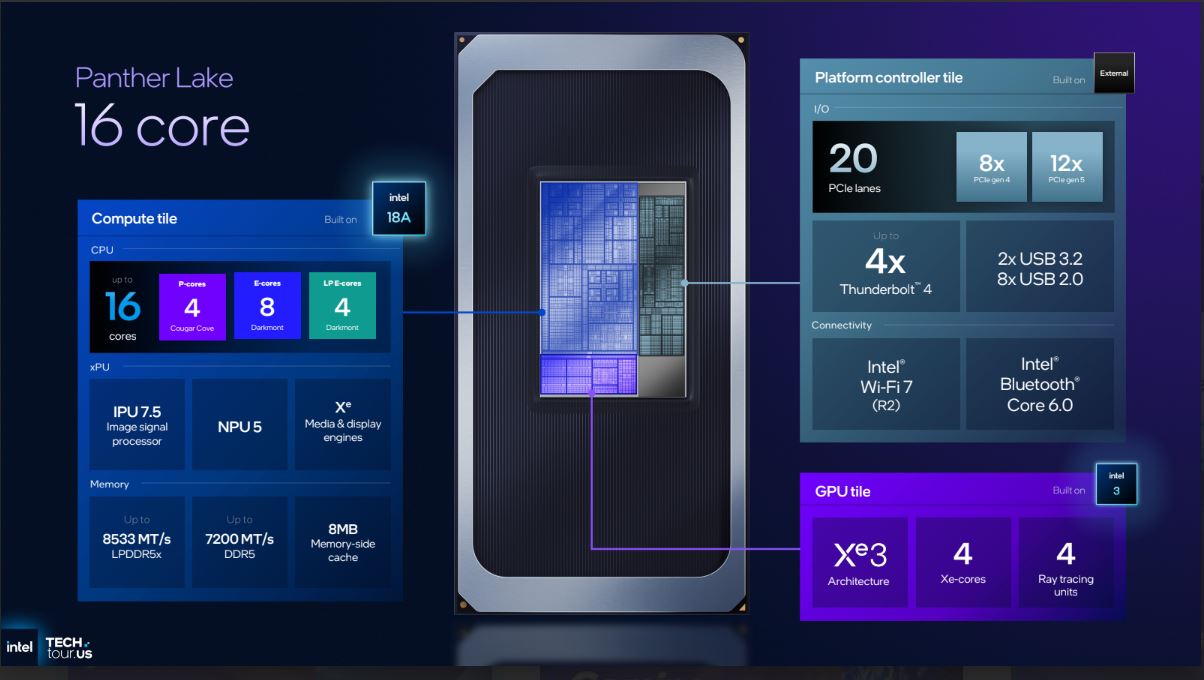
Mit dem Prestige 13 AI+ hat es MSI auf mobile Nutzer abgesehen, die viel unterwegs sind und ein kompaktes sowie möglichst leichtes Notebook schätzen. Ausgestattet mit einem taufrischen Panther Lake-Prozessor geht der 13-Zöller auf Kundenfang.
Intel Core Ultra 9 386H, Intel Graphics 4 Xe3 PTL, 13.3", 888 gAusgezeichneter 15-Zoll Multimedia-Laptop mit 1.100 nits OLED - Lenovo Yoga Pro 7i Aura Edition im Test
Lenovo ist einer der wenigen Hersteller von 15-Zoll-Geräten. Das neue Yoga Pro 7i 15 Aura Edition ist ein beeindruckender Multimedia-Laptop, der um 3.189 Euro eine Intel Panther Lake-CPU, eine GeForce RTX 5060-GPU, 32 GB RAM und einen wunderschönen 165-Hz-OLED-Touchscreen bietet.
Intel Core Ultra 9 386H, NVIDIA GeForce RTX 5060 Laptop, 15.3", 1.7 kgRazer Blade 16 mit RTX 5090 im Test: Feinschliff zum Premiumpreis
Das bisher AMD-exklusive Razer Blade 16 kann jetzt mit Intel-CPUs konfiguriert werden und die Unterschiede sind mitunter eklatant. Doch wie so oft, bekommt auch der Preis ein Upgrade...
Intel Core Ultra 9 386H, NVIDIA GeForce RTX 5090 Laptop, 16", 2.1 kgDual-screen Gaming-Convertible mit RTX 5090 - Asus ROG Zephyrus Duo GX651 im Test
Mit dem neuen ROG Zephyrus Duo, einem Gaming-Laptop mit zwei Bildschirmen, der von Intels Panther Lake-CPUs und der GeForce RTX 5090 angetrieben wird, hebt Asus das Konzept der Dual-Screen-Convertible auf ein neues Level.
Intel Core Ultra 9 386H, NVIDIA GeForce RTX 5090 Laptop, 16", 2.8 kgLenovo Pro 9 16IPH11: NVIDIA GeForce RTX 5060 Laptop, 16.00", 1.9 kg
Test » Lenovo Pro 9i 16 G11 Aura Edition Test: Eine direkte Antwort auf das Dell XPS 16
Lenovo Pro 9 16IPH11, RTX 5070: NVIDIA GeForce RTX 5070 Laptop, 16.00", 1.9 kg
Externer Test » Lenovo Pro 9 16IPH11, RTX 5070 Tests und Spezifikationen
Acer Predator Helios Neo 16S AI PHN16S-I51: NVIDIA GeForce RTX 5060 Laptop, 16.00", 2.2 kg
Externer Test » Acer Predator Helios Neo 16S AI PHN16S-I51 Tests und Spezifikationen
Lenovo Yoga Pro 9i 16 Gen 11: NVIDIA GeForce RTX 5060 Laptop, 16.00", 1.9 kg
Externer Test » Lenovo Yoga Pro 9 16i Gen 11 Tests und Spezifikationen
MSI Stealth 16 AI+ B3WI: NVIDIA GeForce RTX 5080 Laptop, 16.00", 2 kg
Externer Test » MSI Stealth 16 AI+ B3WI – Tests und technische Daten
MSI Stealth 16 AI+ B3WH: NVIDIA GeForce RTX 5070 Ti Laptop, 16.00", 2 kg
Externer Test » MSI Stealth 16 AI+ B3WH Tests und Spezifikationen
Acer Predator Helios 16S AI PHN16S-I51-94NV: NVIDIA GeForce RTX 5070 Laptop, 16.00", 2.2 kg
Externer Test » Acer Predator Helios 16S AI PHN16S-I51-94NV Tests und Spezifikationen
Asus ROG Zephyrus G16 GU606AW: NVIDIA GeForce RTX 5080 Laptop, 16.00", 2 kg
Externer Test » Asus ROG Zephyrus G16 GU606AW – Tests und technische Daten
Asus ROG Zephyrus G14 GU405AW: NVIDIA GeForce RTX 5080 Laptop, 14.00", 1.6 kg
Externer Test » Asus ROG Zephyrus G14 GU405AW
MSI Stealth 16 AI+ B3WF: NVIDIA GeForce RTX 5060 Laptop, 16.00", 2 kg
Externer Test » MSI Stealth 16 AI+ B3WF
Lenovo Pro 9 16IPH11: NVIDIA GeForce RTX 5060 Laptop, 16.00", 1.9 kg
Externer Test » Lenovo Pro 9 16IPH11
Lenovo Yoga Pro 7 15IPH11: NVIDIA GeForce RTX 5060 Laptop, 15.30", 1.7 kg
Externer Test » Lenovo Yoga Pro 7 15IPH11
Razer Blade 16 Core Ultra 9 386H: NVIDIA GeForce RTX 5090 Laptop, 16.00", 2.1 kg
Externer Test » Razer Blade 16 Core Ultra 9 386H
Asus ROG Zephyrus G14 GU405AR: NVIDIA GeForce RTX 5070 Ti Laptop, 14.00", 1.6 kg
Externer Test » Asus ROG Zephyrus G14 GU405AR
MSI Prestige 14 Flip AI+ D3MTG: Intel Graphics 4 Xe3 Panther Lake iGPU, 14.00", 1.4 kg
Externer Test » MSI Prestige 14 Flip AI+ D3MTG
Acer Aspire 14 AI A14-I71M: Intel Graphics 4 Xe3 Panther Lake iGPU, 14.00", 1.4 kg
Externer Test » Acer Aspire 14 AI A14-I71M
MSI Prestige 13 AI+ A3MG: Intel Graphics 4 Xe3 Panther Lake iGPU, 13.30", 0.9 kg
Externer Test » MSI Prestige 13 AI+ A3MG
MSI Prestige 16 Flip AI+ C3MTG (2026): Intel Graphics 4 Xe3 Panther Lake iGPU, 16.00", 1.7 kg
Externer Test » MSI Prestige 16 Flip AI+ C3MTG (2026)
Asus ZenBook S14 UX5406AA: Intel Graphics 4 Xe3 Panther Lake iGPU, 14.00", 1.2 kg
Externer Test » Asus ZenBook S14 UX5406AA
Asus ROG Zephyrus G14 GU405: NVIDIA GeForce RTX 5060 Laptop, 14.00", 1.5 kg
Externer Test » Asus ROG Zephyrus G14 GU405
Asus ROG Zephyrus Duo GX651: NVIDIA GeForce RTX 5090 Laptop, 16.00", 2.8 kg
Externer Test » Asus ROG Zephyrus Duo GX651
Asus ROG Zephyrus G16 GU606: NVIDIA GeForce RTX 5070 Laptop, 16.00"
Externer Test » Asus ROG Zephyrus G16 GU606
Asus ROG Zephyrus G14 GU405AR: NVIDIA GeForce RTX 5070 Ti Laptop, 14.00", 1.6 kg
» Testfazit Asus ROG Zephyrus G14 - Leistungsstarker und effizienter Allrounder
MSI Cubi NUC AI+ 3MG: Intel Graphics 4 Xe3 Panther Lake iGPU, 0.6 kg
» MSI Cubi NUC AI+ 3MG vs. Cubi NUC AI+ 2MG: Mini-PC ist fast überall besser
» MSI Cubi AI+ 3MG getestet: Neuer Mini-PC ist über 60% schneller, könnte aber noch flotter sein
» MSI Cubi NUC AI+ 3MG: Winziger Mini-PC unterstützt massive 128GB RAM
» Core Ultra 9 (Panther Lake), 32 GB RAM, 1 TB SSD: MSI Cubi Mini-PC im Angebot
Asus ROG Zephyrus G14 GU405AR: NVIDIA GeForce RTX 5070 Ti Laptop, 14.00", 1.6 kg
» Das Asus ROG Zepyhrus G14 2026 wird dank Panther Lake zu einem noch besseren Allrounder
» Das Asus ROG Zephyrus G14 2026 bleibt dank der RTX 5070 Ti der schnellste 14-Zoll Gamer
Lenovo Yoga Pro 7 15IPH11: NVIDIA GeForce RTX 5060 Laptop, 15.30", 1.7 kg
» Core Ultra 9, GeForce RTX 5060, 32 GB RAM, 1 TB SSD, 2.5k-OLED: Lenovo Multimedia-Notebook im Angebot
» Wenn Apples MacBook Pro plötzlich die deutlich günstigere Alternative ist bekommen Laptops wie das Lenovo Yoga Pro 7i 15 ein Problem
» Lenovo verlangt mehr als 3.000 Euro für das Yoga Pro 7i 15, ist das die neue Realität?
Razer Blade 16 Core Ultra 9 386H: NVIDIA GeForce RTX 5090 Laptop, 16.00", 2.1 kg
» Razer Blade 16: Zocken im "Quiet" Modus kann tatsächlich Sinn machen
» Neues Razer Blade 16 legt bei HDR-Spitzenhelligkeit wahnsinnig zu
» Razer Blade 16 (2026) tauscht AMD gegen Intel, mit starkem Ergebnis
» AMD oder Intel? Mit dieser CPU hält das Razer Blade 16 länger durch
Lenovo Yoga Pro 7 15IPH11: NVIDIA GeForce RTX 5060 Laptop, 15.30", 1.7 kg
» Lenovos Yoga Pro 7i 15 G11 ist eines der ersten Multimedia-Notebooks mit der neuen RTX 5070 12 GB
Asus ROG Zephyrus Duo GX651: NVIDIA GeForce RTX 5090 Laptop, 16.00", 2.8 kg
» Testfazit zum neuen Asus ROG Zephyrus Duo GX651 - Einzigartig, aber extrem teuer
» Asus ROG Zephyrus Duo 2026 vs. 2023 - Die RTX 5090 ist kaum schneller als die RTX 4090
Lenovo Pro 9 16IPH11: NVIDIA GeForce RTX 5060 Laptop, 16.00", 1.9 kg
» Lenovo Yoga Pro 9 16 Aura: Tandem-OLED mit 1.600 Nits gehört zu den hellsten Displays überhaupt
» Yoga Pro 9i 16 Aura: Hübscher Laptop sieht im offiziellen Lenovo-Shop grauenvoll aus