Testberichte für den Intel Core Ultra X7 358H Prozessor
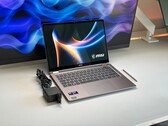
Prestige 16 AI+ C3MTG im Test: Schickes neues MSI Logo
Das neueste Prestige 16 führt bedeutende Änderungen an der Serie ein, darunter Intel Panther Lake, OLED für alle Konfigurationen und einen brandneuen Look. Im Vergleich zum letztjährigen Design sind jedoch einige wichtige Funktionen verloren gegangen oder reduziert worden.
Intel Core Ultra X7 358H, Arc B390 Panther Lake iGPU, 16", 1.6 kgKühl wie kaum ein anderer: Acer Swift 16 AI im Test
Das neue Acer Swift 16 AI kombiniert Intels aktuelle Panther-Lake-Architektur mit einem beeindruckenden OLED-Display und einem gewaltigen Touchpad. All dies wird hier schick verpackt und gut gekühlt. Der Laptop überrascht positiv mit geringen Temperaturen.
Intel Core Ultra X7 358H, Arc B390 Panther Lake iGPU, 16", 1.4 kgDell XPS 16 Core Ultra X7 358H Test: Raus mit Nvidia, rein mit Intel Arc B390
Für 400 US-Dollar mehr als das Basismodell bietet die Core-Ultra-X7-XPS-16-Konfiguration mehr RAM, mehr Speicher und deutlich mehr Leistung, ohne dass man Lüftergeräusch, Stromverbrauch oder Temperaturen erhöhen muss.
Intel Core Ultra X7 358H, Arc B390 Panther Lake iGPU, 16", 1.7 kgKhadas Mind Pro im Test: High-End-Mini-PC mit Intel Core Ultra X7 und Arc-Grafik als perfekte Basis im Khadas-Ökosystem
Khadas erweitert die Mind-Serie mit dem Mind Pro und setzt dabei auf aktuelle Intel-Prozessoren der neuesten Generation. In unserem Test nehmen wir die Variante mit Intel Core Ultra X7 358H genauer unter die Lupe, analysieren die Leistung anhand umfangreicher Benchmarks und werfen zudem einen Blick auf die Performance in Kombination mit dem Mind Graphics 2.
Intel Core Ultra X7 358H, Arc B390 Panther Lake iGPU, 566 gFast 20 Stunden Akkulaufzeit mit Panther Lake - MSI Prestige 14 Flip AI+ Convertible im Test
Mit dem Prestige 14 Flip AI+ präsentiert MSI ein kompaktes 14-Zoll-Convertible mit einem schnellen Panther-Lake-Prozessor und integriertem Stylus. Der verbaute 60-Hz OLED-Bildschirm ist allerdings sehr dunkel und unterstützt kein HDR.
Intel Core Ultra X7 358H, Arc B390 Panther Lake iGPU, 14", 1.4 kgDell XPS 14 Core Ultra X7 358H: Intel Arc B390 12 Xe3 Panther Lake iGPU, 14.00", 1.4 kg
Test » Zurück in die Zukunft mit Intel Panther Lake X7: Dell XPS 14 2026 im Test
Asus ExpertBook Ultra B9406CAA: Intel Arc B390 12 Xe3 Panther Lake iGPU, 14.00", 1.1 kg
Test » Asus ExpertBook Ultra im Test - Erfolgreicher Einstand für Intel Panther Lake X7
Xiaomi RedmiBook Pro 14 2026: Intel Arc B390 12 Xe3 Panther Lake iGPU, 14.00", 1.5 kg
Externer Test » Xiaomi RedmiBook Pro 14 2026
Dell XPS 16 Core Ultra X7 358H: Intel Arc B390 12 Xe3 Panther Lake iGPU, 16.00", 1.7 kg
Externer Test » Dell XPS 16 Core Ultra X7 358H
Acer Swift 16 AI SF16-71T-75YX: Intel Arc B390 12 Xe3 Panther Lake iGPU, 16.00", 1.4 kg
Externer Test » Acer Swift 16 AI SF16-71T-75YX
HP OmniBook X 16 (2026): Intel Arc B390 12 Xe3 Panther Lake iGPU, 16.00", 2.1 kg
Externer Test » HP OmniBook X 16 (2026)
HP EliteBook X G2i 14 NG AI: Intel Arc B390 12 Xe3 Panther Lake iGPU, 14.00", 1 kg
Externer Test » HP EliteBook X G2i 14 NG AI
Dell XPS 14 (2026) DA14260: Intel Graphics 4 Xe3 Panther Lake iGPU, 14.00", 1.4 kg
Externer Test » Dell XPS 14 (2026) DA14260
LG gram Pro AI (2026) 16Z90U: Intel Arc B390 12 Xe3 Panther Lake iGPU, 16.00", 1.2 kg
Externer Test » LG gram Pro AI (2026) 16Z90U
Asus ExpertBook Ultra B9406CAA: Intel Arc B390 12 Xe3 Panther Lake iGPU, 14.00", 1.1 kg
Externer Test » Asus ExpertBook Ultra B9406CAA
MSI Prestige 14 Flip AI+ 2026: Intel Arc B390 12 Xe3 Panther Lake iGPU, 14.00", 1.4 kg
Externer Test » MSI Prestige 14 Flip AI+ 2026
Samsung Galaxy Book6 Pro NP960XJG-KG6DE: Intel Arc B390 12 Xe3 Panther Lake iGPU, 16.00", 1.6 kg
Externer Test » Samsung Galaxy Book6 Pro NP960XJG-KG6DE
Acer Swift 16 AI SF16-71T-75YX: Intel Arc B390 12 Xe3 Panther Lake iGPU, 16.00", 1.4 kg
» Core Ultra X9, 32 GB RAM, 1 TB SSD, 2.8k-OLED: Acer Multimedia-Notebook (16 Zoll) im Angebot
Asus ExpertBook Ultra B9406CAA: Intel Arc B390 12 Xe3 Panther Lake iGPU, 14.00", 1.1 kg
» Leichter Asus Profi-Laptop mit "sehr hoher Leistung pro Watt" und 32 GB RAM jetzt günstiger verfügbar
Acer Swift 16 AI SF16-71T-75YX: Intel Arc B390 12 Xe3 Panther Lake iGPU, 16.00", 1.4 kg
» So bleibt das Acer Swift 16 selbst im Stresstest kühl
» So bleibt das Acer Swift 16 selbst im Stresstest kühl
MSI Prestige 16 AI C3MTG: Intel Arc B390 12 Xe3 Panther Lake iGPU, 16.00", 1.6 kg
» Dieser Laptop schafft Cyberpunk 2077 auf 1080p Ultra mit über 45 FPS und ist kein Gaming-Notebook
» Dieser Laptop ist eine der besten Dell XPS 16 Alternativen
» MSI Prestige 16 AI+ C3MTG läuft im Balanced-Modus deutlich leiser, aber mit Haken
Dell XPS 16 Core Ultra X7 358H: Intel Arc B390 12 Xe3 Panther Lake iGPU, 16.00", 1.7 kg
» Dell XPS 16: Core Ultra X7 ist die viel bessere Wahl als der Core Ultra 7
» Dell 16 Premium anstatt Dell XPS 16: Zwei gute Kaufgründe
» Dell XPS 16: Core Ultra X7 ist lauter und verbraucht mehr als das Core Ultra 5 Modell
» Dell XPS 16: Längere Akkulebensdauer dank versteckter BIOS-Einstellungen
» Dell XPS 16: OLED-Konfiguration hat interessante Vor- und Nachteile
Khadas Mind Pro: Intel Arc B390 12 Xe3 Panther Lake iGPU, 0.6 kg
» Khadas Mind Pro Mini-PC wird teurer: Vorbestellerpreis gilt nur bis 27. März
» Khadas Mind Pro Mini-PC im Test: Vom Office-PC zum Gaming-System mit GeForce RTX GPU
MSI Prestige 14 Flip AI+ 2026: Intel Arc B390 12 Xe3 Panther Lake iGPU, 14.00", 1.4 kg
» MSI verbaut beim Prestige 14 Flip AI+ einen ziemlich dunklen OLED-Bildschirm ohne HDR
Dell XPS 14 Core Ultra X7 358H: Intel Arc B390 12 Xe3 Panther Lake iGPU, 14.00", 1.4 kg
» Dell XPS 14 mit Arc B390 vs. GeForce RTX 4050: 3DMark erzählt nicht die ganze Geschichte
» Test-Fazit: Neues Dell XPS 14 (2026) behebt große Kritikpunkte an der Laptop-Baureihe
Asus ExpertBook Ultra B9406CAA: Intel Arc B390 12 Xe3 Panther Lake iGPU, 14.00", 1.1 kg
» Core Ultra X7 358H vs Core Ultra 7 255H: Panther Lake drosselt weniger und liefert konstantere Performance
» Asus ExpertBook Ultra ist dank Panther Lake so schnell wie manche Budget-Gaming-Laptops aber nur halb so groß
Samsung Galaxy Book6 Pro NP960XJG-KG6DE: Intel Arc B390 12 Xe3 Panther Lake iGPU, 16.00", 1.6 kg
» Samsung Galaxy Book6 Ultra startet mit Intel Panther Lake und Nvidia RTX 5070. Galaxy Book 6 und Book6 Pro im Schlepptau
» Hands-On Samsung Galaxy Book6 Serie: Alle Modelle, Preise und Starttermin