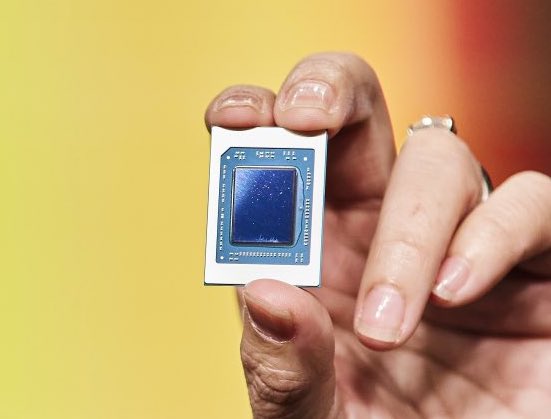
Testberichte für den AMD Ryzen 7 7735HS Prozessor
GMK NucBox K16 Mini-PC-Test: Ältere AMD‑Zen‑3‑CPU reicht für die meisten Anwender aus
GMKtec verbaut eine preiswerte Ryzen‑7‑7735HS‑CPU in ein hochwertiges, EVO‑X1‑ähnliches Gehäuse mit einem Oculink‑Port, der auf Profis ausgerichtet ist.
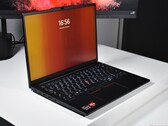
AMD Ryzen 7 7735HS, Radeon 680M, 567 gAufrüstbar und günstig: Lenovo ThinkPad E14 Gen 6 AMD Laptop im Test
Das Einstiegsmodell Lenovo ThinkPad E14 Gen 6 ist eine sehr interessante Wahl für Käuferinnen und Käufer mit geringem Budget: Es kostet deutlich weniger als andere ThinkPads und bietet dennoch die wichtigsten Qualitäten der Marke. Zu schade, dass die veralteten CPUs das Leistungspotenzial limitieren.
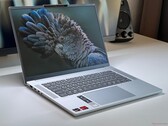
AMD Ryzen 7 7735HS, Radeon 680M, 14", 1.6 kgTest Lenovo IdeaPad Slim 5-15 Laptop - Preis-Leistungs-Kracher mit AMD-SoC und Alu-Gehäuse
Mit dem IdeaPad Slim 5-15 hat Lenovo ein günstiges Alltags-Notebook im Angebot. Für 649 Euro bekommt man neben einem ansprechenden Alu-Gehäuse einen AMD-SoC, ein mattes IPS-Display und sehr lange Akkulaufzeiten.
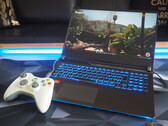
AMD Ryzen 7 7735HS, Radeon 680M, 15.3", 1.6 kgTest CSL GameStar Notebook VenomGamer G16: Premiere für die RX 7600M
Notebooks auf Basis von AMDs aktuellen Mobile-GPUs sind rar gesät. Der VenomGamer G16 von CSL Computer ist das erste Gerät mit RX 7600M, das wir für einen ausführlichen Test ergattern konnten. Wie schlägt sich das Mittelklasse-Modell gegen die RTX 4050 und RTX 4060?
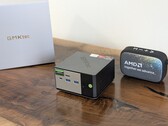
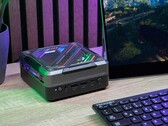
AMD Ryzen 7 7735HS, Radeon RX 7600M, 16.1", 2.4 kgAoostar GOD77 im Test - Mini-PC mit Lichteffekten und AMD Ryzen 7 7735HS im auffälligen Cyberpunk Gehäuse
Aus dem Hause Aoostar stammt der GOD77, welcher auf Basis des AMD Ryzen 7 7735HS und der AMD Radeon 680M über eine recht potente iGPU verfügt. Optisch überzeugt der Mini-PC zudem mit einem etwas extravaganten Design. Ob sich der Kauf lohnt und welche Vorzüge der Aoostar GOD77 noch zu bieten hat, klären wir in diesem Review.
AMD Ryzen 7 7735HS, Radeon 680M, 603 gMaxtang MTN-FP750: AMD Radeon 680M, 0.6 kg
Test » Maxtang MTN-FP750 Mini-PC im Test: AMD Ryzen 7 7735HS mit undurchdachter Konfiguration unnötig eingebremst
Minisforum Neptune Series HX77G: AMD Radeon RX 6600M, 1.6 kg
Test » Minisforum Neptune Series HX77G im Test: Mini-Gaming-PC mit AMD Ryzen 7 7735HS, AMD Radeon RX 6600M und 2x USB4
GMK NucBox K2: AMD Radeon 680M, 0.4 kg
Test » GMK NucBox K2 Mini-PC im Test: Überraschend gutes Preis-Leistungs-Verhältnis
Acer Nitro 17 AN17-41-R9LN: NVIDIA GeForce RTX 4070 Laptop GPU, 17.30", 3 kg
Test » Test Acer Nitro 17 Ryzen-Edition: QHD-Gaming-Laptop mit RTX 4070
Acer Nitro 16 AN16-41: NVIDIA GeForce RTX 4070 Laptop GPU, 16.00", 2.7 kg
Test » Acer Nitro 16 AN16-41 im Test: Gaming-Notebook mit RTX 4070 bietet gute Laufzeiten
Asus TUF A15 FA507: NVIDIA GeForce RTX 4050 Laptop GPU, 15.60", 2.2 kg
Test » Asus TUF Gaming A15 Laptop im Test - Budget-Gamer mit RTX 4050 und 144 Hz
Lenovo Slim Pro 7 14ARP8: NVIDIA GeForce RTX 3050 6GB Laptop GPU, 14.50", 1.6 kg
Test » Lenovo Yoga Slim 7 Pro mit Ryzen 7 7735HS Laptop im Test: Neue CPU mit alter Performance
Lenovo Yoga Pro 7 14ARP G8: AMD Radeon 680M, 14.50", 1.5 kg
Test » Lenovo Yoga Pro 7 14 im Test - Das nahezu perfekte Ultrabook mit AMD Zen3+
Asus TUF Gaming A16 FA617: AMD Radeon RX 7600S, 16.00", 2.2 kg
Test » Test Asus TUF Gaming A16 Advantage Edition: AMD-Notebook im Zeichen der 7
Blackview GamiBook 8: AMD Radeon 680M, 16.00", 1.8 kg
Externer Test » Blackview GamiBook 8
MSI Thin A15 B7VF: NVIDIA GeForce RTX 4060 Laptop GPU, 15.60", 1.9 kg
Externer Test » MSI Thin A15 B7VF
Lenovo IdeaPad Slim 5 15ARP10: AMD Radeon 680M, 15.10", 1.5 kg
Externer Test » Lenovo IdeaPad Slim 5 15ARP10
Acer Nitro V15 ANV15-41, R7 7735HS: NVIDIA GeForce RTX 4050 Laptop GPU, 15.60", 2.1 kg
Externer Test » Acer Nitro V15 ANV15-41, R7 7735HS
Lenovo Thinkpad E16 G2: AMD Radeon 680M, 16.00", 1.8 kg
Externer Test » Lenovo Thinkpad E16 G2
Acer Nitro V15 ANV15-41: NVIDIA GeForce RTX 4060 Laptop GPU, 15.60", 2.1 kg
Externer Test » Acer Nitro V15 ANV15-41
Acer Nitro 17 AN17-41-R38P: NVIDIA GeForce RTX 4060 Laptop GPU, 17.30", 3.1 kg
Externer Test » Acer Nitro 17 AN17-41-R38P
Acer Nitro 16 AN16-41, R7 7735HS RTX 4060: NVIDIA GeForce RTX 4060 Laptop GPU, 16.00", 2.7 kg
Externer Test » Acer Nitro 16 AN16-41, R7 7735HS RTX 4060
Asus ROG Zephyrus G14 GA402NU: NVIDIA GeForce RTX 4050 Laptop GPU, 14.00", 1.7 kg
Externer Test » Asus ROG Zephyrus G14 GA402NU
MSI Bravo 15 C7VF: NVIDIA GeForce RTX 4060 Laptop GPU, 15.60", 2.3 kg
Externer Test » MSI Bravo 15 C7VF
Lenovo IdeaPad 5 Pro 16ARP8: AMD Radeon 680M, 16.00", 1.9 kg
Externer Test » Lenovo IdeaPad 5 Pro 16ARP8
Lenovo Yoga Pro 7 14ARP G8: AMD Radeon 680M, 14.50", 1.5 kg
Externer Test » Lenovo Yoga Pro 7 14ARP G8
Acer Nitro 16 AN16-41: NVIDIA GeForce RTX 4070 Laptop GPU, 16.00", 2.7 kg
Externer Test » Acer Nitro 16 AN16-41
Acer Nitro 16 AN16-41-R8UR: NVIDIA GeForce RTX 4070 Laptop GPU, 16.00", 2.7 kg
Externer Test » Acer Nitro 16 AN16-41-R8UR
MSI Bravo 15 C7UDX: NVIDIA GeForce RTX 3050 6GB Laptop GPU, 15.60", 2.3 kg
Externer Test » MSI Bravo 15 C7UDX
Asus TUF Gaming A15 FA507NV: NVIDIA GeForce RTX 4060 Laptop GPU, 15.60", 2.2 kg
Externer Test » Asus TUF Gaming A15 FA507NV
MSI Bravo 15 C7V: NVIDIA GeForce RTX 4050 Laptop GPU, 15.60", 2.3 kg
Externer Test » MSI Bravo 15 C7V
Acer Nitro 17 AN17-41-R9LN: NVIDIA GeForce RTX 4070 Laptop GPU, 17.30", 3 kg
Externer Test » Acer Nitro 17 AN17-41-R9LN
Asus TUF Gaming A15 FA507NU: NVIDIA GeForce RTX 4050 Laptop GPU, 15.60", 2.2 kg
Externer Test » Asus TUF Gaming A15 FA507NU
Lenovo Slim Pro 7 14ARP8: NVIDIA GeForce RTX 3050 6GB Laptop GPU, 14.50", 1.6 kg
Externer Test » Lenovo Slim Pro 7 14ARP8
Asus TUF Gaming A17 FA707NU-HX032W: NVIDIA GeForce RTX 4050 Laptop GPU, 17.30", 2.6 kg
Externer Test » Asus TUF Gaming A17 FA707NU-HX032W
Asus TUF Gaming A16 FA617: AMD Radeon RX 7600S, 16.00", 2.2 kg
Externer Test » Asus TUF Gaming A16 FA617
Acer Nitro 5 AN515-47-R79X: NVIDIA GeForce RTX 3050 4GB Laptop GPU, 15.60", 2.5 kg
Externer Test » Acer Nitro 5 AN515-47-R79X
Lenovo ThinkPad E14 Gen 6 21M3002KGE: AMD Radeon 680M, 14.00", 1.6 kg
» Deal: Lenovo ThinkPad E14 G6 mit Ryzen 5 7535HS gibts jetzt ab 520€, Bestpreis auch für ThinkPad E16 G2
Lenovo IdeaPad Slim 5-15ARP G10: AMD Radeon 680M, 15.30", 1.6 kg
» Deal: Lenovo IdeaPad Slim 5 mit 165 Hz OLED und 32 GB RAM gibts kurze Zeit günstiger denn je
» Ryzen 7, 32 GB RAM, 1 TB SSD, 2.5k-OLED (165 Hz, DCI-P3): Lenovo Multimedia-Notebook im Angebot
Lenovo IdeaPad Slim 5 15ARP10: AMD Radeon 680M, 15.10", 1.5 kg
» Deal: Lenovo IdeaPad Slim 5 mit Ryzen, 16 GB RAM und 1 TB SSD ist jetzt günstiger als Apple MacBook Neo
GMK NucBox K16: AMD Radeon 680M, 0.6 kg
» Drei Jahre alter Ryzen 7 7735HS zeigt starke Leistung gegen Ryzen AI 7 445
Lenovo IdeaPad Slim 5-15ARP G10: AMD Radeon 680M, 15.30", 1.6 kg
» 2.5k-OLED (165 Hz, DCI-P3), Ryzen 7, 32 GB RAM, 1 TB SSD: Lenovo IdeaPad im Angebot
» 32GB RAM, Ryzen 7 und 165Hz-OLED: Lenovo-Notebook zum Top-Preis direkt vom Hersteller
» Lenovo IdeaPad mit 2.5k-OLED (165 Hz, DCI-P3), Ryzen 7, 32 GB RAM, 1 TB SSD im Angebot
» OLED (2.5k, 165 Hz, DCI-P3), Ryzen 7, 32 GB RAM, 1 TB SSD: Lenovo IdeaPad im Angebot
Lenovo Thinkpad E16 G2: AMD Radeon 680M, 16.00", 1.8 kg
» Lenovo-Deal: ThinkPad E16 mit hellem QHD-Display und AMD-CPU für unter 700 Euro dank 37% CB-Rabatt
Lenovo IdeaPad Slim 5-15ARP G10: AMD Radeon 680M, 15.30", 1.6 kg
» OLED (2.5k, 165 Hz, DCI-P3), Ryzen 7, 32 GB RAM: Lenovo IdeaPad Slim 5 im Angebot für 749 Euro
» Viel Power, Top-Ausstattung: Lenovo packt das IdeaPad Slim 5 randvoll mit Technik
Lenovo Thinkpad E16 G2: AMD Radeon 680M, 16.00", 1.8 kg
» ThinkPad E16 Gen 2: QHD-Display mit 400 Nits, AMD Ryzen 7 und 40% Rabatt direkt bei Lenovo
Lenovo IdeaPad Slim 5-15ARP G10: AMD Radeon 680M, 15.30", 1.6 kg
» OLED, Ryzen 7, 16 GB RAM: Schickes Office-Notebook von Lenovo im Angebot für 679 Euro
» Ryzen 7, 16 GB RAM, OLED-Bildschirm: Premium-Office-Laptop von Lenovo für 699 Euro
Acer Nitro 17 AN17-41-R9LN: NVIDIA GeForce RTX 4070 Laptop GPU, 17.30", 3 kg
» Deal: Günstiger QHD-Gamer dank Acer-Cashback mit Ryzen 7, RTX 4070 und 100% DCI-P3 zum Allzeit-Bestpreis
Lenovo ThinkPad E14 Gen 6 21M3002KGE: AMD Radeon 680M, 14.00", 1.6 kg
» Weg mit den billigen Displays, Lenovo: Bildschirm des ThinkPad E14 Gen 6 sollte nicht mehr existieren
Asus TUF A15 FA507: NVIDIA GeForce RTX 4050 Laptop GPU, 15.60", 2.2 kg
» Alternate Black November: Gaming-Laptops wie Asus ROG Strix G16 mit RTX 4080 und QHD+ Display zu Bestpreisen
Asus TUF Gaming A15 FA507NV: NVIDIA GeForce RTX 4060 Laptop GPU, 15.60", 2.2 kg
» Deal: Asus TUF A15 Gaming-Notebook mit RTX 4060 und Ryzen 7 um satte 30% rabattiert
Asus TUF Gaming A16 FA617: AMD Radeon RX 7600S, 16.00", 2.2 kg
» Deal: Asus TUF Gaming A16 Laptop mit RX 7600S, 100% sRGB und sehr langer Akkulaufzeit zum Bestpreis bei Alternate
Aoostar GOD77: AMD Radeon 680M, 0.6 kg
» Aoostar GOD77 Mini-PC mit gutem Preis-Leistungs-Verhältnis bekommt einen AMD Ryzen 7 7735HS
Asus TUF A15 FA507: NVIDIA GeForce RTX 4050 Laptop GPU, 15.60", 2.2 kg
» Otto-Deal: ASUS TUF Gaming A15 Laptop bietet aktuell beste Preis-Leistung mit RTX 4060 samt 140W-TGP und AMD Ryzen 7
Acer Nitro 17 AN17-41-R9LN: NVIDIA GeForce RTX 4070 Laptop GPU, 17.30", 3 kg
» Leiser 17 Zoll Gaming-Laptop Acer Nitro 17 mit AMD Ryzen 7, RTX 4060 und QHD-Display samt 98 % DCI-P3 günstig bei Amazon
Lenovo IdeaPad 5 Pro 16ARP8: AMD Radeon 680M, 16.00", 1.9 kg
» Deal: Lenovo IdeaPad Pro 5 mit AMD Ryzen 7 7735HS, 32GB RAM und QHD-Display erhält gigantischen 34% Rabatt
Acer Nitro 17 AN17-41-R9LN: NVIDIA GeForce RTX 4070 Laptop GPU, 17.30", 3 kg
» Deal: Acer Nitro 17 Gaming-Notebook mit RTX 4070, AMD Ryzen 7 7840HS und QHD-Display zum Bestpreis
Minisforum Neptune Series HX77G: AMD Radeon RX 6600M, 1.6 kg
» Gaming-Mini-PC im Test: Minisforum Neptune Series HX77G mit AMD Ryzen 7 7735HS und AMD Radeon RX 6600M
Lenovo Yoga Pro 7 14ARP G8: AMD Radeon 680M, 14.50", 1.5 kg
» Deal: Lenovo Yoga Pro 7 Ultrabook mit AMD Ryzen 7 7735HS, 16GB RAM und QHD-Display zum Tiefpreis bestellbar
Asus TUF A15 FA507: NVIDIA GeForce RTX 4050 Laptop GPU, 15.60", 2.2 kg
» Asus TUF Gaming A15 für 1.100 Euro ermöglicht Ray Tracing dank RTX 4050 Laptop
Acer Nitro 16 AN16-41: NVIDIA GeForce RTX 4070 Laptop GPU, 16.00", 2.7 kg
» Acer Nitro 16 AN16-41: Gaming-Bolide mit hellem Display und langen Laufzeiten
Lenovo Yoga Pro 7 14ARP G8: AMD Radeon 680M, 14.50", 1.5 kg
» Lenovos neues Yoga Pro 7 14 AMD bietet ein fast unschlagbares Preis-Leistungsverhältnis