Testberichte für den Intel Core i9-13900H Prozessor
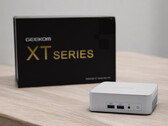
Geekom XT13 Pro im Test: NUC-Mini-PC verzichtet auf Meteor Lake und bekommt nur einen Intel Core i9-13900H
Als leistungsstarken NUC-Mini-PC hat Geekom den XT13 Pro auf Basis eines Intel Core i9-13900H vorgestellt. Damit bleiben Intels Meteor-Lake-Prozessoren weiterhin außen vor. Wie gut das High-End-Modell der Raptor-Lake-H-Reihe gegenüber den neueren Prozessoren abschneidet, haben wir anhand zahlreicher Messungen und Benchmarks analysiert.
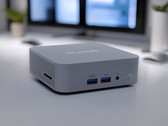
Intel Core i9-13900H, Iris Xe G7 96EUs, 555 gGeekom GT13 Pro Mini-PC im Test - schicke NUC-Alternative mit Intel Core i9-13900H, 32 GB DDR4-RAM und 2-TB-SSD
Mit einem schicken Design knüpft Geekom mit dem GT13 Pro an die bestehende Modellpalette an. Der Intel Core i9-13900H verspricht dabei viel, doch wie gut sich das High-End-SoC in dem kleinen 0,5-l-Gehäuse schlägt, schauen wir uns in diesem ausführlichen Review genauer an. Mit 32 GB RAM und einer 2-TB-SSD klotzt der Mini-PC mit einer guten Ausstattung, die sich auch bei den Anschlüssen mit zwei USB4-Ports widerspiegelt.
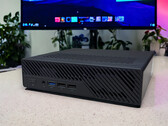
Intel Core i9-13900H, Iris Xe G7 96EUs, 440 gTest: Minisforum MS-01 Workstation debütiert mit Intel Core i9-13900H, verzichtet aber ab Werk auf eine dedizierte Grafikkarte
Hinter dem Minisforum MS-01 verbirgt sich laut Hersteller eine Workstation für leistungshungrige Workloads. Ausgestattet mit einem Intel Core i9-13900H sowie schnellem DDR5-RAM und der Möglichkeit, mehrere SSDs im Gerät unterzubringen – all das klingt vielversprechend. Außerdem verfügt der MS-01 über eine physische PCIe-x16-Schnittstelle, um Erweiterungskarten zu installieren.
Update 19.05.2024: Nachdem wir ein Ersatzgerät geprüft haben, können wir nun die finale Bewertung vornehmen.
Intel Core i9-13900H, Iris Xe G7 96EUs, 1.5 kgAsus VivoBook S15 BAPE im Laptop Test: Ein affenstarkes OLED-Notebook? Oder geht die Sonderedition baden?
Die BAPE Edition des Asus VivoBook S15 OLED fällt auf - nicht nur mit ihrem Design, sondern auch dem Lieferumfang. Ob das Multimedia-Notebook mit OLED-Display und Intel Core i9-13900H auch in der Praxis überzeugt, verrät unser Testbericht des "A Bathing Ape"-Laptops.
Intel Core i9-13900H, Iris Xe G7 96EUs, 15.6", 1.6 kgHuawei MateBook D 16 2024 im Test - Multimedia-Laptop jetzt mit Intel Core i9-13900H
Huawei stattet das 2024er-Modell seines Multimedia-Laptops MateBook D 16 mit einem Core i9-13900H-Prozessor von Intel aus, der durch geringe Power Limits allerdings ausgebremst wird. Vor allem bei den Anschlüssen wurde zudem massiv der Rotstift angesetzt, dafür wurde aber die Akkulaufzeit verbessert.
Intel Core i9-13900H, Iris Xe G7 96EUs, 16", 1.7 kgGeekom Mini IT13: Intel Iris Xe Graphics G7 96EUs, 0.7 kg
Test » Geekom Mini IT13 Mini PC im Test - Mini-Desktop mit einem leistungsfähigen Core i9
MSI Stealth 16 Mercedes-AMG Motorsport A13VG: NVIDIA GeForce RTX 4070 Laptop GPU, 16.00", 1.9 kg
Test » Test MSI Stealth 16 Mercedes-AMG Motorsport Laptop: Mobiler Rennwagen mit OLED-Display
Asus VivoBook Pro 16 K6602VU: NVIDIA GeForce RTX 4050 Laptop GPU, 16.00", 1.9 kg
Test » Asus VivoBook Pro 16 (2023) im Laptop-Test: Paket aus Core i9-13900H, RTX 4050 und 3.2K-OLED für Hobby-Kreative
Schenker XMG Pro 16 Studio (Mid 23): NVIDIA GeForce RTX 4070 Laptop GPU, 16.00", 2.6 kg
Test » XMG Pro 16 Studio (Mid 23) im Test: RTX-4070-Laptop für Gamer und Creator
Lenovo ThinkPad P1 G6-21FV000DGE: NVIDIA RTX 2000 Ada Generation Laptop, 16.00", 1.9 kg
Test » Lenovo ThinkPad P1 G6 Laptop im Test - Mobile Workstation ersetzt das ThinkPad X1 Extreme
Dell Precision 5480: NVIDIA RTX 3000 Ada Generation Laptop, 14.00", 1.6 kg
Test » Nvidia RTX 3000 Ada Leistungsdebüt: Dell Precision 5480 Workstation im Test
Dell Precision 5000 5680: NVIDIA RTX 5000 Ada Generation Laptop, 16.00", 2.3 kg
Test » Dell Precision 5680 im Test: Ada Lovelace dominiert auf Workstations
Lenovo Legion Slim 7i 16 Gen 8: NVIDIA GeForce RTX 4070 Laptop GPU, 16.00", 2.1 kg
Test » Lenovo Legion Slim 7i 16 (Gen 8) Gaming-Laptop im Test: Dünner als das Razer Blade 16
Asus ZenBook 14X UX3404VC: Intel Iris Xe Graphics G7 96EUs, 14.50", 1.6 kg
Test » Asus ZenBook 14X (2023) Laptop im Test - OLED-Ultrabook am Limit
Huawei MateBook 16s i9: Intel Iris Xe Graphics G7 96EUs, 16.00", 2 kg
Test » Huawei MateBook 16s 2023 Laptop im Test - Multimedia-Notebook jetzt mit hellerem 3:2 Display
Asus ROG Flow X16 GV601V: NVIDIA GeForce RTX 4060 Laptop GPU, 16.00", 2.1 kg
Test » Flaches Asus ROG Flow X16 im Laptop-Test: Starkes 16-Zoll-Gaming-Workstation-Convertible mit Touch-Display
Asus Zenbook Pro 14 OLED UX6404VI: NVIDIA GeForce RTX 4070 Laptop GPU, 14.50", 1.7 kg
Test » Asus Zenbook Pro 14 OLED Laptop im Test - MacBook Pro Konkurrent mit 120 Hz OLED
Asus ZenBook Pro 14 Duo UX8402VV-P1021W: NVIDIA GeForce RTX 4060 Laptop GPU, 14.50", 1.8 kg
Test » Asus ZenBook Pro 14 Duo Kreativ-Laptop mit Zweitbildschirm im Test: Gesteigerte Produktivität
Samsung Galaxy Book3 Ultra 16, i9-13900H RTX 4070: NVIDIA GeForce RTX 4070 Laptop GPU, 16.00", 1.8 kg
Test » Samsung Galaxy Book3 Ultra 16 mit RTX 4070 im Notebook-Test: Viel Grafikleistung im Business-Look
Asus ROG Flow Z13 GZ301V: NVIDIA GeForce RTX 4060 Laptop GPU, 13.40", 1.6 kg
Test » Asus ROG Flow Z13 im Test: Wahnsinn - RTX 4060 in einem beeindruckenden Gaming-Tablet
MSI Stealth 17 Studio A13VH-014: NVIDIA GeForce RTX 4080 Laptop GPU, 17.30", 3 kg
Test » MSI Stealth 17 Studio im Test: Laptop mit ruhiger RTX 4080 für fast jede Gelegenheit
Asus ROG Flow Z13 ACRNM: NVIDIA GeForce RTX 4070 Laptop GPU, 13.40", 1.7 kg
Test » Asus ROG Flow Z13 ACRNM im Test - Gaming-Convertible mit RTX 4070 Laptop
Asus ROG Zephyrus M16 GU604VY-NM042X: NVIDIA GeForce RTX 4090 Laptop GPU, 16.00", 2.3 kg
Test » Asus ROG Zephyrus M16 (2023) im Laptop-Test: RTX 4090 mit super-hellem miniLED-Display
Gigabyte AERO 16 OLED BSF: NVIDIA GeForce RTX 4070 Laptop GPU, 16.00", 2.1 kg
Test » Dünnes Gigabyte AERO 16 OLED im Laptop-Test: Effiziente RTX 4070 für Gamer und Kreative
Acer Aspire 17 A17-51M: Intel Iris Xe Graphics G7 96EUs, 17.30", 2.1 kg
Externer Test » Acer Aspire 17 A17-51M
MSI Modern 14 H D13MG: Intel Iris Xe Graphics G7 96EUs, 14.00", 1.6 kg
Externer Test » MSI Modern 14 H D13MG
Acer Nitro V 15 ANV15-51, i9-13900H: NVIDIA GeForce RTX 4060 Laptop GPU, 15.60", 2.1 kg
Externer Test » Acer Nitro V 15 ANV15-51, i9-13900H
Infinix GT Book 16: NVIDIA GeForce RTX 4060 Laptop GPU, 16.00", 2 kg
Externer Test » Infinix GT Book 16
Asus Vivobook S 14 Flip TP3402VA, i9-13900H: Intel Iris Xe Graphics G7 96EUs, 14.00", 1.5 kg
Externer Test » Asus Vivobook S 14 Flip TP3402VA, i9-13900H
Lenovo Legion Slim 7 16IRH8, i9-13900H RTX 4070: NVIDIA GeForce RTX 4070 Laptop GPU, 16.00", 2 kg
Externer Test » Lenovo Legion Slim 7 16IRH8, i9-13900H RTX 4070
Huawei MateBook D 16 2024: Intel Iris Xe Graphics G7 96EUs, 16.00", 1.7 kg
Externer Test » Huawei MateBook D 16 2024
MSI Modern 15 H B13M: Intel Iris Xe Graphics G7 96EUs, 15.60", 1.9 kg
Externer Test » MSI Modern 15 H B13M
Dell XPS 17 9730, i9-13900H: NVIDIA GeForce RTX 4070 Laptop GPU, 17.00", 2.4 kg
Externer Test » Dell XPS 17 9730, i9-13900H
Lenovo ThinkPad P1 G6-21FV000DGE: NVIDIA RTX 2000 Ada Generation Laptop, 16.00", 1.9 kg
Externer Test » Lenovo ThinkPad P1 G6-21FV000DGE
Asus Vivobook S 14 OLED K5404VA: Intel Iris Xe Graphics G7 96EUs, 14.50", 1.5 kg
Externer Test » Asus Vivobook S 14 OLED K5404VA
Asus VivoBook Pro 16 OLED K6602V: NVIDIA GeForce RTX 4050 Laptop GPU, 16.00", 1.9 kg
Externer Test » Asus VivoBook Pro 16 OLED K6602V
Dell Precision 5480: NVIDIA RTX 3000 Ada Generation Laptop, 14.00", 1.6 kg
Externer Test » Dell Precision 5480
Asus TUF Gaming F17 FX707VV: NVIDIA GeForce RTX 4060 Laptop GPU, 17.30", 2.6 kg
Externer Test » Asus TUF Gaming F17 FX707VV
Asus VivoBook S15 OLED K5504, i9-13900H: Intel Iris Xe Graphics G7 96EUs, 15.60", 1.8 kg
Externer Test » Asus VivoBook S15 OLED K5504, i9-13900H
MSI Stealth 16 Studio A13VF, i9-13900H: NVIDIA GeForce RTX 4060 Laptop GPU, 16.00", 2 kg
Externer Test » MSI Stealth 16 Studio A13VF, i9-13900H
Asus ZenBook 14X OLED UX3404VA, i9-13900H: Intel Iris Xe Graphics G7 96EUs, 14.50", 1.6 kg
Externer Test » Asus ZenBook 14X OLED UX3404VA, i9-13900H
HP Zbook Power G10: NVIDIA RTX 3000 Ada Generation Laptop, 15.60", 2 kg
Externer Test » HP Zbook Power G10
Asus VivoBook 16X OLED K3605VV: NVIDIA GeForce RTX 4060 Laptop GPU, 16.00", 1.8 kg
Externer Test » Asus VivoBook 16X OLED K3605VV
Asus Vivobook 17X K3704VA: Intel Iris Xe Graphics G7 96EUs, 17.30", 2.1 kg
Externer Test » Asus Vivobook 17X K3704VA
Asus ZenBook Pro 16X OLED UX7602BZ: NVIDIA GeForce RTX 4080 Laptop GPU, 16.00", 2.2 kg
Externer Test » Asus ZenBook Pro 16X OLED UX7602BZ
Dell Precision 5000 5680: NVIDIA RTX 5000 Ada Generation Laptop, 16.00", 2.3 kg
Externer Test » Dell Precision 5000 5680
MSI Stealth 17 Studio A13VI, i9-13900H: NVIDIA GeForce RTX 4090 Laptop GPU, 17.30", 2.8 kg
Externer Test » MSI Stealth 17 Studio A13VI, i9-13900H
Asus ZenBook Pro 14 Duo UX8402VV-P1021W: NVIDIA GeForce RTX 4060 Laptop GPU, 14.50", 1.8 kg
Externer Test » Asus ZenBook Pro 14 Duo UX8402VV-P1021W
HP Envy 16-h1000: NVIDIA GeForce RTX 4060 Laptop GPU, 16.00", 2.7 kg
Externer Test » HP Envy 16-h1000
Origin PC EON14-S 2023: NVIDIA GeForce RTX 4070 Laptop GPU, 14.00", 1.8 kg
Externer Test » Origin PC EON14-S 2023
Asus Vivobook 15 OLED L1201W: Intel Iris Xe Graphics G7 96EUs, 15.60", 1.7 kg
Externer Test » Asus Vivobook 15 OLED L1201W
Huawei MateBook D 16 2023: Intel Iris Xe Graphics G7 96EUs, 16.00", 1.7 kg
Externer Test » Huawei MateBook D 16 2023
Lenovo Legion Slim 7i 16 Gen 8: NVIDIA GeForce RTX 4070 Laptop GPU, 16.00", 2.1 kg
Externer Test » Lenovo Legion Slim 7i 16 Gen 8
Hyperbook SL606, i9-13900H RTX 4070: NVIDIA GeForce RTX 4070 Laptop GPU, 16.00", 2.7 kg
Externer Test » Hyperbook SL606, i9-13900H RTX 4070
Asus ROG Flow Z13 GZ301VU: NVIDIA GeForce RTX 4050 Laptop GPU, 13.40", 1.2 kg
Externer Test » Asus ROG Flow Z13 GZ301VU
Asus VivoBook Pro 15 OLED K6502VU: NVIDIA GeForce RTX 4050 Laptop GPU, 15.60", 1.8 kg
Externer Test » Asus VivoBook Pro 15 OLED K6502VU
Asus Vivobook 14X K3405VC: NVIDIA GeForce RTX 3050 4GB Laptop GPU, 14.00", 1.4 kg
Externer Test » Asus Vivobook 14X K3405VC
Asus ZenBook Pro 14 Duo UX8402VU: NVIDIA GeForce RTX 4050 Laptop GPU, 14.50", 1.8 kg
Externer Test » Asus ZenBook Pro 14 Duo UX8402VU
Asus VivoBook Pro 16 OLED K6602VV: NVIDIA GeForce RTX 4060 Laptop GPU, 16.00", 1.9 kg
Externer Test » Asus VivoBook Pro 16 OLED K6602VV
Asus Zenbook Pro 14 OLED UX6404VV: NVIDIA GeForce RTX 4060 Laptop GPU, 14.50", 1.6 kg
Externer Test » Asus Zenbook Pro 14 OLED UX6404VV
Origin PC EVO16-S 2023: NVIDIA GeForce RTX 4070 Laptop GPU, 16.10", 2.5 kg
Externer Test » Origin PC EVO16-S 2023
Asus ROG Zephyrus M16 GU604VY-NM001W: NVIDIA GeForce RTX 4090 Laptop GPU, 16.00", 2.3 kg
Externer Test » Asus ROG Zephyrus M16 GU604VY-NM001W
Asus ROG Zephyrus M16 GU604VZ: NVIDIA GeForce RTX 4080 Laptop GPU, 16.00", 2.3 kg
Externer Test » Asus ROG Zephyrus M16 GU604VZ
Asus ROG Zephyrus M16 GU604VI: NVIDIA GeForce RTX 4070 Laptop GPU, 16.00", 2.3 kg
Externer Test » Asus ROG Zephyrus M16 GU604VI
Asus Zenbook Pro 14 OLED UX6404VI: NVIDIA GeForce RTX 4070 Laptop GPU, 14.50", 1.7 kg
Externer Test » Asus Zenbook Pro 14 OLED UX6404VI
Asus VivoBook 14X S3405: Intel Iris Xe Graphics G7 96EUs, 14.00", 1.4 kg
Externer Test » Asus VivoBook 14X S3405
MSI Pulse 15 B13VFK: NVIDIA GeForce RTX 4060 Laptop GPU, 15.60", 2.3 kg
Externer Test » MSI Pulse 15 B13VFK
Asus ROG Flow X16 GV601V: NVIDIA GeForce RTX 4060 Laptop GPU, 16.00", 2.1 kg
Externer Test » Asus ROG Flow X16 GV601V
Asus ROG Flow X16 GV601VI: NVIDIA GeForce RTX 4070 Laptop GPU, 16.00", 2.2 kg
Externer Test » Asus ROG Flow X16 GV601VI
MSI Stealth 17 Studio A13VH-053US: NVIDIA GeForce RTX 4080 Laptop GPU, 17.30", 2.8 kg
Externer Test » MSI Stealth 17 Studio A13VH-053US
Asus ROG Flow Z13 GZ301V: NVIDIA GeForce RTX 4060 Laptop GPU, 13.40", 1.6 kg
Externer Test » Asus ROG Flow Z13 GZ301V
Gigabyte AERO 16 OLED BSF: NVIDIA GeForce RTX 4070 Laptop GPU, 16.00", 2.1 kg
Externer Test » Gigabyte AERO 16 OLED BSF
Asus ROG Flow Z13 ACRNM: NVIDIA GeForce RTX 4070 Laptop GPU, 13.40", 1.7 kg
Externer Test » Asus ROG Flow Z13 ACRNM
Asus ROG Zephyrus G16 GU603VV-N4007W: NVIDIA GeForce RTX 4060 Laptop GPU, 16.00", 2 kg
Externer Test » Asus ROG Zephyrus G16 2023 GU603VV-N4007W
Asus Zenbook 14X UX3404VC-M3145X: NVIDIA GeForce RTX 3050 4GB Laptop GPU, 14.50", 1.6 kg
Externer Test » Asus Zenbook 14X UX3404VC-M3145X
Asus ZenBook 14X UX3404VC: Intel Iris Xe Graphics G7 96EUs, 14.50", 1.6 kg
Externer Test » Asus ZenBook 14X UX3404VC
Asus ROG Zephyrus M16 GU604VY-NM042X: NVIDIA GeForce RTX 4090 Laptop GPU, 16.00", 2.3 kg
Externer Test » Asus ROG Zephyrus M16 GU604VY-NM042X
Samsung Galaxy Book3 Ultra 16, i9-13900H RTX 4070: NVIDIA GeForce RTX 4070 Laptop GPU, 16.00", 1.8 kg
Externer Test » Samsung Galaxy Book3 Ultra 16, i9-13900H RTX 4070
Huawei MateBook 16s i9: Intel Iris Xe Graphics G7 96EUs, 16.00", 2 kg
Externer Test » Huawei MateBook 16s i9
Asus VivoBook 14X S3405: Intel Iris Xe Graphics G7 96EUs, 14.00", 1.4 kg
» Deal: Asus Vivobook 14X Multimedia-Notebook mit 3K-OLED und starkem Core i9 um 17% rabattiert
Asus VivoBook Pro 16 K6602VU: NVIDIA GeForce RTX 4050 Laptop GPU, 16.00", 1.9 kg
» Notebook-Deal: Asus Vivobook Pro 16 mit 3,2K OLED, Core i9 und RTX 4050 um starke 20% reduziert
Schenker XMG Pro 16 Studio (Mid 23): NVIDIA GeForce RTX 4070 Laptop GPU, 16.00", 2.6 kg
» Gaming-Laptop-Deals bei Schenker: XMG Neo 17 mit RTX 4080, Apex 17, Pro 16 Studio und mehr stark rabattiert
» Deal: XMG Pro 16 Studio (M23) gibts für kurze Zeit mit 470 Euro Rabatt, mit Core i9-13900H und 240 Hz QHD-Display
Asus ROG Flow X16 GV601V: NVIDIA GeForce RTX 4060 Laptop GPU, 16.00", 2.1 kg
» Amazon: Asus ROG Flow X16 Gaming-Convertible mit Intel Core i9-13900H und GeForce RTX 4060 zum neuen Bestpreis
Gigabyte AERO 16 OLED BSF: NVIDIA GeForce RTX 4070 Laptop GPU, 16.00", 2.1 kg
» Schlankes 4K-OLED-Notebook zum Bestpreis: Gigabyte Aero 16 mit RTX 4070 deutlich rabattiert
Asus VivoBook S15 OLED K5504, i9-13900H: Intel Iris Xe Graphics G7 96EUs, 15.60", 1.8 kg
» "Affige" Sonderedition des Asus VivoBook S15 punktet im Test mit hochauflösendem OLED und solider Performance
Asus ROG Flow X16 GV601V: NVIDIA GeForce RTX 4060 Laptop GPU, 16.00", 2.1 kg
» Amazon Bestpreis-Deal: Asus ROG Flow X16 Gaming-Convertible mit Intel Core i9 und GeForce RTX 4060
Asus ZenBook 14X OLED UX3404VA, i9-13900H: Intel Iris Xe Graphics G7 96EUs, 14.50", 1.6 kg
» Deal: Asus Zenbook 14X Ultrabook mit tollem OLED-Display und Core i9 zum Bestpreis bei Saturn
HP Envy 16-h1000: NVIDIA GeForce RTX 4060 Laptop GPU, 16.00", 2.7 kg
» Deal: Hübsches HP Envy 16 Notebook mit RTX 4060 und 120Hz QHD-Display um 400 Euro rabattiert
Huawei MateBook D 16 2024: Intel Iris Xe Graphics G7 96EUs, 16.00", 1.7 kg
» Huaweis MateBook D 16 wird immer teurer, die Ausstattung aber immer schlechter
Schenker XMG Pro 16 Studio (Mid 23): NVIDIA GeForce RTX 4070 Laptop GPU, 16.00", 2.6 kg
» XMG Pro 16 Studio: Viel Power für Gamer und Creator
Lenovo ThinkPad P1 G6-21FV000DGE: NVIDIA RTX 2000 Ada Generation Laptop, 16.00", 1.9 kg
» Das ThinkPad X1 Extreme ist Geschichte, ab sofort gibt es nur noch das ThinkPad P1
Schenker XMG Pro 16 Studio (Mid 23): NVIDIA GeForce RTX 4070 Laptop GPU, 16.00", 2.6 kg
» Deal: Schenker XMG Pro 16 Studio Content-Creator-Laptop mit RTX 4070 bekommt ersten Rabatt
Gigabyte AERO 16 OLED BSF: NVIDIA GeForce RTX 4070 Laptop GPU, 16.00", 2.1 kg
» Deal: Gigabyte Aero 16 Notebook mit 4K-OLED-Display und RTX 4070 zum Bestpreis mit 17% Rabatt
Asus Zenbook Pro 14 OLED UX6404VV: NVIDIA GeForce RTX 4060 Laptop GPU, 14.50", 1.6 kg
» Asus: Drei neue Notebooks mit OLED-Display offiziell erhältlich, auch mit Core i9-Prozessor und GeForce RTX 4080
Asus Zenbook Pro 14 OLED UX6404VI: NVIDIA GeForce RTX 4070 Laptop GPU, 14.50", 1.7 kg
» Das Asus Zenbook Pro 14 überzeugt mit viel Leistung und dem weltweit ersten 120-Hz-OLED
Huawei MateBook 16s i9: Intel Iris Xe Graphics G7 96EUs, 16.00", 2 kg
» Huawei MateBook 16s getestet: Starker Core i9
Asus ROG Flow X16 GV601V: NVIDIA GeForce RTX 4060 Laptop GPU, 16.00"
» Getestet: Mehr Allroundfähigkeiten wie im Asus ROG Flow X16 bitte!
Asus ZenBook Pro 14 Duo UX8402VV-P1021W: NVIDIA GeForce RTX 4060 Laptop GPU, 14.50", 1.8 kg
» Asus ZenBook Pro 14 Duo getestet: Mit dem Zweiten ist man produktiver
Samsung Galaxy Book3 Ultra 16, i9-13900H RTX 4070: NVIDIA GeForce RTX 4070 Laptop GPU, 16.00", 1.8 kg
» Leiser, heißer Creator: Samsung Galaxy Book3 Ultra 16 im Test
Asus ROG Flow Z13 GZ301V: NVIDIA GeForce RTX 4060 Laptop GPU, 13.40", 1.6 kg
» Dieses AAA-Gaming-Tablet hat es uns angetan: Asus ROG Flow z13 mit RTX 4060 getestet
MSI Stealth 17 Studio A13VH-014: NVIDIA GeForce RTX 4080 Laptop GPU, 17.30", 3 kg
» Leise Lüfter, starke Leistung: Im Test zeigt das MSI Stealth 17 Studio einen klugen Ansatz
Asus ROG Flow Z13 ACRNM: NVIDIA GeForce RTX 4070 Laptop GPU, 13.40", 1.7 kg
» Das Gaming-Tablet Asus ROG Flow Z13 zeigt, dass die RTX 4070 Laptop auch mit 65 Watt viel Leistung bietet
» Skurrile Asus ROG Flow Z13 Acronym Edition packt GeForce RTX 4070 ins CNC-gefräste Tablet
Asus ROG Zephyrus M16 GU604V: NVIDIA GeForce RTX 4090 Laptop GPU, 16.00", 2.3 kg
» Asus ROG Zephyrus M16 (2023) getestet: Weder Intel Gen 13 noch RTX 40 - OLED und miniLED-Displays sind die Highlights neuer Laptops
Gigabyte AERO 16 OLED BSF: NVIDIA GeForce RTX 4070 Laptop GPU, 16.00", 2.1 kg
» Neues Aero 16 OLED getestet: OLED und neue Intel-/Nvidia-Generationen auf dem Vormarsch