Test: Minisforum MS-01 Workstation debütiert mit Intel Core i9-13900H, verzichtet aber ab Werk auf eine dedizierte Grafikkarte
Minisforum ist im Mini-PC-Markt eine bekannte Marke und hat ein breites Portfolio, um für alle Eventualitäten gewappnet zu sein. Den Workstation-Bereich hat der Hersteller aus Fernost bislang ausgespart, was sich nun mit dem Minisforum MS-01 ändern soll. Als Prozessor verbaut der Hersteller in der besten Ausstattung einen Intel Core i9-13900H, welcher zusammen mit 32 GB RAM und einer 1-TB-SSD in unseren Räumlichkeiten genau unter die Lupe genommen wurde. Mit 979 Euro ist der Minisforum MS-01 sicherlich kein Schnäppchen, wenngleich das Gerät auch als Barebone-Option geordert werden kann. Ohne RAM und SSD werden aber noch immer 799 Euro aufgerufen. Wer nicht die Leistung des Intel Core i9-13900H benötigt, kann die kompakte Workstation auch mit einem Intel Core i5-12600H (ab 499 Euro) oder einem Intel Core i9-12900H (ab 619 Euro) bekommen.
Bevor wir uns dem Review des Minisforum MS-01 widmen, gibt es noch einige wichtige Informationen!
Die Tests zu unserem Testsample wurden immer wieder durch unvorhersehbare Abstürze begleitet. Diese traten vorwiegend bei längeren Lastszenarien wie der Cinebench-R15-Multi-Schleife auf. Probleme gab es mitunter beim SSD-Stresstest sowie dem Adobe Premiere Benchmark. Bei diesen Tests konnten Abstürze immer wieder reproduziert werden. Eine Besserung trat ein, als wir die Power-Limits des Prozessors auf 35 Watt reduzierten, was jedoch eine deutliche Verschlechterung der CPU-Leistung nach sich zog. Um das Problem weiter einzugrenzen, haben wir sämtliche Komponenten wie RAM, SSD oder das Netzteil getauscht, was jedoch nicht das erhoffte Ergebnis brachte. Schlussendlich sind wir zu dem aktuellen Schluss gekommen, dass es sich hierbei nur noch um ein Problem mit dem Intel Core i9-13900H selbst handeln kann. Den Hersteller haben wir darüber informiert, um eine Lösung zu erhalten. Minisforum plant, uns umgehend ein weiteres Sample zukommen zu lassen. Eine abschließende Wertung wird daher erst möglich sein, sobald wir uns das Ersatzgerät angeschaut haben.
Falls jemand ähnliche Probleme mit dem Minisforum MS-01 beobachtet hat, kann man uns gern darüber informieren. Wer einen Minisforum MS-01 besitzt und keine derartigen Probleme hat, kann uns dies ebenfalls gern mitteilen.
Update 19.05.2024
Inzwischen hat Minisforum ein Ersatzgerät bereitgestellt. Unsere Tests offenbarten ein stabil arbeitendes System, was bei unserem ersten Testsample nicht gegeben war. Wir haben das Ersatzgerät auch mit langen Stresstests geprüft und konnten nicht einen einzigen Systemabsturz herbeiführen. Das Ersatzgerät ist komplett identisch zum erst getesteten MS-01, inklusive gleicher BIOS-Version. Nachdem wir einige Vergleichstests durchgeführt haben, konnten wir im Vergleich zum defekten Gerät keinen Performanceunterschied feststellen. Demzufolge haben alle bisherigen Werte Bestand und gehen somit in die Bewertung ein.
mögliche Konkurrenten im Vergleich
Bew. | Datum | Modell | Memory | Gewicht | Dicke |
|---|---|---|---|---|---|
| 81.5 % v7 (old) | 05 / 2024 | Minisforum MS-01 i9-13900H, Iris Xe G7 96EUs | 32768 MB | 1.5 kg | 48 mm |
| 83.4 % v7 (old) | 04 / 2024 | Acemagic F2A Ultra 7 155H, Arc 8-Core | 32768 MB | 768 g | 57 mm |
| 84.1 % | 04 / 2024 | Geekom XT12 Pro i9-12900H, Iris Xe G7 96EUs | 32768 MB | 545 g | 37 mm |
| 82.6 % v7 (old) | 02 / 2024 | Geekom A7 R9 7940HS, Radeon 780M | 32768 MB | 417 g | 38 mm |
| 82.4 % v7 (old) | 05 / 2024 | Minisforum Venus Series NAB9 i9-12900HK, Iris Xe G7 96EUs | 32768 MB | 615 g | 55 mm |
| 81.7 % v7 (old) | 08 / 2023 | Minisforum Venus Series NPB5 i5-13500H, Iris Xe G7 80EUs | 16384 MB | 604 g | 55 mm |
| 79.5 % v7 (old) | 02 / 2024 | Maxtang MTN-FP750 R7 7735HS, Radeon 680M | 16384 MB | 601 g | 52 mm |
Minisforum MS-01 Workstation im Detail

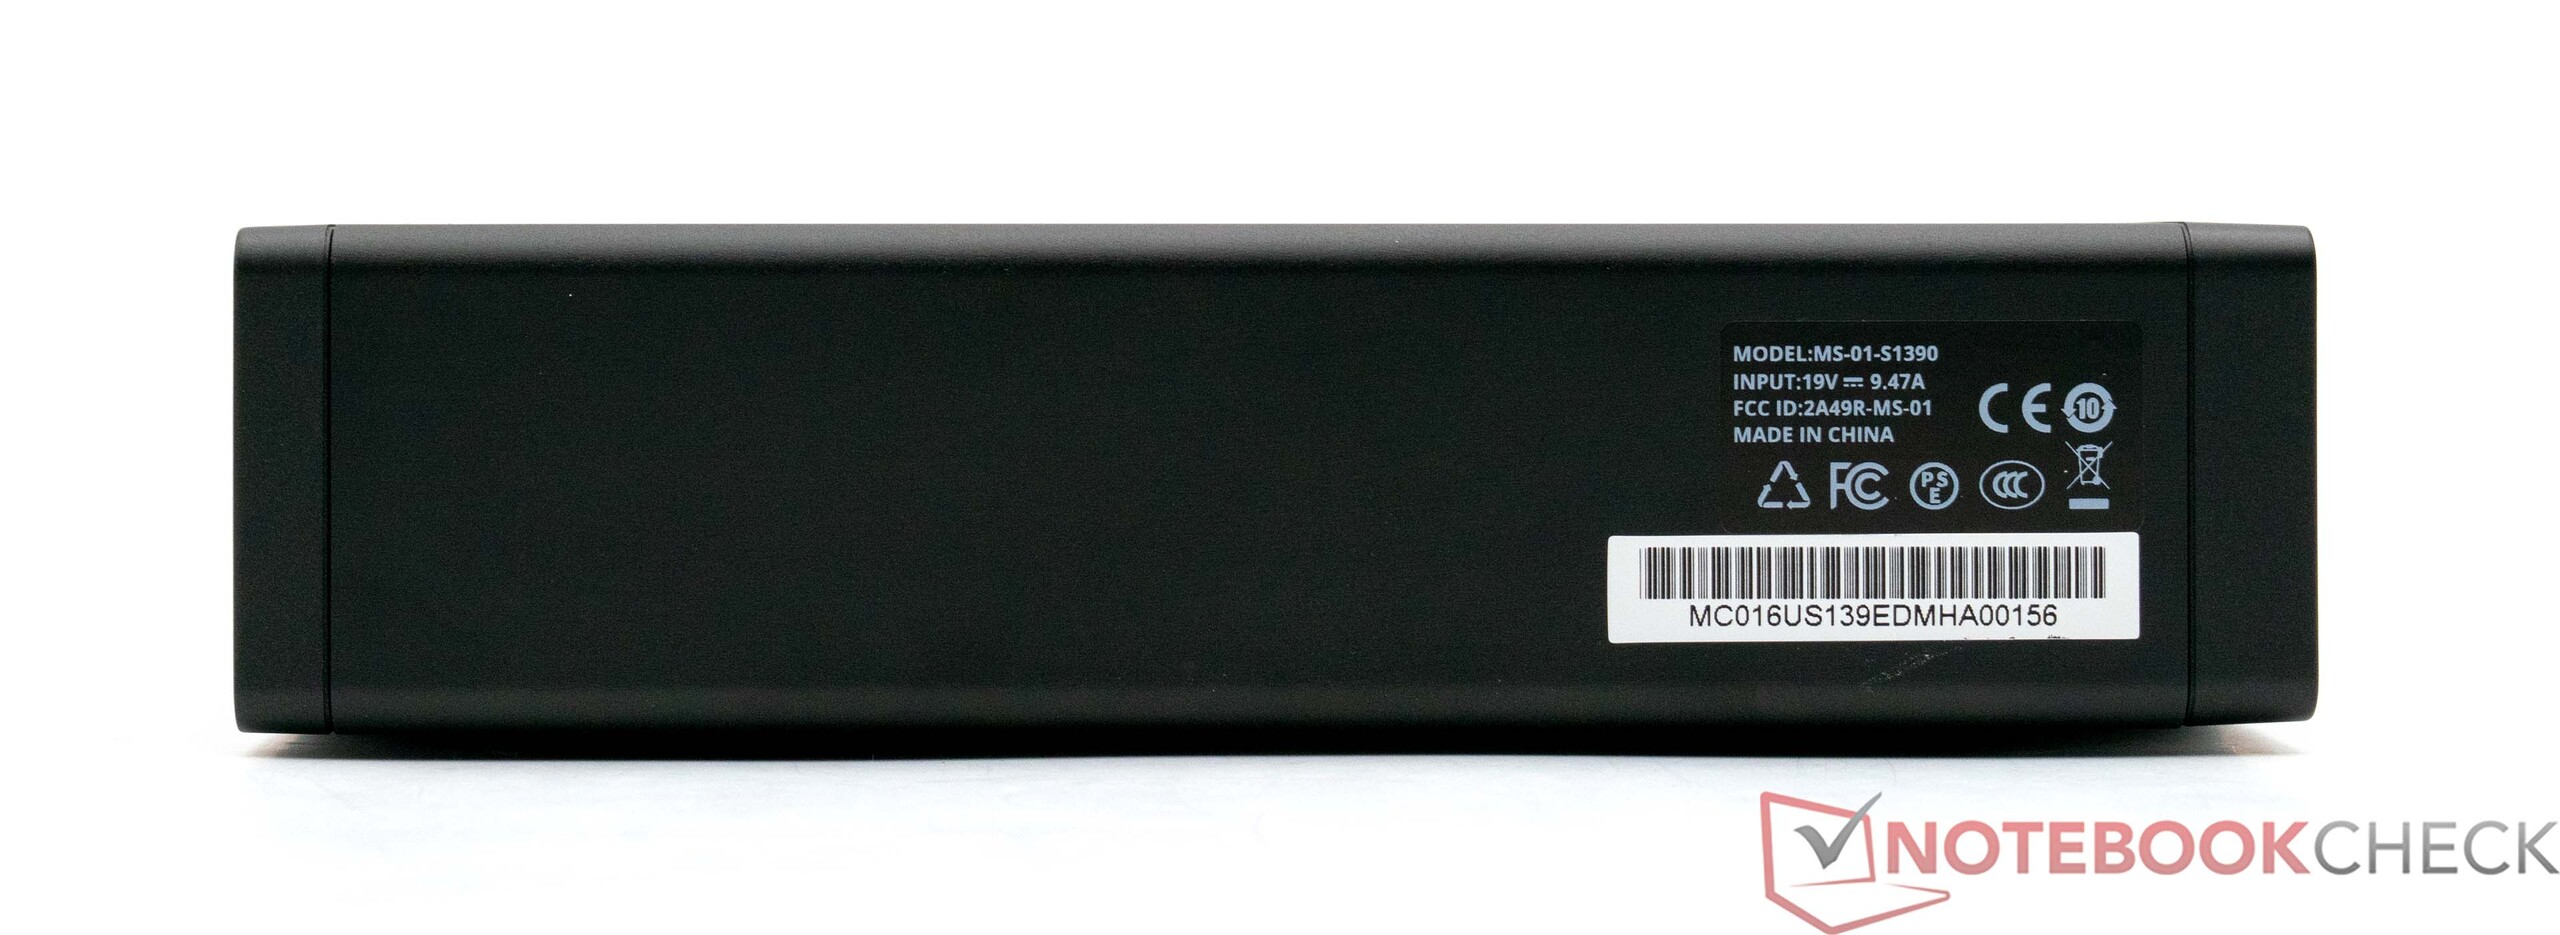

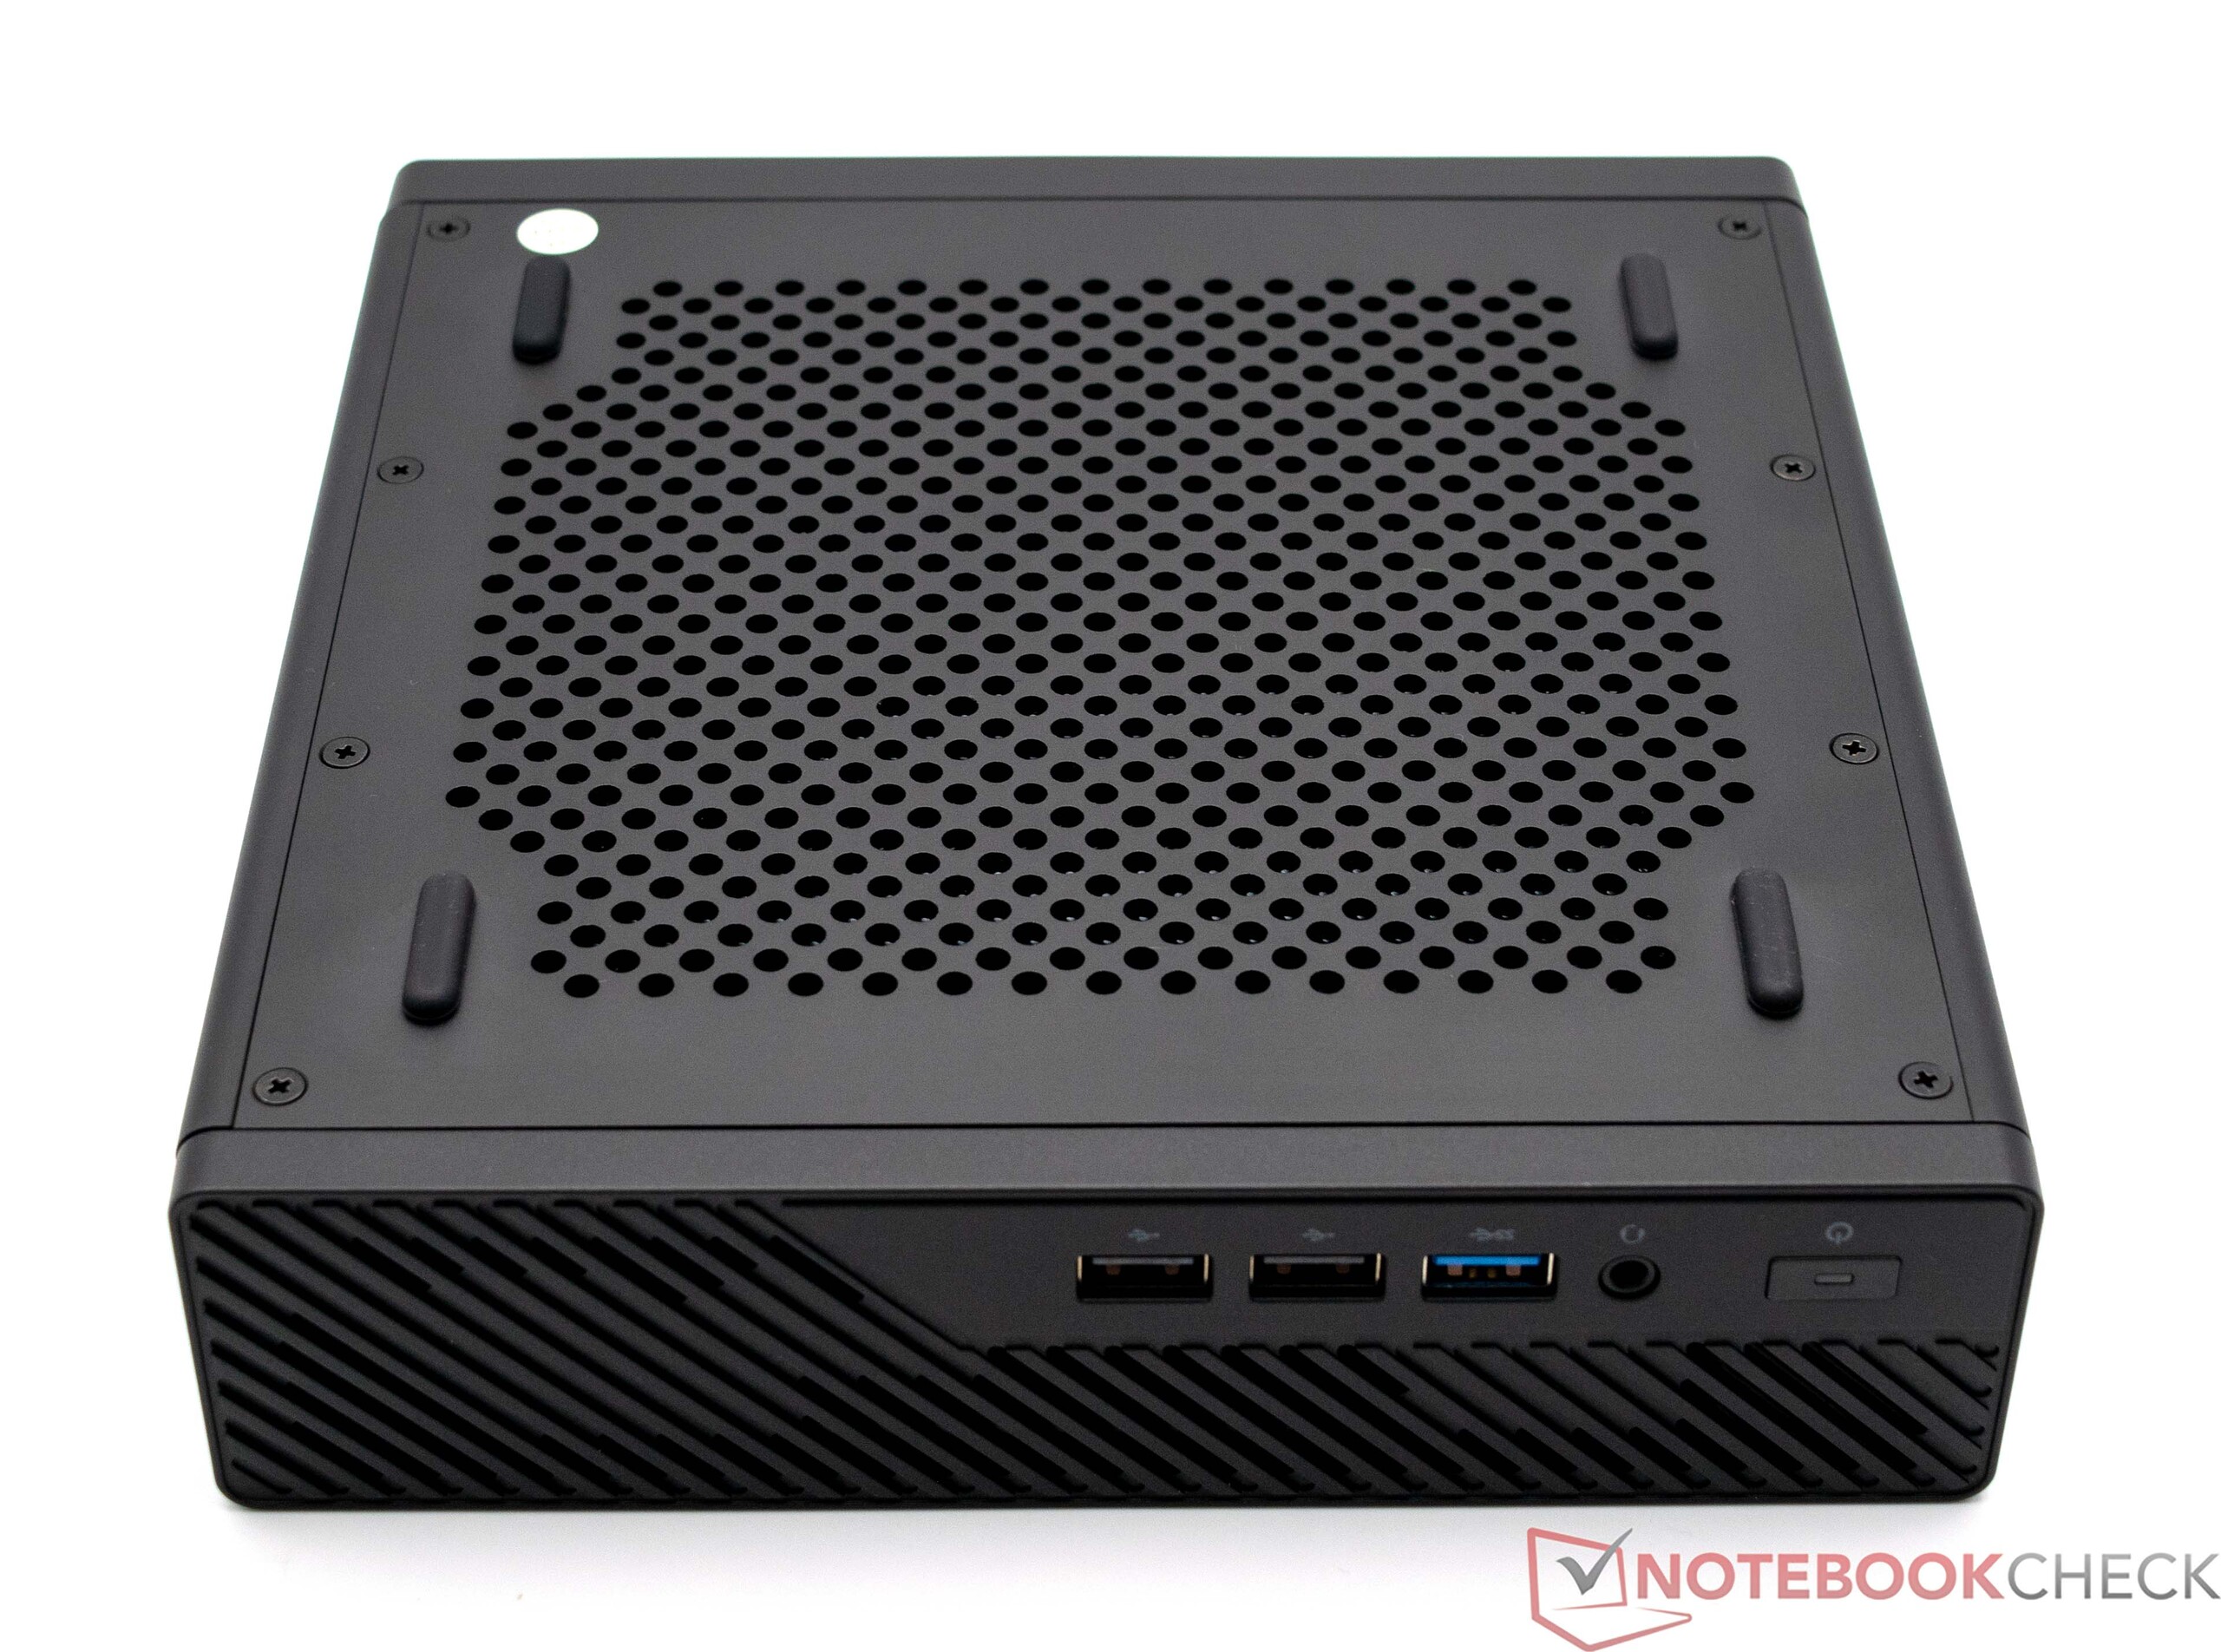


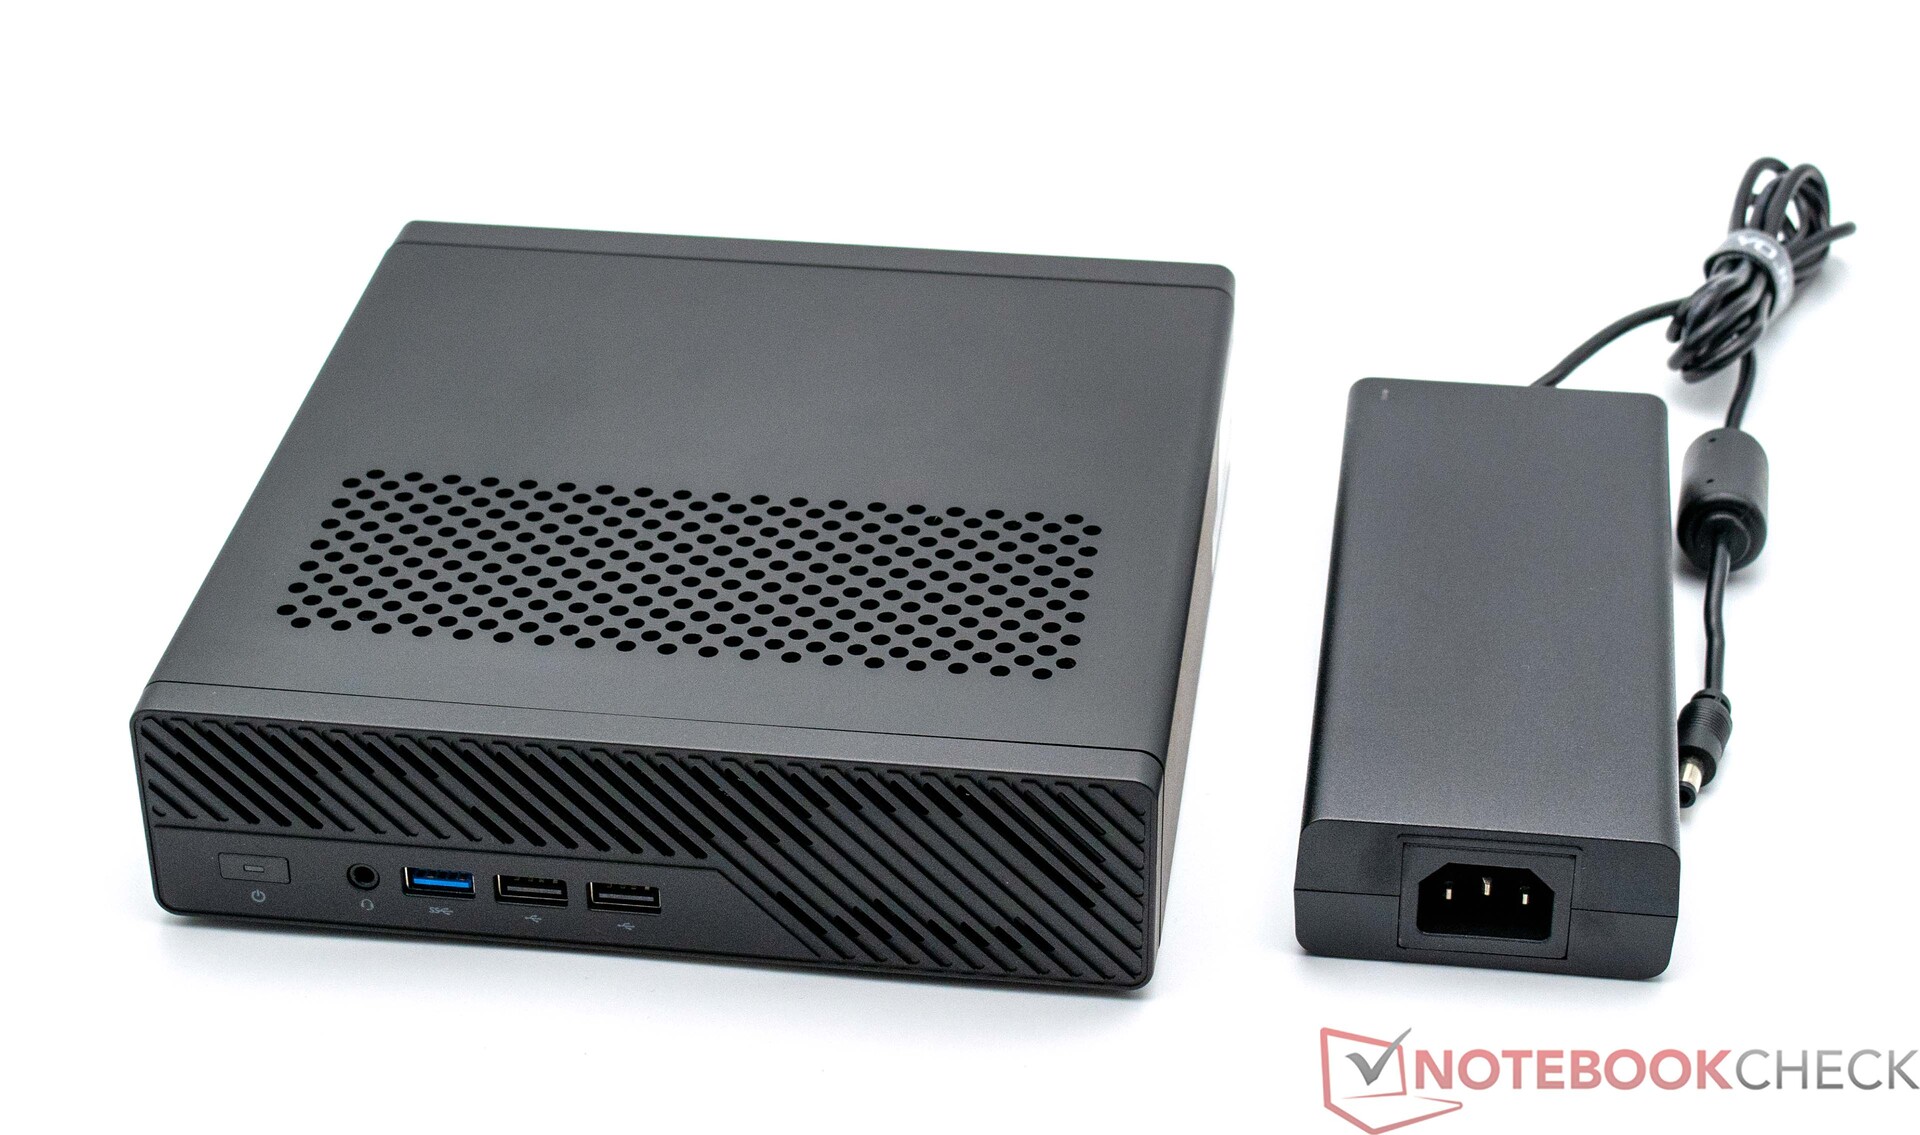
Gehäuse - Metall und Kunstsoff im Industrie-Look
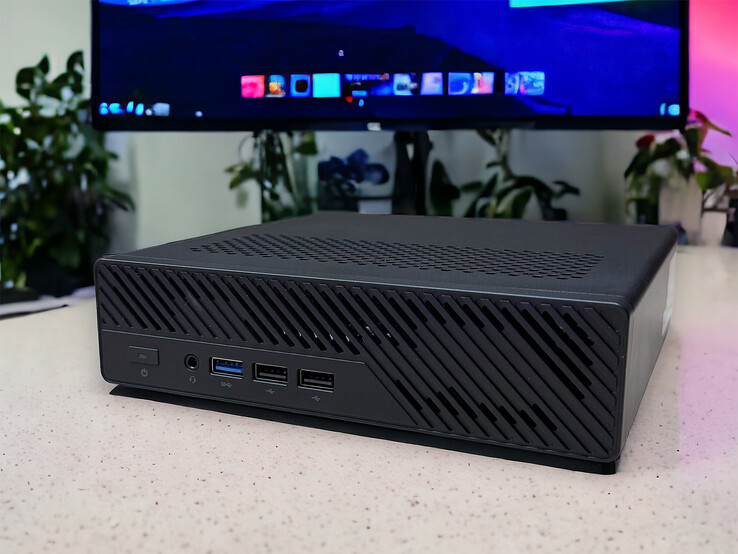
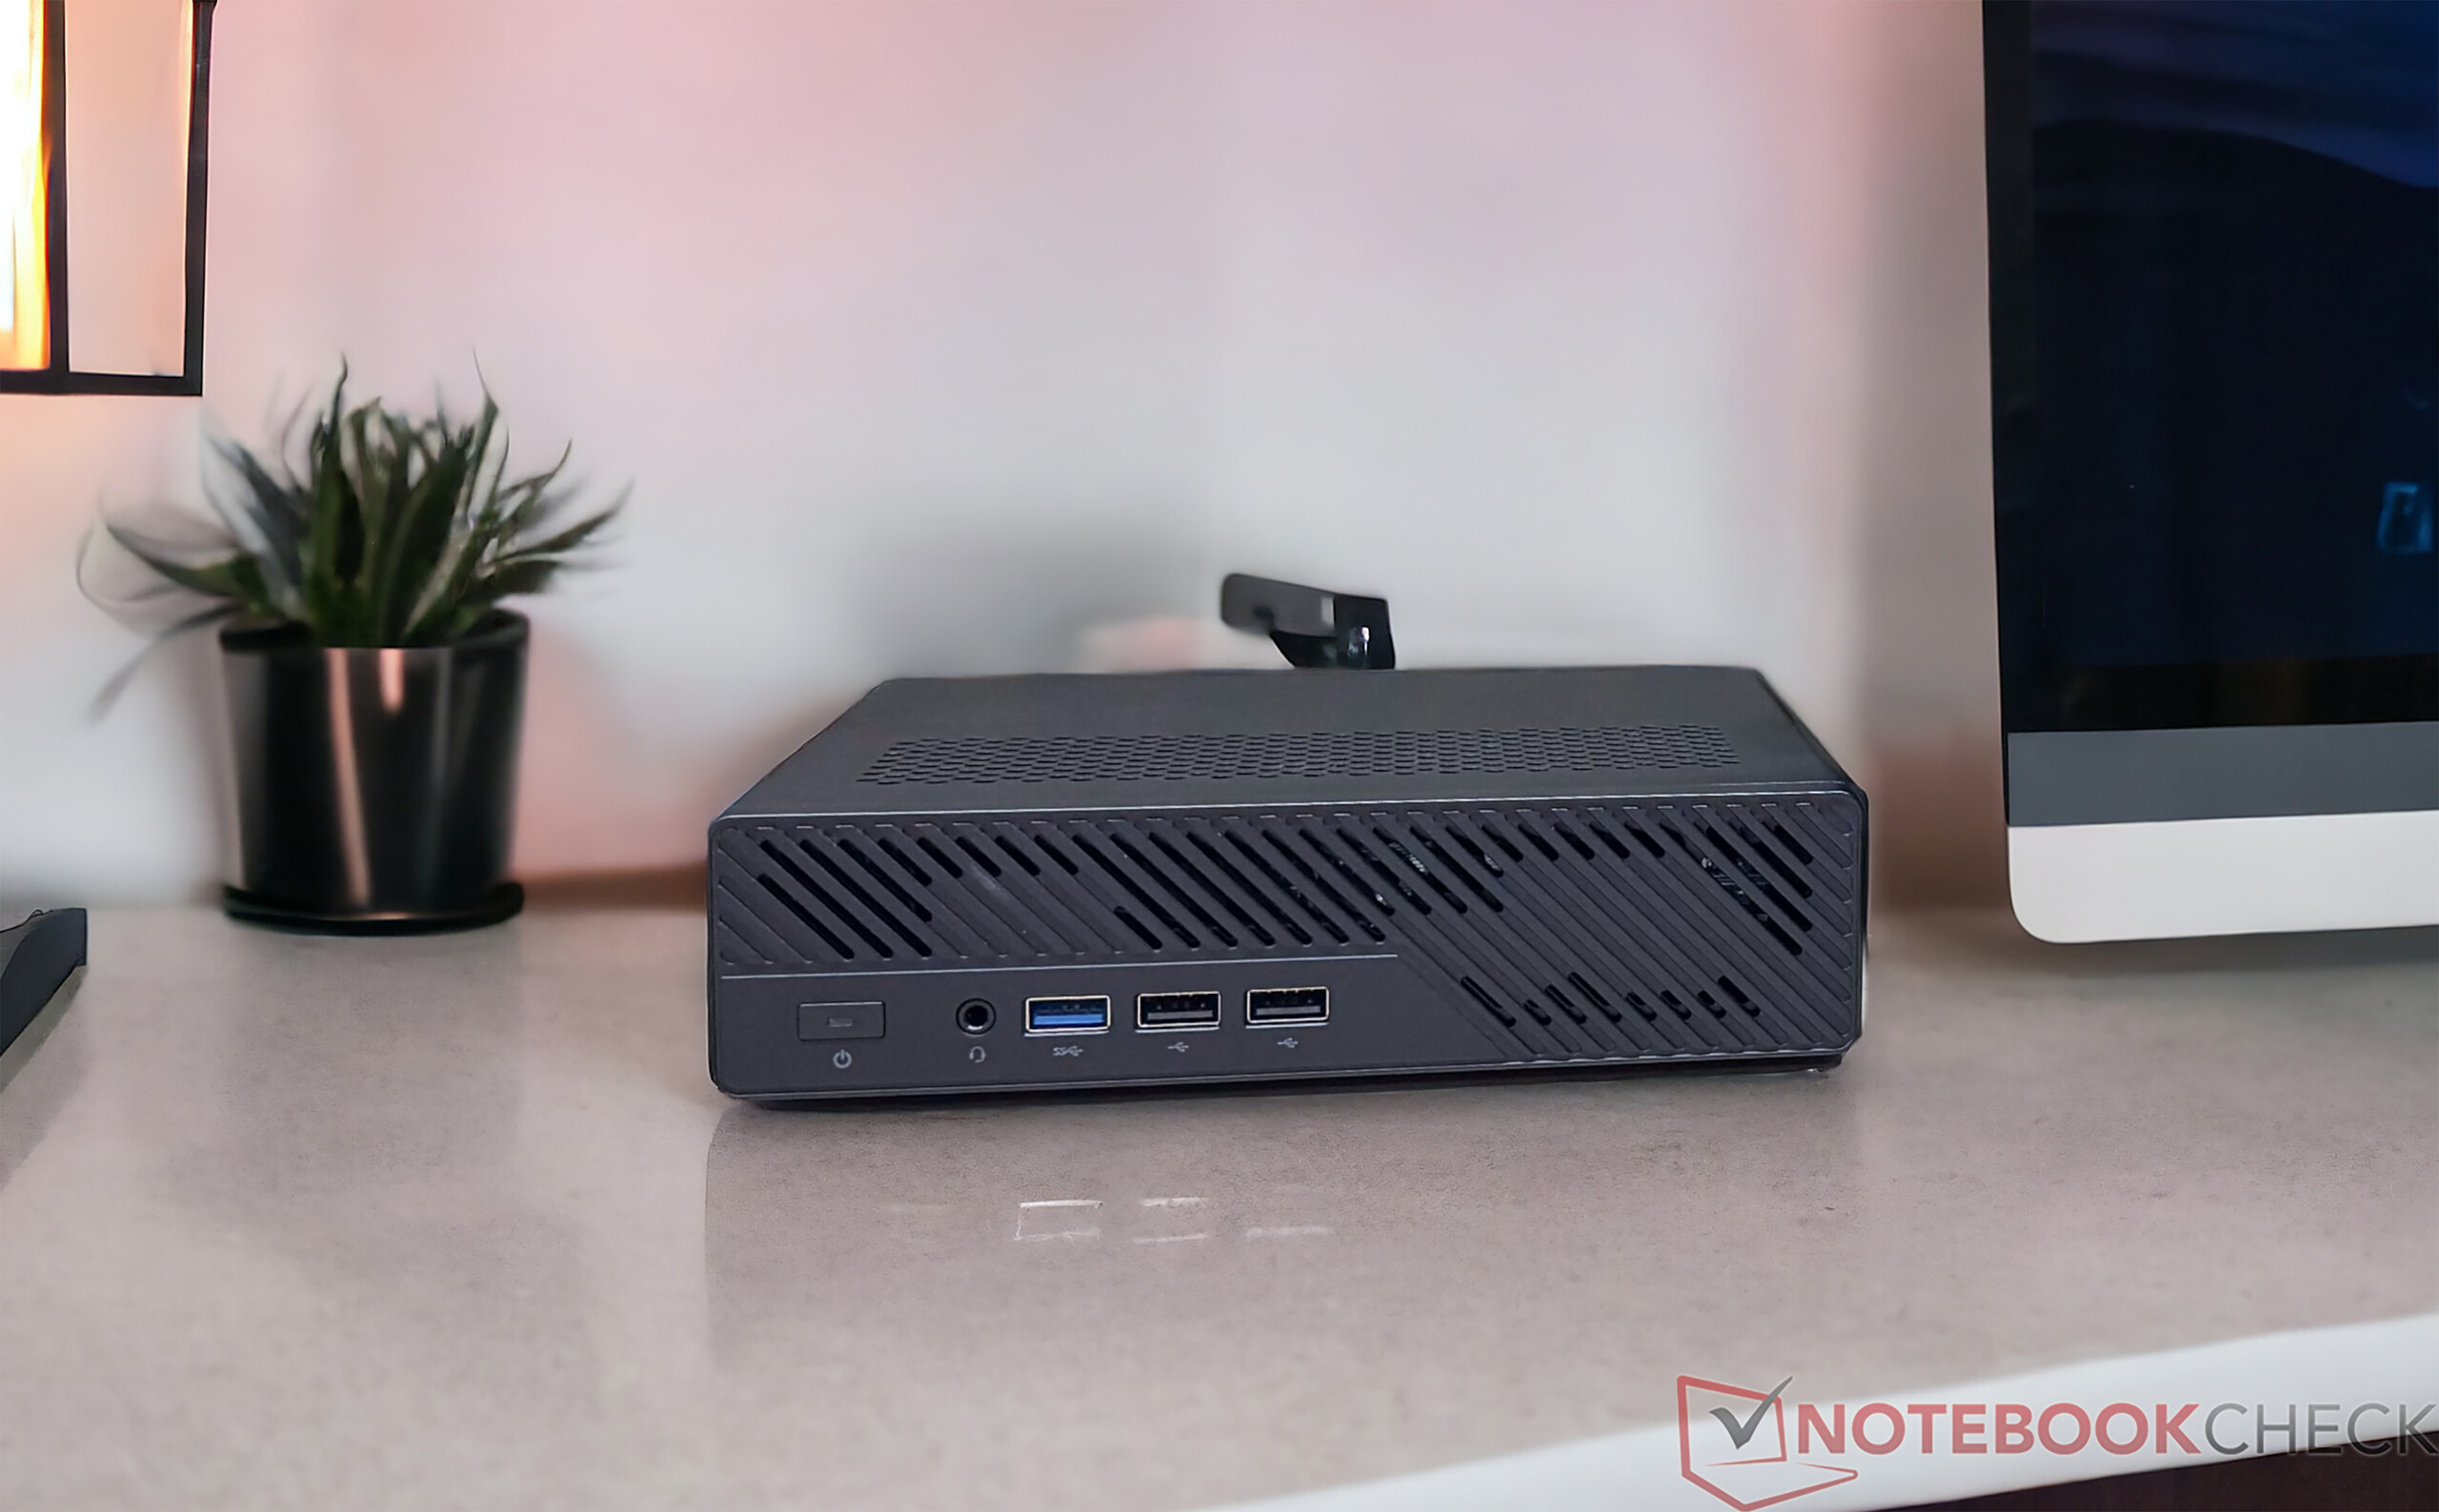
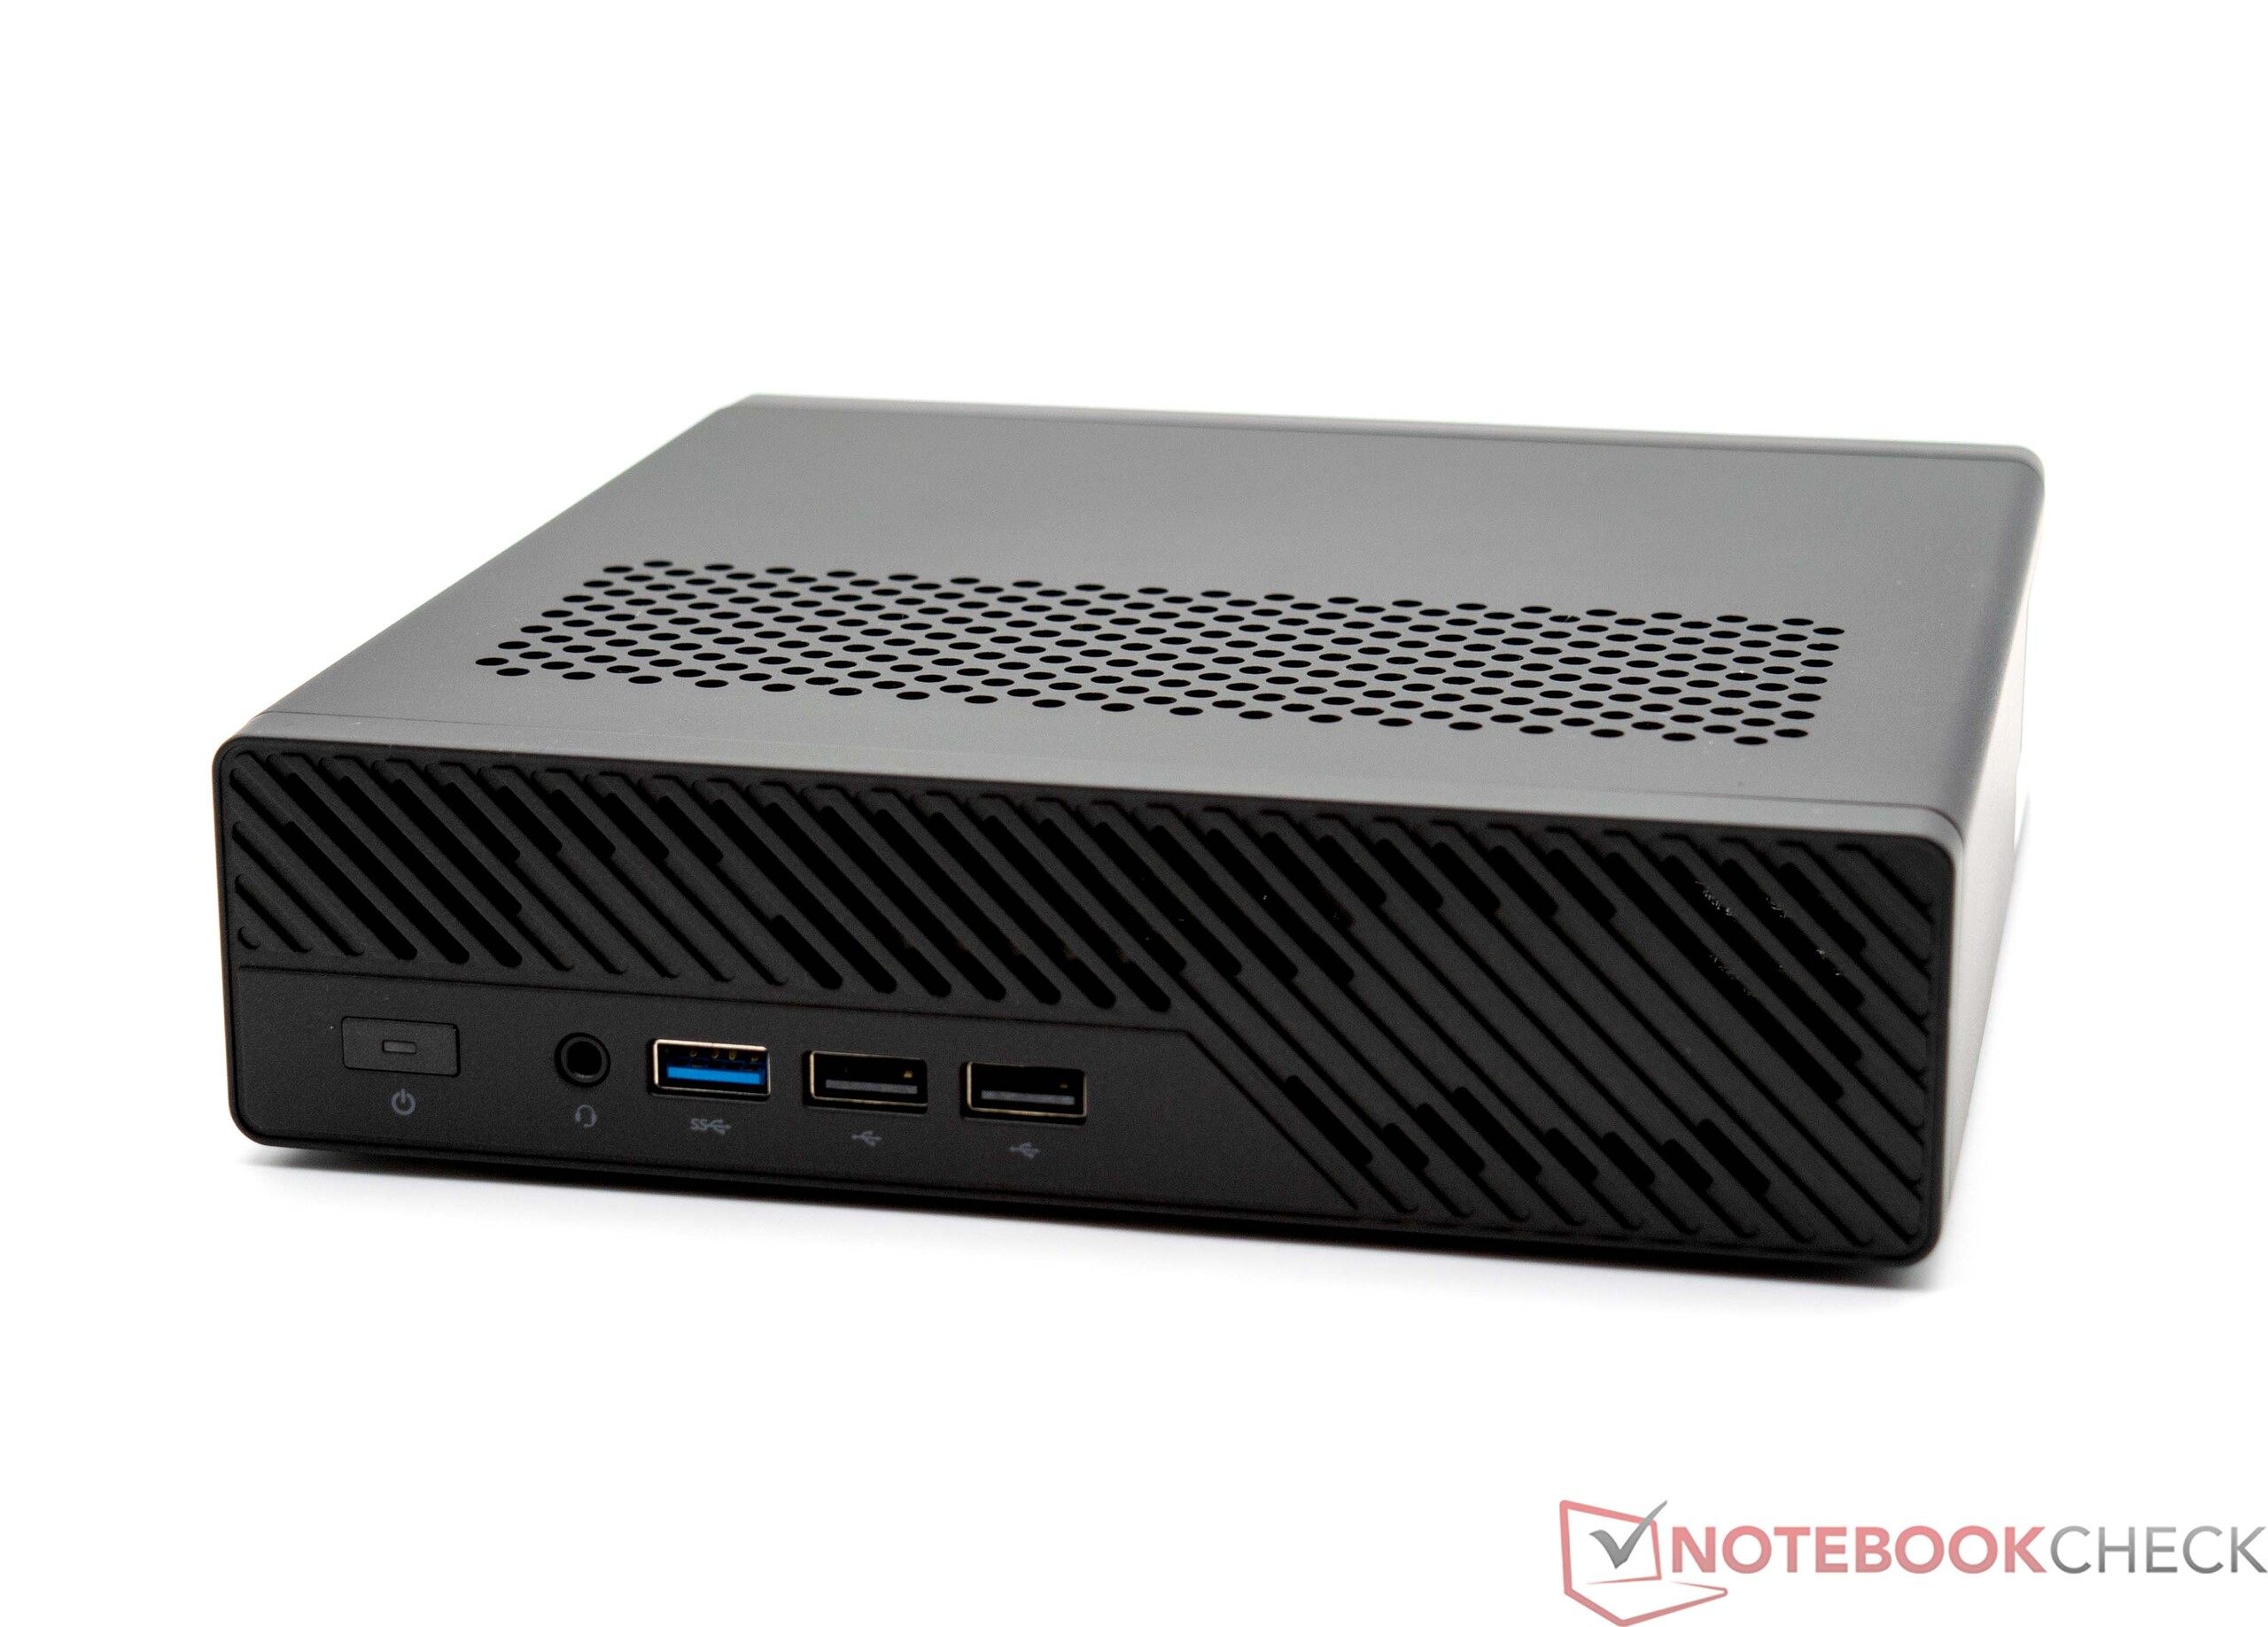
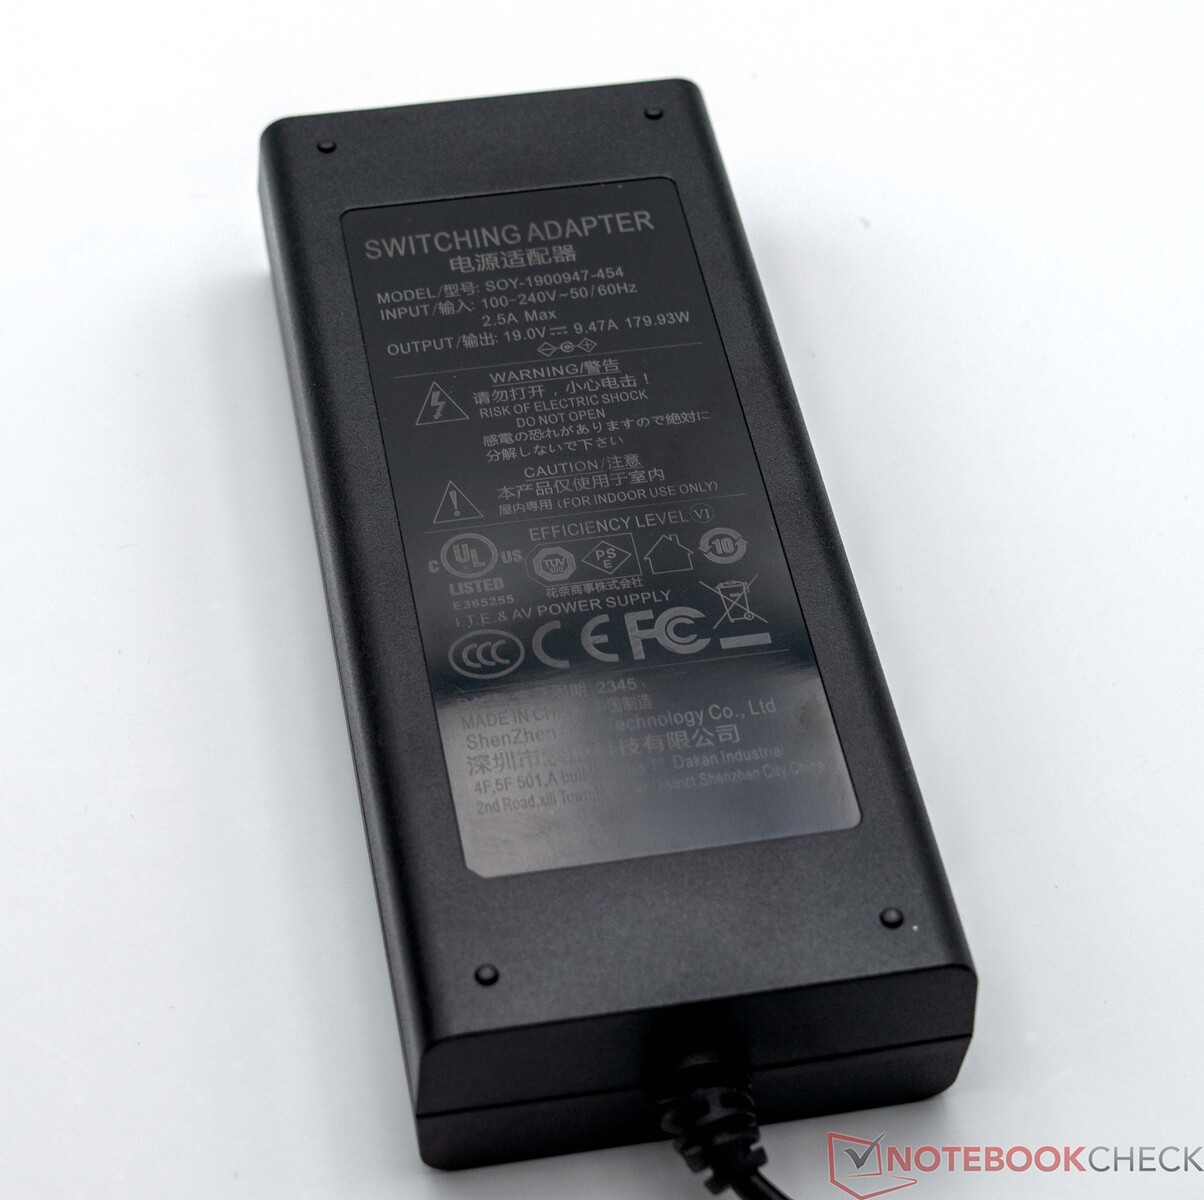
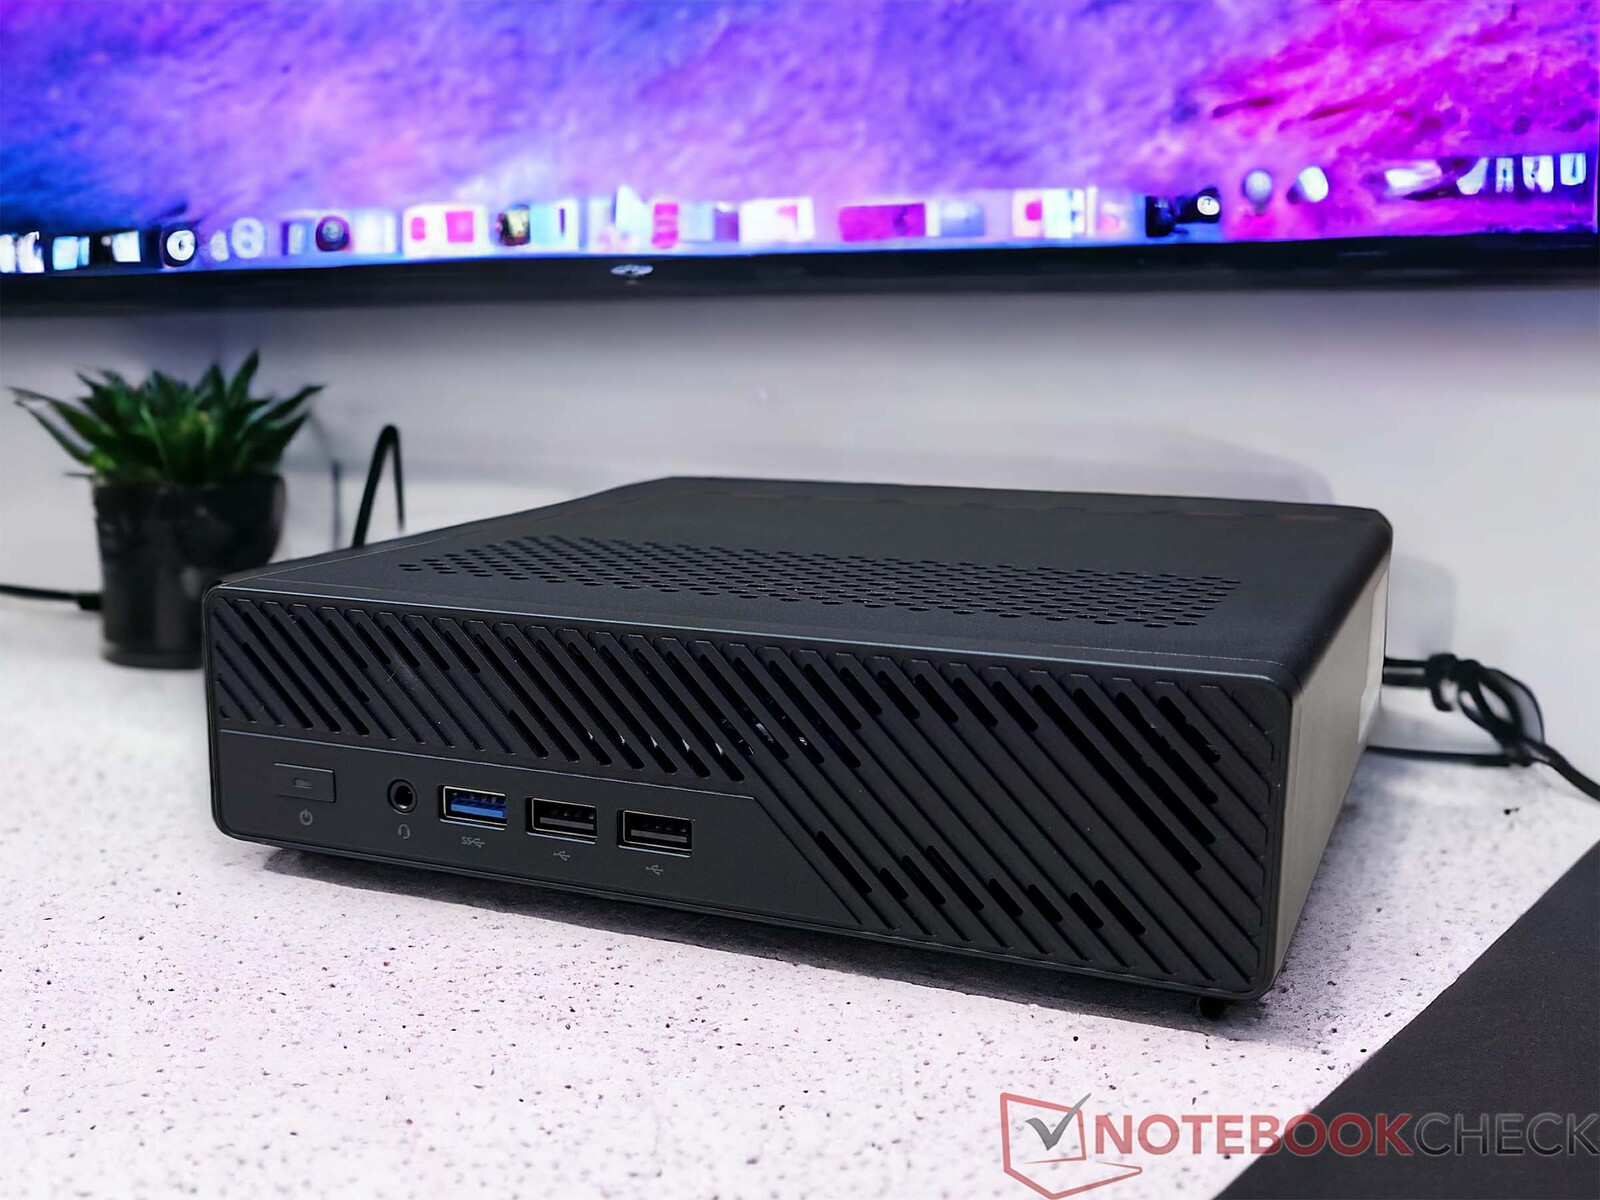
Optisch ähnelt der Minisforum MS-01 keinen bisherigen Modellen des Herstellers. Vielmehr erinnert der Look an Industriegeräte wie Lenovos ThinkCentre oder HPs Elite-Mini-800-Modelle. Bei den eingesetzten Materialien überwiegt Metall, wenngleich Kunststoff die Front und die Rückseite ziert. Der Minisforum MS-01 beansprucht deutlich mehr Platz auf dem Schreibtisch als andere herkömmliche Mini-PCs. Optische Highlights gibt es nicht und sind auch nicht nötig. Bei der Verarbeitung gibt es nichts auszusetzen. Alle Teile sind gut verarbeitet und passen zusammen. Hervorzuheben ist die extrem hohe Stabilität, welche allerdings mit einem hohen Gewicht ihr Tribut fordert. Im Vergleich zu den anderen Mini-PCs fällt der Minisforum MS-01 mit 1,5 Kilogramm deutlich auf. Das 180-Watt-Netzteil bringt noch einmal 525 Gramm auf die Waage.
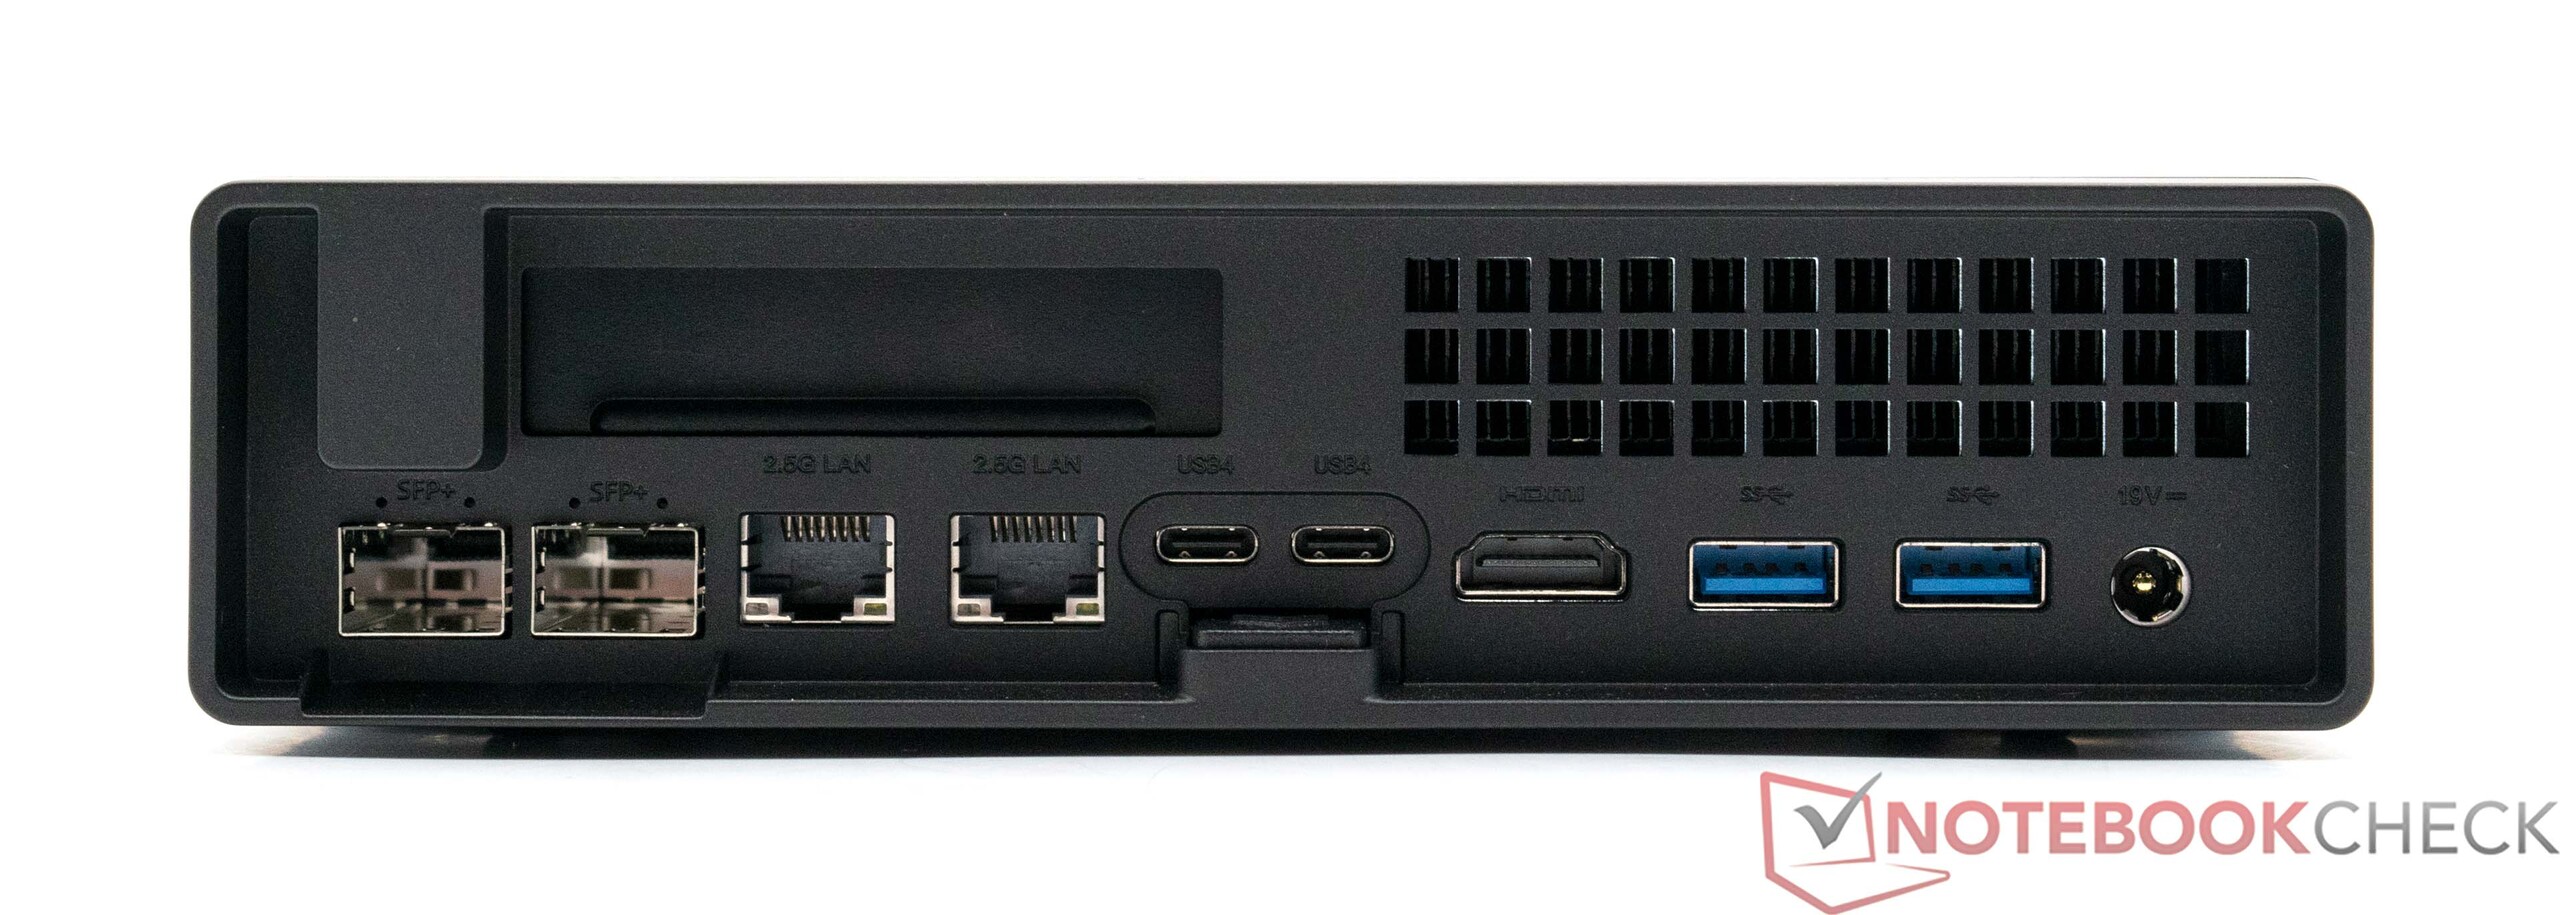
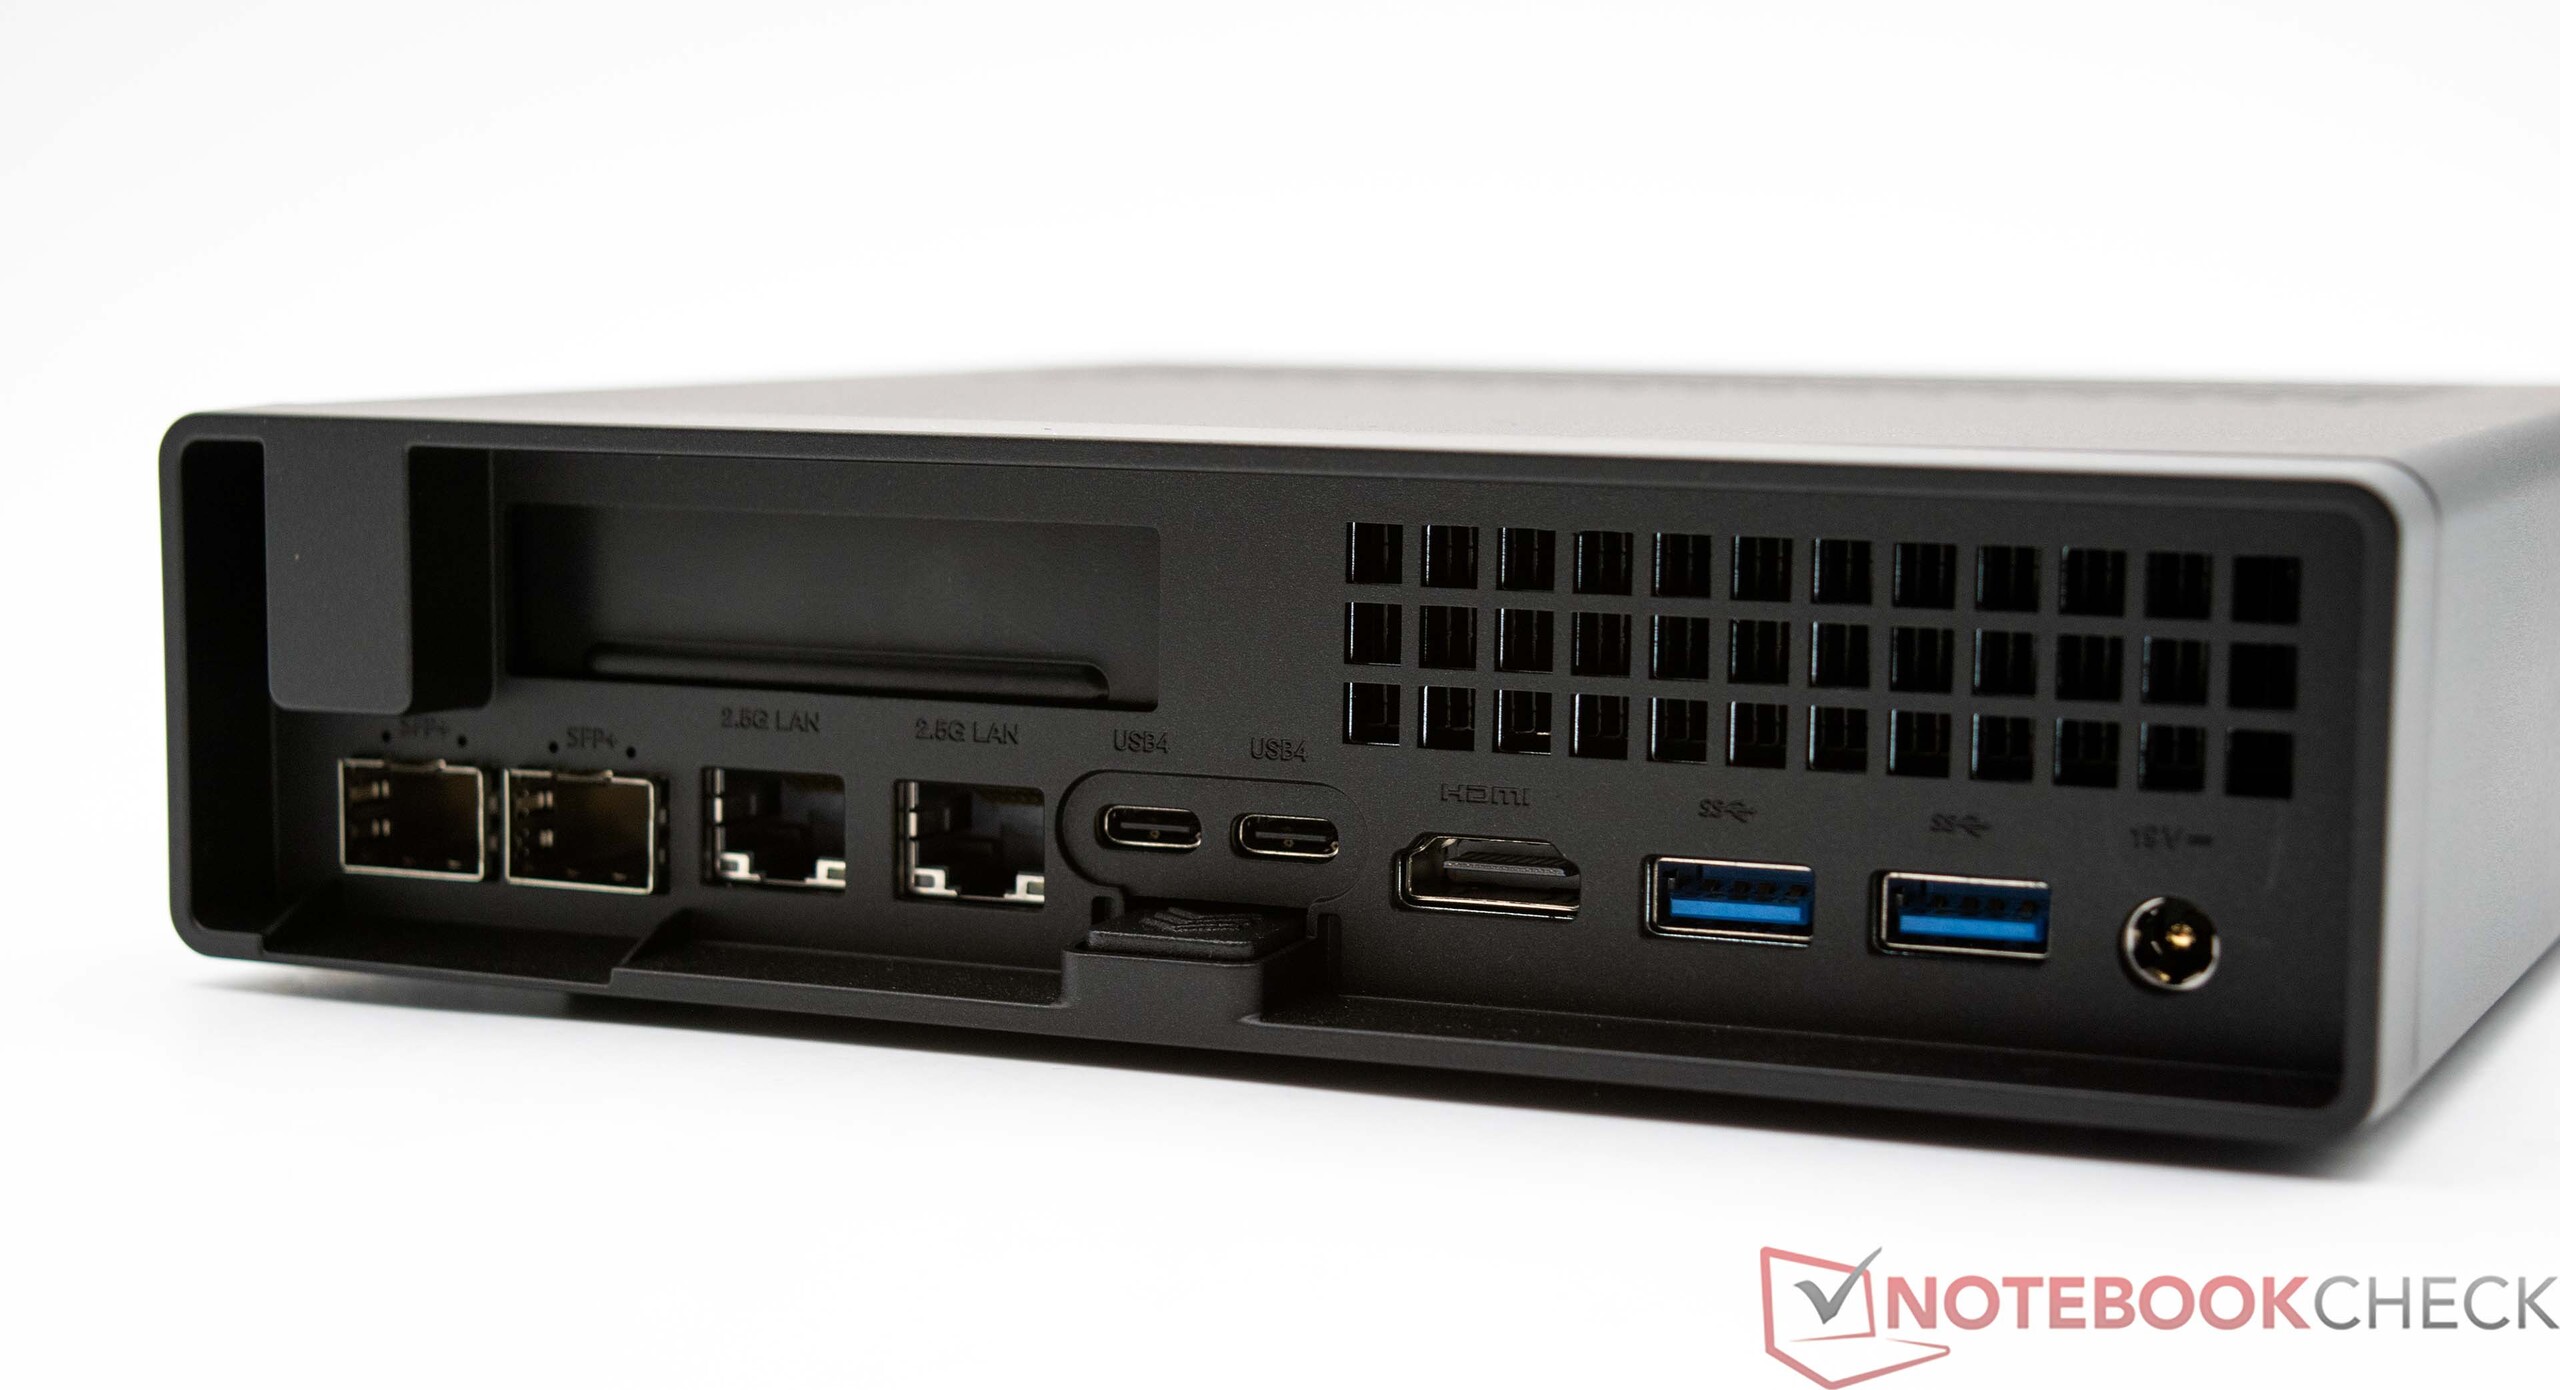
Ausstattung - PCIe x16 intern und 2x USB4 extern
Die vorhandenen Anschlüsse verteilen sich auf Vorder- und Rückseite. Gleich sieben USB-Anschlüsse bringt der Minisforum MS-01 mit, von denen zwei den langsamen 2.0-Standard unterstützen. Für Eingabegeräte ist das aber mehr als ausreichend. Immerhin kann der Minisforum MS-01 mit zwei USB4-Anschlüssen punkten, welche sich mittig auf der Rückseite befinden. Sparsam hingegen geht der Hersteller mit der Anzahl an HDMI-Anschlüssen um, denn nur eine Anschlussmöglichkeit ist deutlich weniger als das, was wir von Mini-PCs gewohnt sind. Über USB4 lassen sich unterdessen auch Bildschirme anschließen, womit der Minisforum MS-01 in Summe drei Bildschirme gleichzeitig ansteuern kann. Sogar 8K-Displays werden von dem Minisforum MS-01 nativ unterstützt. Allerdings muss man sich dann mit 30 Hz zufriedengeben. Als Besonderheit verfügt der Minisforum MS-01 über eine physische PCIe-x16-Schnittstelle, welche nativ PCIe-4.0-x8-Geschwindigkeit bietet. Somit kann der kompakte Rechner mit einer dedizierten Grafikkarte ausgestattet werden. Der Formfaktor schränkt die Auswahl des Modells aber deutlich ein, denn hier passen lediglich Karten mit halber Höhe in das Gehäuse. Bei der Kühlung darf nur ein Single-Slot-Design zum Einsatz kommen.

Kommunikation
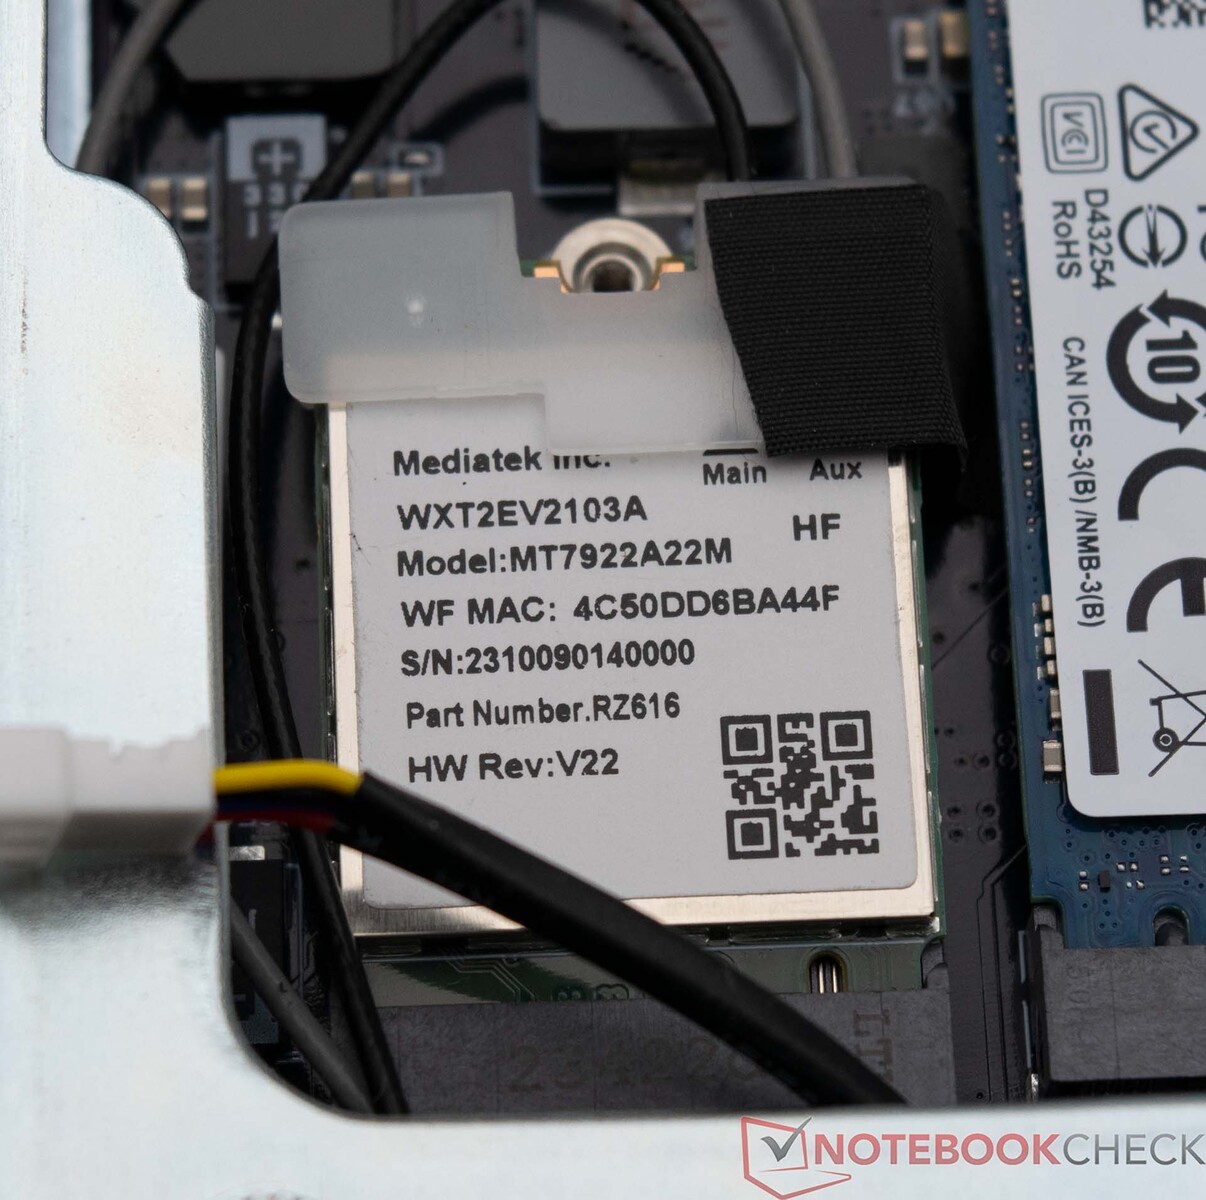
Im Minisforum MS-01 finden wir ein WLAN-Modul vor, welches uns schon häufiger untergekommen ist. Das MediaTek Wi-Fi 6E MT7922 WLAN-Modul erreicht in Kombination mit unserem Testsample durchweg hervorragende Ergebnisse. Sowohl bei der Verwendung des 5-GHz-Funknetzes als auch bei der Nutzung des 6-GHz-Frequenzbereiches kann sich unser Testsample fast immer an die Spitze setzen. Als Testrouter kam der Asus ROG Rapture GT-AXE11000 zum Einsatz. Alternativ zur Funkverbindung bietet der Minisforum MS-01 noch viele weitere Netzwerkanschlüsse. Auf der Rückseite des MS-01 gibt es noch zwei RJ45-Buchsen. Eine Übertragung der Daten ist hier bis zu 2,5 GBit/s möglich. Alternativ dazu gibt es noch die Möglichkeit, über zwei SFP+-Schnittstellen weitere Netzwerkadapter nachzurüsten.
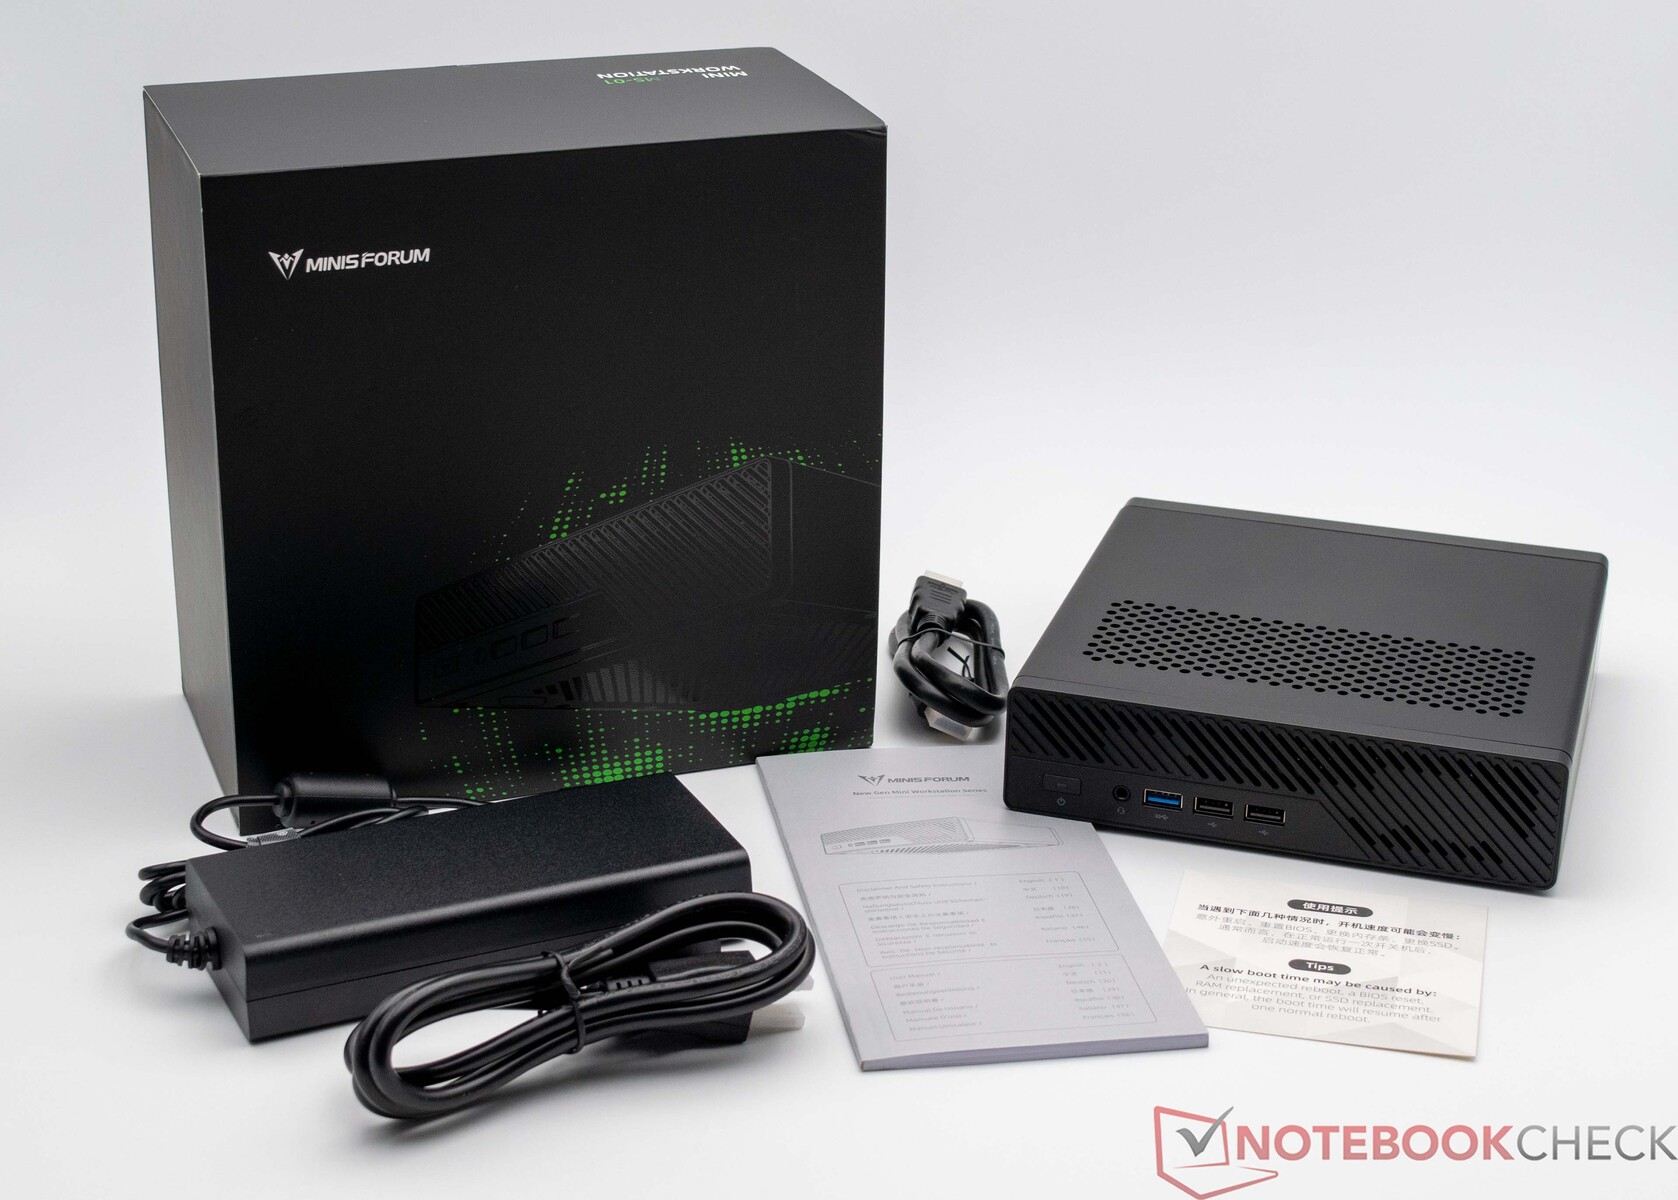
Zubehör
Der Lieferumfang des Minisforum MS-01 fällt nicht sehr üppig aus. Neben dem Mini-PC selbst befindet sich noch das 180-Watt-Netzteil sowie ein HDMI-Kabel im Lieferumfang. Des Weiteren liegt dem Gerät ein Adapter für die Installation einer U.2-SSD bei.
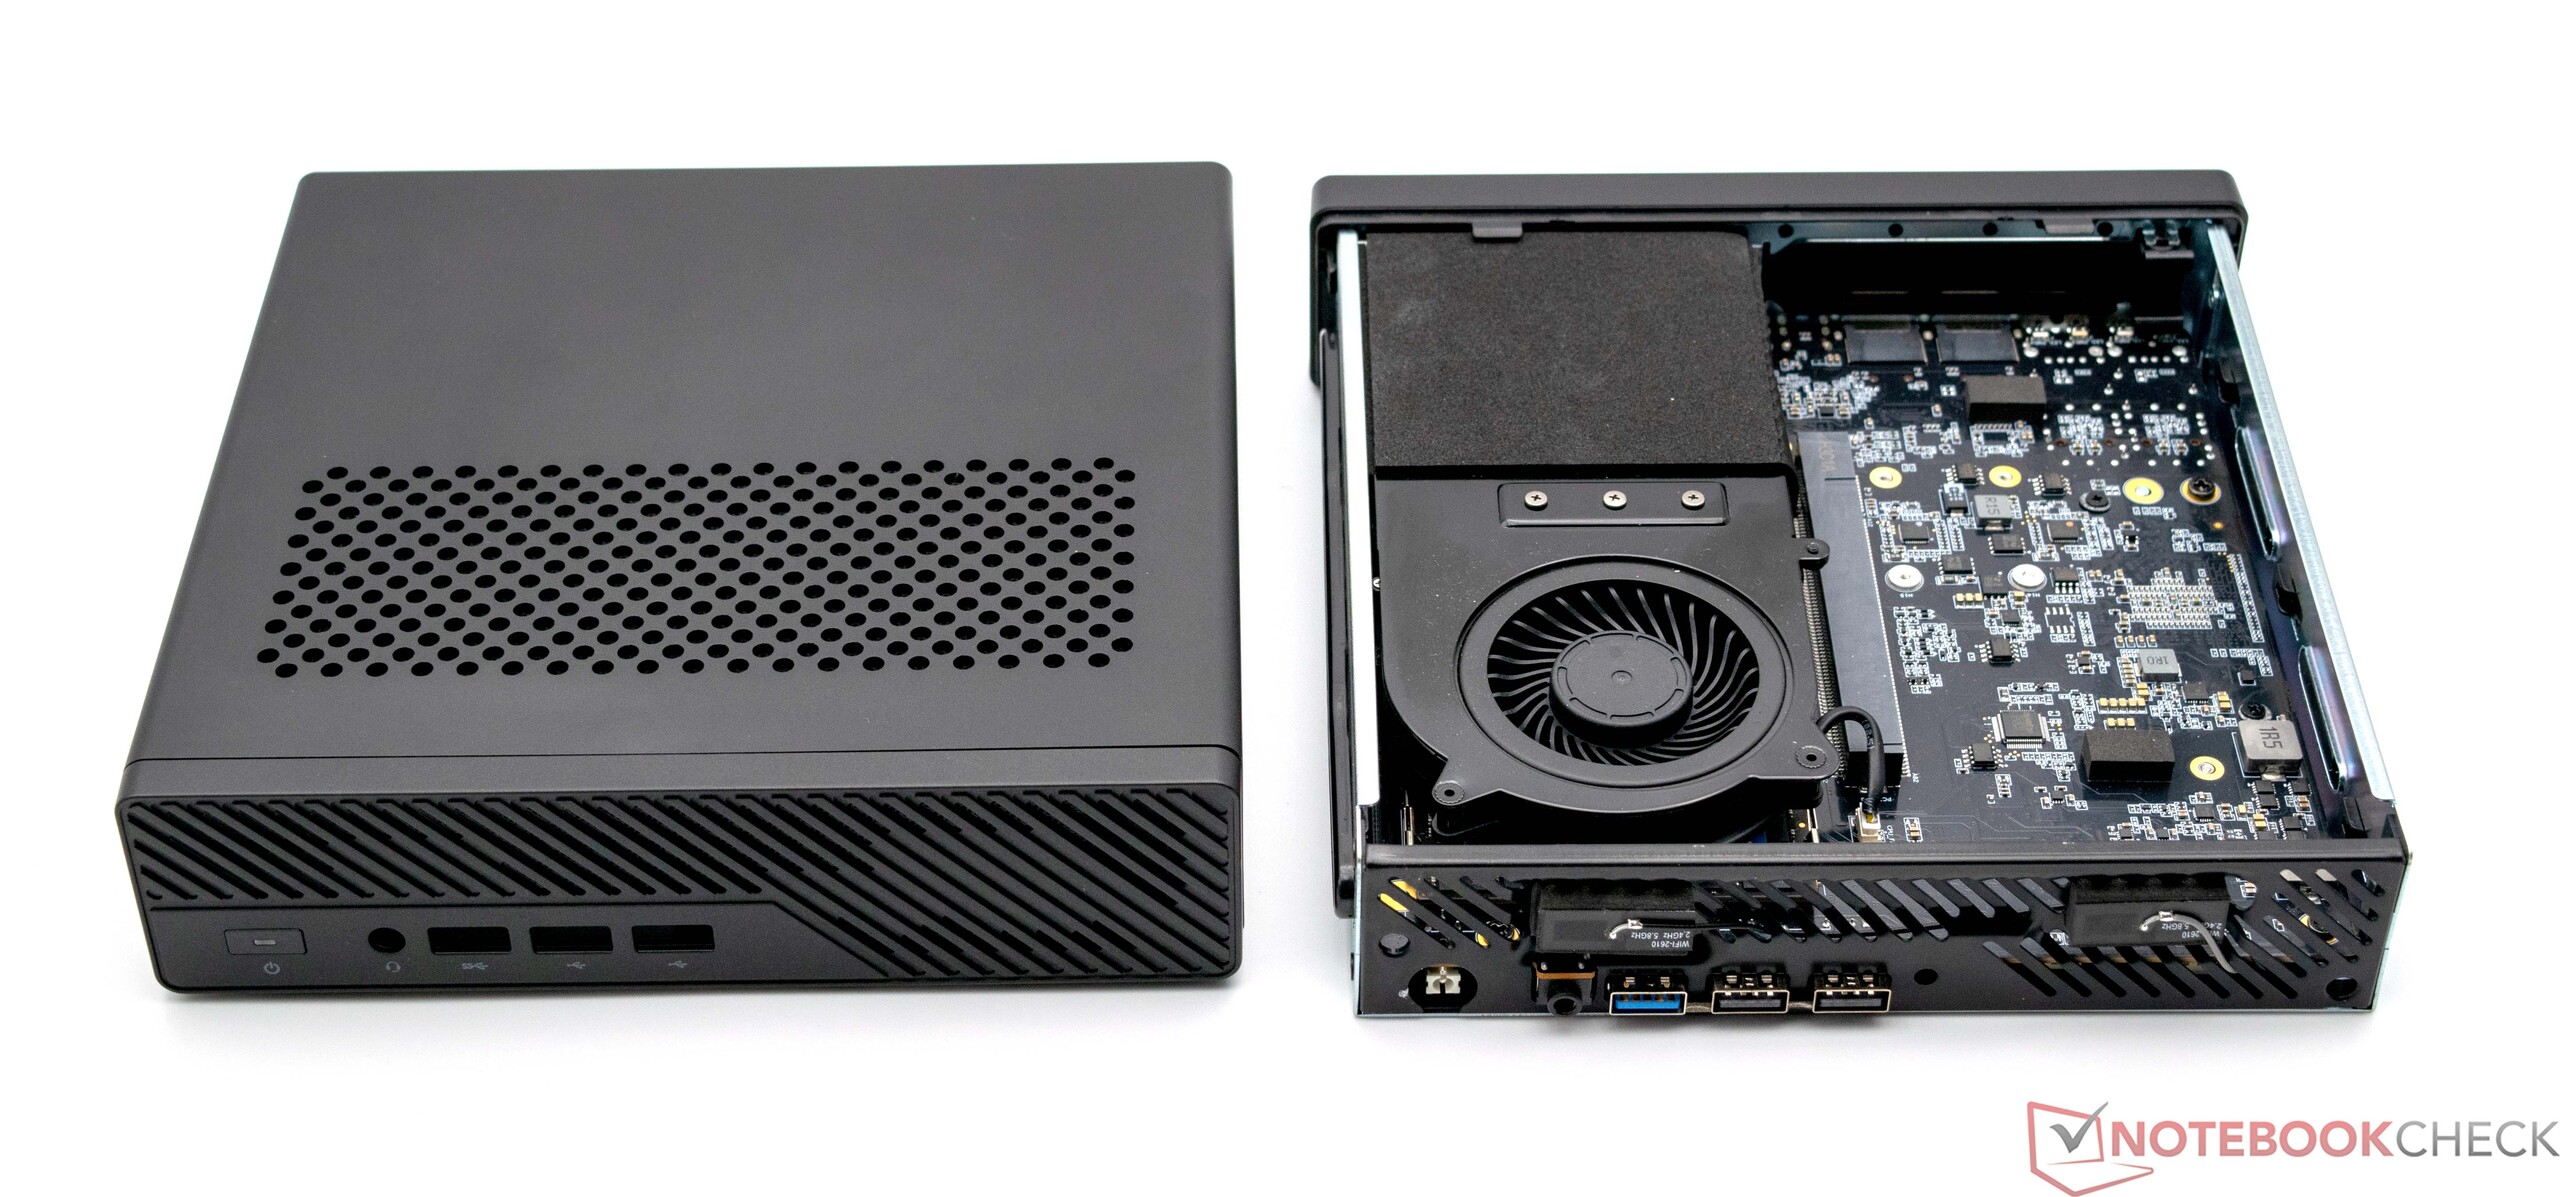
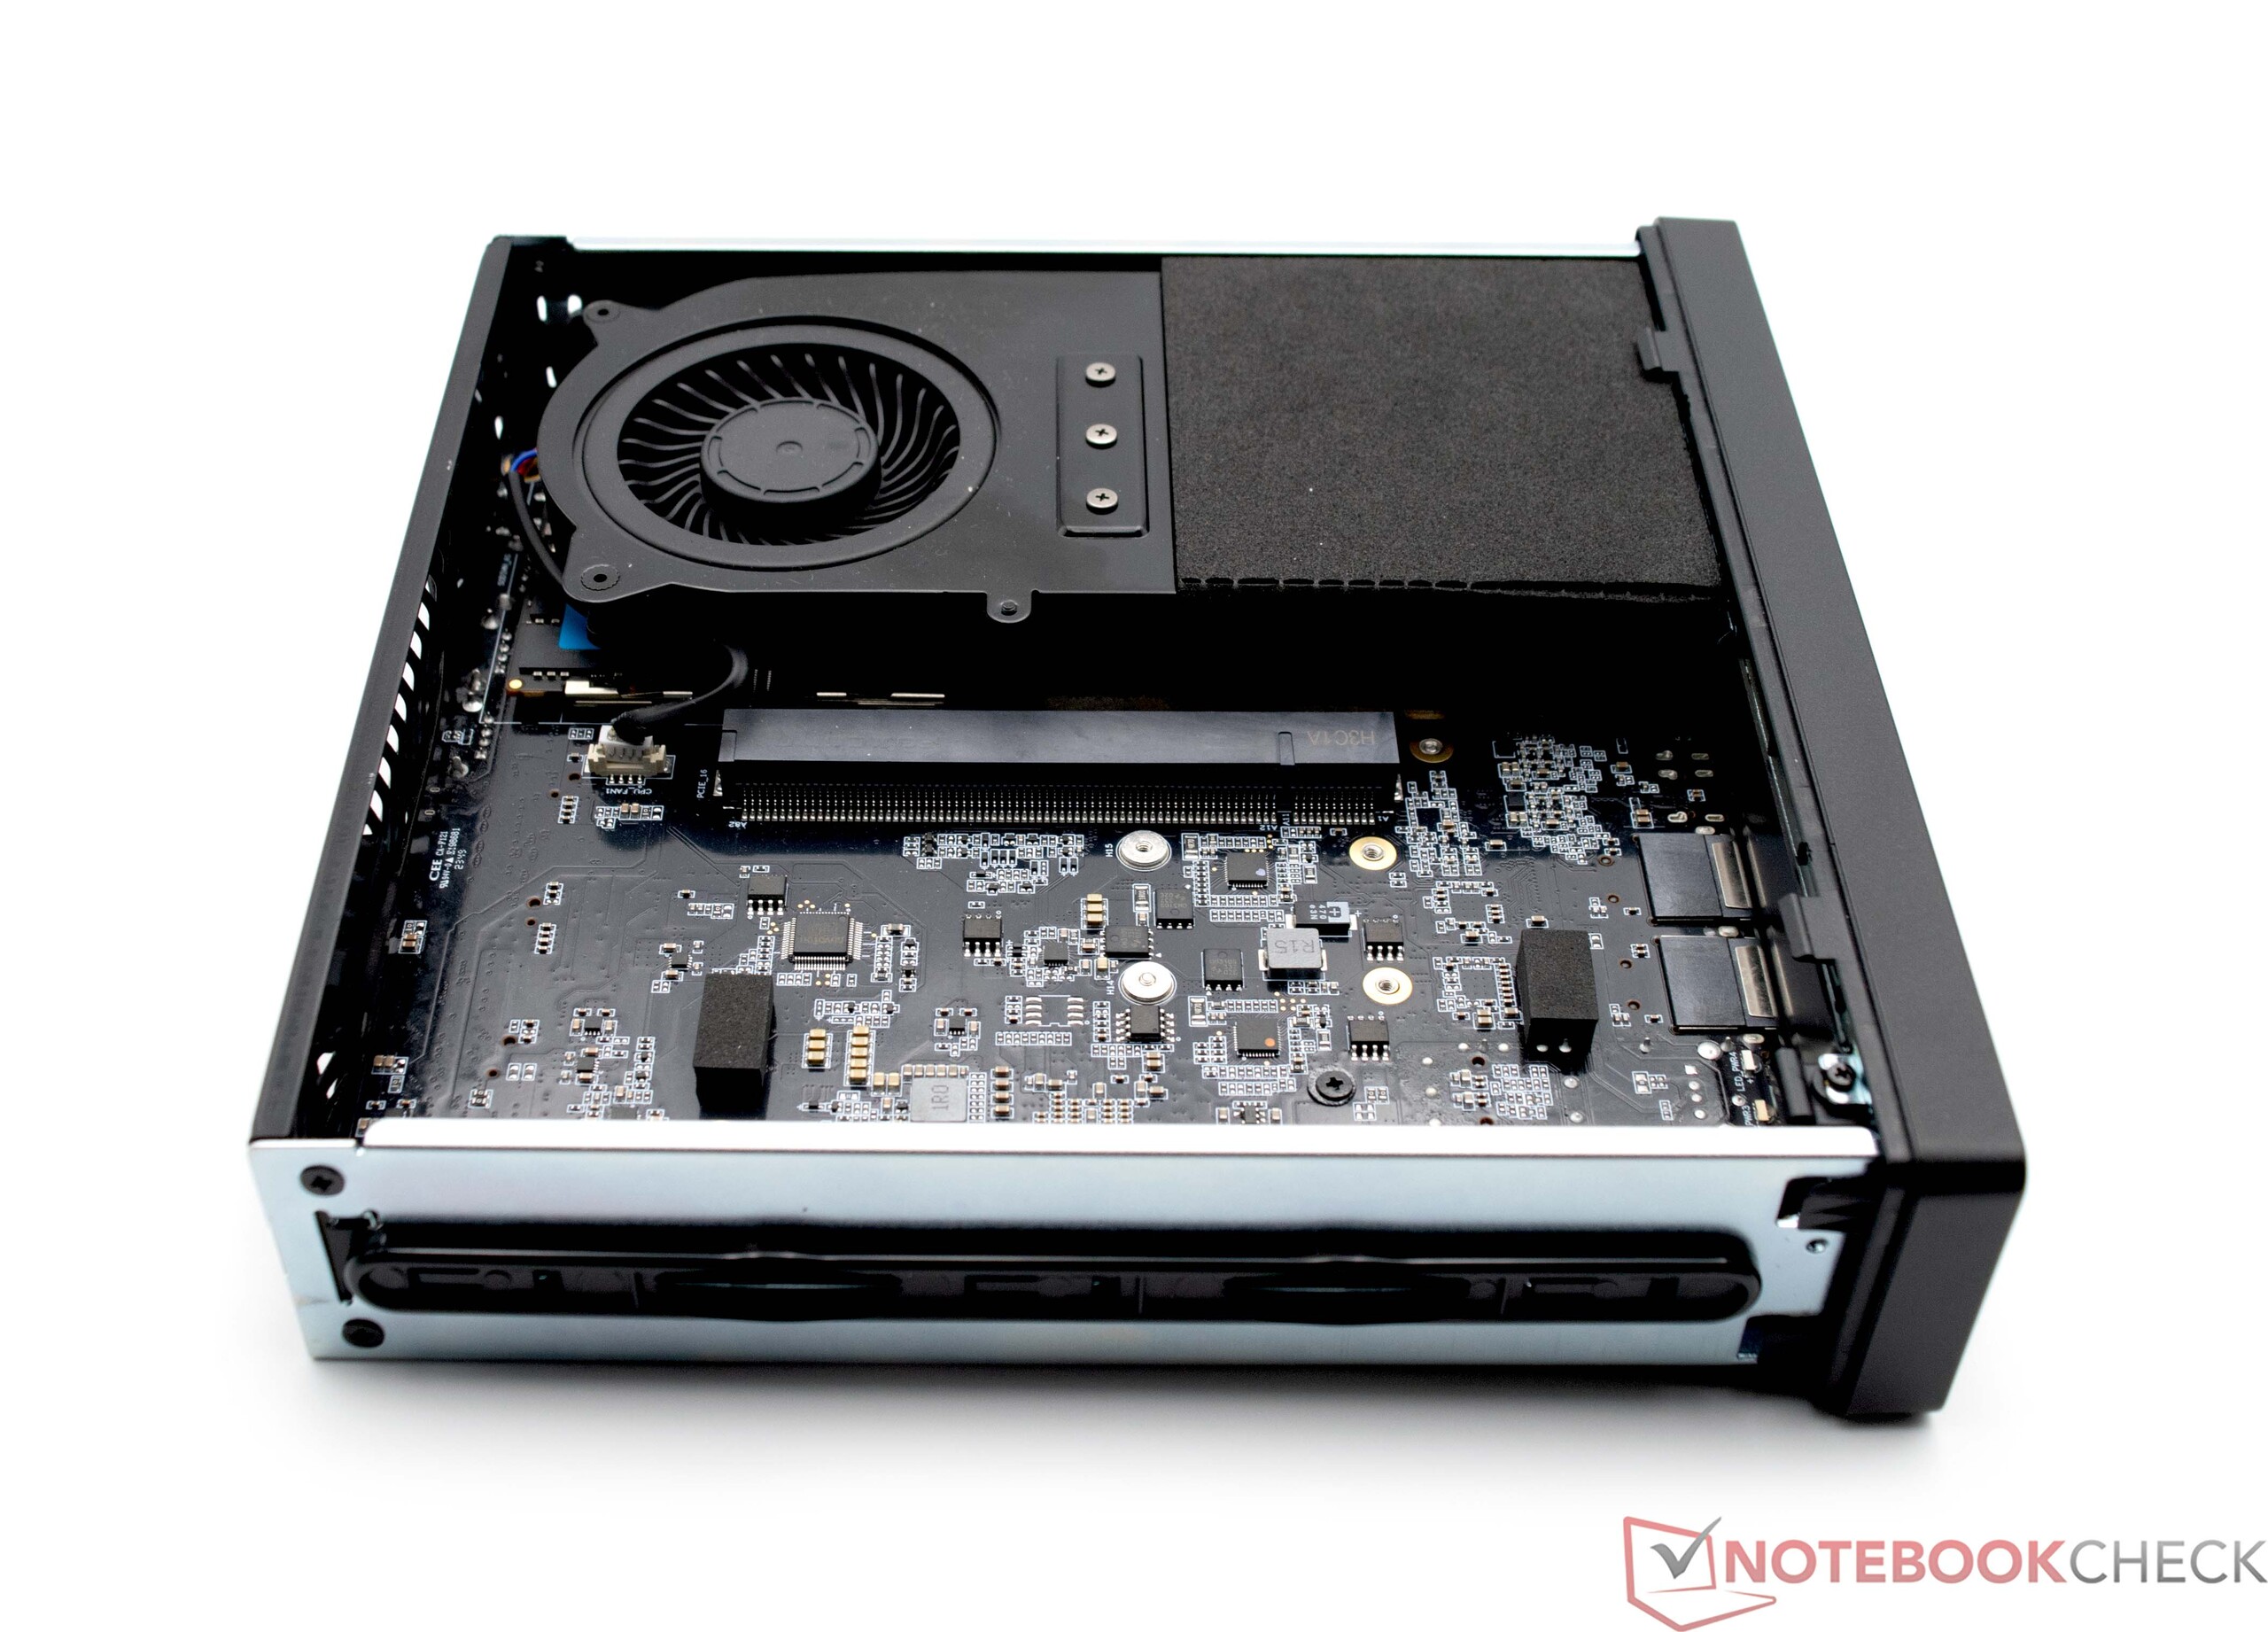
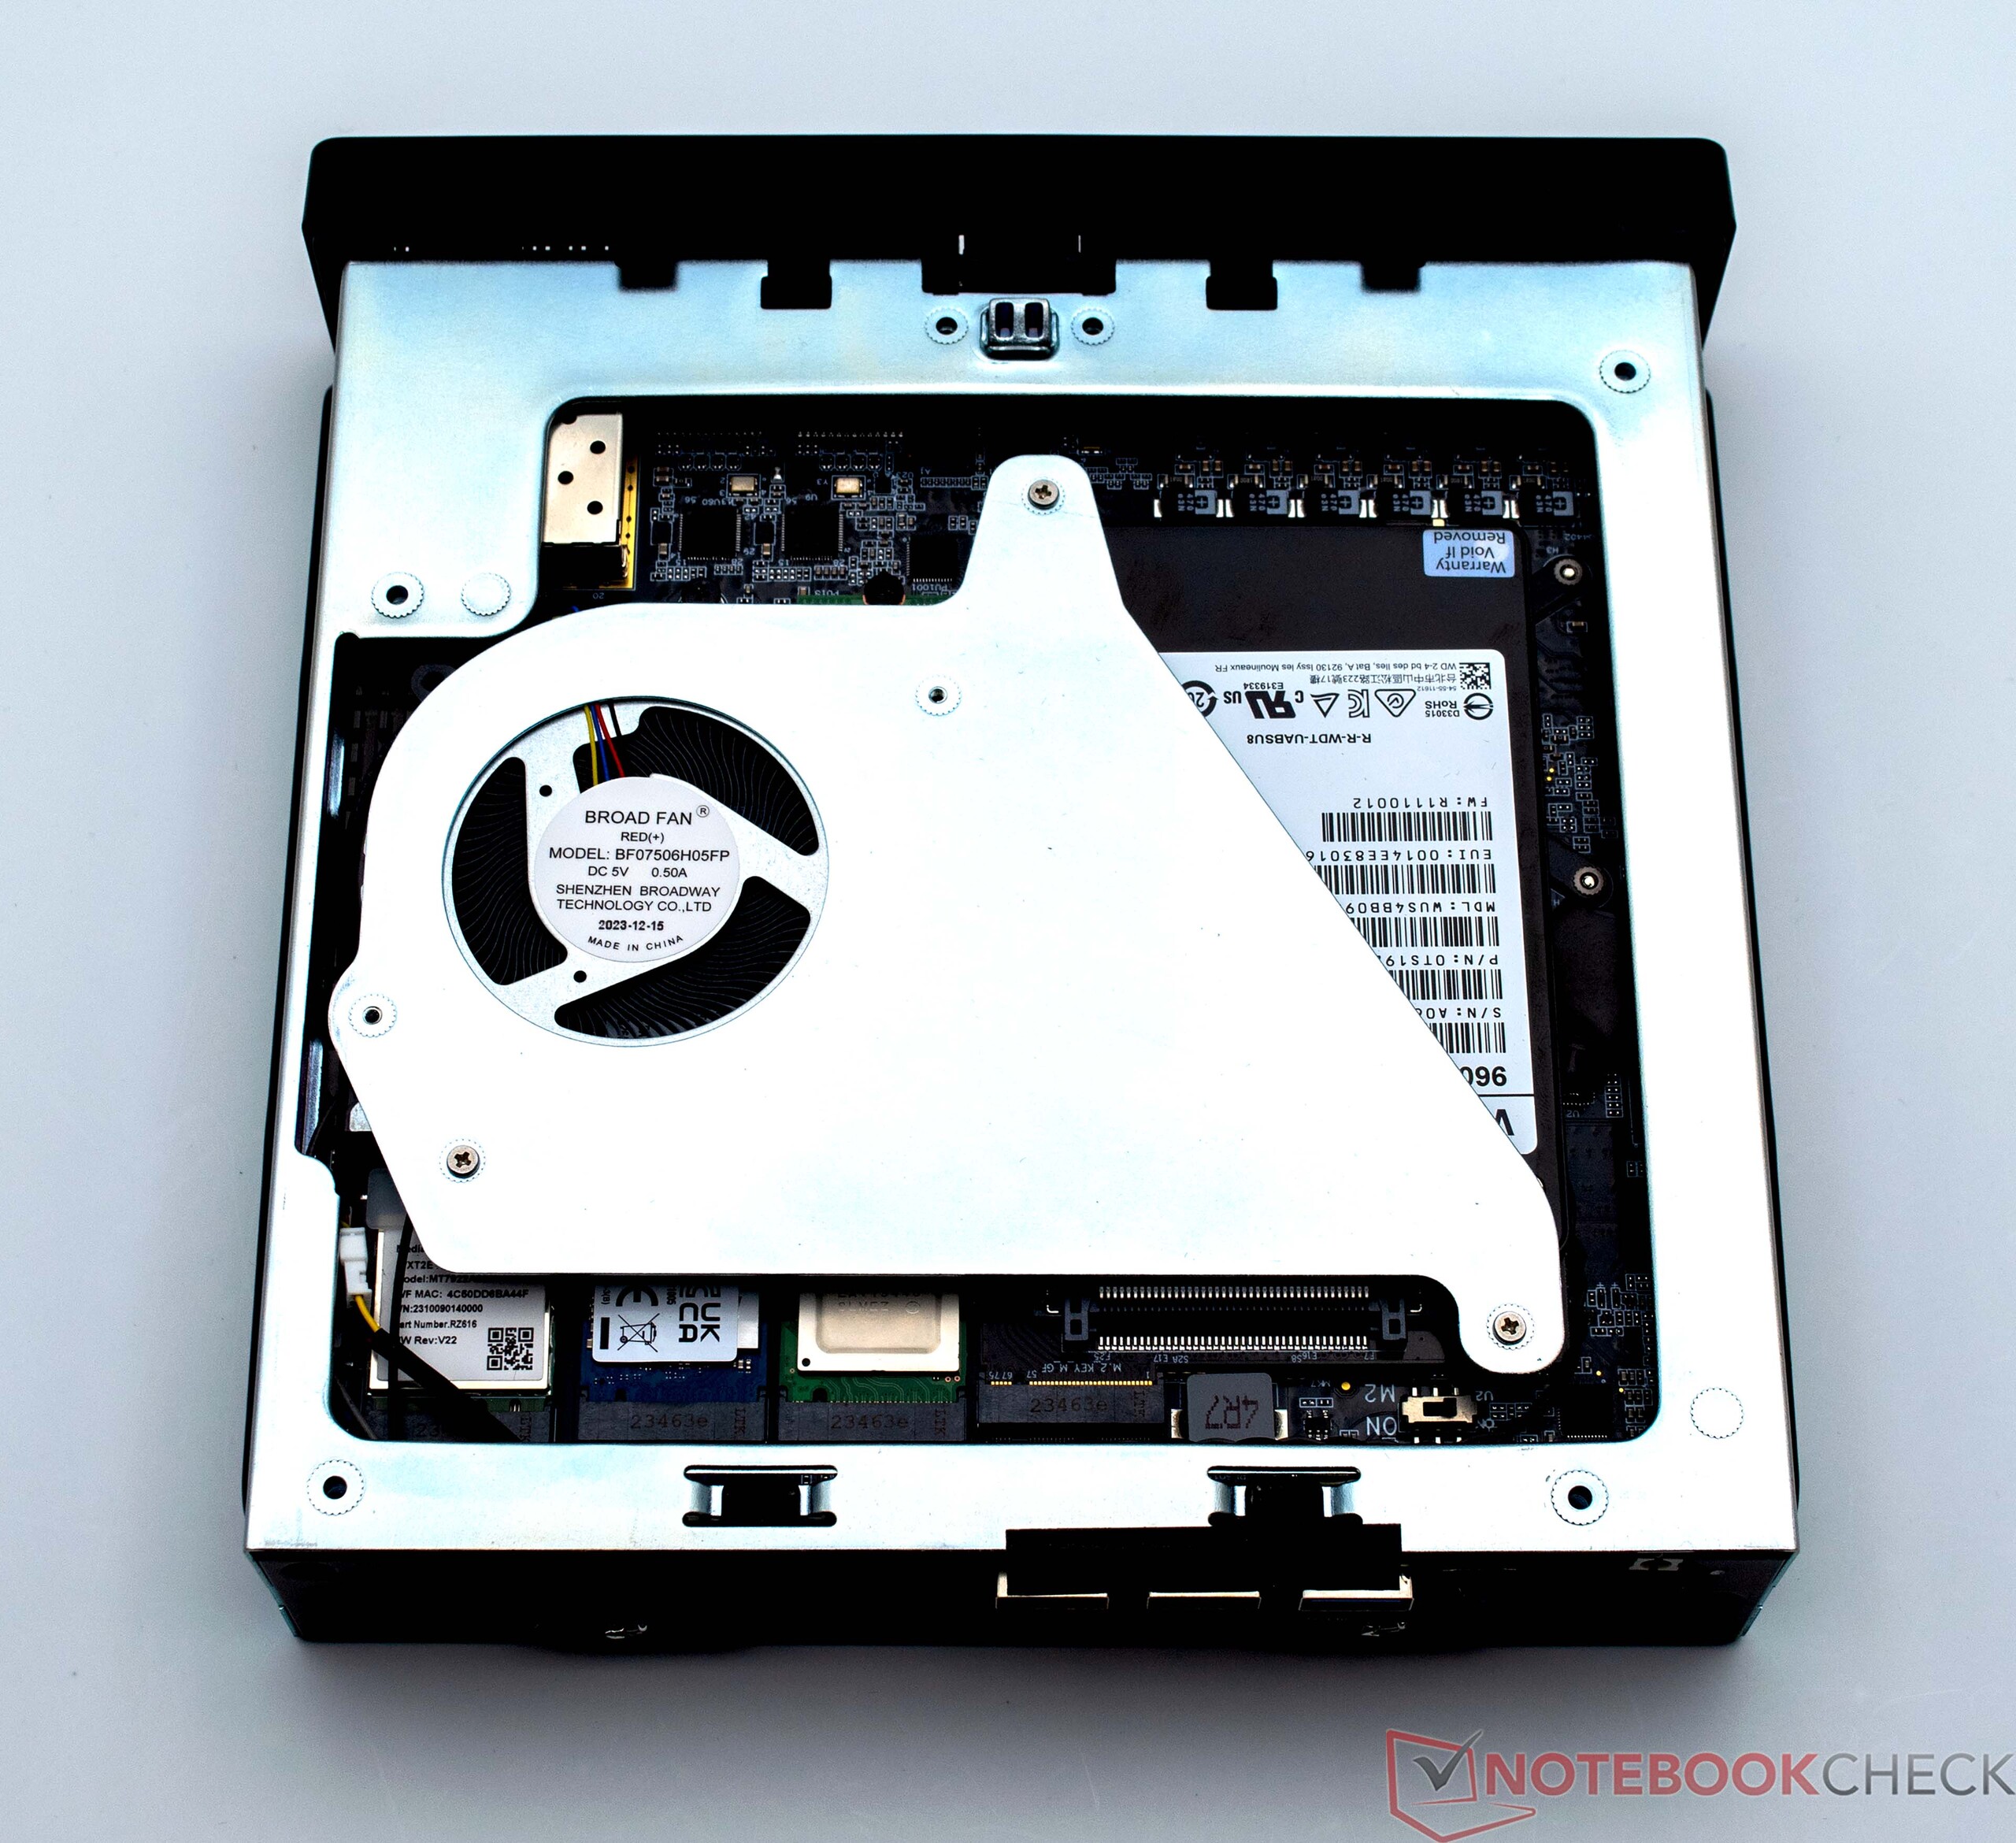
Wartung
Wartungsarbeiten sind beim Minisforum MS-01 kein Problem. Das Gerät selbst kann sogar werkzeuglos geöffnet werden. Das klappt in der Realität recht gut. Wer das Gerät also als Barebone-Option kauft, muss zwangsläufig RAM und SSD installieren, was dann doch nicht ohne Werkzeug möglich ist. Die beiden SO-DIMM-Slots befinden sich direkt unter dem CPU-Lüfter, und SSDs lassen sich auf der Unterseite installieren. Jedoch muss hierfür eine weite Metallabdeckung mit einem weiteren Lüfter demontiert werden. Im Minisforum MS-01 lassen sich ausschließlich PCIe-SSDs unterbringen. Selbst U.2-SSDs können eingebaut werden, wenngleich dafür der beiliegende Adapter genutzt werden muss.


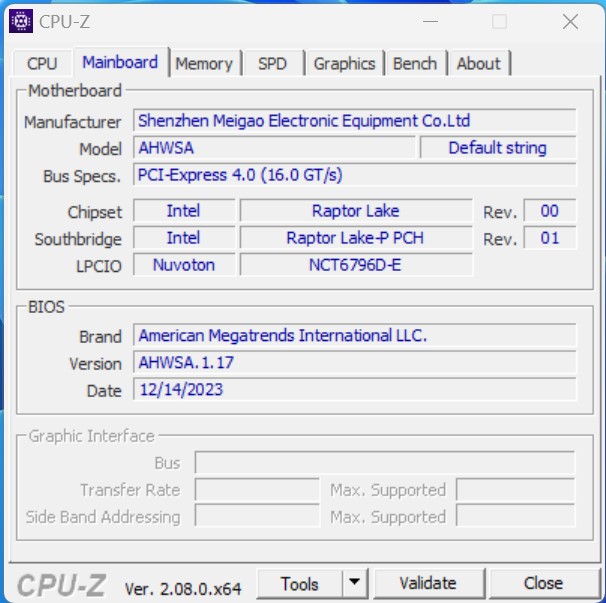
Leistung - Intel Raptor Lake-H mit 14 Kernen und 20 Threads
Der Minisforum MS-01 ist in der Topausstattung mit dem Intel Core i9-13900H bestückt. Alternativ gibt es das Modell auch mit einem Intel Core i9-12900H, welcher vermutlich kaum schlechter abschneiden würde. Preisbewusste Käufer können aber auch zum Intel Core i5-12600H greifen. Dieses SoC vereint noch immer 12 Kerne und 16 Threads und sollte ebenfalls mit den meisten Aufgaben umgehen können.
Testbedingungen
Für alle Leistungstests mit dem Minisforum MS-01 nutzen wir das Energieprofil "Höchstleistung". Abweichungen hierzu gab es nur bei den Energie- und Lautstärkemessungen gemäß unserer Testkriterien. Die Leistungsgrenzen des Prozessors PL1 (60 Watt) und PL2 (80 Watt) wurden gemäß dem Auslieferungszustand nicht verändert.
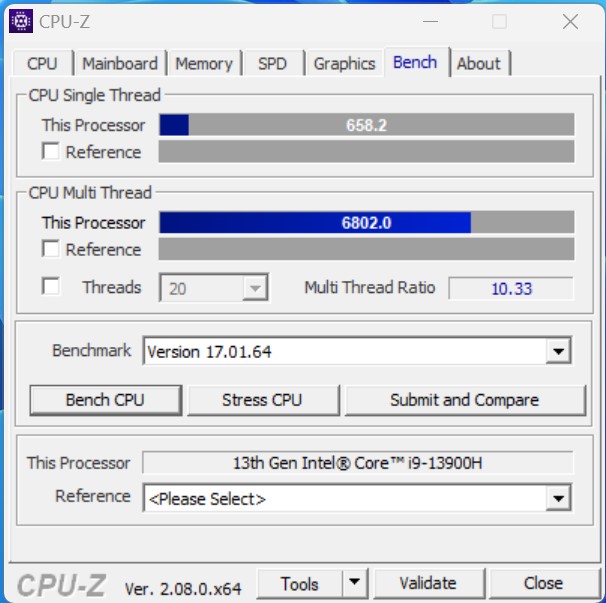
Prozessor
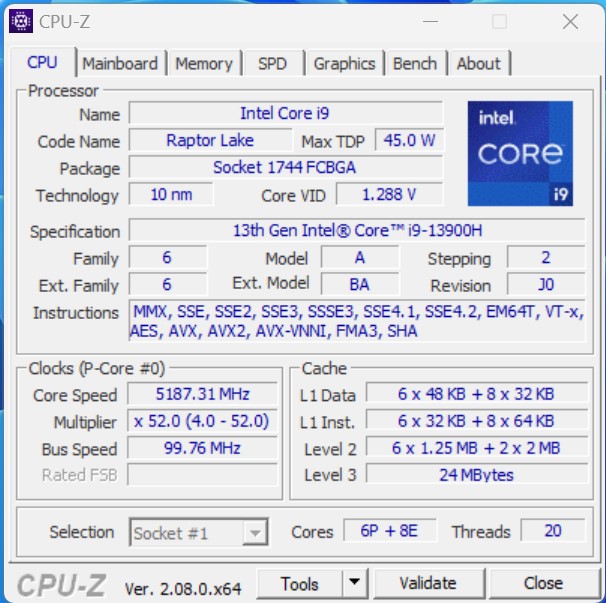
Der Minisforum MS-01 wird in der Topausstattung mit dem Intel Core i9-13900H ausgeliefert. Rein leistungstechnisch liefert das SoC in unserem Testsample eine hervorragende Leistung und reiht sich mit einem sehr geringen Abstand hinter dem Geekom A7 mit dem AMD Ryzen 9 7940HS ein.
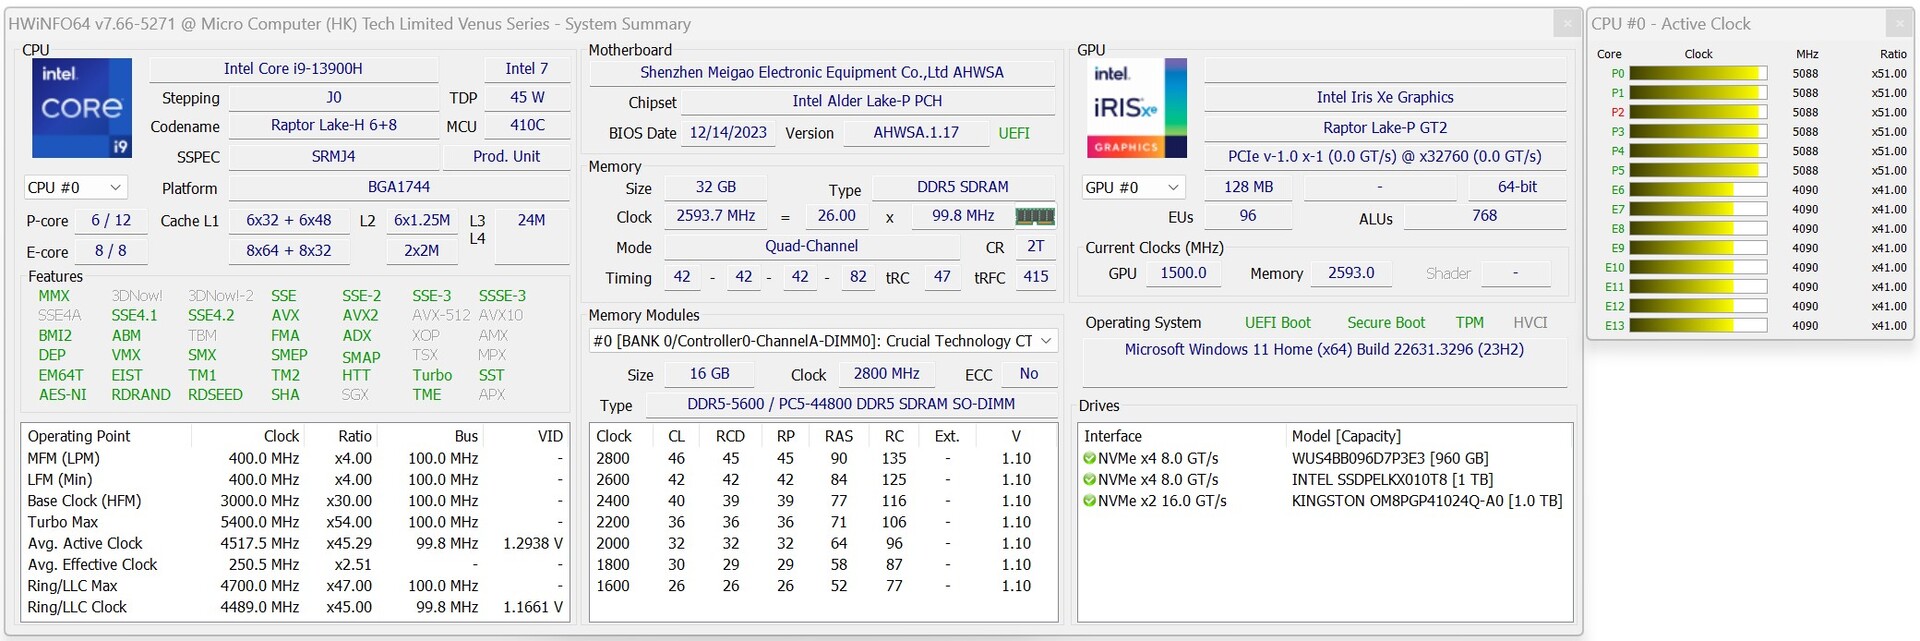
Insgesamt bietet Intel Core i9-13900H 14 Kerne mit 20 Threads. Beim Energiebedarf räumt Minisforum dem Prozessor ein kurzfristiges Leistungslimit von bis zu 80 Watt ein. Unter Dauerlast sollen immerhin 60 Watt erreicht werden. An dieser Stelle greifen wir etwas vor und können die Leistungslimits bestätigen.
Für weitere Vergleiche und Benchmarks verweisen wir auf unsere CPU-Vergleichstabelle.
| Performance Rating - Percent | |
| Geekom A7 | |
| Minisforum MS-01 | |
| Minisforum Venus Series NAB9 | |
| Acemagic F2A | |
| Minisforum Venus Series NPB5 | |
| Geekom XT12 Pro | |
| Maxtang MTN-FP750 | |
| Cinebench R10 | |
| Rendering Single CPUs 64Bit | |
| Minisforum Venus Series NAB9 | |
| Minisforum Venus Series NPB5 | |
| Geekom A7 | |
| Acemagic F2A | |
| Minisforum MS-01 | |
| Geekom XT12 Pro | |
| Maxtang MTN-FP750 | |
| Rendering Multiple CPUs 64Bit | |
| Acemagic F2A | |
| Minisforum Venus Series NPB5 | |
| Geekom A7 | |
| Minisforum MS-01 | |
| Minisforum Venus Series NAB9 | |
| Geekom XT12 Pro | |
| Maxtang MTN-FP750 | |
| Blender - v2.79 BMW27 CPU | |
| Geekom XT12 Pro | |
| Maxtang MTN-FP750 | |
| Minisforum Venus Series NPB5 | |
| Minisforum Venus Series NAB9 | |
| Geekom A7 | |
| Minisforum MS-01 | |
| Acemagic F2A | |
| WinRAR - Result | |
| Minisforum MS-01 | |
| Minisforum Venus Series NAB9 | |
| Geekom XT12 Pro | |
| Acemagic F2A | |
| Geekom A7 | |
| Minisforum Venus Series NPB5 | |
| Maxtang MTN-FP750 | |
| 3DMark 11 - 1280x720 Performance Physics | |
| Geekom A7 | |
| Minisforum MS-01 | |
| Minisforum Venus Series NPB5 | |
| Acemagic F2A | |
| Minisforum Venus Series NAB9 | |
| Geekom XT12 Pro | |
| Maxtang MTN-FP750 | |
| HWBOT x265 Benchmark v2.2 - 4k Preset | |
| Geekom A7 | |
| Acemagic F2A | |
| Minisforum MS-01 | |
| Minisforum Venus Series NAB9 | |
| Minisforum Venus Series NPB5 | |
| Maxtang MTN-FP750 | |
| Geekom XT12 Pro | |
| R Benchmark 2.5 - Overall mean | |
| Maxtang MTN-FP750 | |
| Minisforum Venus Series NPB5 | |
| Acemagic F2A | |
| Geekom XT12 Pro | |
| Minisforum Venus Series NAB9 | |
| Minisforum MS-01 | |
| Geekom A7 | |
| LibreOffice - 20 Documents To PDF | |
| Maxtang MTN-FP750 | |
| Geekom A7 | |
| Acemagic F2A | |
| Minisforum Venus Series NPB5 | |
| Geekom XT12 Pro | |
| Minisforum Venus Series NAB9 | |
| Minisforum MS-01 | |
| WebXPRT 3 - Overall | |
| Geekom A7 | |
| Minisforum MS-01 | |
| Minisforum Venus Series NPB5 | |
| Minisforum Venus Series NAB9 | |
| Geekom XT12 Pro | |
| Maxtang MTN-FP750 | |
| Acemagic F2A | |
| Mozilla Kraken 1.1 - Total | |
| Maxtang MTN-FP750 | |
| Acemagic F2A | |
| Minisforum Venus Series NPB5 | |
| Geekom XT12 Pro | |
| Minisforum MS-01 | |
| Geekom A7 | |
| Minisforum Venus Series NAB9 | |
| Super Pi mod 1.5 XS 1M - 1M | |
| Maxtang MTN-FP750 | |
| Geekom XT12 Pro | |
| Geekom A7 | |
| Minisforum Venus Series NAB9 | |
| Acemagic F2A | |
| Minisforum Venus Series NPB5 | |
| Minisforum MS-01 | |
| Super Pi mod 1.5 XS 2M - 2M | |
| Maxtang MTN-FP750 | |
| Geekom A7 | |
| Minisforum Venus Series NAB9 | |
| Geekom XT12 Pro | |
| Acemagic F2A | |
| Minisforum Venus Series NPB5 | |
| Minisforum MS-01 | |
| Super Pi Mod 1.5 XS 32M - 32M | |
| Maxtang MTN-FP750 | |
| Geekom A7 | |
| Minisforum Venus Series NAB9 | |
| Geekom XT12 Pro | |
| Acemagic F2A | |
| Minisforum MS-01 | |
| Minisforum Venus Series NPB5 | |
* ... kleinere Werte sind besser
| Performance Rating - Percent | |
| Geekom A7 | |
| Minisforum MS-01 | |
| Acemagic F2A | |
| Minisforum Venus Series NPB5 | |
| Minisforum Venus Series NAB9 | |
| Geekom XT12 Pro | |
| Maxtang MTN-FP750 | |
AIDA64: FP32 Ray-Trace | FPU Julia | CPU SHA3 | CPU Queen | FPU SinJulia | FPU Mandel | CPU AES | CPU ZLib | FP64 Ray-Trace | CPU PhotoWorxx
| Performance Rating | |
| Geekom A7 | |
| Durchschnitt der Klasse Mini PC | |
| Acemagic F2A | |
| Minisforum MS-01 | |
| Minisforum Venus Series NAB9 | |
| Maxtang MTN-FP750 | |
| Minisforum Venus Series NPB5 | |
| Geekom XT12 Pro | |
| AIDA64 / FP32 Ray-Trace | |
| Geekom A7 | |
| Durchschnitt der Klasse Mini PC (974 - 82725, n=103, der letzten 2 Jahre) | |
| Acemagic F2A | |
| Minisforum MS-01 | |
| Maxtang MTN-FP750 | |
| Minisforum Venus Series NAB9 | |
| Minisforum Venus Series NPB5 | |
| Geekom XT12 Pro | |
| AIDA64 / FPU Julia | |
| Geekom A7 | |
| Durchschnitt der Klasse Mini PC (6115 - 363782, n=103, der letzten 2 Jahre) | |
| Acemagic F2A | |
| Maxtang MTN-FP750 | |
| Minisforum MS-01 | |
| Minisforum Venus Series NAB9 | |
| Minisforum Venus Series NPB5 | |
| Geekom XT12 Pro | |
| AIDA64 / CPU SHA3 | |
| Geekom A7 | |
| Durchschnitt der Klasse Mini PC (385 - 9475, n=103, der letzten 2 Jahre) | |
| Acemagic F2A | |
| Minisforum MS-01 | |
| Minisforum Venus Series NAB9 | |
| Maxtang MTN-FP750 | |
| Minisforum Venus Series NPB5 | |
| Geekom XT12 Pro | |
| AIDA64 / CPU Queen | |
| Geekom A7 | |
| Minisforum Venus Series NAB9 | |
| Durchschnitt der Klasse Mini PC (20501 - 162855, n=86, der letzten 2 Jahre) | |
| Maxtang MTN-FP750 | |
| Acemagic F2A | |
| Minisforum MS-01 | |
| Minisforum Venus Series NPB5 | |
| Geekom XT12 Pro | |
| AIDA64 / FPU SinJulia | |
| Geekom A7 | |
| Durchschnitt der Klasse Mini PC (1116 - 31931, n=103, der letzten 2 Jahre) | |
| Maxtang MTN-FP750 | |
| Acemagic F2A | |
| Minisforum MS-01 | |
| Minisforum Venus Series NAB9 | |
| Geekom XT12 Pro | |
| Minisforum Venus Series NPB5 | |
| AIDA64 / FPU Mandel | |
| Geekom A7 | |
| Durchschnitt der Klasse Mini PC (3322 - 192994, n=103, der letzten 2 Jahre) | |
| Acemagic F2A | |
| Maxtang MTN-FP750 | |
| Minisforum MS-01 | |
| Minisforum Venus Series NAB9 | |
| Minisforum Venus Series NPB5 | |
| Geekom XT12 Pro | |
| AIDA64 / CPU AES | |
| Geekom A7 | |
| Acemagic F2A | |
| Minisforum MS-01 | |
| Minisforum Venus Series NAB9 | |
| Minisforum Venus Series NPB5 | |
| Geekom XT12 Pro | |
| Durchschnitt der Klasse Mini PC (9915 - 204742, n=102, der letzten 2 Jahre) | |
| Maxtang MTN-FP750 | |
| AIDA64 / CPU ZLib | |
| Acemagic F2A | |
| Durchschnitt der Klasse Mini PC (127.2 - 2431, n=103, der letzten 2 Jahre) | |
| Geekom A7 | |
| Minisforum MS-01 | |
| Minisforum Venus Series NAB9 | |
| Minisforum Venus Series NPB5 | |
| Geekom XT12 Pro | |
| Maxtang MTN-FP750 | |
| AIDA64 / FP64 Ray-Trace | |
| Geekom A7 | |
| Durchschnitt der Klasse Mini PC (537 - 43587, n=103, der letzten 2 Jahre) | |
| Acemagic F2A | |
| Minisforum MS-01 | |
| Maxtang MTN-FP750 | |
| Minisforum Venus Series NAB9 | |
| Minisforum Venus Series NPB5 | |
| Geekom XT12 Pro | |
| AIDA64 / CPU PhotoWorxx | |
| Minisforum MS-01 | |
| Durchschnitt der Klasse Mini PC (8069 - 96843, n=103, der letzten 2 Jahre) | |
| Geekom A7 | |
| Minisforum Venus Series NPB5 | |
| Acemagic F2A | |
| Minisforum Venus Series NAB9 | |
| Geekom XT12 Pro | |
| Maxtang MTN-FP750 | |
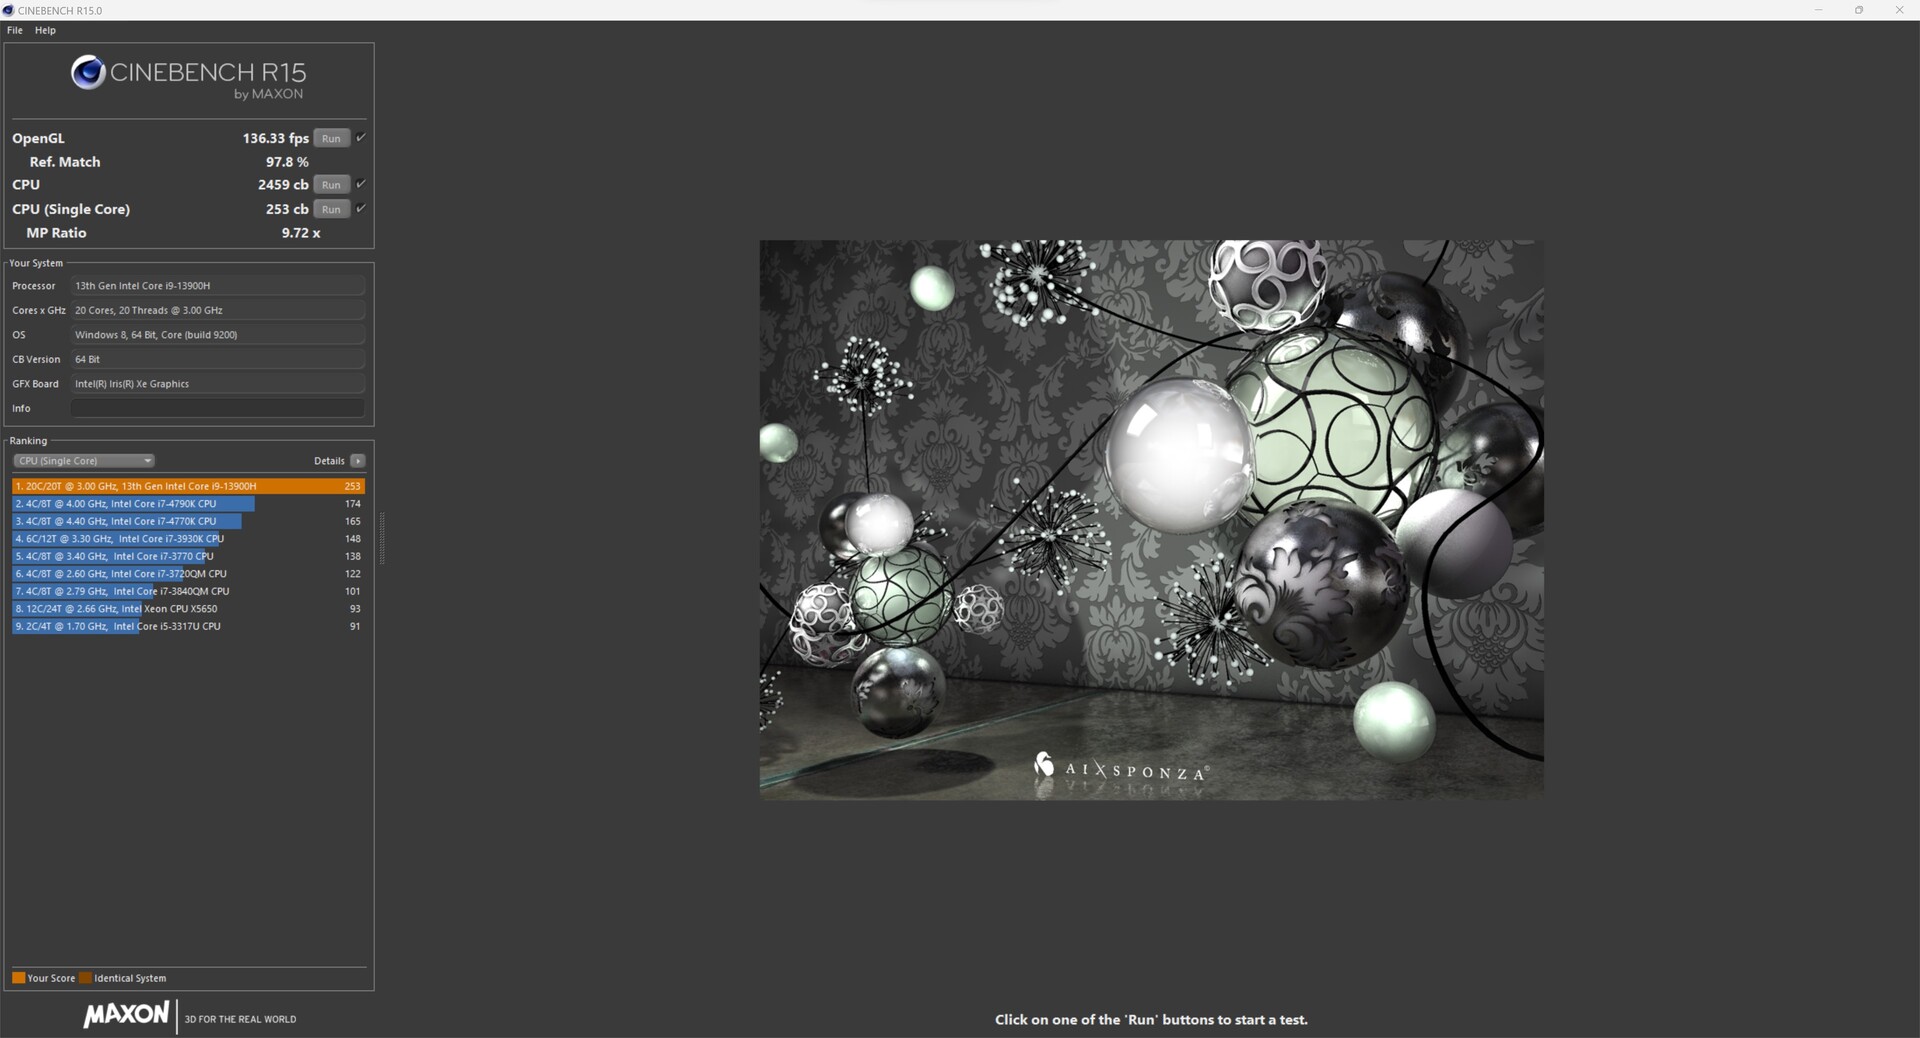
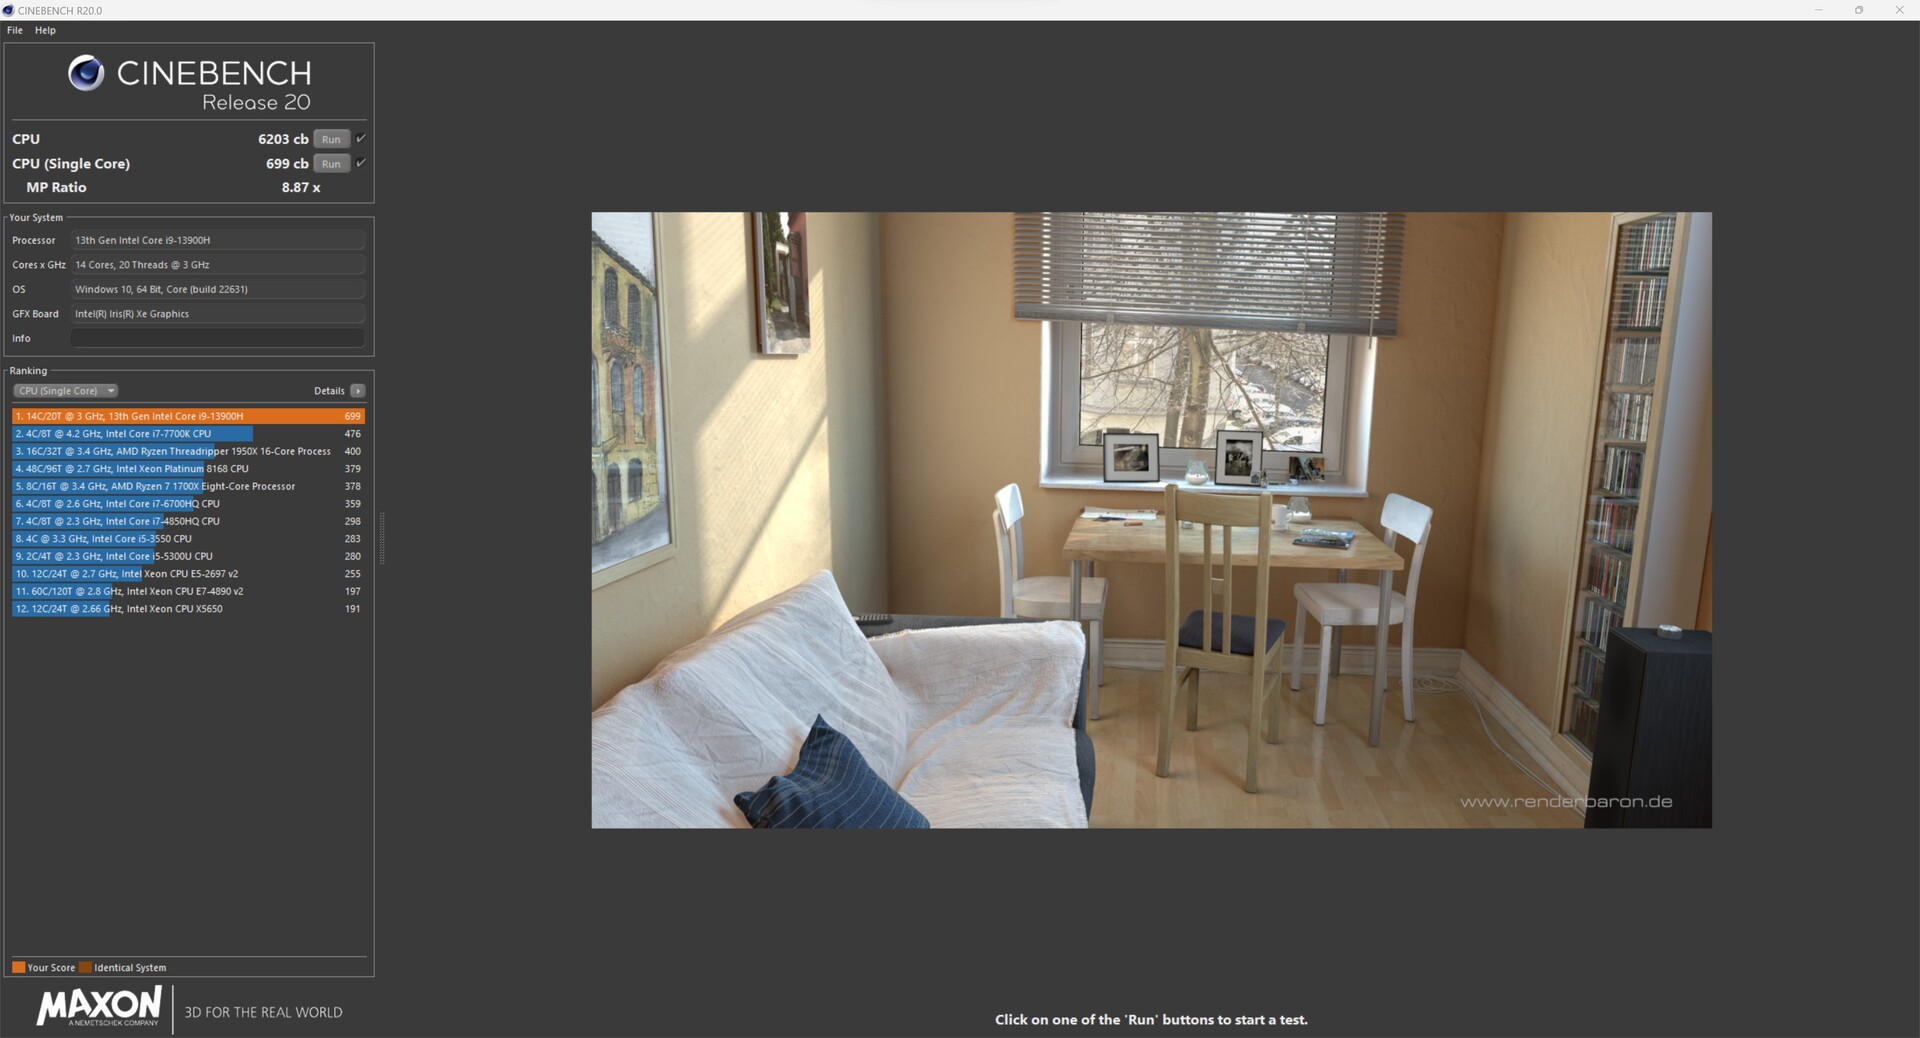
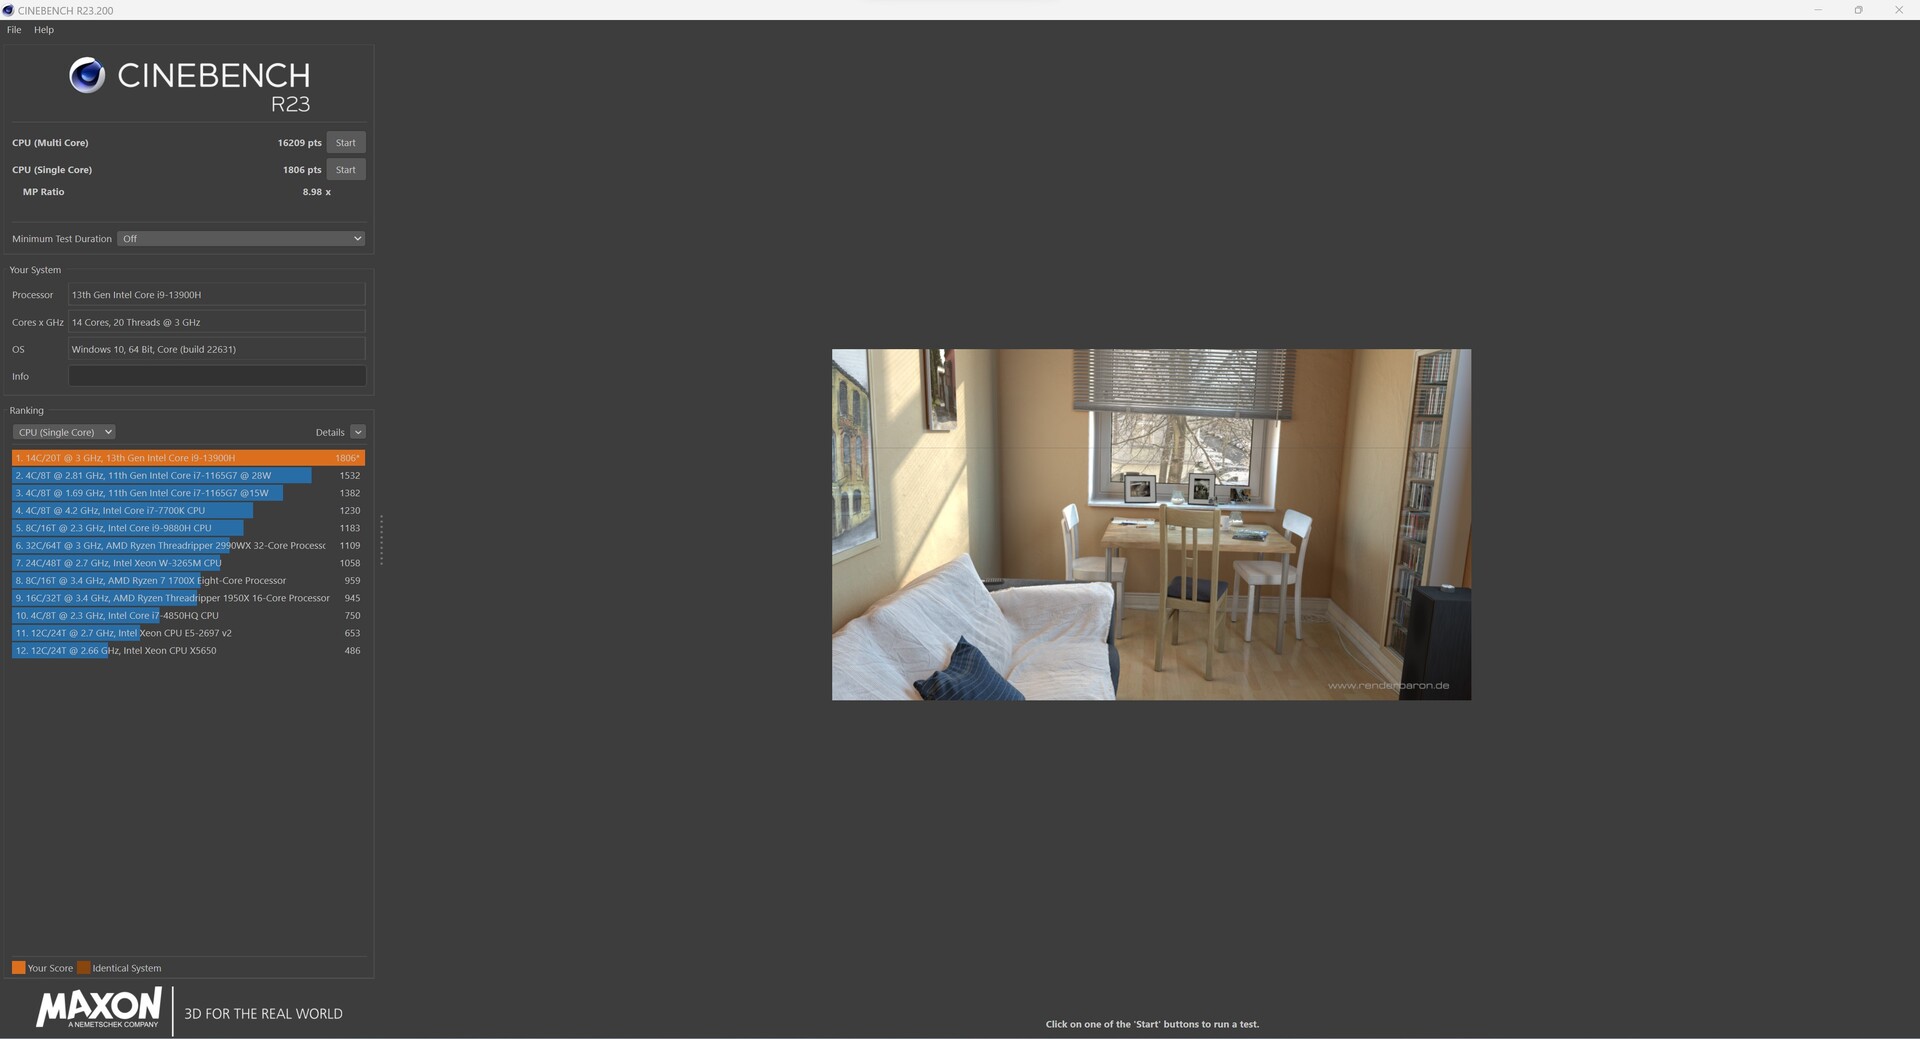
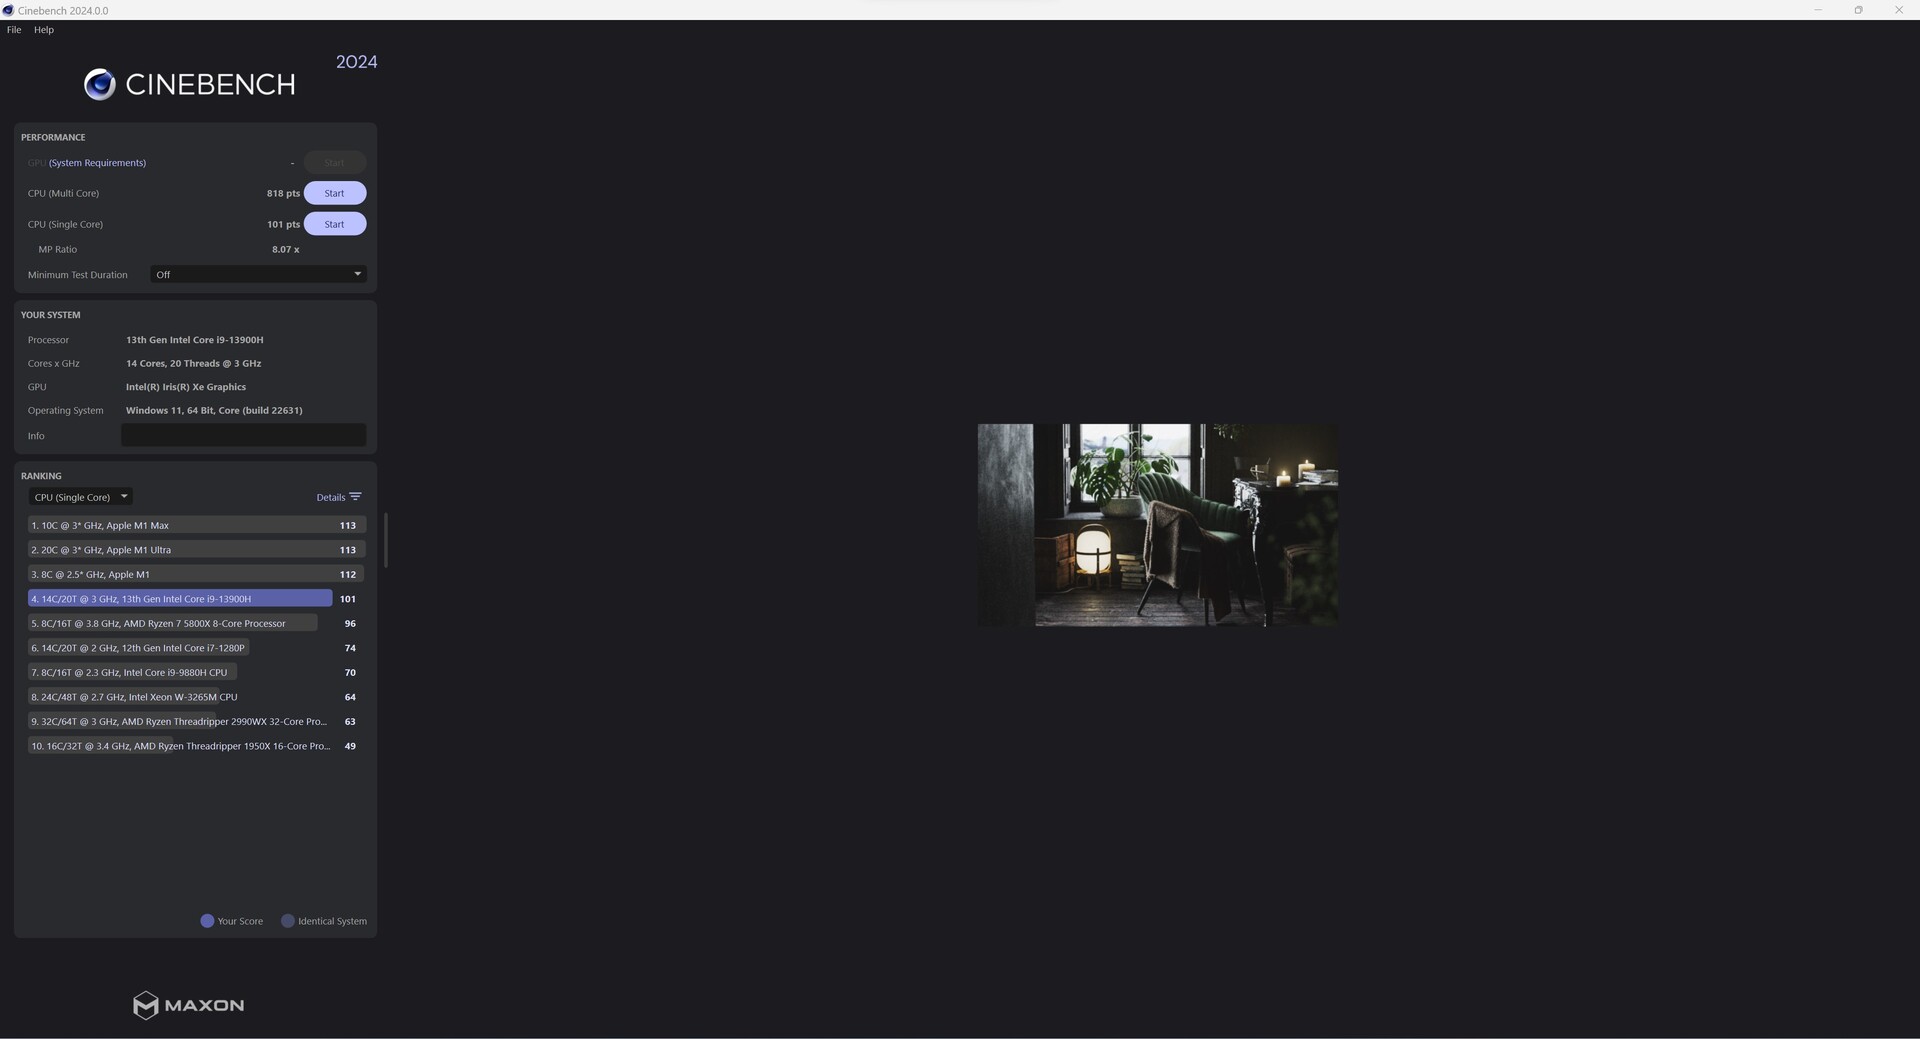
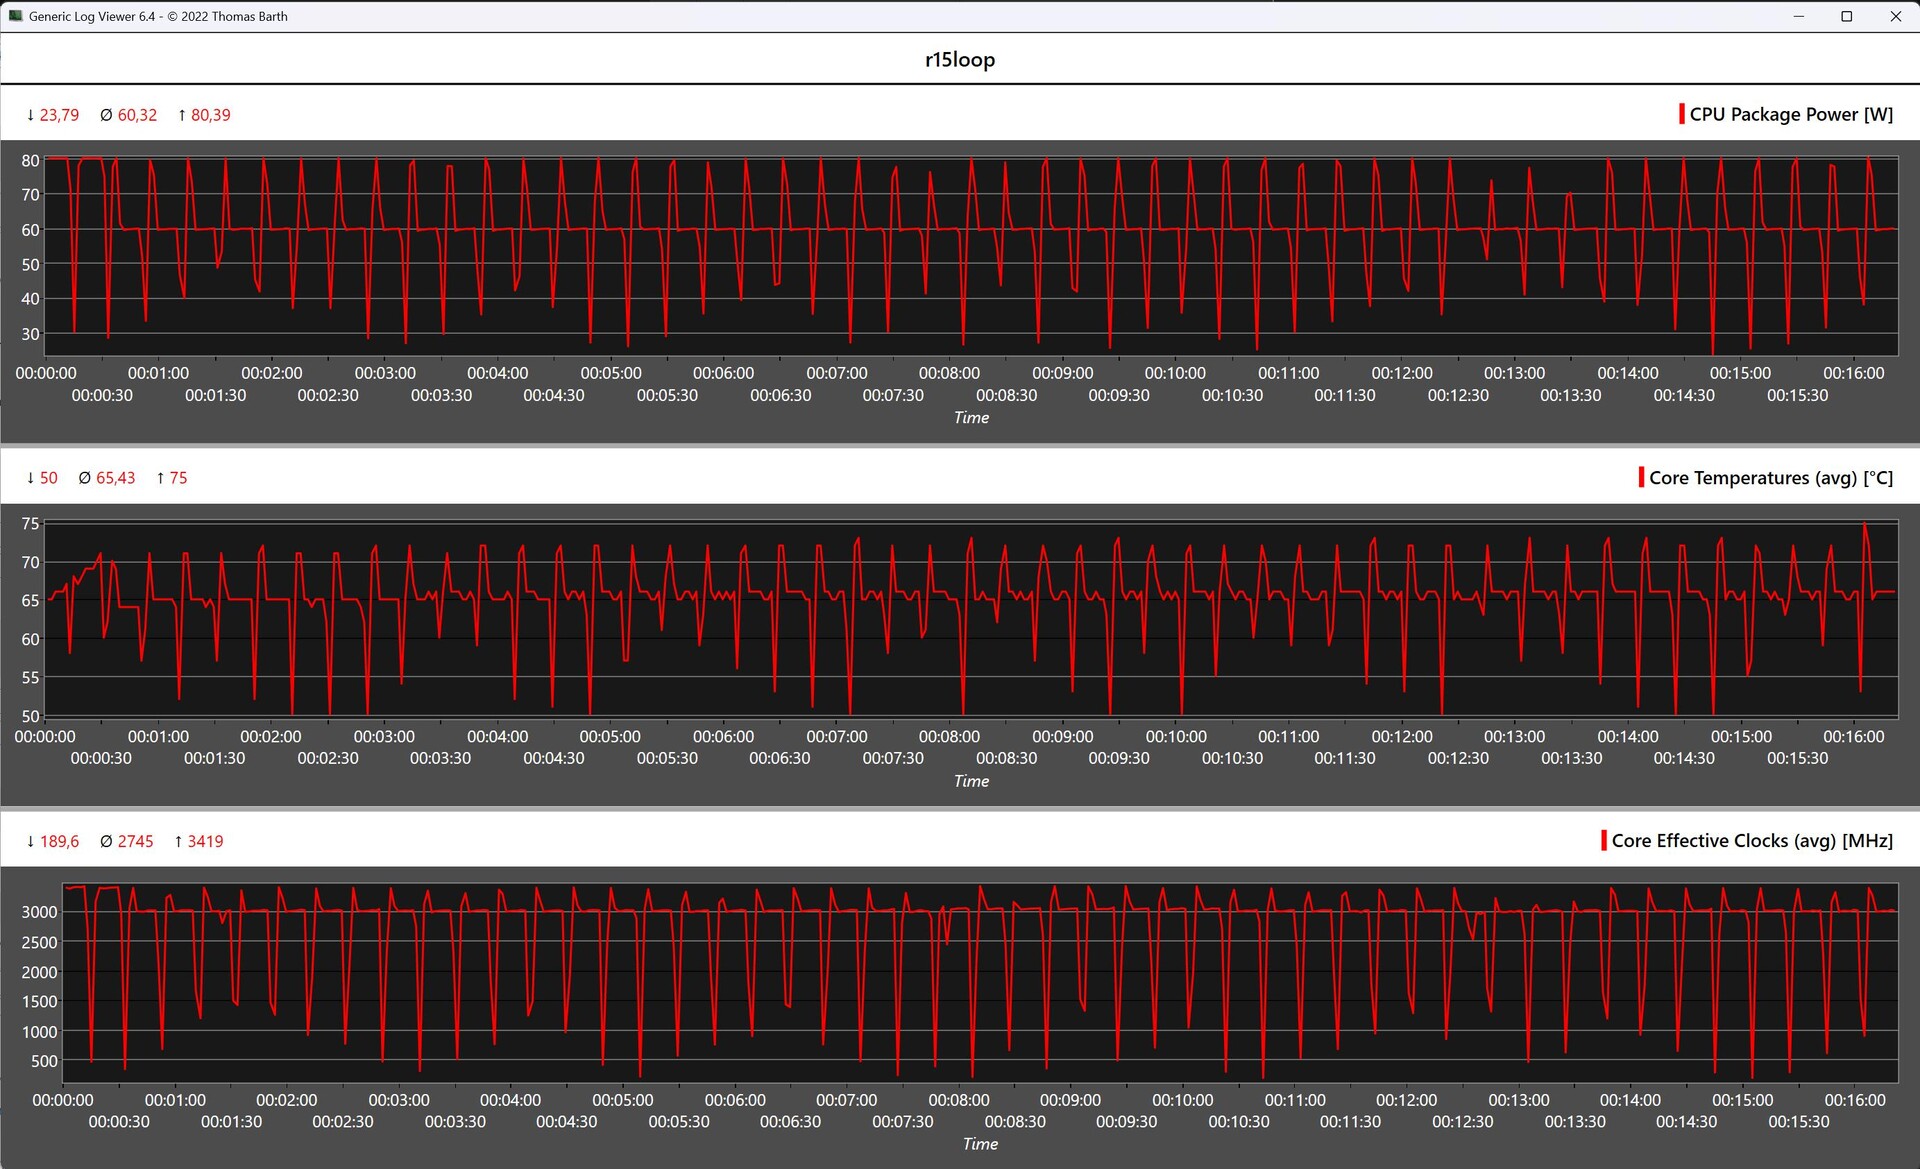
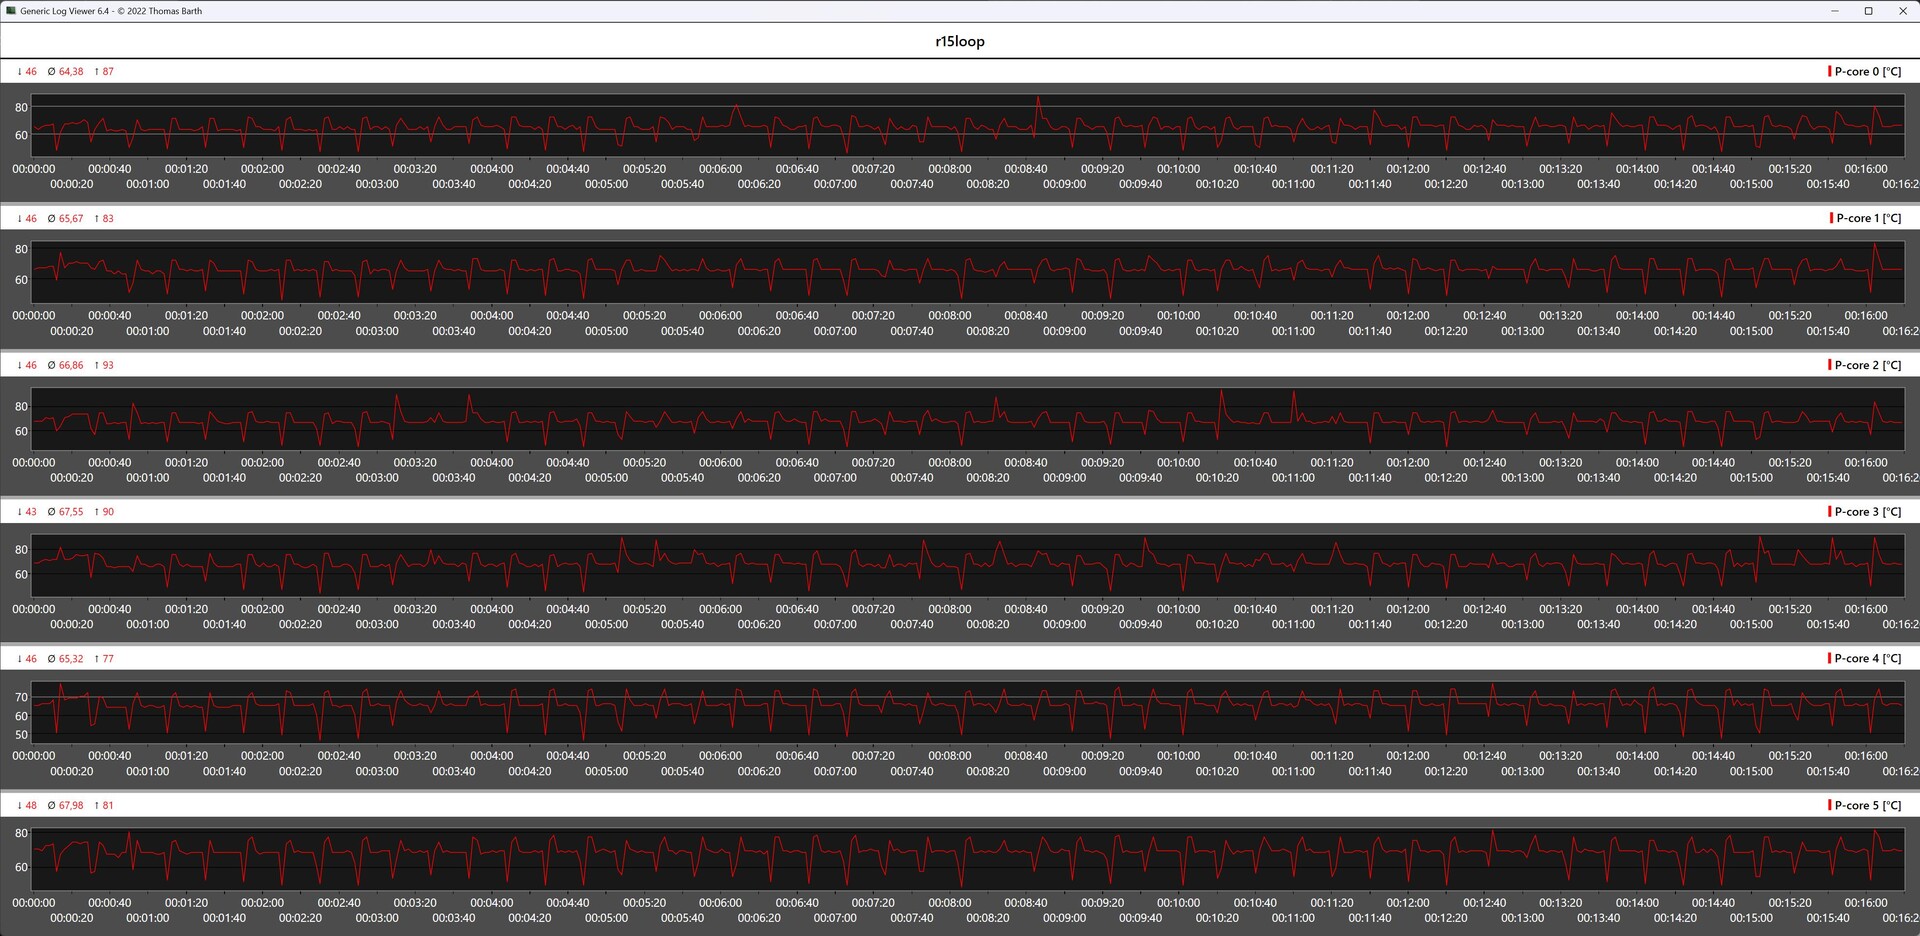
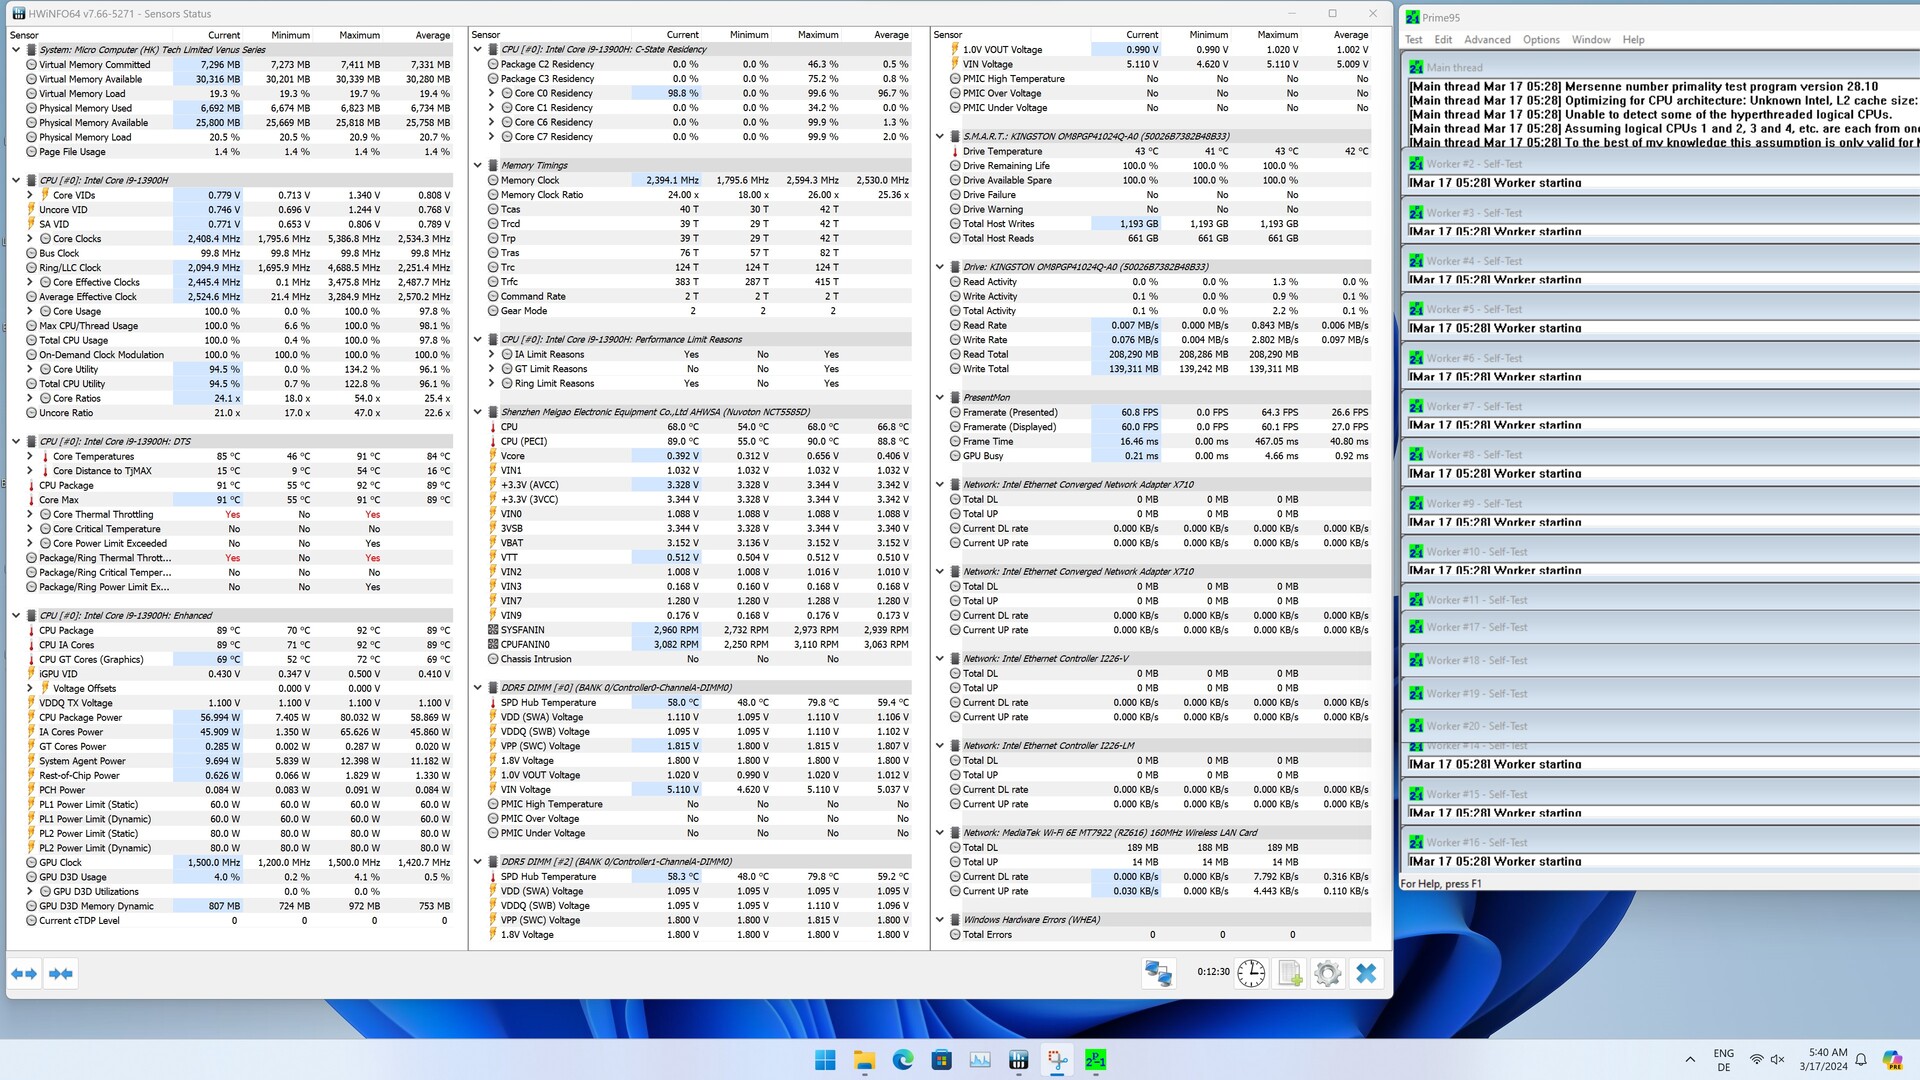
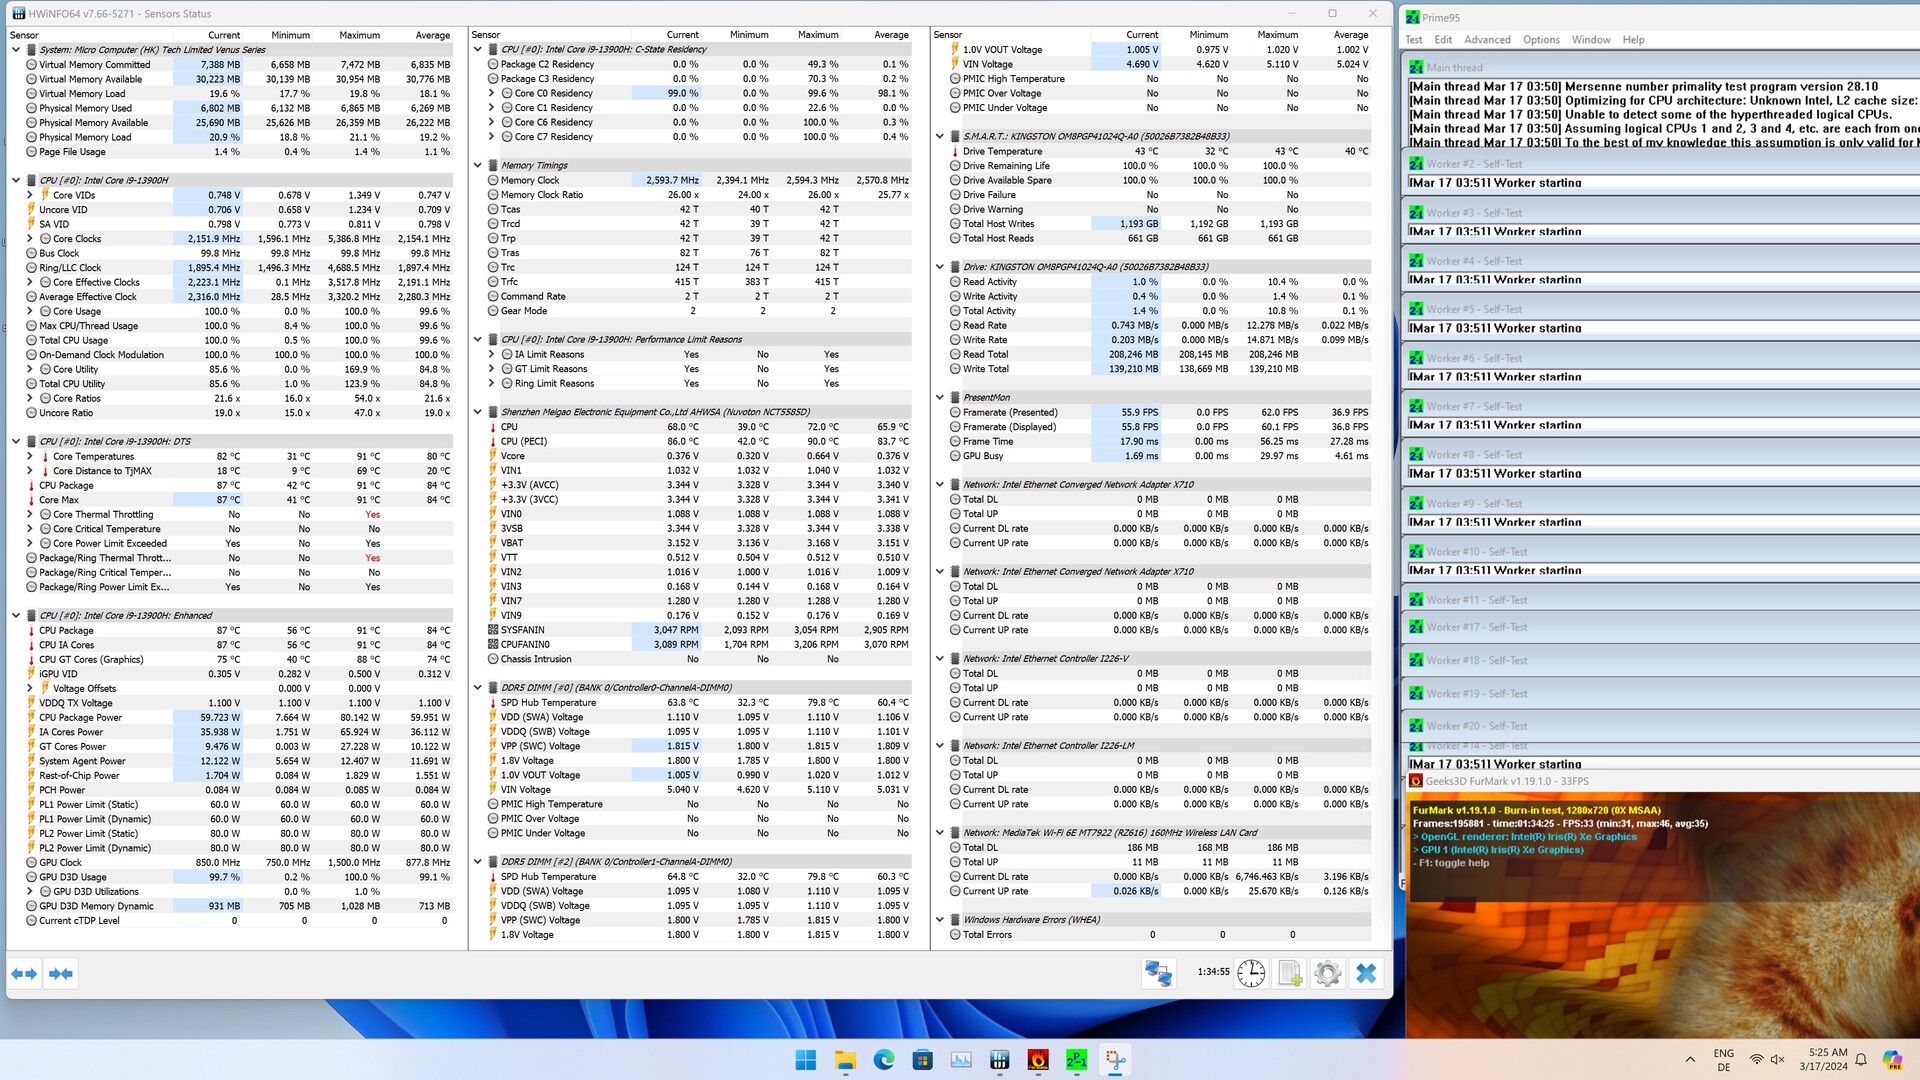
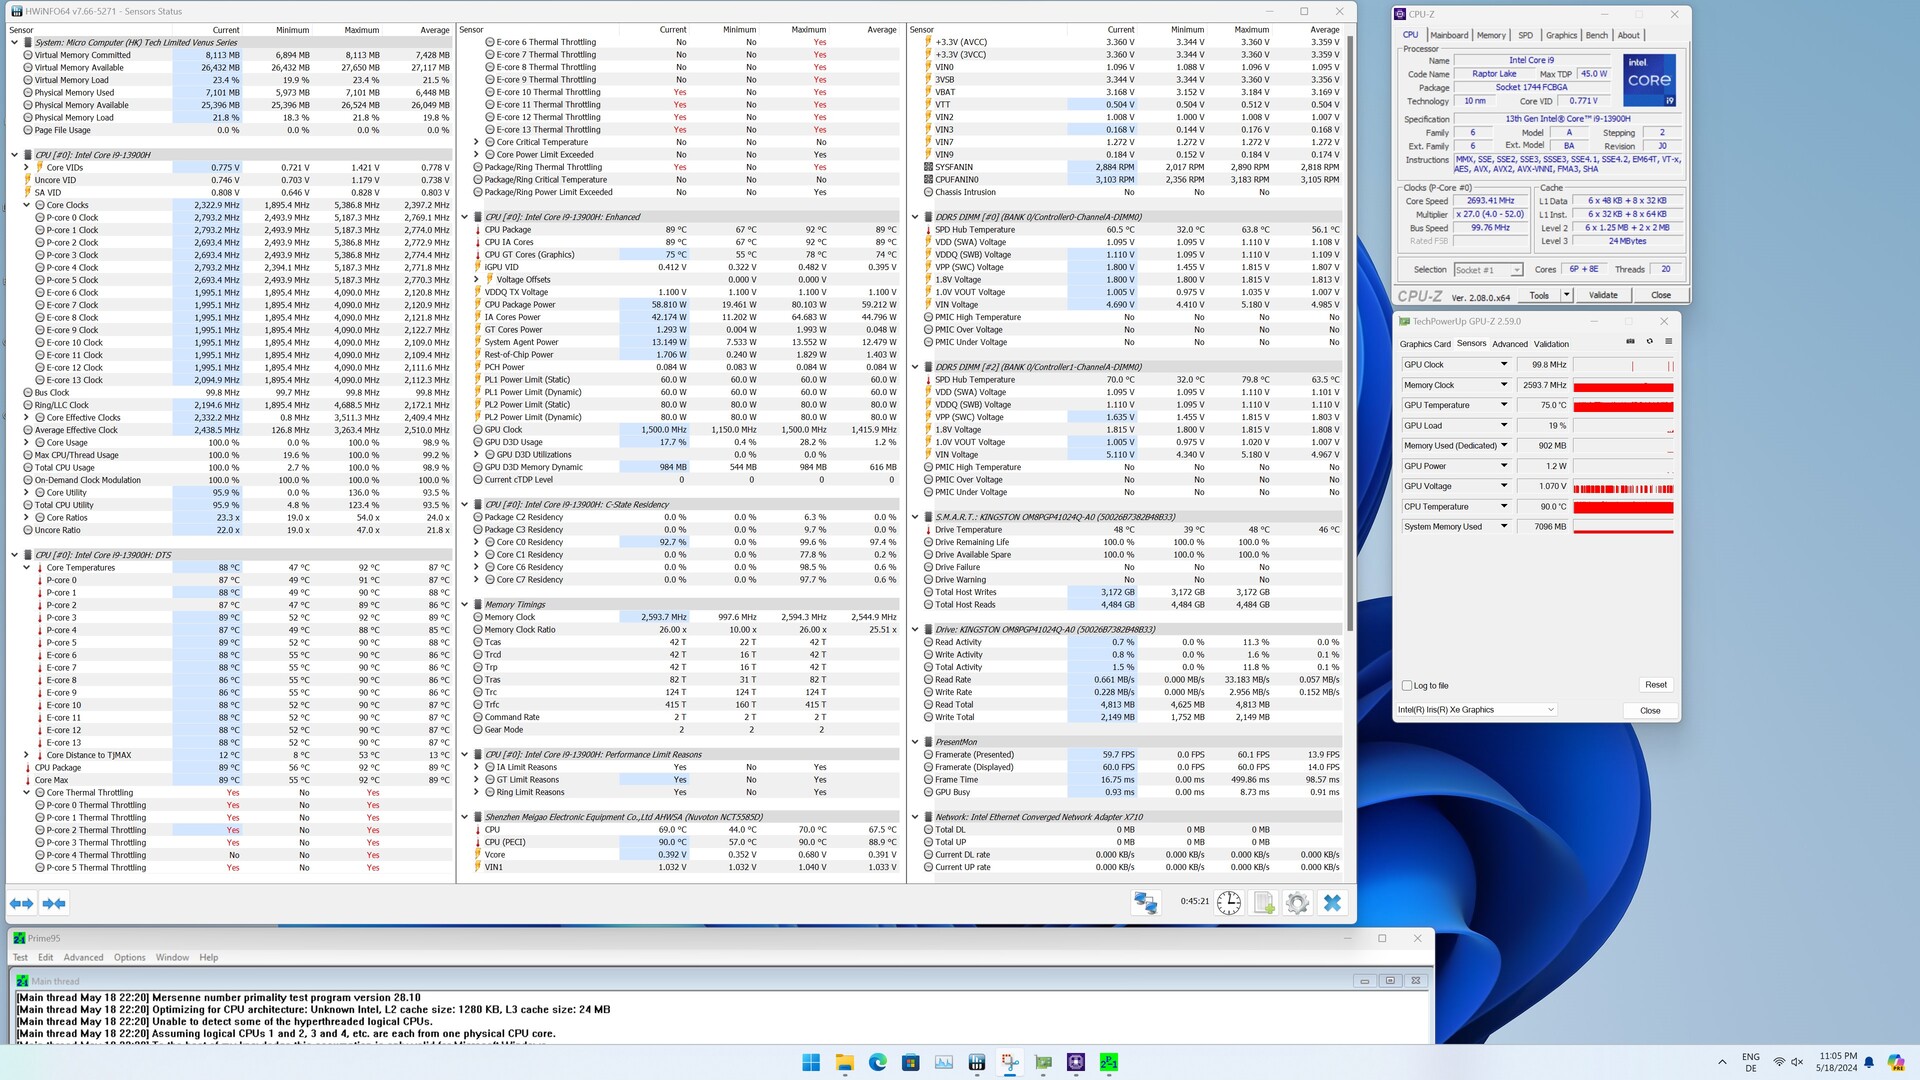
Minisforum MS-01 bei der Cinebench-R15-Multi-Schleife
Die Cinebench-R15-Dauerschleife durchlief unser Testsystem nur mit maximaler CPU-Lüfterdrehzahl. Ein Leistungsverlust kann allerdings nicht abgewendet werden, wie man anhand der einzelnen Ergebnisse sehen kann. Schlussendlich rangiert der Minisforum MS-01 etwa auf dem gleichen Niveau wie der Geekom A7.
In den aufgezeichneten Telemetriedaten ist zu erkennen, dass zwei P-Kerne deutlich wärmer werden und die 90 °C überschreiten. Trotz voller Lüfterdrehzahl kann das SoC nicht mit kühleren Temperaturen betrieben werden, wenngleich die mobilen Prozessoren grundsätzlich mit hohen Temperaturen umgehen können. Immerhin sehen wir auch, dass die Power-Limits von 80 respektive 60 Watt erreicht und eingehalten werden.
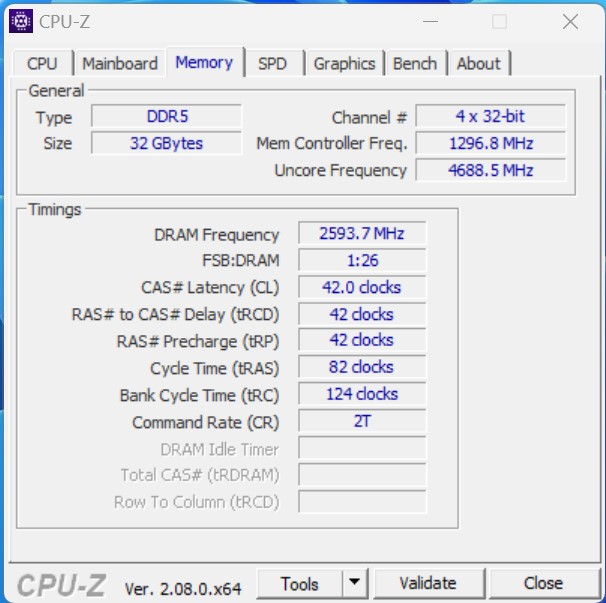
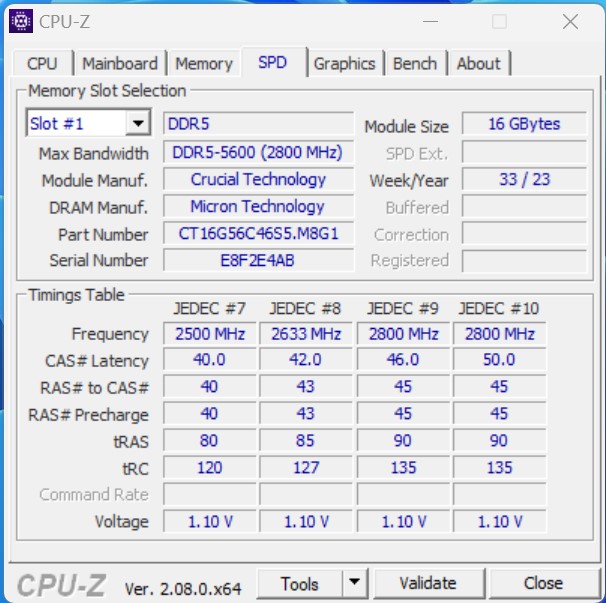
System Performance
Die gesamte Systemleistung ist grundsätzlich gut. Vor allem die Kombination des Intel Core i9-13900H und DDR5-RAM ist sinnvoll und verhilft dem Minisforum MS-01 damit, die Leistung des Prozessors ohne weitere Einschränkungen zu nutzen. Daraus resultiert ebenfalls das hervorragende Ergebnis bei den AIDA64-Benchmarks hinsichtlich der RAM-Performance.
| AIDA64 / Memory Copy | |
| Minisforum MS-01 | |
| Durchschnitt der Klasse Mini PC (15933 - 163031, n=103, der letzten 2 Jahre) | |
| Geekom A7 | |
| Acemagic F2A | |
| Minisforum Venus Series NPB5 | |
| Geekom XT12 Pro | |
| Minisforum Venus Series NAB9 | |
| Maxtang MTN-FP750 | |
| AIDA64 / Memory Read | |
| Minisforum MS-01 | |
| Minisforum Venus Series NPB5 | |
| Durchschnitt der Klasse Mini PC (14143 - 123769, n=103, der letzten 2 Jahre) | |
| Acemagic F2A | |
| Geekom A7 | |
| Geekom XT12 Pro | |
| Minisforum Venus Series NAB9 | |
| Maxtang MTN-FP750 | |
| AIDA64 / Memory Write | |
| Geekom A7 | |
| Durchschnitt der Klasse Mini PC (10630 - 216693, n=103, der letzten 2 Jahre) | |
| Minisforum MS-01 | |
| Acemagic F2A | |
| Minisforum Venus Series NPB5 | |
| Geekom XT12 Pro | |
| Minisforum Venus Series NAB9 | |
| Maxtang MTN-FP750 | |
| AIDA64 / Memory Latency | |
| Acemagic F2A | |
| Durchschnitt der Klasse Mini PC (88.1 - 184.8, n=104, der letzten 2 Jahre) | |
| Minisforum Venus Series NPB5 | |
| Minisforum MS-01 | |
| Geekom A7 | |
| Minisforum Venus Series NAB9 | |
| Maxtang MTN-FP750 | |
| Geekom XT12 Pro | |
* ... kleinere Werte sind besser
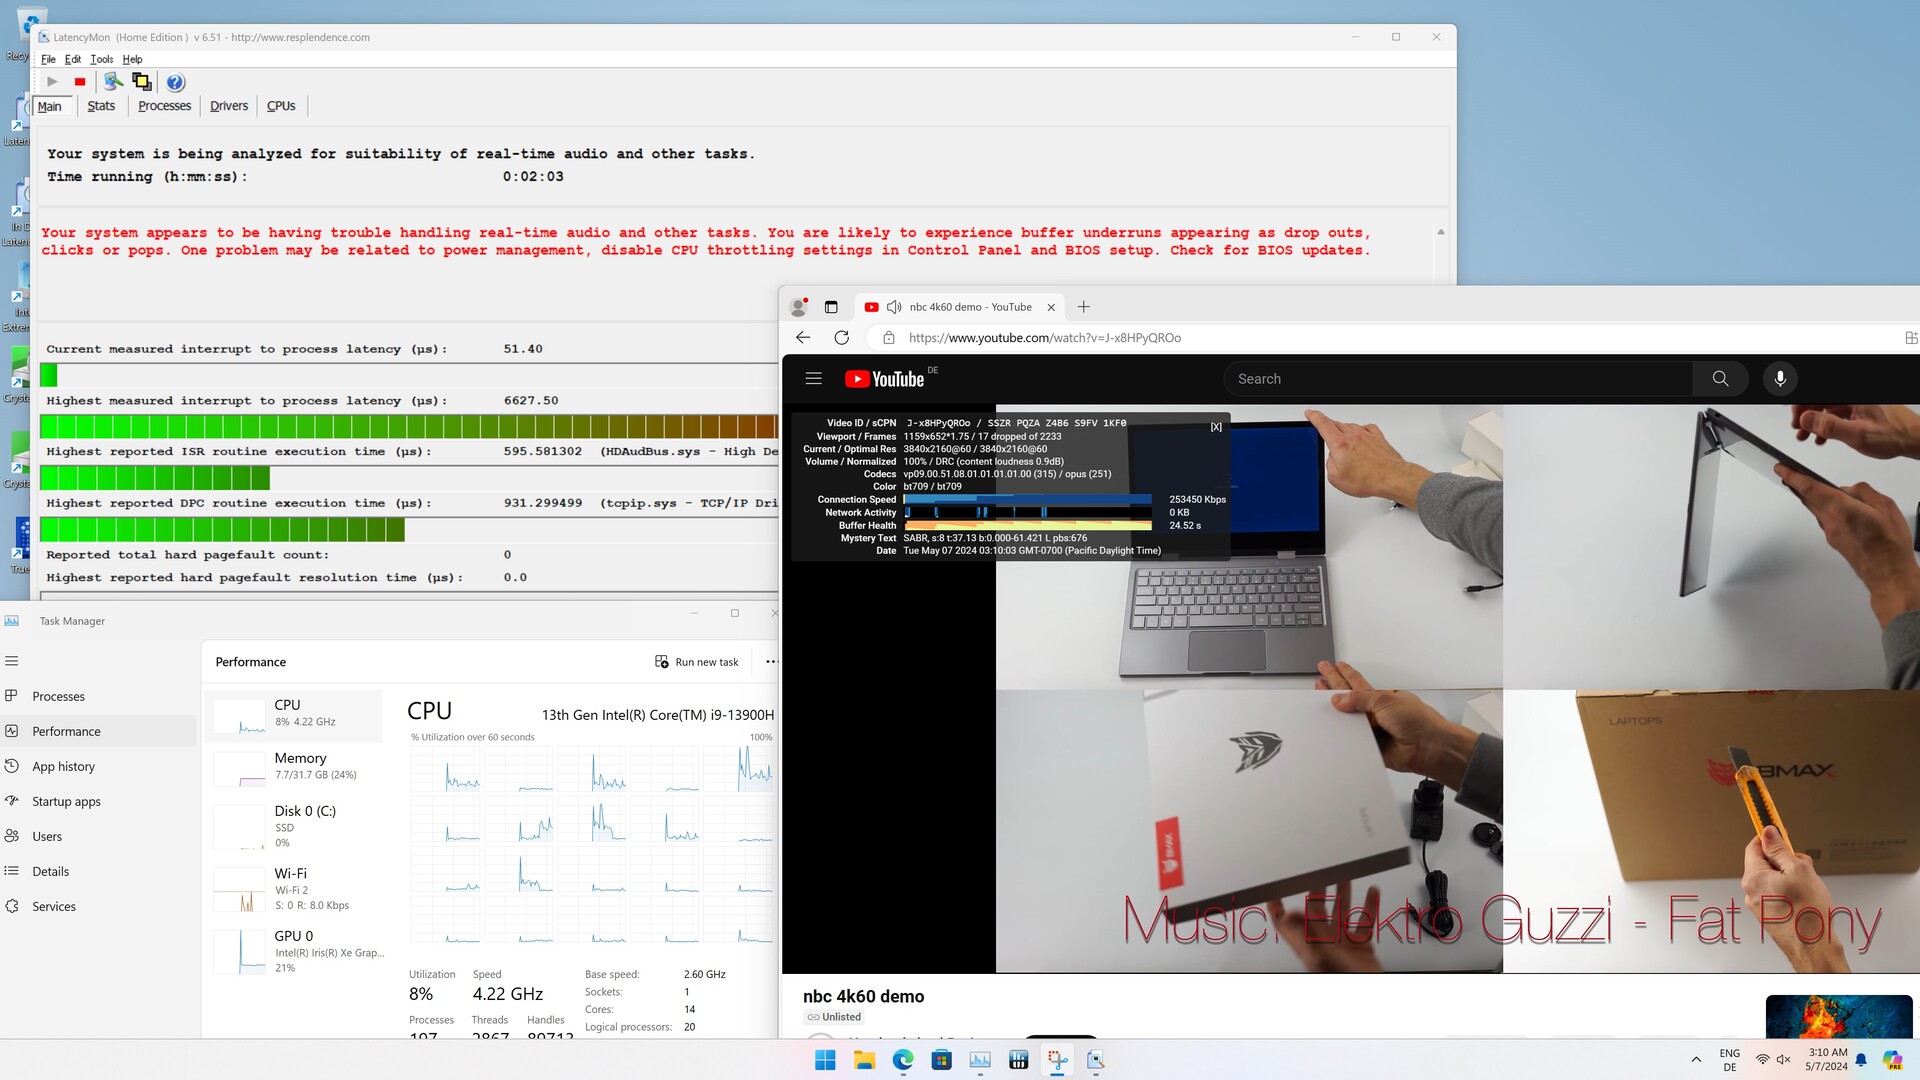
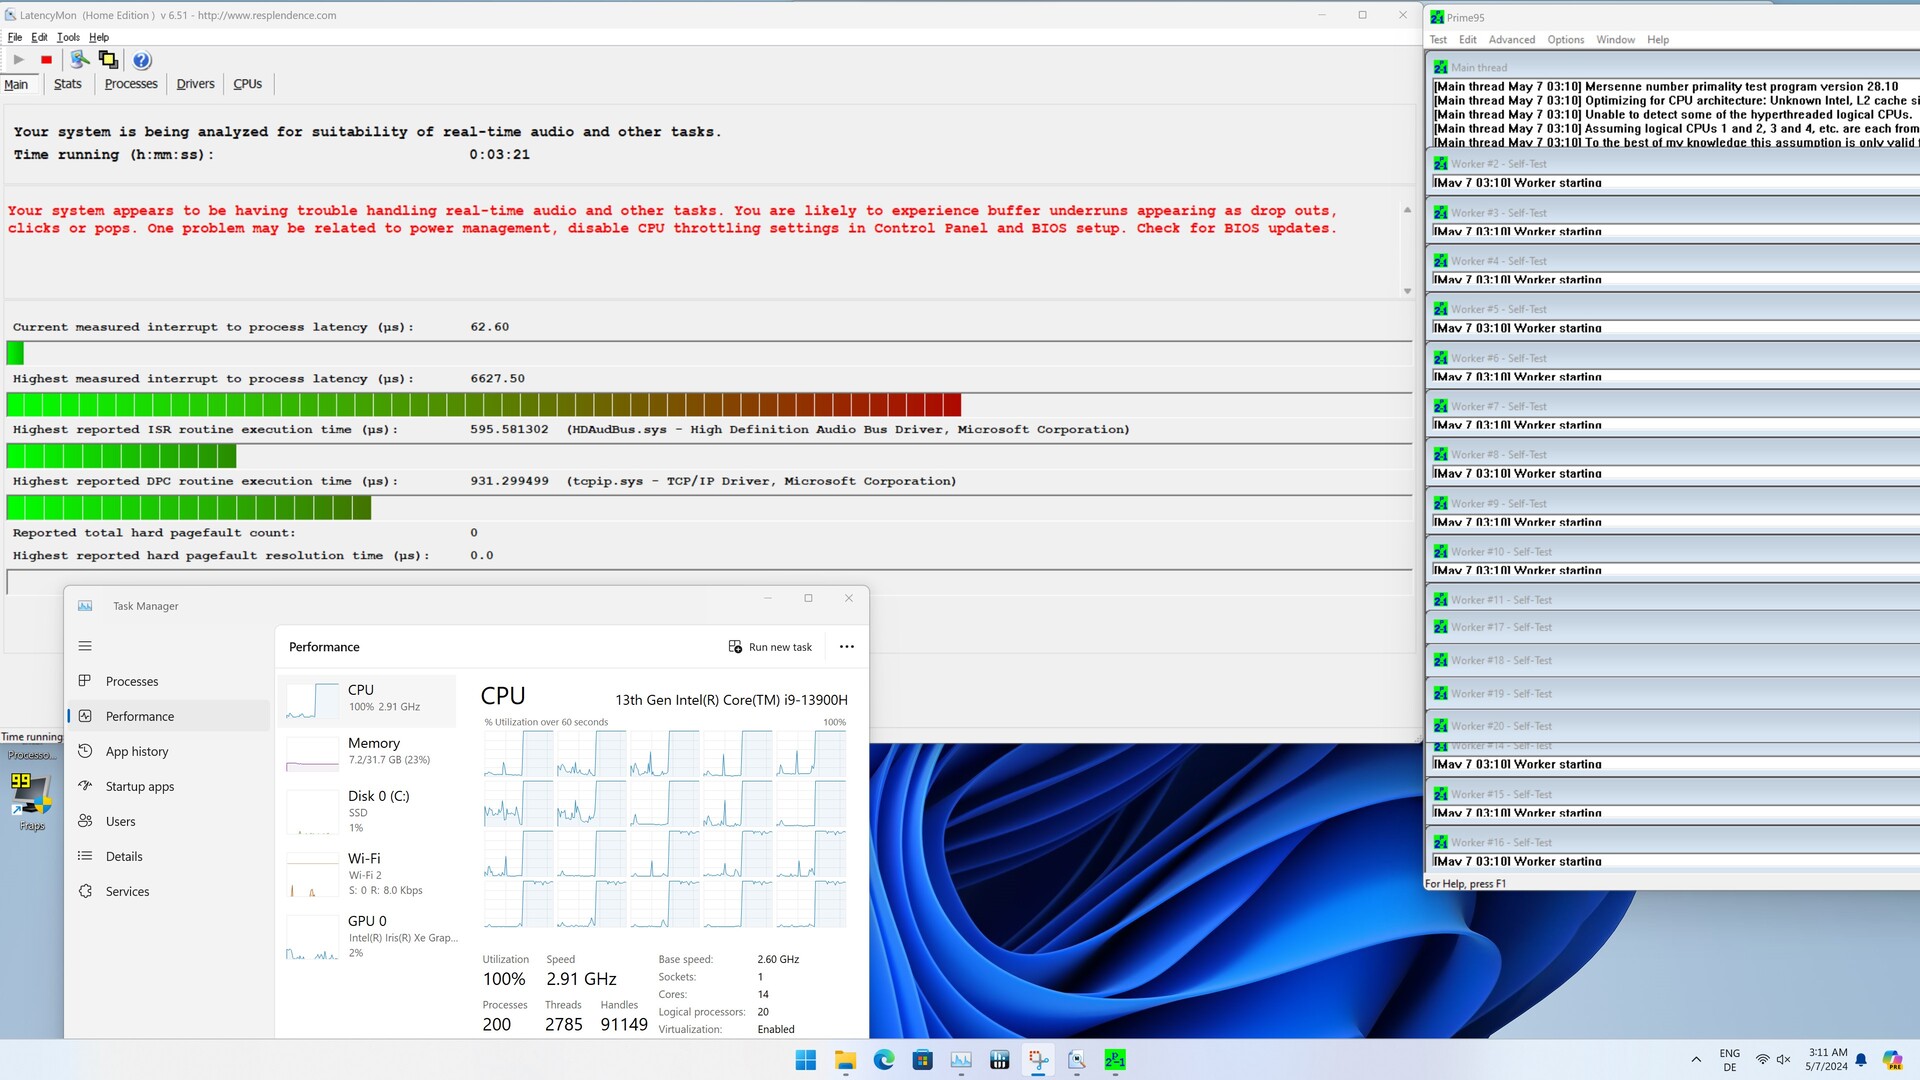
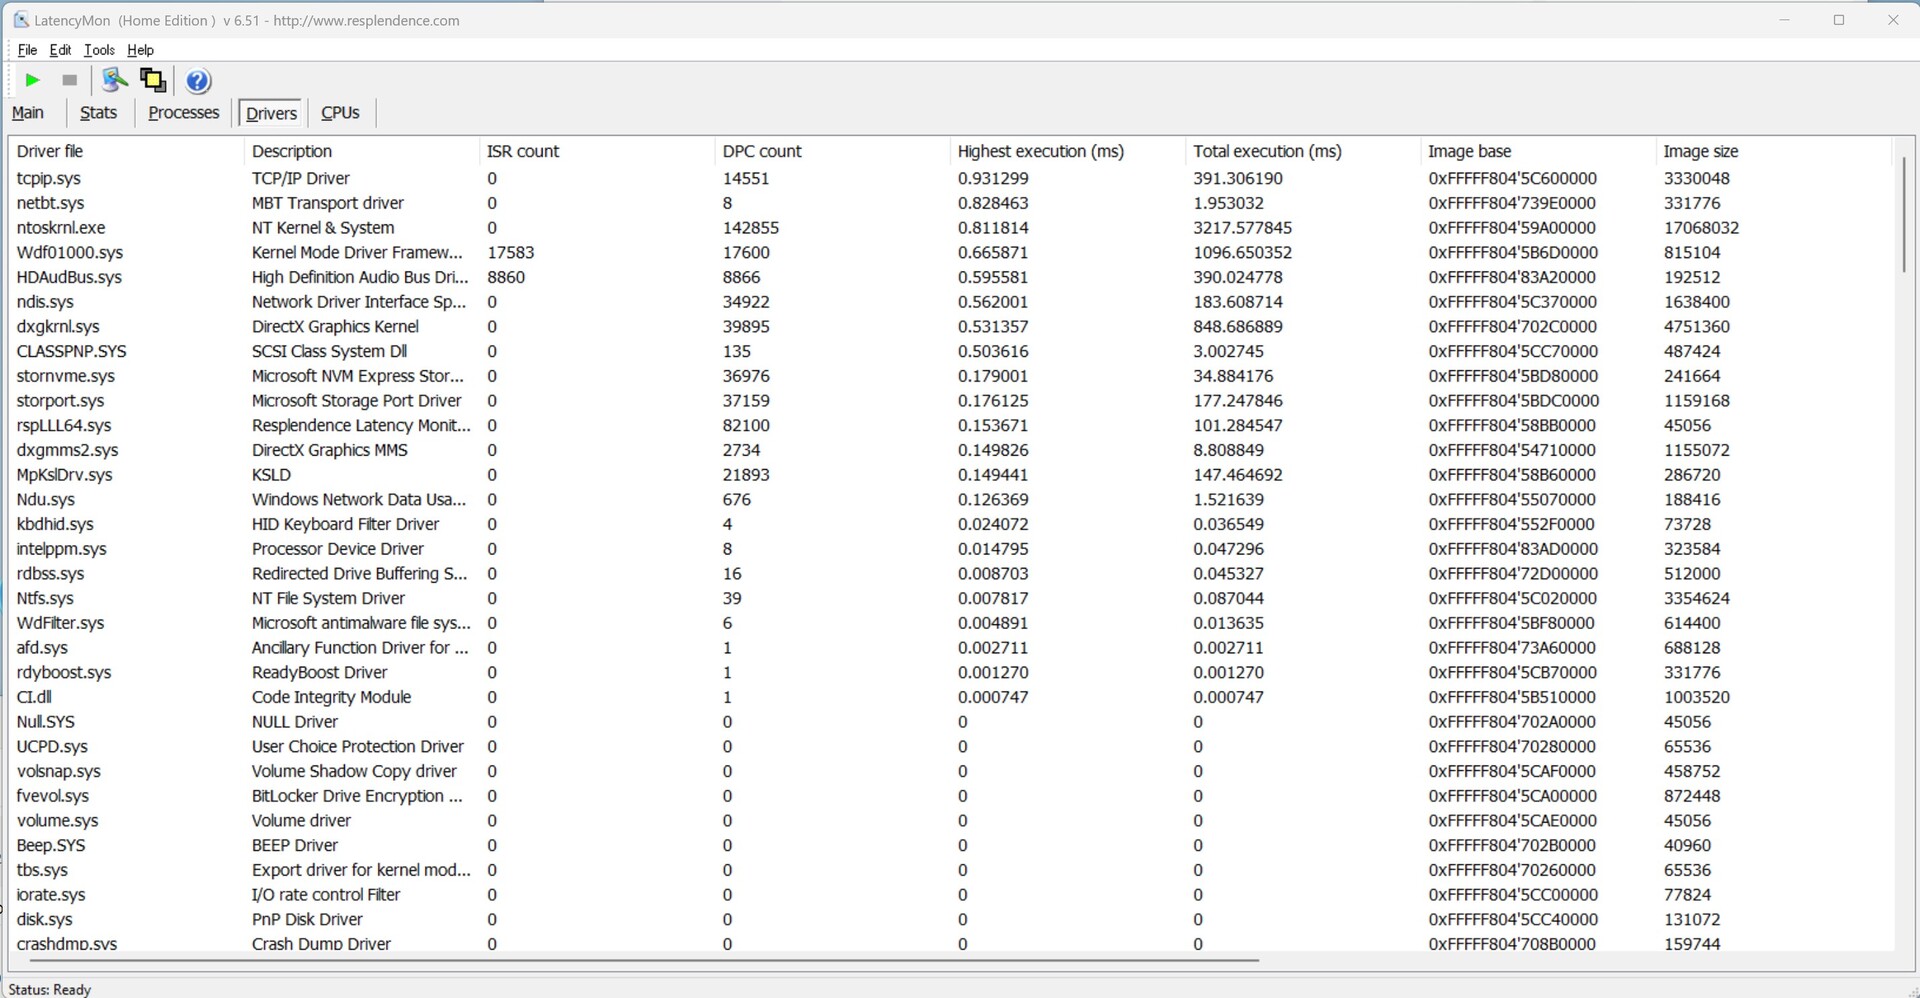
DPC-Latenzen
Schon beim Öffnen mehrerer Tabs im Edge-Browser dokumentieren wir erhöhte Latenzen, welche beim Abspielen des 4K-Testvideos nochmals leicht ansteigen. Ein kurzzeitiger Lasttest mit Prime95 führt hier zu keinem weiteren Anstieg. Im Vergleich steht unser Testsample dennoch gut dar und sichert sich den zweiten Platz.
| DPC Latencies / LatencyMon - interrupt to process latency (max), Web, Youtube, Prime95 | |
| Acemagic F2A | |
| Geekom XT12 Pro | |
| Geekom A7 | |
| Maxtang MTN-FP750 | |
| Minisforum Venus Series NAB9 | |
| Minisforum MS-01 | |
| Minisforum Venus Series NPB5 | |
* ... kleinere Werte sind besser
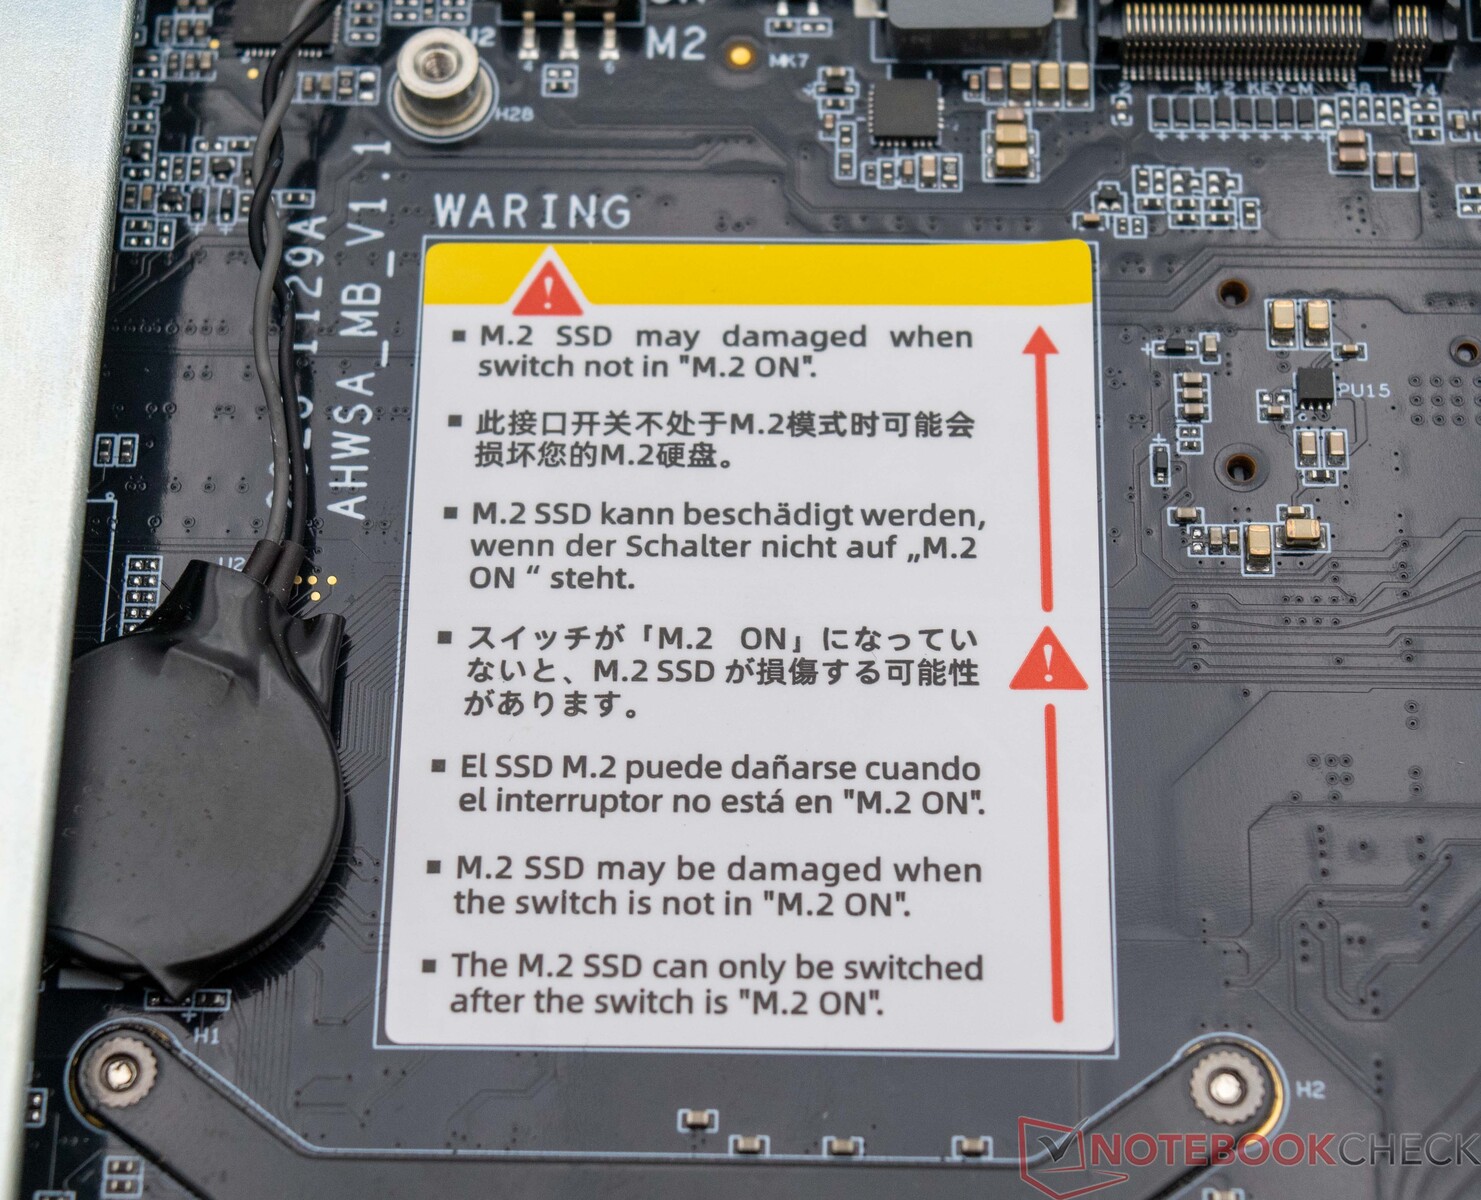
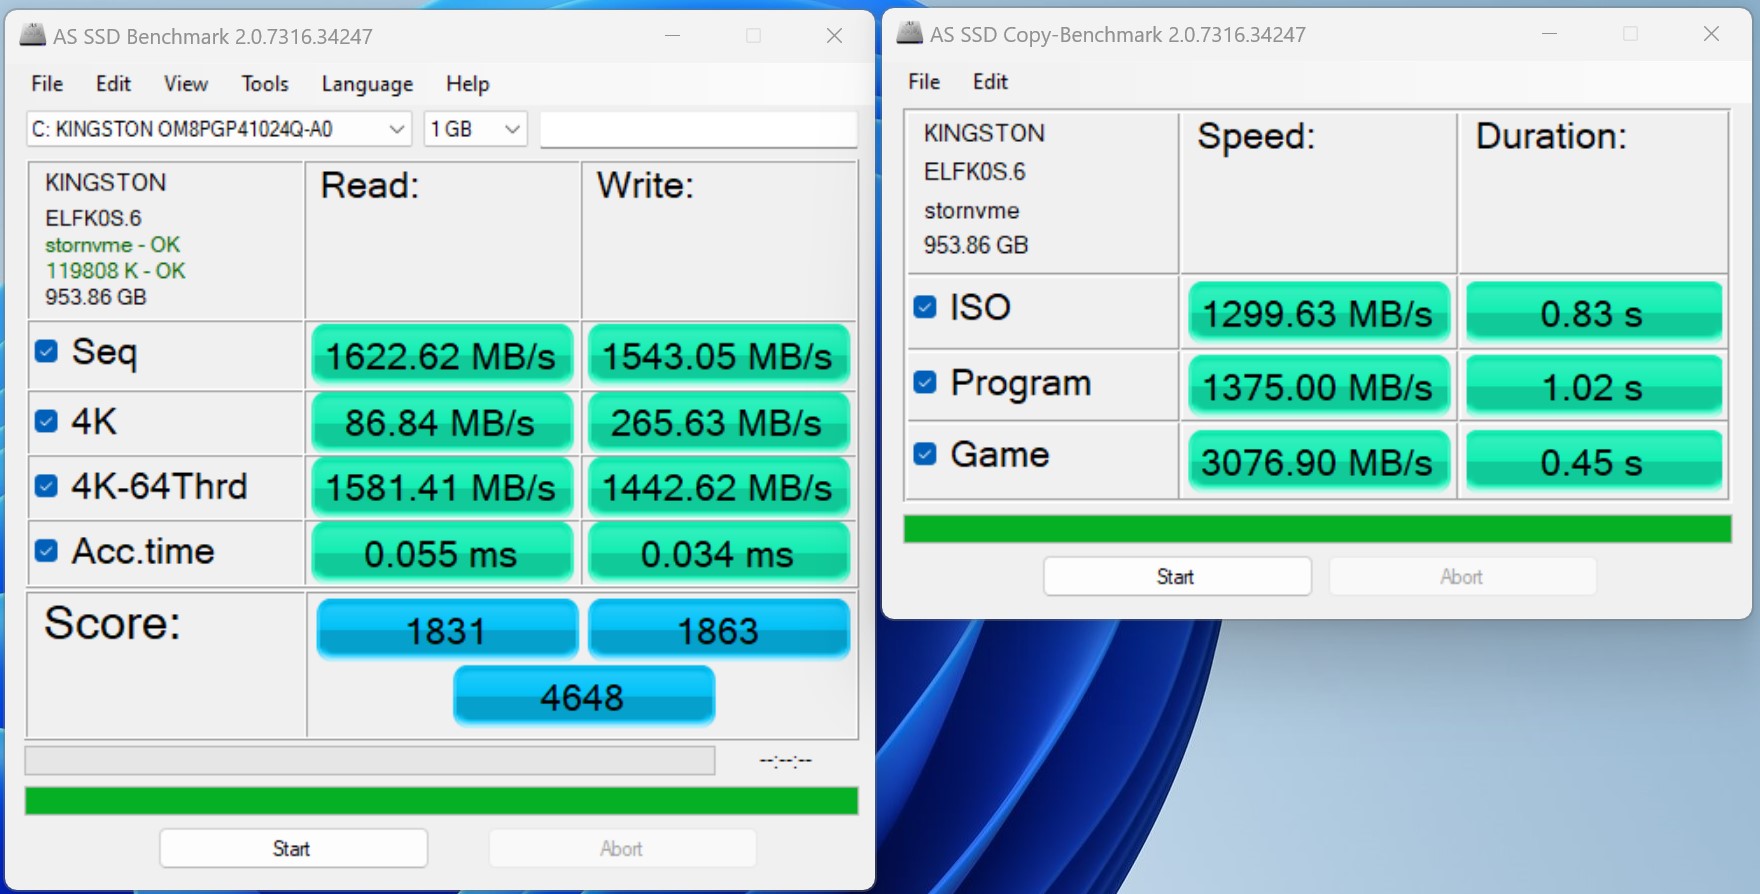
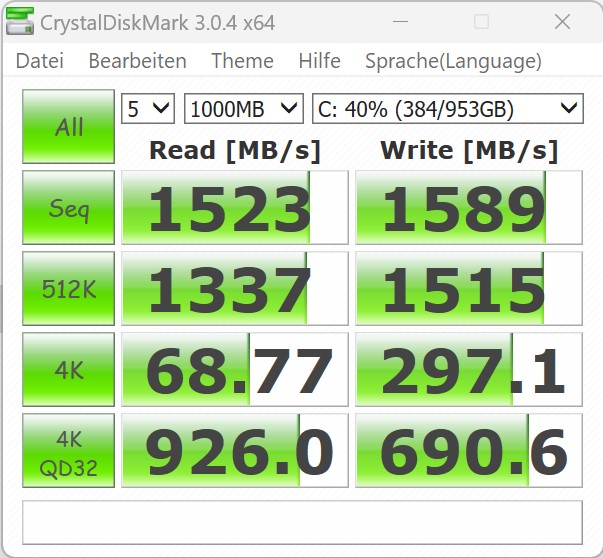
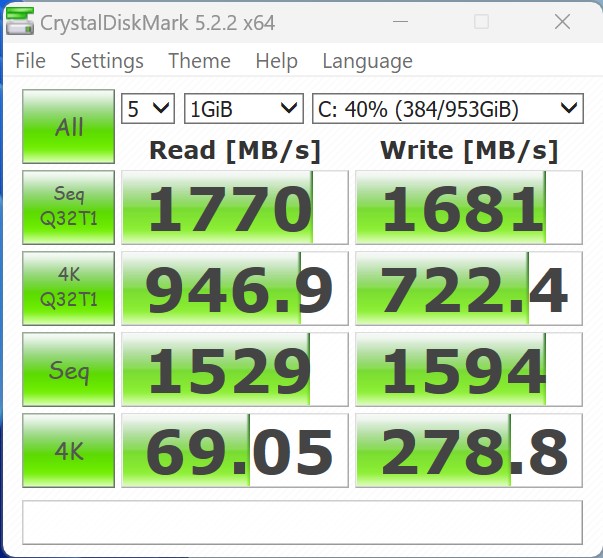
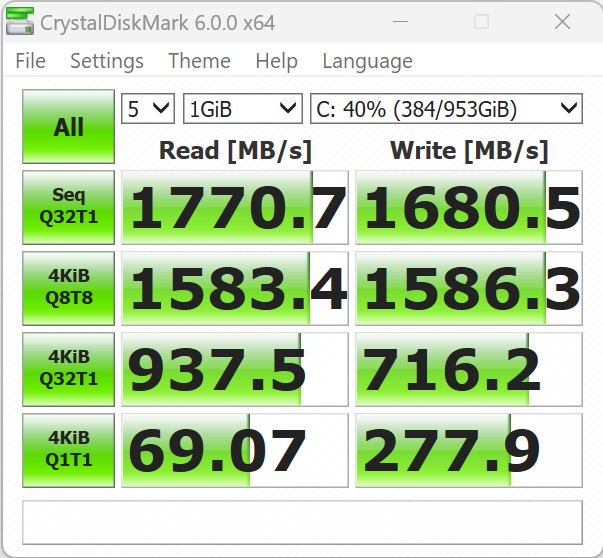
Massenspeicher
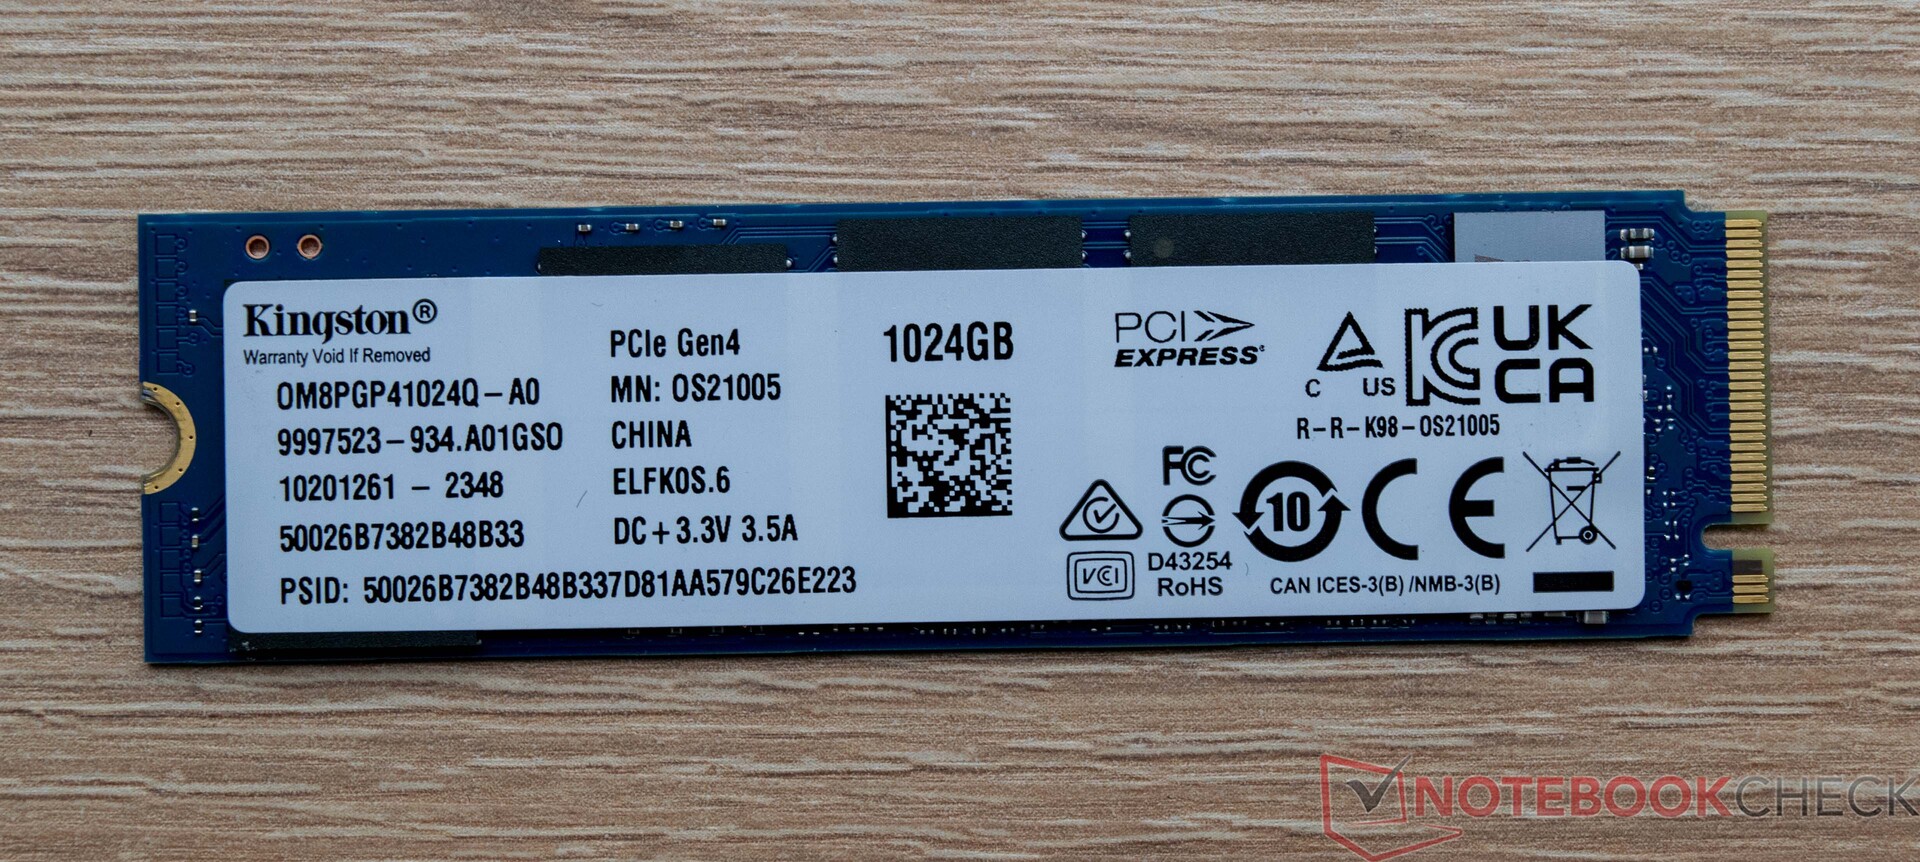
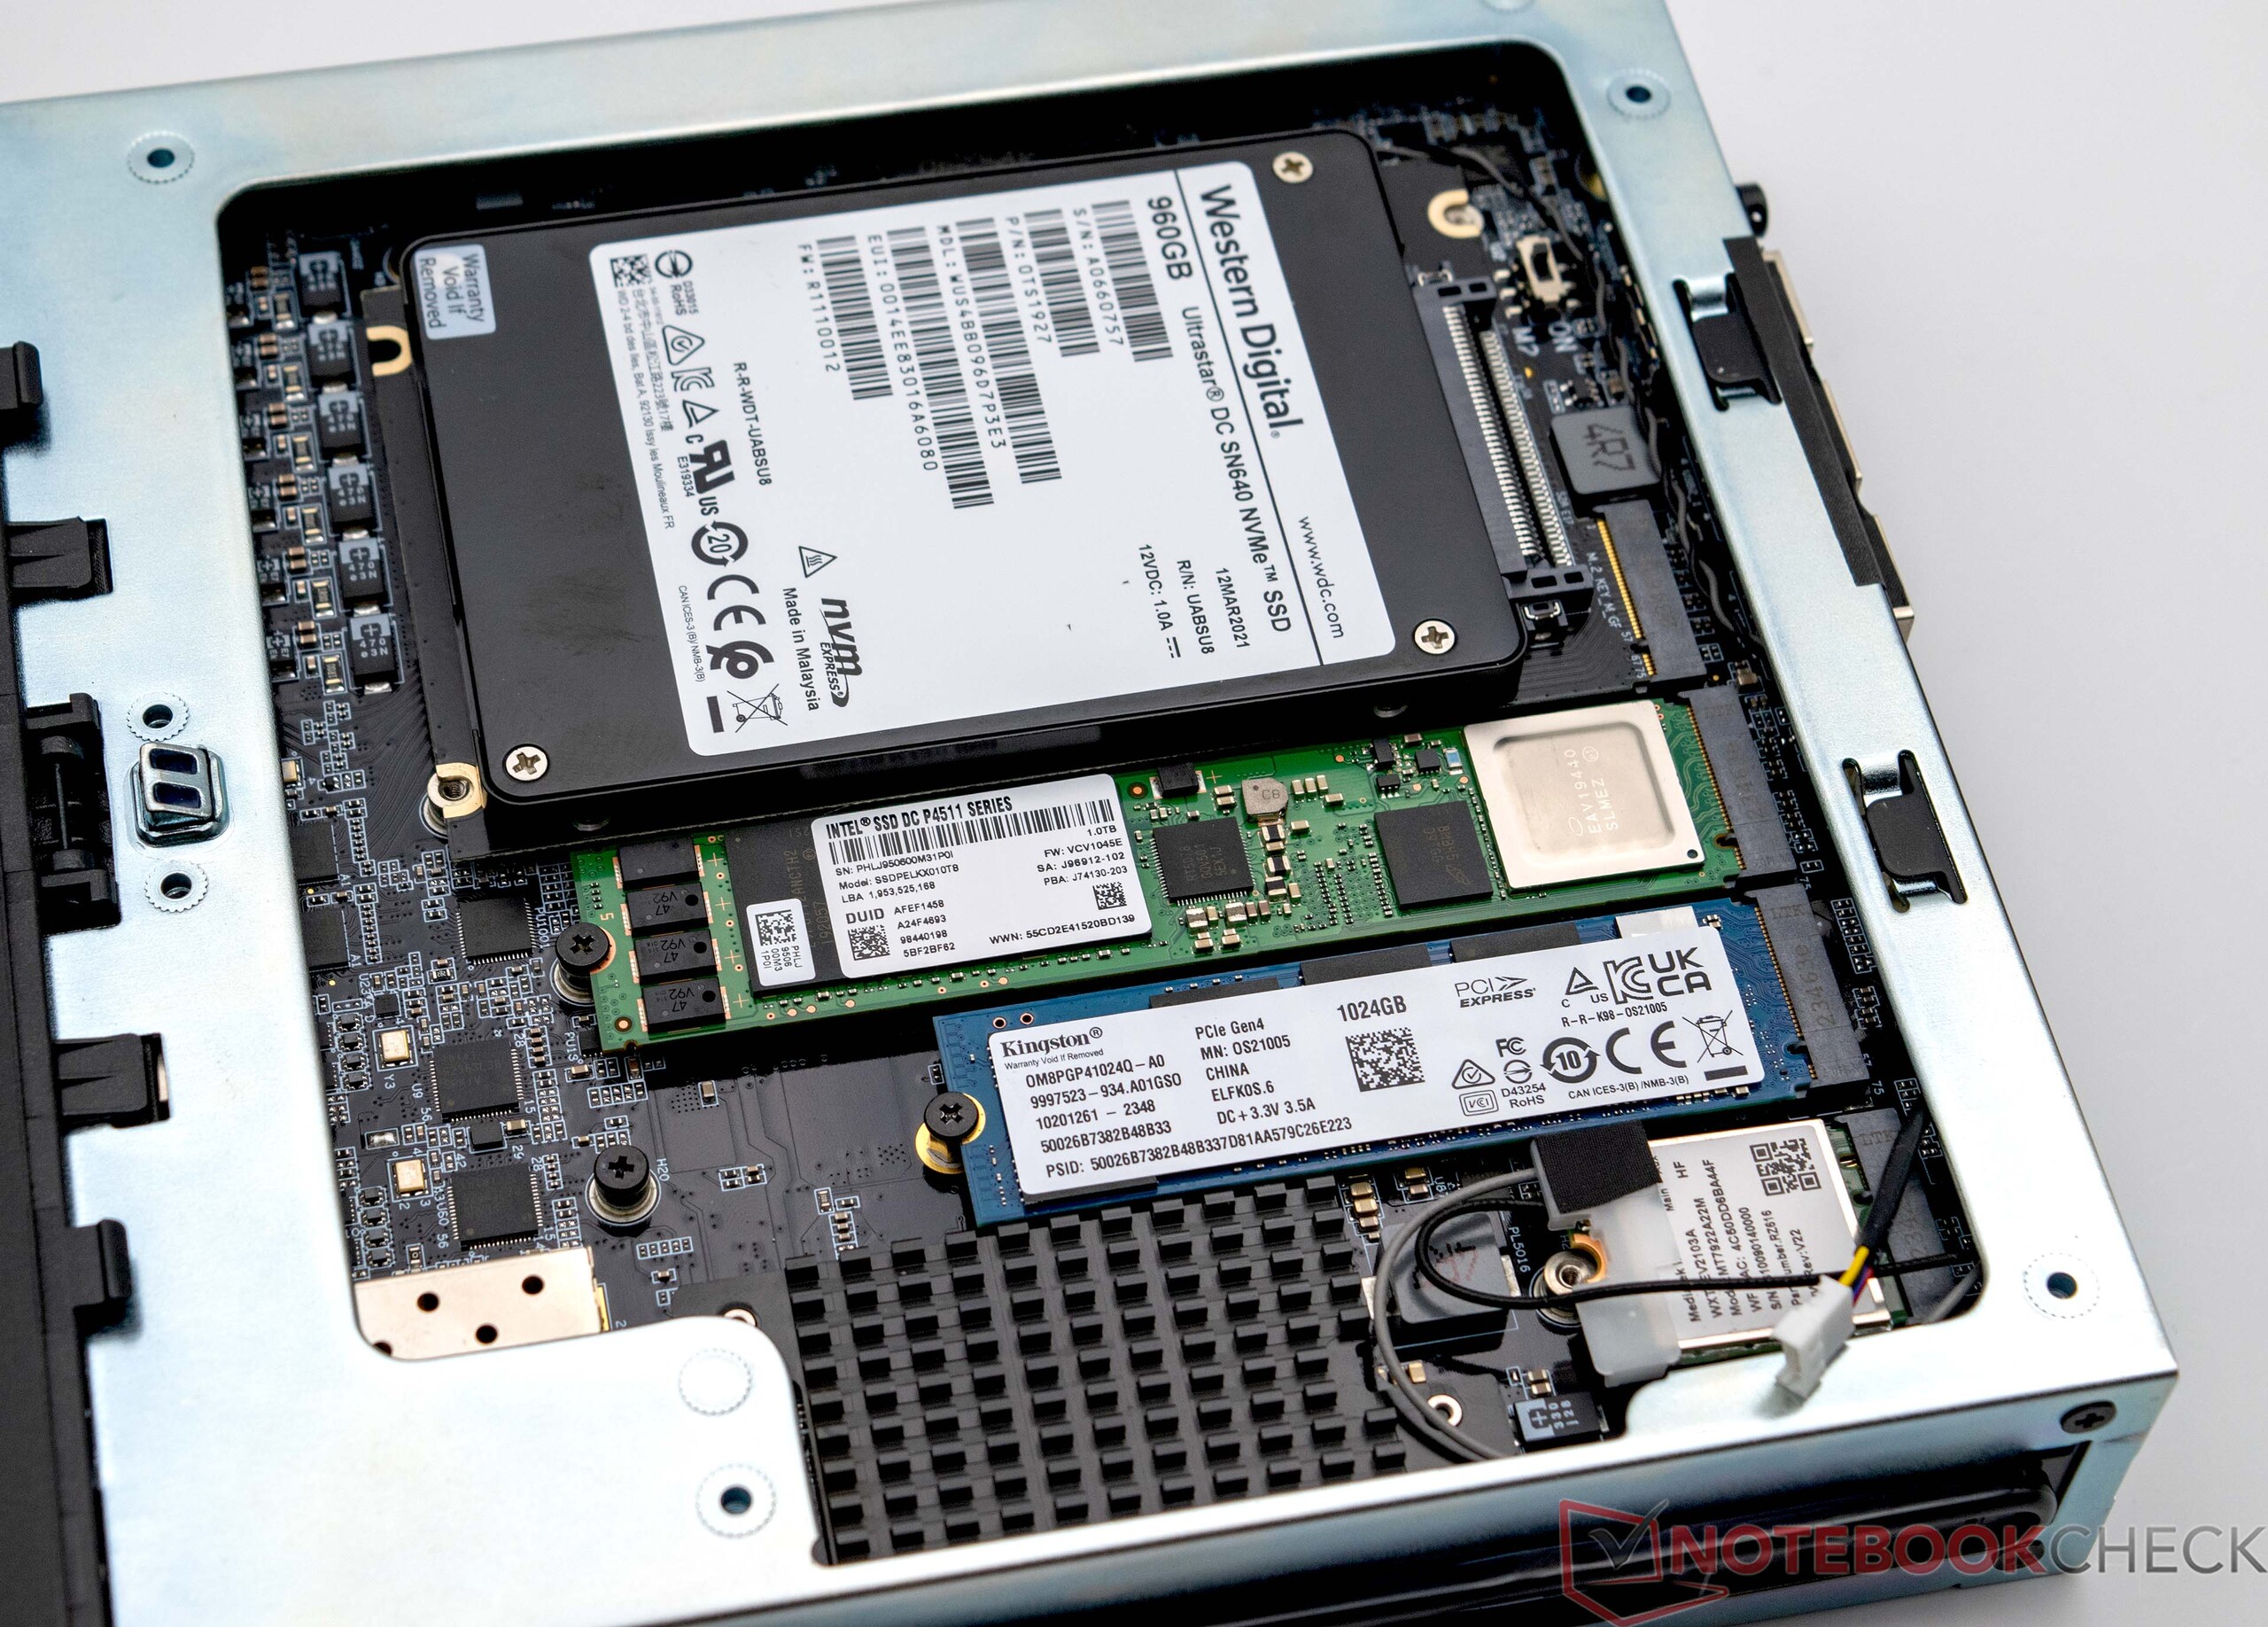
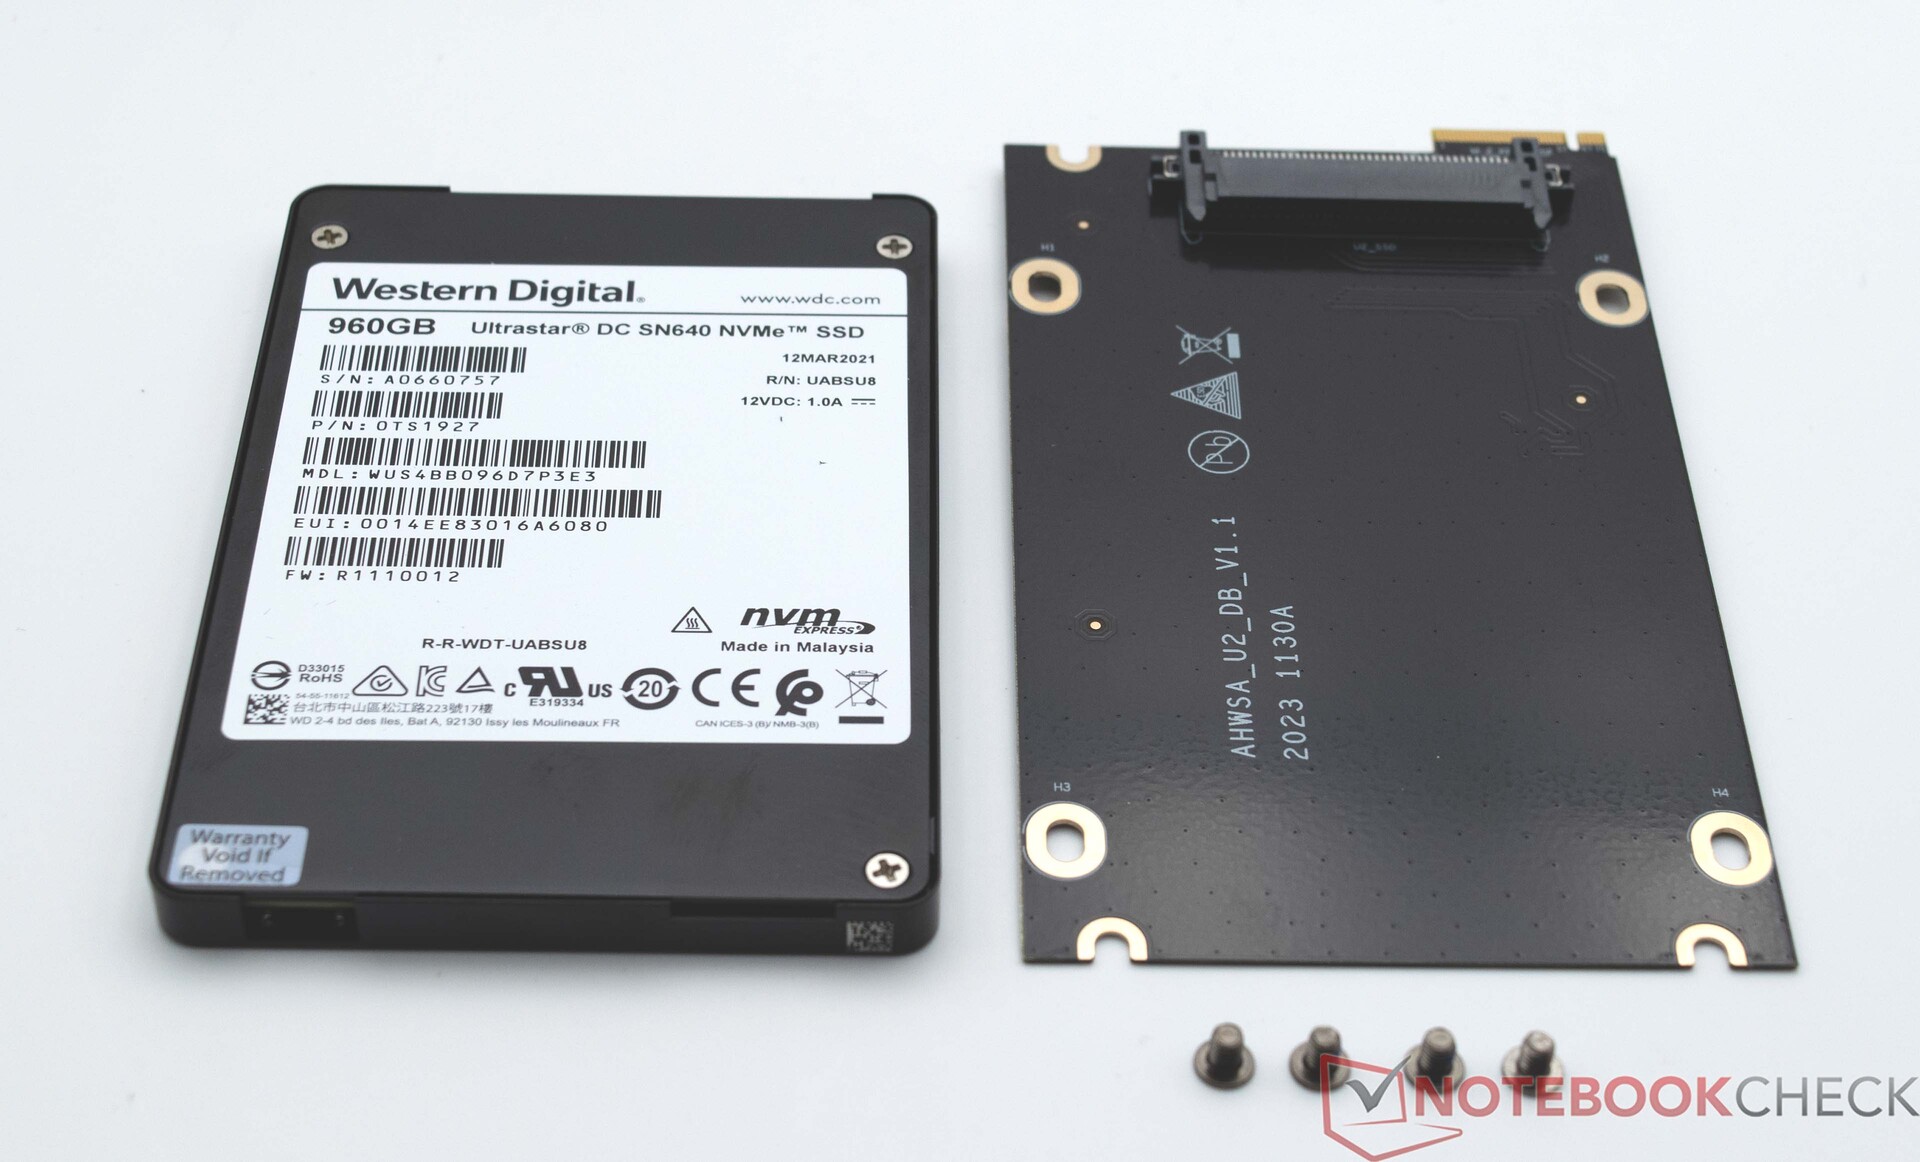
Im Minisforum MS-01 lassen sich eine Vielzahl an unterschiedlichen SSDs installieren. Wichtig zu wissen ist jedoch, dass es sich um NVMe-SSDs handeln muss. Auch beim Formfaktor punktet der MS-01, denn neben der Standardlänge von 80 Millimetern können auch 110-Millimeter-SSDs eingebaut werden. Kürzere SSDs können jedoch nicht installiert, genauer gesagt befestigt werden. Das Betriebssystem befindet sich auf einer 1-TB-SSD von Kingston. Die Anbindung der SSD entspricht nicht dem, was technisch möglich wäre. Darunter leiden die ermittelten Transferraten, was aber im Alltag kaum ins Gewicht fällt.
Bei unseren Messergebnissen hinsichtlich der Dauerleistung beim Lesen zeigt sich, dass die verbaute Kühleinheit keine optimale Kühlung gewährleisten kann. Immer wieder gibt es deutliche Leistungseinbrüche, welche jedoch nur von kurzer Dauer sind. Wenn man es auf die Spitze treiben möchte und keine dedizierte Grafikkarte im System einbauen will, kann der Minisforum MS-01 sogar mit insgesamt vier Massenspeichern ausgestattet werden. Wir haben den Test gemacht und eine Intel SSD DC P4618 PCIe 3.1 x8 im System verbaut.
Für weitere Vergleiche und Benchmarks verweisen wir auf unsere Vergleichstabelle.


| Drive Performance Rating - Percent | |
| Minisforum Venus Series NAB9 | |
| Minisforum Venus Series NPB5 | |
| Minisforum MS-01 | |
| Geekom XT12 Pro | |
| Geekom A7 | |
| Durchschnitt der Klasse Mini PC | |
| Acemagic F2A | |
| Maxtang MTN-FP750 | |
* ... kleinere Werte sind besser
Dauerleistung Lesen: DiskSpd Read Loop, Queue Depth 8
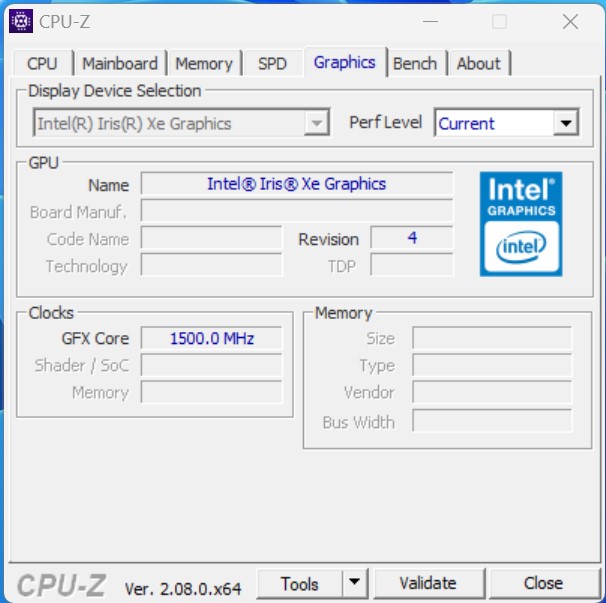
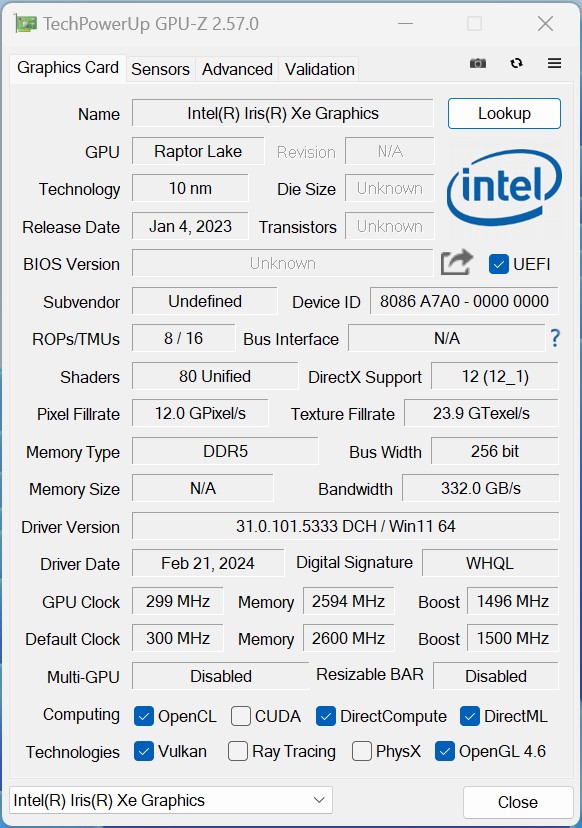
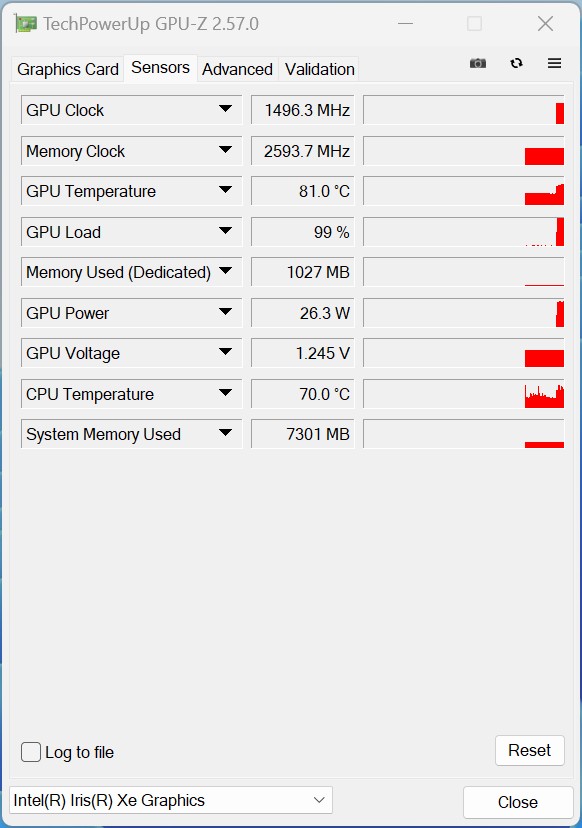
Grafikkarte
Die weitverbreitete Intel Iris Xe Graphics G7 übernimmt die 3D-Berechnungen und die Bildausgabe beim Minisforum MS-01. Gegenüber den neueren Modellen aka Intel Arc8 hat das betagte Modell in unserem Testsample über weite Strecken das Nachsehen. Stellenweise kann die Intel Iris Xe Graphics G7 aber doch relativ gut mit dem vermeintlich schnelleren Modell im Acemagic F2A mithalten und es sogar übertreffen.
Betrachten wir an dieser Stelle noch einmal den Einsatz als Workstation, so kann man sich die Frage stellen, warum der Hersteller nicht direkt eine dedizierte Grafikkarte hernimmt. Um die Leistung im Vergleich zu einer Nvidia GeForce RTX A2000 Laptop GPU zu verdeutlichen, haben wir diese einmal mit in die Vergleichsgrafiken aufgenommen. In Kombination mit diesem Grafikbeschleuniger würde die 3D-Leistung massiv gesteigert werden. Einen enormen Leistungszuwachs gibt es bei den Rendertest, welcher auf den Einsatz von professionellen Grafikkarten optimiert sind.
Weitere Vergleiche und Benchmarks entnehmen Sie bitte unserer GPU-Vergleichstabelle.
| Unigine Valley 1.0 | |
| 1920x1080 Extreme HD DirectX AA:x8 | |
| Minisforum MS-01 | |
| Geekom A7 | |
| Acemagic F2A | |
| Minisforum Venus Series NPB5 | |
| Durchschnittliche Intel Iris Xe Graphics G7 96EUs (11.3 - 20, n=24) | |
| Minisforum Venus Series NAB9 | |
| Geekom XT12 Pro | |
| Maxtang MTN-FP750 | |
| 1920x1080 Extreme HD Preset OpenGL AA:x8 | |
| Minisforum MS-01 | |
| Acemagic F2A | |
| Minisforum Venus Series NPB5 | |
| Durchschnittliche Intel Iris Xe Graphics G7 96EUs (11.7 - 21.7, n=24) | |
| Minisforum Venus Series NAB9 | |
| Geekom XT12 Pro | |
| Maxtang MTN-FP750 | |
| Geekom A7 | |
| Affinity Photo 2 - Combined (Single / Multi GPU) | |
| Minisforum MS-01 | |
| Acemagic F2A | |
| Minisforum Venus Series NAB9 | |
| Durchschnittliche Intel Iris Xe Graphics G7 96EUs (1560 - 4958, n=16) | |
| Geekom XT12 Pro | |
| Geekom A7 | |
| Minisforum MS-01, Intel Iris Xe Graphics G7 96EUs i9-13900H | Acemagic F2A, Intel Arc 8-Core iGPU Ultra 7 155H | Geekom XT12 Pro, Intel Iris Xe Graphics G7 96EUs i9-12900H | Geekom A7, AMD Radeon 780M R9 7940HS | Minisforum Venus Series NAB9, Intel Iris Xe Graphics G7 96EUs i9-12900HK | Minisforum Venus Series NPB5, Intel Iris Xe Graphics G7 80EUs i5-13500H | Maxtang MTN-FP750, AMD Radeon 680M R7 7735HS | Durchschnittliche NVIDIA RTX A2000 Laptop GPU | Durchschnitt der Klasse Mini PC | |
|---|---|---|---|---|---|---|---|---|---|
| SPECviewperf 12 | 7% | -19% | 601% | -17% | -24% | 7% | 457% | 707% | |
| 1900x1060 3ds Max (3dsmax-05) (fps) | 46.7 | 49.8 7% | 40.1 -14% | 84.7 81% | 40.2 -14% | 41.5 -11% | 46.9 0% | 146.2 ? 213% | |
| 1900x1060 Catia (catia-04) (fps) | 41.7 | 48.2 16% | 37.1 -11% | 89 113% | 35.9 -14% | 31 -26% | 51.5 24% | 134.9 ? 224% | 138.8 ? 233% |
| 1900x1060 Creo (creo-01) (fps) | 30 | 23.1 -23% | 26.9 -10% | 55.4 85% | 27.7 -8% | 23.4 -22% | 33.2 11% | 116.2 ? 287% | 68.8 ? 129% |
| 1900x1060 Energy (energy-01) (fps) | 0.5 | 0.91 82% | 0.4 -20% | 20.7 4040% | 0.4 -20% | 0.35 -30% | 10.7 ? 2040% | 21.3 ? 4160% | |
| 1900x1060 Maya (maya-04) (fps) | 51.9 | 54.9 6% | 38.3 -26% | 69.7 34% | 39.8 -23% | 35.9 -31% | 45.2 -13% | 96 ? 85% | 125.8 ? 142% |
| 1900x1060 Medical (medical-01) (fps) | 14.5 | 16.9 17% | 11.8 -19% | 60.5 317% | 12.2 -16% | 8.44 -42% | 17.9 23% | 45 ? 210% | 76.6 ? 428% |
| 1900x1060 Showcase (showcase-01) (fps) | 24.8 | 18.2 -27% | 16.6 -33% | 30.3 22% | 17.4 -30% | 20.4 -18% | 17.5 -29% | 69.9 ? 182% | 81.5 ? 229% |
| 1900x1060 Solidworks (sw-03) (fps) | 53.1 | 42.7 -20% | 45.3 -15% | 116 118% | 47.3 -11% | 46.1 -13% | 72.1 36% | 142.1 ? 168% | 119.3 ? 125% |
| SPECviewperf 13 | 5% | -14% | 157% | -14% | -27% | 33% | 266% | 347% | |
| 3ds Max (3dsmax-06) (fps) | 46.5 | 46.4 0% | 40.1 -14% | 83.9 80% | 39.9 -14% | 41.5 -11% | 48.3 4% | 139.4 ? 200% | 142.9 ? 207% |
| Catia (catia-05) (fps) | 58.9 | 71.6 22% | 51.3 -13% | 130 121% | 51.6 -12% | 44.8 -24% | 73.9 25% | 205 ? 248% | 191.8 ? 226% |
| Creo (creo-02) (fps) | 46.2 | 29.6 -36% | 41.1 -11% | 93.4 102% | 40.2 -13% | 37.1 -20% | 44.9 -3% | 165.1 ? 257% | 160.7 ? 248% |
| Energy (energy-02) (fps) | 4.72 | 5.69 21% | 4.5 -5% | 23.8 404% | 4.39 -7% | 2.03 -57% | 11.4 142% | 32.1 ? 580% | 38.9 ? 724% |
| Maya (maya-05) (fps) | 58.4 | 59.5 2% | 47.5 -19% | 107 83% | 48.3 -17% | 46 -21% | 58.3 0% | 174.5 ? 199% | 199.4 ? 241% |
| Medical (medical-02) (fps) | 15.8 | 29.7 88% | 14.4 -9% | 77.6 391% | 14.4 -9% | 7.92 -50% | 32.8 108% | 70.4 ? 346% | 146.5 ? 827% |
| Showcase (showcase-02) (fps) | 25 | 18.2 -27% | 17.3 -31% | 25.4 2% | 17.3 -31% | 20.4 -18% | 17.4 -30% | 68 ? 172% | 77.7 ? 211% |
| Solidworks (sw-04) (fps) | 63.7 | 44.8 -30% | 57.1 -10% | 109 71% | 57.4 -10% | 56 -12% | 72.9 14% | 144.6 ? 127% | 121.1 ? 90% |
| SPECviewperf 2020 | 11% | -15% | 232% | -14% | -32% | 69% | 429% | 442% | |
| 3840x2160 Medical (medical-03) (fps) | 2.72 | 5.05 86% | 3.49 28% | 11.1 308% | 3.48 28% | 1.37 -50% | 4.72 74% | 10.6 ? 290% | 22.9 ? 742% |
| 3840x2160 Energy (energy-03) (fps) | 4.75 | 4.61 -3% | 3.05 -36% | 14.1 197% | 3 -37% | 1.18 -75% | 6.6 39% | 25.6 ? 439% | 33.7 ? 609% |
| 3840x2160 Creo (creo-03) (fps) | 19.2 | 17.9 -7% | 14.8 -23% | 31.4 64% | 15.1 -21% | 13.6 -29% | 17.5 -9% | 55.5 ? 189% | 49.8 ? 159% |
| 3840x2160 CATIA (catia-06) (fps) | 9.99 | 10 0% | 7.78 -22% | 24.8 148% | 8.08 -19% | 7.41 -26% | 13.1 31% | 29.7 ? 197% | 34.8 ? 248% |
| 3840x2160 3ds Max (3dsmax-07) (fps) | 11.6 | 12.9 11% | 9.69 -16% | 20.9 80% | 9.78 -16% | 10.1 -13% | 9.26 -20% | 36 ? 210% | 55.4 ? 378% |
| 3840x2160 Siemens NX (snx-04) (fps) | 6.9 | 5.7 -17% | 6.29 -9% | 61.4 790% | 6.67 -3% | 6.71 -3% | 33 378% | 112.5 ? 1530% | 51.5 ? 646% |
| 3840x2160 Maya (maya-06) (fps) | 34.1 | 35.4 4% | 23.9 -30% | 47 38% | 24.4 -28% | 23.6 -31% | 29.5 -13% | 83.5 ? 145% | 141.1 ? 314% |
| Durchschnitt gesamt (Programm / Settings) | 8% /
7% | -16% /
-16% | 330% /
334% | -15% /
-15% | -28% /
-28% | 36% /
36% | 384% /
378% | 499% /
501% |
| 3DMark 05 Standard | 50056 Punkte | |
| 3DMark 06 Score 1366x768 | 38453 Punkte | |
| 3DMark Vantage P Result | 33312 Punkte | |
| 3DMark 11 Performance | 8500 Punkte | |
| 3DMark Ice Storm Standard Score | 179358 Punkte | |
| 3DMark Cloud Gate Standard Score | 30468 Punkte | |
| 3DMark Fire Strike Score | 6105 Punkte | |
| 3DMark Fire Strike Extreme Score | 3023 Punkte | |
| 3DMark Time Spy Score | 2118 Punkte | |
Hilfe | ||
Gaming Performance
Als Gaming-System ist der Minisforum MS-01 in der von uns getesteten Ausstattung nur bedingt geeignet. Die iGPU des Intel Core i9-13900H schafft es trotzdem, einige Spiele mit gut spielbaren Frame-Raten auf den Bildschirm zu bringen. Spürbar mehr Leistung gibt es mit einer AMD Radeon 780M, welche im Geekom A7 zum Einsatz kommt. Wer eine dedizierte Grafikkarte im Minisforum MS-01 einbauen möchte, wird sicherlich einen ordentlichen Leistungszuwachs bekommen. Allerdings muss erst einmal ein passendes Modell gefunden werden, welches in dem Gerät untergebracht werden kann. Unter den aktuellen GPU-Modellen gibt es eine Intel Arc A380, welche die Voraussetzungen erfüllen würde. Um eine grobe Einschätzung zu der Leistung in Kombination mit einer Intel Arc A380 zu bekommen, haben wir diese einmal mit in die Vergleichsübersicht einfließen lassen. Unabhängig dazu kann man auch den Umweg über eine externe Grafikkarte via USB4 gehen.
| The Witcher 3 | |
| 1024x768 Low Graphics & Postprocessing | |
| Sparkle Intel Arc A380 Elf | |
| Geekom A7 | |
| Acemagic F2A | |
| Minisforum MS-01 | |
| Minisforum Venus Series NAB9 | |
| Minisforum Venus Series NPB5 | |
| Geekom XT12 Pro | |
| Maxtang MTN-FP750 | |
| 1920x1080 High Graphics & Postprocessing (Nvidia HairWorks Off) | |
| Sparkle Intel Arc A380 Elf | |
| Geekom A7 | |
| Acemagic F2A | |
| Minisforum MS-01 | |
| Minisforum Venus Series NPB5 | |
| Minisforum Venus Series NAB9 | |
| Geekom XT12 Pro | |
| Maxtang MTN-FP750 | |
| Borderlands 3 | |
| 1280x720 Very Low Overall Quality (DX11) | |
| Sparkle Intel Arc A380 Elf | |
| Geekom A7 | |
| Acemagic F2A | |
| Minisforum MS-01 | |
| Maxtang MTN-FP750 | |
| Minisforum Venus Series NPB5 | |
| Minisforum Venus Series NAB9 | |
| Geekom XT12 Pro | |
| 1920x1080 High Overall Quality (DX11) | |
| Sparkle Intel Arc A380 Elf | |
| Acemagic F2A | |
| Geekom A7 | |
| Minisforum MS-01 | |
| Minisforum Venus Series NAB9 | |
| Minisforum Venus Series NPB5 | |
| Maxtang MTN-FP750 | |
| Geekom XT12 Pro | |
| GTA V | |
| 1024x768 Lowest Settings possible | |
| Sparkle Intel Arc A380 Elf | |
| Geekom A7 | |
| Minisforum MS-01 | |
| Acemagic F2A | |
| Minisforum Venus Series NPB5 | |
| Minisforum Venus Series NAB9 | |
| Maxtang MTN-FP750 | |
| 1920x1080 High/On (Advanced Graphics Off) AA:2xMSAA + FX AF:8x | |
| Geekom A7 | |
| Sparkle Intel Arc A380 Elf | |
| Acemagic F2A | |
| Minisforum MS-01 | |
| Maxtang MTN-FP750 | |
| Minisforum Venus Series NPB5 | |
| Minisforum Venus Series NAB9 | |
| Shadow of the Tomb Raider | |
| 1280x720 Lowest Preset | |
| Sparkle Intel Arc A380 Elf | |
| Acemagic F2A | |
| Geekom A7 | |
| Minisforum MS-01 | |
| Minisforum Venus Series NPB5 | |
| Maxtang MTN-FP750 | |
| Geekom XT12 Pro | |
| 1920x1080 High Preset AA:SM | |
| Sparkle Intel Arc A380 Elf | |
| Acemagic F2A | |
| Geekom A7 | |
| Minisforum MS-01 | |
| Minisforum Venus Series NPB5 | |
| Maxtang MTN-FP750 | |
| Geekom XT12 Pro | |
| F1 2021 | |
| 1280x720 Ultra Low Preset | |
| Sparkle Intel Arc A380 Elf | |
| Geekom A7 | |
| Acemagic F2A | |
| Minisforum MS-01 | |
| Minisforum Venus Series NAB9 | |
| Maxtang MTN-FP750 | |
| Geekom XT12 Pro | |
| 1920x1080 High Preset AA:T AF:16x | |
| Sparkle Intel Arc A380 Elf | |
| Geekom A7 | |
| Acemagic F2A | |
| Minisforum MS-01 | |
| Minisforum Venus Series NAB9 | |
| Maxtang MTN-FP750 | |
| Geekom XT12 Pro | |
| Tiny Tina's Wonderlands | |
| 1280x720 Lowest Preset (DX12) | |
| Sparkle Intel Arc A380 Elf | |
| Geekom A7 | |
| Acemagic F2A | |
| Maxtang MTN-FP750 | |
| Minisforum MS-01 | |
| Minisforum Venus Series NAB9 | |
| Minisforum Venus Series NPB5 | |
| Geekom XT12 Pro | |
| 1920x1080 High Preset (DX12) | |
| Sparkle Intel Arc A380 Elf | |
| Geekom A7 | |
| Acemagic F2A | |
| Minisforum Venus Series NAB9 | |
| Maxtang MTN-FP750 | |
| Minisforum MS-01 | |
| Minisforum Venus Series NPB5 | |
| Geekom XT12 Pro | |
Witcher-3-fps-Diagramm
| min. | mittel | hoch | max. | |
|---|---|---|---|---|
| GTA V (2015) | 166.4 | 149.3 | 31.1 | 12.5 |
| The Witcher 3 (2015) | 117.2 | 77.8 | 43 | 19.5 |
| Dota 2 Reborn (2015) | 128.6 | 94.5 | 80.8 | 70.6 |
| Final Fantasy XV Benchmark (2018) | 56.3 | 31.2 | 21.4 | |
| X-Plane 11.11 (2018) | 65.5 | 48.3 | 40.7 | |
| Far Cry 5 (2018) | 75 | 39 | 35 | 33 |
| Strange Brigade (2018) | 115.1 | 51.4 | 39.8 | 31.7 |
| Shadow of the Tomb Raider (2018) | 68.7 | 32.4 | 30.3 | 25.7 |
| Far Cry New Dawn (2019) | 69 | 38 | 36 | 33 |
| Metro Exodus (2019) | 45.8 | 23.8 | 17.1 | 13.2 |
| Borderlands 3 (2019) | 67.2 | 30.9 | 18.9 | 14 |
| F1 2020 (2020) | 109.6 | 57.5 | 44.4 | 28 |
| F1 2021 (2021) | 129.9 | 64.9 | 50.8 | 34.4 |
| God of War (2022) | 26.4 | 23 | 18.4 | 13.6 |
| GRID Legends (2022) | 66.2 | 49.3 | 36.7 | 33.2 |
| Tiny Tina's Wonderlands (2022) | 37.5 | 29.5 | 18.2 | 14.2 |
| F1 22 (2022) | 57.2 | 52.3 | 37.1 | 28 |
| F1 23 (2023) | 53.7 | 48.6 | 33.3 | 25 |
| Cyberpunk 2077 (2023) | 22.5 | 17.7 | 15 | 13.1 |
| Total War Pharaoh (2023) | 87.5 | 60.2 | 41.6 | 36.7 |
| Prince of Persia The Lost Crown (2024) | 178 | 124.2 | 115.8 |
Der Minisforum MS-01 mit dem Razer Core X im Leistungs-Check
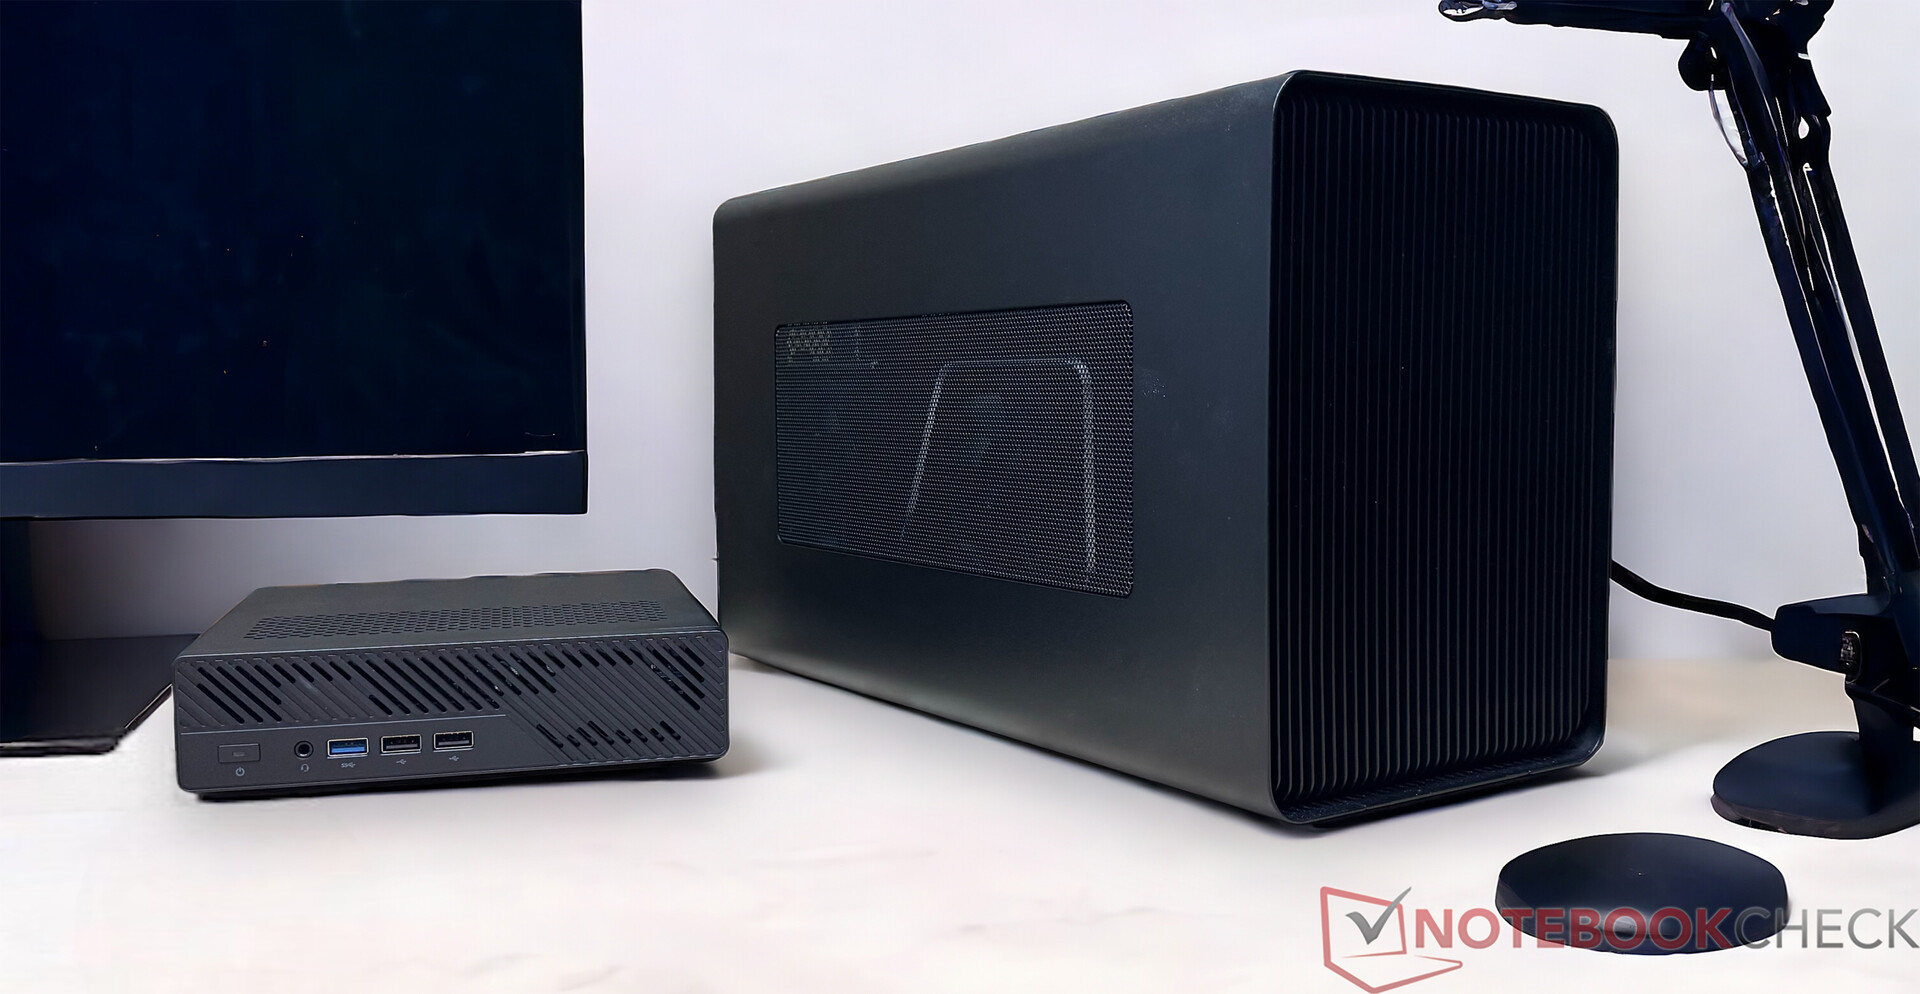
Wer den Minisforum MS-01 mit einer eGPU bestückt, anstatt ein passendes Modell zu finden, welches direkt im Gerät verbaut werden kann, bekommt hier einen Überblick über den zu erwartenden Leistungszuwachs. Wir haben den Minisforum MS-01 in Kombination mit dem Razer Core X und einer Nvidia GeForce RTX 3060 Ti genauer angeschaut. Verglichen mit den Kontrahenten kann unser Testsample an dieser Stelle eine hervorragende Leistung abliefern. Unseren Ergebnissen können wir unter anderem auch entnehmen, dass der Intel Core i9-13900H in Kombination mit unserem Razer Core X deutlich besser abschneidet als die Vergleichsgeräte mit AMD Prozessoren.
Bei diesen Tests handelt es sich ausschließlich um eine Darstellung einer möglichen Leistung mit einer externen Grafikkarte. Eine Einflussnahme auf die Gesamtwertung in diesem Test haben diese Ergebnisse nicht.
| Performance Rating - Percent | |
| Minisforum MS-01 (Nvidia GeForce RTX 3060 Ti FE) | |
| Geekom A7 (Nvidia GeForce RTX 3060 Ti FE) | |
| Intel NUC 13 Pro Kit NUC13ANK (Nvidia GeForce RTX 3060 Ti FE TB3) | |
| Acemagic AM18 (Nvidia GeForce RTX 3060 Ti FE) | |
| Geekom XT12 Pro (Nvidia GeForce RTX 3060 Ti FE) | |
| Minisforum Venus Series UM790 Pro (Nvidia GeForce RTX 3060 Ti FE TB3) | |
| Ace Magician AM08Pro (Nvidia GeForce RTX 3060 Ti FE TB3) | |
| 3DMark | |
| 1280x720 Sky Diver Graphics | |
| Geekom A7 (Nvidia GeForce RTX 3060 Ti FE) | |
| Minisforum MS-01 (Nvidia GeForce RTX 3060 Ti FE) | |
| Intel NUC 13 Pro Kit NUC13ANK (Nvidia GeForce RTX 3060 Ti FE TB3) | |
| Ace Magician AM08Pro (Nvidia GeForce RTX 3060 Ti FE TB3) | |
| Minisforum Venus Series UM790 Pro (Nvidia GeForce RTX 3060 Ti FE TB3) | |
| Acemagic AM18 (Nvidia GeForce RTX 3060 Ti FE) | |
| Geekom XT12 Pro (Nvidia GeForce RTX 3060 Ti FE) | |
| 1920x1080 Fire Strike Graphics | |
| Geekom A7 (Nvidia GeForce RTX 3060 Ti FE) | |
| Intel NUC 13 Pro Kit NUC13ANK (Nvidia GeForce RTX 3060 Ti FE TB3) | |
| Minisforum MS-01 (Nvidia GeForce RTX 3060 Ti FE) | |
| Acemagic AM18 (Nvidia GeForce RTX 3060 Ti FE) | |
| Geekom XT12 Pro (Nvidia GeForce RTX 3060 Ti FE) | |
| Ace Magician AM08Pro (Nvidia GeForce RTX 3060 Ti FE TB3) | |
| Minisforum Venus Series UM790 Pro (Nvidia GeForce RTX 3060 Ti FE TB3) | |
| Unigine Superposition | |
| 1280x720 720p Low | |
| Minisforum MS-01 (Nvidia GeForce RTX 3060 Ti FE) | |
| Geekom A7 (Nvidia GeForce RTX 3060 Ti FE) | |
| Minisforum Venus Series UM790 Pro (Nvidia GeForce RTX 3060 Ti FE TB3) | |
| Acemagic AM18 (Nvidia GeForce RTX 3060 Ti FE) | |
| Geekom XT12 Pro (Nvidia GeForce RTX 3060 Ti FE) | |
| Intel NUC 13 Pro Kit NUC13ANK (Nvidia GeForce RTX 3060 Ti FE TB3) | |
| Ace Magician AM08Pro (Nvidia GeForce RTX 3060 Ti FE TB3) | |
| 1920x1080 1080p High | |
| Intel NUC 13 Pro Kit NUC13ANK (Nvidia GeForce RTX 3060 Ti FE TB3) | |
| Minisforum MS-01 (Nvidia GeForce RTX 3060 Ti FE) | |
| Geekom A7 (Nvidia GeForce RTX 3060 Ti FE) | |
| Acemagic AM18 (Nvidia GeForce RTX 3060 Ti FE) | |
| Geekom XT12 Pro (Nvidia GeForce RTX 3060 Ti FE) | |
| Ace Magician AM08Pro (Nvidia GeForce RTX 3060 Ti FE TB3) | |
| Minisforum Venus Series UM790 Pro (Nvidia GeForce RTX 3060 Ti FE TB3) | |
| 1920x1080 1080p Extreme | |
| Intel NUC 13 Pro Kit NUC13ANK (Nvidia GeForce RTX 3060 Ti FE TB3) | |
| Minisforum MS-01 (Nvidia GeForce RTX 3060 Ti FE) | |
| Geekom XT12 Pro (Nvidia GeForce RTX 3060 Ti FE) | |
| Acemagic AM18 (Nvidia GeForce RTX 3060 Ti FE) | |
| Geekom A7 (Nvidia GeForce RTX 3060 Ti FE) | |
| Ace Magician AM08Pro (Nvidia GeForce RTX 3060 Ti FE TB3) | |
| Minisforum Venus Series UM790 Pro (Nvidia GeForce RTX 3060 Ti FE TB3) | |
| 3840x2160 4k Optimized | |
| Minisforum MS-01 (Nvidia GeForce RTX 3060 Ti FE) | |
| Intel NUC 13 Pro Kit NUC13ANK (Nvidia GeForce RTX 3060 Ti FE TB3) | |
| Geekom XT12 Pro (Nvidia GeForce RTX 3060 Ti FE) | |
| Geekom A7 (Nvidia GeForce RTX 3060 Ti FE) | |
| Acemagic AM18 (Nvidia GeForce RTX 3060 Ti FE) | |
| Ace Magician AM08Pro (Nvidia GeForce RTX 3060 Ti FE TB3) | |
| Minisforum Venus Series UM790 Pro (Nvidia GeForce RTX 3060 Ti FE TB3) | |
| 7680x4320 8k Optimized | |
| Geekom XT12 Pro (Nvidia GeForce RTX 3060 Ti FE) | |
| Minisforum MS-01 (Nvidia GeForce RTX 3060 Ti FE) | |
| Intel NUC 13 Pro Kit NUC13ANK (Nvidia GeForce RTX 3060 Ti FE TB3) | |
| Acemagic AM18 (Nvidia GeForce RTX 3060 Ti FE) | |
| Geekom A7 (Nvidia GeForce RTX 3060 Ti FE) | |
| Ace Magician AM08Pro (Nvidia GeForce RTX 3060 Ti FE TB3) | |
| Minisforum Venus Series UM790 Pro (Nvidia GeForce RTX 3060 Ti FE TB3) | |
| Unigine Valley 1.0 | |
| 1920x1080 Extreme HD DirectX AA:x8 | |
| Geekom XT12 Pro (Nvidia GeForce RTX 3060 Ti FE) | |
| Minisforum MS-01 (Nvidia GeForce RTX 3060 Ti FE) | |
| Intel NUC 13 Pro Kit NUC13ANK (Nvidia GeForce RTX 3060 Ti FE TB3) | |
| Geekom A7 (Nvidia GeForce RTX 3060 Ti FE) | |
| Acemagic AM18 (Nvidia GeForce RTX 3060 Ti FE) | |
| Minisforum Venus Series UM790 Pro (Nvidia GeForce RTX 3060 Ti FE TB3) | |
| Ace Magician AM08Pro (Nvidia GeForce RTX 3060 Ti FE TB3) | |
| 1920x1080 Extreme HD Preset OpenGL AA:x8 | |
| Minisforum MS-01 (Nvidia GeForce RTX 3060 Ti FE) | |
| Geekom XT12 Pro (Nvidia GeForce RTX 3060 Ti FE) | |
| Geekom A7 (Nvidia GeForce RTX 3060 Ti FE) | |
| Acemagic AM18 (Nvidia GeForce RTX 3060 Ti FE) | |
| Intel NUC 13 Pro Kit NUC13ANK (Nvidia GeForce RTX 3060 Ti FE TB3) | |
| Ace Magician AM08Pro (Nvidia GeForce RTX 3060 Ti FE TB3) | |
| Minisforum Venus Series UM790 Pro (Nvidia GeForce RTX 3060 Ti FE TB3) | |
| Unigine Heaven 4.0 | |
| Extreme Preset OpenGL | |
| Geekom A7 (Nvidia GeForce RTX 3060 Ti FE) | |
| Minisforum MS-01 (Nvidia GeForce RTX 3060 Ti FE) | |
| Acemagic AM18 (Nvidia GeForce RTX 3060 Ti FE) | |
| Geekom XT12 Pro (Nvidia GeForce RTX 3060 Ti FE) | |
| Intel NUC 13 Pro Kit NUC13ANK (Nvidia GeForce RTX 3060 Ti FE TB3) | |
| Ace Magician AM08Pro (Nvidia GeForce RTX 3060 Ti FE TB3) | |
| Minisforum Venus Series UM790 Pro (Nvidia GeForce RTX 3060 Ti FE TB3) | |
| Extreme Preset DX11 | |
| Geekom A7 (Nvidia GeForce RTX 3060 Ti FE) | |
| Intel NUC 13 Pro Kit NUC13ANK (Nvidia GeForce RTX 3060 Ti FE TB3) | |
| Minisforum MS-01 (Nvidia GeForce RTX 3060 Ti FE) | |
| Geekom XT12 Pro (Nvidia GeForce RTX 3060 Ti FE) | |
| Acemagic AM18 (Nvidia GeForce RTX 3060 Ti FE) | |
| Ace Magician AM08Pro (Nvidia GeForce RTX 3060 Ti FE TB3) | |
| Minisforum Venus Series UM790 Pro (Nvidia GeForce RTX 3060 Ti FE TB3) | |
| ComputeMark v2.1 | |
| 1024x600 Normal, Score | |
| Geekom A7 (Nvidia GeForce RTX 3060 Ti FE) | |
| Minisforum MS-01 (Nvidia GeForce RTX 3060 Ti FE) | |
| Acemagic AM18 (Nvidia GeForce RTX 3060 Ti FE) | |
| Minisforum Venus Series UM790 Pro (Nvidia GeForce RTX 3060 Ti FE TB3) | |
| Intel NUC 13 Pro Kit NUC13ANK (Nvidia GeForce RTX 3060 Ti FE TB3) | |
| Ace Magician AM08Pro (Nvidia GeForce RTX 3060 Ti FE TB3) | |
| Geekom XT12 Pro (Nvidia GeForce RTX 3060 Ti FE) | |
| 1024x600 Normal, Fluid 3DTex | |
| Geekom A7 (Nvidia GeForce RTX 3060 Ti FE) | |
| Minisforum MS-01 (Nvidia GeForce RTX 3060 Ti FE) | |
| Intel NUC 13 Pro Kit NUC13ANK (Nvidia GeForce RTX 3060 Ti FE TB3) | |
| Minisforum Venus Series UM790 Pro (Nvidia GeForce RTX 3060 Ti FE TB3) | |
| Acemagic AM18 (Nvidia GeForce RTX 3060 Ti FE) | |
| Ace Magician AM08Pro (Nvidia GeForce RTX 3060 Ti FE TB3) | |
| Geekom XT12 Pro (Nvidia GeForce RTX 3060 Ti FE) | |
| 1024x600 Normal, Fluid 2DTexArr | |
| Minisforum MS-01 (Nvidia GeForce RTX 3060 Ti FE) | |
| Geekom A7 (Nvidia GeForce RTX 3060 Ti FE) | |
| Intel NUC 13 Pro Kit NUC13ANK (Nvidia GeForce RTX 3060 Ti FE TB3) | |
| Minisforum Venus Series UM790 Pro (Nvidia GeForce RTX 3060 Ti FE TB3) | |
| Acemagic AM18 (Nvidia GeForce RTX 3060 Ti FE) | |
| Ace Magician AM08Pro (Nvidia GeForce RTX 3060 Ti FE TB3) | |
| Geekom XT12 Pro (Nvidia GeForce RTX 3060 Ti FE) | |
| 1024x600 Normal, Mandel Vector | |
| Geekom A7 (Nvidia GeForce RTX 3060 Ti FE) | |
| Minisforum MS-01 (Nvidia GeForce RTX 3060 Ti FE) | |
| Acemagic AM18 (Nvidia GeForce RTX 3060 Ti FE) | |
| Minisforum Venus Series UM790 Pro (Nvidia GeForce RTX 3060 Ti FE TB3) | |
| Intel NUC 13 Pro Kit NUC13ANK (Nvidia GeForce RTX 3060 Ti FE TB3) | |
| Ace Magician AM08Pro (Nvidia GeForce RTX 3060 Ti FE TB3) | |
| Geekom XT12 Pro (Nvidia GeForce RTX 3060 Ti FE) | |
| 1024x600 Normal, Mandel Scalar | |
| Geekom A7 (Nvidia GeForce RTX 3060 Ti FE) | |
| Minisforum MS-01 (Nvidia GeForce RTX 3060 Ti FE) | |
| Acemagic AM18 (Nvidia GeForce RTX 3060 Ti FE) | |
| Minisforum Venus Series UM790 Pro (Nvidia GeForce RTX 3060 Ti FE TB3) | |
| Intel NUC 13 Pro Kit NUC13ANK (Nvidia GeForce RTX 3060 Ti FE TB3) | |
| Ace Magician AM08Pro (Nvidia GeForce RTX 3060 Ti FE TB3) | |
| Geekom XT12 Pro (Nvidia GeForce RTX 3060 Ti FE) | |
| 1024x600 Normal, QJuliaRayTrace | |
| Minisforum MS-01 (Nvidia GeForce RTX 3060 Ti FE) | |
| Acemagic AM18 (Nvidia GeForce RTX 3060 Ti FE) | |
| Geekom A7 (Nvidia GeForce RTX 3060 Ti FE) | |
| Intel NUC 13 Pro Kit NUC13ANK (Nvidia GeForce RTX 3060 Ti FE TB3) | |
| Minisforum Venus Series UM790 Pro (Nvidia GeForce RTX 3060 Ti FE TB3) | |
| Ace Magician AM08Pro (Nvidia GeForce RTX 3060 Ti FE TB3) | |
| Geekom XT12 Pro (Nvidia GeForce RTX 3060 Ti FE) | |
| min. | mittel | hoch | max. | QHD | 4K | |
|---|---|---|---|---|---|---|
| GTA V (2015) | 186.2 | 184.2 | 177.4 | 111.8 | 96.1 | 103.5 |
| The Witcher 3 (2015) | 317 | 213 | 155 | 76.2 | 64.9 | 72.7 |
| Dota 2 Reborn (2015) | 202 | 167.4 | 157.5 | 144.6 | 107 | |
| Final Fantasy XV Benchmark (2018) | 205 | 146.8 | 99.6 | 77.9 | 49 | |
| X-Plane 11.11 (2018) | 168.4 | 150.4 | 116.4 | 106.7 | ||
| Far Cry 5 (2018) | 185 | 151 | 139 | 131 | 101 | 59 |
| Strange Brigade (2018) | 231 | 174.9 | 168 | 159.9 | 131.8 | 83.8 |
| Shadow of the Tomb Raider (2018) | 183.7 | 115.4 | 109.9 | 101.6 | 80.8 | 50.3 |
| Far Cry New Dawn (2019) | 160 | 134 | 127 | 115 | 98 | 61 |
| Metro Exodus (2019) | 147.8 | 93.6 | 70.9 | 53.6 | 46.5 | 33.9 |
| Borderlands 3 (2019) | 184.1 | 143 | 108 | 86 | 65.3 | 38.5 |
| F1 2020 (2020) | 223 | 136.2 | 135.8 | 107.2 | 92.5 | 61.5 |
| F1 2021 (2021) | 147.6 | 115.8 | 68.9 | 54.5 | 51 | 42.9 |
| God of War (2022) | 113 | 100.9 | 85.1 | 67.4 | 58.3 | 40.9 |
| Tiny Tina's Wonderlands (2022) | 180 | 140.9 | 101.1 | 81.7 | 62 | 36 |
| F1 22 (2022) | 63.1 | 57.5 | 44.1 | 28.5 | 27.5 | 19.9 |
| F1 23 (2023) | 70.3 | 71 | 56.9 | 36 | 32.6 | 17.4 |
| Cyberpunk 2077 (2023) | 91.7 | 81.5 | 71.6 | 64.6 | 44.6 | 22.4 |
| Assassin's Creed Mirage (2023) | 88 | 82 | 78 | 60 | 55 | 38 |
| Total War Pharaoh (2023) | 334.2 | 179 | 104.6 | 77.3 | 62.7 | 39.2 |
| Avatar Frontiers of Pandora (2023) | 67 | 64 | 57 | 45 | 32 |
Emissionen - Leider nicht sehr sparsam
Geräuschemissionen
Betrachtet man die Kühleinheit in Relation zu dem verbauten Prozessor, so wird schnell klar, dass der kleine Lüfter ordentlich rotieren muss, um genügend Frischluft durch die Kühlfinnen zu befördern. Ein deutlich hörbarer Betrieb unter Last ist das Resultat. Gleichwohl arbeitet das Gerät im Leerlauf verhältnismäßig leise. Mit 33,7 bis 34,7 dB(A) rangiert man etwa auf dem gleichen Level wie der Geekom A7. Unter Last wird es dann recht laut, und somit duelliert sich unser Testsample mit dem Acemagic F2A, welcher hier ähnliche Ergebnisse in unserem Test ablieferte.
Lautstärkediagramm
| Idle |
| 33.7 / 33.9 / 34.7 dB(A) |
| Last |
| 47.7 / 49.1 dB(A) |
 | ||
30 dB leise 40 dB(A) deutlich hörbar 50 dB(A) störend |
||
min: | ||
| Minisforum MS-01 i9-13900H, Iris Xe G7 96EUs | Acemagic F2A Ultra 7 155H, Arc 8-Core | Geekom XT12 Pro i9-12900H, Iris Xe G7 96EUs | Geekom A7 R9 7940HS, Radeon 780M | Minisforum Venus Series NAB9 i9-12900HK, Iris Xe G7 96EUs | Minisforum Venus Series NPB5 i5-13500H, Iris Xe G7 80EUs | Maxtang MTN-FP750 R7 7735HS, Radeon 680M | |
|---|---|---|---|---|---|---|---|
| Geräuschentwicklung | 12% | 11% | 5% | 9% | 13% | 15% | |
| aus / Umgebung * (dB) | 24.4 | 24.9 -2% | 25.4 -4% | 25.4 -4% | 25.4 -4% | 25.1 -3% | 25 -2% |
| Idle min * (dB) | 33.7 | 25.4 25% | 28 17% | 33.3 1% | 27.5 18% | 27.8 18% | 25.3 25% |
| Idle avg * (dB) | 33.9 | 25.7 24% | 28.1 17% | 33.6 1% | 28 17% | 27.8 18% | 25.3 25% |
| Idle max * (dB) | 34.7 | 25.7 26% | 28.5 18% | 33.7 3% | 33 5% | 27.9 20% | 25.4 27% |
| Last avg * (dB) | 47.7 | 47.8 -0% | 39.6 17% | 43.3 9% | 42.8 10% | 38.9 18% | 45.1 5% |
| Witcher 3 ultra * (dB) | 48.9 | 45.23 8% | 47.2 3% | 43.2 12% | 44.5 9% | ||
| Last max * (dB) | 49.1 | 49 -0% | 44.2 10% | 43.3 12% | 44.9 9% | 45.8 7% | 45.3 8% |
* ... kleinere Werte sind besser
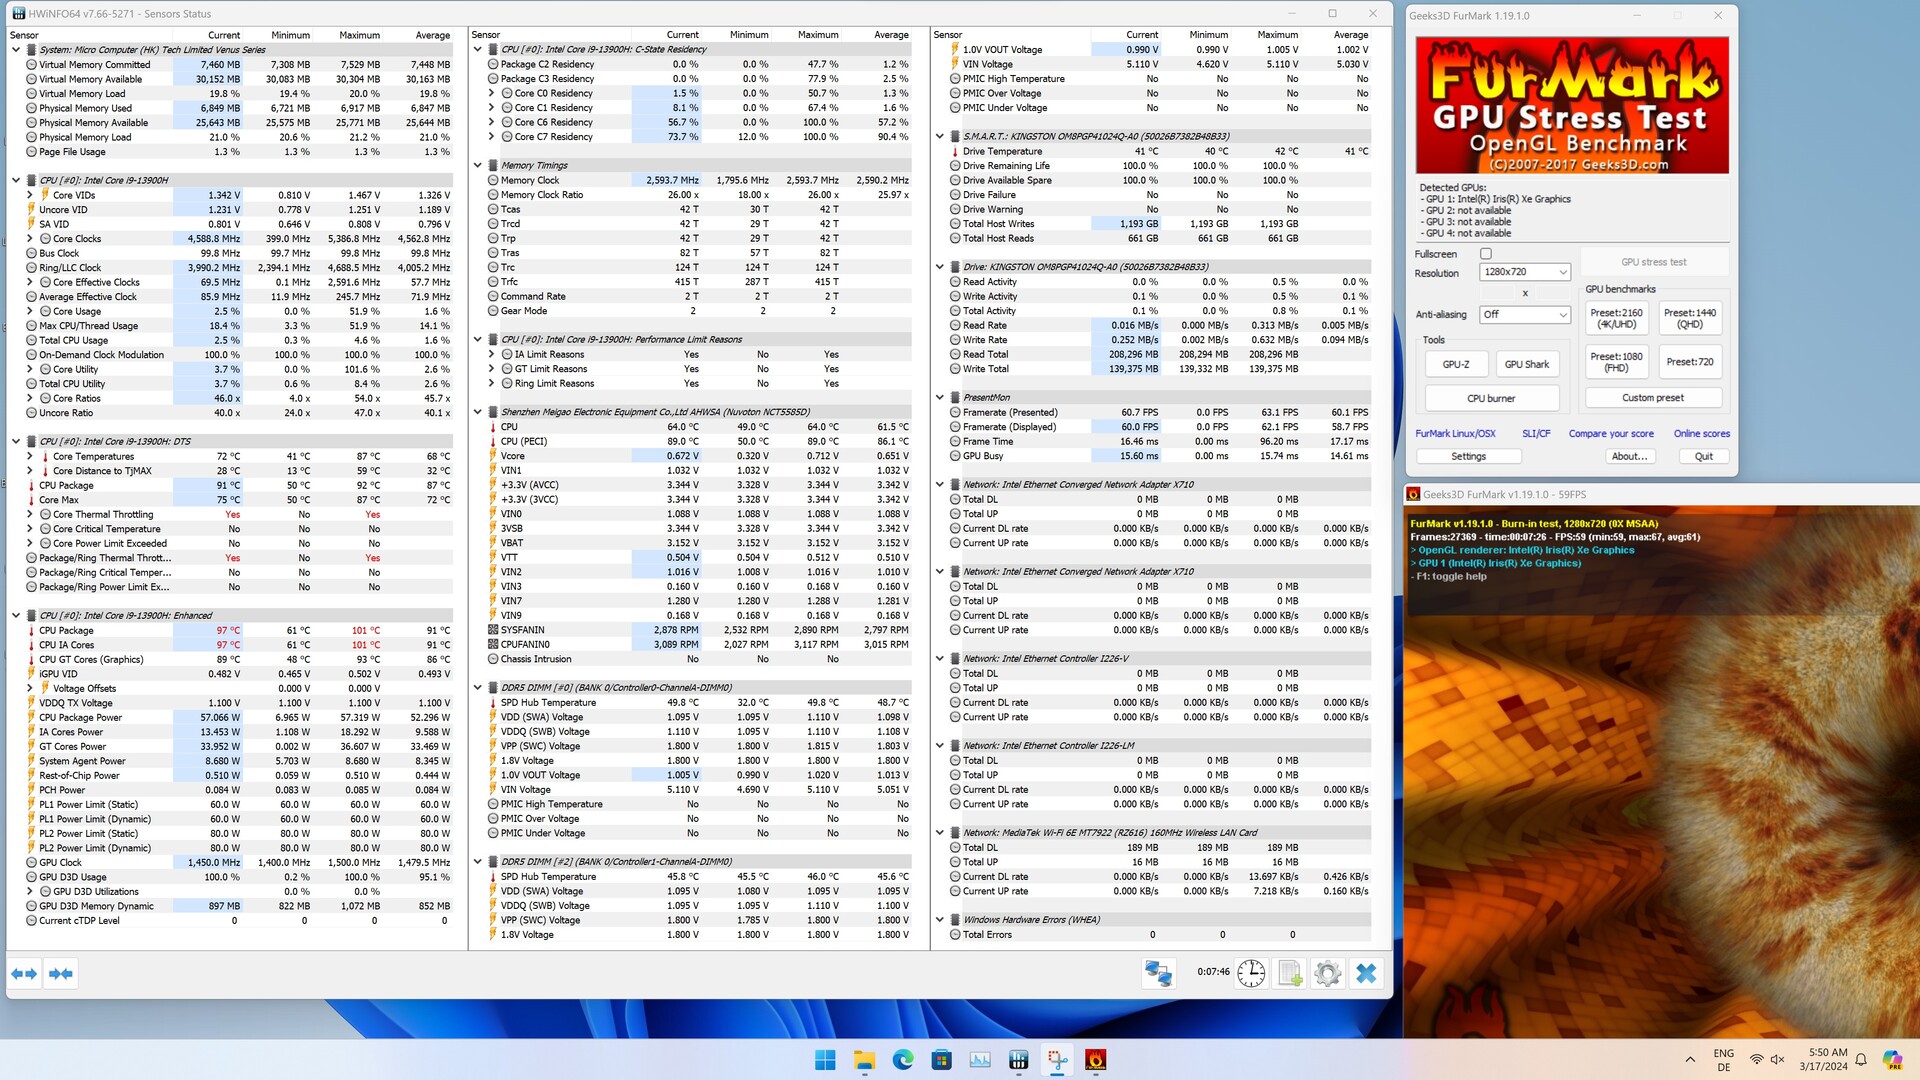
Temperatur
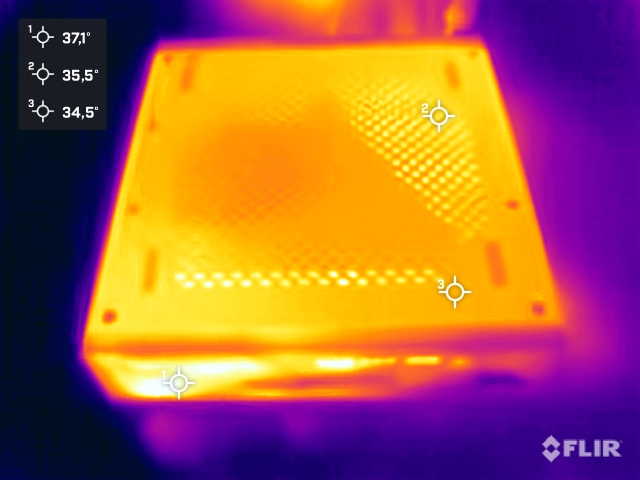
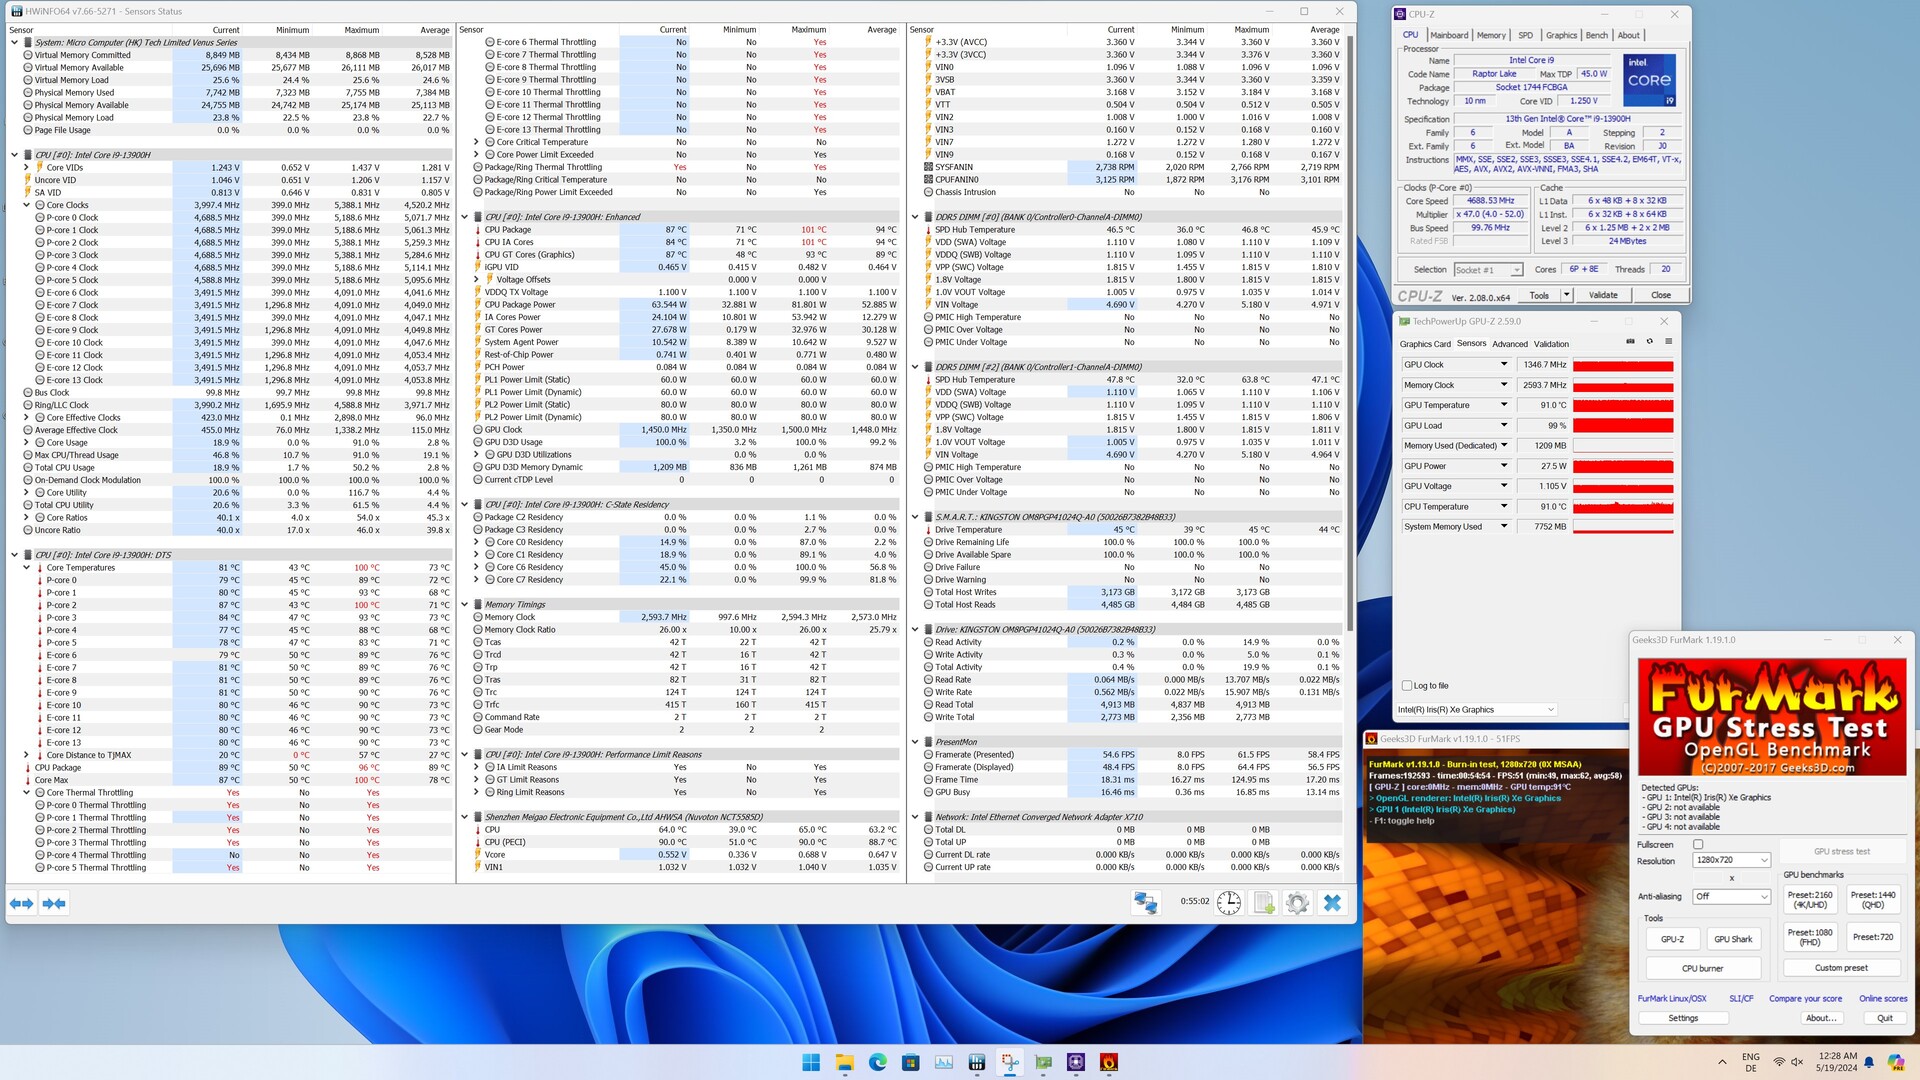
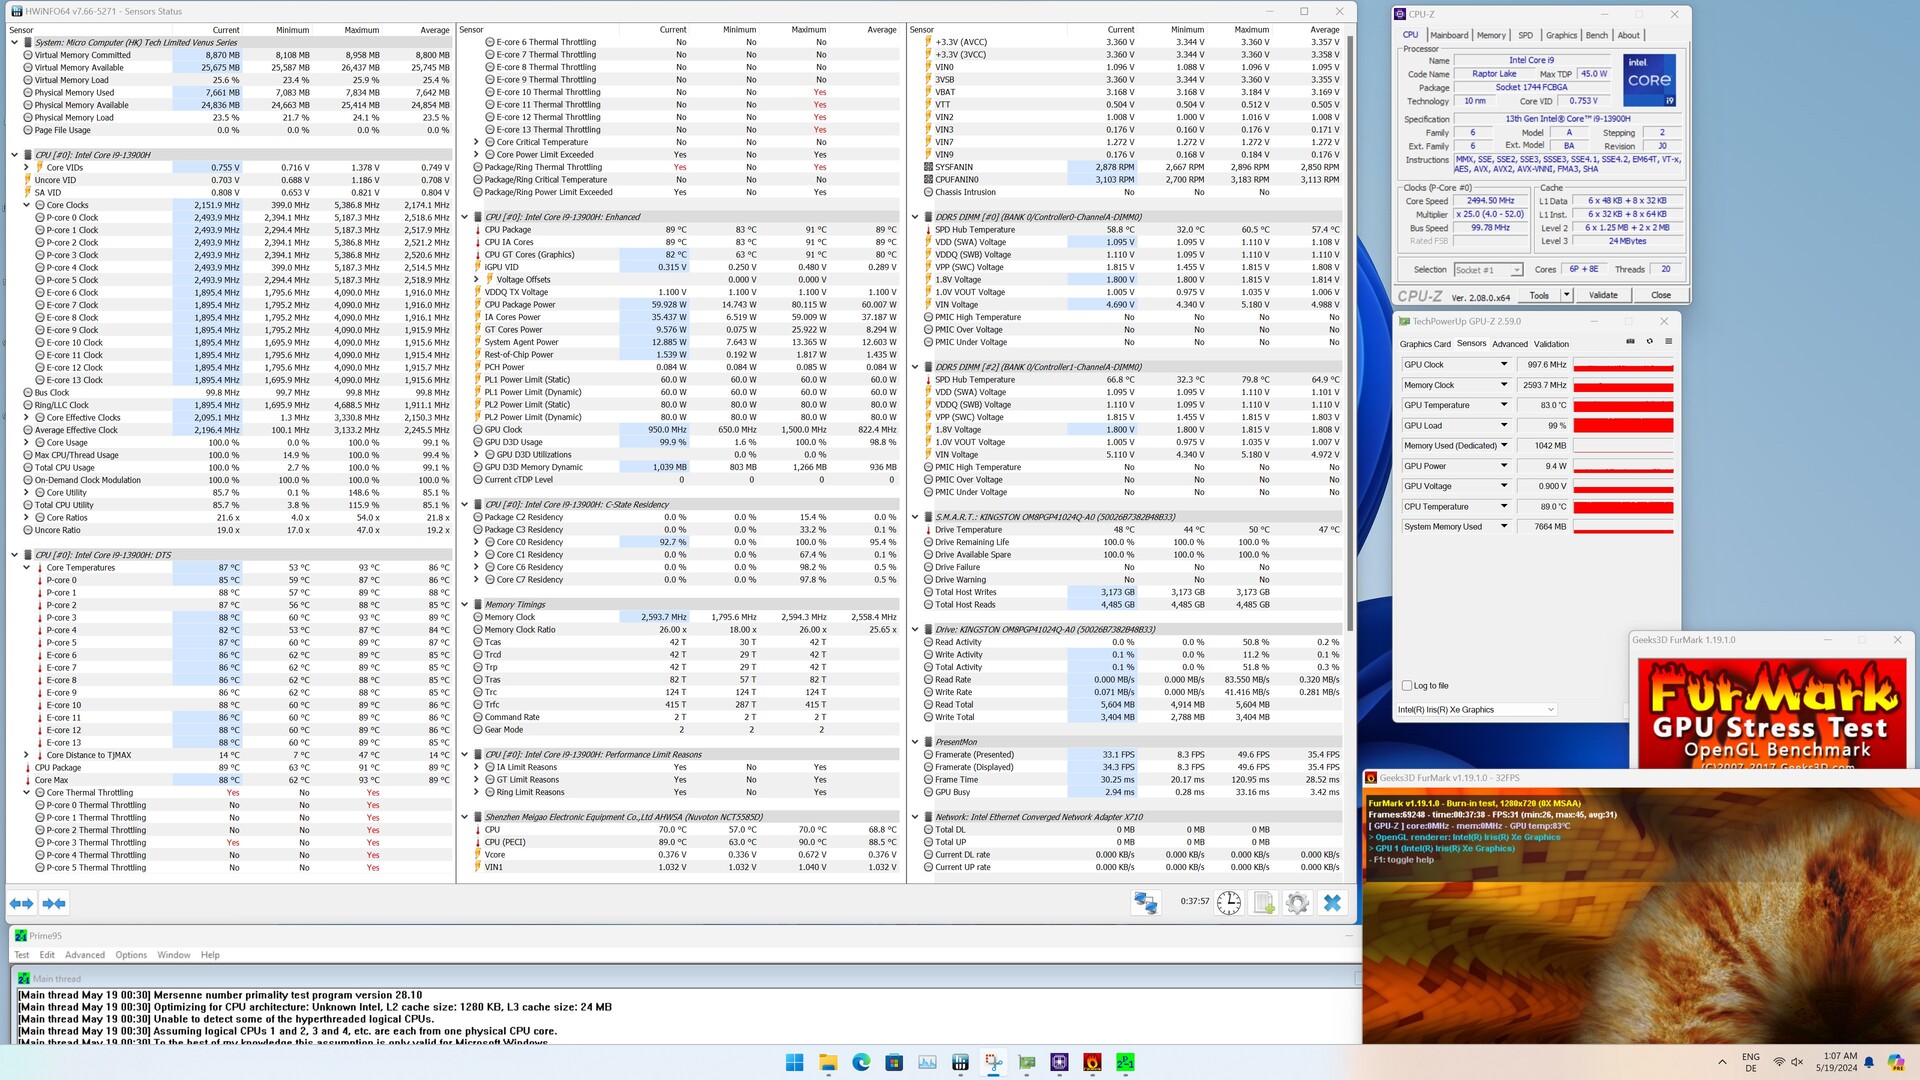
Das Gehäuse des Minisforum MS-01 ist im Leerlauf und unter Last relativ kühl. Mit deutlich unter 40 °C gibt es hier nichts auszusetzen. Ganz anders sieht es allerdings beim Prozessor aus: Mit 101 °C notieren wir den Höchstwert, welcher ungewöhnlicherweise beim FurMark Stresstest erreicht wurde. Aufgrund der eingangs erwähnten Probleme werden wir uns diesem Part noch einmal widmen, sobald das Ersatzgerät bei uns eingetroffen ist.
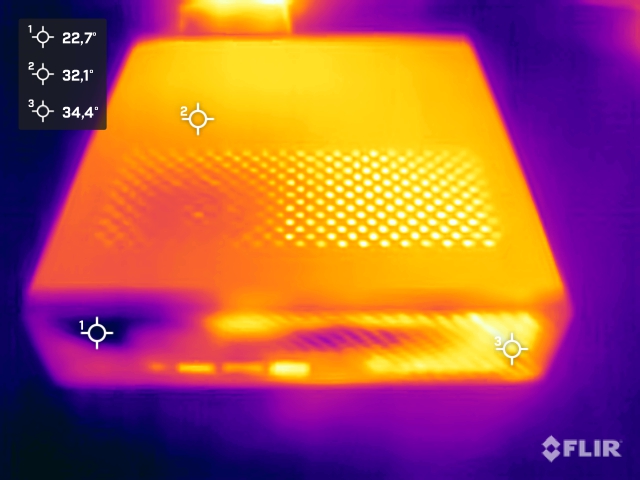
(+) Die maximale Temperatur auf der Oberseite ist 36.6 °C. Im Vergleich liegt der Klassendurchschnitt bei 35.4 °C (von 20.6 bis 69.5 °C für die Klasse Mini PC).
(+) Auf der Unterseite messen wir eine maximalen Wert von 33.6 °C (im Vergleich zum Durchschnitt von 36.1 °C).
(+) Ohne Last messen wir eine durchschnittliche Temperatur von 28.4 °C auf der Oberseite. Der Klassendurchschnitt erreicht 32.1 °C.
Update 19.05.2024
Da wir bei unserem Erstgerät ein thermisches Problem vermutet hatten, haben wir uns die Temperaturen beim Stresstest mit dem Ersatzgerät noch einmal genauer angeschaut. Nach kurzer Zeit haben wir jedoch ähnlich hohe Temperaturwerte beim Intel Core i9-13900H gesehen. Wieder erreichen wir beim FurMark Stresstest die 101 °C, wenngleich beim Prime95 Lasttest nur 92 °C erreicht wurden. Die vordefinierten Leistungslimits erreicht das SoC problemlos und arbeitet somit auf dem erwarteten Leistungsniveau.
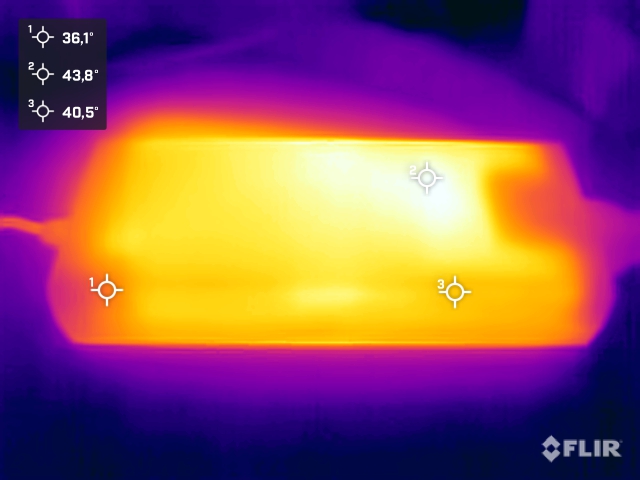
Energieaufnahme
Zu den sparsamen Geräten zählt der Minisforum MS-01 nicht. Selbst im Leerlauf dokumentieren wir recht hohe Werte, die deutlich über dem Durchschnitt der meisten Mini-PCs liegen. Bei durchschnittlicher Belastung klettert der Energiebedarf auf 87 Watt, wenngleich in der Spitze 123,3 Watt erreicht wurden. Beim Vergleich mit den Kontrahenten sehen wir, dass auch der Minisforum Venus Series NAB9 ähnliche Werte erreicht. Das mitgelieferte Netzteil wirkt mir seinen 180 Watt auf den ersten Blick überdimensioniert. Die Möglichkeit, den Minisforum MS-01 mit einer dedizierten Grafikkarte zu bestücken, darf man dabei nicht aus den Augen verlieren, womit das 180-Watt-Netzteil seine Daseinsberechtigung hat.
| Aus / Standby | |
| Idle | |
| Last |
|
Legende:
min: | |
| Minisforum MS-01 i9-13900H, Iris Xe G7 96EUs | Acemagic F2A Ultra 7 155H, Arc 8-Core | Geekom XT12 Pro i9-12900H, Iris Xe G7 96EUs | Geekom A7 R9 7940HS, Radeon 780M | Minisforum Venus Series NAB9 i9-12900HK, Iris Xe G7 96EUs | Minisforum Venus Series NPB5 i5-13500H, Iris Xe G7 80EUs | Maxtang MTN-FP750 R7 7735HS, Radeon 680M | Durchschnittliche Intel Iris Xe Graphics G7 96EUs | Durchschnitt der Klasse Mini PC | |
|---|---|---|---|---|---|---|---|---|---|
| Stromverbrauch | 33% | 41% | 52% | 19% | 23% | 51% | 52% | 31% | |
| Idle min * (Watt) | 14.4 | 9.1 37% | 5.7 60% | 3.8 74% | 12.1 16% | 8.4 42% | 7 51% | 5.51 ? 62% | 8.65 ? 40% |
| Idle avg * (Watt) | 16.1 | 10.3 36% | 9.5 41% | 4.8 70% | 13.2 18% | 11.3 30% | 8.1 50% | 8.66 ? 46% | 10.8 ? 33% |
| Idle max * (Watt) | 25.5 | 14.4 44% | 16.5 35% | 6.5 75% | 14.1 45% | 14.5 43% | 8.4 67% | 10.9 ? 57% | 13.7 ? 46% |
| Last avg * (Watt) | 87.3 | 54.9 37% | 53.3 39% | 71.9 18% | 82.9 5% | 70 20% | 54.2 38% | 45.6 ? 48% | 64.4 ? 26% |
| Last max * (Watt) | 123.3 | 110.4 10% | 87.8 29% | 94.7 23% | 106.8 13% | 149 -21% | 61.4 50% | 67.8 ? 45% | 112.2 ? 9% |
* ... kleinere Werte sind besser
Energieaufnahme mit externem Monitor
Energieaufnahme mit externem Monitor
Pro
Contra
Vorläufiges Fazit - Leistungsstarkes Arbeitsgerät mit überdurchschnittlicher Ausstattung
Der Minisforum MS-01 unterscheidet sich optisch grundlegend von den meisten Mini-PCs, was aber nicht schlimm ist. Der Industrie-Look zeigt ganz klar, dass es sich um ein Arbeitsgerät handelt. Leistungstechnisch bekommt der Rechenknecht mit dem Intel Core i9-13900H viel Leistung, welche auch genutzt werden kann. Die vordefinierten Power-Limits sorgen für eine hohe Leistung, und AMDs aktuelle Topmodelle sind hier nicht spürbar schneller. Aufgrund der Emissionen hinsichtlich der Lautstärke hätten wir uns eine deutlich leistungsstärkere Kühleinheit gewünscht.
Positiv hervorzuheben sind die vielen Anschlussmöglichkeiten, die eine breite Palette an Einsatzmöglichkeiten eröffnet. Zwei USB4-Anschlüsse sind dabei die vermutlich wichtigsten Schnittstellen des Minisforum MS-01. Allerdings kann der Mini-PC auch intern mit vielen Anschlussmöglichkeiten punkten. Eine physische PCIe-x16-Schnittstelle ist momentan ein Alleinstellungsmerkmal in dieser kompakten Bauweise. Eine dedizierte Grafikkarte lässt sich somit einbauen. Allerdings muss intensiv nach einem passenden Modell gesucht werden.
Der Minisforum MS-01 ist ein leistungsstarkes Arbeitsgerät und hat das Potenzial, mit dem richtigen Zubehör eine Workstation zu werden.
Als reine Workstation würden wir den Minisforum MS-01 ist dieser Form, wie wir das Modell getestet haben, nicht bezeichnen. Rein von der Leistung her ergibt sich kein großer Vorteil gegenüber anderen Mini-PCs für den Consumer-Bereich. Eine professionelle Grafiklösung, um sich hier deutlicher abzugrenzen, wäre unserer Ansicht nach der richtige Weg. Leider bietet Minisforum auch selbst kein passendes Modell einer dedizierten Grafikkarte an.
Zum Schluss wollen wir uns noch einmal dem Kaufpreis widmen, denn ein Schnäppchen ist der Minisforum MS-01 mit seinen 979 Euro nicht. Viele Kontrahenten sind weitaus günstiger und teilweise auch leistungsfähiger. Dennoch bietet der Minisforum MS-01 spezielle Vorteile hinsichtlich der Nutzungsmöglichkeiten, die andere Mini-PCs nicht bieten.
Während des gesamten Testzeitraumes hatten wir mit massiven Stabilitätsproblemen zu kämpfen. Wir haben bereits zu Beginn des Reviews auf die Problematik mit unserem Testsample hingewiesen. Immer wieder wurden einige Tests von plötzlichen Abstürzen begleitet, die einen regulären Betrieb für Endanwender in diesem Zustand unmöglich machen. Aufgrund der Problematik haben wir vorerst von einem abschließenden Rating abgesehen und gehen der Sache noch einmal nach, sobald uns der Hersteller ein Ersatzgerät zugeschickt.
Update 19.05.2024
Nachdem wir uns das Ersatzgerät in einigen Tests angesehen haben, können wir die Leistung des ursprünglich getesteten Minisforum MS-01 bestätigen. Die Stabilitätsprobleme des Erstgerätes hatten keine Auswirkungen auf die Systemleistung, die uns als Grundlage für die Bewertung dient. Das Ersatzgerät läuft nun stabil und ohne Systemabstürze.
Preise und Verfügbarkeit
Den Minisforum MS-01 kann man direkt im Shop bei Minisforum bekommen. Derzeit gibt es das Gerät in unserer Testausstattung für nur 979 Euro. Ohne Rabatt liegt der Preis aktuell bei 1.179 Euro. Das preiswertere Barebone-Modell startet derweil bei 779 Euro. Amazon bietet den Minisforum MS-01 ebenfalls in der von uns getesteten Version an. Hier geht das Gerät für 959 Euro über die virtuelle Ladentheke.
Minisforum MS-01
- 19.05.2024 v7 (old)
Sebastian Bade
Transparenz
Die Auswahl der zu testenden Geräte erfolgt innerhalb der Redaktion. Das vorliegende Testmuster wurde dem Autor vom Hersteller unentgeltlich zu Testzwecken überlassen. Eine Einflussnahme auf den Testbericht gab es nicht, der Hersteller erhielt keine Version des Reviews vor der Veröffentlichung. Es bestand keine Verpflichtung zur Publikation. Als eigenständiges, unabhängiges Unternehmen unterliegt Notebookcheck keiner Diktion von Herstellern, Shops und Verlagen.
So testet Notebookcheck
Pro Jahr werden von Notebookcheck hunderte Laptops und Smartphones unabhängig in von uns standardisierten technischen Verfahren getestet, um eine Vergleichbarkeit aller Testergebnisse zu gewährleisten. Seit rund 20 Jahren entwickeln wir diese Testmethoden kontinuierlich weiter und setzen damit Branchenstandards. In unseren Testlaboren kommt ausschließlich hochwertiges Messequipment in die Hände erfahrener Techniker und Redakteure. Die Tests unterliegen einer mehrstufigen Kontrolle. Unsere komplexe Gesamtbewertung basiert auf hunderten fundierten Messergebnissen und Benchmarks, womit Ihnen Objektivität garantiert ist. Weitere Informationen zu unseren Testmethoden gibt es hier.
