Maxtang MTN-FP750 Mini-PC im Test: AMD Ryzen 7 7735HS mit undurchdachter Konfiguration unnötig eingebremst

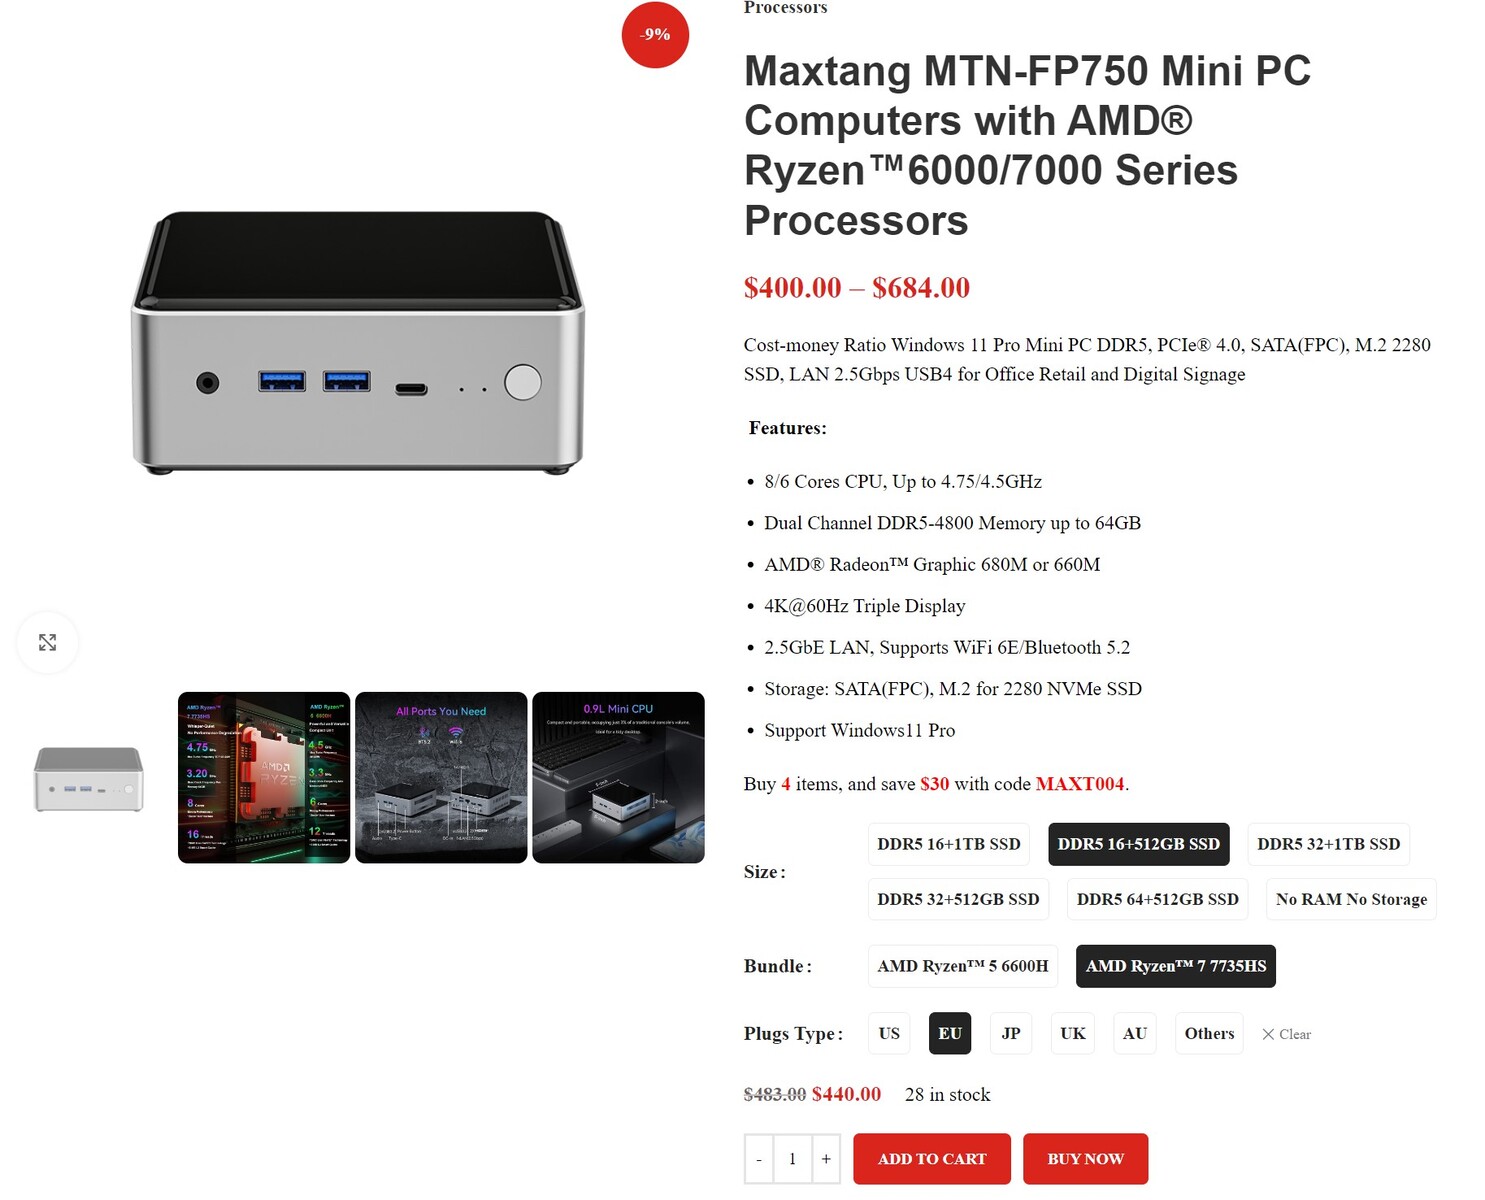
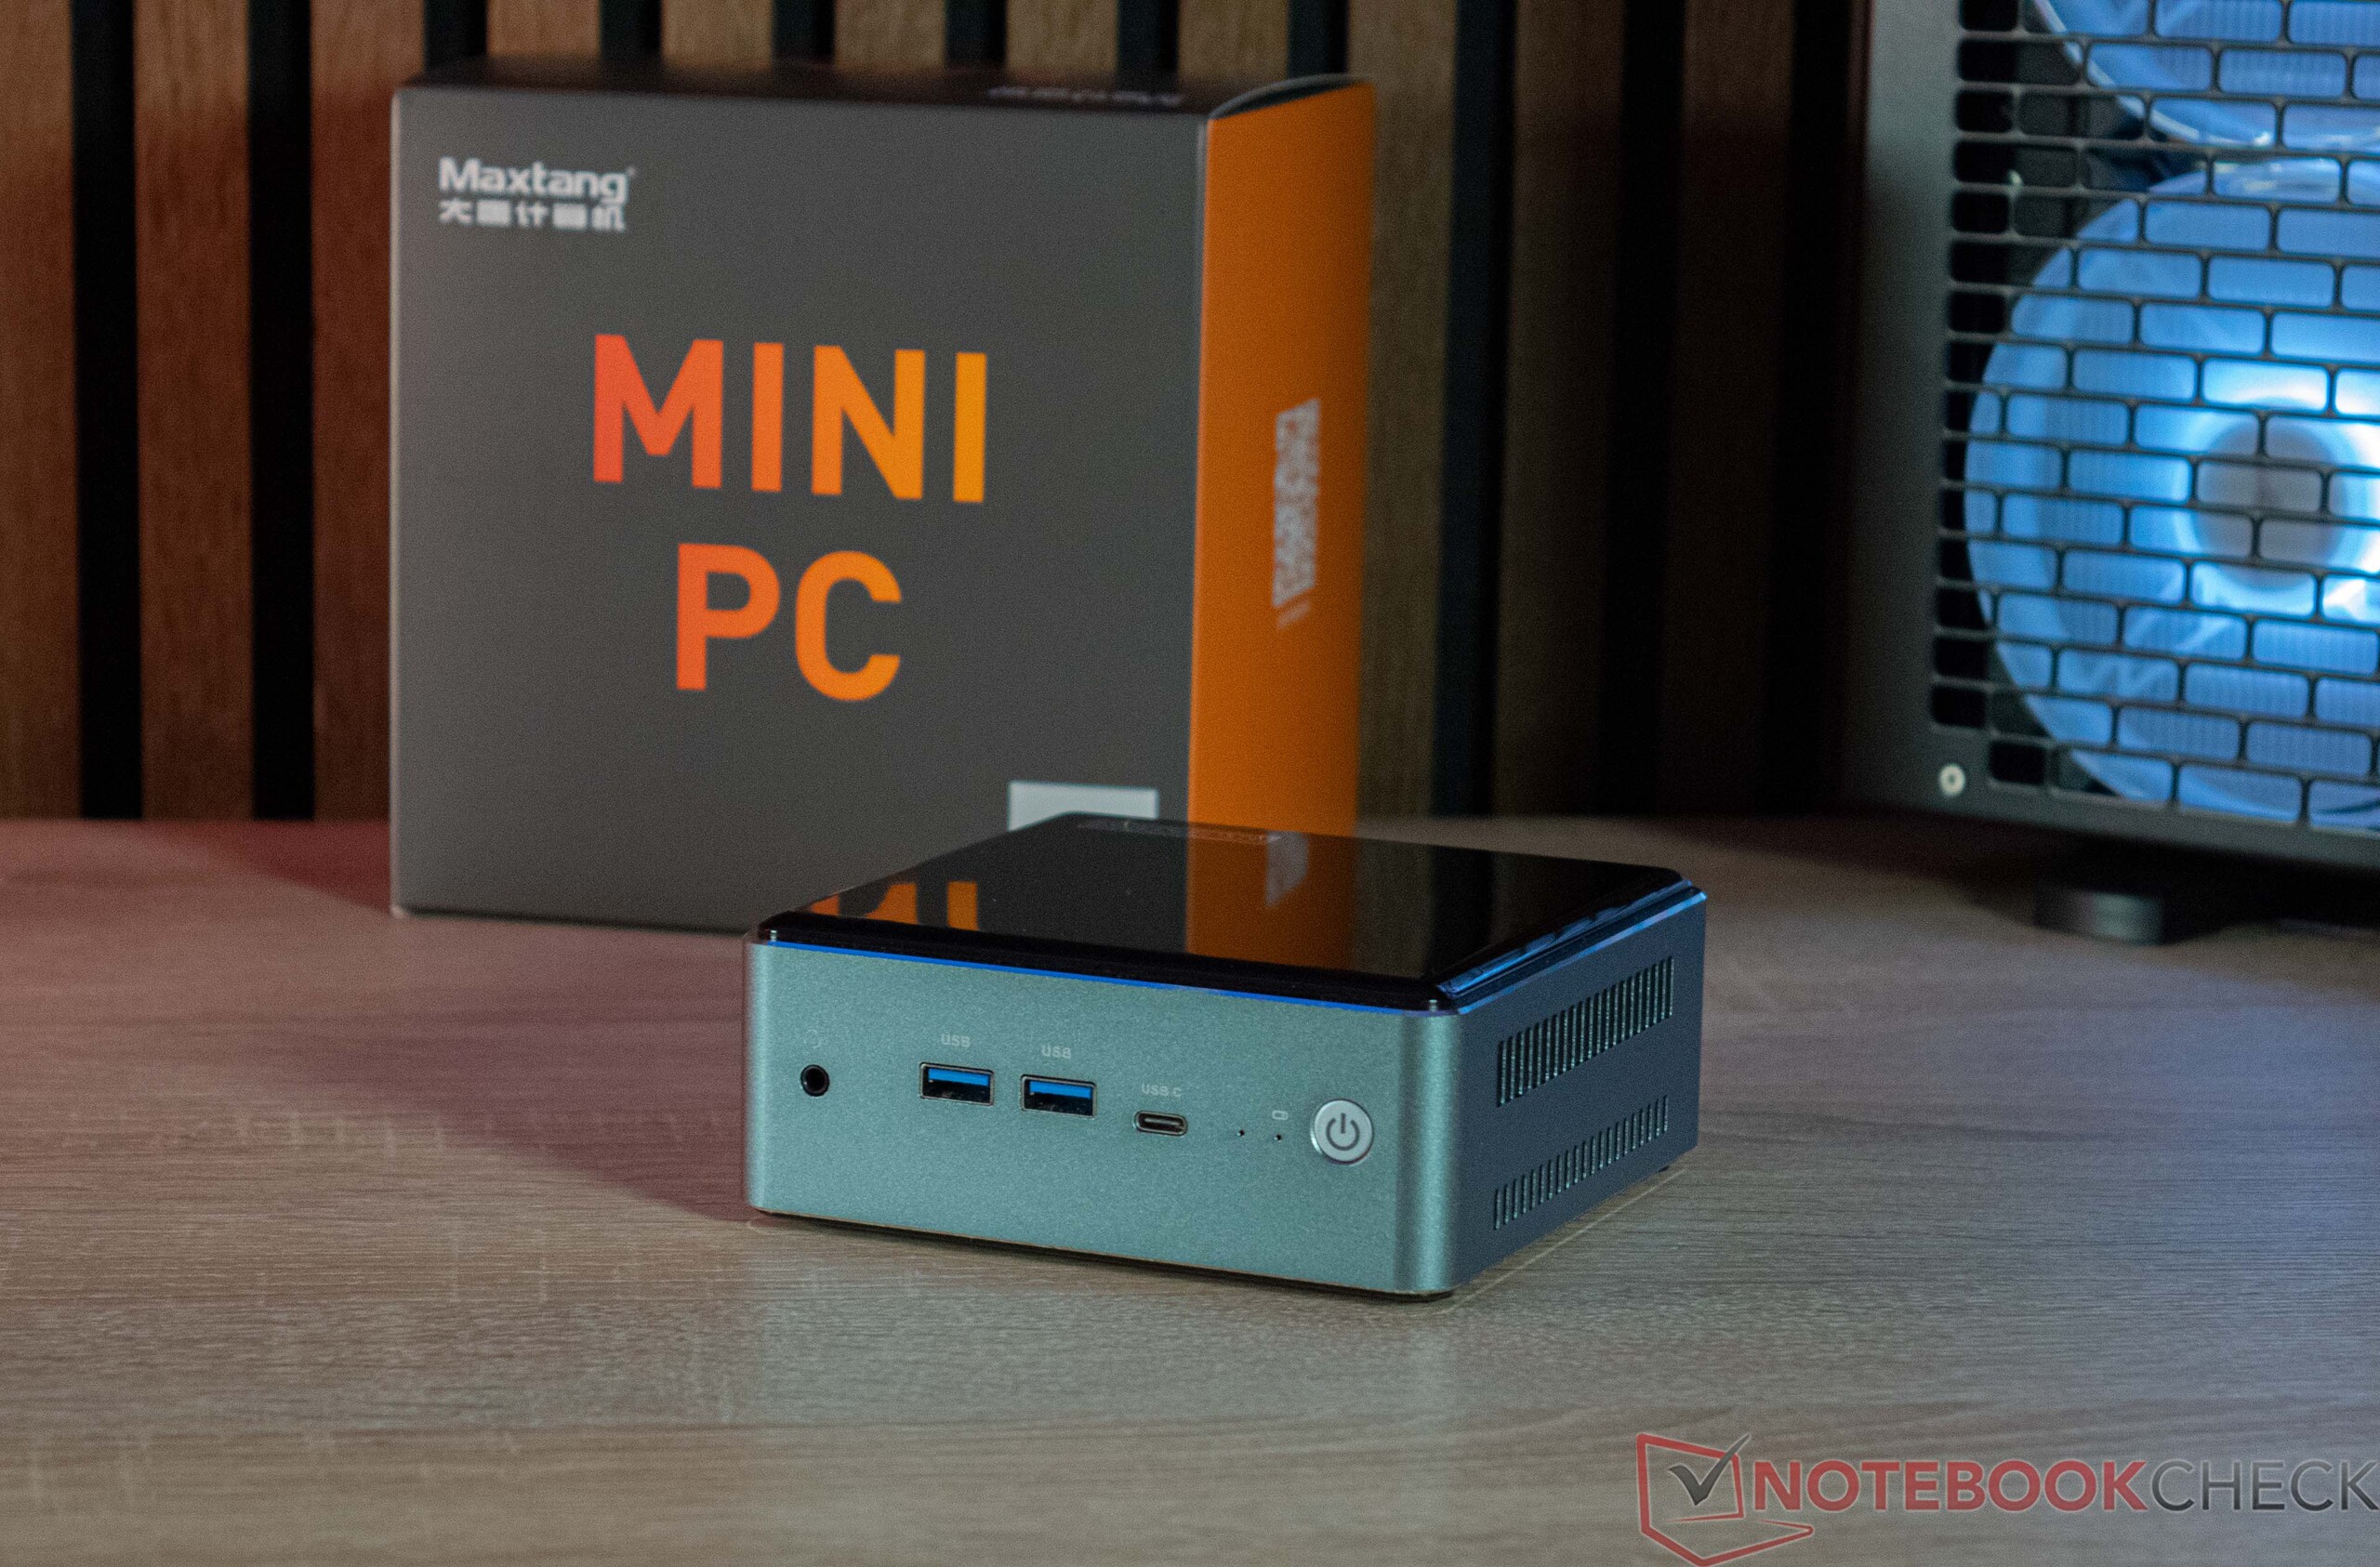
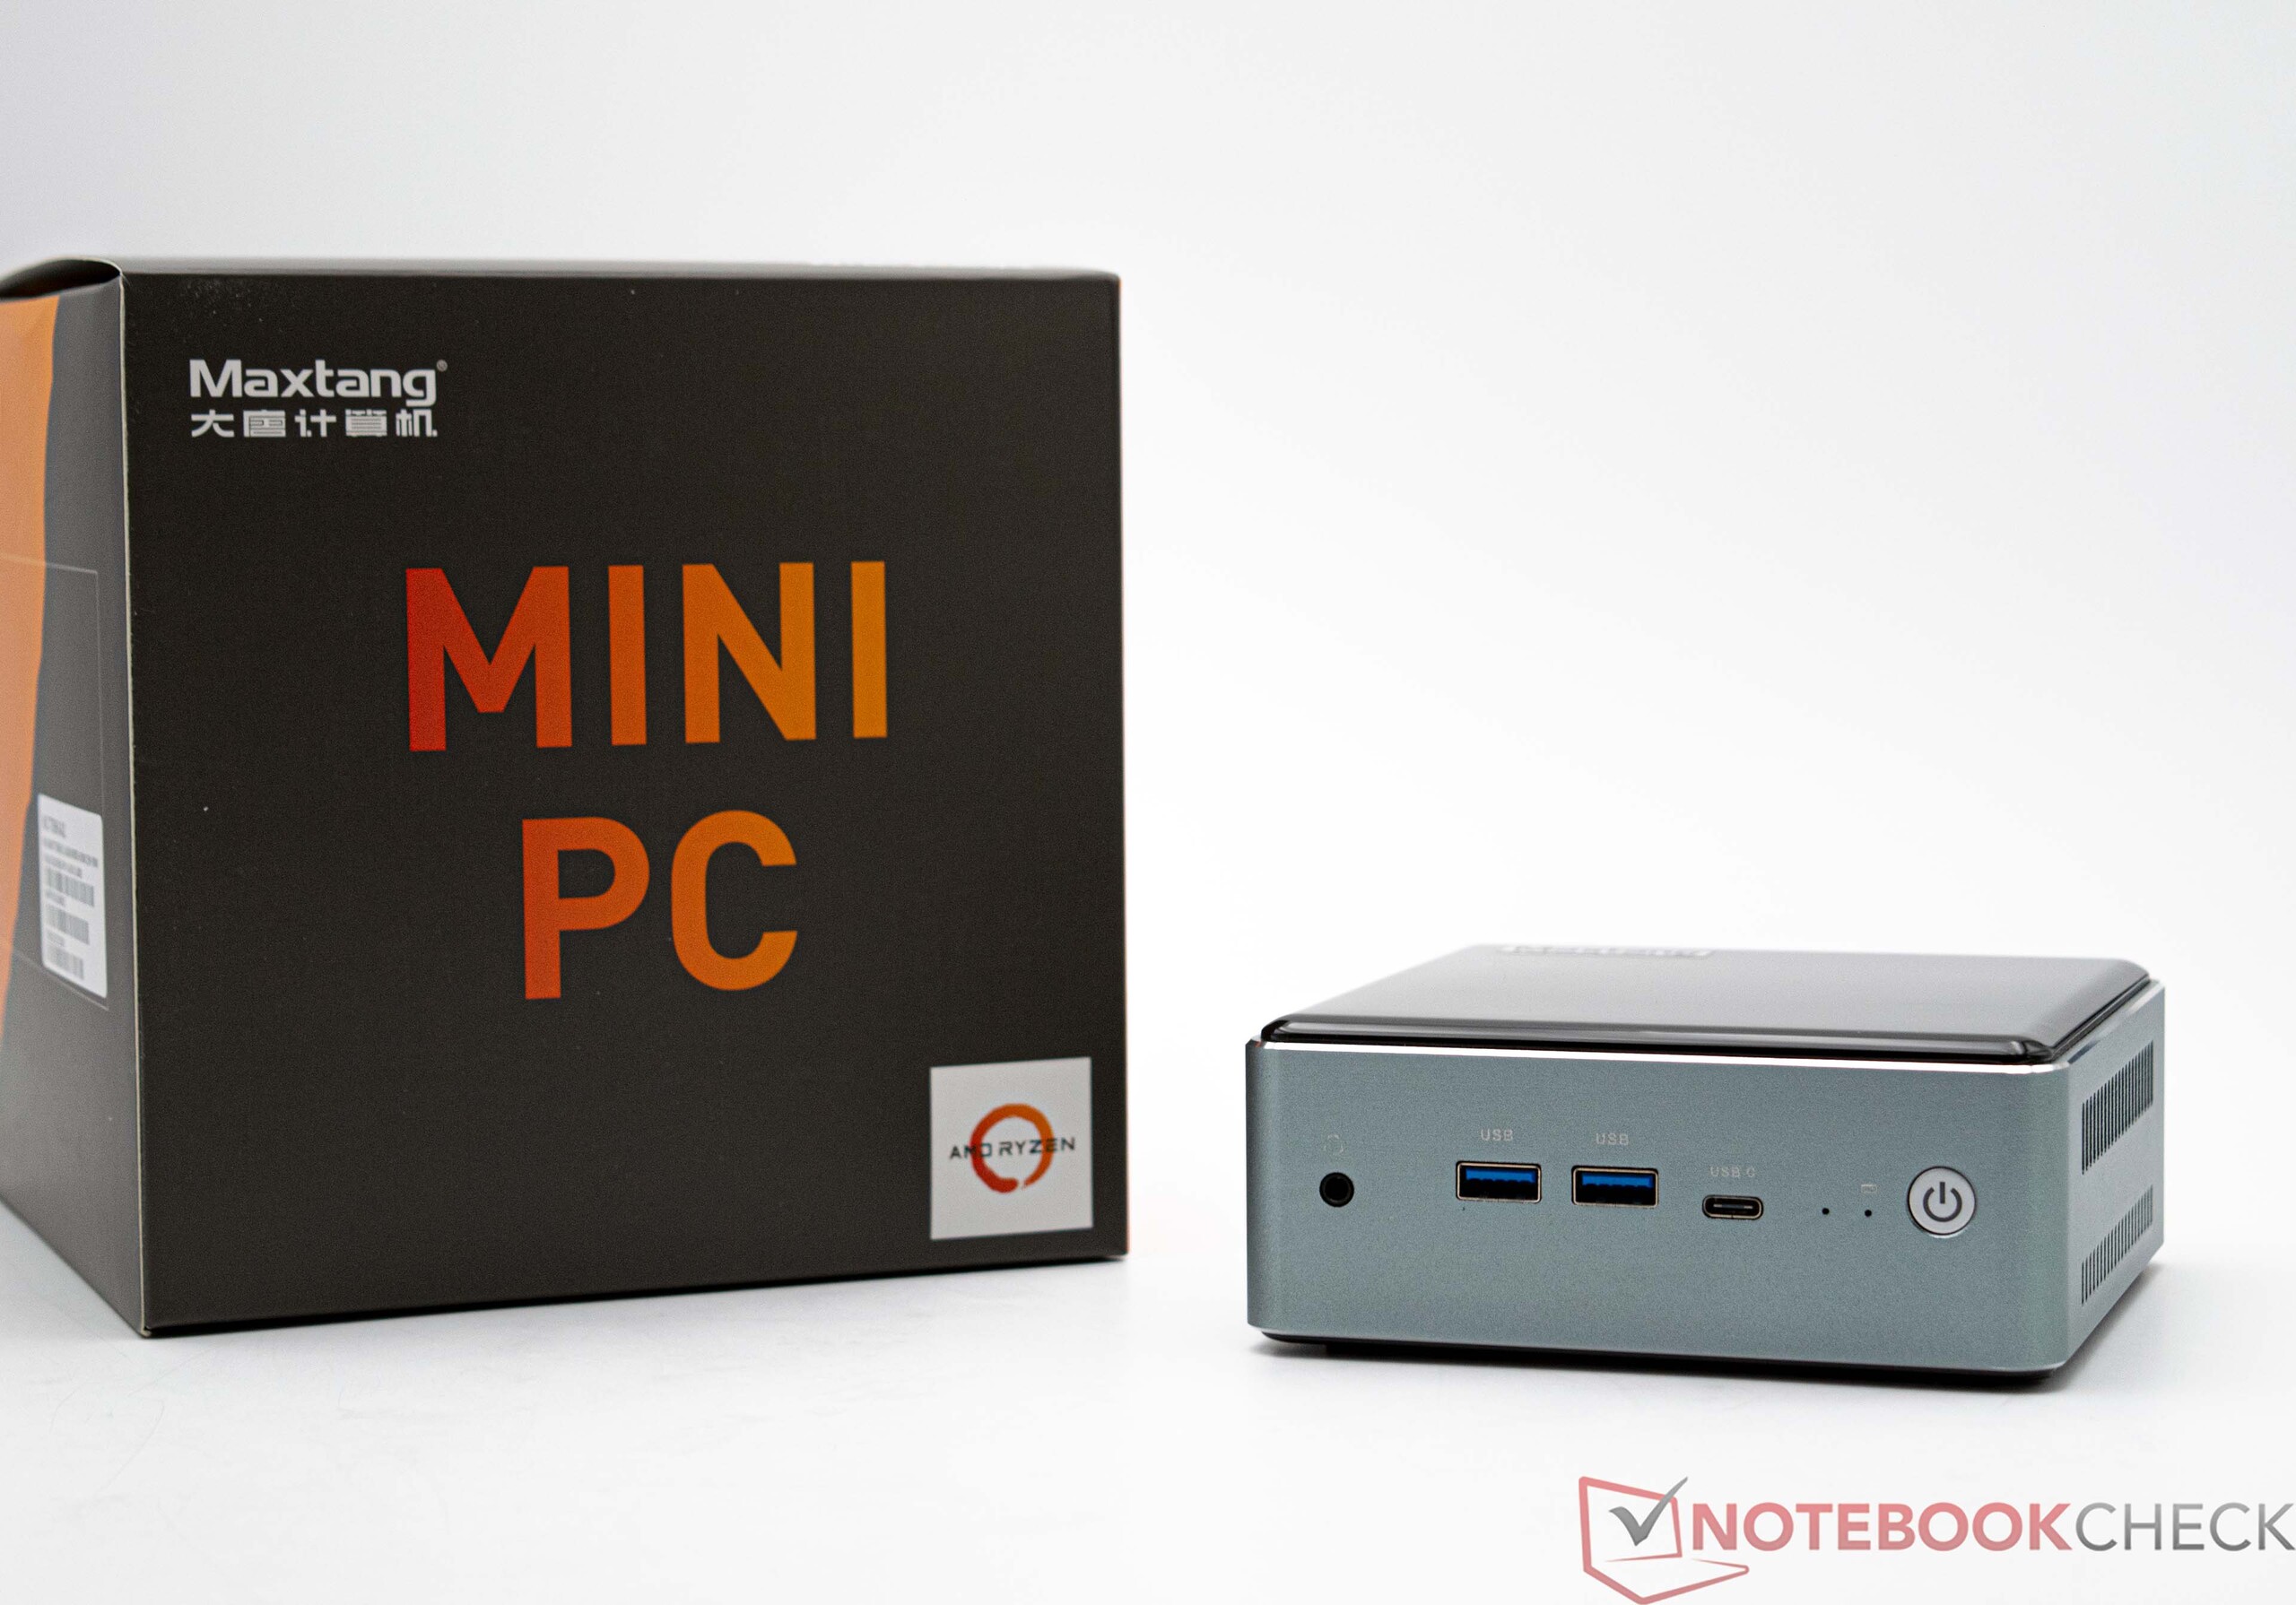
Maxtang ist ein chinesischer Systemhersteller, welcher spezielle Industrielösungen in Form von embedded-Systemen und auch Mini-PCs für den Office-Gebrauch vertreibt. Der Maxtang MTN-FP750, welchen wir uns in diesem Review widmen, kostet 440 US-Dollar. Verbaut ist hier ein AMD Ryzen 7 7735HS sowie 16 GB DDR5-RAM und eine 512-GB-SSD. Alternativ steht noch ein AMD Ryzen 5 6600H als Prozessor zur Verfügung. Des Weiteren lässt sich der Mini-PC mit mehr Arbeitsspeicher und einer größeren SSD bestellen. Auch eine Barebone-Option bietet Maxtang an, jedoch nur mit dem AMD Ryzen 7 7735HS.
In diesem Review muss sich der Maxtang MTN-FP750 gegen aktuelle Mini-PC behaupten. Eine detaillierte Auflistung der Vergleichsgeräte für dieses Review haben wir in der nachfolgenden Tabelle zusammengefasst.
mögliche Konkurrenten im Vergleich
Bew. | Datum | Modell | Gewicht | Dicke | Preis ab |
|---|---|---|---|---|---|
| 79.5 % v7 (old) | 02 / 2024 | Maxtang MTN-FP750 R7 7735HS, Radeon 680M | 601 g | 52 mm | |
| 85.1 % v7 (old) | 01 / 2023 | Minisforum Neptune Series NAD9 i9-12900H, Iris Xe G7 96EUs | 1.2 kg | 66 mm | |
| 82.8 % v7 (old) | 07 / 2023 | Geekom AS 6, R9 6900HX R9 6900HX, Radeon 680M | 753 g | 58 mm | |
| 82.3 % v7 (old) | 05 / 2023 | Geekom Mini IT12 i7-1260P, Iris Xe G7 96EUs | 572 g | 45.6 mm | |
| 81.2 % v7 (old) | 10 / 2023 | Geekom A5 R7 5800H, Vega 8 | 555 g | 49.2 mm | |
| 81.9 % v7 (old) | 05 / 2023 | Minisforum Venus Series NAB6 i7-12650H, UHD Graphics 64EUs | 616 g | 55 mm | |
| 78.4 % v7 (old) | 01 / 2024 | NiPoGi AD08 i7-12650H, UHD Graphics 64EUs | 878 g | 188.5 mm |
Der Maxtang MTN-FP750 im Detail


Gehäuse - Metall und Kunststoff mit Klavierlack
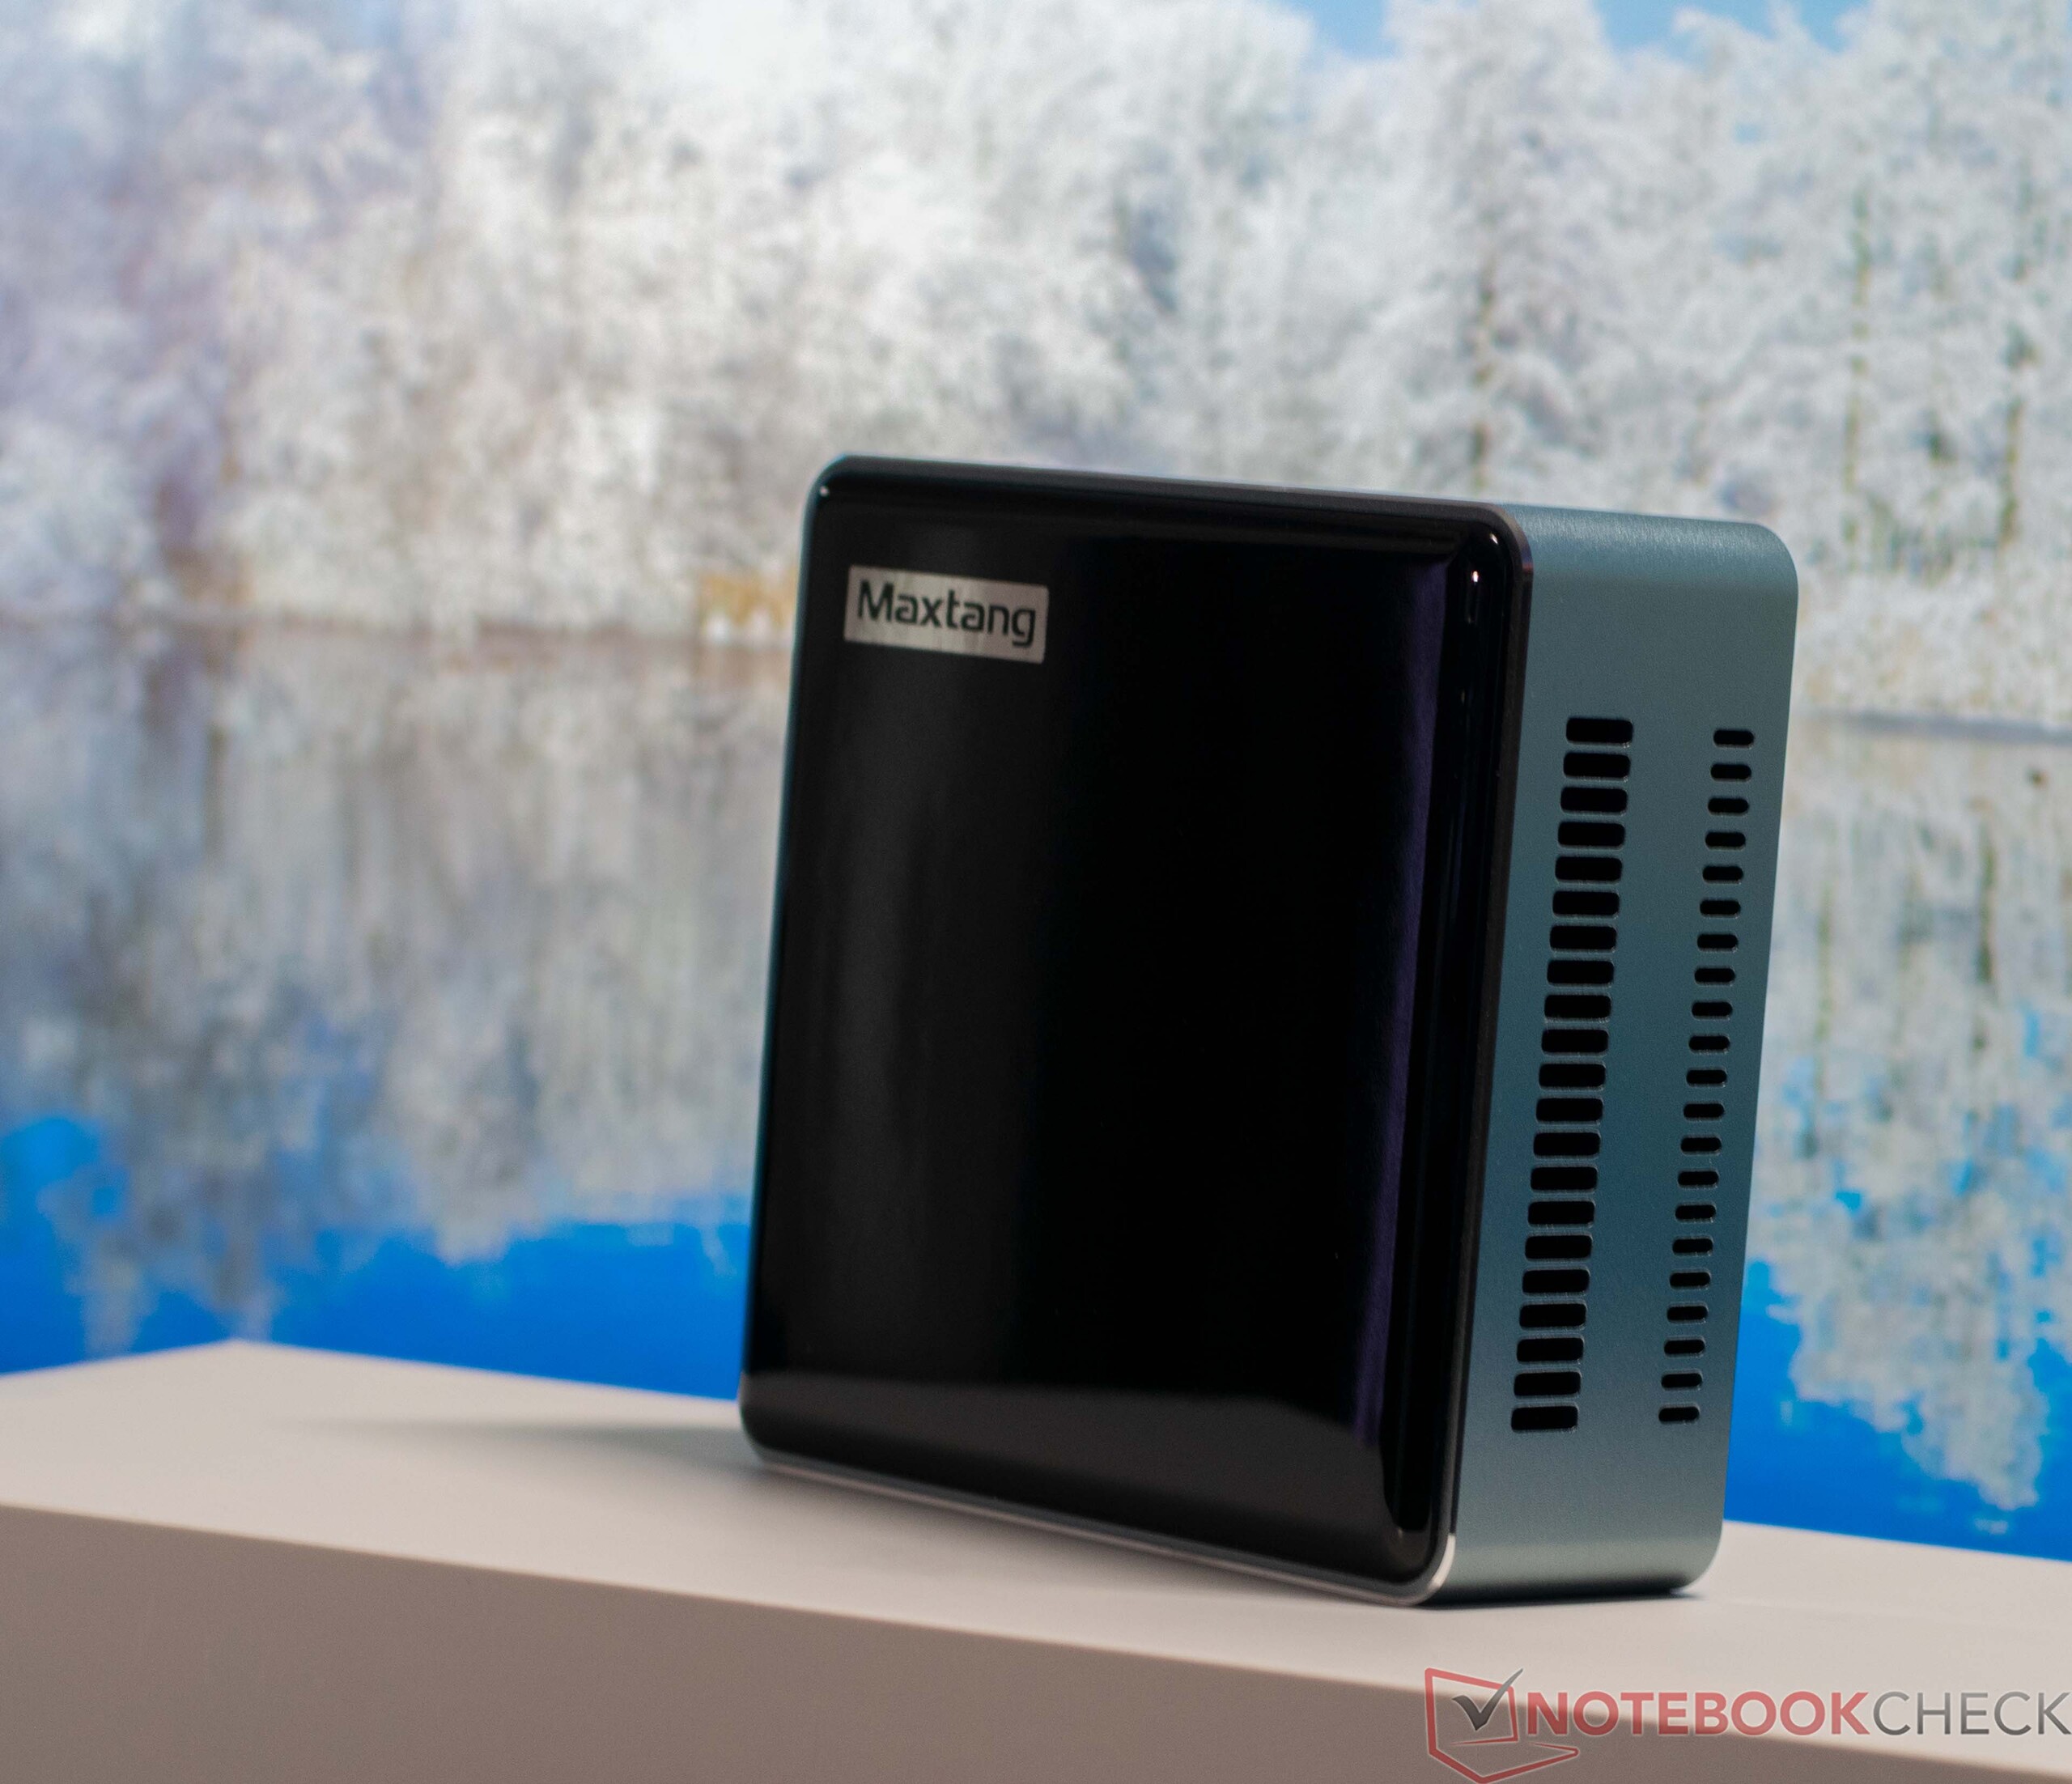
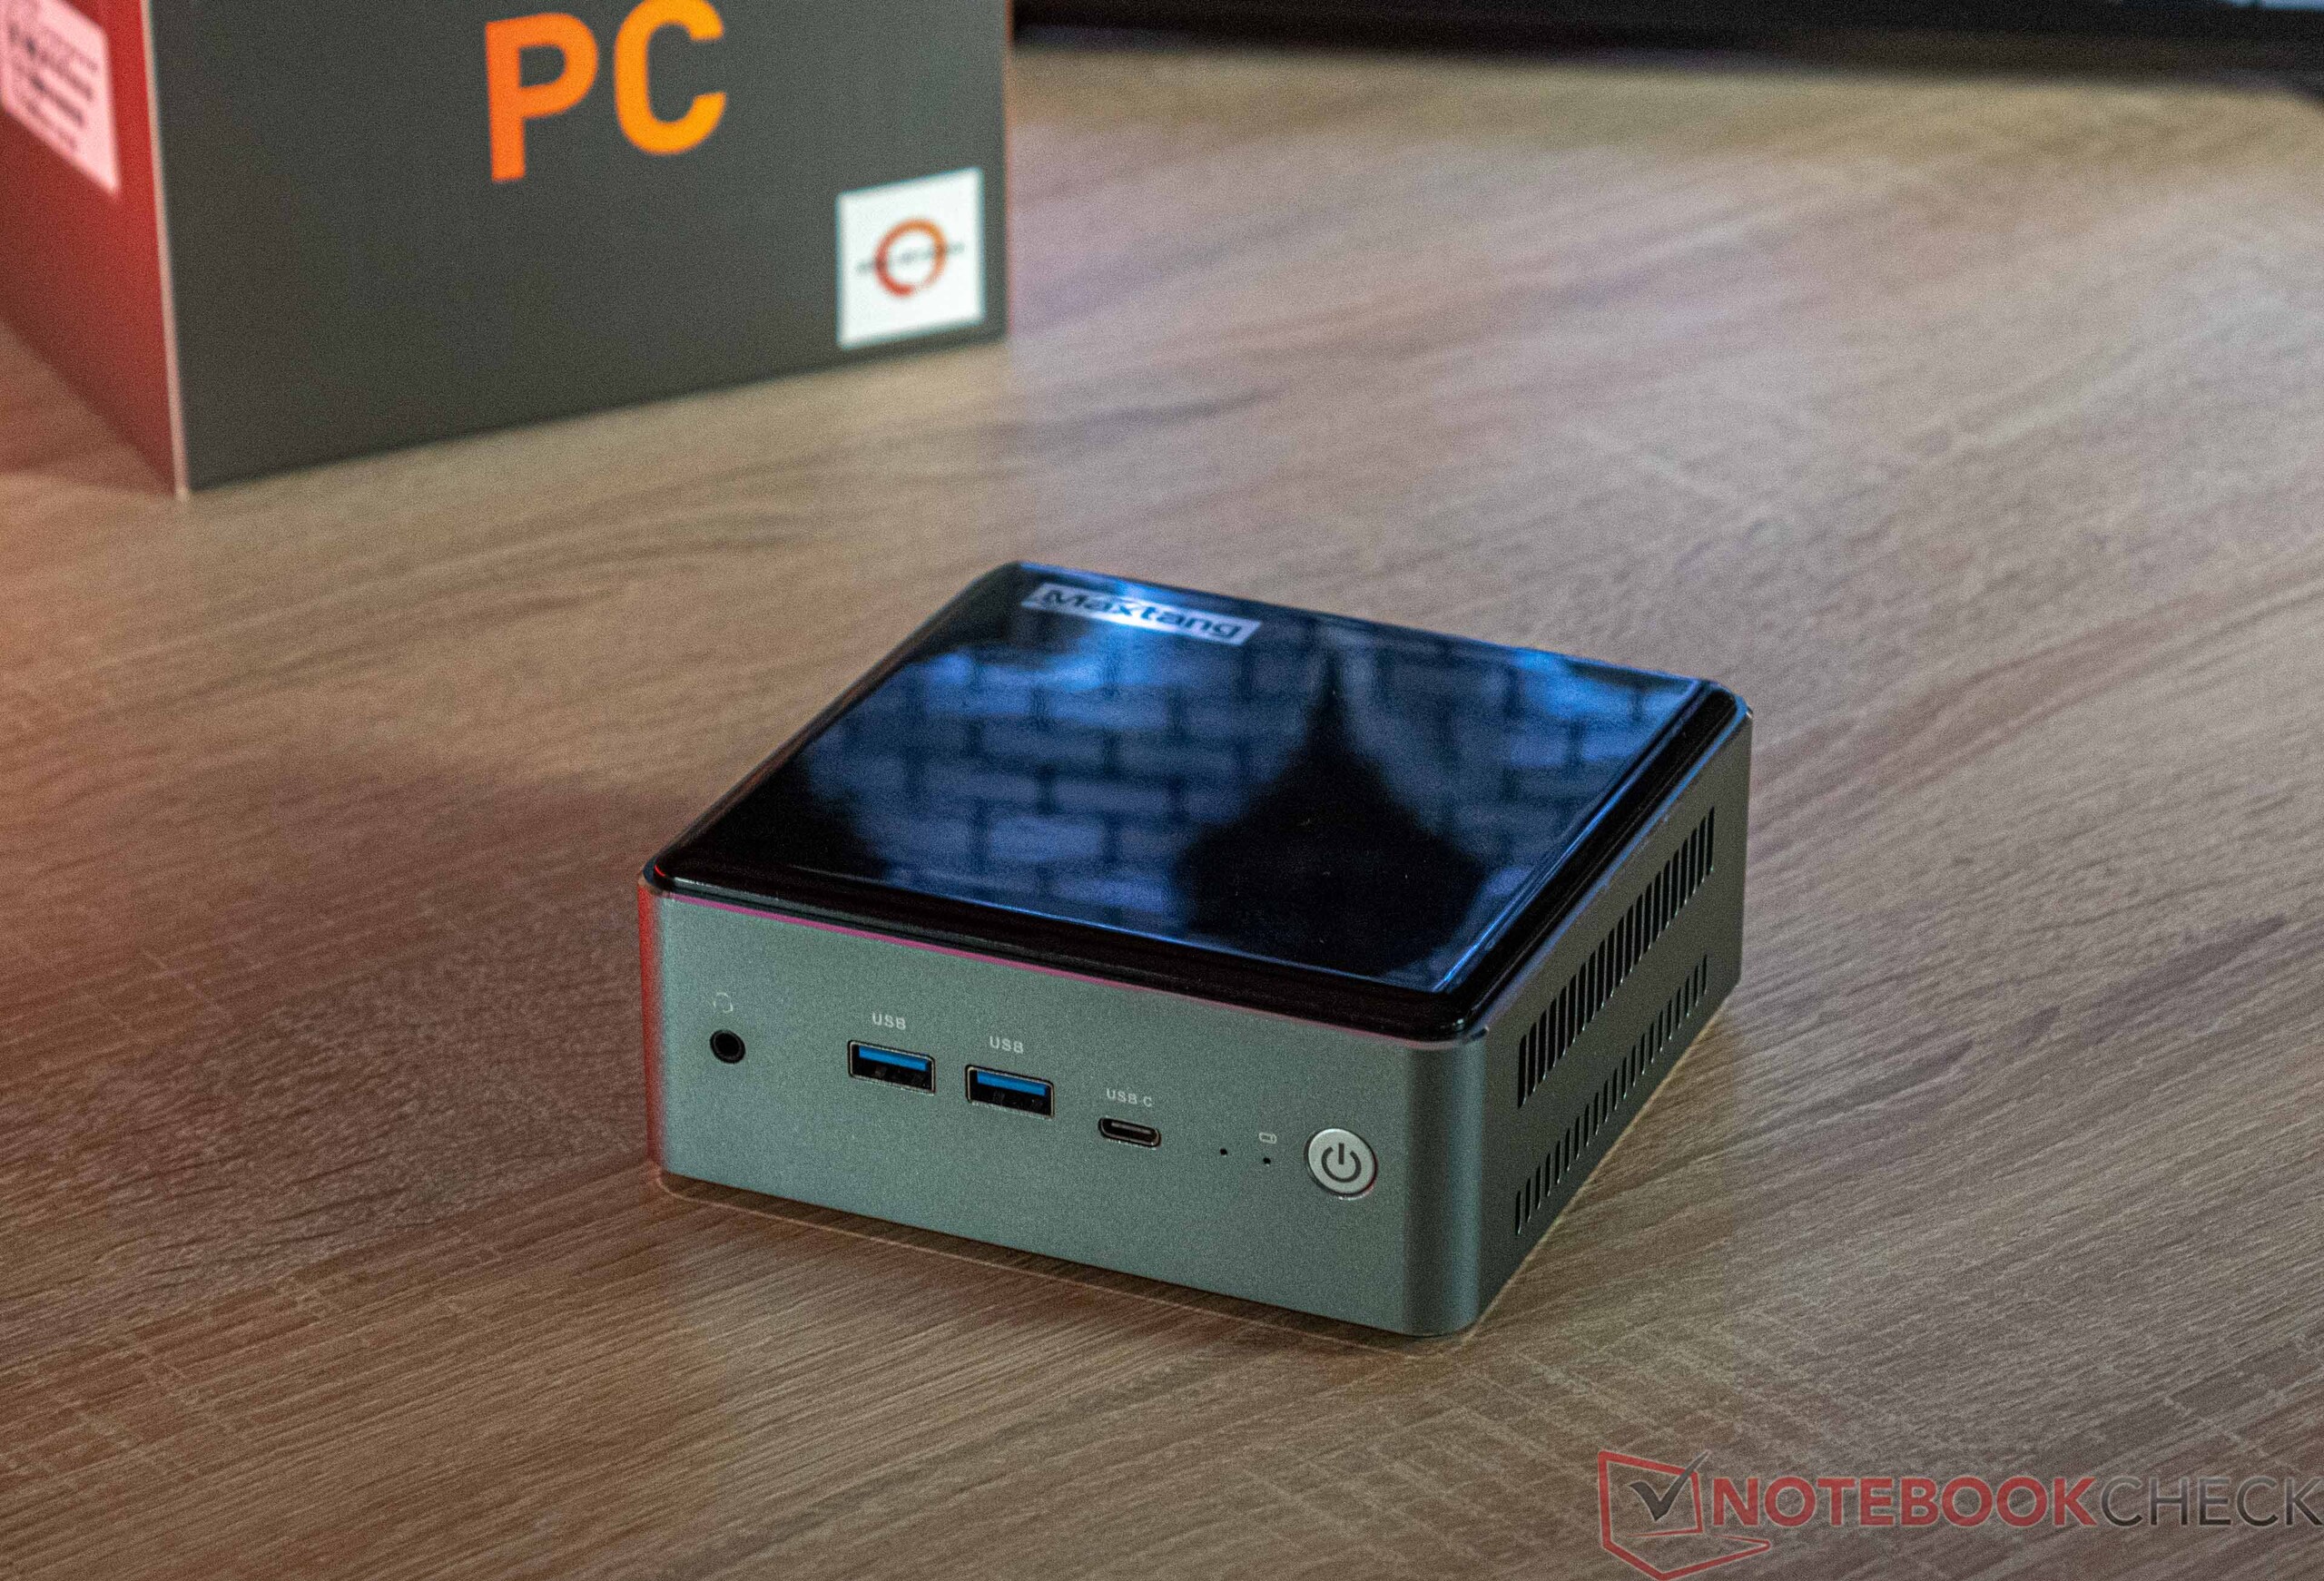
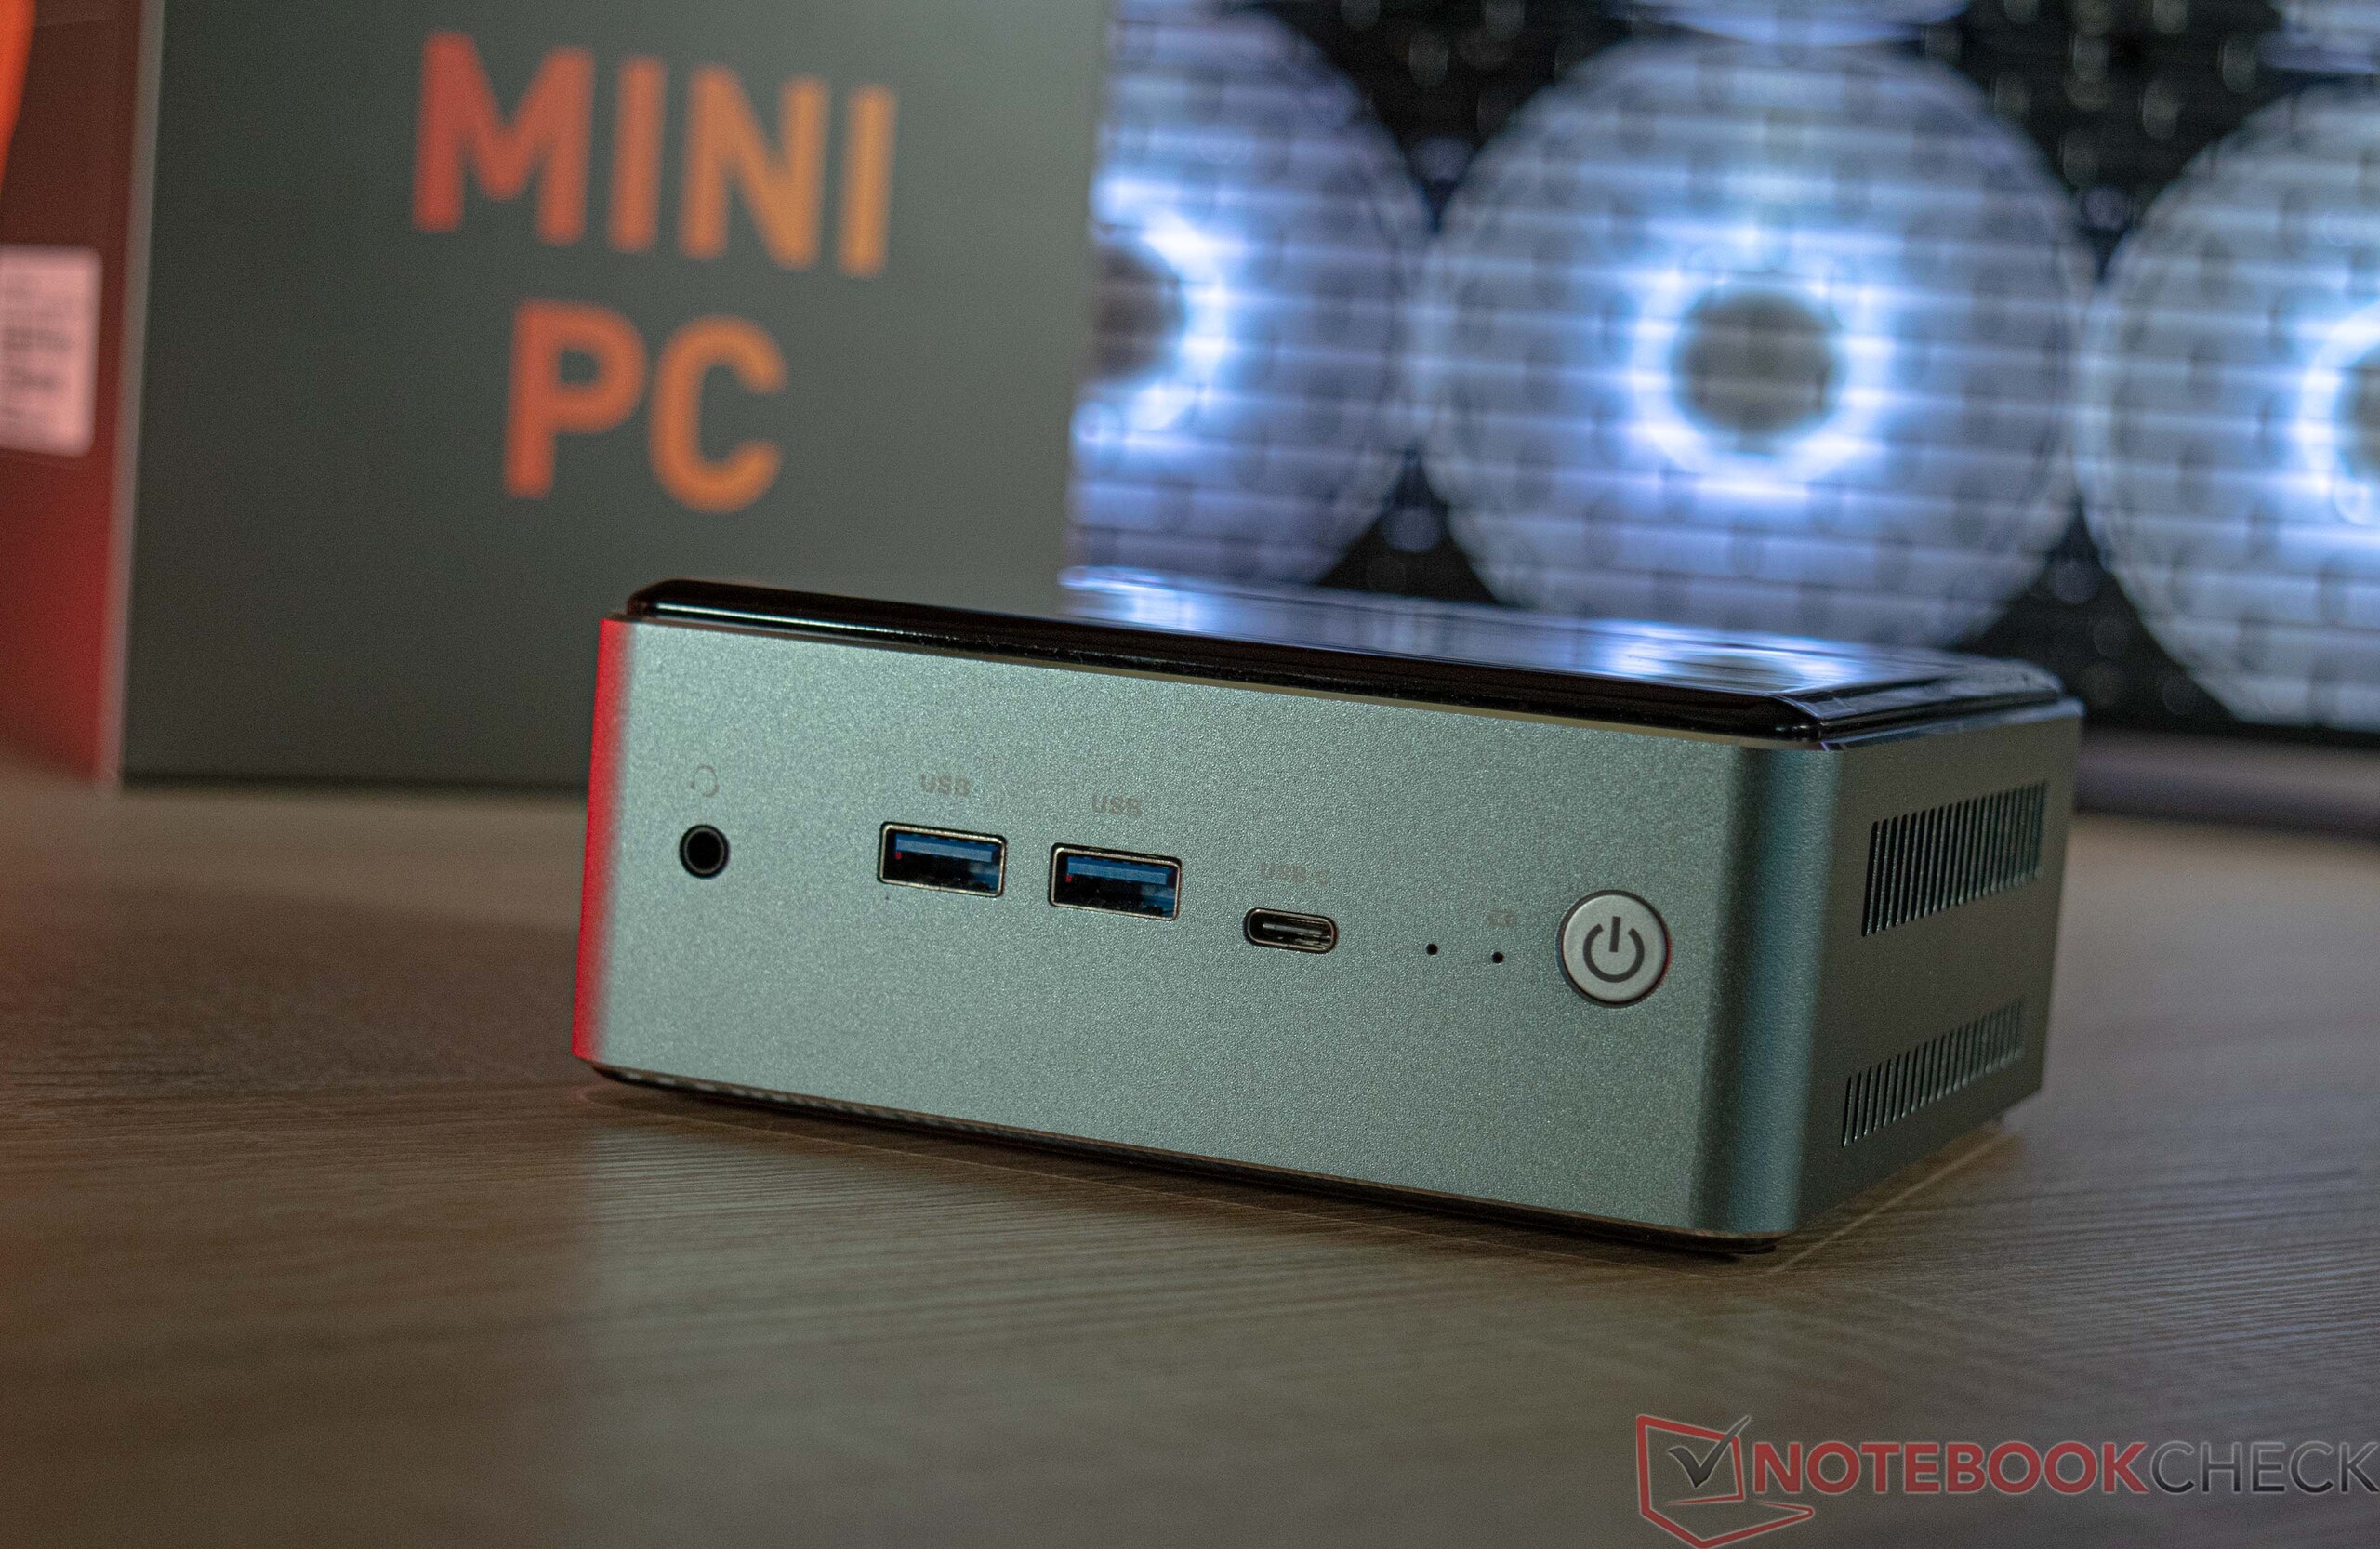
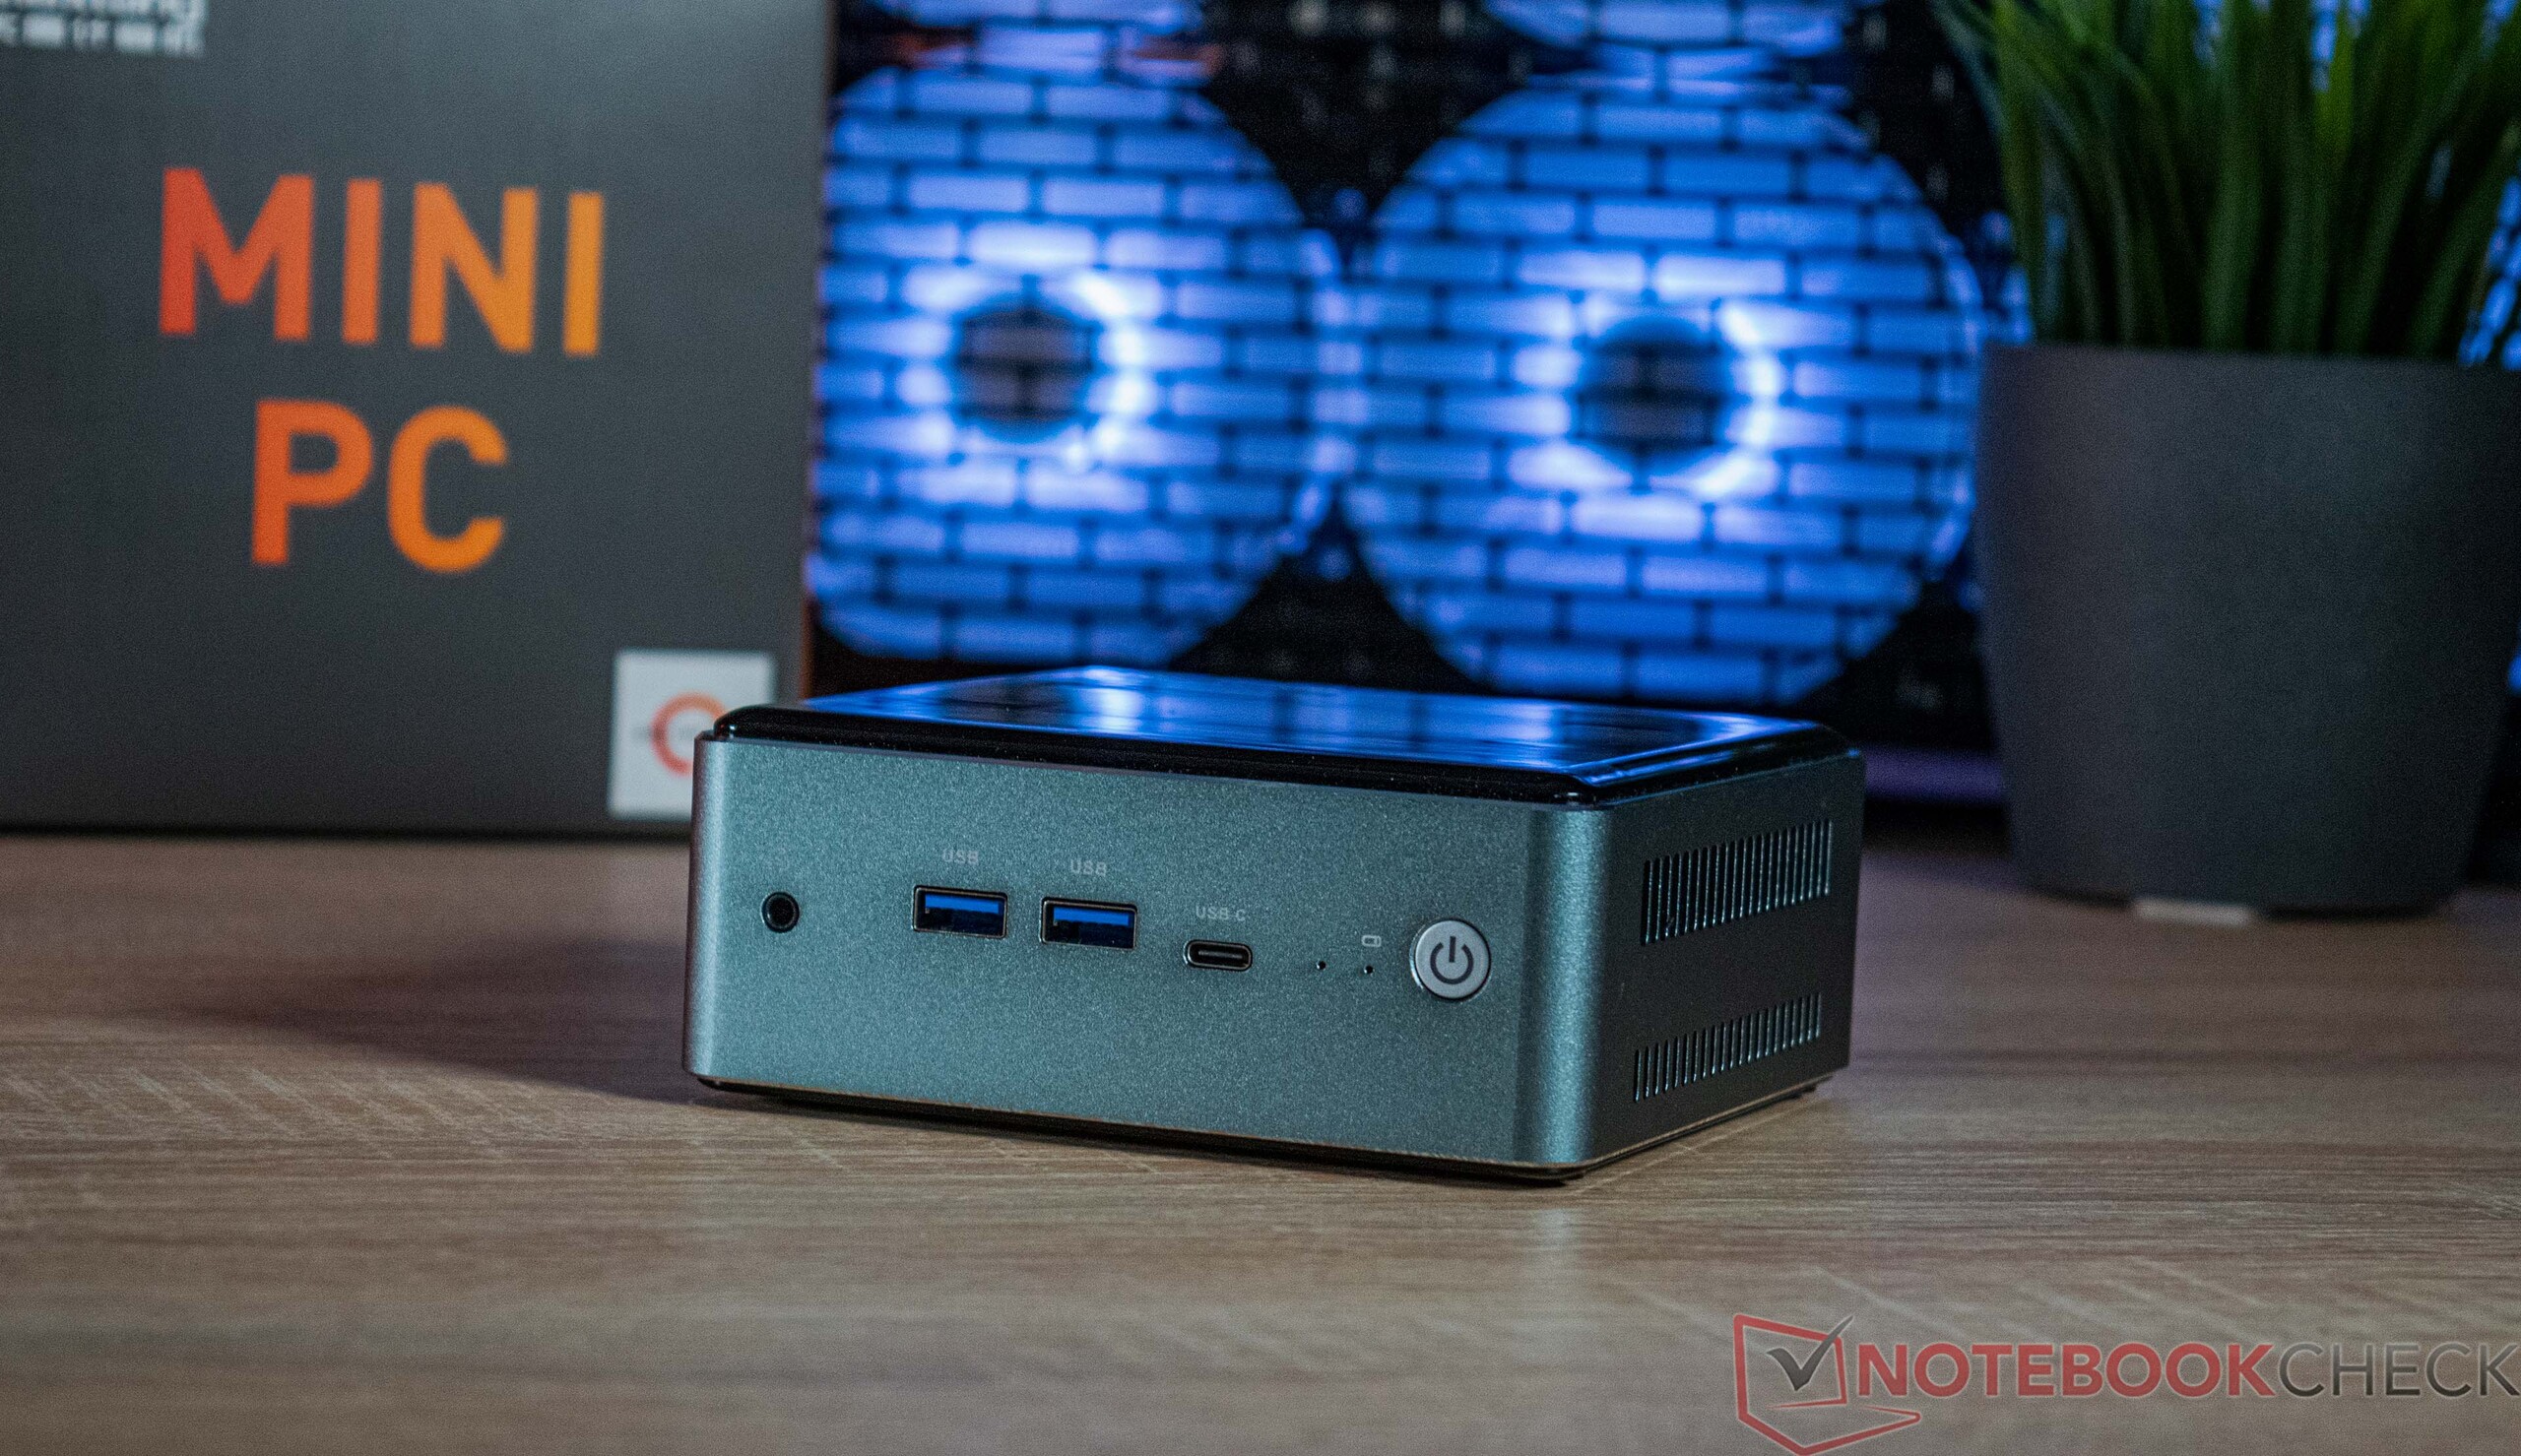
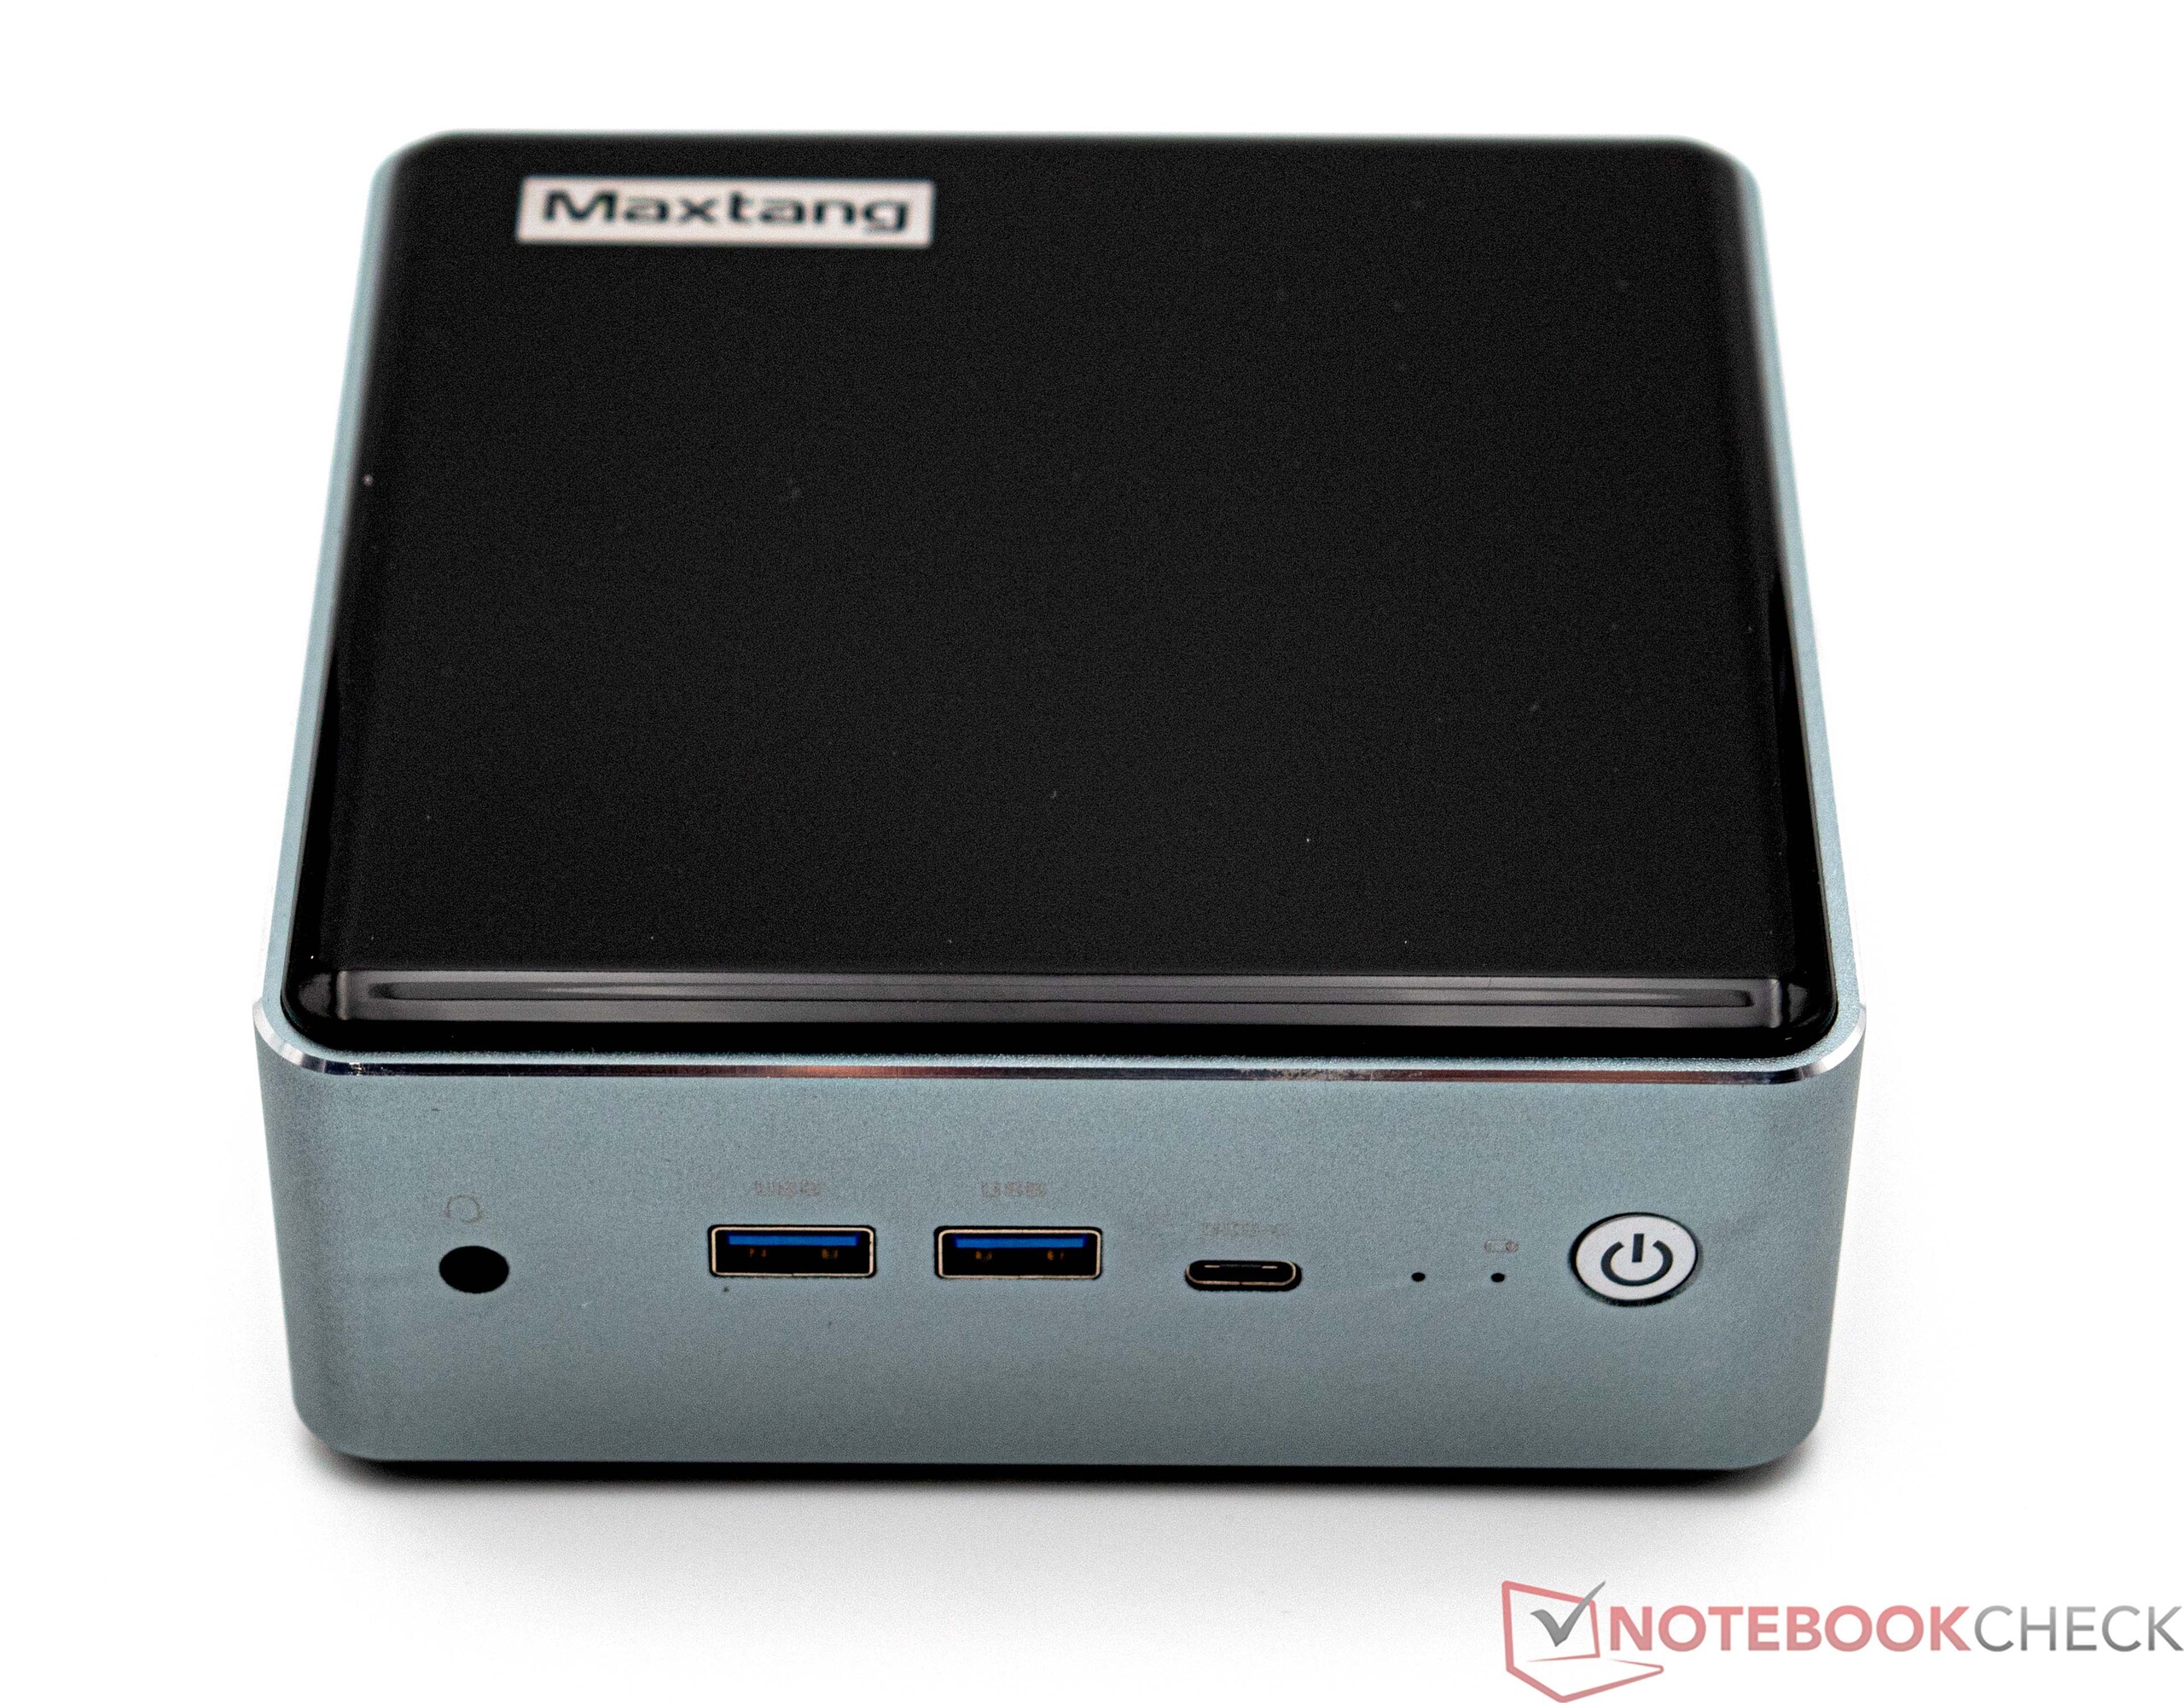
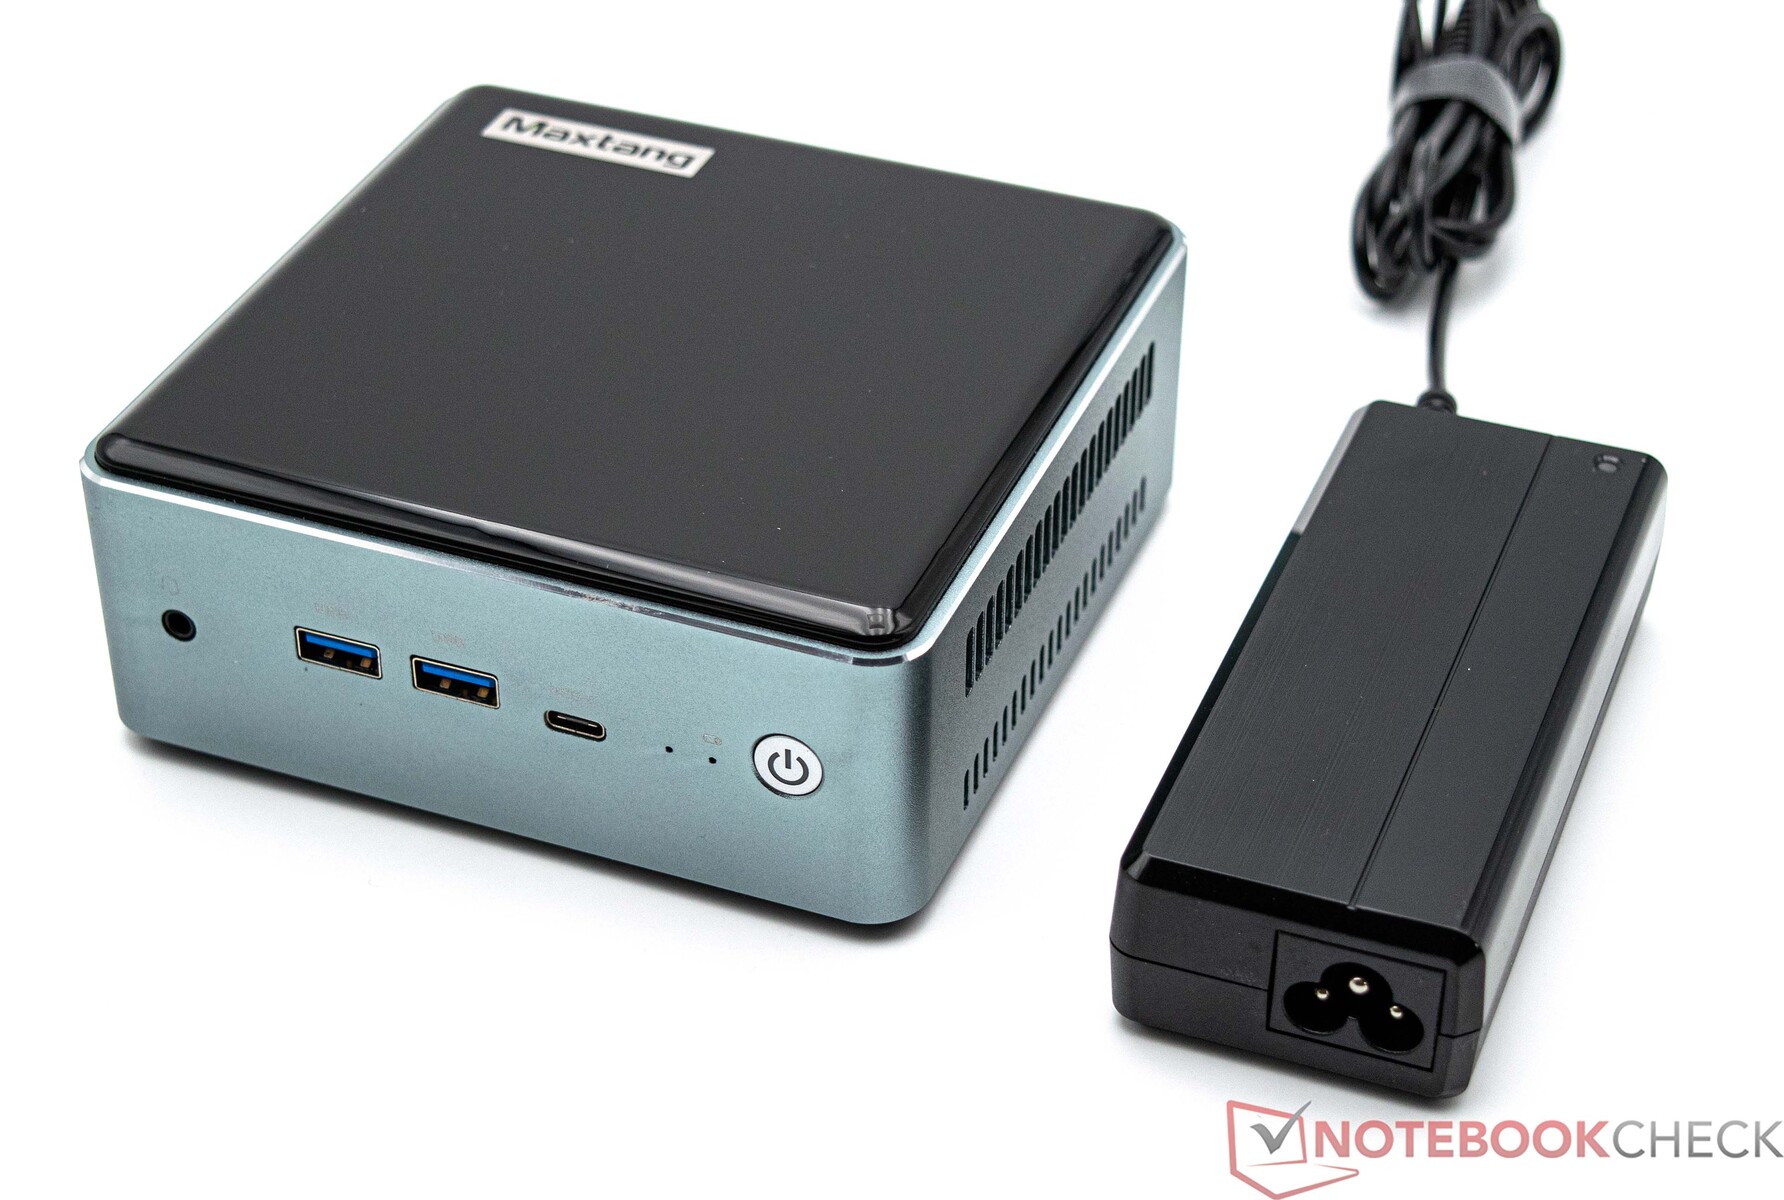
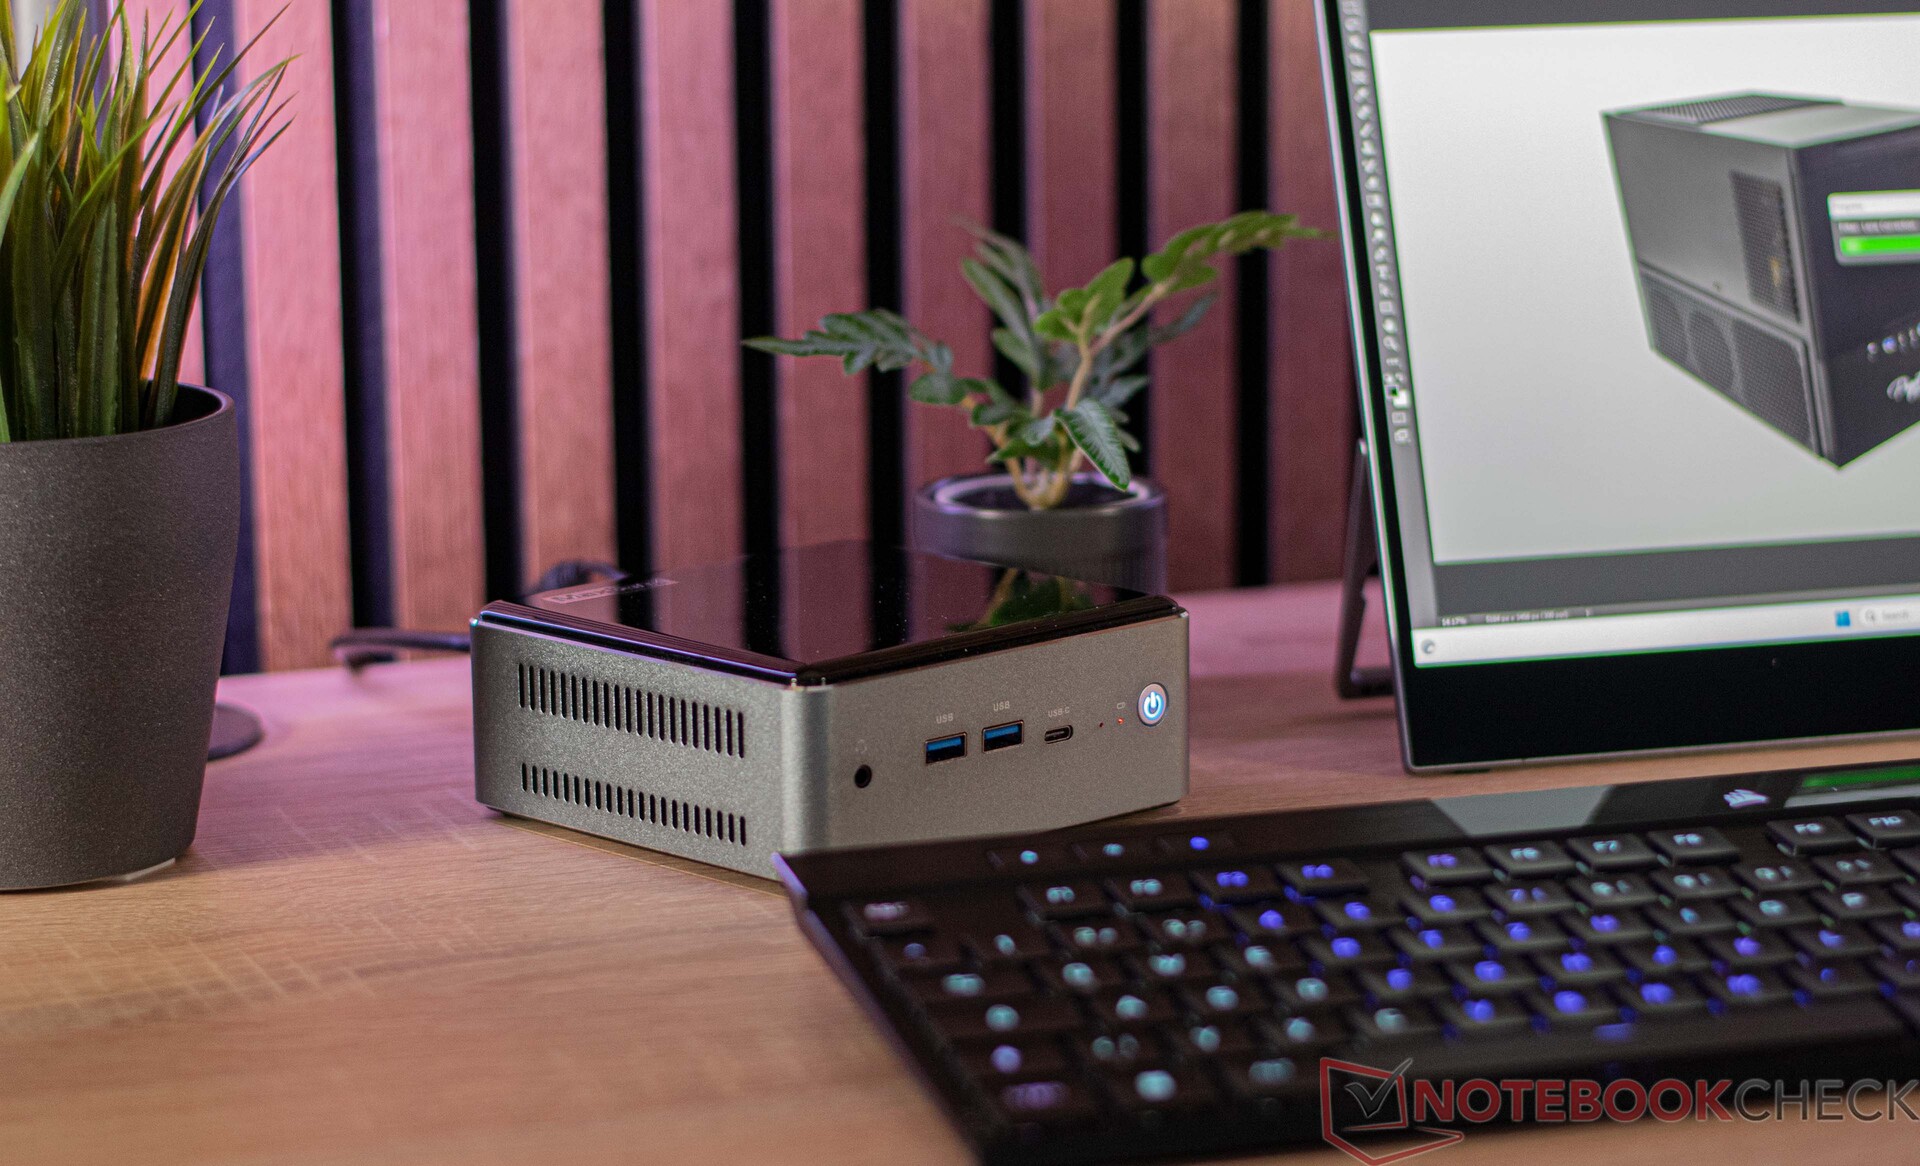
Der Maxtang MTN-FP750 hat ein stabiles Metallgehäuse, welches auf der Ober- und der Unterseite durch schwarze Hochglanzoberflächen aus Kunststoff komplettiert wird. Fingerabdrücke sind hier sehr schnell sichtbar und auch Mikrokratzer lassen sich über kurz oder lang nicht vermeiden. Die Stabilität leidet nicht spürbar durch die Kunststoffabdeckungen. Auf der Oberseite ziert den Mini-PC noch ein Maxtang-Schriftzug.
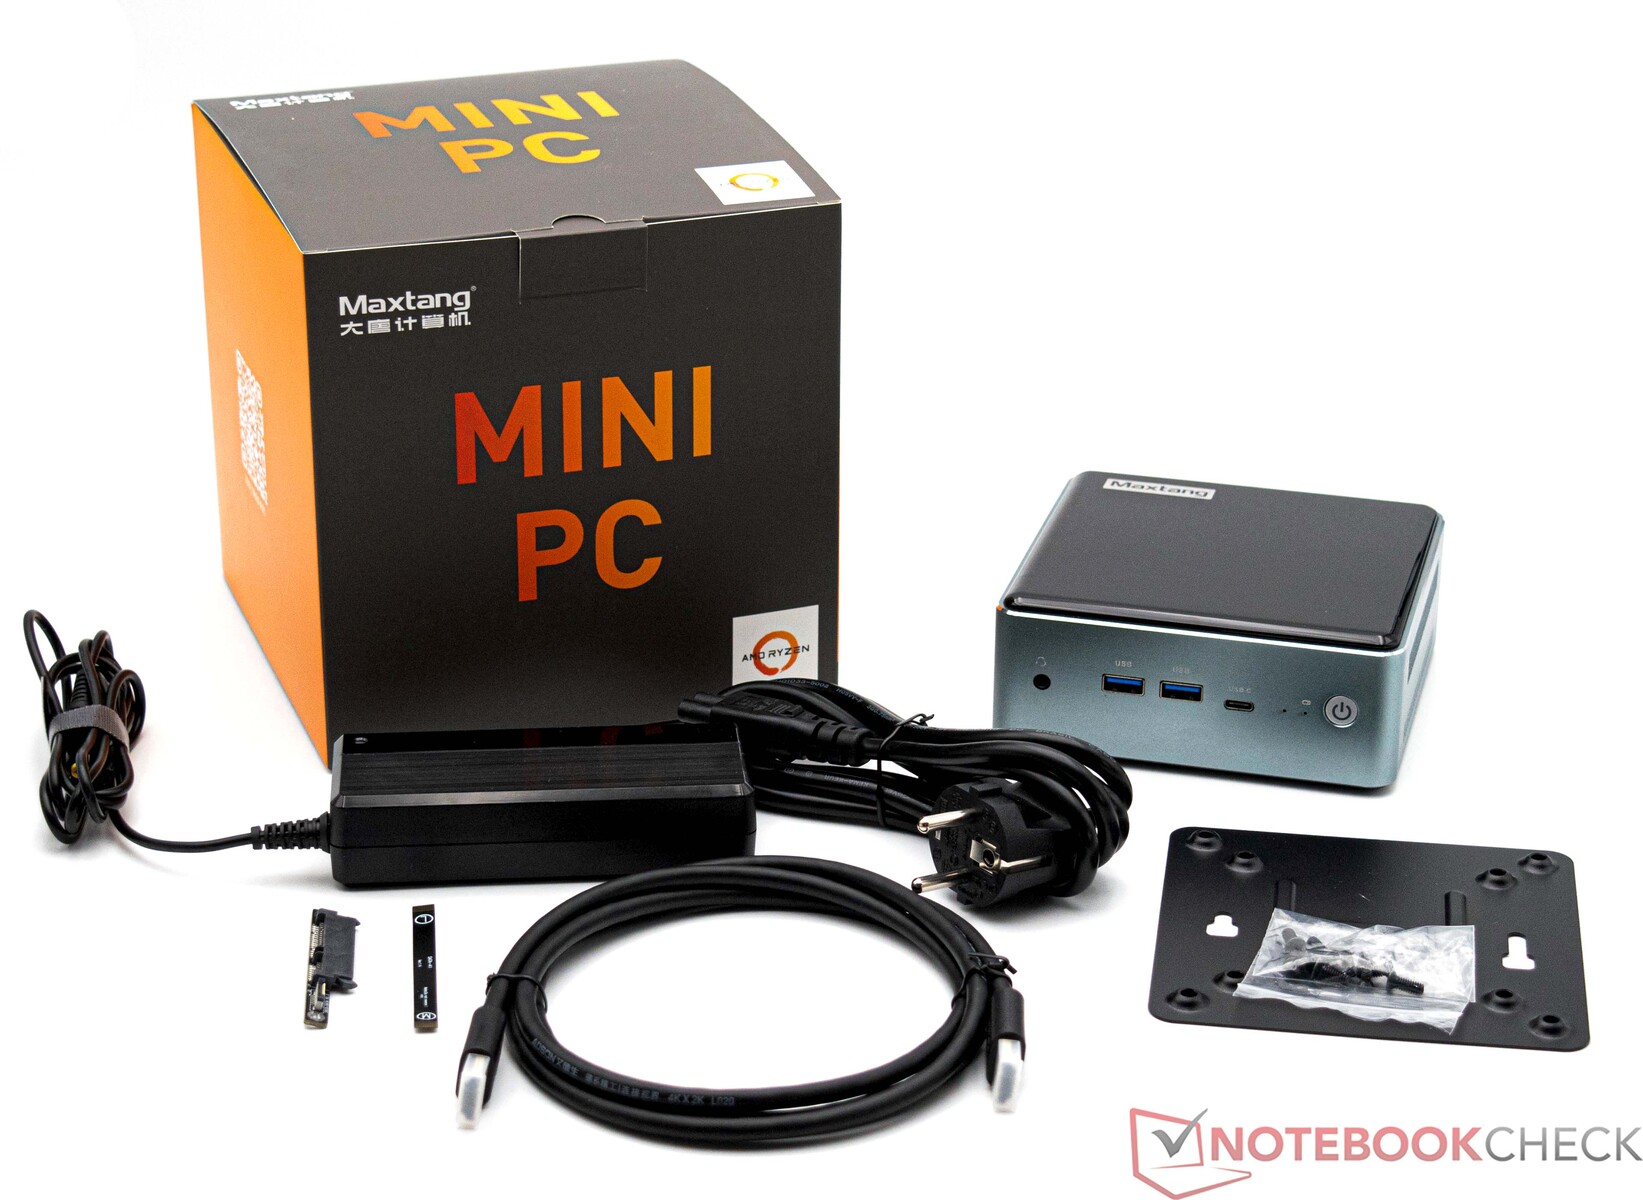
Der Platzbedarf auf dem Schreibtisch fällt mit rund 13 x 13 Zentimetern etwas größer aus als bei der Konkurrenz. Mit einem Gewicht von ca. 600 Gramm ist der Maxtang MTN-FP750 relativ leicht. Das Netzteil bringt knapp 290 Gramm auf die Waage. Der Maxtang MTN-FP750 lässt sich auch an einem Monitor befestigen. Eine VESA-Halterung befindet sich im Lieferumfang.
Ausstattung
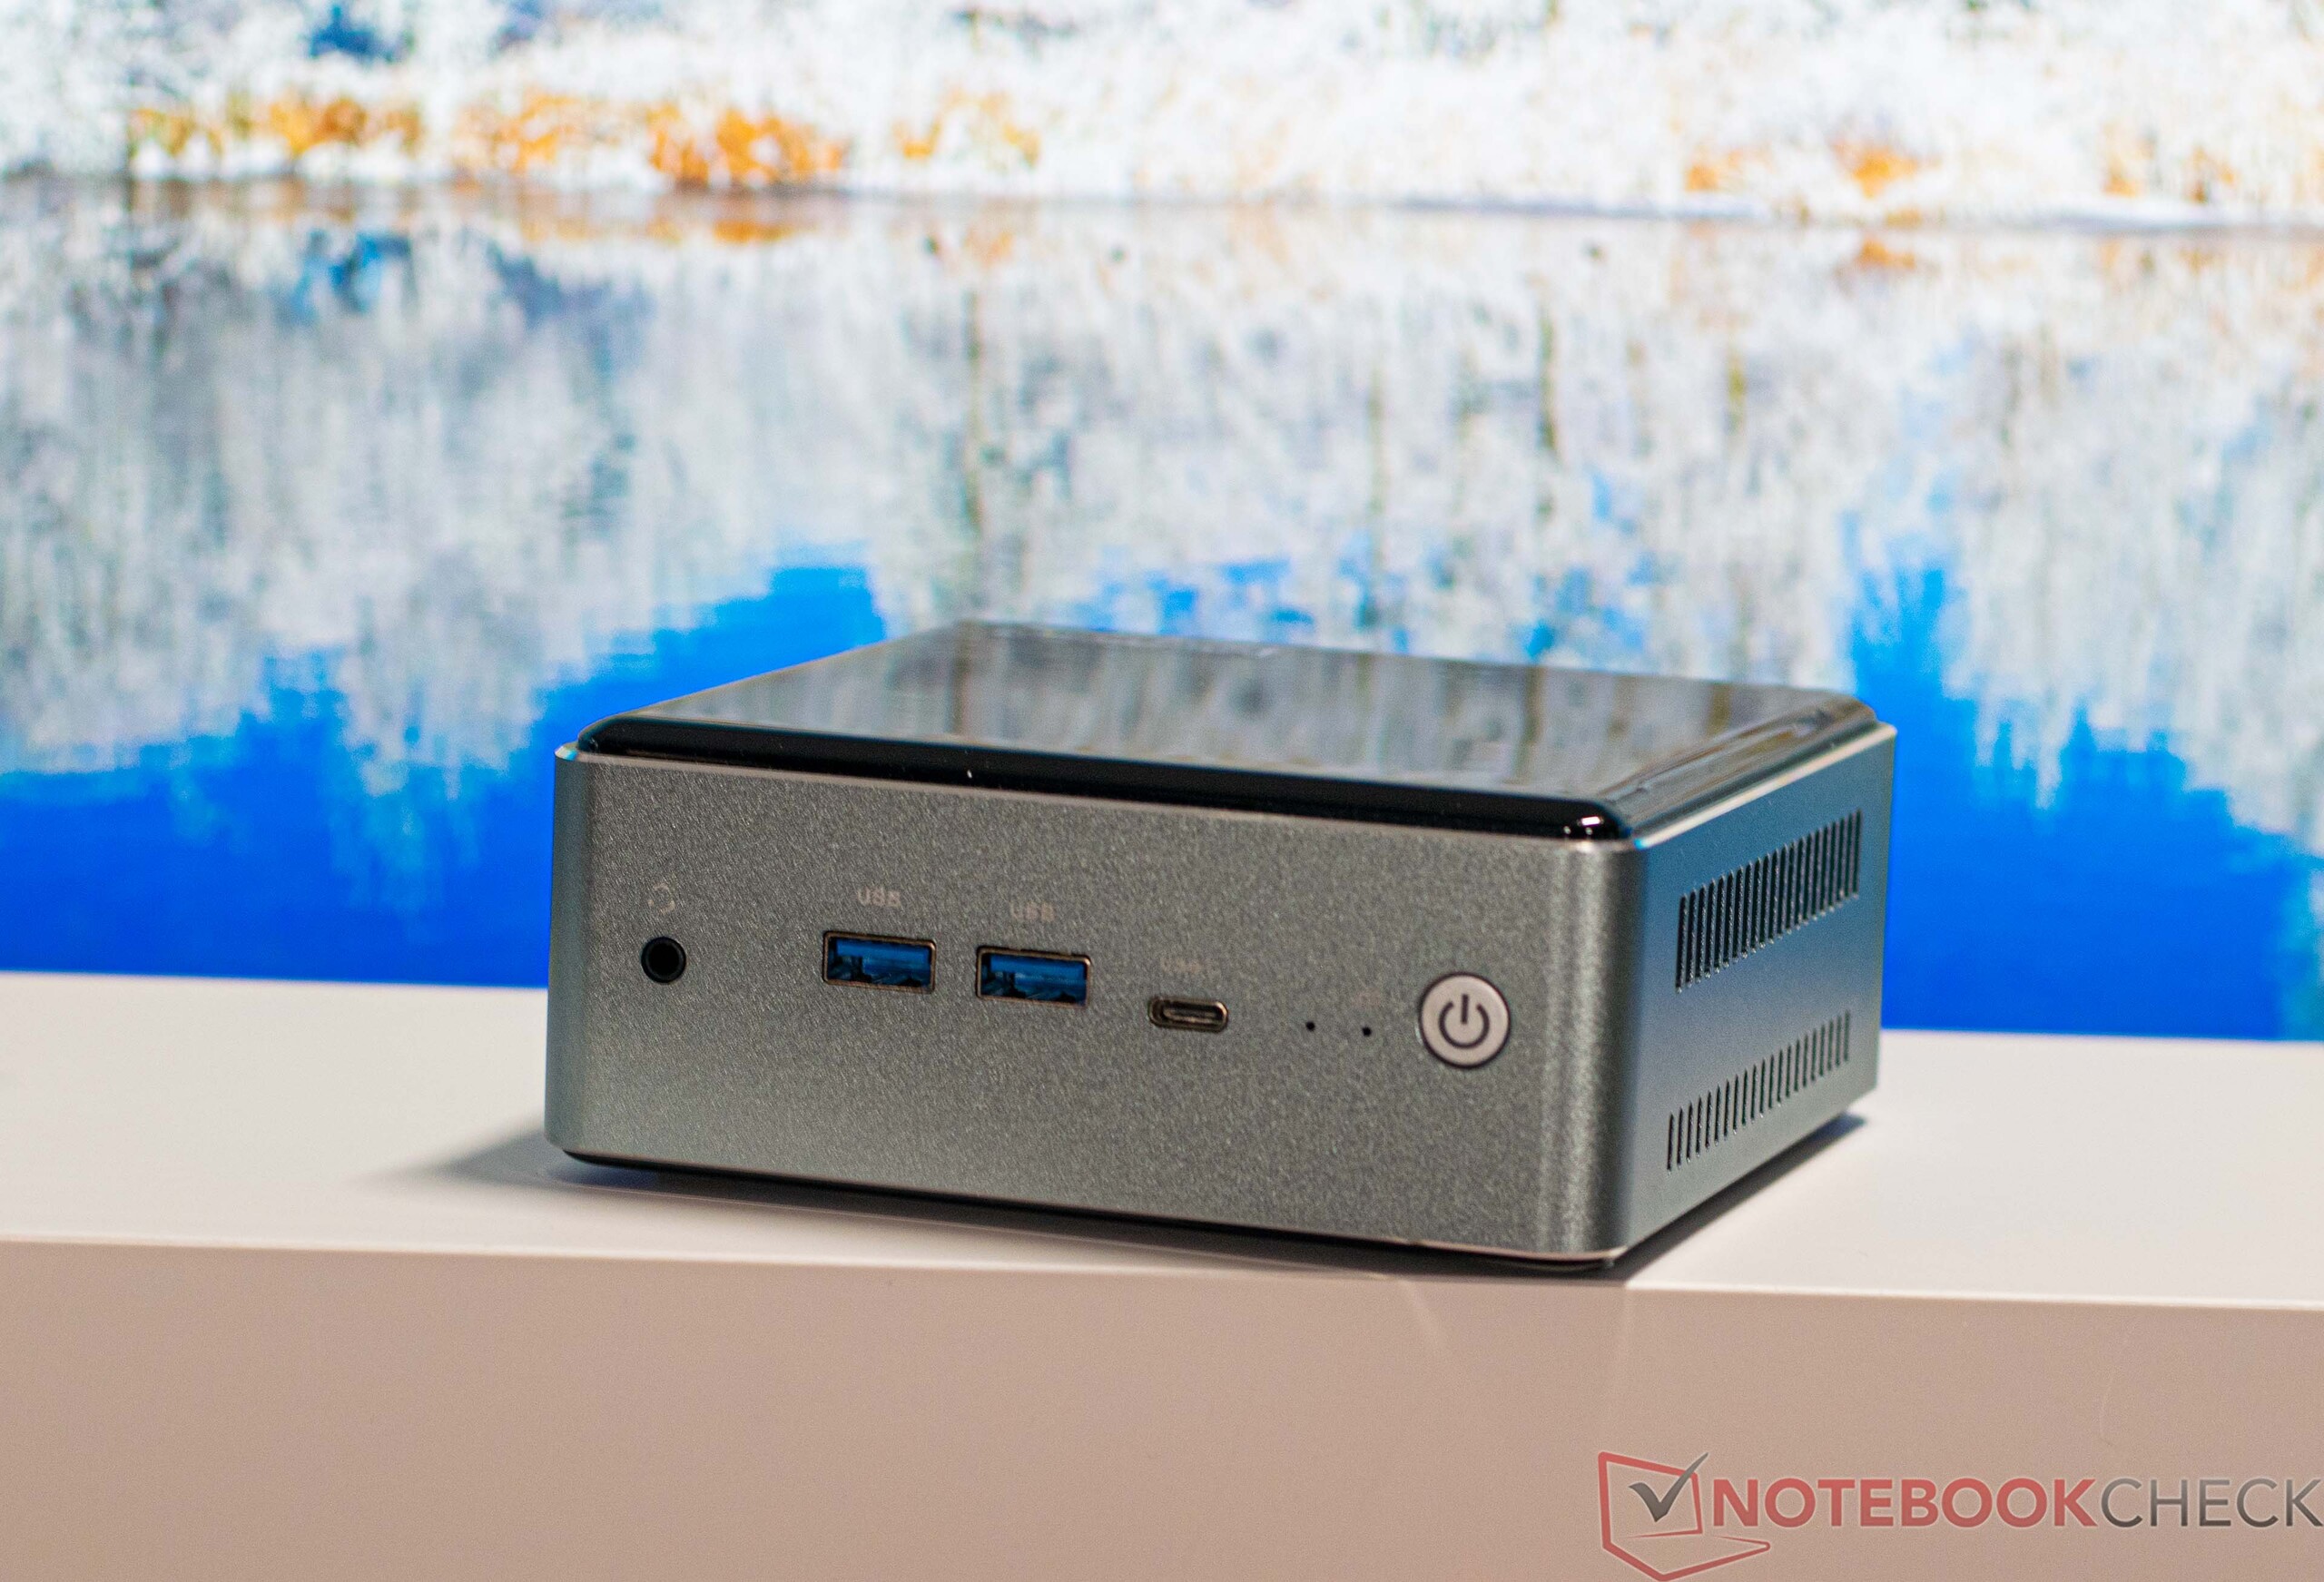
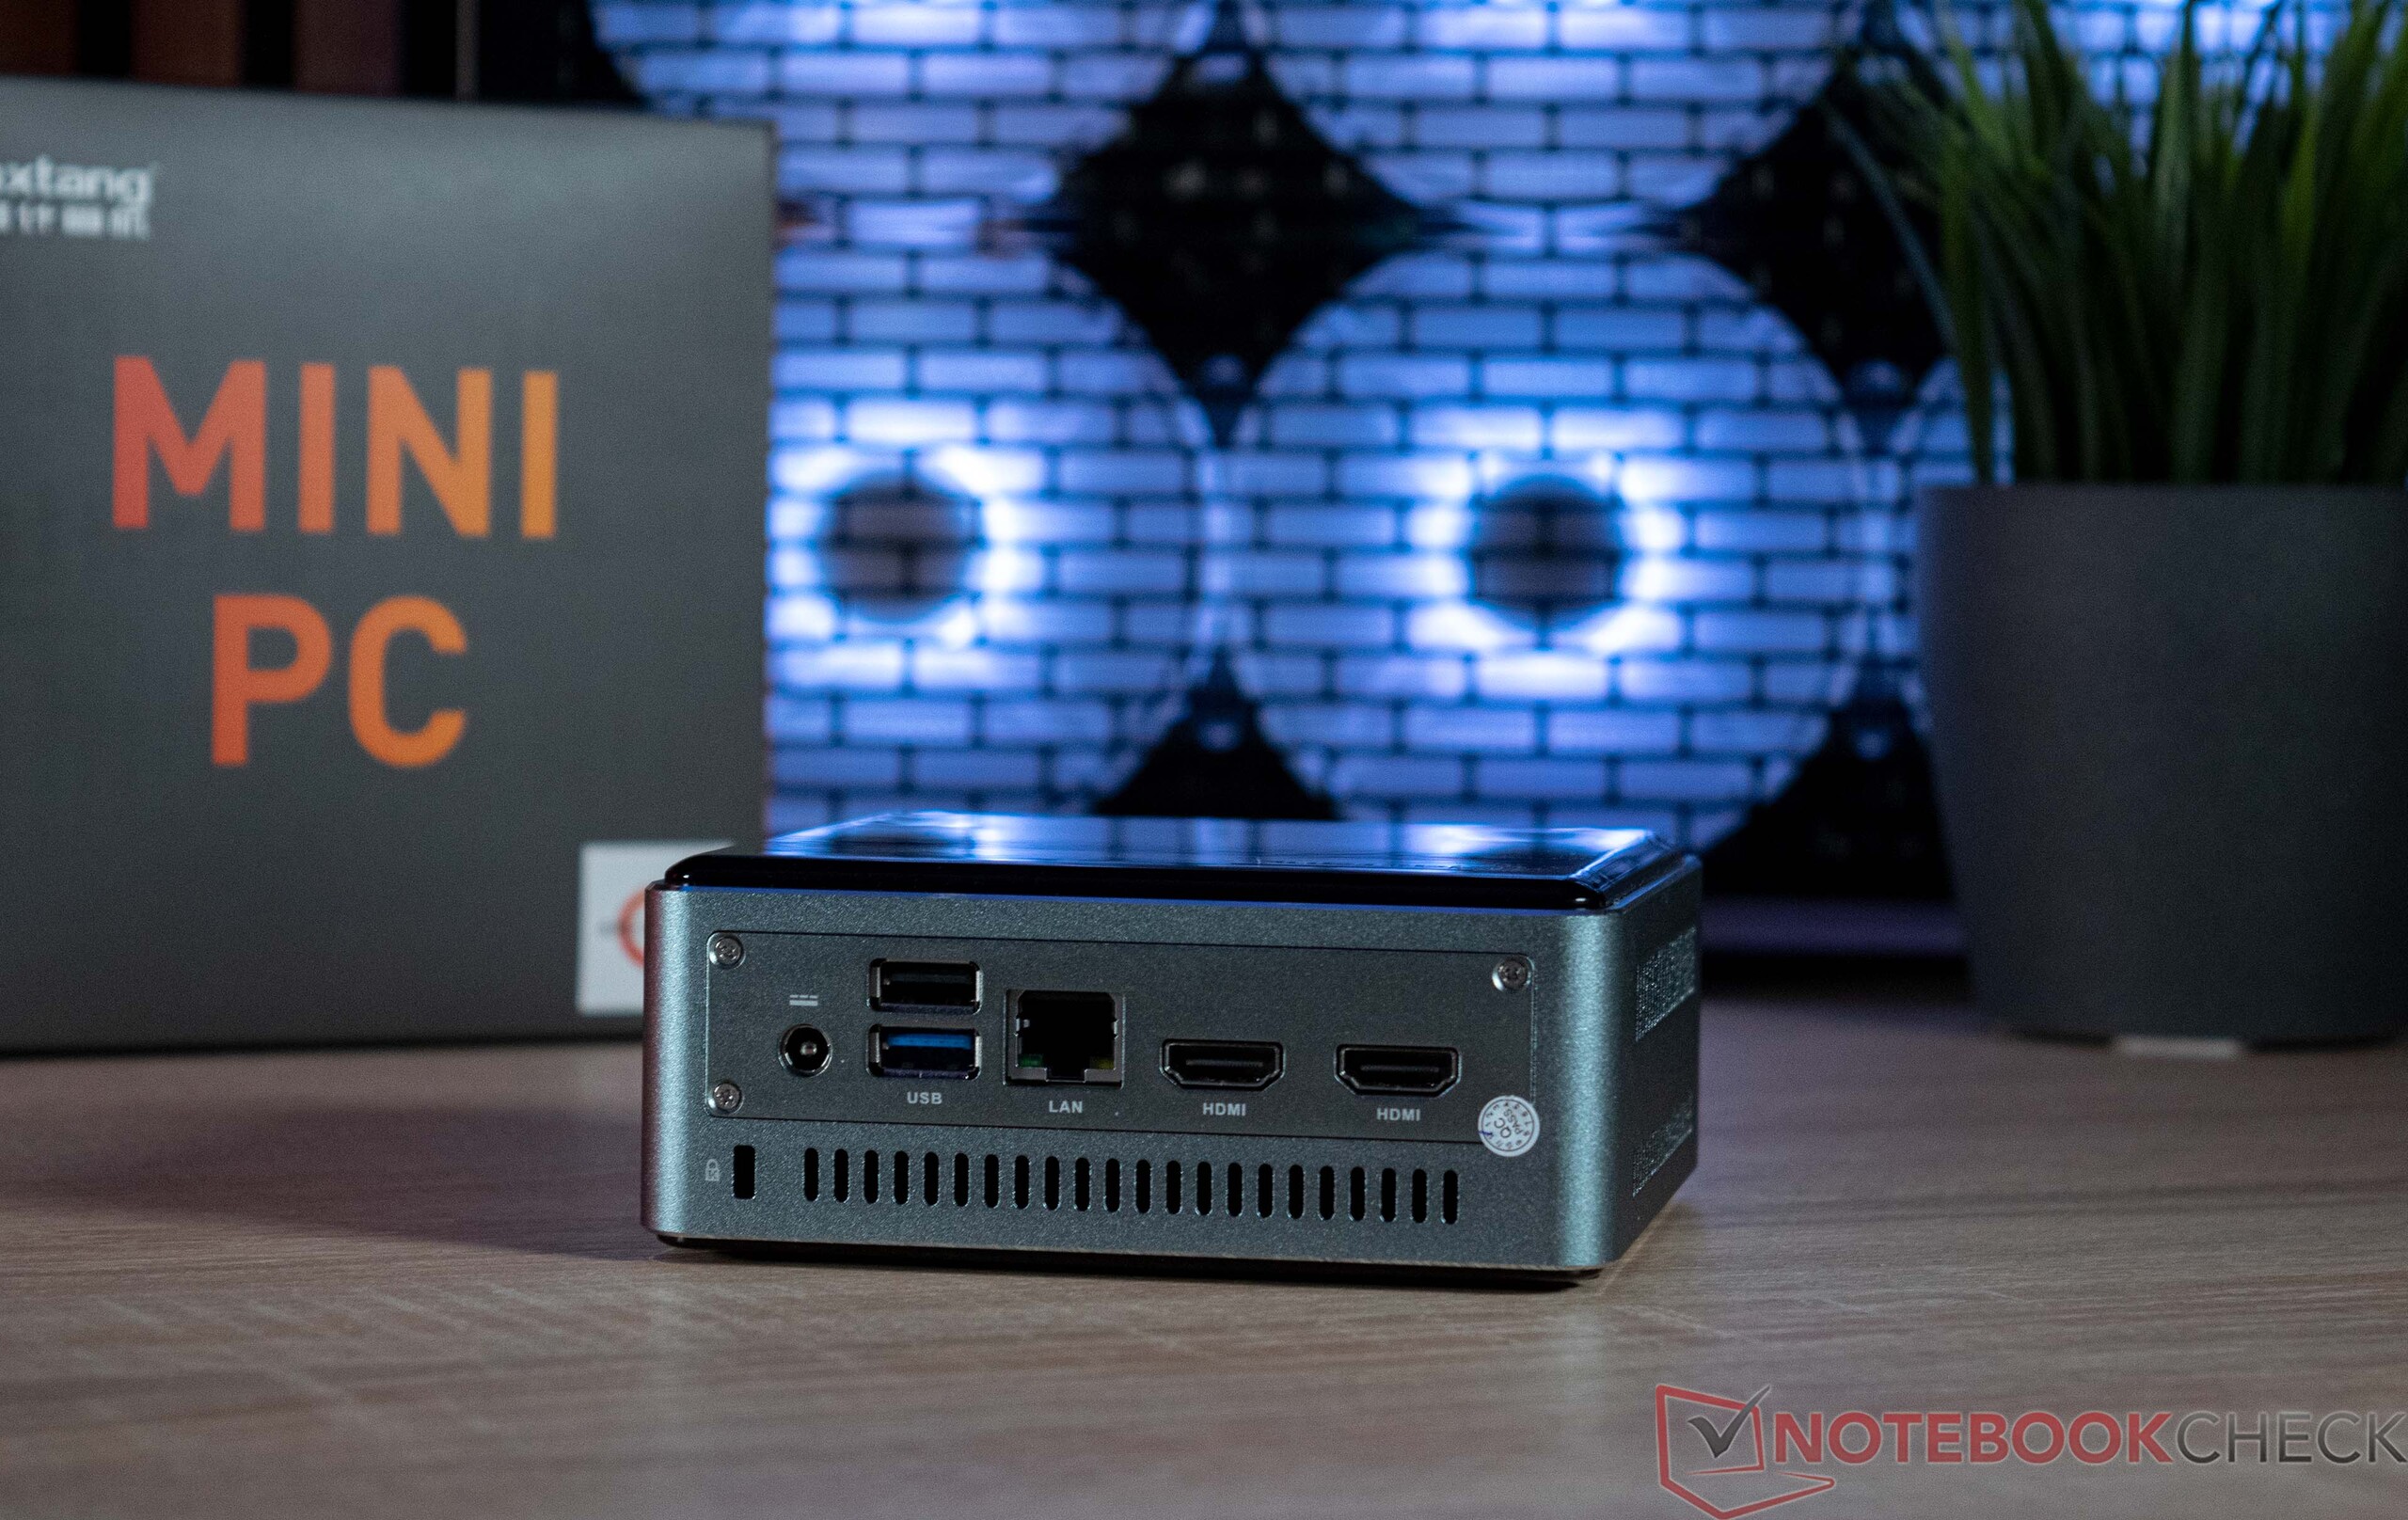
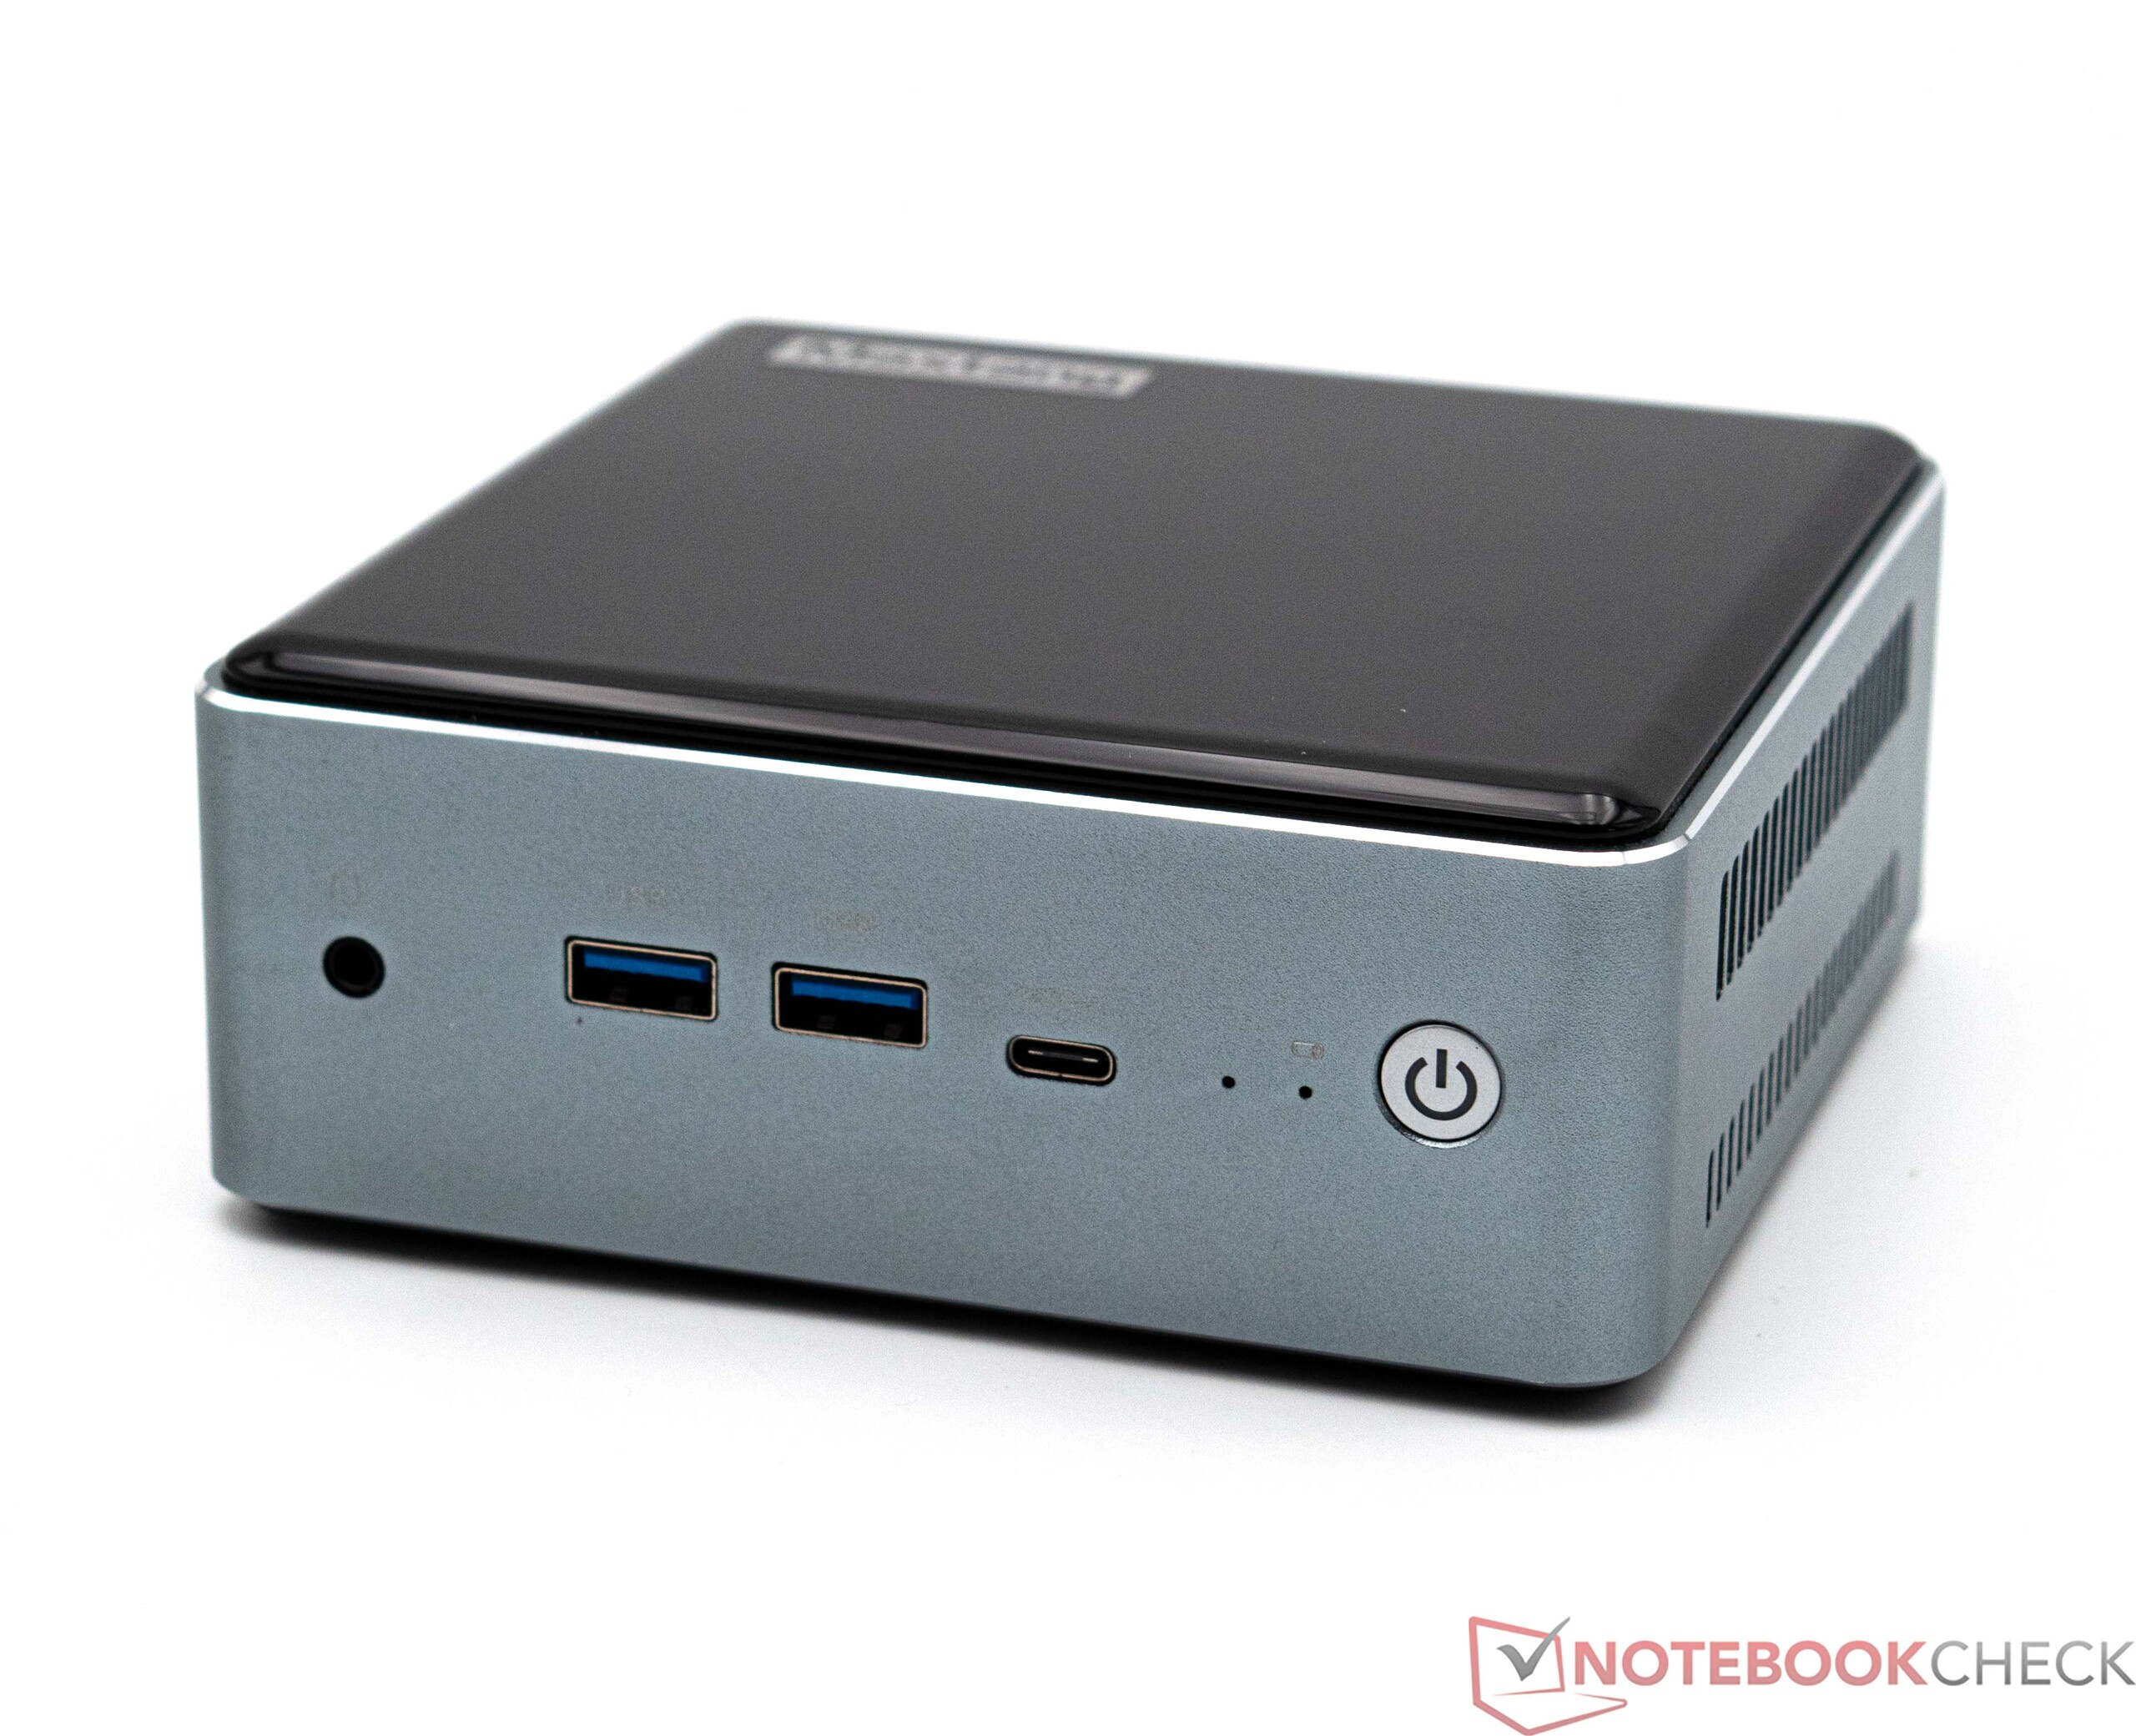
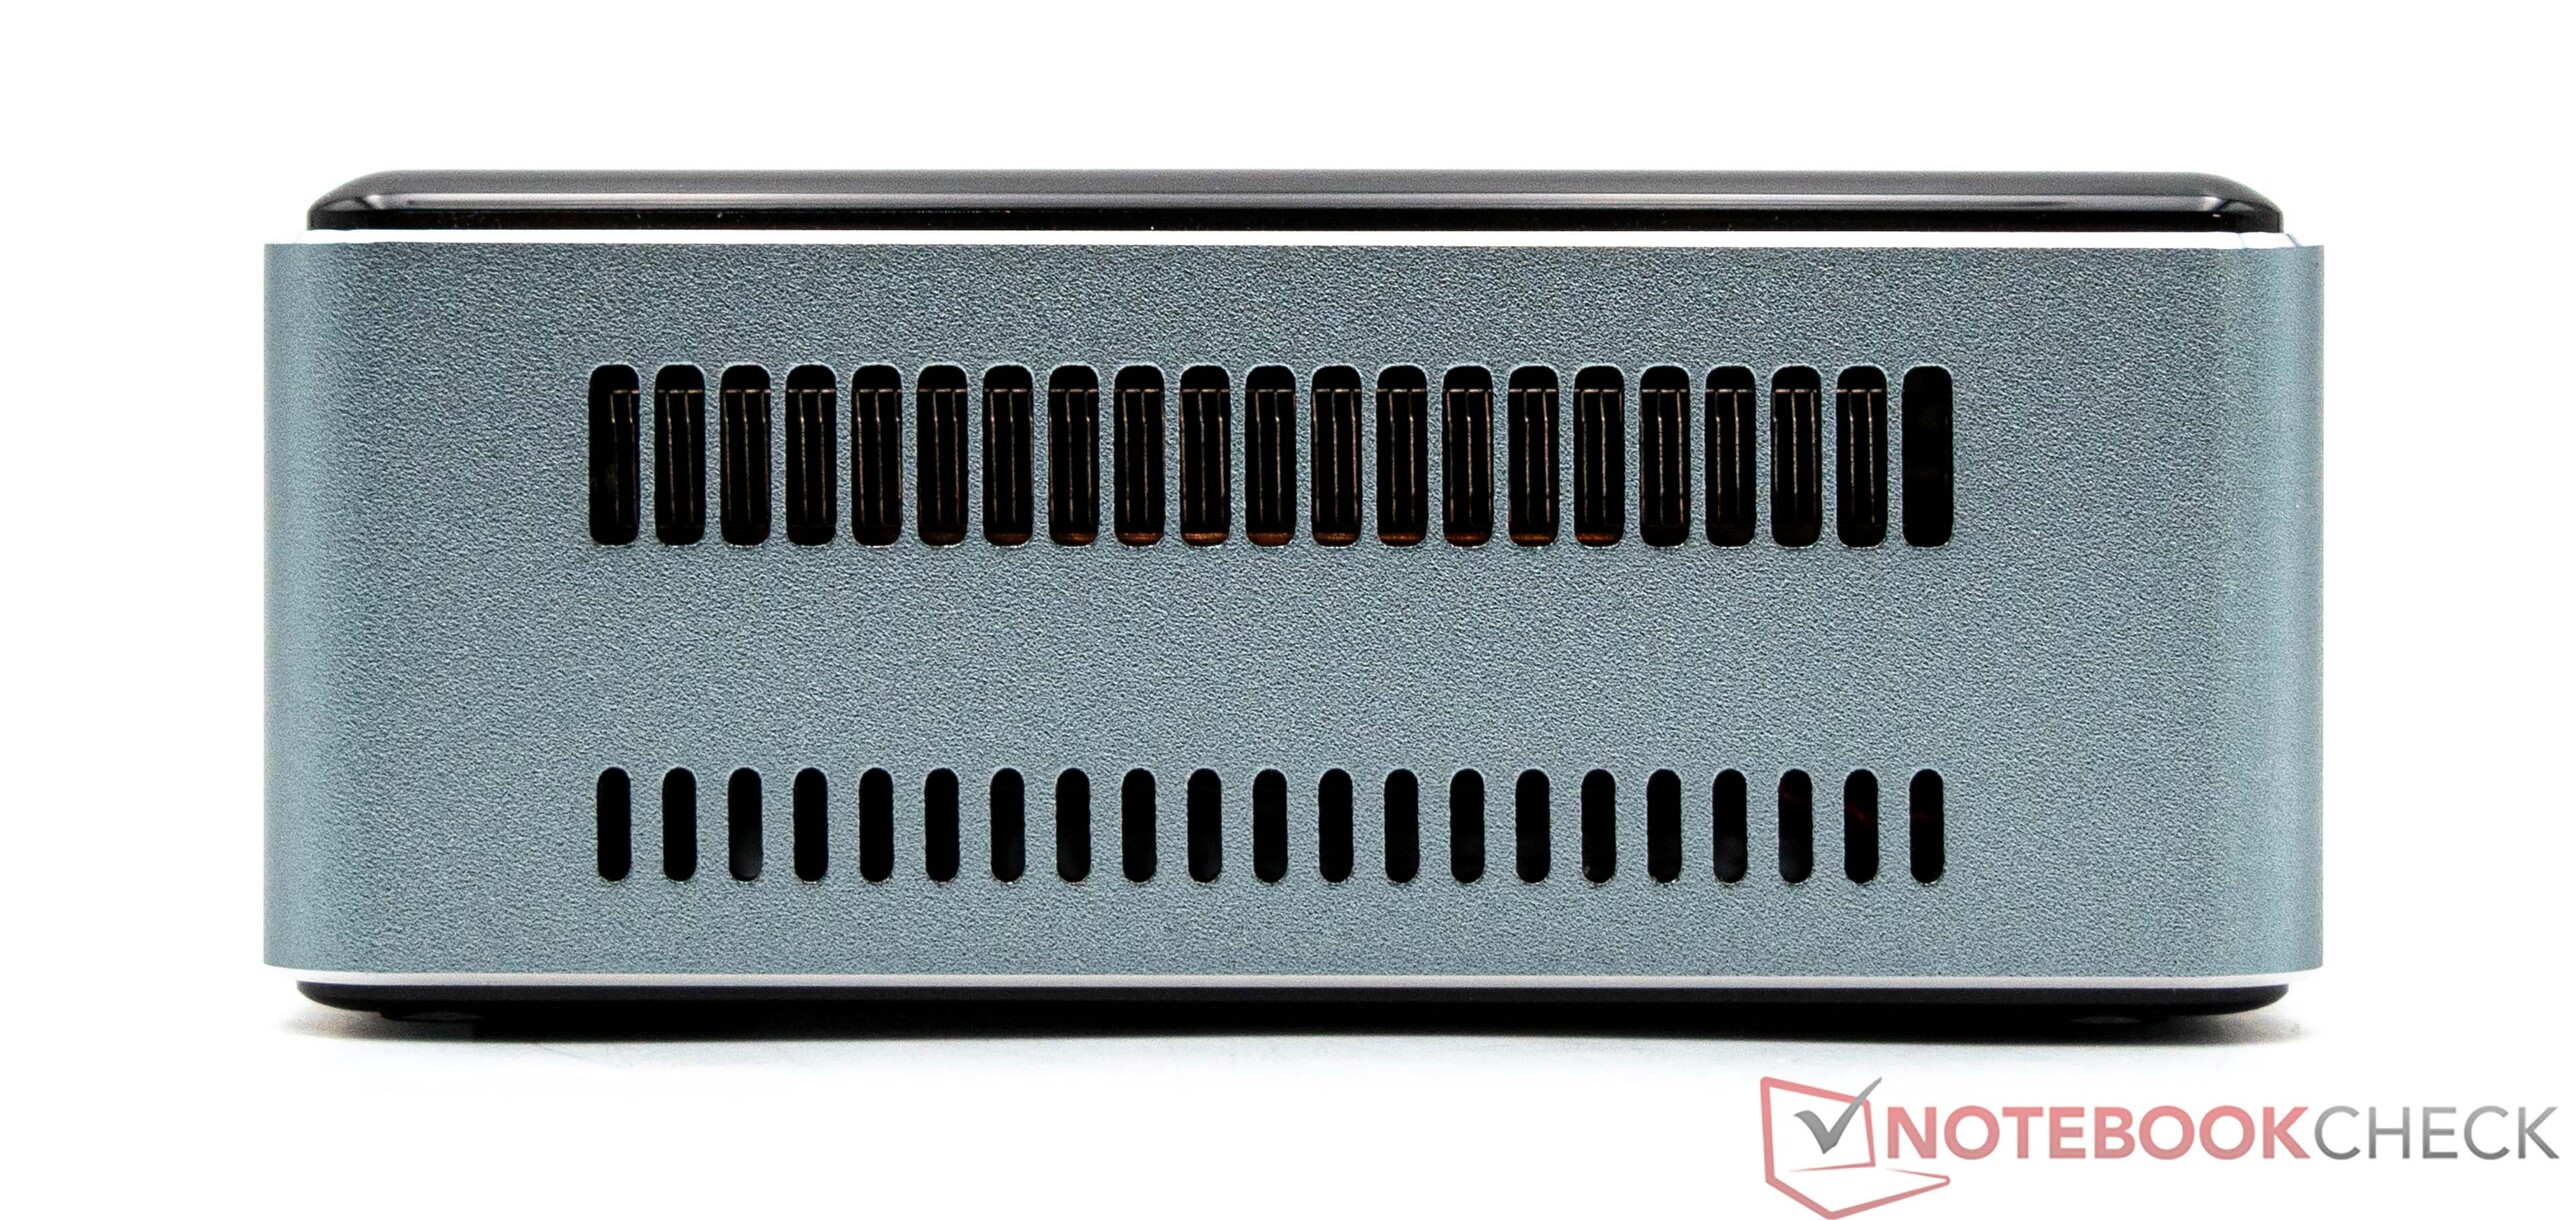
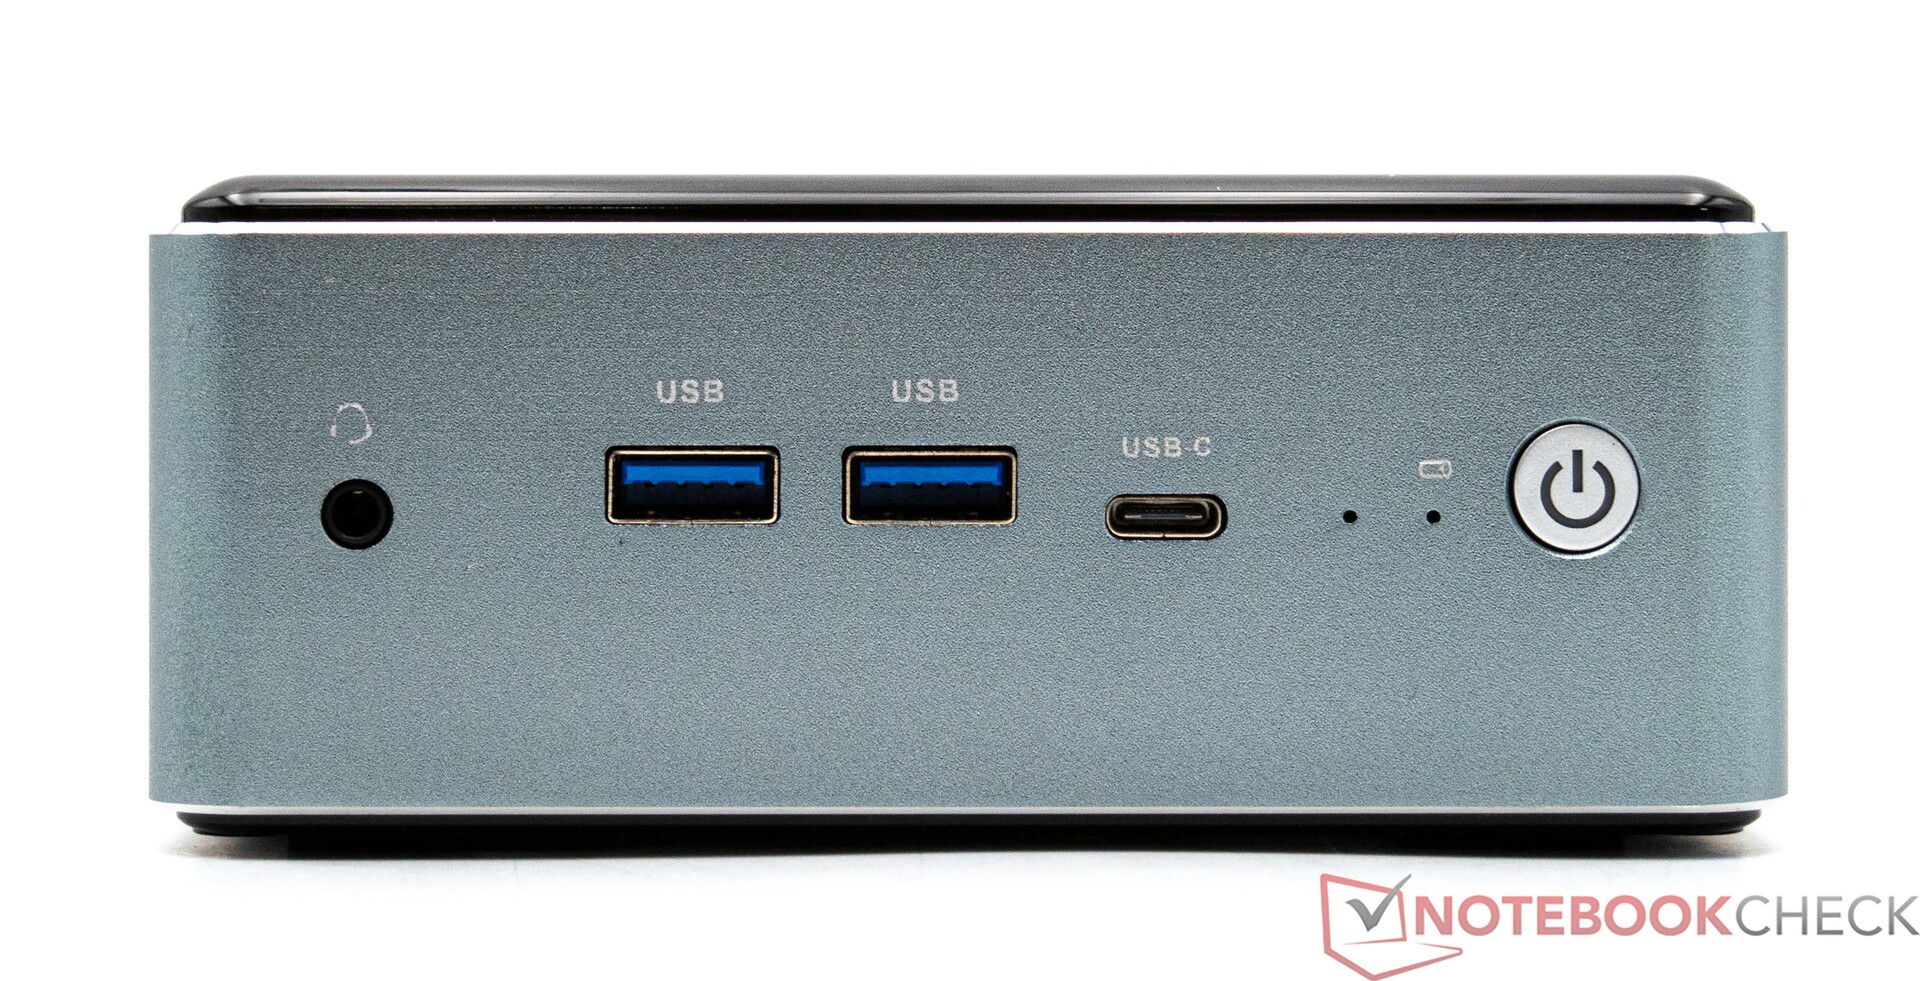
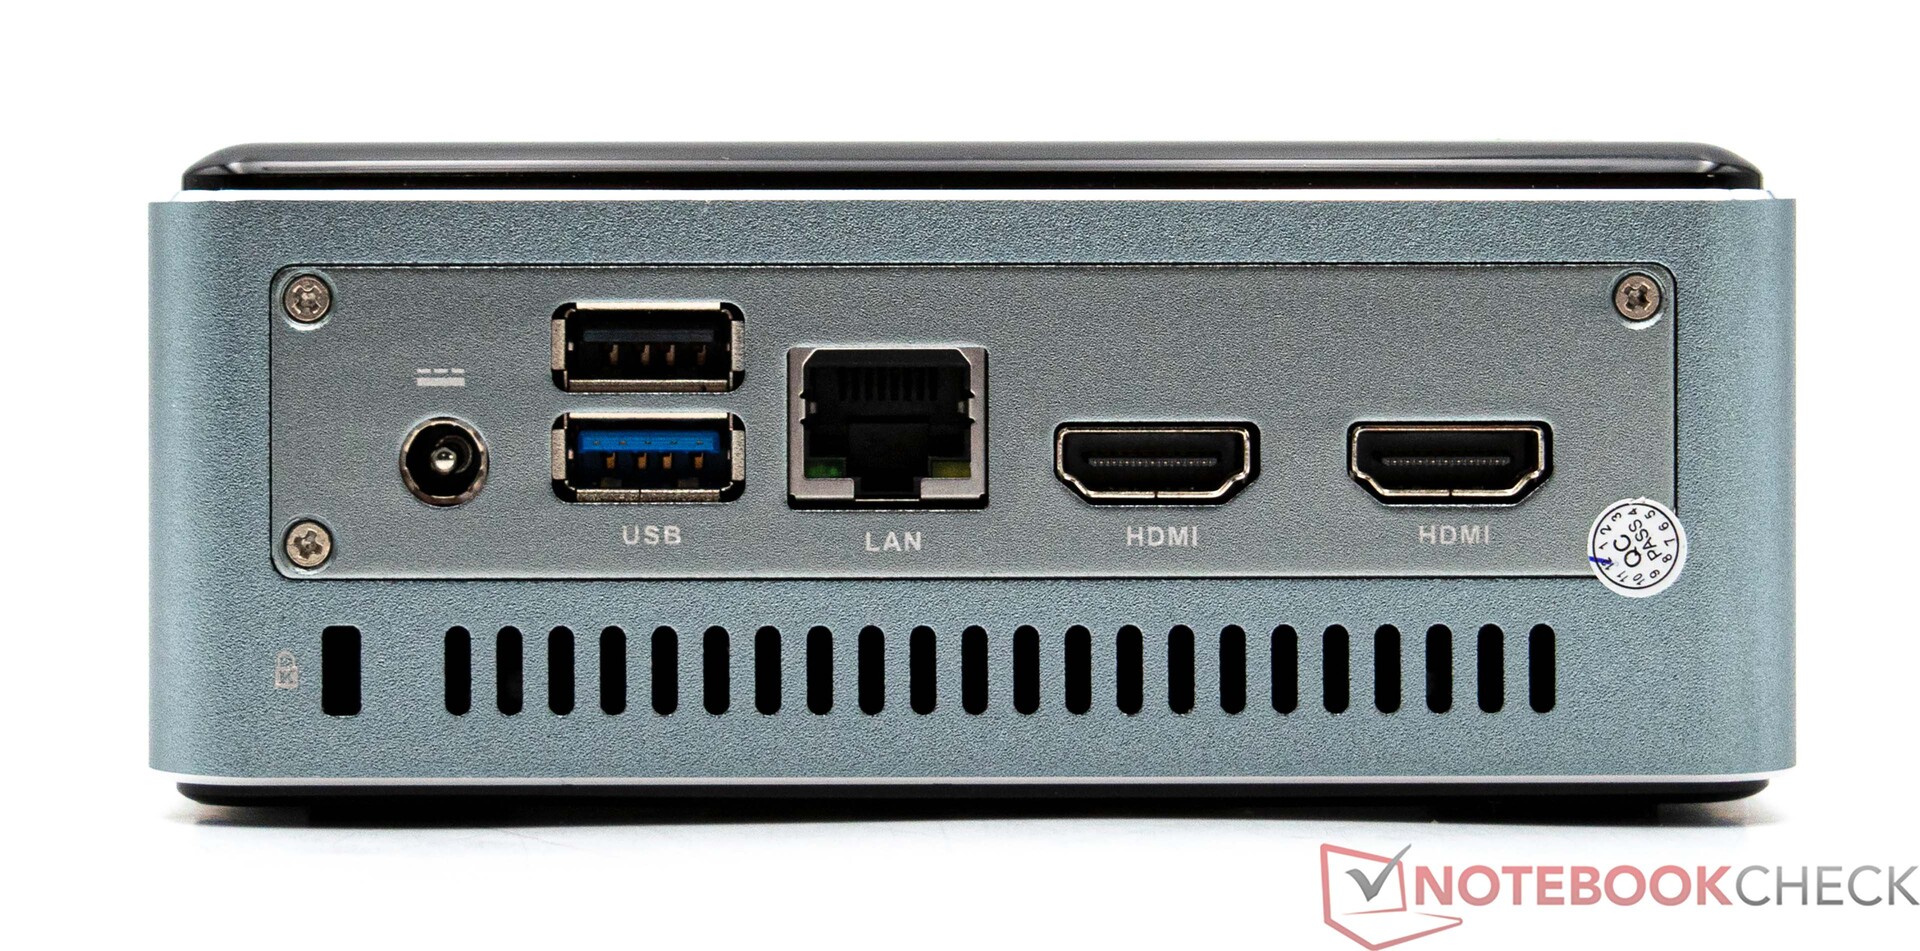
Bei der Anschlussausstattung bietet der Maxtang MTN-FP750 den einfachen Standard. Alle Anschlüsse befinden sich auf der Vorder- und Rückseite. Insgesamt gibt es fünf USB-Anschlüsse, von denen einer als USB-TypC zusätzlich als Displayanschluss genutzt werden kann. Zusammen mit den beiden HDMI-Ausgängen auf der Rückseite lassen sich in Summe gleich drei Bildschirme gleichzeitig ansteuern. Auf der Rückseite befindet sich zudem noch die 2,5G-LAN-Buchse.
Kommunikation

Im Maxtang MTN-FP750 ist ein Intel Wi-Fi 6 AX200 Funkmodul verbaut, welches mit 2,4- und 5 GHZ-Frequenzen umgehen kann. Im Test überzeugt unser Testsample nicht mit herausragenden Ergebnissen. Für den Test kam der Asus ROG Rapture GT-AXE11000 zum Einsatz. Alternativ kann man den Maxtang Mini-PC auch über eine Ethernet-Buchse mit dem Netzwerk verbinden. Hier sind Übertragungsgeschwindigkeiten von bis zu 2,5 Gbit/s möglich.
Zubehör
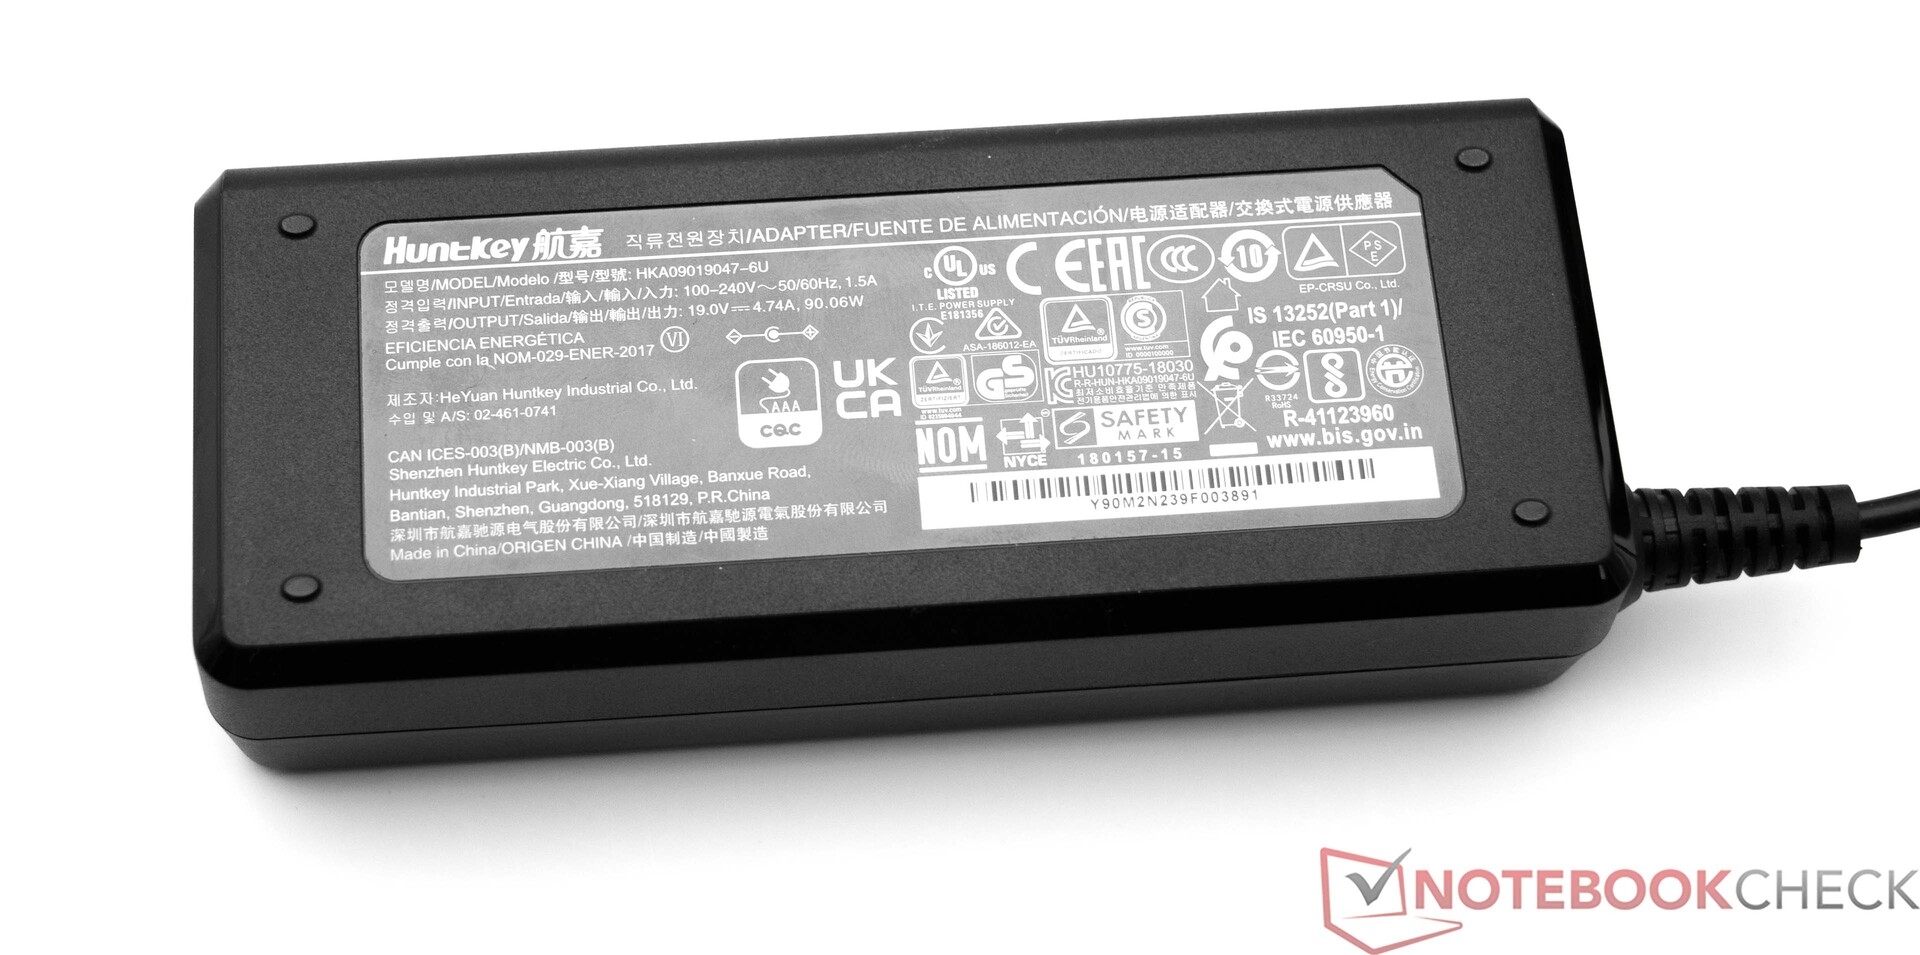
Der Lieferumfang des Maxtang MTN-FP750 beinhaltet alles Wichtige, um das Gerät in Betrieb nehmen zu können. Nebst dem Gerät selbst liegt im Karton noch ein 90-Watt-Netzteil (19 V; 4,74 A) sowie eine Halteplatte für die VESA-Montage. Ein HDMI-Kabel und eine Kurzanleitung sind ebenfalls Bestandteil des Lieferumfanges.
Wartung
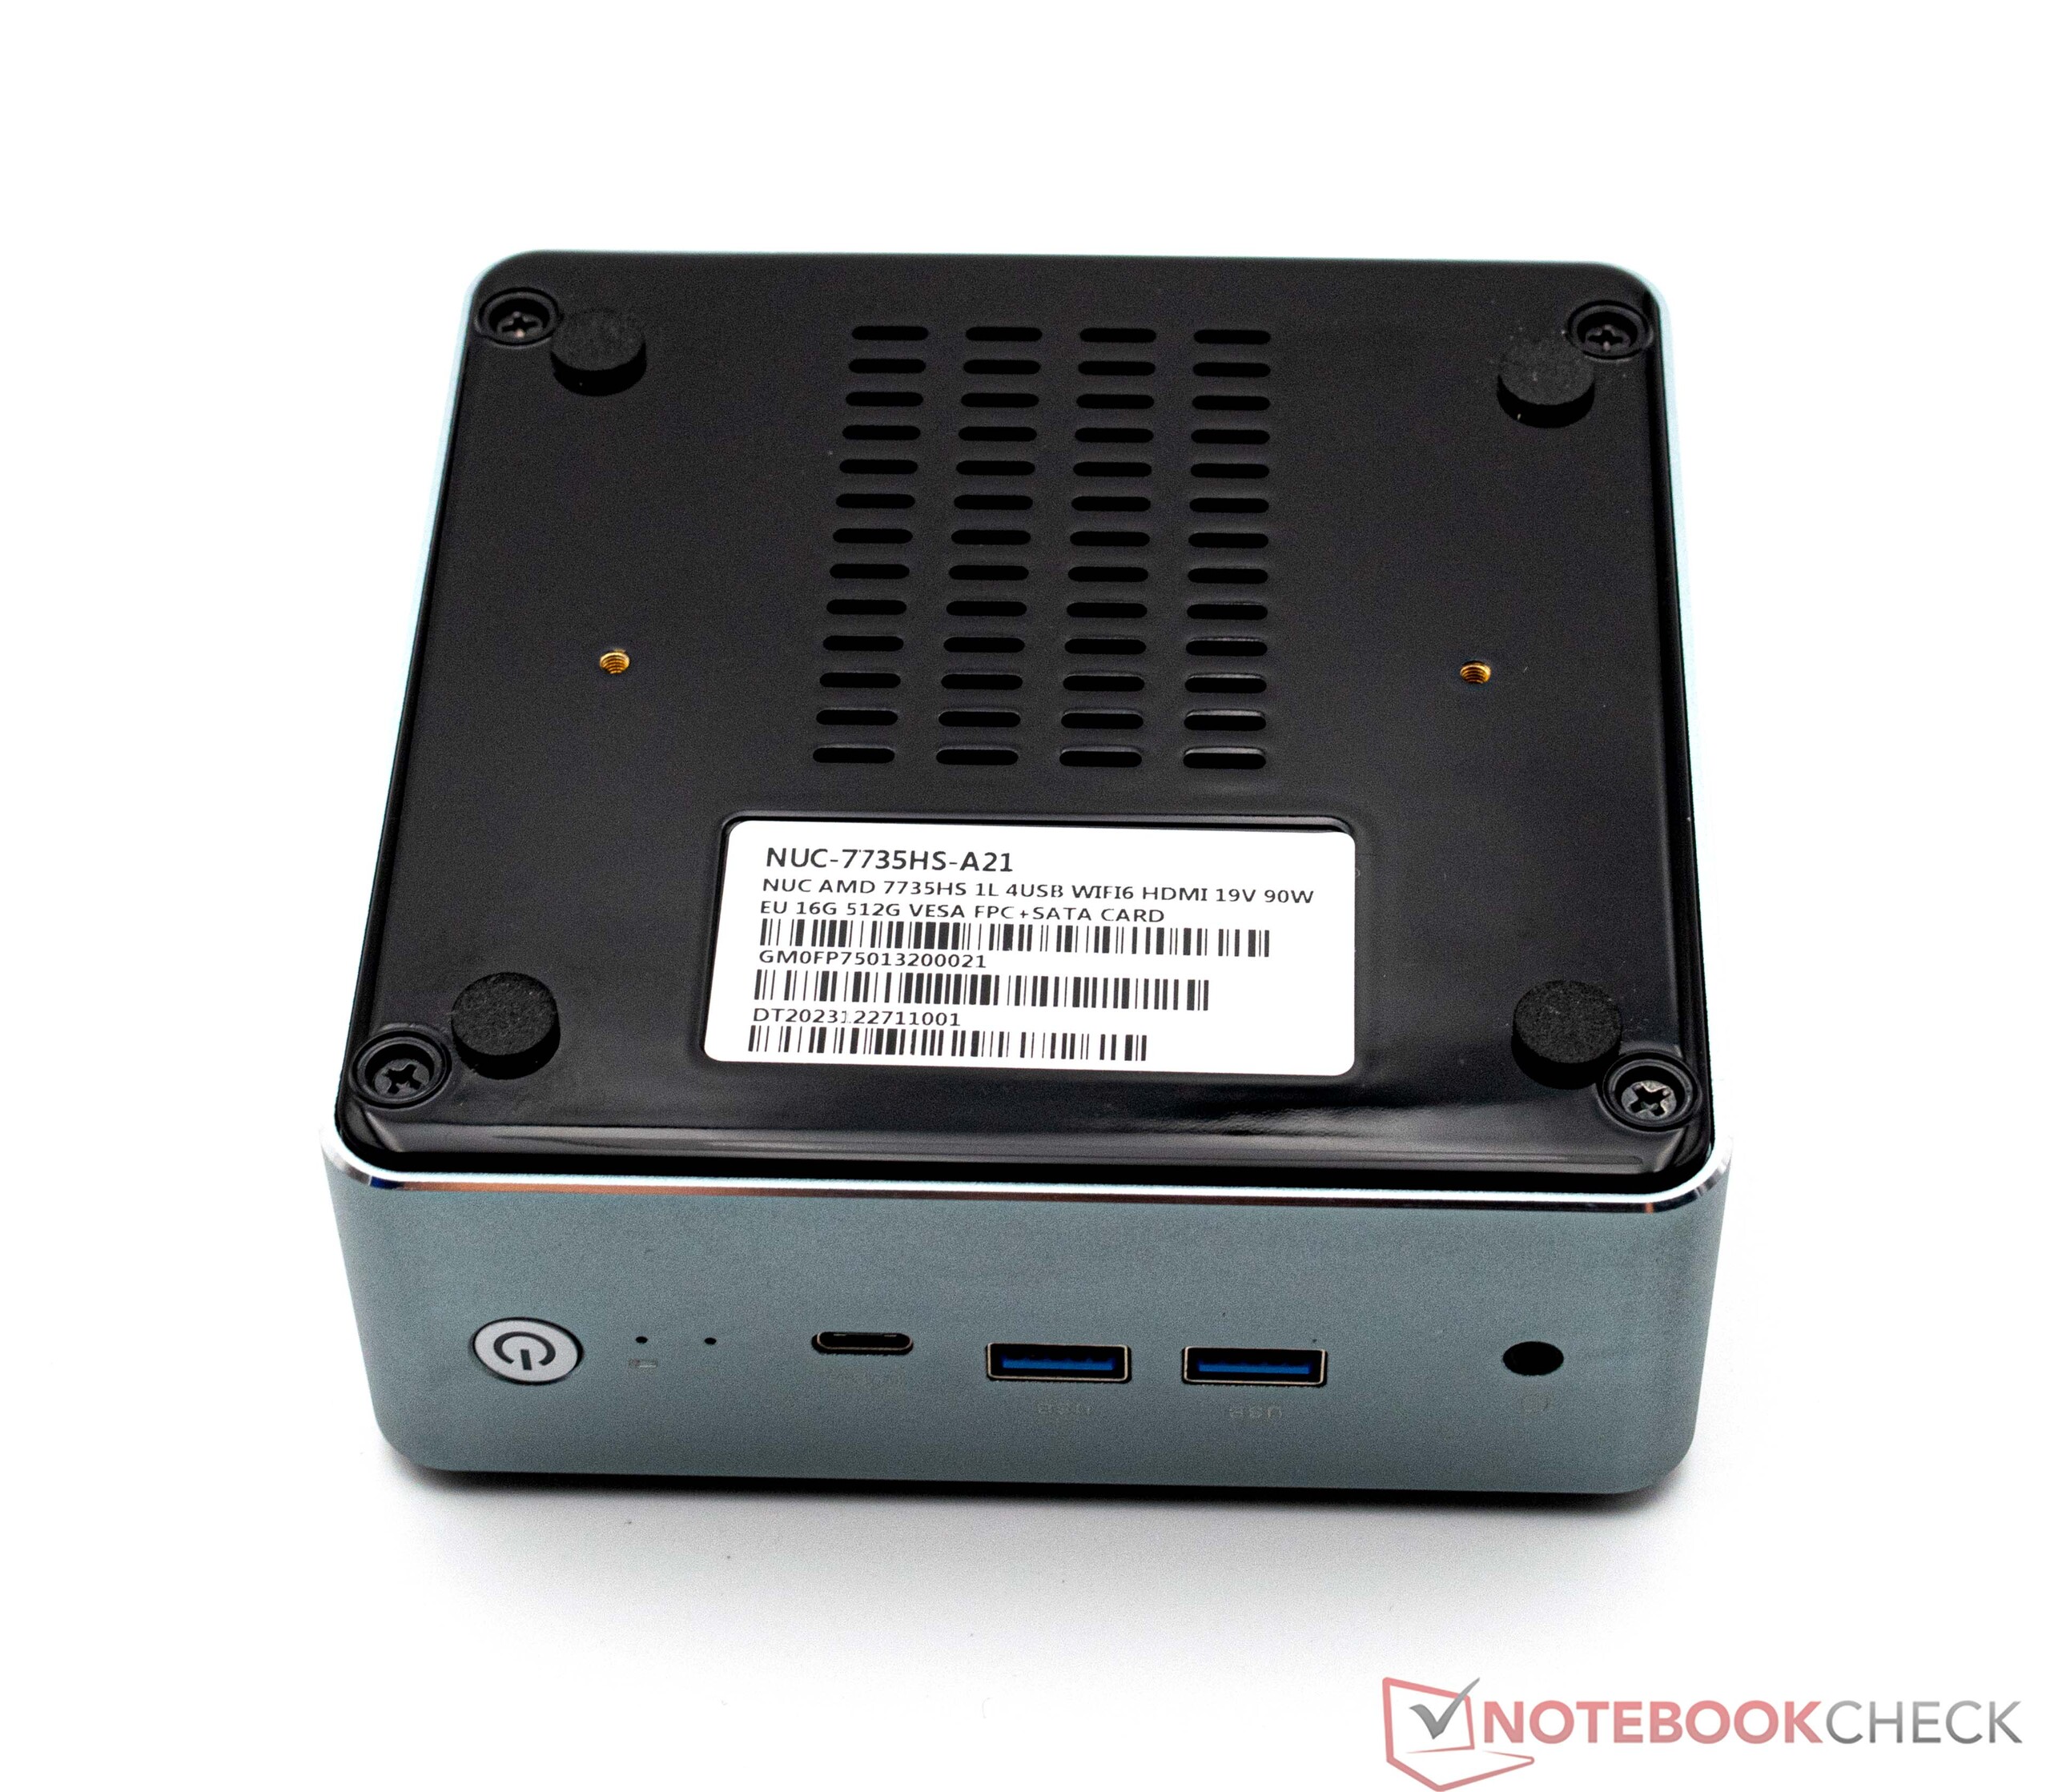
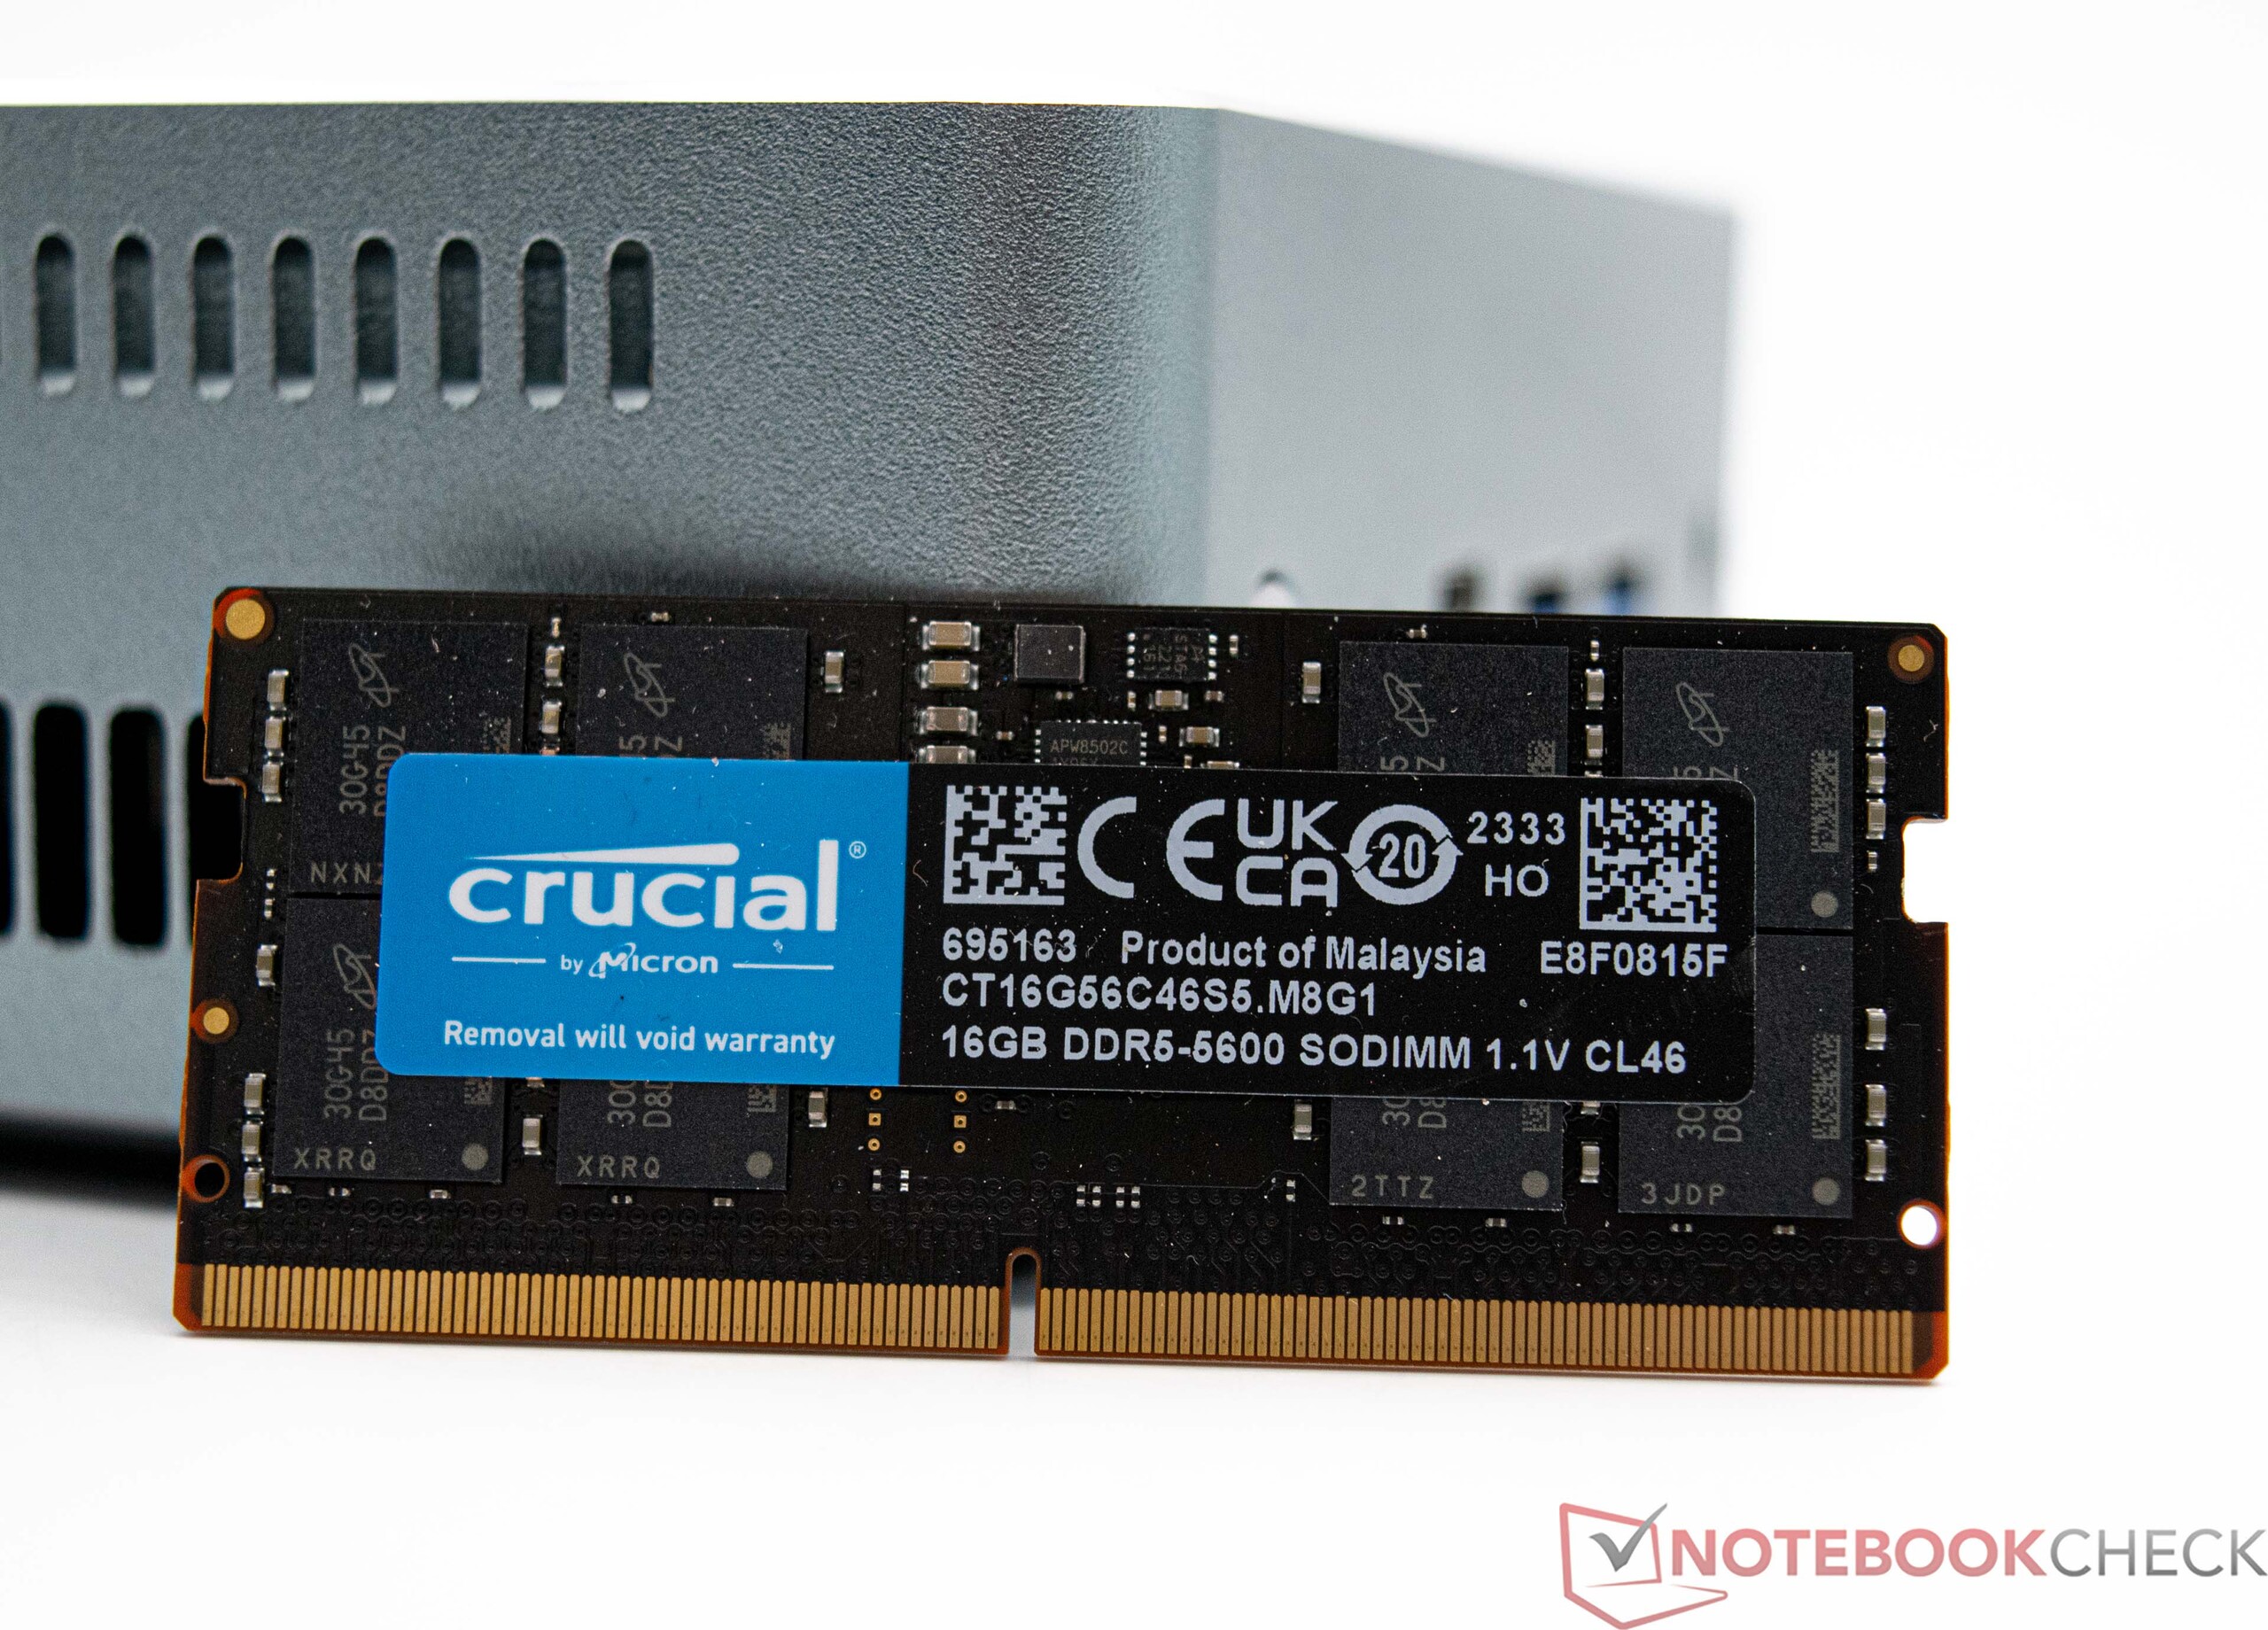
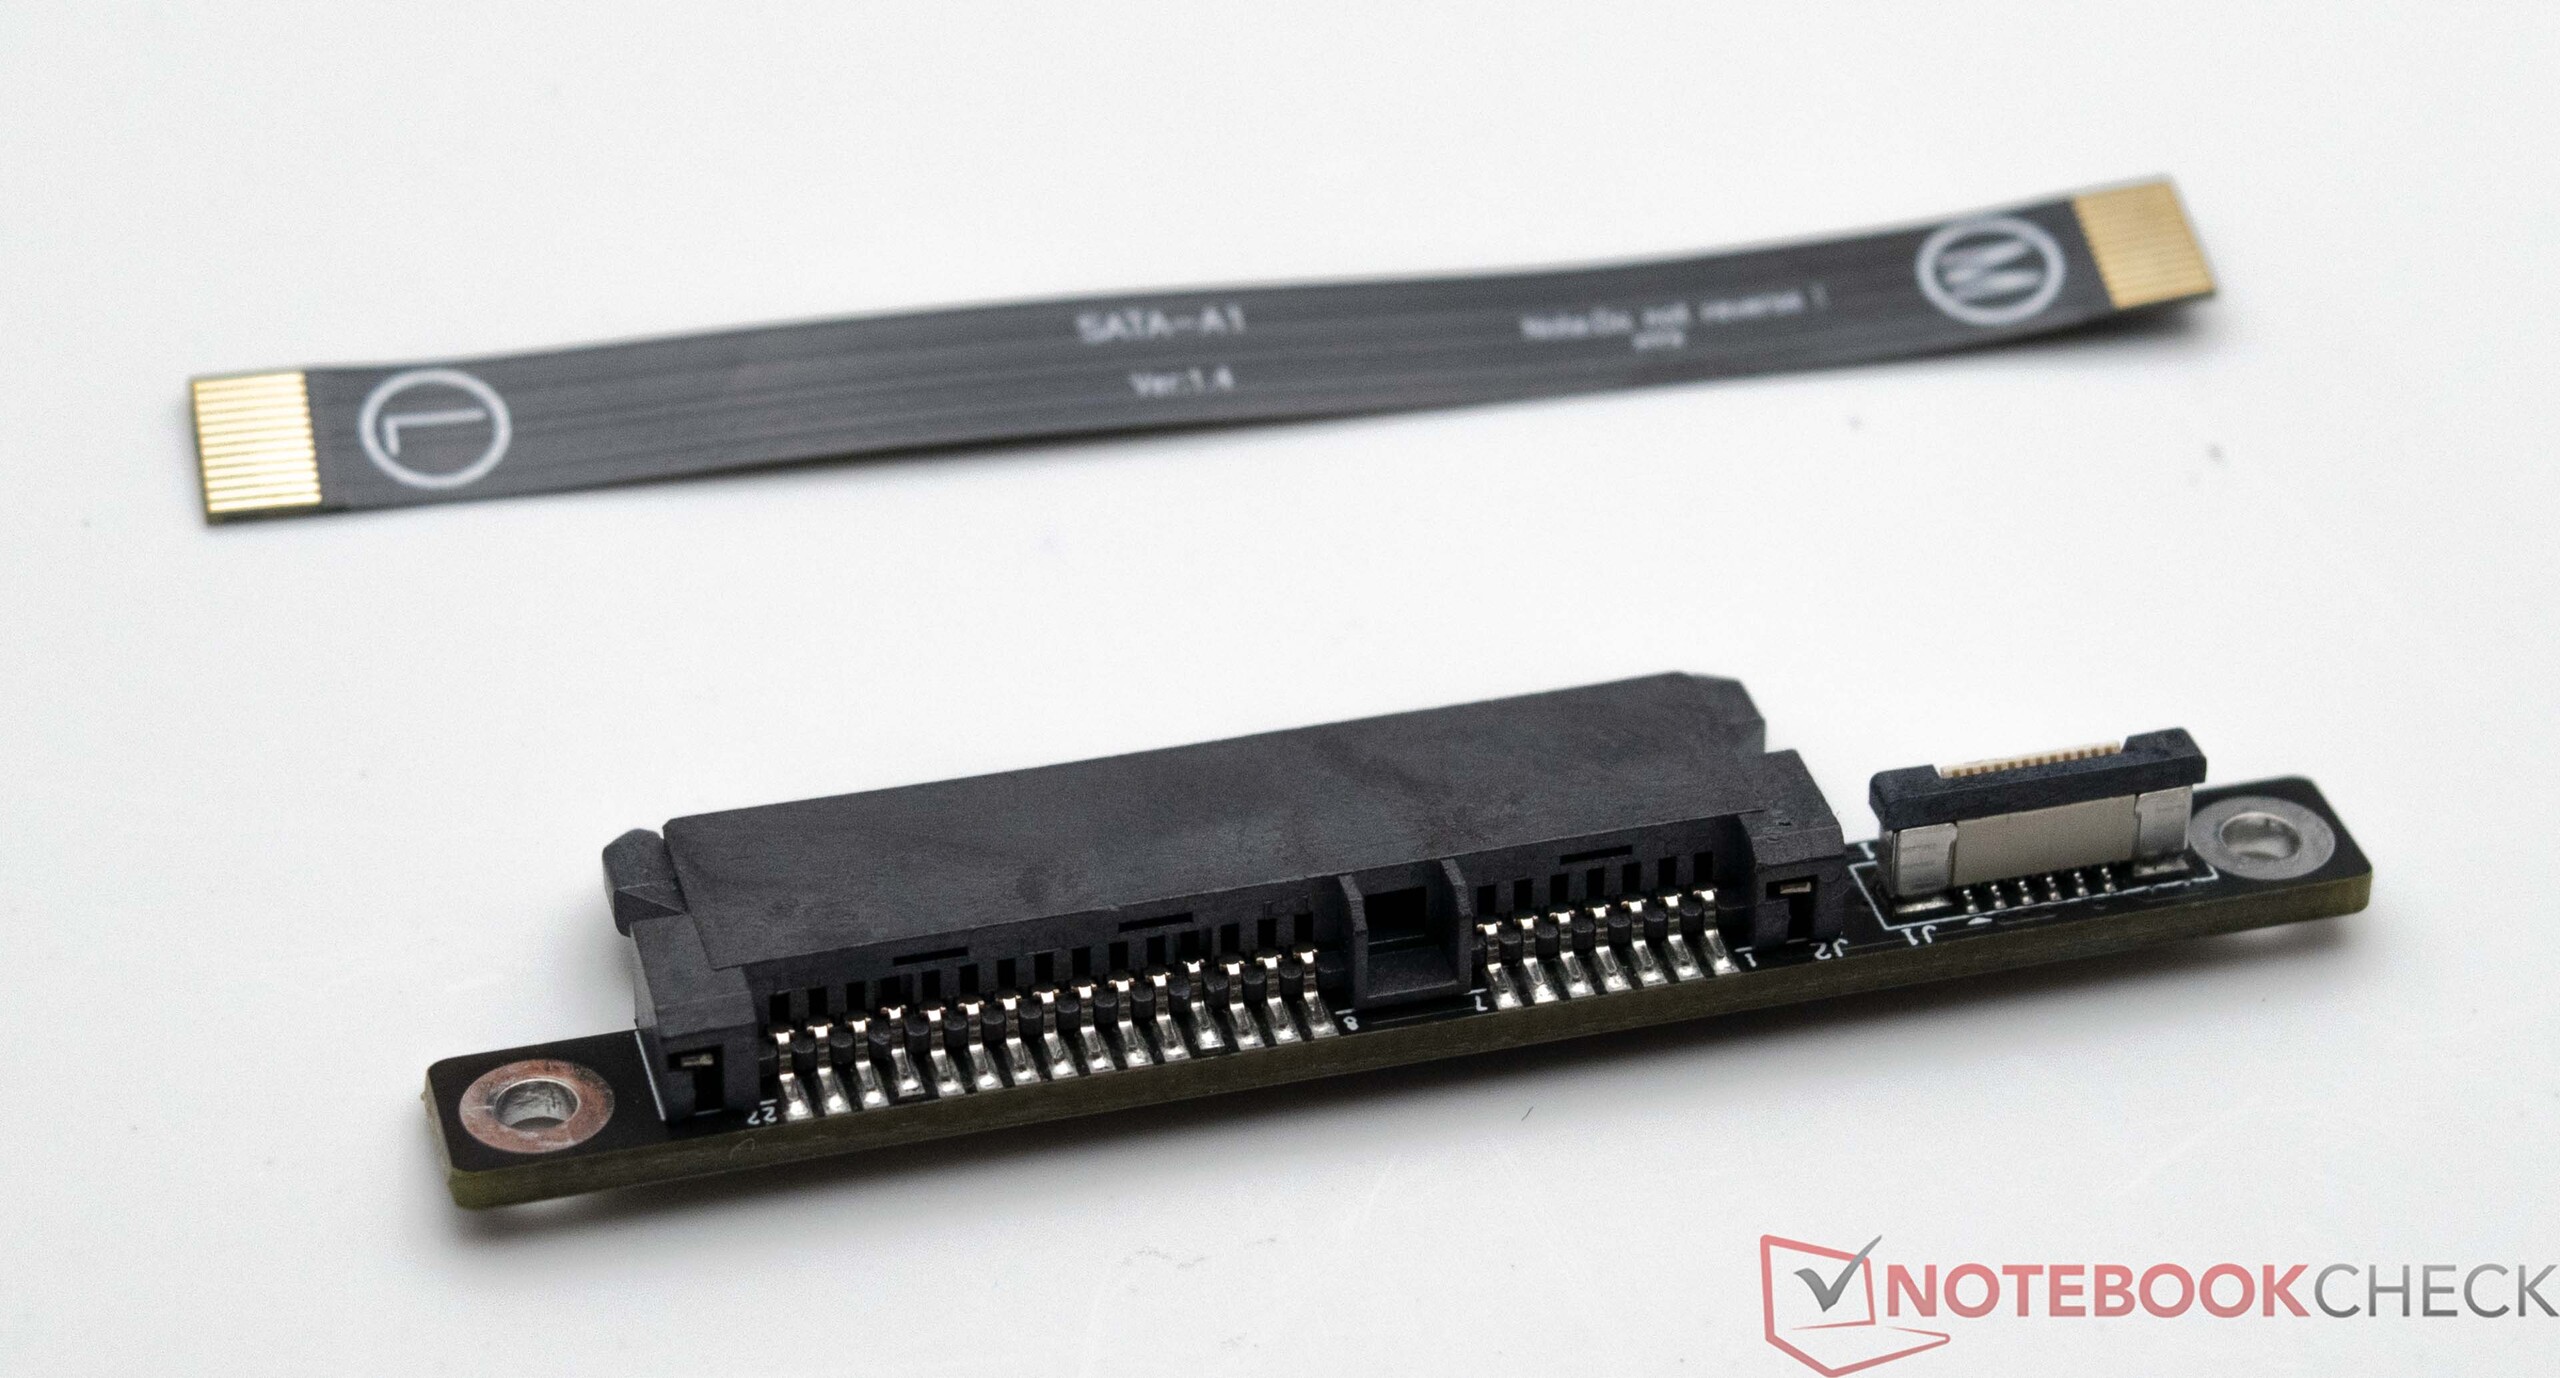
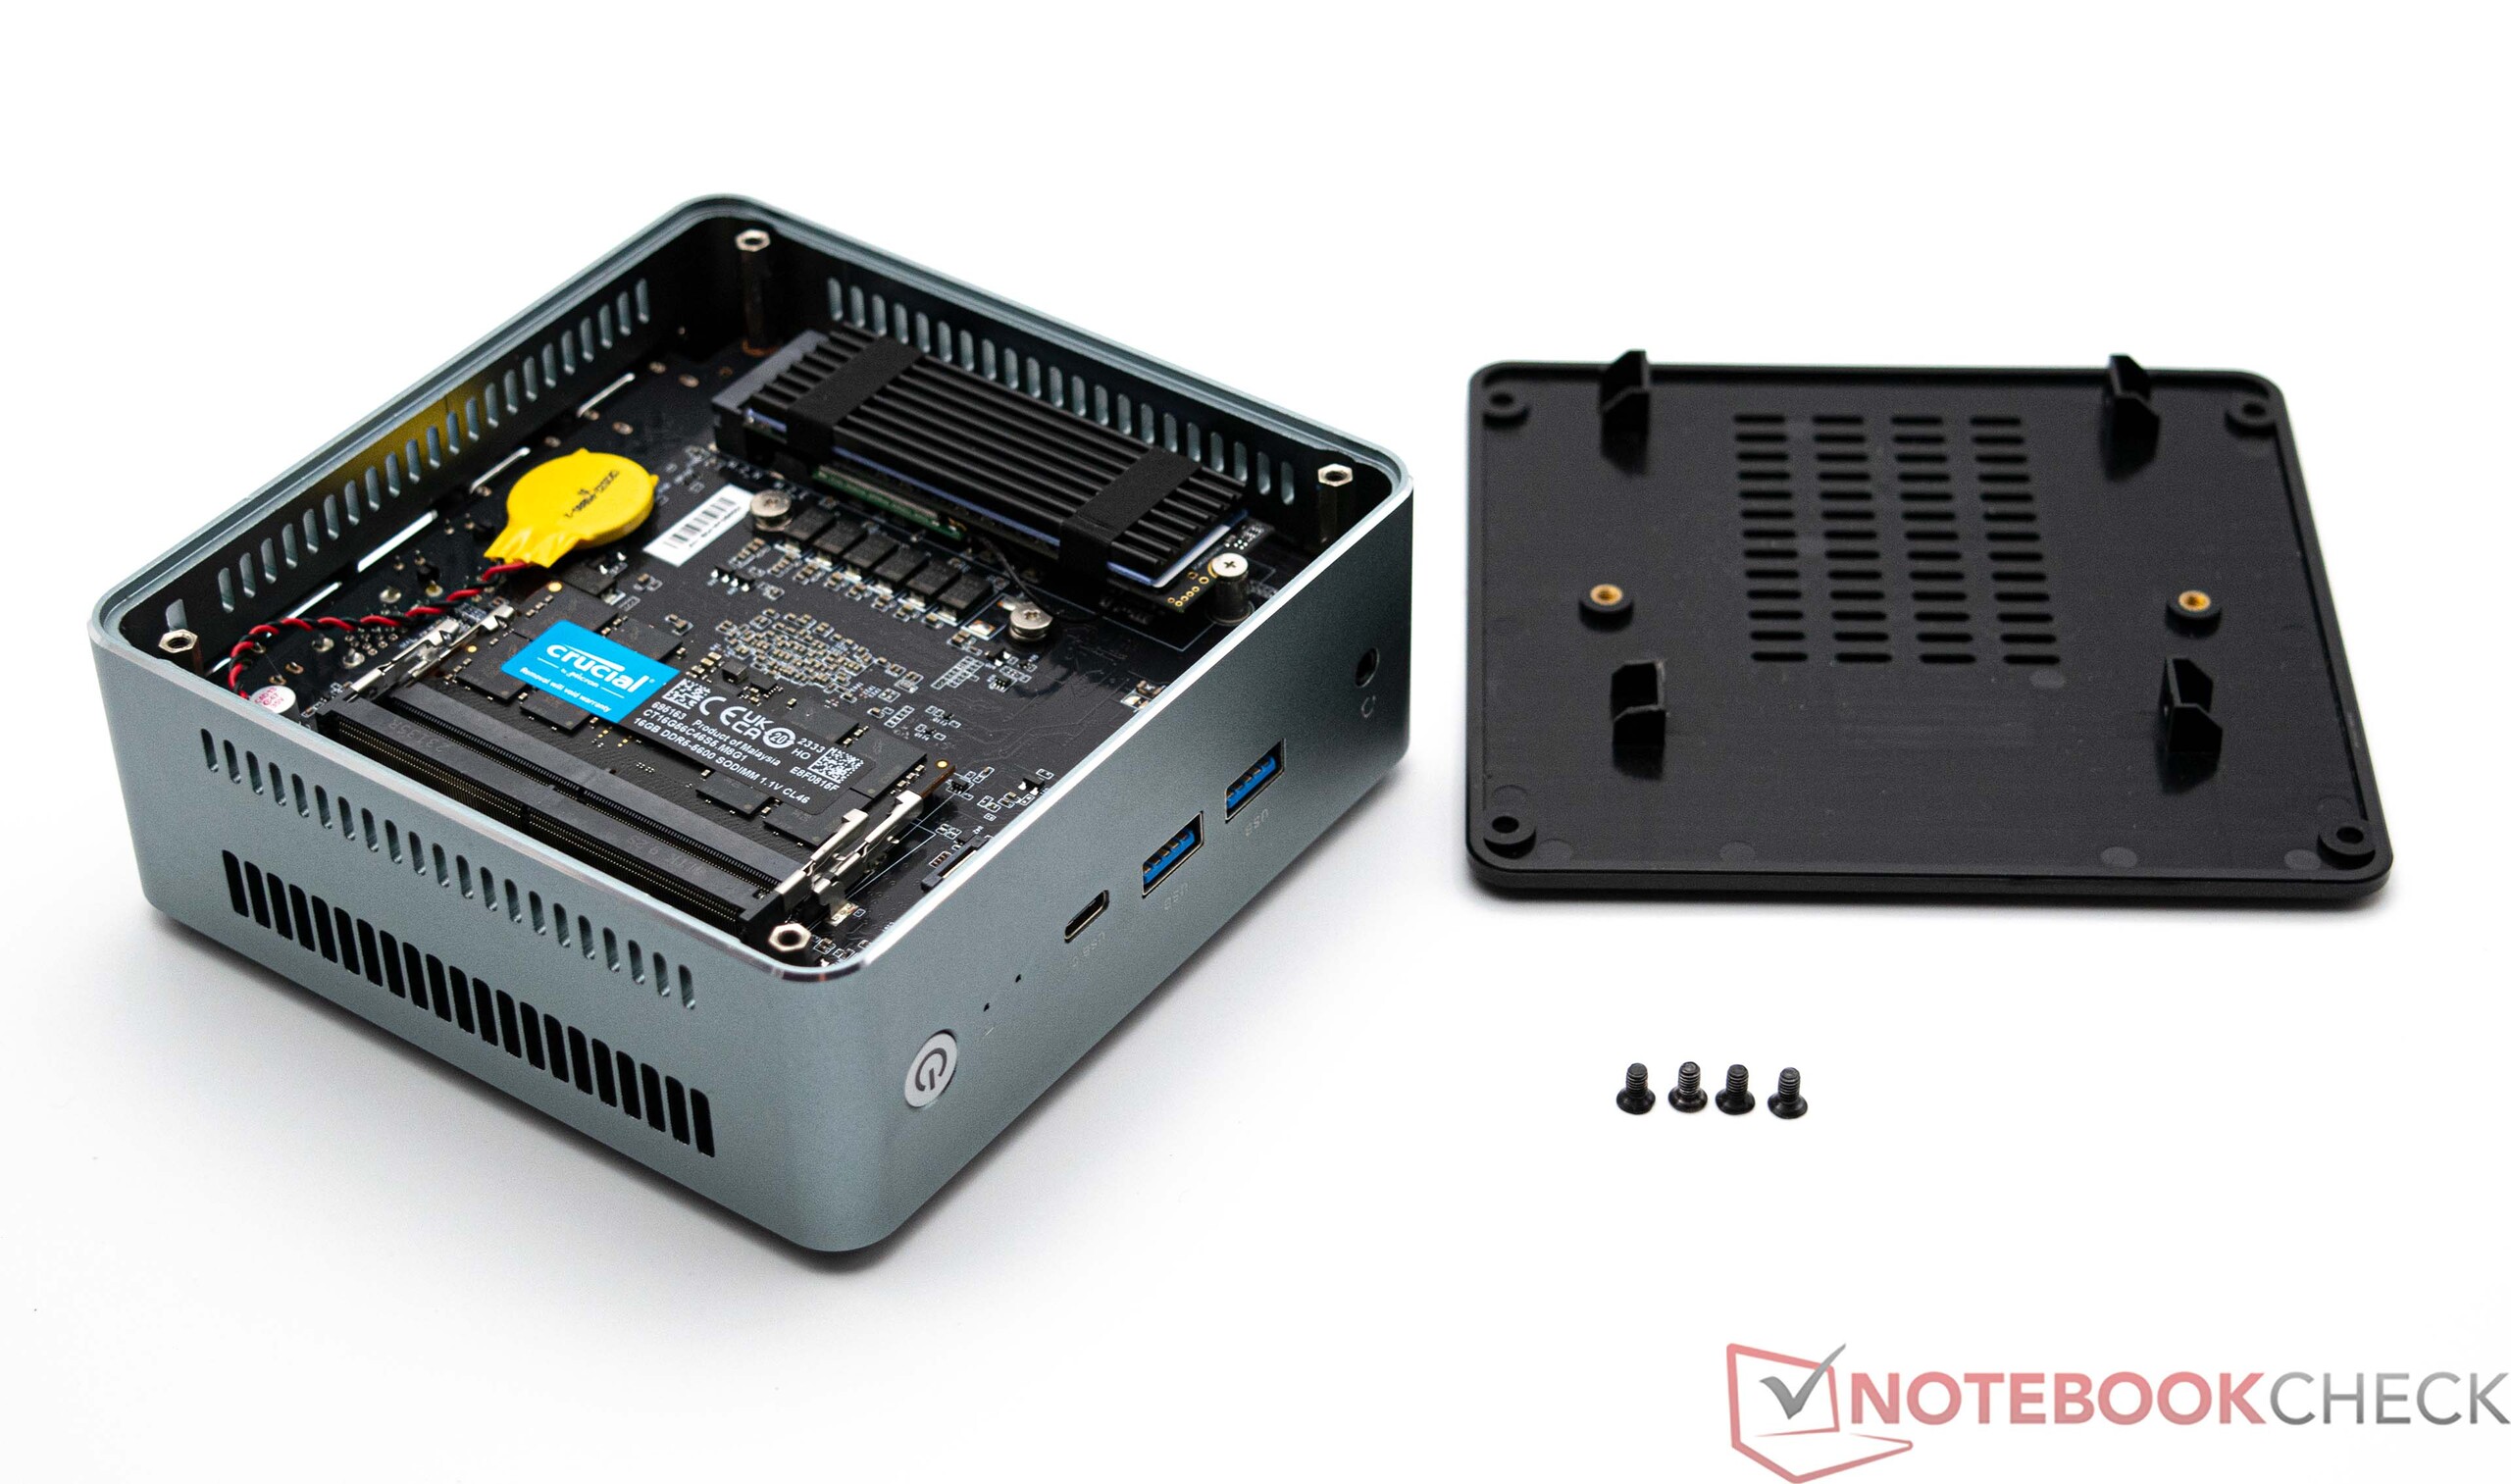
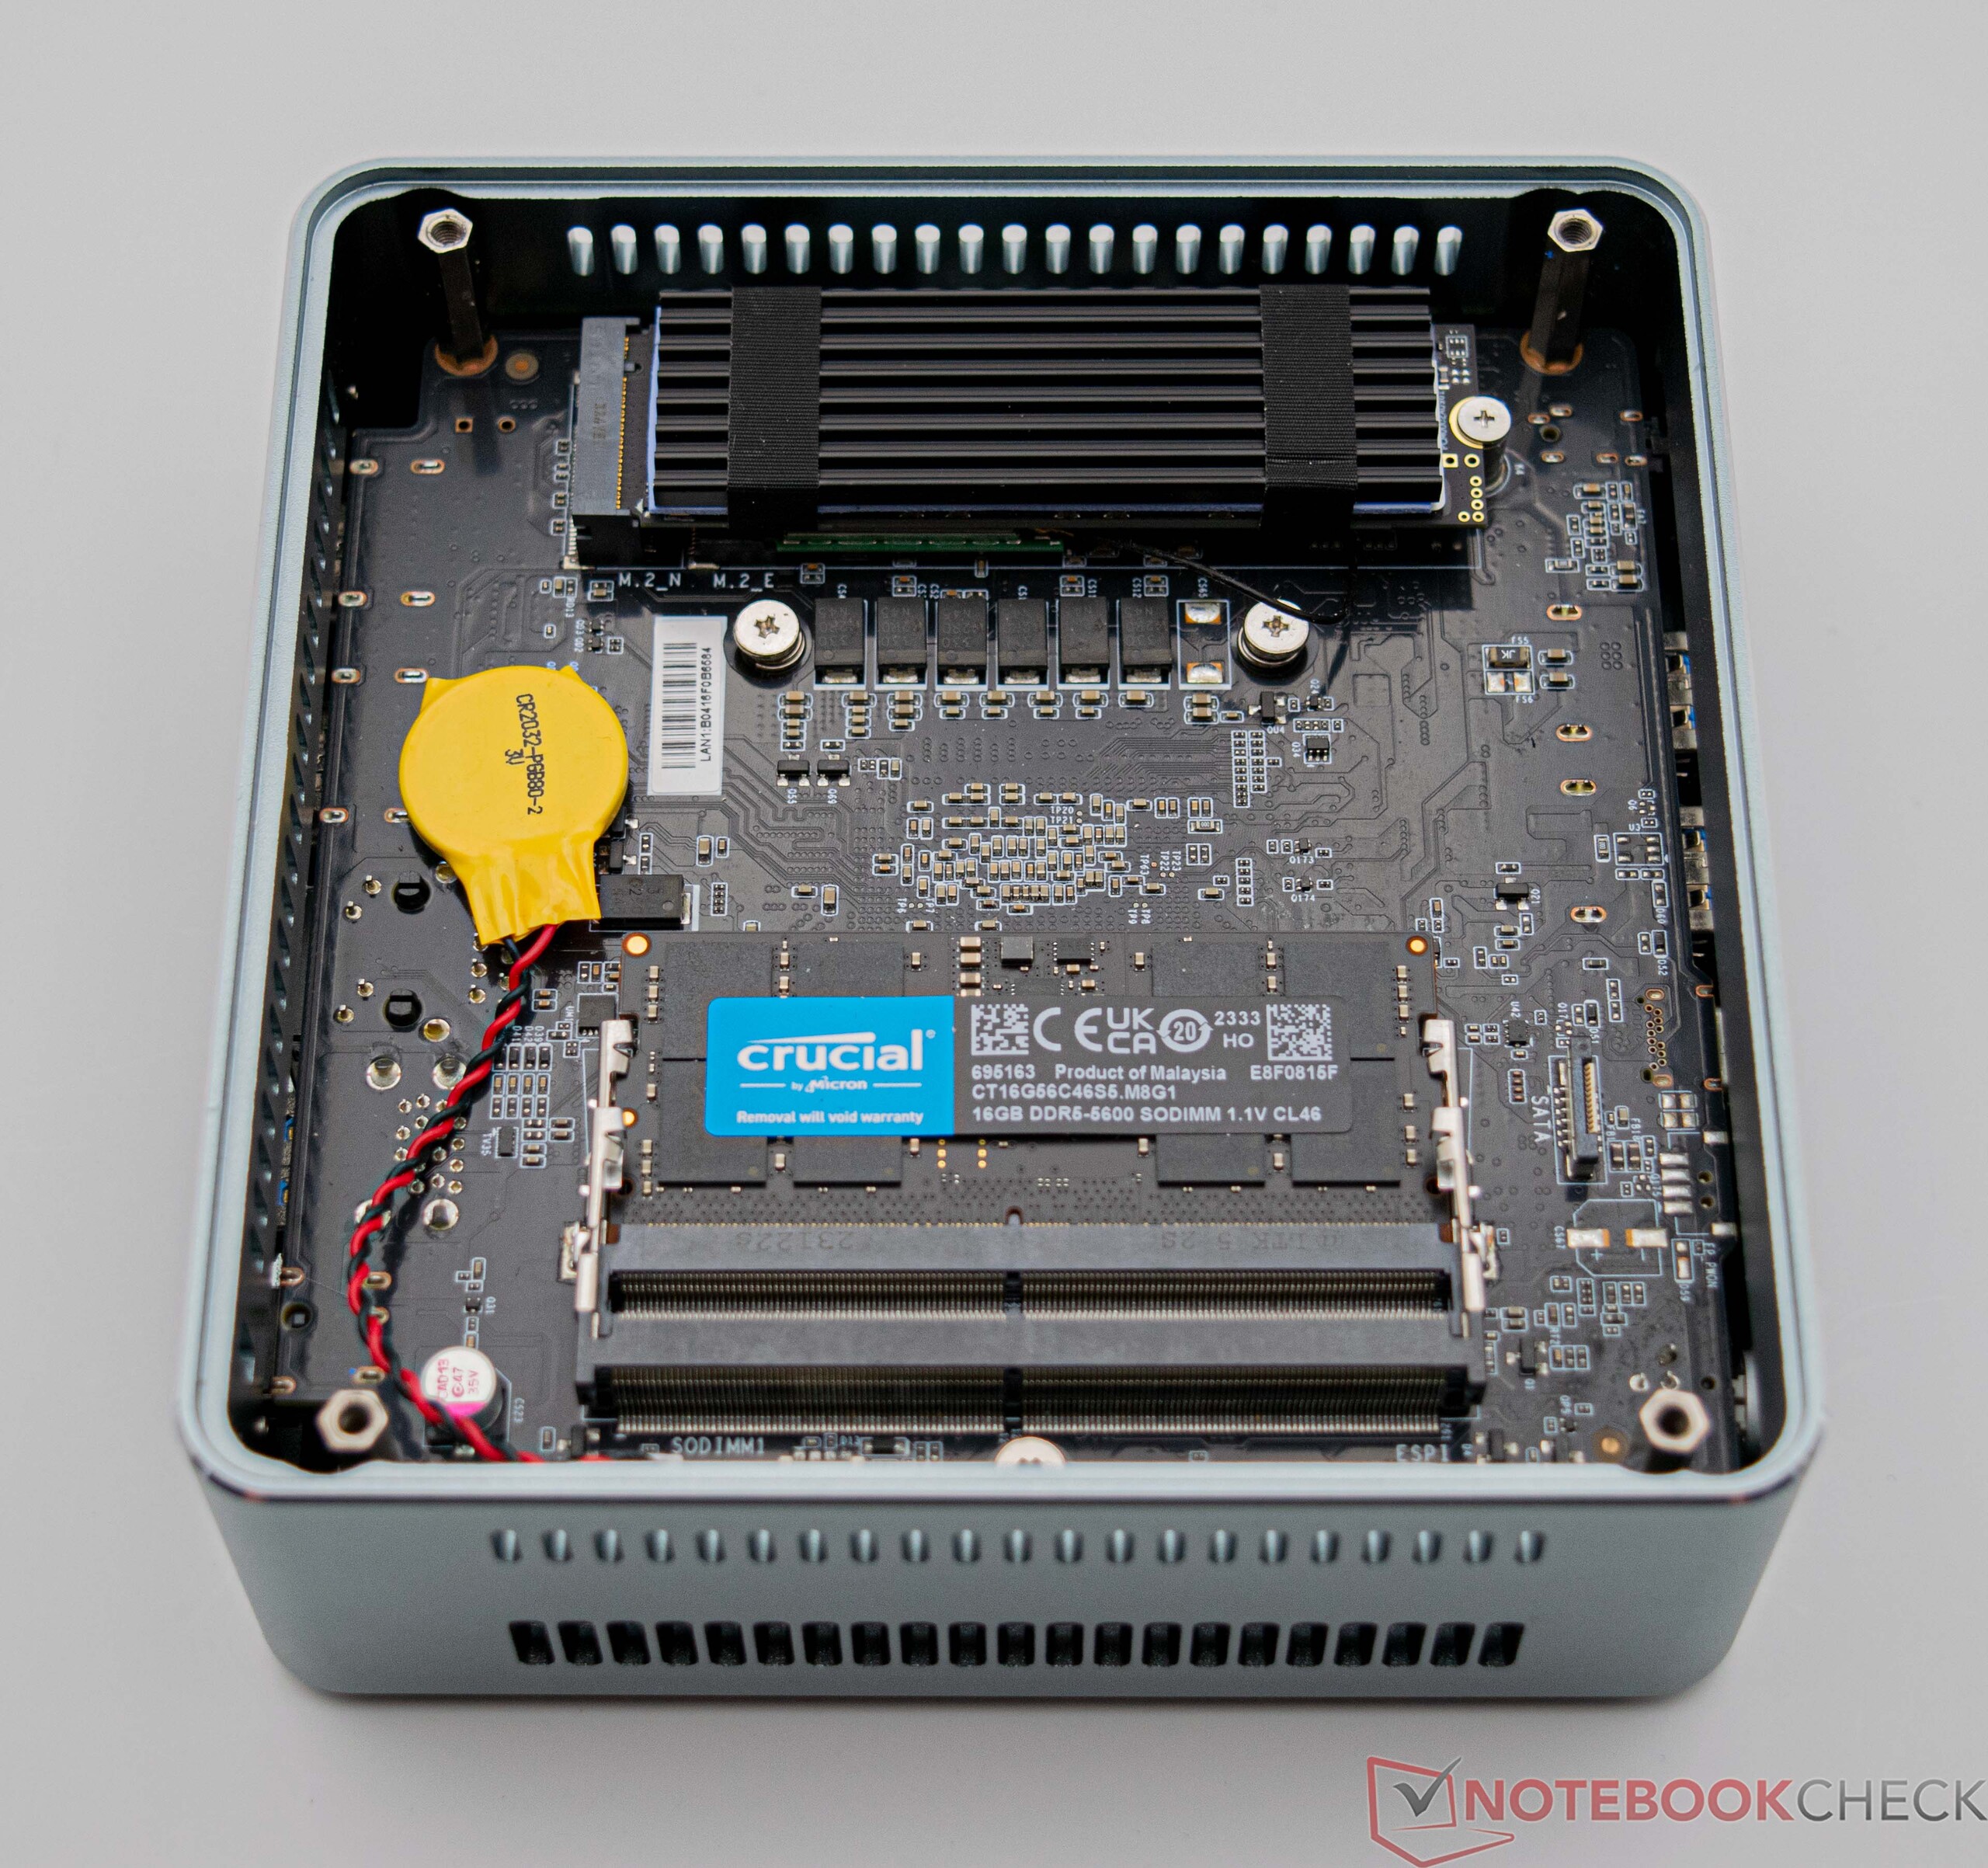
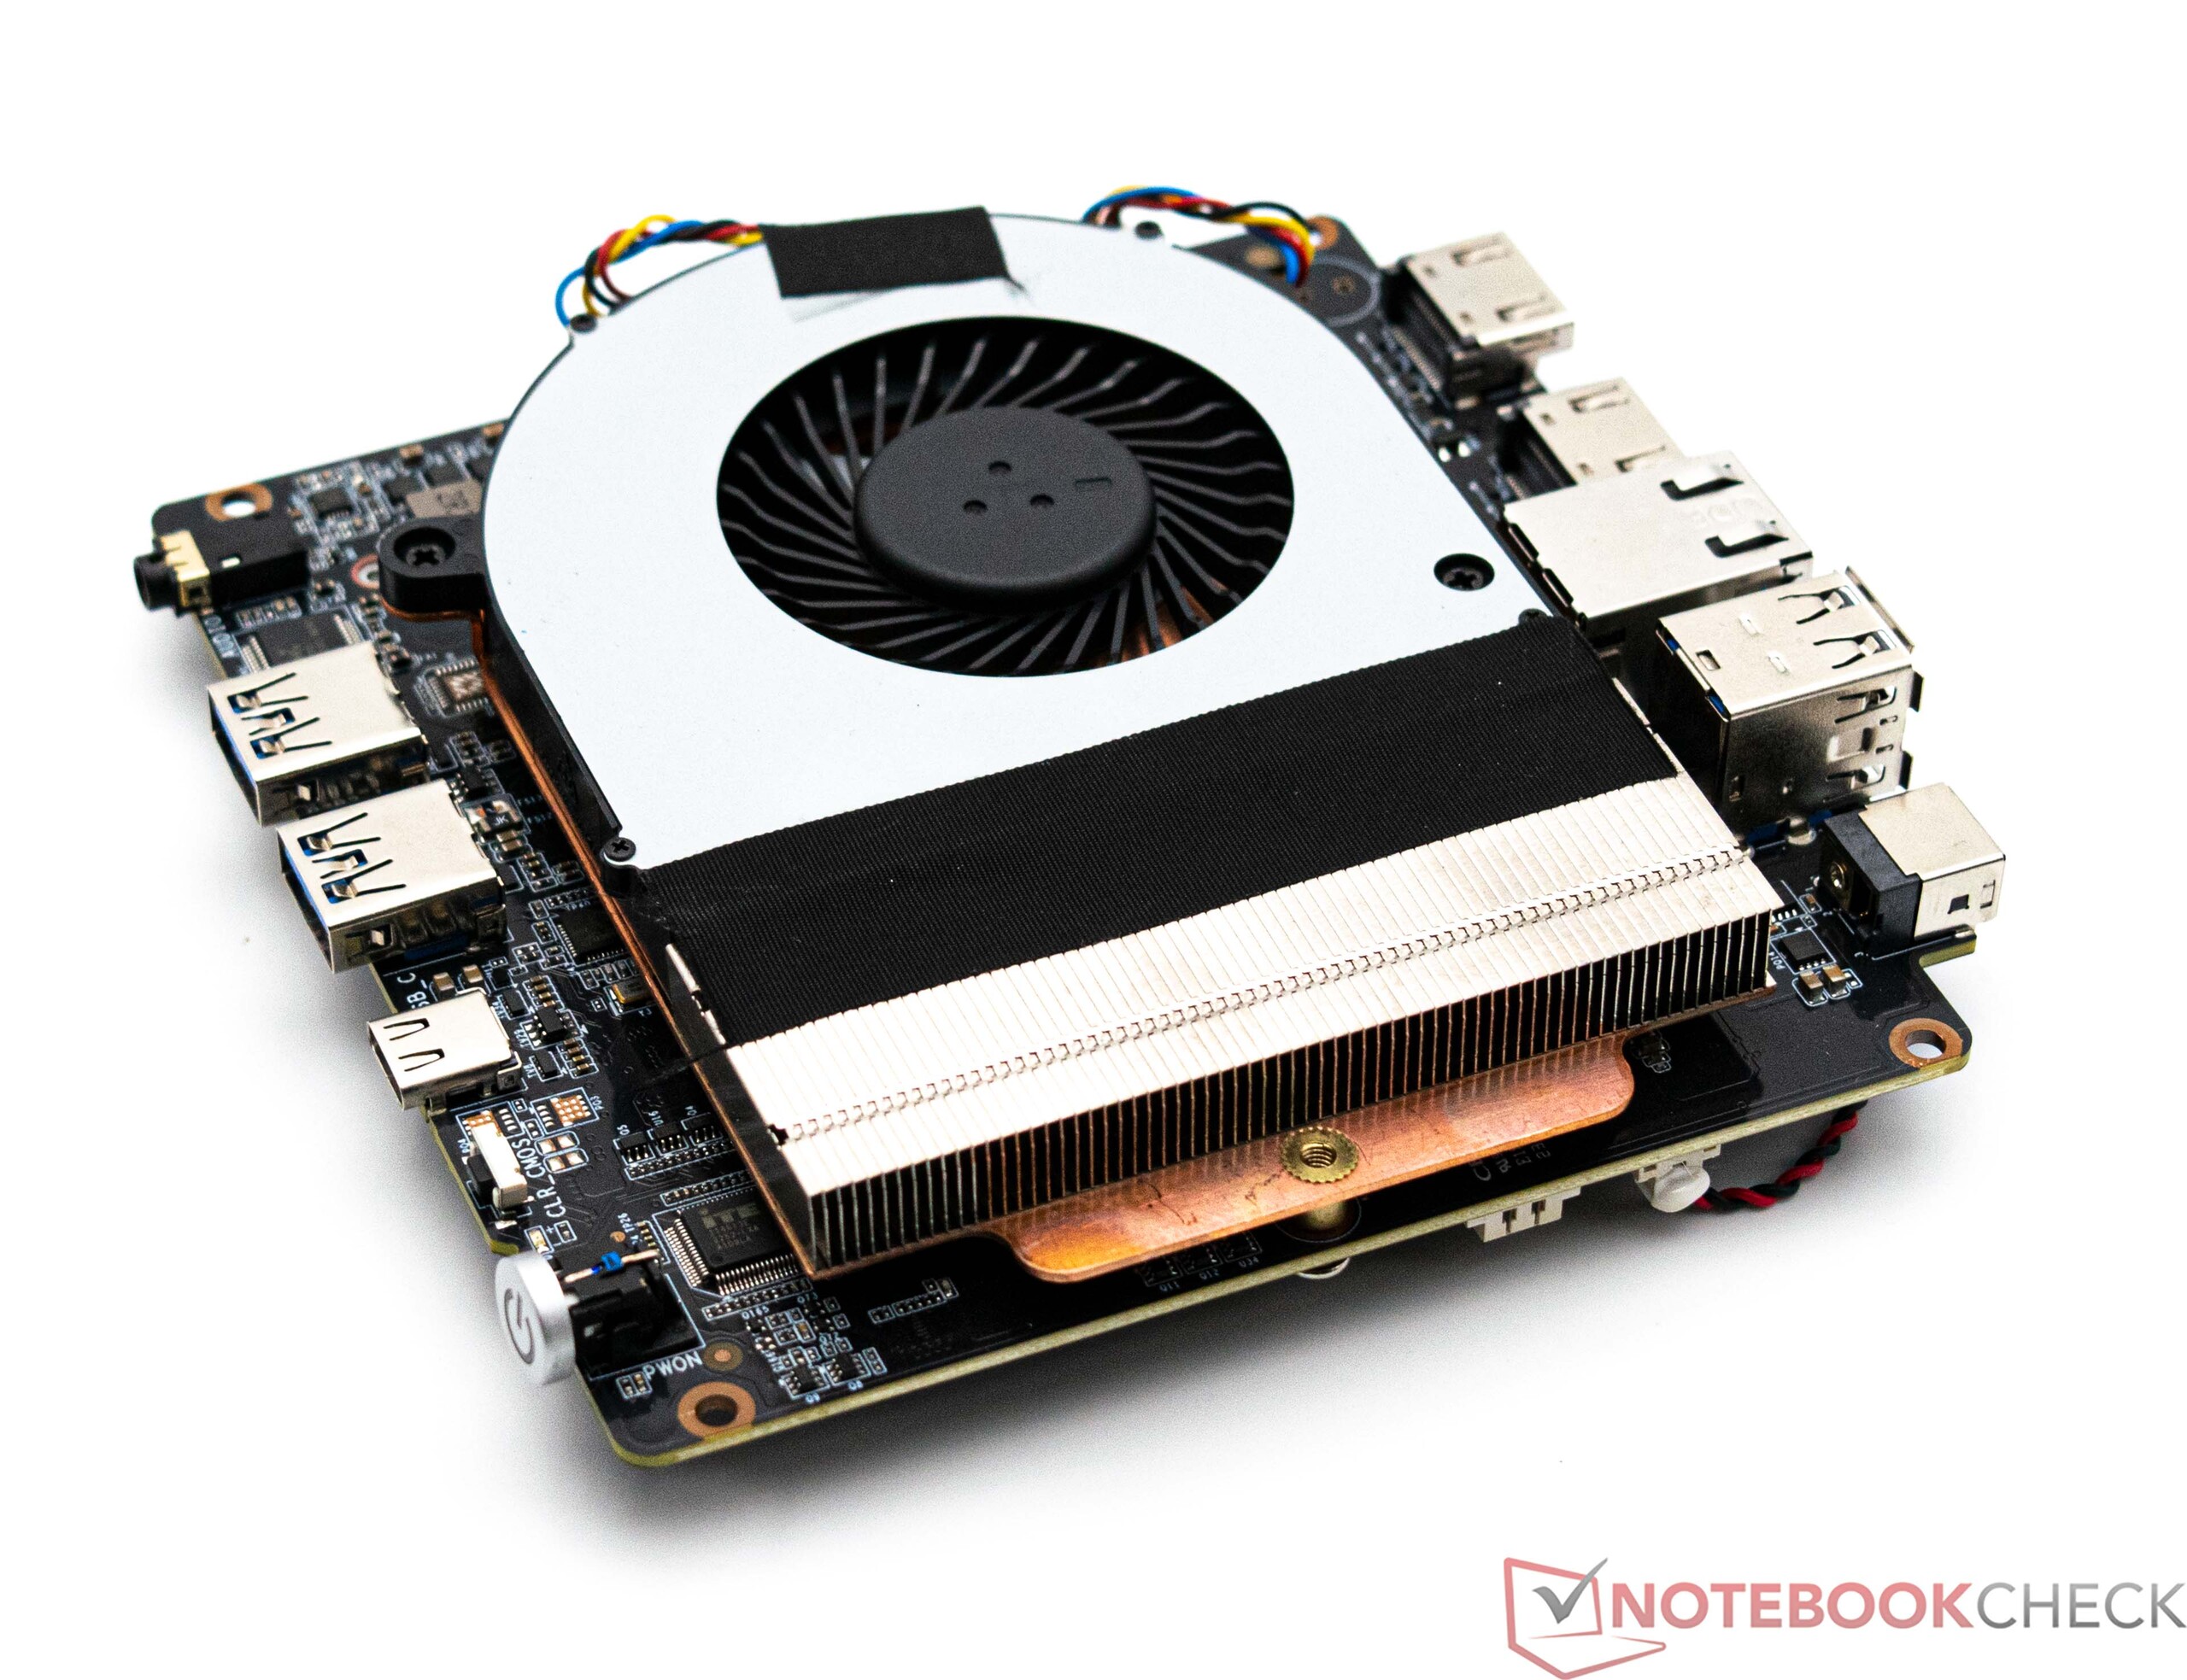
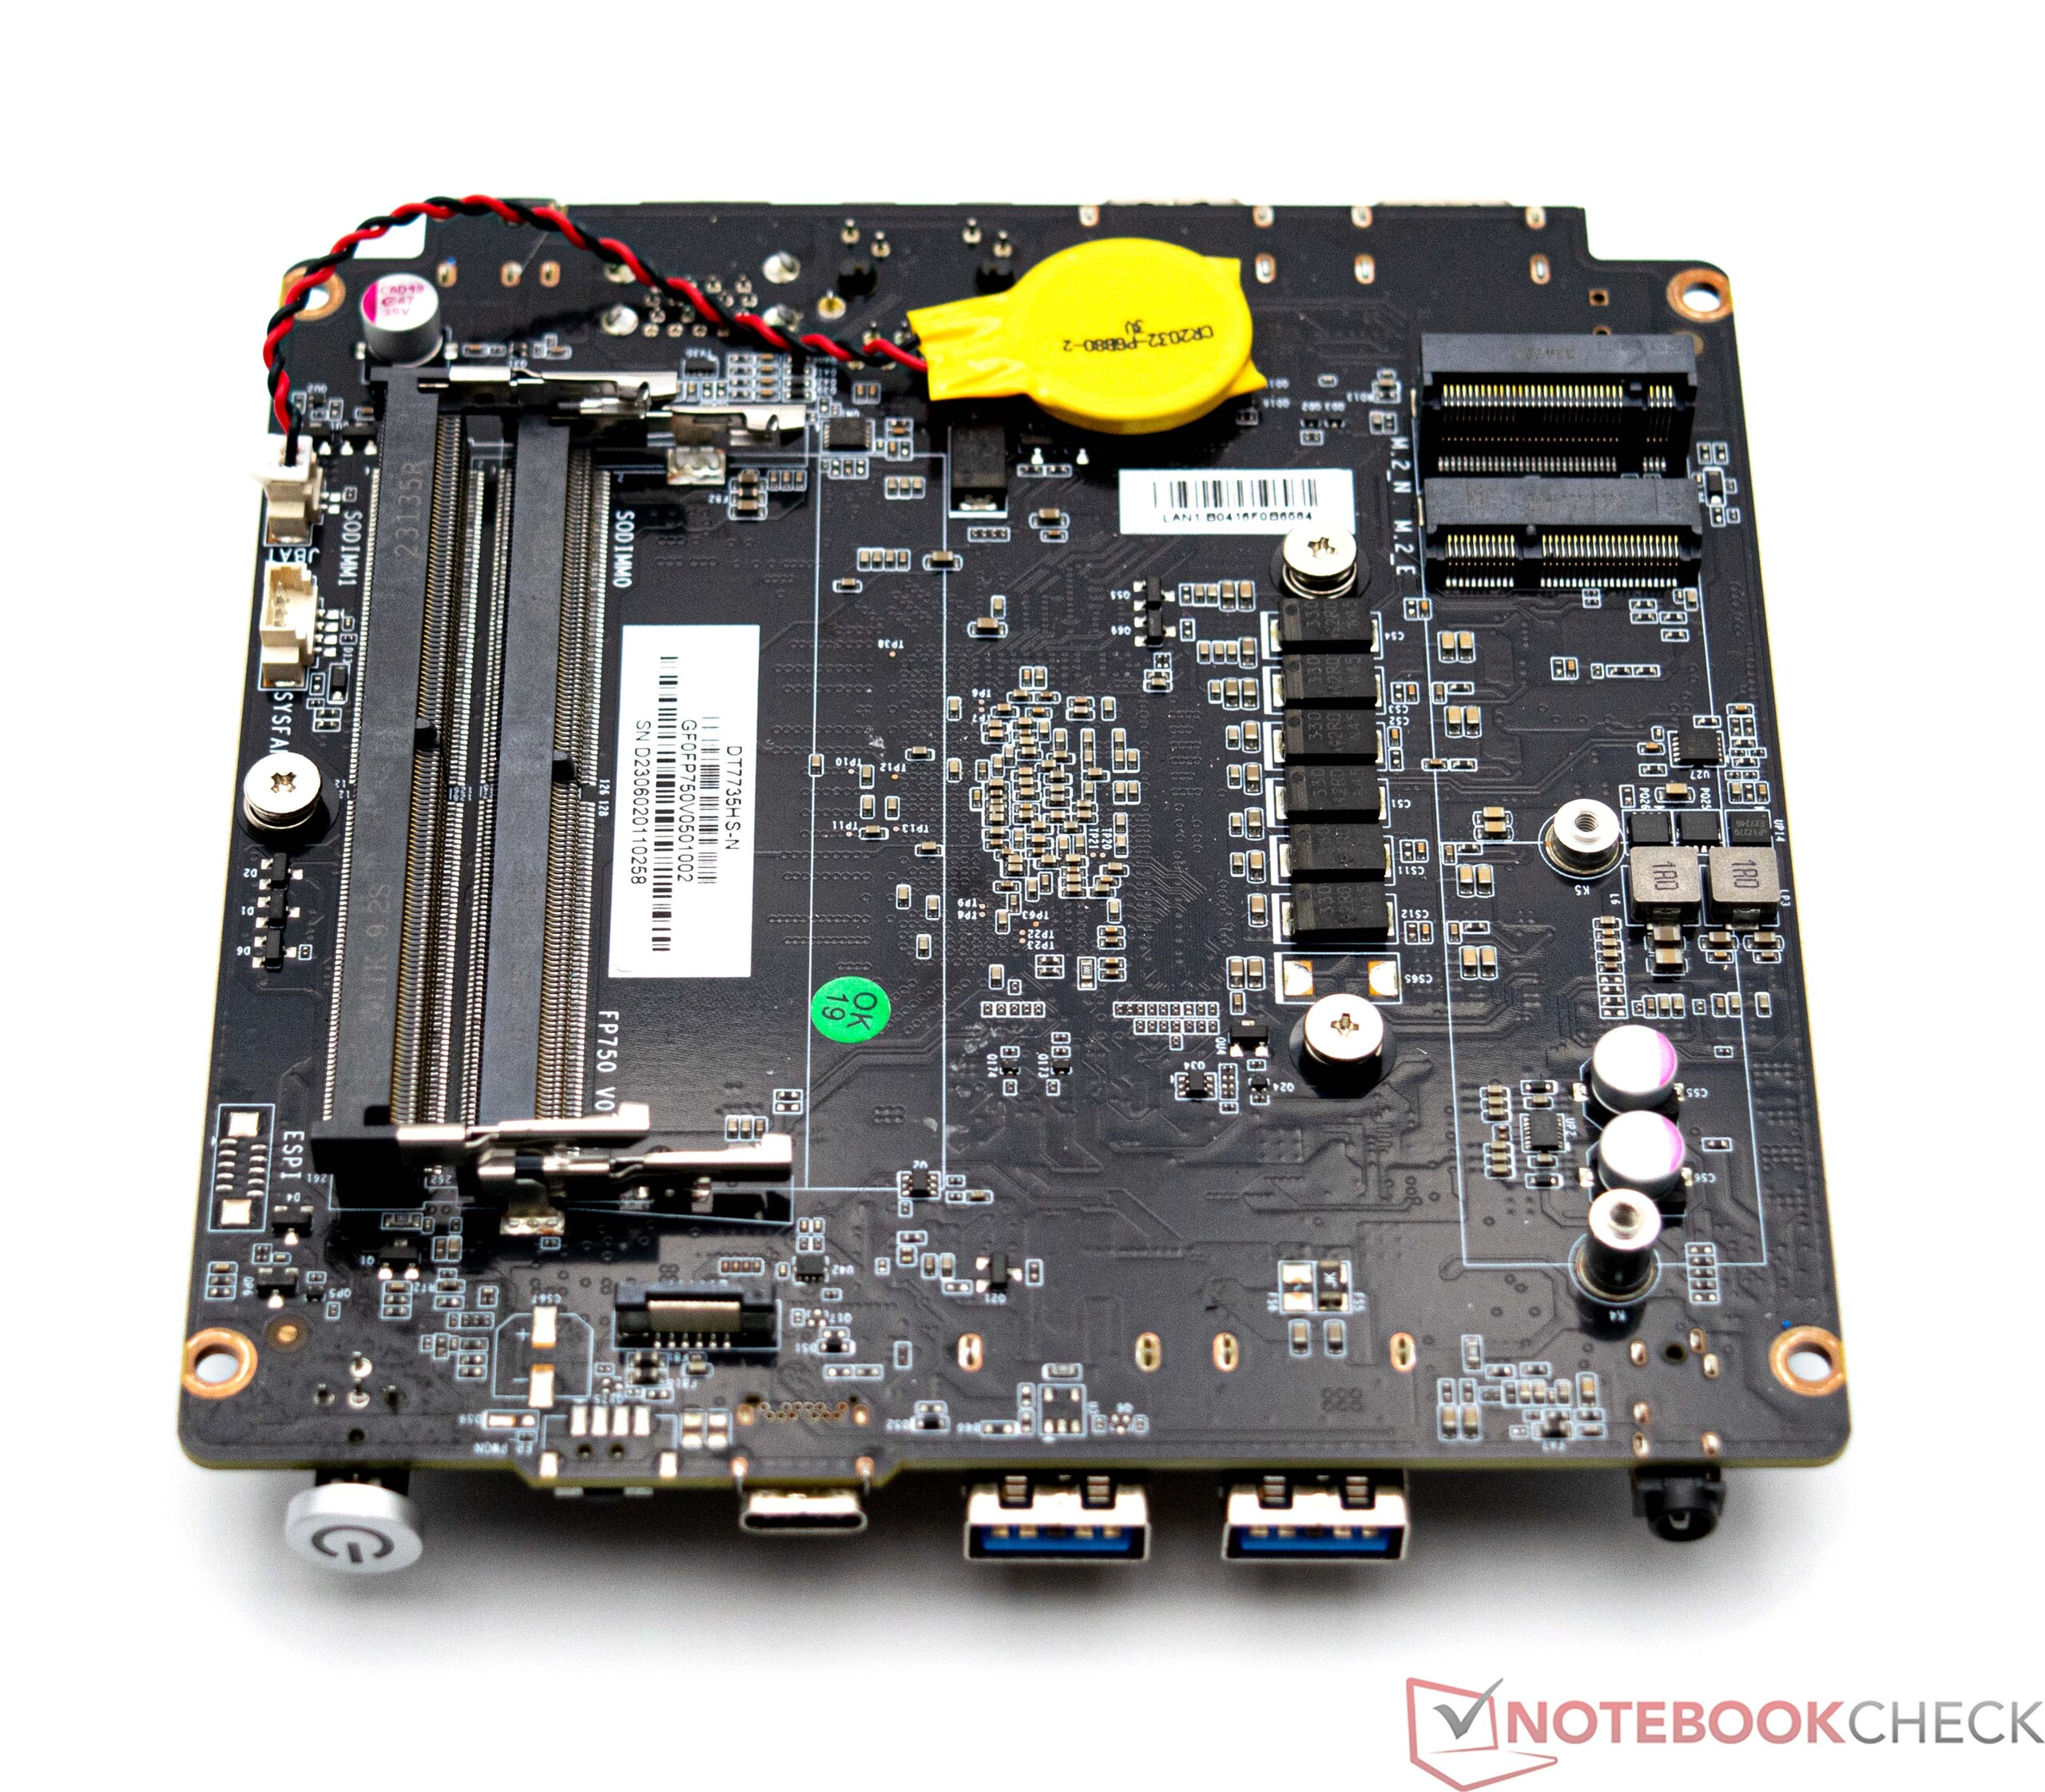
Öffnen lässt sich der Maxtang Mini-PC relativ einfach. Die Unterseite ist mit vier Schrauben fixiert, welche sich unter den aufgeklebten Gummifüßen befinden. Unter der Bodenplatte hat man dann leichten Zugang zum Arbeitsspeicher oder zur M.2-SSD. In unserem Fall ist noch Platz für ein weiteres RAM-Modul und ein zweiter Massenspeicher (2,5-Zoll-Format) lässt sich auch noch im Gerät verbauen. Um an den CPU-Lüfter zu gelangen, muss das Gerät jedoch noch weiter zerlegt werden. Ein schnelles Reinigen ist somit leider nicht möglich.
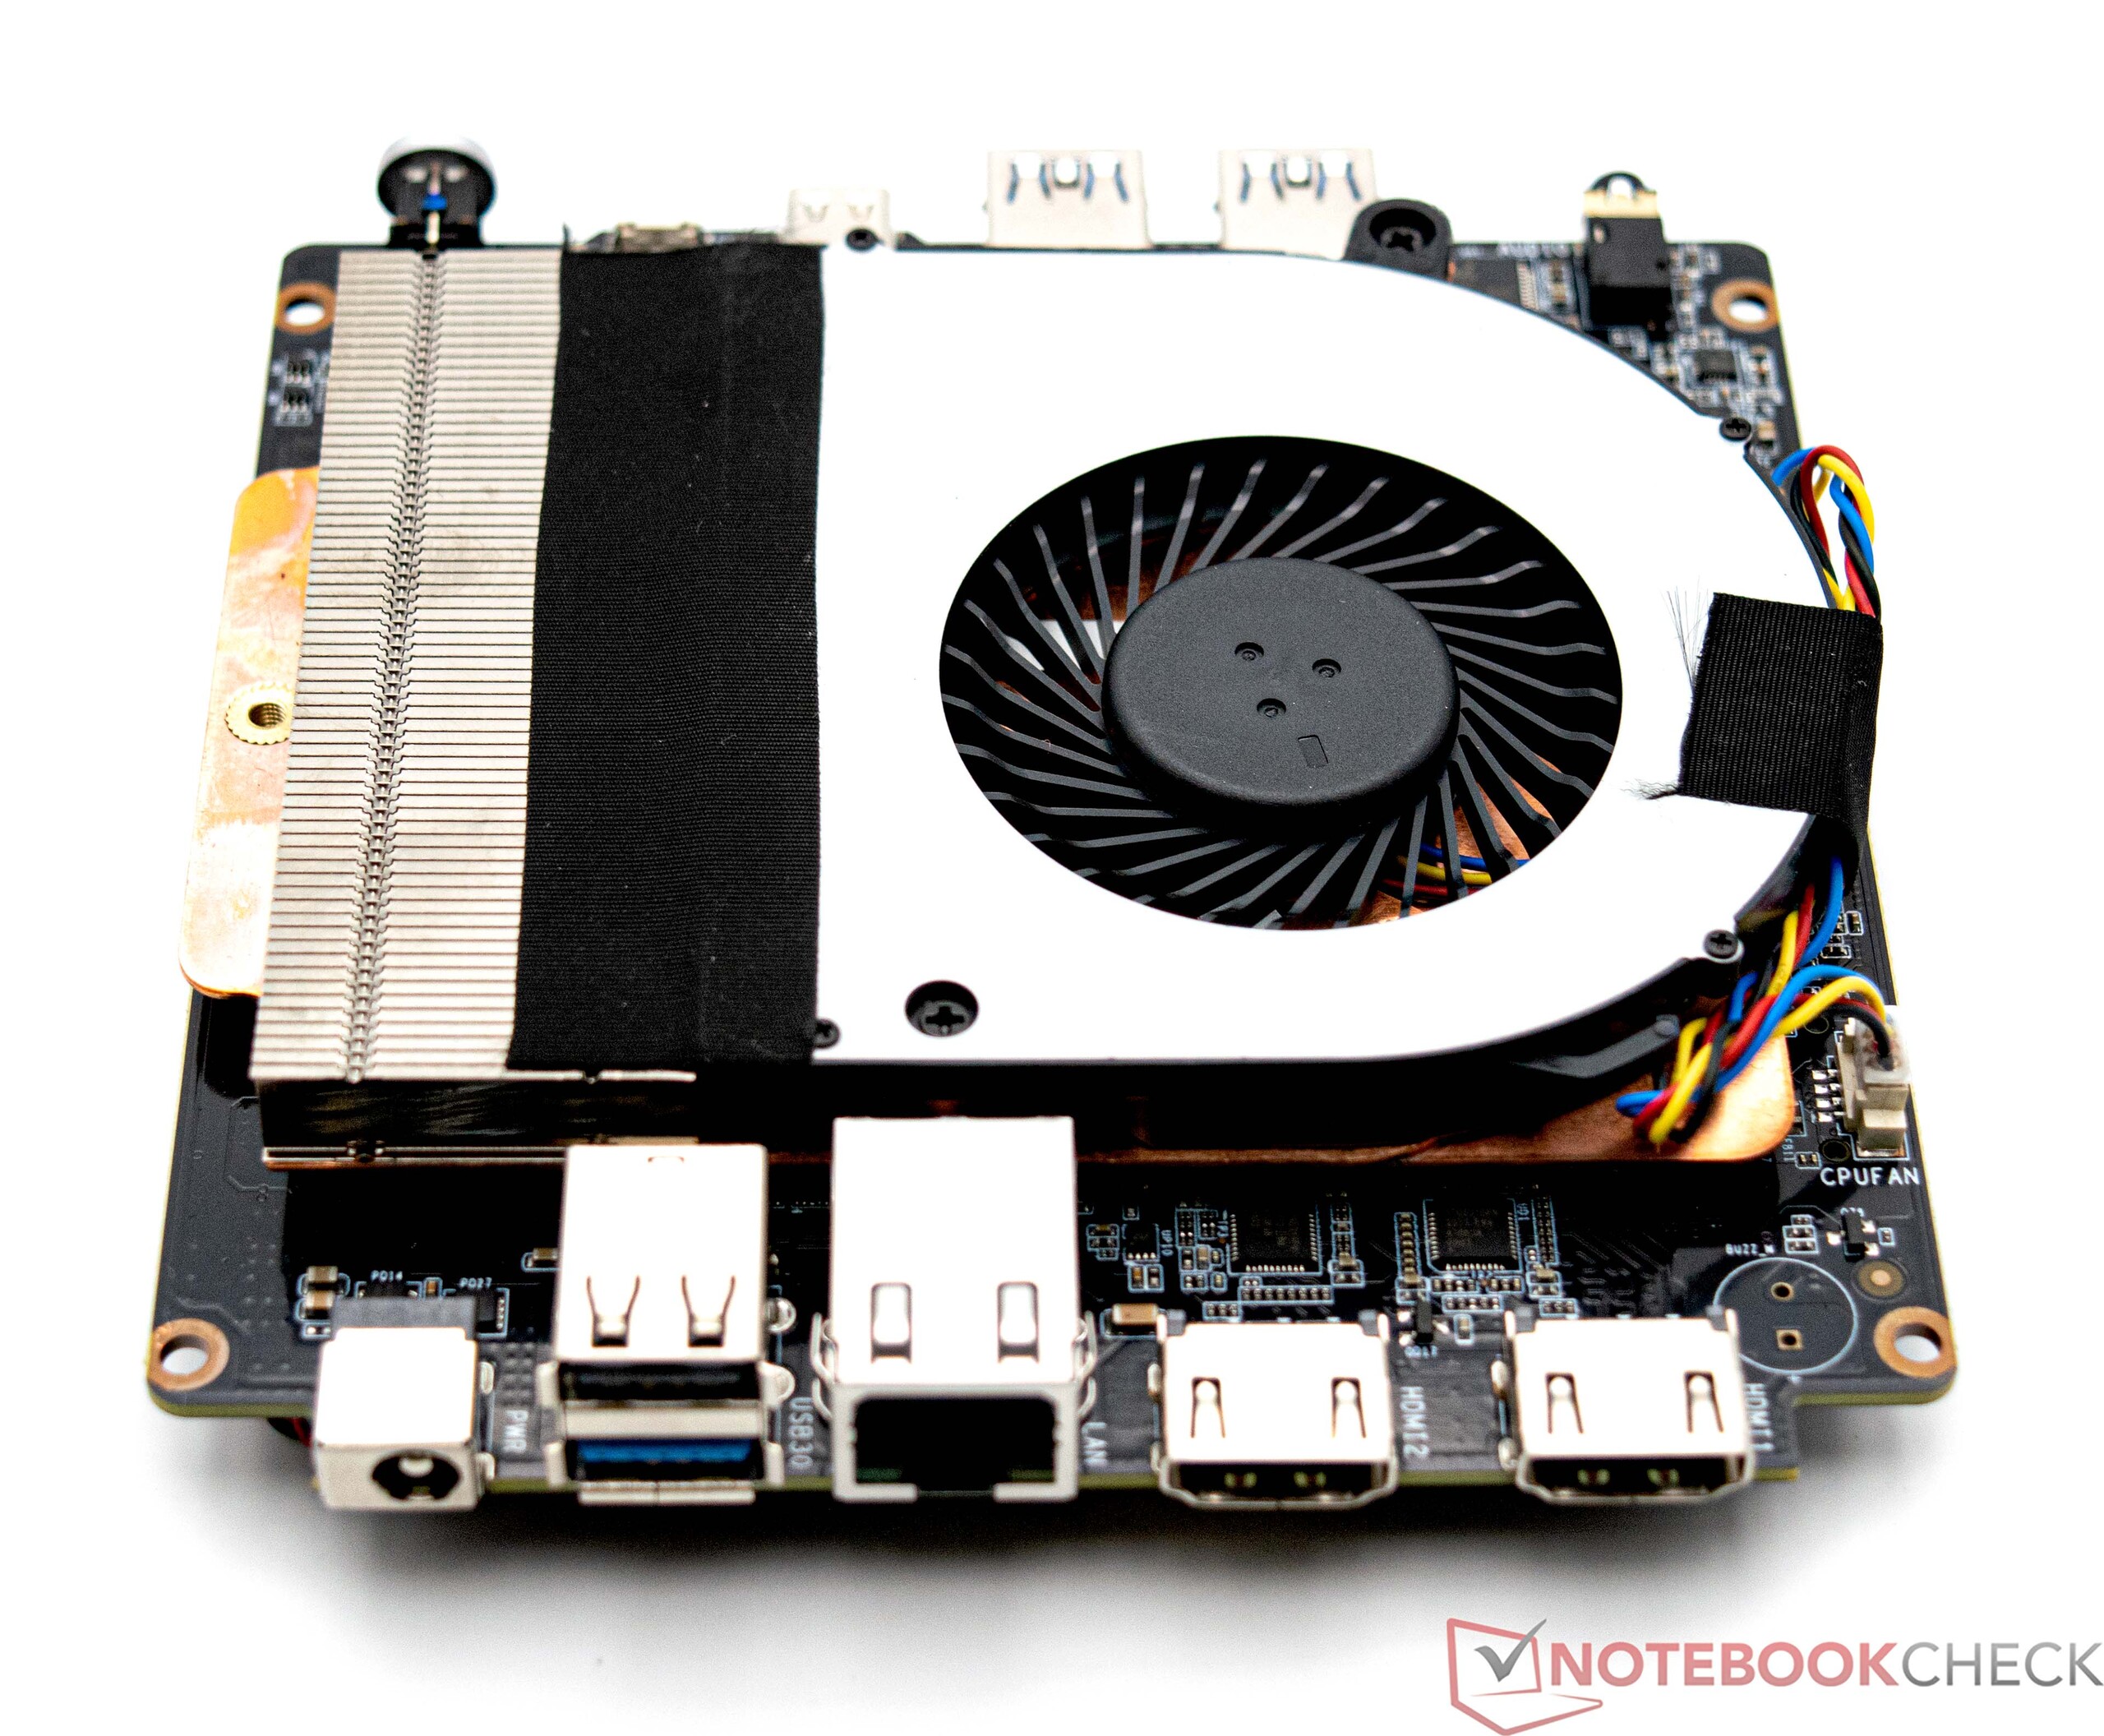
Leistung - AMD Ryzen 7 7735HS mit 8 Kernen und 16 Threads
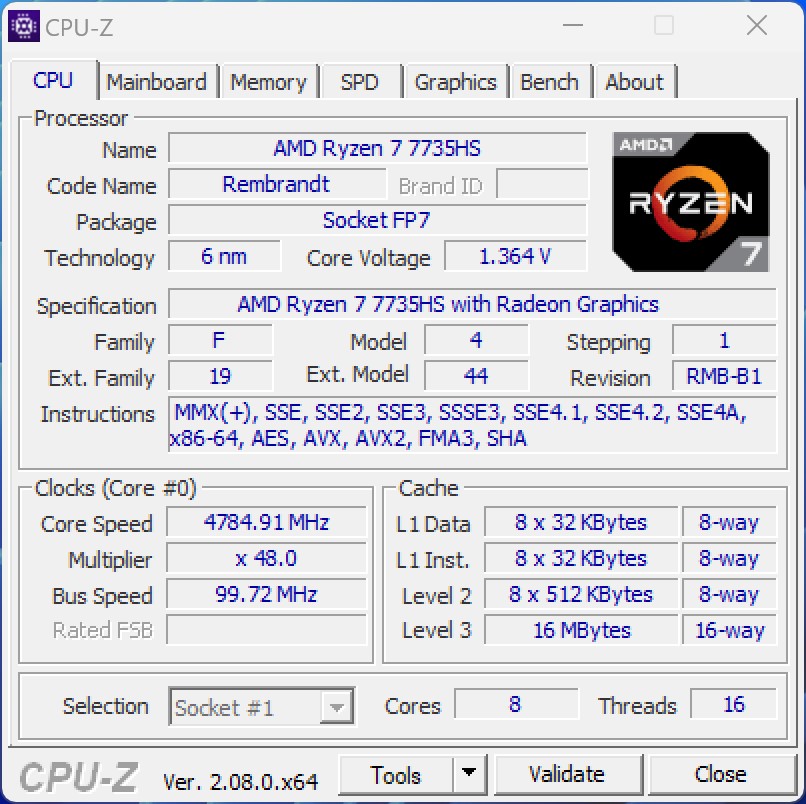
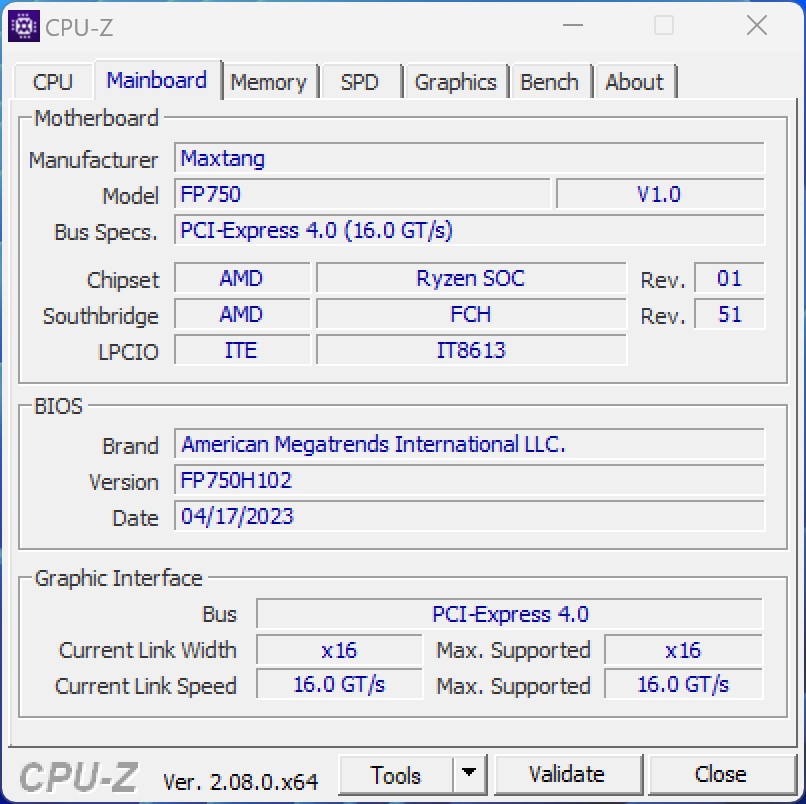
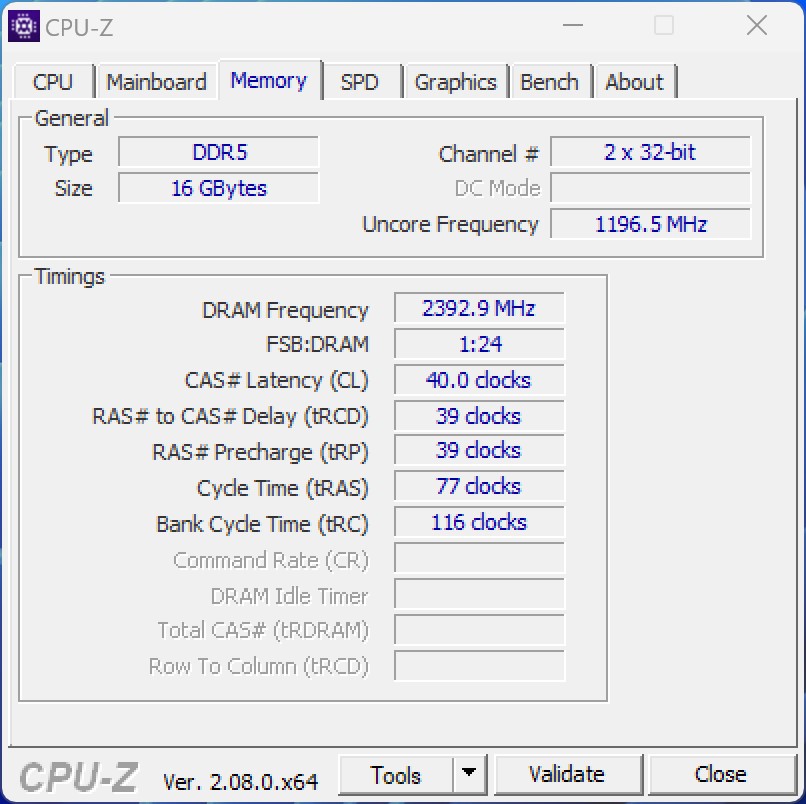
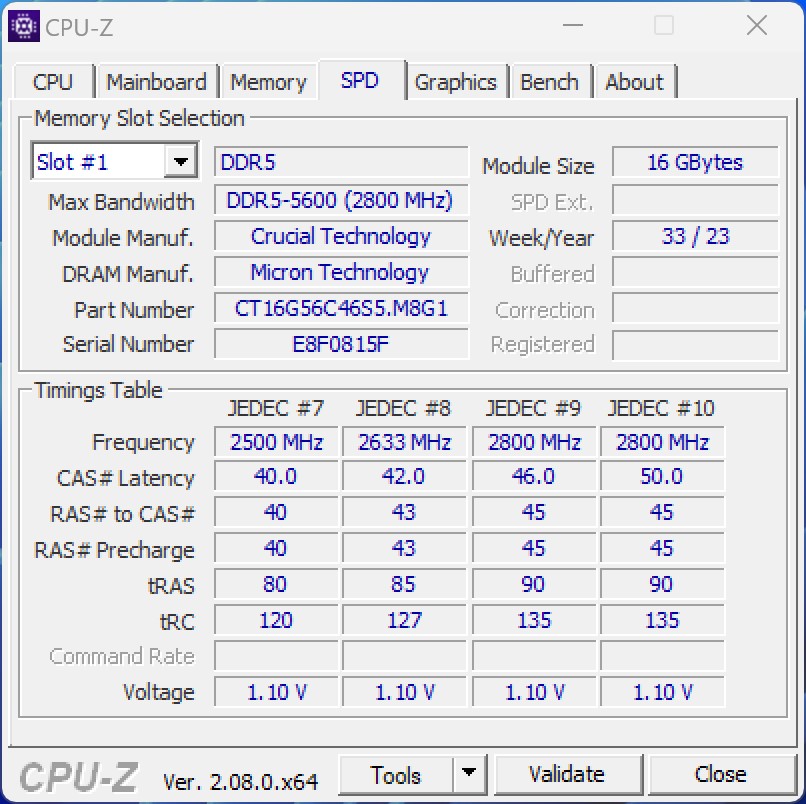
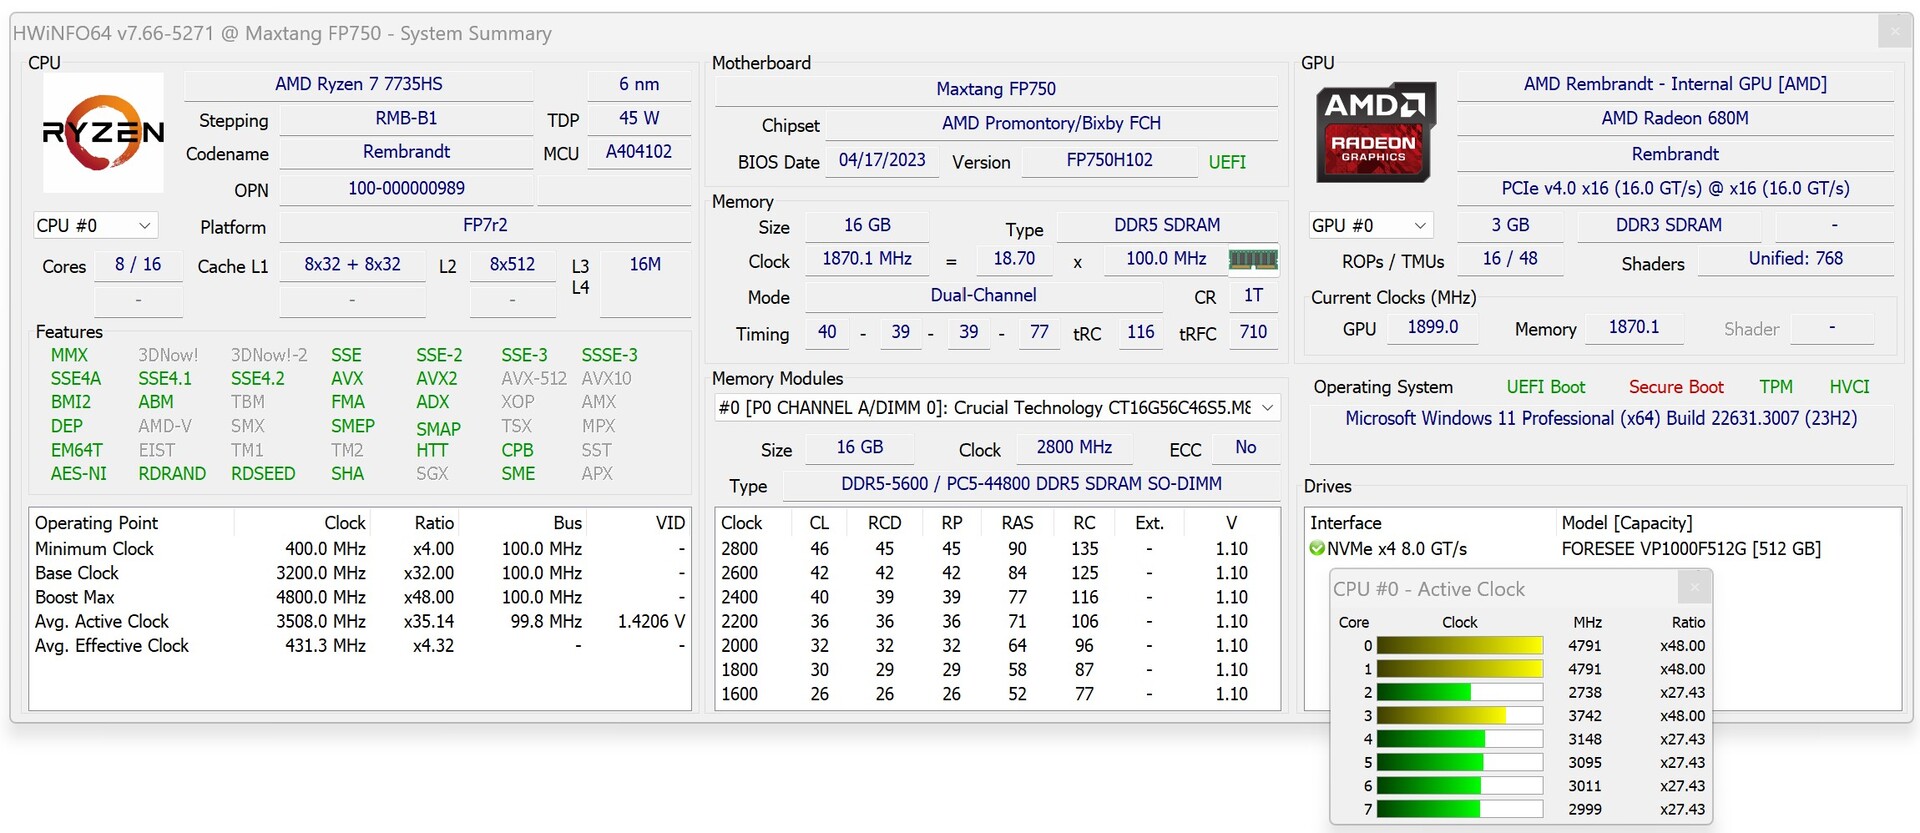
In unserem Testsample des Maxtang MTN-FP750 kommt der AMD Ryzen 7 7735HS zum Einsatz. Mit der AMD Radeon 680M verfügt das SoC zudem über eine leistungsstarke iGPU. Beim Arbeitsspeicher muss der Mini-PC jedoch mit nur einem 16-GB-Modul zurechtkommen. Zudem verbaut der Hersteller ein DDR5-5600-Modul, wenngleich in der Praxis nur DDR5-4800 genutzt werden kann.

Testbedingungen
Alle Leistungstests haben wir mit dem Energieprofil Höchstleistung
durchgeführt. Die Leistung des SoC wurde im BIOS nicht verändert und gemäß den Einstellungen des Herstellers im Auslieferungszustand belassen.
Prozessor
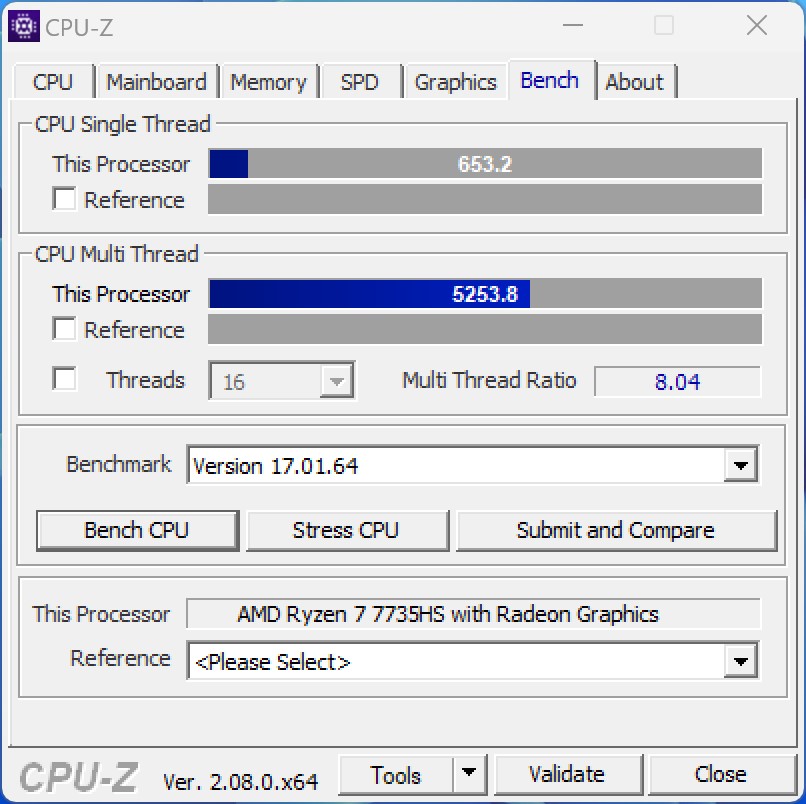
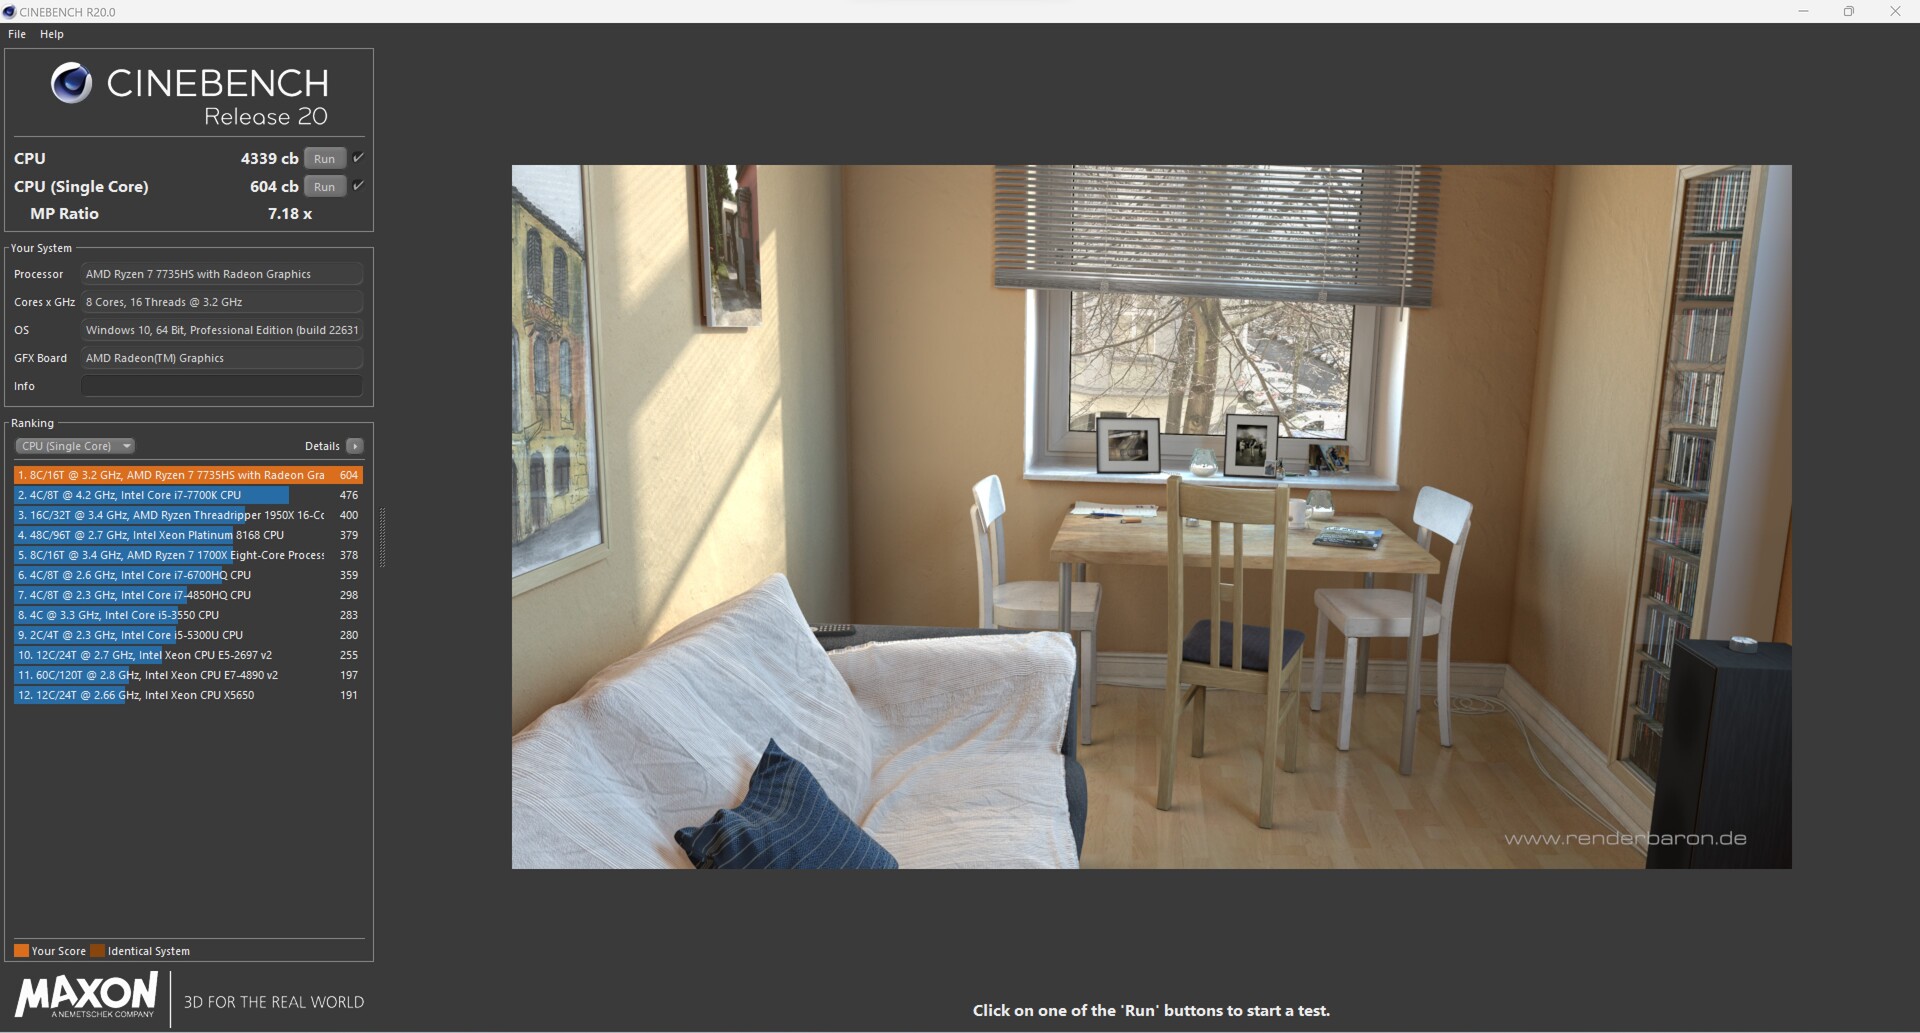
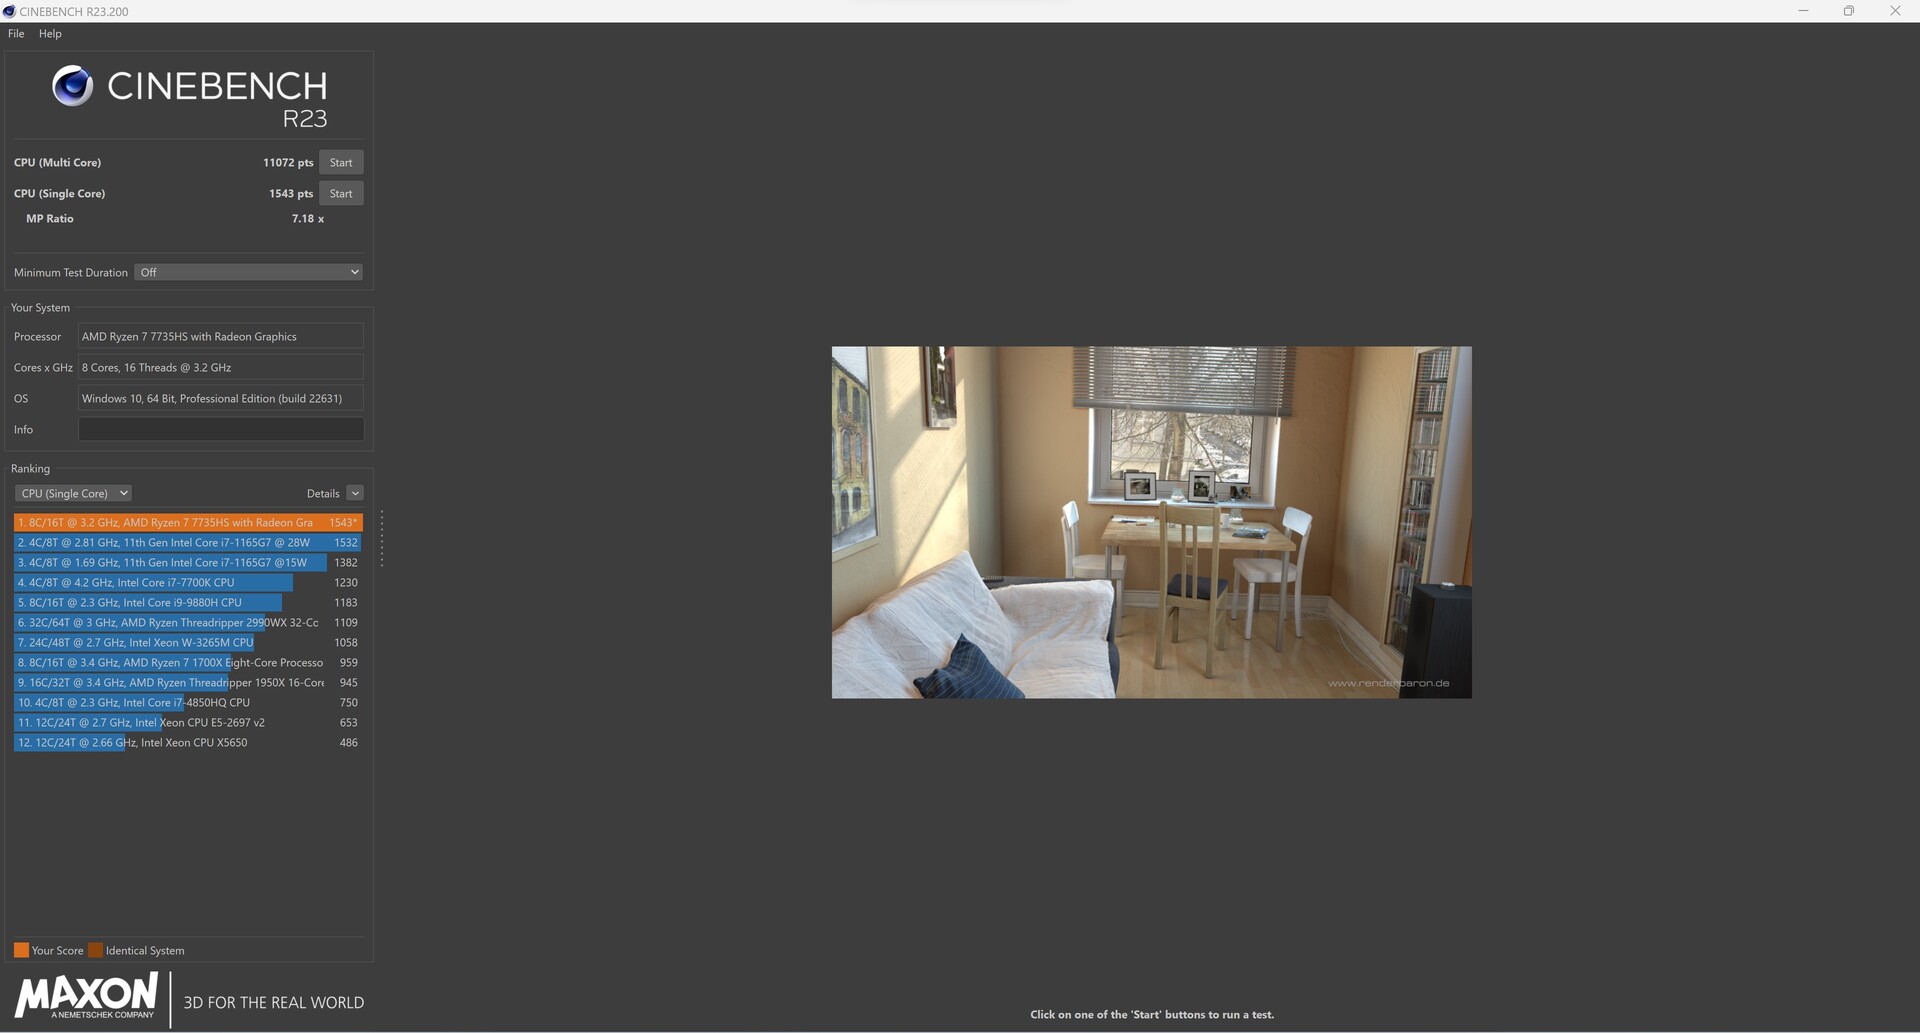
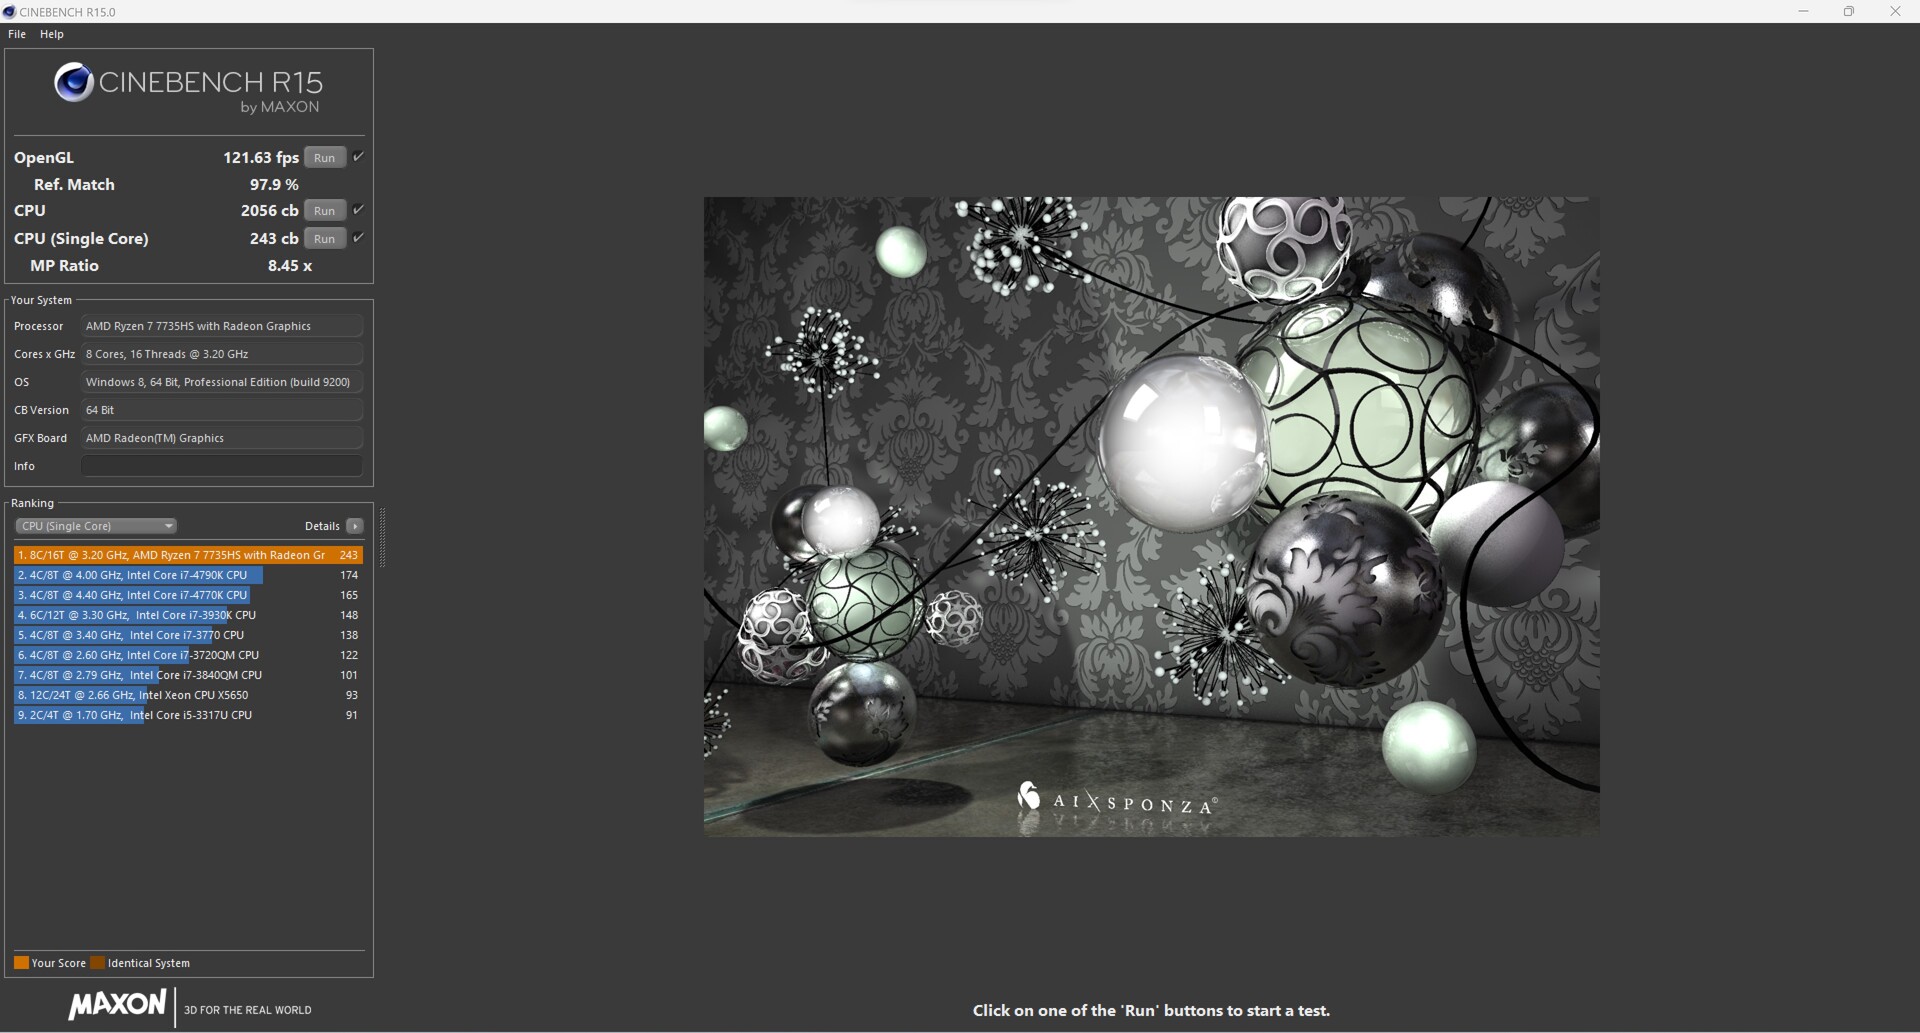
Der AMD Ryzen 7 7735HS ist ein relativ moderner 8-Kern-Prozessor und gehört zur Rembrandt-Serie. Zu den aktuellsten Prozessoren von AMD zählt das Zen3-SoC jedoch nicht mehr. Immerhin kann der Prozessor 16 Threads parallel verarbeiten, was eine gute Multi-Thread-Performance verspricht. Im Leistungsvergleich kann sich unser Maxtang MTN-FP750 nur den vorletzten Platz sichern. Der Grund ist hier die Leistungsbegrenzung des AMD Ryzen 7 7735HS, welche bei 35 Watt liegt.
Weitere Benchmarks zu den Prozessoren finden Sie hier.
Cinebench-Ergebnisse im Auslieferungszustand (PL1 und PL2 = 35 Watt)


Cinebench-Ergebnisse mit höherem Power-Target (PL1 = 54 Watt, PL2 = 65 Watt)

| Performance Rating - Percent | |
| Minisforum Neptune Series NAD9 | |
| Minisforum Venus Series NAB6 | |
| Geekom AS 6, R9 6900HX | |
| NiPoGi AD08 | |
| Geekom Mini IT12 | |
| Geekom A5 | |
| Maxtang MTN-FP750 | |
| Cinebench R10 | |
| Rendering Single CPUs 64Bit | |
| Minisforum Venus Series NAB6 | |
| Geekom Mini IT12 | |
| NiPoGi AD08 | |
| Minisforum Neptune Series NAD9 | |
| Maxtang MTN-FP750 | |
| Geekom AS 6, R9 6900HX | |
| Geekom A5 | |
| Rendering Multiple CPUs 64Bit | |
| Minisforum Neptune Series NAD9 | |
| Minisforum Venus Series NAB6 | |
| Geekom AS 6, R9 6900HX | |
| Geekom A5 | |
| Maxtang MTN-FP750 | |
| NiPoGi AD08 | |
| Geekom Mini IT12 | |
| Blender - v2.79 BMW27 CPU | |
| NiPoGi AD08 | |
| Geekom A5 | |
| Minisforum Venus Series NAB6 | |
| Geekom Mini IT12 | |
| Maxtang MTN-FP750 | |
| Minisforum Neptune Series NAD9 | |
| Geekom AS 6, R9 6900HX | |
| WinRAR - Result | |
| Minisforum Venus Series NAB6 | |
| Minisforum Neptune Series NAD9 | |
| NiPoGi AD08 | |
| Geekom A5 | |
| Geekom AS 6, R9 6900HX | |
| Geekom Mini IT12 | |
| Maxtang MTN-FP750 | |
| 3DMark 11 - 1280x720 Performance Physics | |
| Minisforum Neptune Series NAD9 | |
| Minisforum Venus Series NAB6 | |
| Geekom AS 6, R9 6900HX | |
| Geekom A5 | |
| NiPoGi AD08 | |
| Maxtang MTN-FP750 | |
| Geekom Mini IT12 | |
| HWBOT x265 Benchmark v2.2 - 4k Preset | |
| Geekom AS 6, R9 6900HX | |
| Minisforum Neptune Series NAD9 | |
| Minisforum Venus Series NAB6 | |
| Geekom A5 | |
| Maxtang MTN-FP750 | |
| NiPoGi AD08 | |
| Geekom Mini IT12 | |
| R Benchmark 2.5 - Overall mean | |
| Geekom A5 | |
| Maxtang MTN-FP750 | |
| Geekom AS 6, R9 6900HX | |
| NiPoGi AD08 | |
| Geekom Mini IT12 | |
| Minisforum Neptune Series NAD9 | |
| Minisforum Venus Series NAB6 | |
| LibreOffice - 20 Documents To PDF | |
| Maxtang MTN-FP750 | |
| Geekom A5 | |
| Geekom Mini IT12 | |
| NiPoGi AD08 | |
| Geekom AS 6, R9 6900HX | |
| Minisforum Venus Series NAB6 | |
| Minisforum Neptune Series NAD9 | |
| WebXPRT 3 - Overall | |
| Minisforum Neptune Series NAD9 | |
| Minisforum Venus Series NAB6 | |
| NiPoGi AD08 | |
| Geekom Mini IT12 | |
| Maxtang MTN-FP750 | |
| Geekom A5 | |
| Geekom AS 6, R9 6900HX | |
| Mozilla Kraken 1.1 - Total | |
| Geekom A5 | |
| Geekom AS 6, R9 6900HX | |
| Maxtang MTN-FP750 | |
| Minisforum Neptune Series NAD9 | |
| Geekom Mini IT12 | |
| NiPoGi AD08 | |
| Minisforum Venus Series NAB6 | |
* ... kleinere Werte sind besser
AIDA64: FP32 Ray-Trace | FPU Julia | CPU SHA3 | CPU Queen | FPU SinJulia | FPU Mandel | CPU AES | CPU ZLib | FP64 Ray-Trace | CPU PhotoWorxx
| Performance Rating | |
| Durchschnitt der Klasse Mini PC | |
| Geekom AS 6, R9 6900HX | |
| Geekom A5 | |
| Maxtang MTN-FP750 | |
| Minisforum Neptune Series NAD9 | |
| Minisforum Venus Series NAB6 | |
| NiPoGi AD08 | |
| Geekom Mini IT12 | |
| AIDA64 / FP32 Ray-Trace | |
| Durchschnitt der Klasse Mini PC (974 - 82725, n=104, der letzten 2 Jahre) | |
| Geekom AS 6, R9 6900HX | |
| Maxtang MTN-FP750 | |
| Geekom A5 | |
| Minisforum Neptune Series NAD9 | |
| Minisforum Venus Series NAB6 | |
| NiPoGi AD08 | |
| Geekom Mini IT12 | |
| AIDA64 / FPU Julia | |
| Durchschnitt der Klasse Mini PC (6115 - 363782, n=104, der letzten 2 Jahre) | |
| Geekom AS 6, R9 6900HX | |
| Maxtang MTN-FP750 | |
| Geekom A5 | |
| Minisforum Neptune Series NAD9 | |
| Minisforum Venus Series NAB6 | |
| NiPoGi AD08 | |
| Geekom Mini IT12 | |
| AIDA64 / CPU SHA3 | |
| Durchschnitt der Klasse Mini PC (385 - 9475, n=104, der letzten 2 Jahre) | |
| Geekom AS 6, R9 6900HX | |
| Maxtang MTN-FP750 | |
| Geekom A5 | |
| Minisforum Neptune Series NAD9 | |
| Minisforum Venus Series NAB6 | |
| NiPoGi AD08 | |
| Geekom Mini IT12 | |
| AIDA64 / CPU Queen | |
| Geekom AS 6, R9 6900HX | |
| Durchschnitt der Klasse Mini PC (20501 - 162855, n=87, der letzten 2 Jahre) | |
| Geekom A5 | |
| Maxtang MTN-FP750 | |
| Minisforum Neptune Series NAD9 | |
| Minisforum Venus Series NAB6 | |
| Geekom Mini IT12 | |
| NiPoGi AD08 | |
| AIDA64 / FPU SinJulia | |
| Durchschnitt der Klasse Mini PC (1116 - 31931, n=104, der letzten 2 Jahre) | |
| Maxtang MTN-FP750 | |
| Geekom AS 6, R9 6900HX | |
| Geekom A5 | |
| Minisforum Neptune Series NAD9 | |
| Minisforum Venus Series NAB6 | |
| NiPoGi AD08 | |
| Geekom Mini IT12 | |
| AIDA64 / FPU Mandel | |
| Durchschnitt der Klasse Mini PC (3322 - 192994, n=104, der letzten 2 Jahre) | |
| Geekom AS 6, R9 6900HX | |
| Maxtang MTN-FP750 | |
| Geekom A5 | |
| Minisforum Neptune Series NAD9 | |
| Minisforum Venus Series NAB6 | |
| NiPoGi AD08 | |
| Geekom Mini IT12 | |
| AIDA64 / CPU AES | |
| Geekom AS 6, R9 6900HX | |
| Geekom A5 | |
| Minisforum Neptune Series NAD9 | |
| Minisforum Venus Series NAB6 | |
| Durchschnitt der Klasse Mini PC (9915 - 204742, n=103, der letzten 2 Jahre) | |
| Geekom Mini IT12 | |
| Maxtang MTN-FP750 | |
| NiPoGi AD08 | |
| AIDA64 / CPU ZLib | |
| Durchschnitt der Klasse Mini PC (127.2 - 2431, n=104, der letzten 2 Jahre) | |
| Geekom AS 6, R9 6900HX | |
| Minisforum Neptune Series NAD9 | |
| Geekom A5 | |
| NiPoGi AD08 | |
| Minisforum Venus Series NAB6 | |
| Maxtang MTN-FP750 | |
| Geekom Mini IT12 | |
| AIDA64 / FP64 Ray-Trace | |
| Durchschnitt der Klasse Mini PC (537 - 43587, n=104, der letzten 2 Jahre) | |
| Geekom AS 6, R9 6900HX | |
| Maxtang MTN-FP750 | |
| Geekom A5 | |
| Minisforum Neptune Series NAD9 | |
| Minisforum Venus Series NAB6 | |
| NiPoGi AD08 | |
| Geekom Mini IT12 | |
| AIDA64 / CPU PhotoWorxx | |
| Durchschnitt der Klasse Mini PC (8069 - 96843, n=104, der letzten 2 Jahre) | |
| Geekom AS 6, R9 6900HX | |
| Geekom Mini IT12 | |
| Minisforum Venus Series NAB6 | |
| Geekom A5 | |
| NiPoGi AD08 | |
| Minisforum Neptune Series NAD9 | |
| Maxtang MTN-FP750 | |
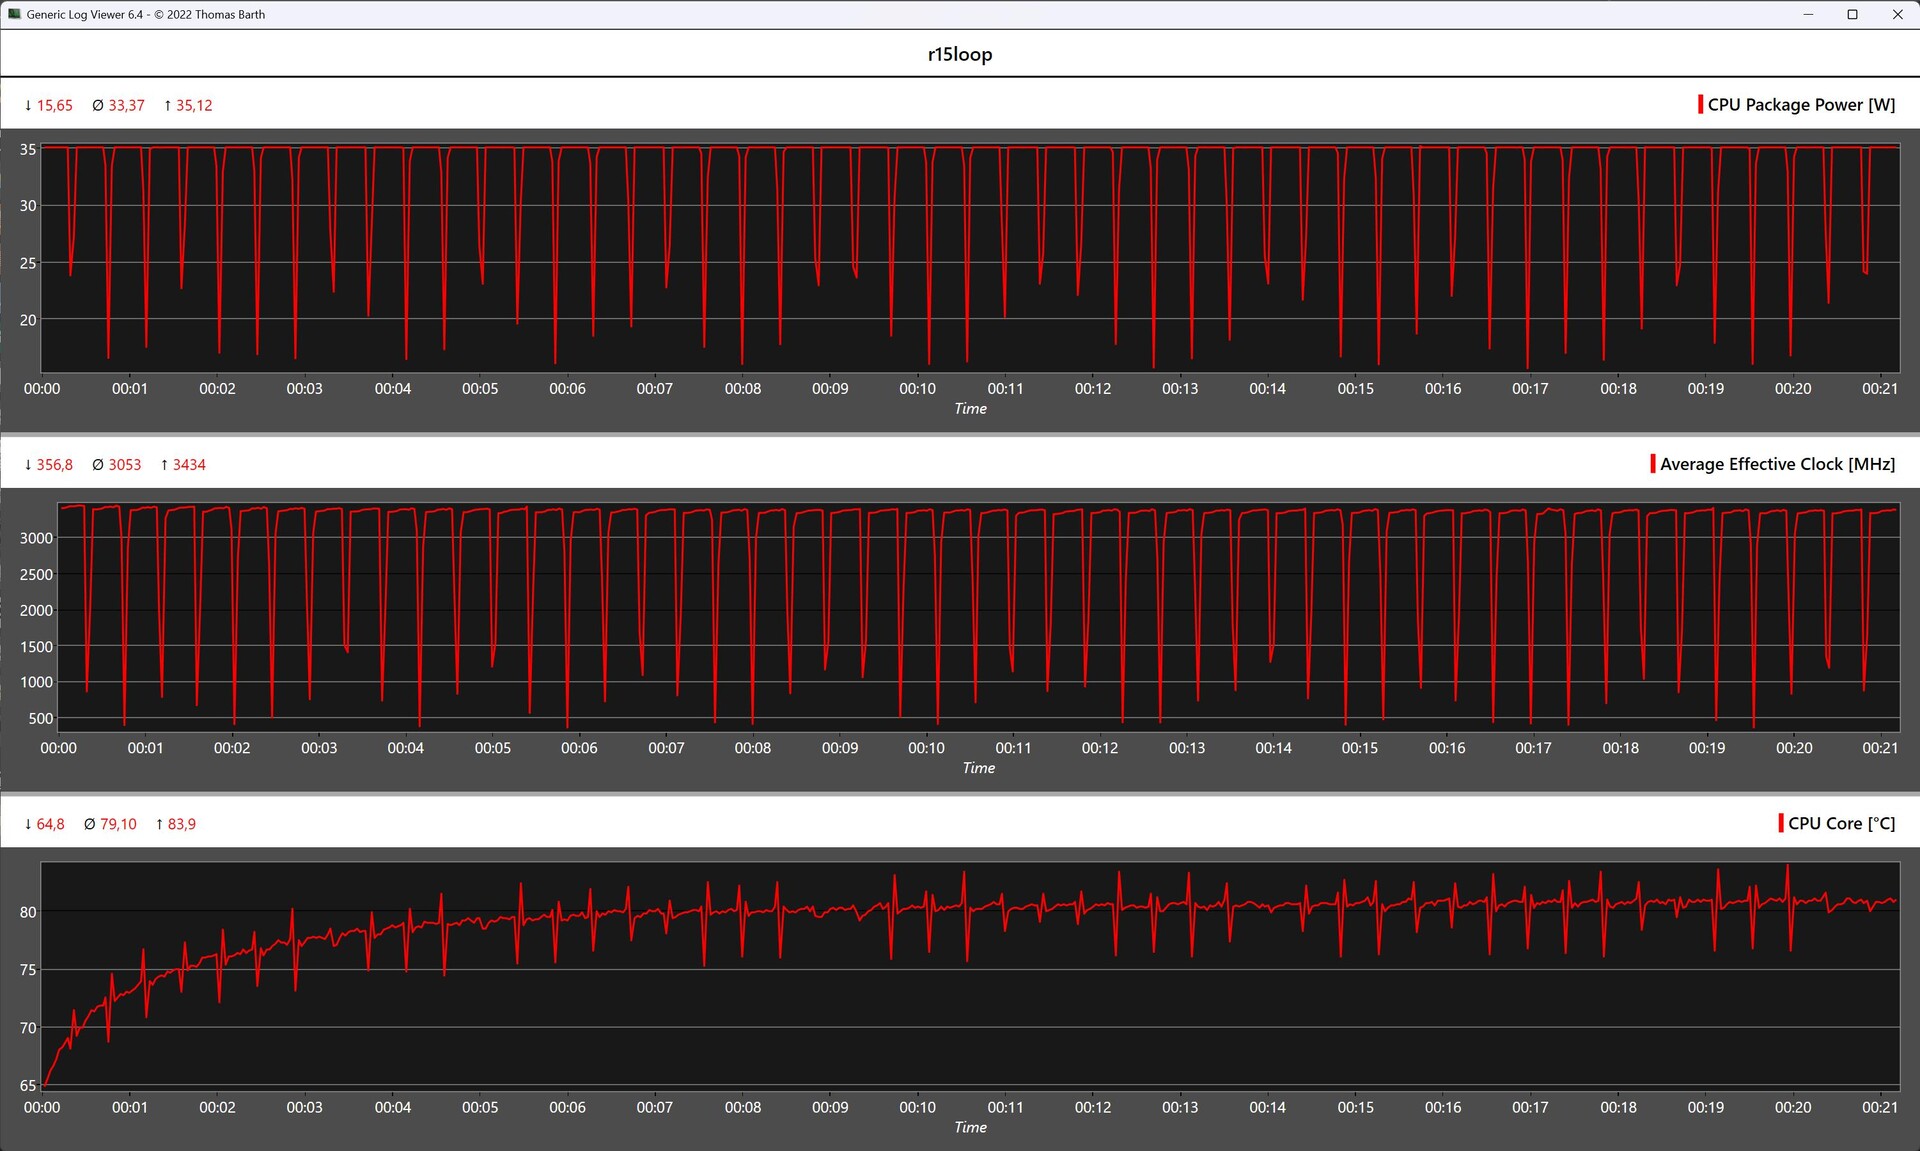
Maxtang MTN-FP750 vs. Cinebench-R15-Multi-Schleife
Die Cinebench-R15-Dauerschleife zeigt uns an dieser Stelle, wie gut das Kühlsystem unter Last arbeitet. Aufgrund der geringen maximalen TPD von nur 35 Watt, kommt die Kühleinheit nicht an die Grenzen, weshalb eine durchweg stabile CPU-Leistung erreicht wurde. Im Vergleich kann sich unser Testsample sogar den zweiten Platz, hinter dem Geekom AS 6, sichern.
System Performance
Bei den synthetischen Tests hinsichtlich der Systemperformance findet sich unser Testsample ebenfalls nur auf den hinteren Plätzen wieder. Bei der täglichen Arbeit während des Testens konnte der Maxtang MTN-FP750 subjektiv mit einer guten Systemleistung aufwarten, wenn man dem System nicht allzu viele Aufgaben gleichzeitig zumutet. Der Arbeitsspeicher scheint hier der Flaschenhals zu sein, denn abzüglich des Grafikspeichers stehen nur noch 12 GB von den 16 GB RAM zur Verfügung.
| AIDA64 / Memory Copy | |
| Durchschnitt der Klasse Mini PC (15933 - 163031, n=104, der letzten 2 Jahre) | |
| Geekom AS 6, R9 6900HX | |
| Minisforum Venus Series NAB6 | |
| Minisforum Neptune Series NAD9 | |
| Geekom Mini IT12 | |
| NiPoGi AD08 | |
| Geekom A5 | |
| Maxtang MTN-FP750 | |
| AIDA64 / Memory Read | |
| Durchschnitt der Klasse Mini PC (14143 - 123769, n=104, der letzten 2 Jahre) | |
| Geekom AS 6, R9 6900HX | |
| Minisforum Venus Series NAB6 | |
| Minisforum Neptune Series NAD9 | |
| Geekom Mini IT12 | |
| NiPoGi AD08 | |
| Geekom A5 | |
| Maxtang MTN-FP750 | |
| AIDA64 / Memory Write | |
| Durchschnitt der Klasse Mini PC (10630 - 216693, n=104, der letzten 2 Jahre) | |
| Geekom AS 6, R9 6900HX | |
| Minisforum Venus Series NAB6 | |
| Minisforum Neptune Series NAD9 | |
| Geekom Mini IT12 | |
| Geekom A5 | |
| NiPoGi AD08 | |
| Maxtang MTN-FP750 | |
| AIDA64 / Memory Latency | |
| NiPoGi AD08 | |
| Durchschnitt der Klasse Mini PC (88.1 - 184.8, n=105, der letzten 2 Jahre) | |
| Minisforum Neptune Series NAD9 | |
| Geekom AS 6, R9 6900HX | |
| Geekom A5 | |
| Geekom Mini IT12 | |
| Maxtang MTN-FP750 | |
| Minisforum Venus Series NAB6 | |
* ... kleinere Werte sind besser
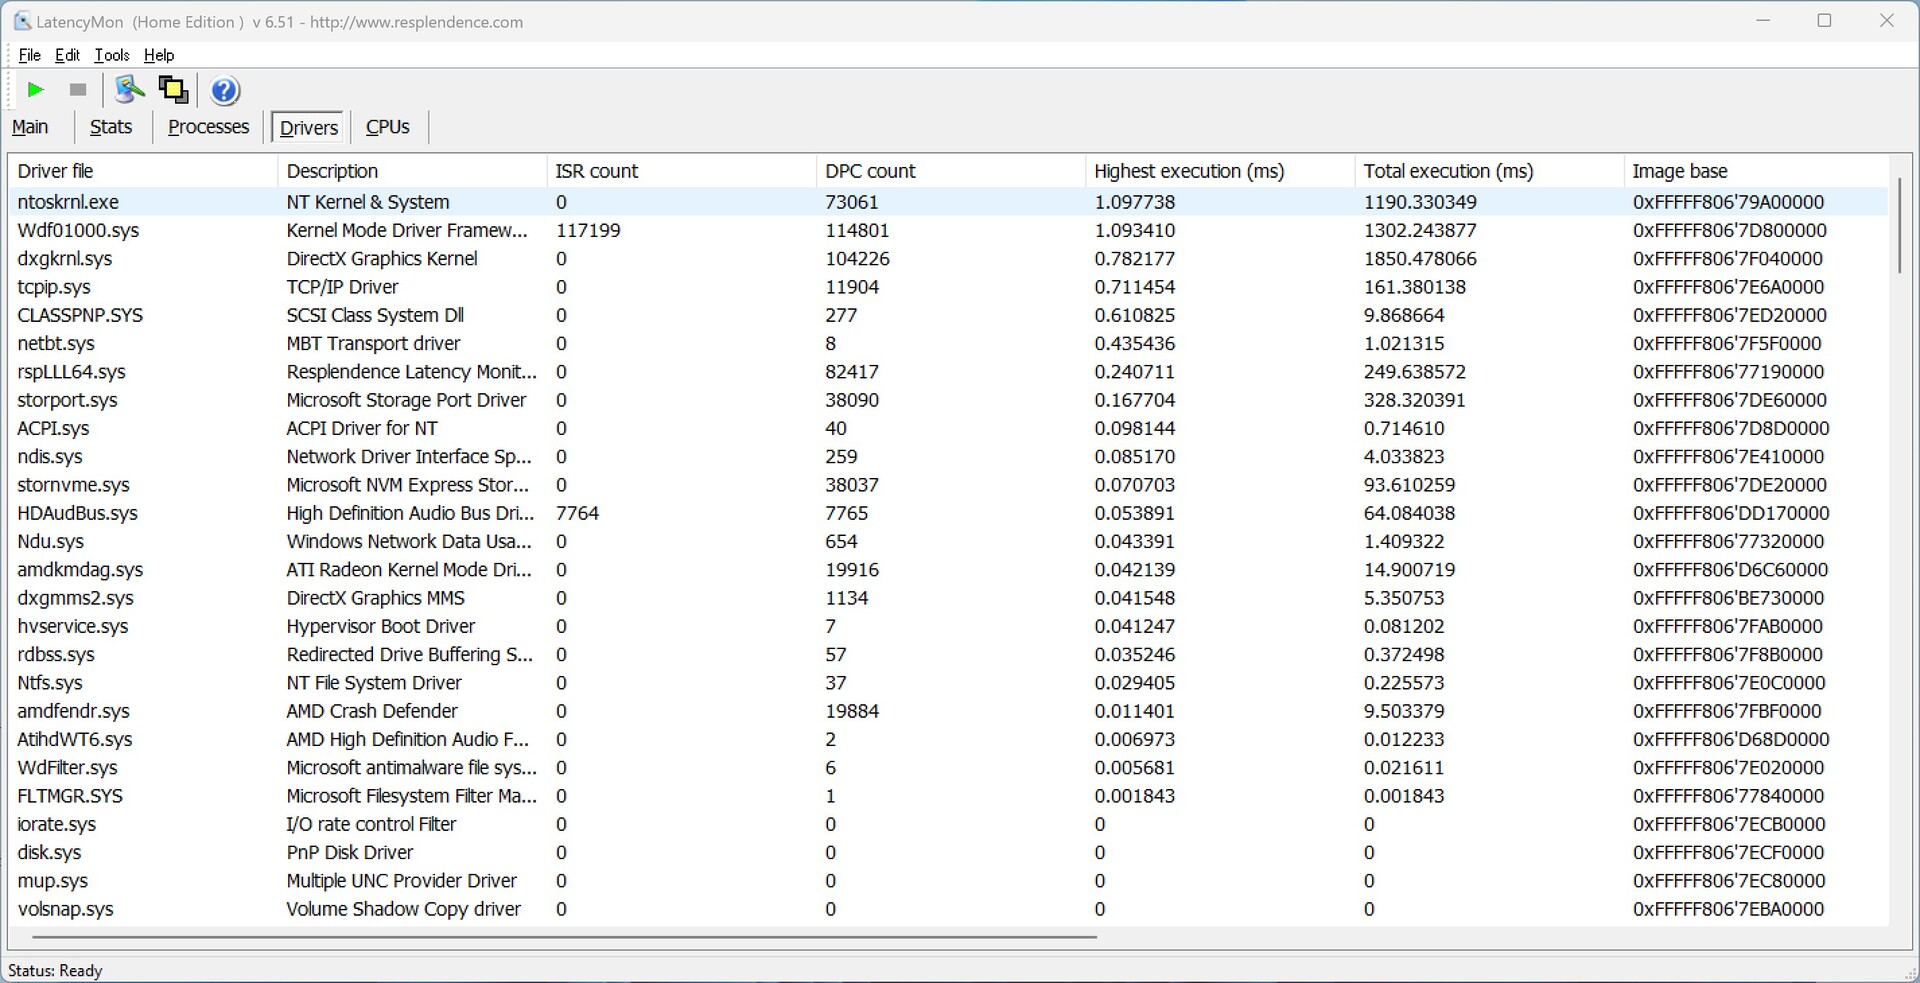
DPC-Latenzen
Leicht erhöhte Latenzen dokumentieren wir schon beim Öffnen mehrerer Tabs im Edge Browser. Diese erhöhten sich im weiteren Testverlauf jedoch nicht. Bei der Wiedergabe unseres 4K-Testvideos wird die iGPU zu etwa 24 Prozent ausgelastet.


| DPC Latencies / LatencyMon - interrupt to process latency (max), Web, Youtube, Prime95 | |
| Geekom AS 6, R9 6900HX | |
| Geekom A5 | |
| Minisforum Neptune Series NAD9 | |
| Maxtang MTN-FP750 | |
| NiPoGi AD08 | |
| Geekom Mini IT12 | |
| Minisforum Venus Series NAB6 | |
* ... kleinere Werte sind besser
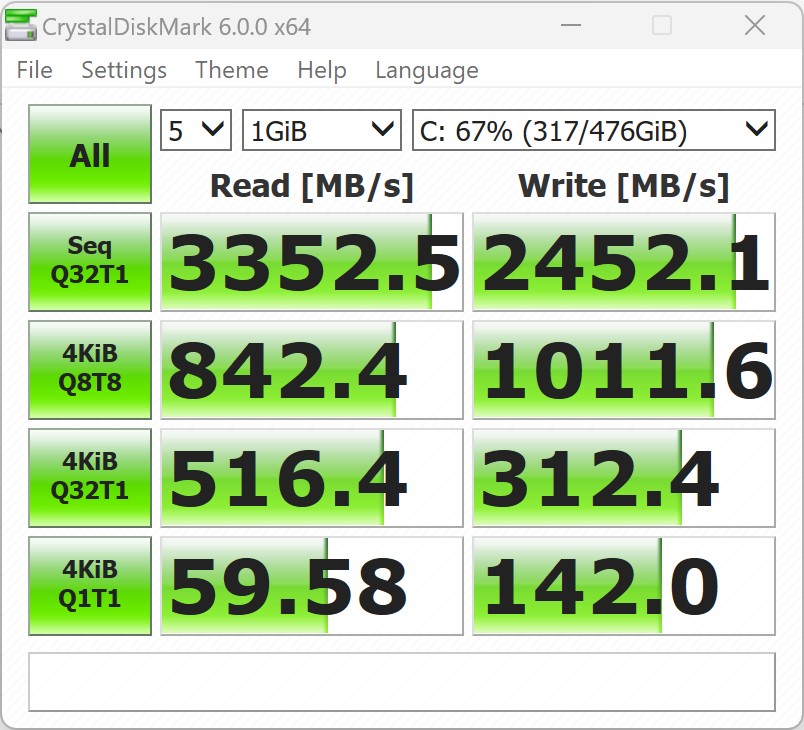
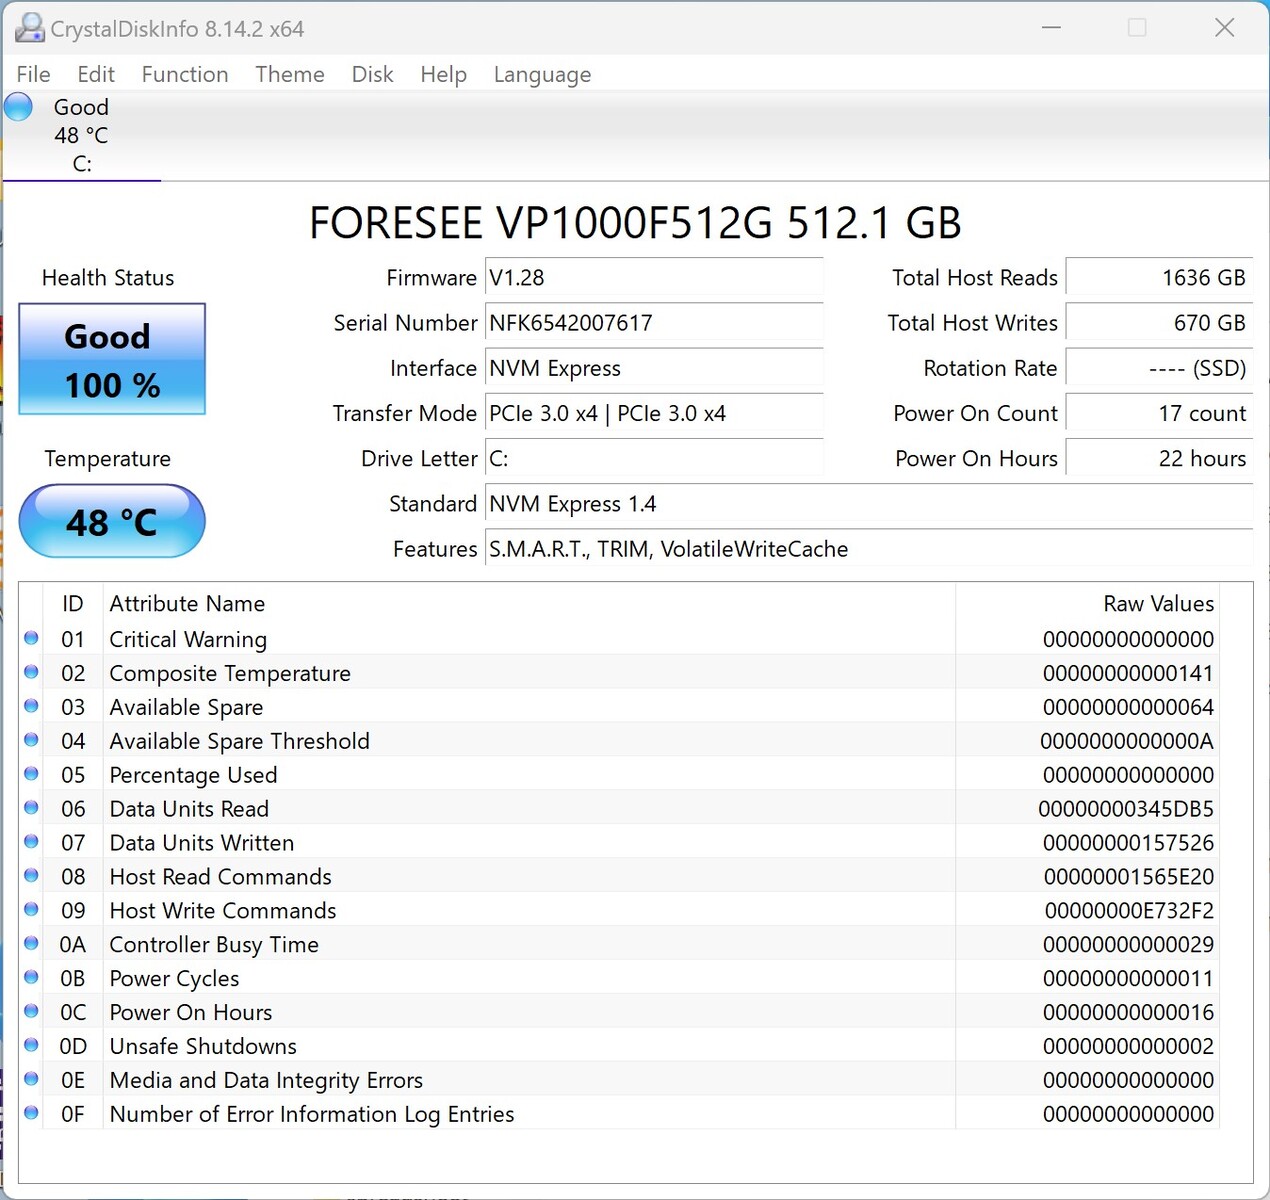
Massenspeicher
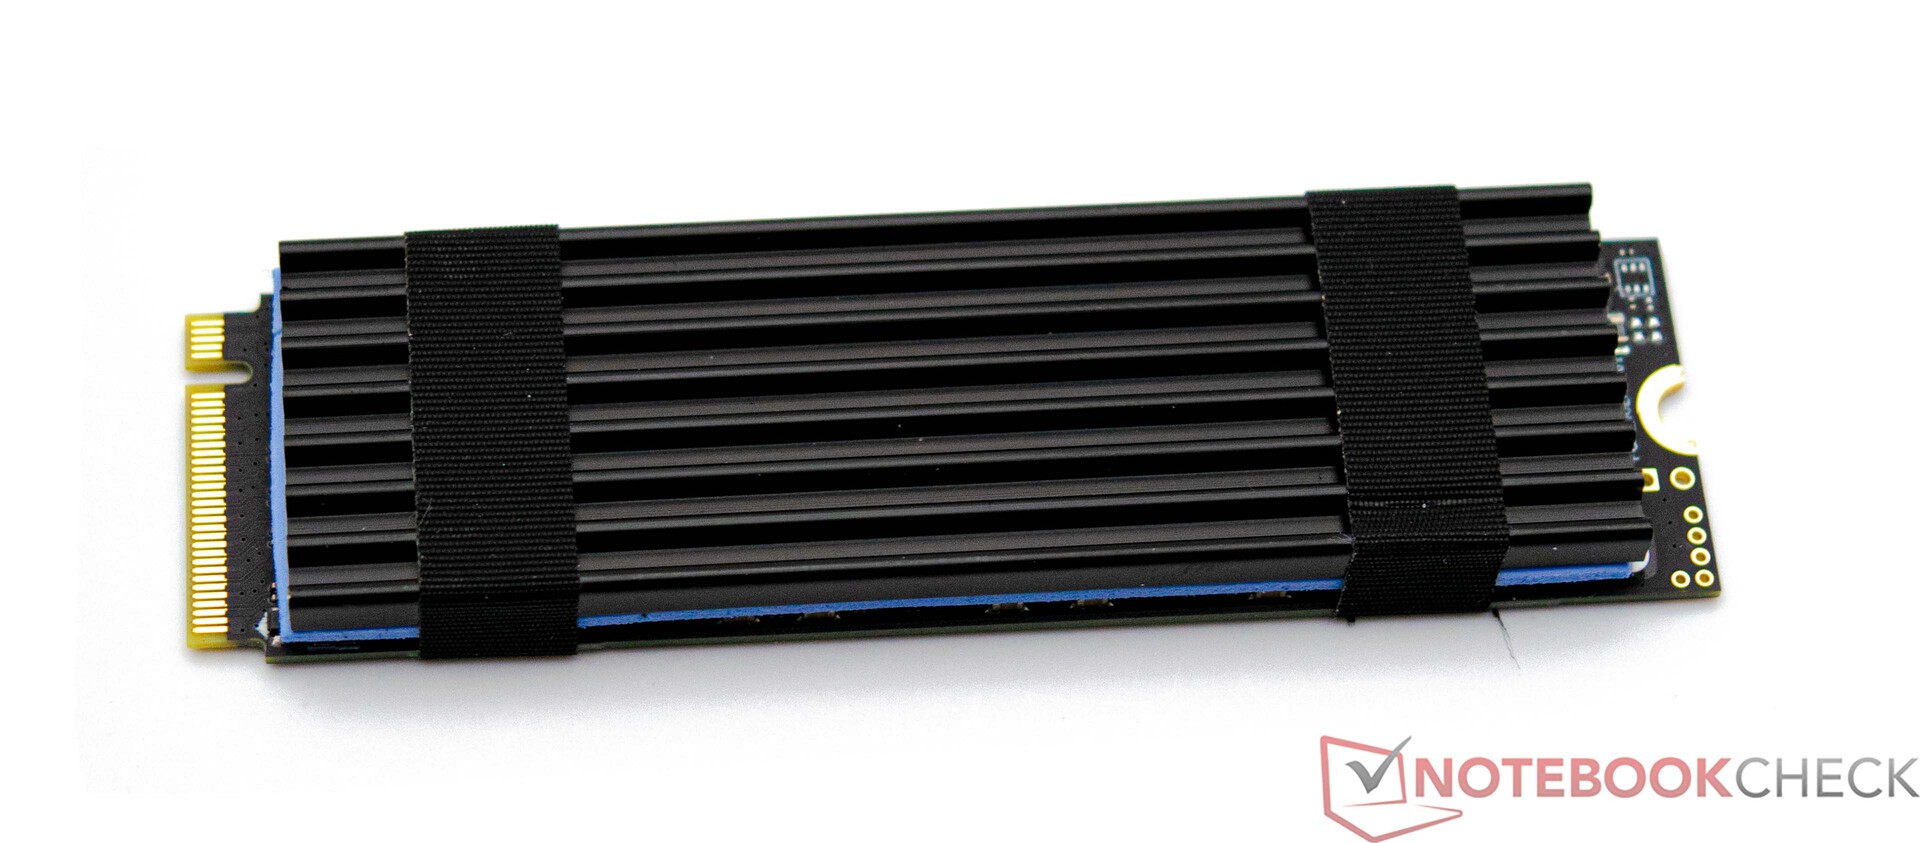
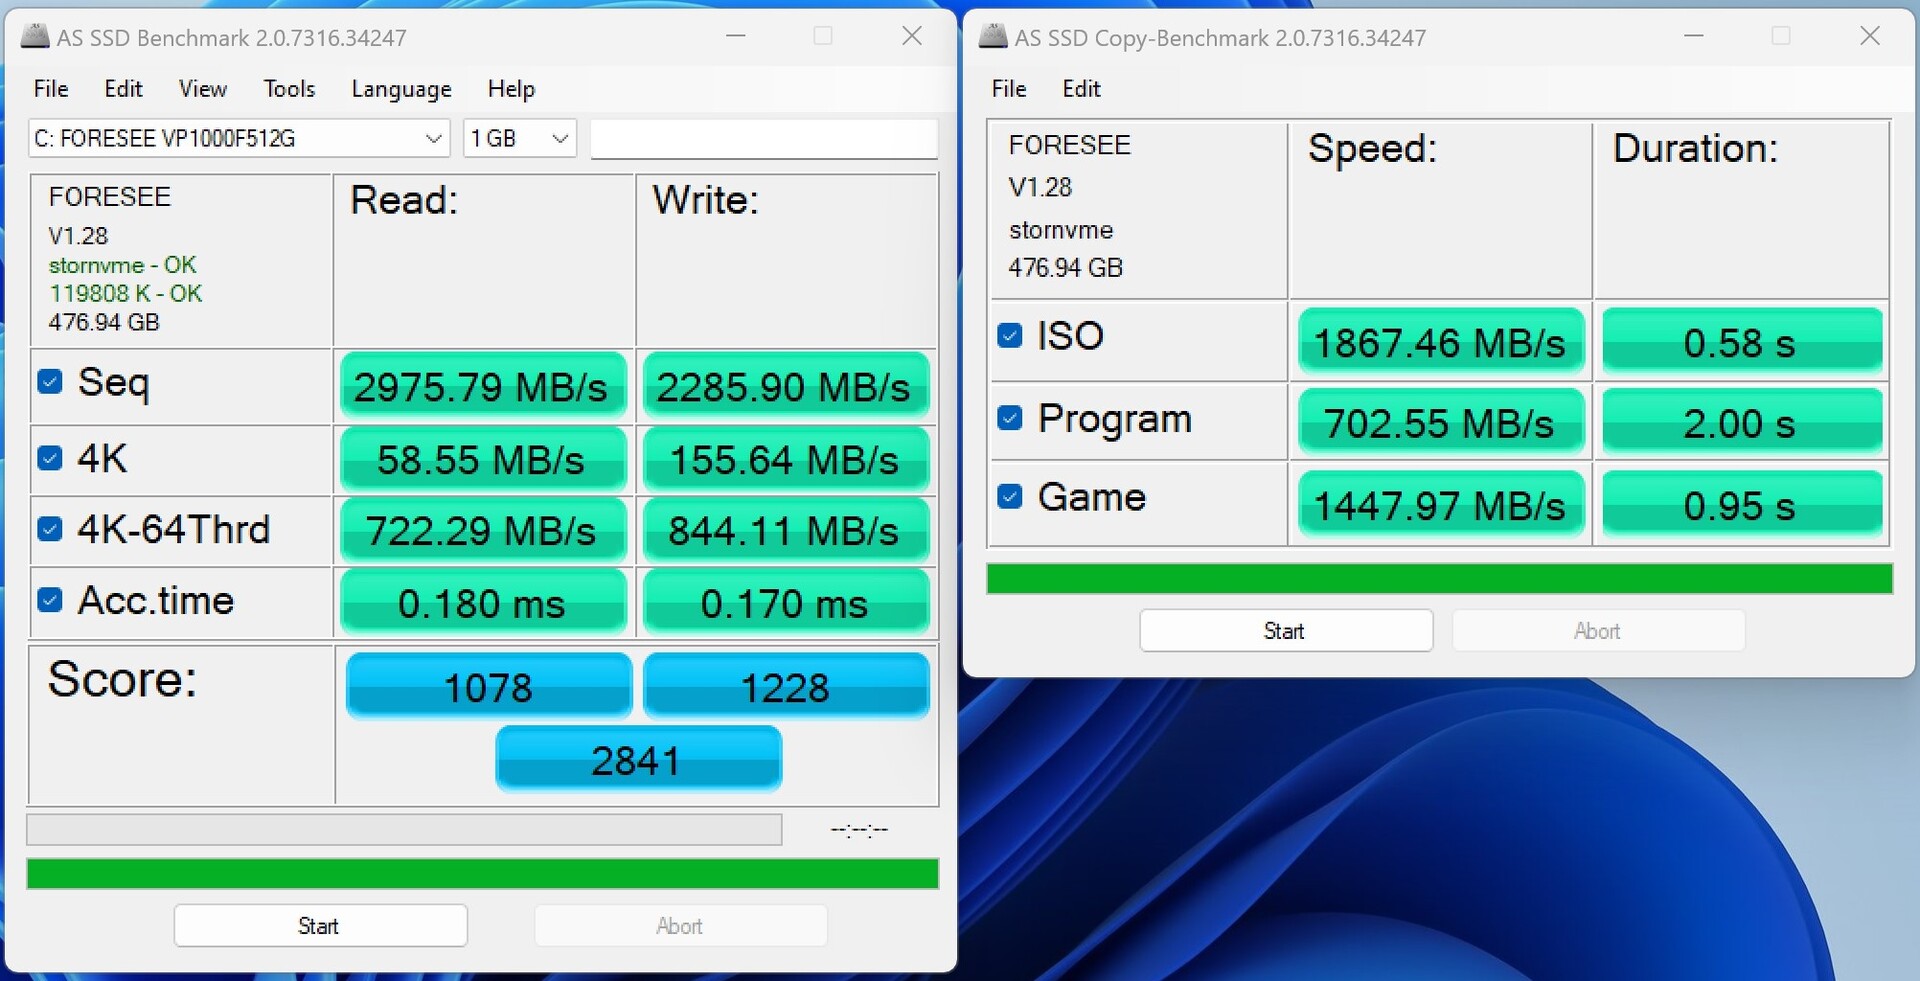
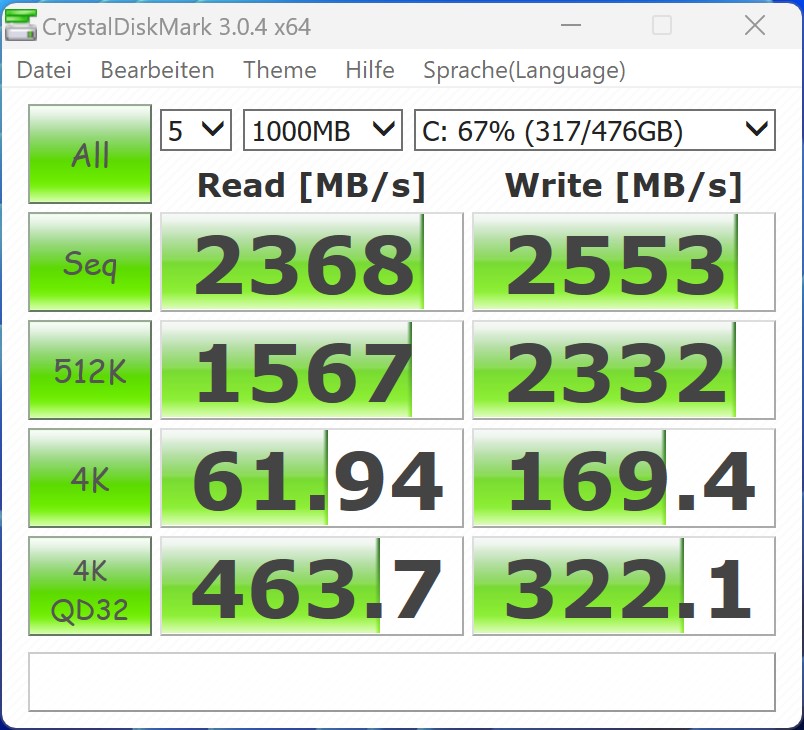
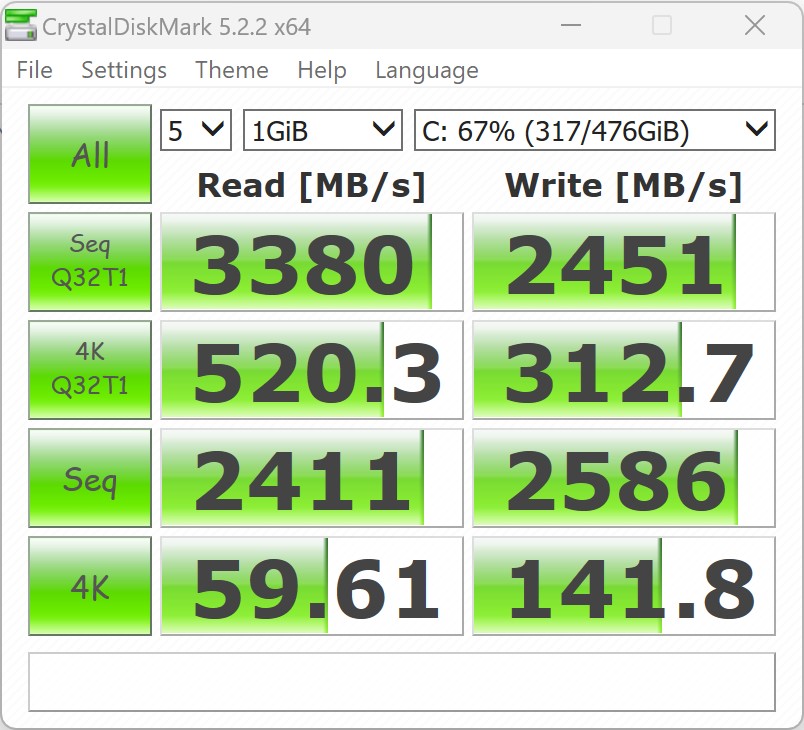
Maxtang spendiert dem MTN-FP750 in unserer Testausstattung eine 512-GB-SSD von Foresee. Die PCIe 3.0 SSD nutzt die M.2 Schnittstelle mit der maximal möglichen Bandbreite aus und wird nicht aufgrund von einer langsamen Schnittstelle künstlich eingebremst. Dennoch kann sich unser Testgerät nur einen Platz im Mittelfeld erarbeiten. Ein weiterer 2,5-Zoll-Datenträger lässt sich noch zusätzlich installieren.
Für weitere Vergleiche und Benchmarks verweisen wir auf unsere Vergleichstabelle.

| Drive Performance Rating - Percent | |
| Minisforum Neptune Series NAD9 | |
| Minisforum Venus Series NAB6 | |
| Durchschnitt der Klasse Mini PC | |
| Geekom A5 | |
| NiPoGi AD08 | |
| Geekom Mini IT12 | |
| Maxtang MTN-FP750 | |
| Geekom AS 6, R9 6900HX | |
* ... kleinere Werte sind besser
Dauerleistung Lesen: DiskSpd Read Loop, Queue Depth 8
Grafikkarte
Die Grafikausgabe übernimmt die AMD Radeon 680M, welche als iGPU in den meisten Fällen eine gute Leistung abliefert. Doch beim Maxtang MTN-FP750 ist das etwas anders... Der Grund ist der verbaute Arbeitsspeicher, denn der Hersteller stattet unser Testgerät nur mit einem RAM-Modul aus. In dieser Konfiguration ist die AMD Radeon 680M kaum schneller als eine Intel Iris Xe Graphics G7 mit 96 EUs. Selbst der Geekom A5 kann sich mit der älteren AMD Radeon RX Vega 8 vor unserem Testsample positionieren.
Um der schwachen Leistung auf den Grund zu gehen, haben wir aus unserem Fundus ein weiteres RAM-Modul genommen und einige Benchmarks gemacht. Das Resultat waren Ergebnisse, welche etwa dem Geekom AS 6 entsprechen, womit der Maxtang MTN-FP750 den Kontrahenten in nichts nachstehen würde.
Weitere Benchmarks zur AMD Radeon 680M finden Sie hier.
| Performance Rating - Percent | |
| Geekom AS 6, R9 6900HX | |
| Geekom A5 | |
| Maxtang MTN-FP750 | |
| Minisforum Neptune Series NAD9 | |
| Geekom Mini IT12 | |
| Minisforum Venus Series NAB6 | |
| NiPoGi AD08 | |
| Unigine Valley 1.0 | |
| 1920x1080 Extreme HD DirectX AA:x8 | |
| Geekom AS 6, R9 6900HX | |
| Minisforum Neptune Series NAD9 | |
| Geekom A5 | |
| Geekom Mini IT12 | |
| Minisforum Venus Series NAB6 | |
| NiPoGi AD08 | |
| Maxtang MTN-FP750 | |
| 1920x1080 Extreme HD Preset OpenGL AA:x8 | |
| Geekom AS 6, R9 6900HX | |
| Geekom Mini IT12 | |
| Minisforum Neptune Series NAD9 | |
| Minisforum Venus Series NAB6 | |
| Geekom A5 | |
| Maxtang MTN-FP750 | |
| NiPoGi AD08 | |
| Maxtang MTN-FP750, AMD Radeon 680M R7 7735HS | Minisforum Neptune Series NAD9, Intel Iris Xe Graphics G7 96EUs i9-12900H | Geekom AS 6, R9 6900HX, AMD Radeon 680M R9 6900HX | Geekom Mini IT12, Intel Iris Xe Graphics G7 96EUs i7-1260P | Geekom A5, AMD Radeon RX Vega 8 (Ryzen 4000/5000) R7 5800H | Minisforum Venus Series NAB6, Intel UHD Graphics 64EUs (Alder Lake 12th Gen) i7-12650H | NiPoGi AD08, Intel UHD Graphics 64EUs (Alder Lake 12th Gen) i7-12650H | Durchschnitt der Klasse Mini PC | |
|---|---|---|---|---|---|---|---|---|
| SPECviewperf 12 | -26% | 58% | -31% | 2% | -37% | -34% | 204% | |
| 1900x1060 3ds Max (3dsmax-05) (fps) | 46.9 | 40.9 -13% | 75.3 61% | 38.7 -17% | 51.7 10% | 36.2 -23% | 34.4 -27% | 146.2 ? 212% |
| 1900x1060 Catia (catia-04) (fps) | 51.5 | 41.2 -20% | 70.3 37% | 38.5 -25% | 44.2 -14% | 34.5 -33% | 30.3 -41% | 138.8 ? 170% |
| 1900x1060 Creo (creo-01) (fps) | 33.2 | 9.64 -71% | 45.2 36% | 7.52 -77% | 36.3 9% | 6.44 -81% | 21.1 -36% | 68.8 ? 107% |
| 1900x1060 Energy (energy-01) (fps) | 0.41 | 76.1 | 0.41 | 0.35 | 0.77 | 21.3 ? | ||
| 1900x1060 Maya (maya-04) (fps) | 45.2 | 39.9 -12% | 58.3 29% | 36.5 -19% | 40.3 -11% | 33.4 -26% | 32.5 -28% | 125.8 ? 178% |
| 1900x1060 Medical (medical-01) (fps) | 17.9 | 12.3 -31% | 44 146% | 11.2 -37% | 18.2 2% | 9.12 -49% | 8.41 -53% | 76.6 ? 328% |
| 1900x1060 Showcase (showcase-01) (fps) | 17.5 | 17.9 2% | 30.1 72% | 16.7 -5% | 21.7 24% | 15.9 -9% | 15.2 -13% | 81.5 ? 366% |
| 1900x1060 Solidworks (sw-03) (fps) | 72.1 | 47.2 -35% | 88.8 23% | 43.7 -39% | 68.3 -5% | 44.5 -38% | 43.4 -40% | 119.3 ? 65% |
| SPECviewperf 13 | -27% | 51% | -30% | 2% | -37% | -40% | 232% | |
| 3ds Max (3dsmax-06) (fps) | 48.3 | 40.5 -16% | 76.7 59% | 37.9 -22% | 51.6 7% | 36 -25% | 34.1 -29% | 142.9 ? 196% |
| Catia (catia-05) (fps) | 73.9 | 59.4 -20% | 105 42% | 56.3 -24% | 62.1 -16% | 49.6 -33% | 43.2 -42% | 191.8 ? 160% |
| Creo (creo-02) (fps) | 44.9 | 38.8 -14% | 78.4 75% | 36.8 -18% | 50.6 13% | 33 -27% | 33.1 -26% | 160.7 ? 258% |
| Energy (energy-02) (fps) | 11.4 | 4.27 -63% | 13.9 22% | 4.29 -62% | 10.6 -7% | 2.82 -75% | 2.62 -77% | 38.9 ? 241% |
| Maya (maya-05) (fps) | 58.3 | 44.2 -24% | 99 70% | 42.9 -26% | 56.5 -3% | 38.2 -34% | 41.3 -29% | 199.4 ? 242% |
| Medical (medical-02) (fps) | 32.8 | 14.5 -56% | 44.9 37% | 14 -57% | 31 -5% | 10.9 -67% | 8.63 -74% | 146.5 ? 347% |
| Showcase (showcase-02) (fps) | 17.4 | 17.9 3% | 30.4 75% | 16.8 -3% | 21.5 24% | 15.7 -10% | 15.1 -13% | 77.7 ? 347% |
| Solidworks (sw-04) (fps) | 72.9 | 55.8 -23% | 95 30% | 54.1 -26% | 72.4 -1% | 53.9 -26% | 51.9 -29% | 121.1 ? 66% |
| SPECviewperf 2020 | -35% | 84% | -24% | 2% | -43% | 297% | ||
| 3840x2160 Medical (medical-03) (fps) | 4.72 | 2.57 -46% | 8.59 82% | 3.37 -29% | 4.82 2% | 2.54 -46% | 22.9 ? 385% | |
| 3840x2160 Energy (energy-03) (fps) | 6.6 | 3.02 -54% | 16.9 156% | 7.39 12% | 5.33 -19% | 1.9 -71% | 33.7 ? 411% | |
| 3840x2160 Creo (creo-03) (fps) | 17.5 | 15.3 -13% | 28.9 65% | 15.1 -14% | 19.1 9% | 12.7 -27% | 49.8 ? 185% | |
| 3840x2160 CATIA (catia-06) (fps) | 13.1 | 8.2 -37% | 20.4 56% | 8.23 -37% | 13.1 0% | 7.63 -42% | 34.8 ? 166% | |
| 3840x2160 3ds Max (3dsmax-07) (fps) | 9.26 | 9.67 4% | 17.5 89% | 9.65 4% | 11.3 22% | 8.65 -7% | 55.4 ? 498% | |
| 3840x2160 Siemens NX (snx-04) (fps) | 33 | 6.69 -80% | 58.5 77% | 6.23 -81% | 38 15% | 6.61 -80% | 51.5 ? 56% | |
| 3840x2160 Maya (maya-06) (fps) | 29.5 | 24 -19% | 47.4 61% | 23.7 -20% | 25.8 -13% | 21.2 -28% | 141.1 ? 378% | |
| Durchschnitt gesamt (Programm / Settings) | -29% /
-29% | 64% /
64% | -28% /
-28% | 2% /
2% | -39% /
-39% | -37% /
-37% | 244% /
244% |
| 3DMark 06 Score 1366x768 | 25274 Punkte | |
| 3DMark Vantage P Result | 24874 Punkte | |
| 3DMark 11 Performance | 6723 Punkte | |
| 3DMark Ice Storm Standard Score | 127954 Punkte | |
| 3DMark Cloud Gate Standard Score | 21960 Punkte | |
| 3DMark Fire Strike Score | 4002 Punkte | |
| 3DMark Fire Strike Extreme Score | 2090 Punkte | |
| 3DMark Time Spy Score | 1591 Punkte | |
Hilfe | ||
Gaming Performance
Der Maxtang MTN-FP750 ist in unserer Testausstattung nur bedingt zum Spielen geeignet. Die eigentlich recht starke AMD Radeon 680M kann leider nicht die volle Leistung erbringen. Wir empfehlen daher, unbedingt darauf zu achten, dass zwei RAM-Module verbaut sind, um die volle Leistung zu erhalten. Als groben Richtwert hinsichtlich der Gaming-Leistung kann man sich an die Ergebnisse des Geekom AS 6 halten.
Für weitere Vergleiche und Benchmarks verweisen wir hier auf unsere GPU-Spieleliste.
| The Witcher 3 | |
| 1024x768 Low Graphics & Postprocessing | |
| Geekom AS 6, R9 6900HX | |
| Minisforum Neptune Series NAD9 | |
| Geekom Mini IT12 | |
| Geekom A5 | |
| Minisforum Venus Series NAB6 | |
| NiPoGi AD08 | |
| Maxtang MTN-FP750 | |
| 1920x1080 High Graphics & Postprocessing (Nvidia HairWorks Off) | |
| Geekom AS 6, R9 6900HX | |
| Minisforum Neptune Series NAD9 | |
| NiPoGi AD08 | |
| Geekom Mini IT12 | |
| Minisforum Venus Series NAB6 | |
| Geekom A5 | |
| Maxtang MTN-FP750 | |
| Borderlands 3 | |
| 1280x720 Very Low Overall Quality (DX11) | |
| Geekom A5 | |
| Geekom AS 6, R9 6900HX | |
| Minisforum Neptune Series NAD9 | |
| Maxtang MTN-FP750 | |
| Geekom Mini IT12 | |
| Minisforum Venus Series NAB6 | |
| NiPoGi AD08 | |
| 1920x1080 High Overall Quality (DX11) | |
| Geekom AS 6, R9 6900HX | |
| Geekom A5 | |
| Minisforum Neptune Series NAD9 | |
| Maxtang MTN-FP750 | |
| Geekom Mini IT12 | |
| Minisforum Venus Series NAB6 | |
| NiPoGi AD08 | |
| GTA V | |
| 1024x768 Lowest Settings possible | |
| Geekom A5 | |
| Minisforum Neptune Series NAD9 | |
| Minisforum Venus Series NAB6 | |
| Geekom AS 6, R9 6900HX | |
| Geekom Mini IT12 | |
| NiPoGi AD08 | |
| Maxtang MTN-FP750 | |
| 1920x1080 High/On (Advanced Graphics Off) AA:2xMSAA + FX AF:8x | |
| Geekom AS 6, R9 6900HX | |
| Geekom A5 | |
| Maxtang MTN-FP750 | |
| Minisforum Neptune Series NAD9 | |
| Geekom Mini IT12 | |
| Minisforum Venus Series NAB6 | |
| NiPoGi AD08 | |
| min. | mittel | hoch | max. | |
|---|---|---|---|---|
| GTA V (2015) | 95.5 | 85.7 | 28.2 | 12.7 |
| The Witcher 3 (2015) | 73 | 46.7 | 23.7 | 14.9 |
| Dota 2 Reborn (2015) | 115.8 | 87.4 | 60.5 | 53.1 |
| Final Fantasy XV Benchmark (2018) | 39.2 | 20.5 | 14.6 | |
| X-Plane 11.11 (2018) | 49.8 | 39.8 | 33.8 | |
| Far Cry 5 (2018) | 46 | 25 | 22 | 21 |
| Strange Brigade (2018) | 78.4 | 31.4 | 26.7 | 23.1 |
| Shadow of the Tomb Raider (2018) | 53.3 | 21.8 | 19.8 | 16.4 |
| Far Cry New Dawn (2019) | 40 | 23 | 21 | 20 |
| Metro Exodus (2019) | 43.1 | 17.6 | 13.8 | 11.7 |
| Borderlands 3 (2019) | 58.2 | 24.8 | 15.7 | 12.5 |
| F1 2020 (2020) | 96.9 | 49.8 | 39.1 | 27.5 |
| F1 2021 (2021) | 97 | 49.8 | 36.4 | 16.7 |
| God of War (2022) | 19.5 | 15.9 | 11.7 | |
| GRID Legends (2022) | 58.2 | 45 | 34.2 | 26.6 |
| Tiny Tina's Wonderlands (2022) | 37.7 | 28.2 | 20.2 | 16.2 |
| F1 22 (2022) | 45.6 | 40.6 | 32.1 | 9.25 |
| F1 23 (2023) | 45.3 | 40.1 | 29.1 | |
| Total War Pharaoh (2023) | 43.3 | 33.3 | 21.6 | 16.9 |
| Prince of Persia The Lost Crown (2024) | 89.3 | 58.8 | 58.4 |
Emissionen - Sparsam, aber auch nicht zu überhören
Geräuschemissionen
Ohne Last arbeitet der Maxtang MTN-FP750 weitgehend lautlos. Doch unter Last erreichen wir schnell 45 dB(A). Einen Unterschied zwischen mittlerer Belastung und Vollast können wir nur minimal ausmachen. Die geringe Abweichung können wir jedoch auch unter Messtoleranz verbuchen. Es scheint, als gäbe es nur zwei Lüfterstufen, was etwas schade ist. Der Blick in die Tabelle zeigt aber auch, dass der Geekom A5 und auch der NiPoGi AD08 im gleichen Szenario noch lauter waren.
Lautstärkediagramm
| Idle |
| 25.3 / 25.3 / 25.4 dB(A) |
| Last |
| 45.1 / 45.3 dB(A) |
 | ||
30 dB leise 40 dB(A) deutlich hörbar 50 dB(A) störend |
||
min: | ||
| Maxtang MTN-FP750 R7 7735HS, Radeon 680M | Minisforum Neptune Series NAD9 i9-12900H, Iris Xe G7 96EUs | Geekom AS 6, R9 6900HX R9 6900HX, Radeon 680M | Geekom Mini IT12 i7-1260P, Iris Xe G7 96EUs | Geekom A5 R7 5800H, Vega 8 | Minisforum Venus Series NAB6 i7-12650H, UHD Graphics 64EUs | NiPoGi AD08 i7-12650H, UHD Graphics 64EUs | |
|---|---|---|---|---|---|---|---|
| Geräuschentwicklung | -3% | -14% | -3% | -7% | -4% | -14% | |
| aus / Umgebung * (dB) | 25 | 30.2 -21% | 30 -20% | 29.8 -19% | 25 -0% | 29.4 -18% | 25 -0% |
| Idle min * (dB) | 25.3 | 30.5 -21% | 33.2 -31% | 29.9 -18% | 28.2 -11% | 29.4 -16% | 31.1 -23% |
| Idle avg * (dB) | 25.3 | 30.5 -21% | 33.6 -33% | 30.1 -19% | 28.2 -11% | 29.5 -17% | 31.2 -23% |
| Idle max * (dB) | 25.4 | 30.5 -20% | 33.6 -32% | 30.2 -19% | 28.2 -11% | 29.7 -17% | 31.3 -23% |
| Last avg * (dB) | 45.1 | 30.5 32% | 36.8 18% | 32.1 29% | 47.8 -6% | 34.6 23% | 51.7 -15% |
| Last max * (dB) | 45.3 | 30.5 33% | 39.8 12% | 32.5 28% | 47.4 -5% | 36.1 20% | 45.8 -1% |
* ... kleinere Werte sind besser
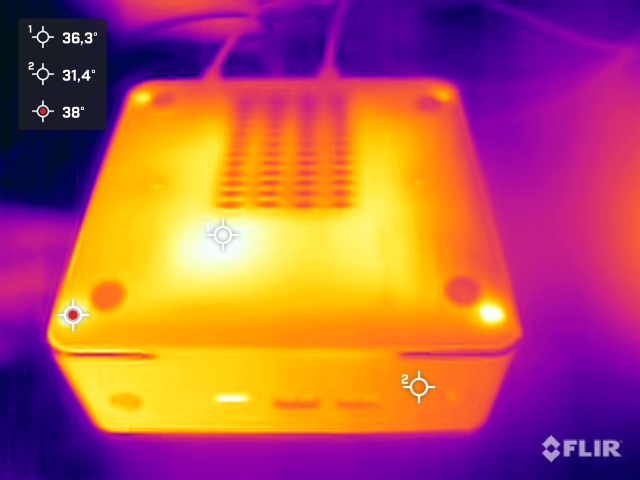
Temperatur
Das Gehäuse des Maxtang MTN-FP750 erwärmt sich im Leerlauf und unter Last nur geringfügig. Als Hotspot sehen wir auf der Oberseite nur knapp 40 °C, wenngleich auf der Unterseite nicht einmal 35 °C erreicht werden. Das SoC wird dabei schon deutlich wärmer, wenngleich wir mit knapp 80 °C im grünen Bereich bleiben. Zudem hat der Hersteller im BIOS eine maximale Temperatur von 90 °C definiert. Diese erreichen wir bei dem voreingestellten Power-Limit von 35 Watt ohnehin nicht.

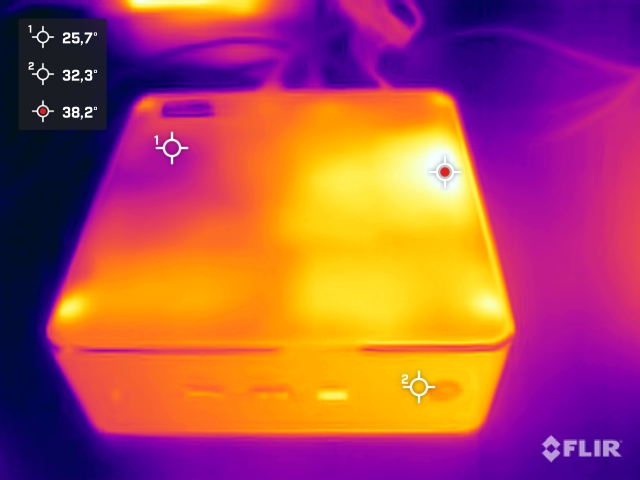
(+) Die maximale Temperatur auf der Oberseite ist 39.7 °C. Im Vergleich liegt der Klassendurchschnitt bei 35.4 °C (von 20.6 bis 69.5 °C für die Klasse Mini PC).
(+) Auf der Unterseite messen wir eine maximalen Wert von 34.3 °C (im Vergleich zum Durchschnitt von 36.1 °C).
(+) Ohne Last messen wir eine durchschnittliche Temperatur von 29.4 °C auf der Oberseite. Der Klassendurchschnitt erreicht 32.1 °C.
Energieaufnahme
Der Maxtang MTN-FP750 gehört hier im Vergleich zu den sparsamsten Geräten. Schon im Leerlauf sehen wir eine sehr geringe Leistungsaufnahme von lediglich 7 bis 8,4 Watt. Nur der Geekom A5 und auch der Geekom Mini IT12 können hier mit ähnlich geringen Werten mithalten. Unter Last bleibt unser Testsample weiterhin vergleichsweise sparsam. So zeigt unser Messgerät in der Spitze nur 61,4 Watt. In Anbetracht des begrenzten Power-Limits des Prozessors sind diese geringen Energiebedarfe unter Last aber nicht verwunderlich.
Das 90-Watt-Netzteil hat somit zu keiner Zeit Probleme, den Mini-PC zuverlässig mit Energie zu versorgen. Selbst ein manuelles Anpassen der Leistungsaufnahme steckt das Netzteil problemlos weg.
| Aus / Standby | |
| Idle | |
| Last |
|
Legende:
min: | |
| Maxtang MTN-FP750 R7 7735HS, Radeon 680M | Minisforum Neptune Series NAD9 i9-12900H, Iris Xe G7 96EUs | Geekom AS 6, R9 6900HX R9 6900HX, Radeon 680M | Geekom Mini IT12 i7-1260P, Iris Xe G7 96EUs | Geekom A5 R7 5800H, Vega 8 | Minisforum Venus Series NAB6 i7-12650H, UHD Graphics 64EUs | NiPoGi AD08 i7-12650H, UHD Graphics 64EUs | Durchschnittliche AMD Radeon 680M | Durchschnitt der Klasse Mini PC | |
|---|---|---|---|---|---|---|---|---|---|
| Stromverbrauch | -73% | -23% | -2% | -12% | -50% | -107% | -10% | -44% | |
| Idle min * (Watt) | 7 | 12.1 -73% | 6.8 3% | 5 29% | 6.9 1% | 10.4 -49% | 14.2 -103% | 6.93 ? 1% | 8.63 ? -23% |
| Idle avg * (Watt) | 8.1 | 13 -60% | 9.4 -16% | 7 14% | 7.9 2% | 12.3 -52% | 15.1 -86% | 8.98 ? -11% | 10.7 ? -32% |
| Idle max * (Watt) | 8.4 | 18.2 -117% | 13.7 -63% | 10.7 -27% | 8.9 -6% | 12.4 -48% | 28.7 -242% | 10.5 ? -25% | 13.6 ? -62% |
| Last avg * (Watt) | 54.2 | 70.6 -30% | 45.3 16% | 50.3 7% | 60.8 -12% | 72.9 -35% | 76.9 -42% | 53.5 ? 1% | 64.5 ? -19% |
| Last max * (Watt) | 61.4 | 113 -84% | 94.8 -54% | 82 -34% | 89.7 -46% | 101.2 -65% | 100.2 -63% | 70.5 ? -15% | 111.9 ? -82% |
* ... kleinere Werte sind besser
Energieaufnahme mit externem Monitor
Pro
Contra
Fazit - Bessere Leistung erst nach Optimierungen
Der Maxtang MTN-FP750 ist ein einfacher Mini-PC für den Office-Gebrauch daheim oder im Büro. Der AMD Ryzen 7 7735HS bietet dabei ausreichend Leistung, um die meisten Aufgaben zu erledigen. Aufgrund seiner 8 Kerne und 16 Threads eignet sich der Mini-PC auch für leistungshungrige Anwendungen. Der installierte RAM umfasst 16 GB, was zunächst einmal kein Problem darstellt. Doch wenn es ans Eingemachte geht, dann rächt sich der Einsatz des einzelnen RAM-Moduls, wenngleich die Möglichkeit besteht, zwei SO-DIMM-Module im Maxtang MTN-FP750 zu installieren. Im Test konnte der Maxtang MTN-FP750 somit nicht die Leistung abliefern, die wir erwartet hatten. Am deutlichsten zeigte sich der Leistungsunterschied bei den 3D-Benchmarks. Mit einem weiteren RAM-Modul kann man diesem Problem vorbeugen, weshalb man darauf als Kunde unbedingt achten sollten.
Der Maxtang MTN-FP750 bietet laut Datenblatt eine recht gute Leistung. Im Test konnte der Mini-PC leider nicht die erwartete Leistung erbringen.
Der größte Vorteil des Maxtang MTN-FP750 ist der geringere Kaufpreis gegenüber den Kontrahenten, die wir hier im Vergleich hatten. Dabei ist die Leistung etwas schlechter, wenn nicht selbst etwas Hand angelegt wird und die Leistungsgrenzen des SoCs nicht angepasst werden. Unserer Meinung nach sind die 35 Watt, welche als Power-Limit definiert sind, etwas zu konservativ. Mit 45 Watt hätte der Hersteller hier einen guten Kompromiss finden können. Gleiches gilt beim RAM, welcher sich aber schnell durch ein zweites Modul erweitern lässt. Beherzigt man diese beiden Punkte, so bekommt man mit dem Maxtang MTN-FP750 ein leistungsmäßig ganz anderes Modell, als das, was wir getestet haben.
Als solide kann man die Anschlussausstattung beschreiben. Alles Wichtige ist dabei - das war es aber auch schon. Auf Thunderbolt oder USB4 wird verzichtet, was die Nutzungsmöglichkeiten etwas einschränkt. Positiver Nebeneffekt der leistungsbeschränkten CPU ist der geringe Energiebedarf des Maxtang MTN-FP750. Im Test war dieses Gerät deutlich sparsamer als alle Kontrahenten. Leider hatte dies keine großen Auswirkungen auf die Lüfterlautstärke, welche vergleichsweise hoch ausfällt. Ein etwas besseres Kühlkonzept hätte an dieser Stelle für bessere Wertungspunkte sorgen können.
Preise und Verfügbarkeit
Den Maxtang MTN-FP750 gibt es in unserer Testkonfiguration für 440 US-Dollar direkt beim Hersteller.
Maxtang MTN-FP750
- 27.02.2024 v7 (old)
Sebastian Bade
Transparenz
Die Auswahl der zu testenden Geräte erfolgt innerhalb der Redaktion. Das vorliegende Testmuster wurde dem Autor vom Hersteller unentgeltlich zu Testzwecken überlassen. Eine Einflussnahme auf den Testbericht gab es nicht, der Hersteller erhielt keine Version des Reviews vor der Veröffentlichung. Es bestand keine Verpflichtung zur Publikation. Als eigenständiges, unabhängiges Unternehmen unterliegt Notebookcheck keiner Diktion von Herstellern, Shops und Verlagen.
So testet Notebookcheck
Pro Jahr werden von Notebookcheck hunderte Laptops und Smartphones unabhängig in von uns standardisierten technischen Verfahren getestet, um eine Vergleichbarkeit aller Testergebnisse zu gewährleisten. Seit rund 20 Jahren entwickeln wir diese Testmethoden kontinuierlich weiter und setzen damit Branchenstandards. In unseren Testlaboren kommt ausschließlich hochwertiges Messequipment in die Hände erfahrener Techniker und Redakteure. Die Tests unterliegen einer mehrstufigen Kontrolle. Unsere komplexe Gesamtbewertung basiert auf hunderten fundierten Messergebnissen und Benchmarks, womit Ihnen Objektivität garantiert ist. Weitere Informationen zu unseren Testmethoden gibt es hier.
