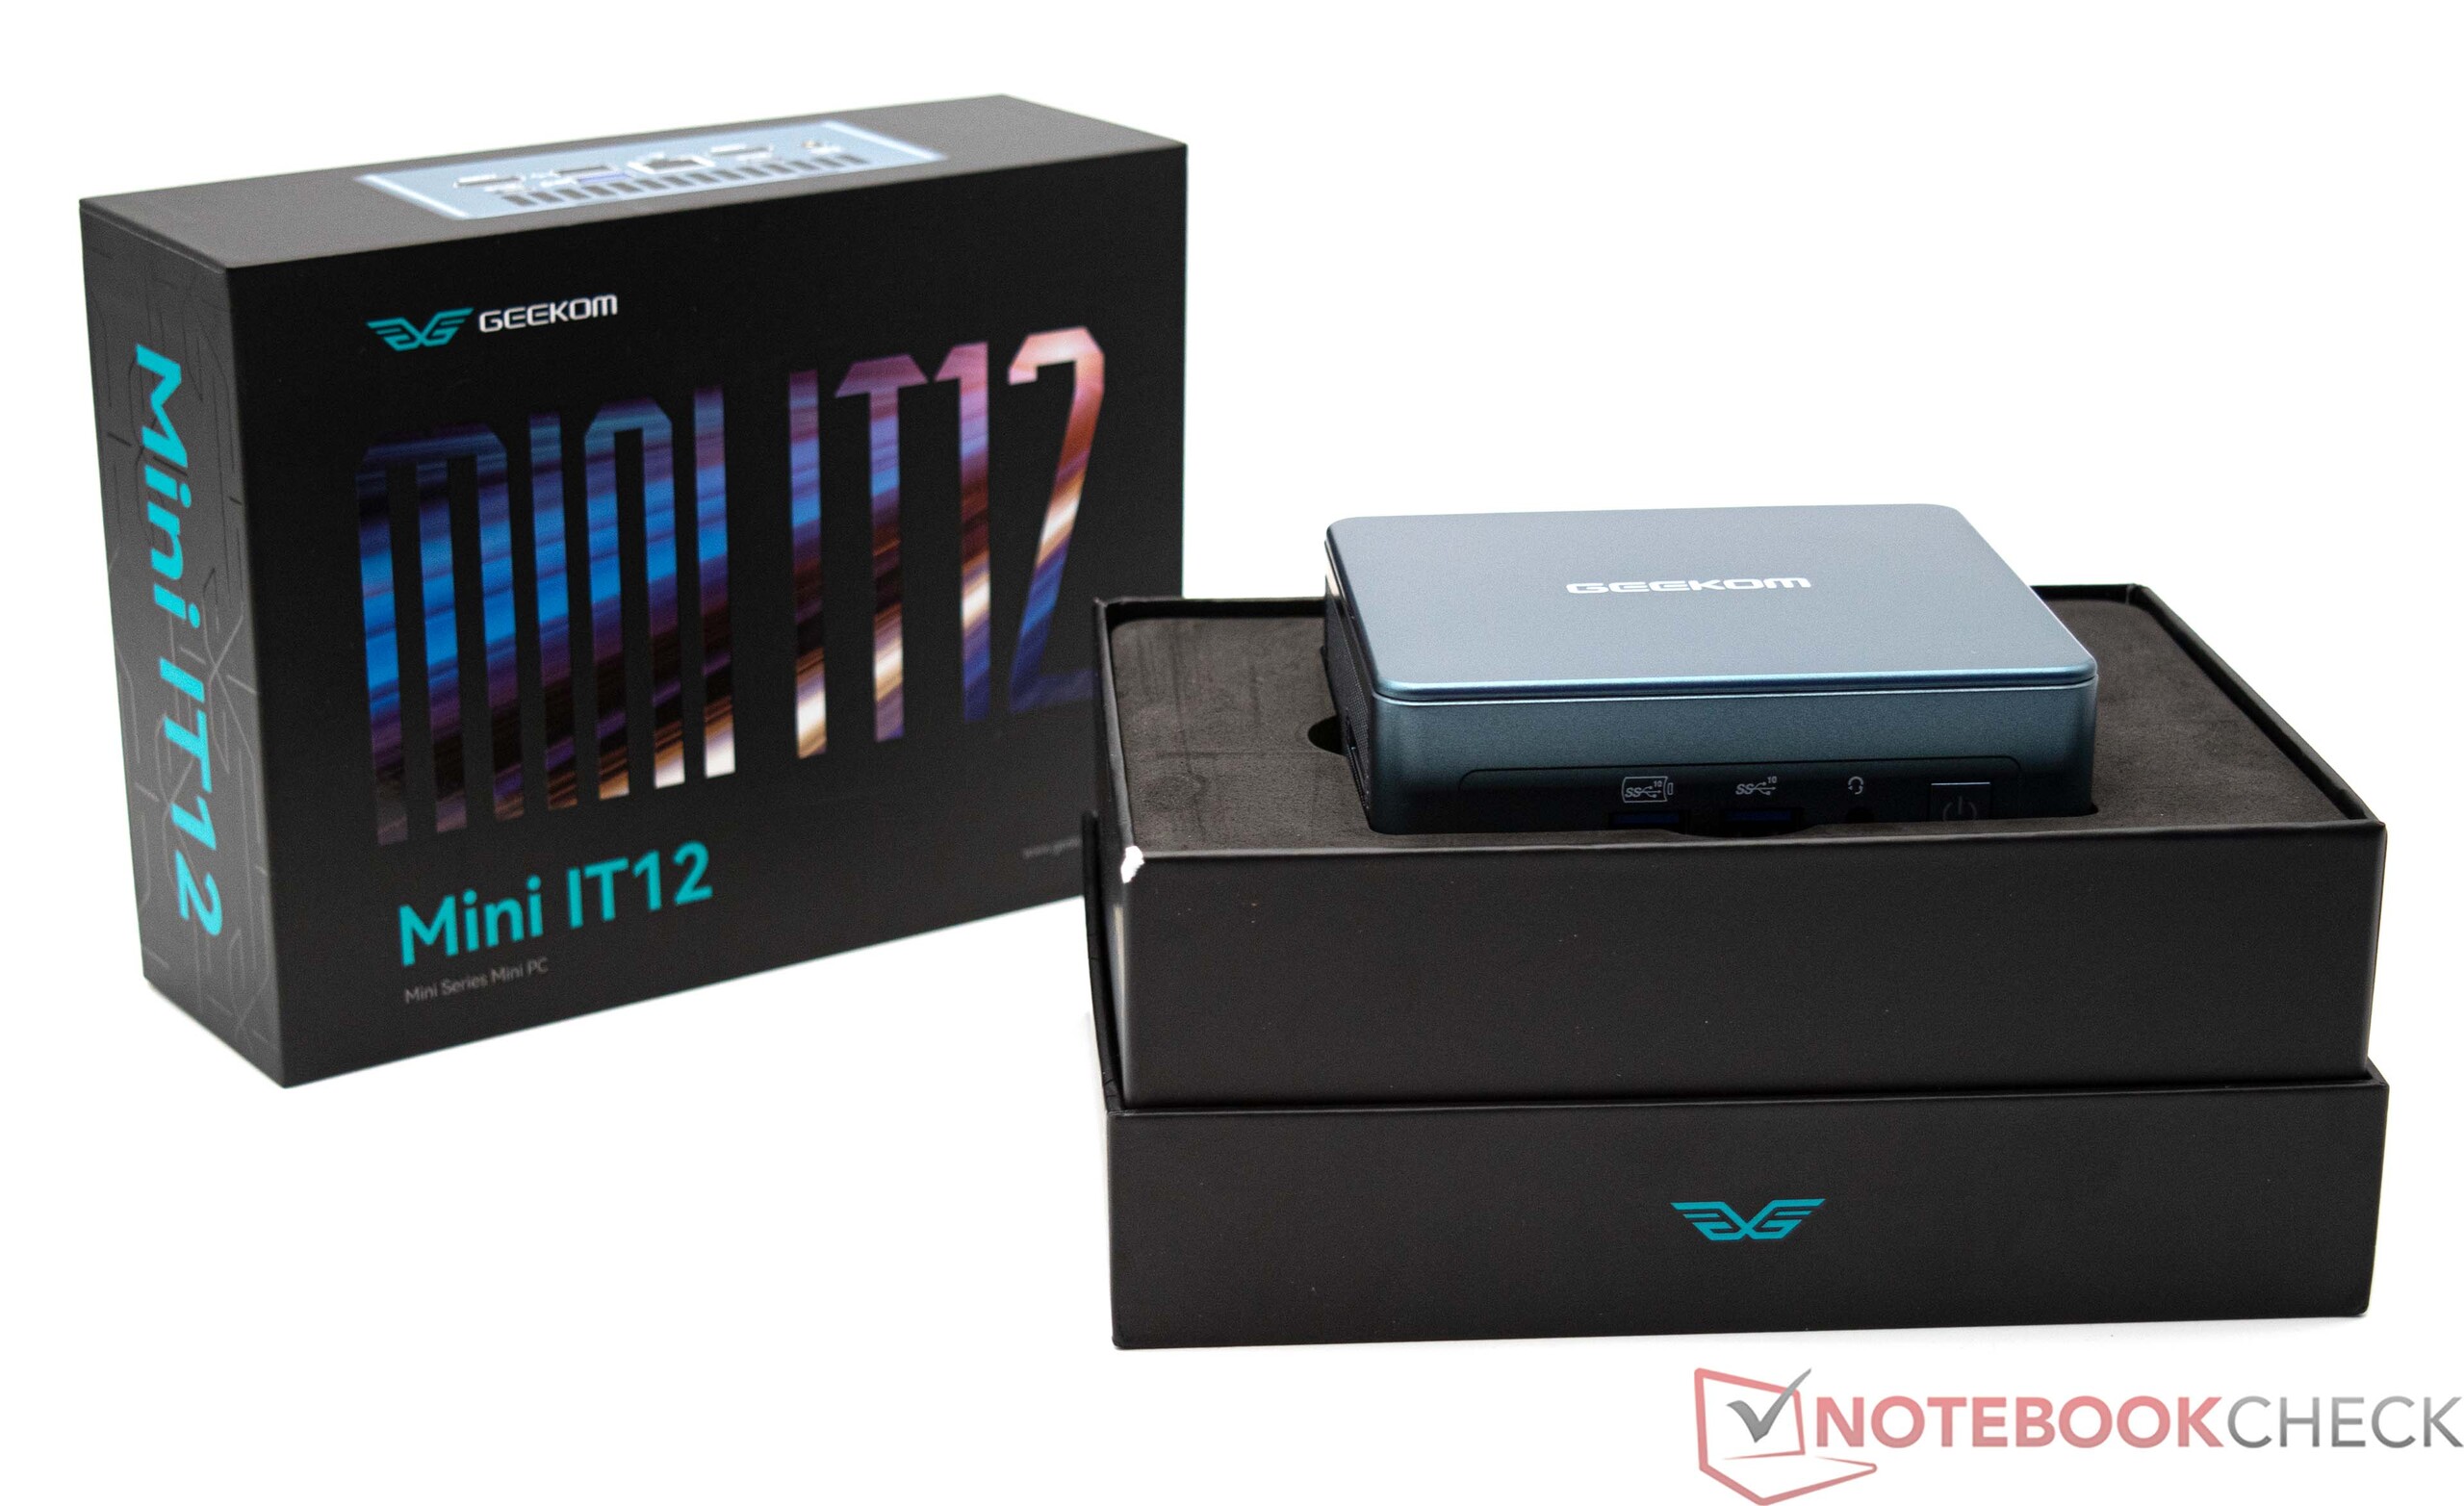
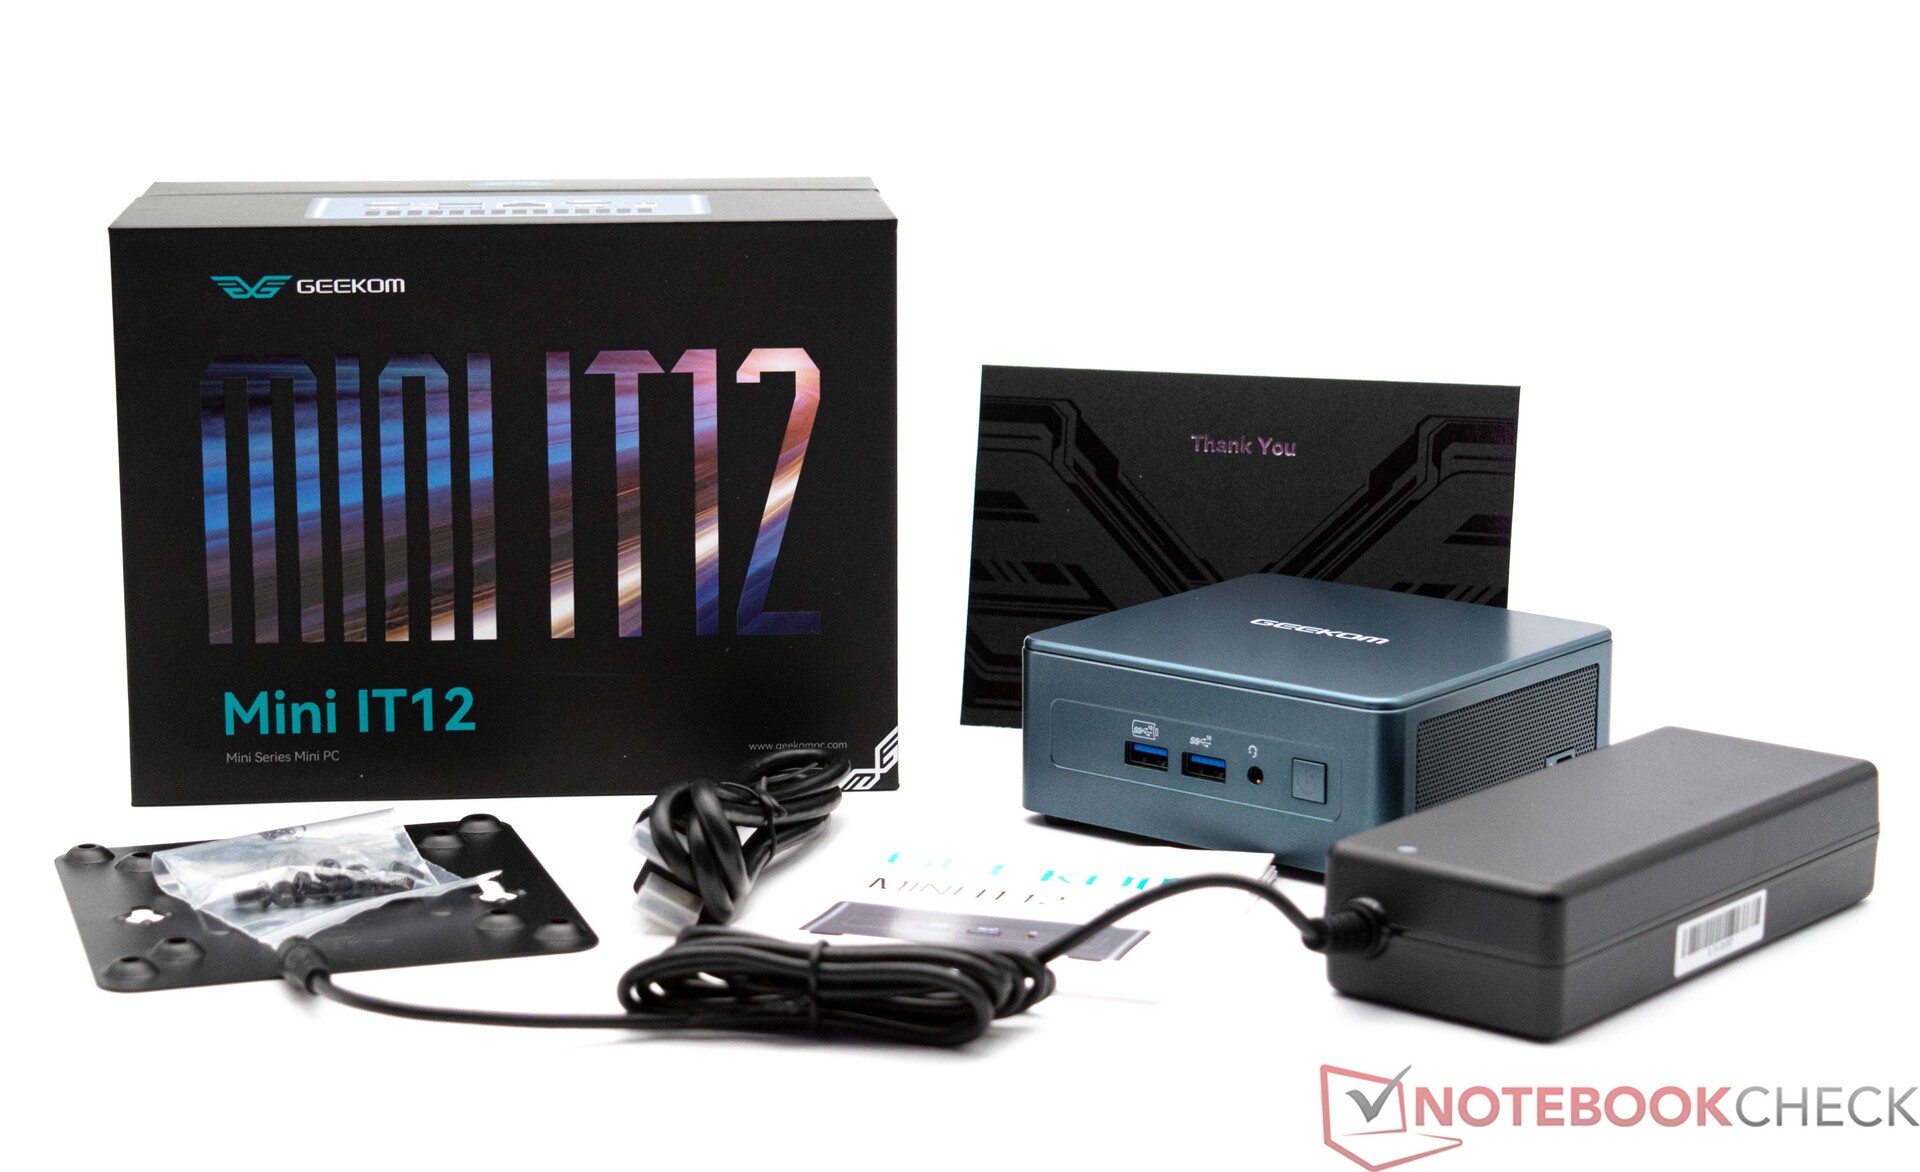
Geekom Mini IT12 mit Intel Core i5-12450H im Test - Mini-PC mit guter Leistung und zwei USB-4-Anschlüssen

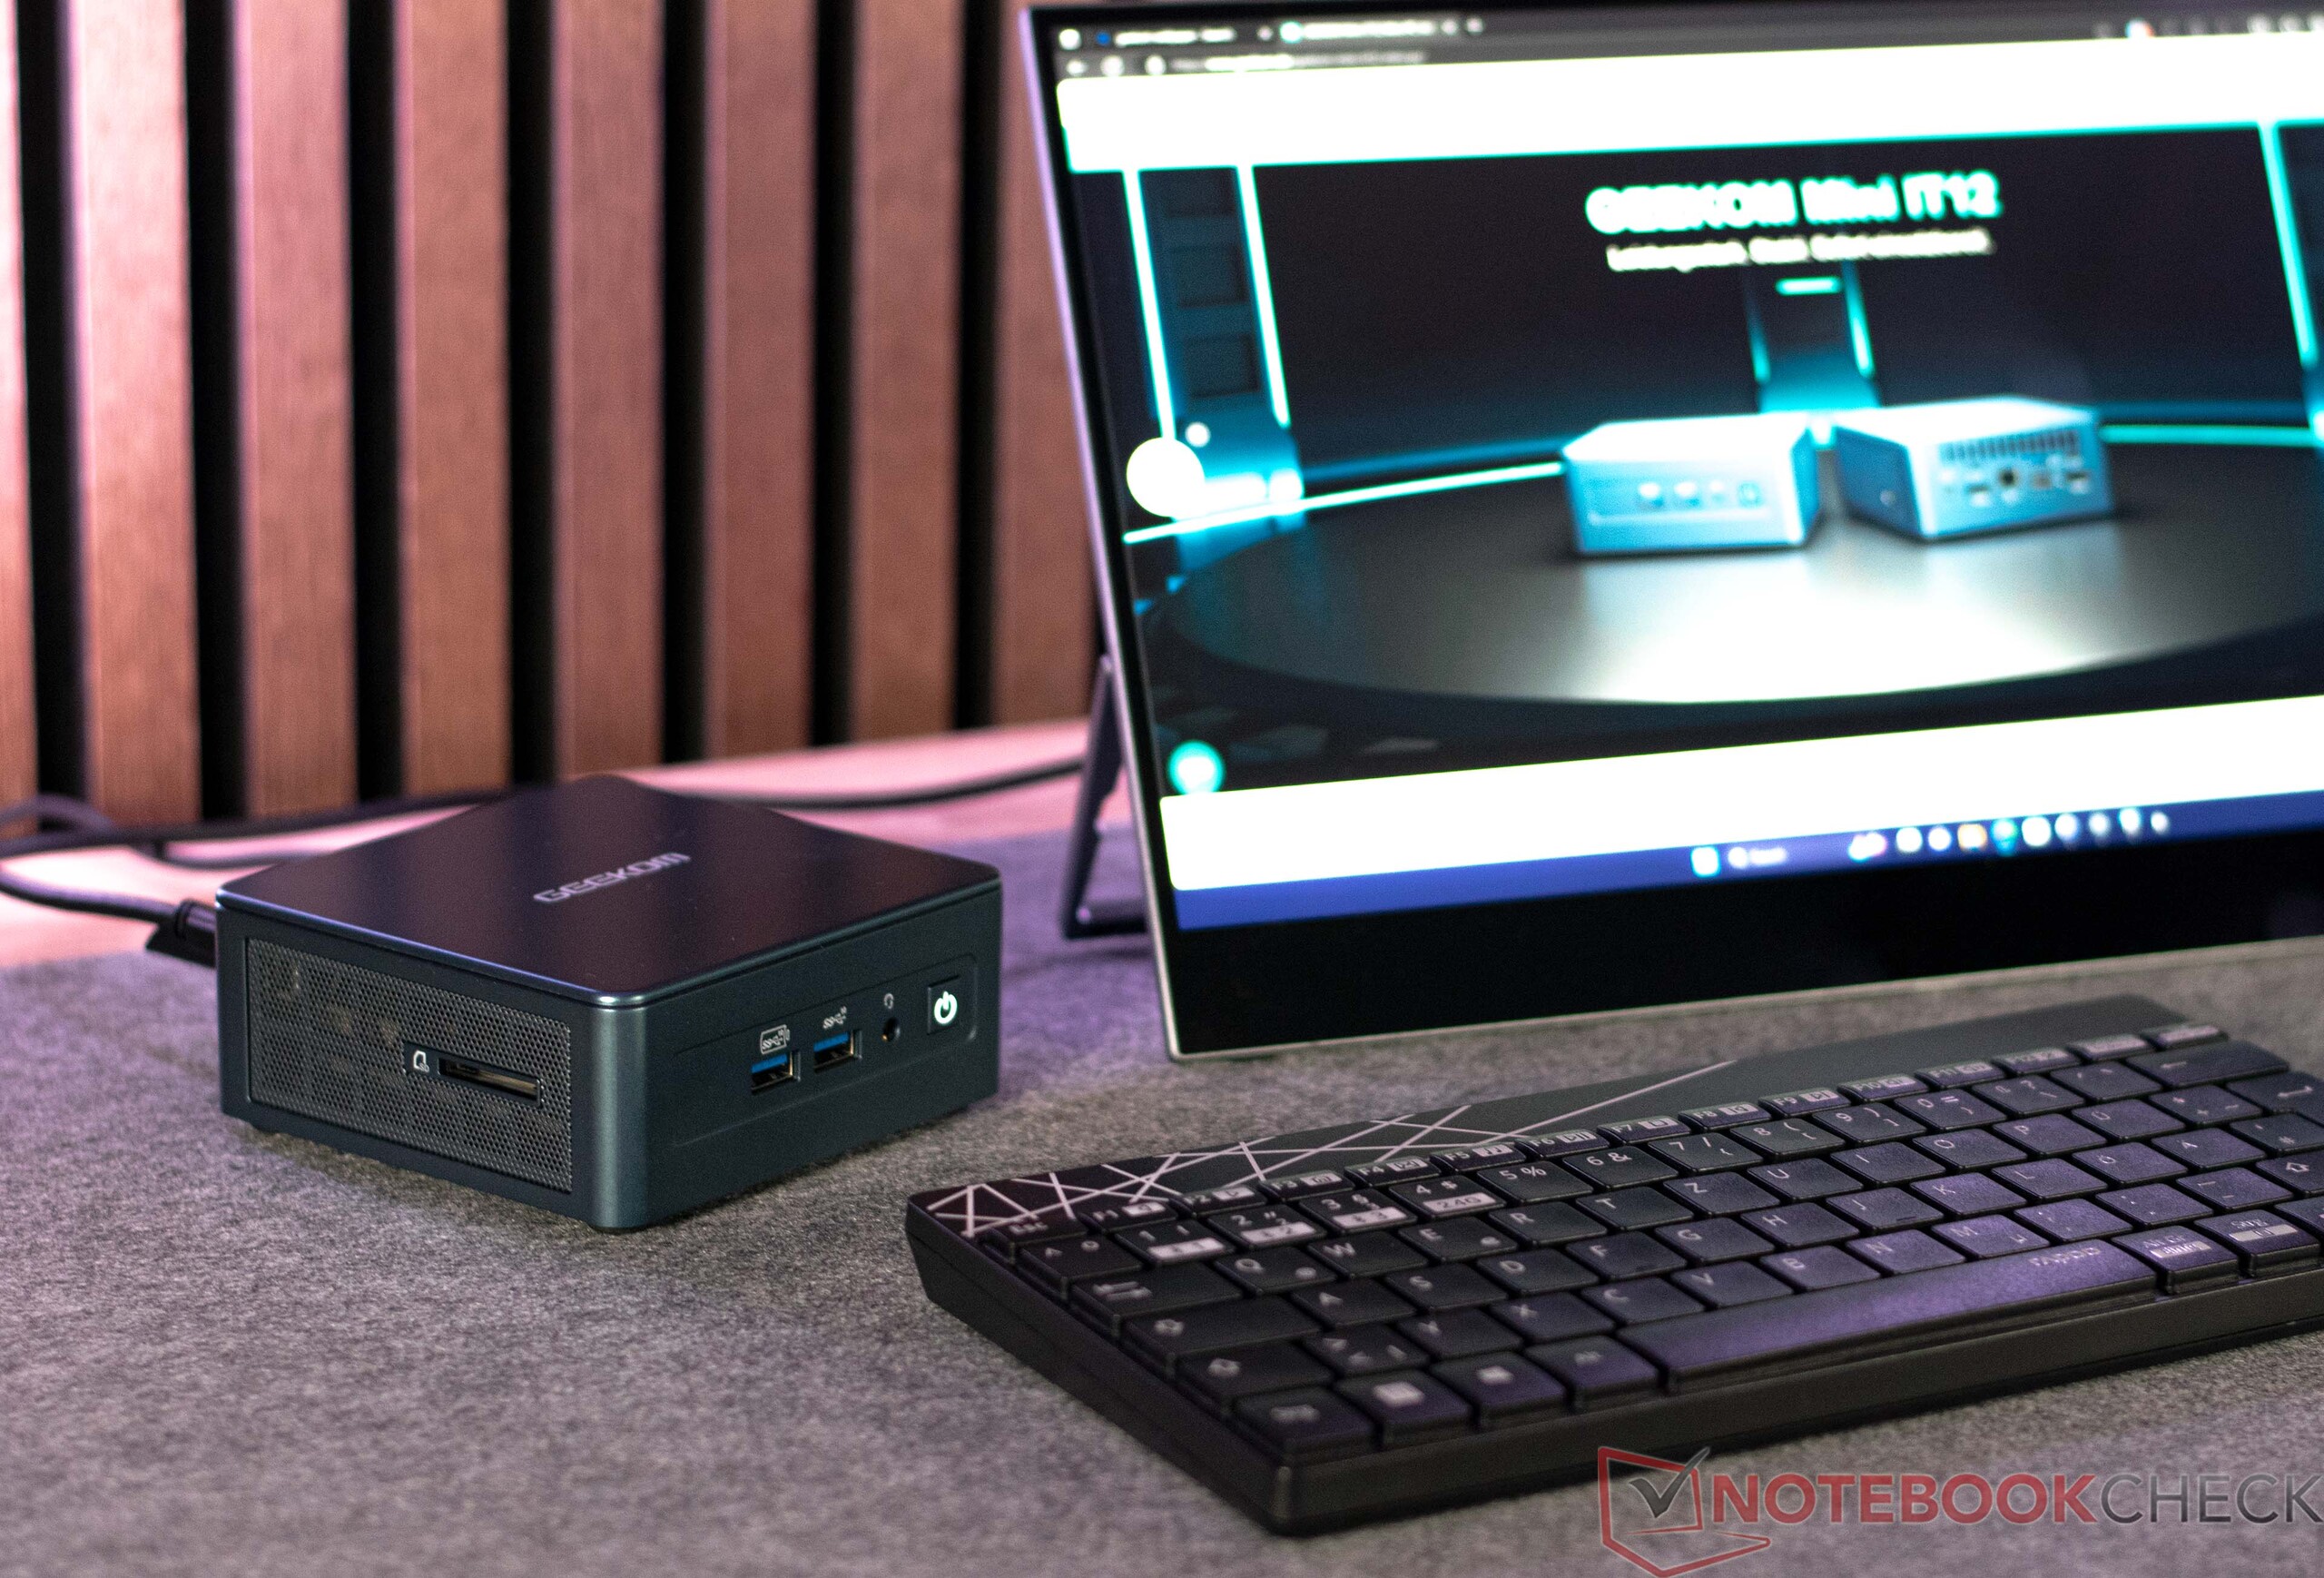
Beim Geekom Mini IT12 handelt es sich in erster Linie um einen kompakten und leistungsstarken Mini-PC. Geekom verbaut ist in unserer Testausstattung einen Intel Core i5-12450H sowie 16 GB RAM und eine 512-GB-SSD. Vorinstalliert ist Windows 11 in der Professional-Version. Aktuell verlangt Geekom 499 Euro für unser Testgerät. Damit reiht sich der Hersteller auf dem Preisniveau ein, welches auch die Konkurrenz für ähnlich ausgestattete Geräte aufruft. Dennoch kann der Geekom mit einer etwas besseren Anschlussausstattung auf sich aufmerksam machen, was unter Umständen die Kaufentscheidung maßgeblich beeinflusst.
Der Geekom Mini IT12 zielt ganz klar auf die Intel-NUC-Serie ab, welche nunmehr von Asus vermarktet wird. Aber auch Minisforum und NiPoGi sind mit ähnlichen Produkten potenzielle Konkurrenten. Eine Auflistung der Vergleichsgeräte für dieses Review haben wir in der nachfolgenden Übersicht zusammengetragen.
mögliche Konkurrenten im Vergleich
Bew. | Datum | Modell | Gewicht | Dicke | Preis ab |
|---|---|---|---|---|---|
| 79.5 % v7 (old) | 11 / 2023 | Geekom Mini IT12 i5-12450H, UHD Graphics 64EUs | 572 g | 45.6 mm | |
| 82.3 % v7 (old) | 05 / 2023 | Geekom Mini IT12 i7-1260P, Iris Xe G7 96EUs | 572 g | 45.6 mm | |
| 80.8 % v7 (old) | 04 / 2023 | Intel NUC 13 Pro Kit NUC13ANK i7-1360P, Iris Xe G7 96EUs | 538 g | 37 mm | |
| 79.5 % v7 (old) | 02 / 2023 | Minisforum Mars Series MC560 R5 5600U, Vega 7 | 562 g | 66 mm | |
| 78.9 % v7 (old) | 11 / 2022 | Intel NUC 12 Pro Kit NUC12WSKi7 i7-1260P, Iris Xe G7 96EUs | 511 g | 37 mm | |
| 78 % v7 (old) | 10 / 2023 | Minisforum Venus Series UN1245 i5-12450H, UHD Graphics 64EUs | 545 g | 54.3 mm | |
| 77.2 % v7 (old) | 10 / 2023 | NiPoGi CK10 i5-12450H, UHD Graphics 64EUs | 481 g | 50 mm |
Geekom Mini IT12 i5-12450H im Detail

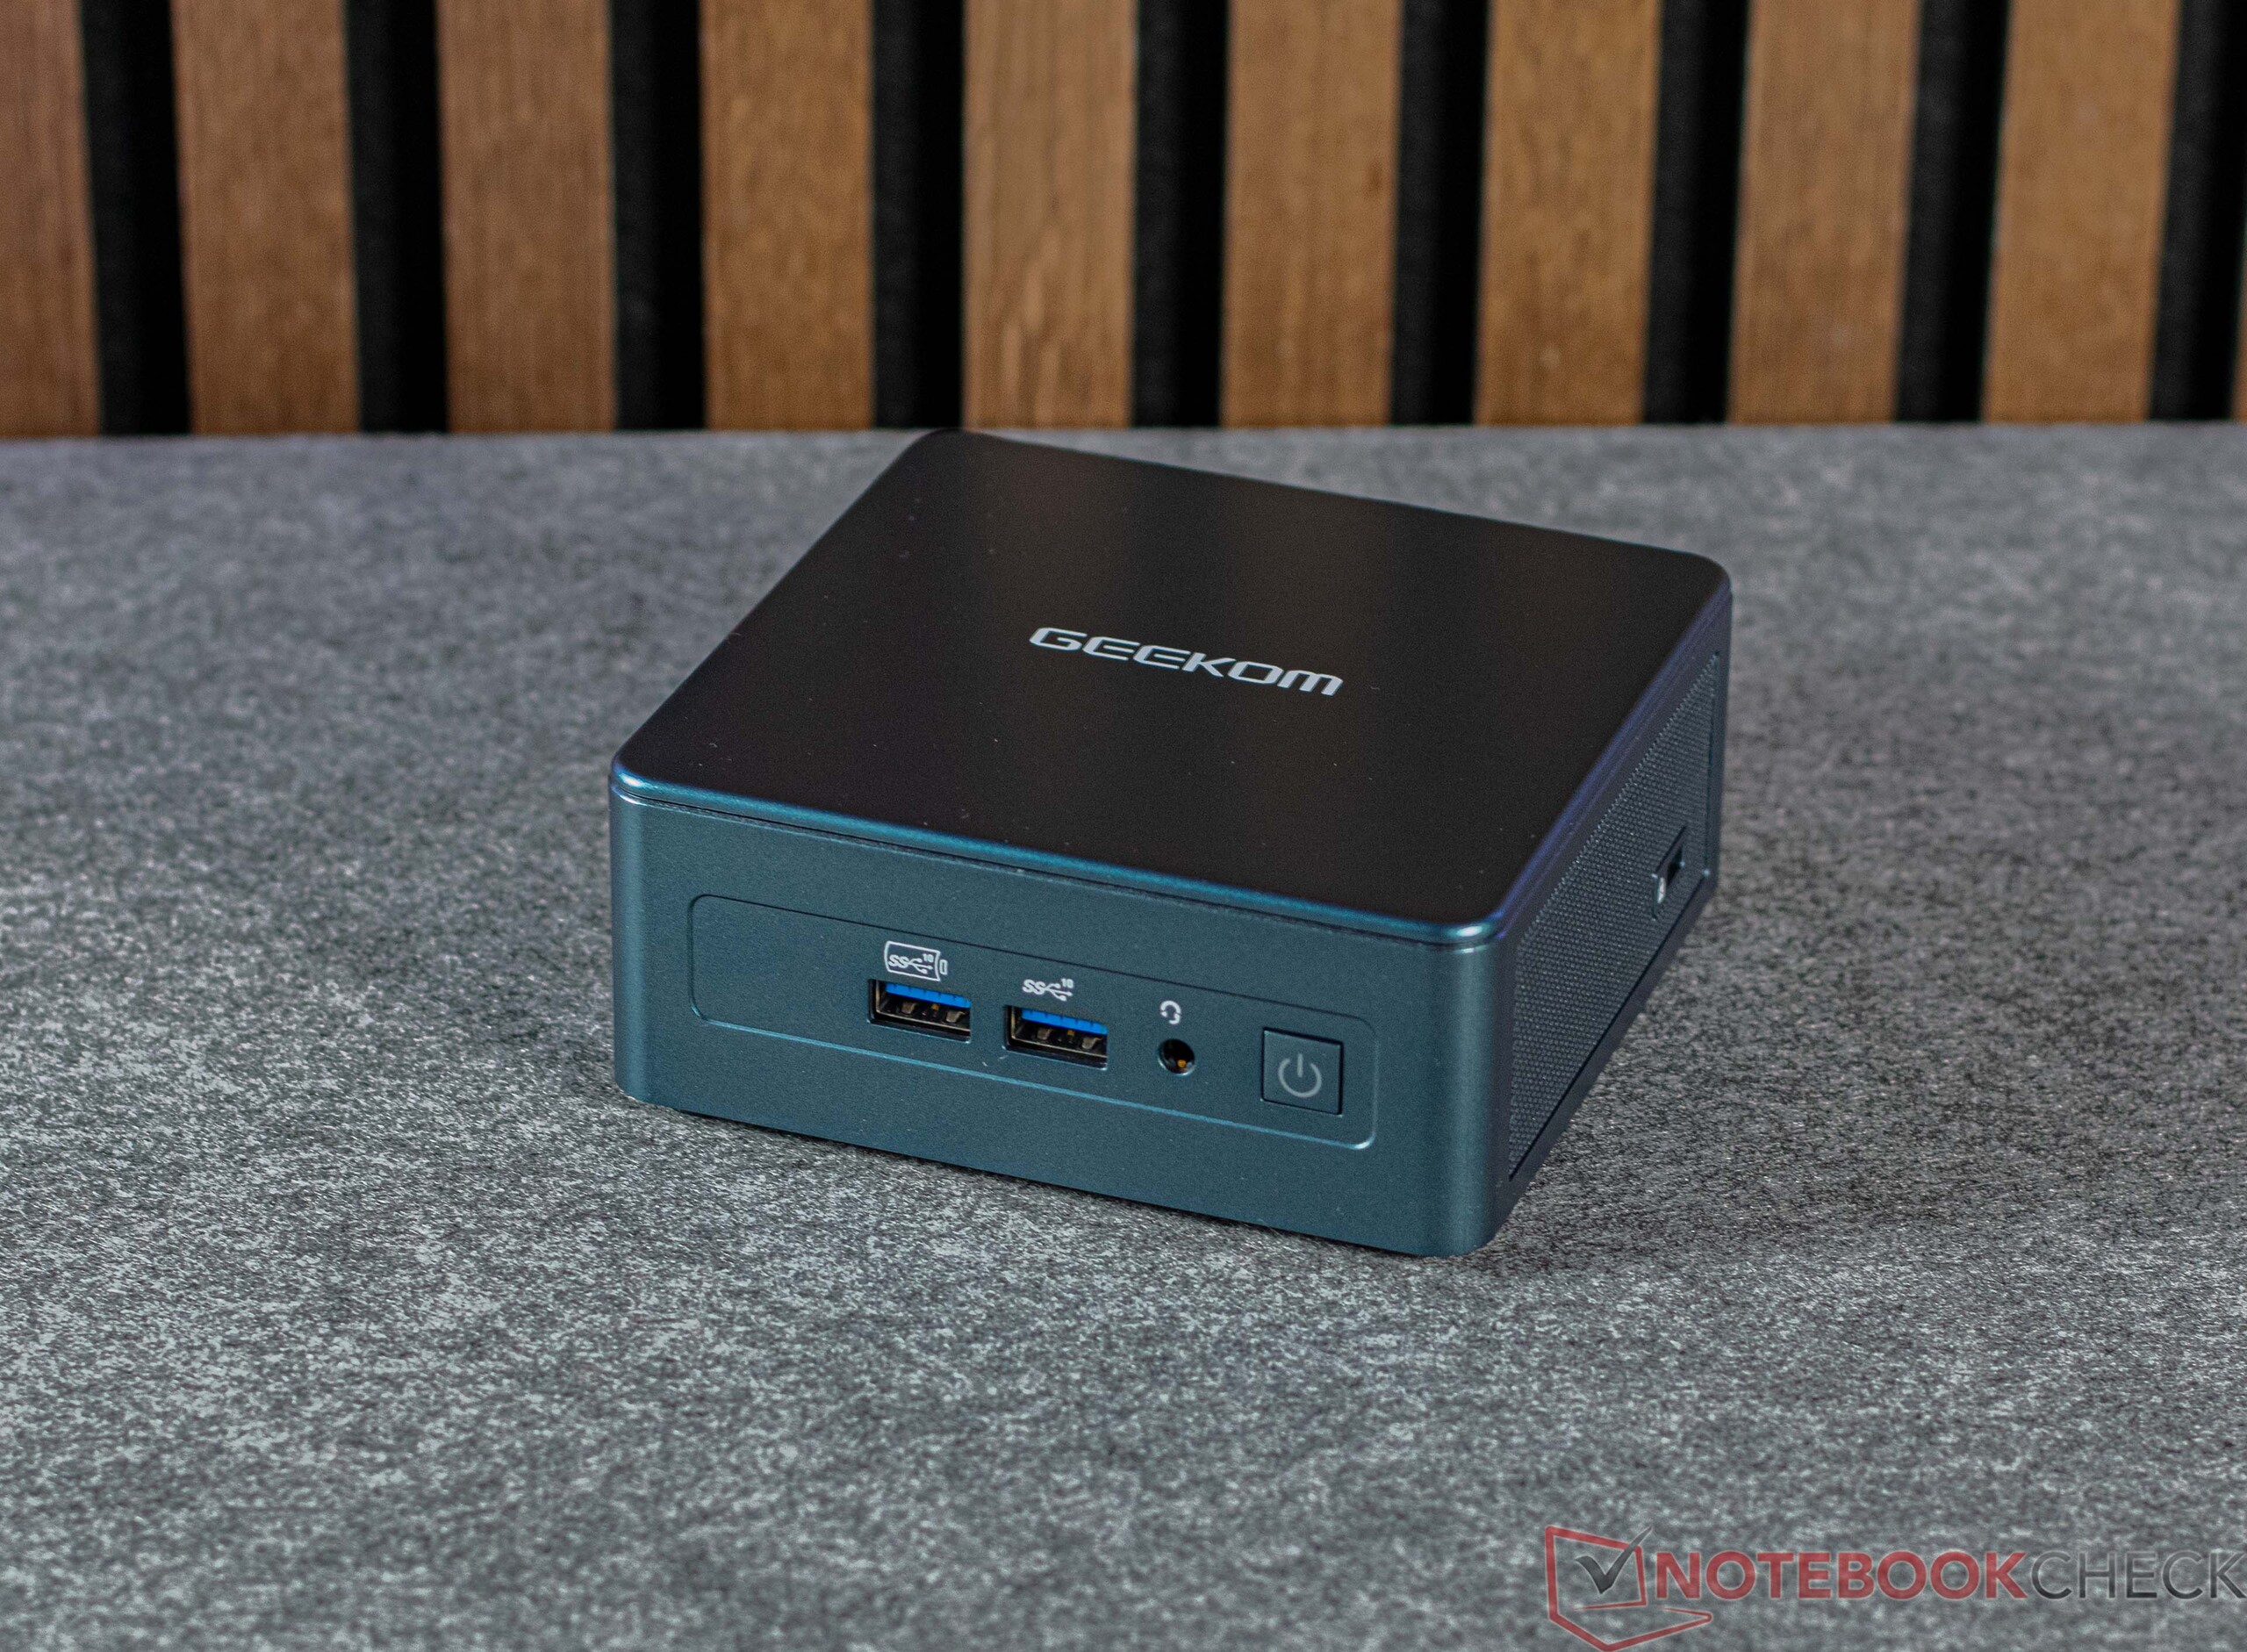


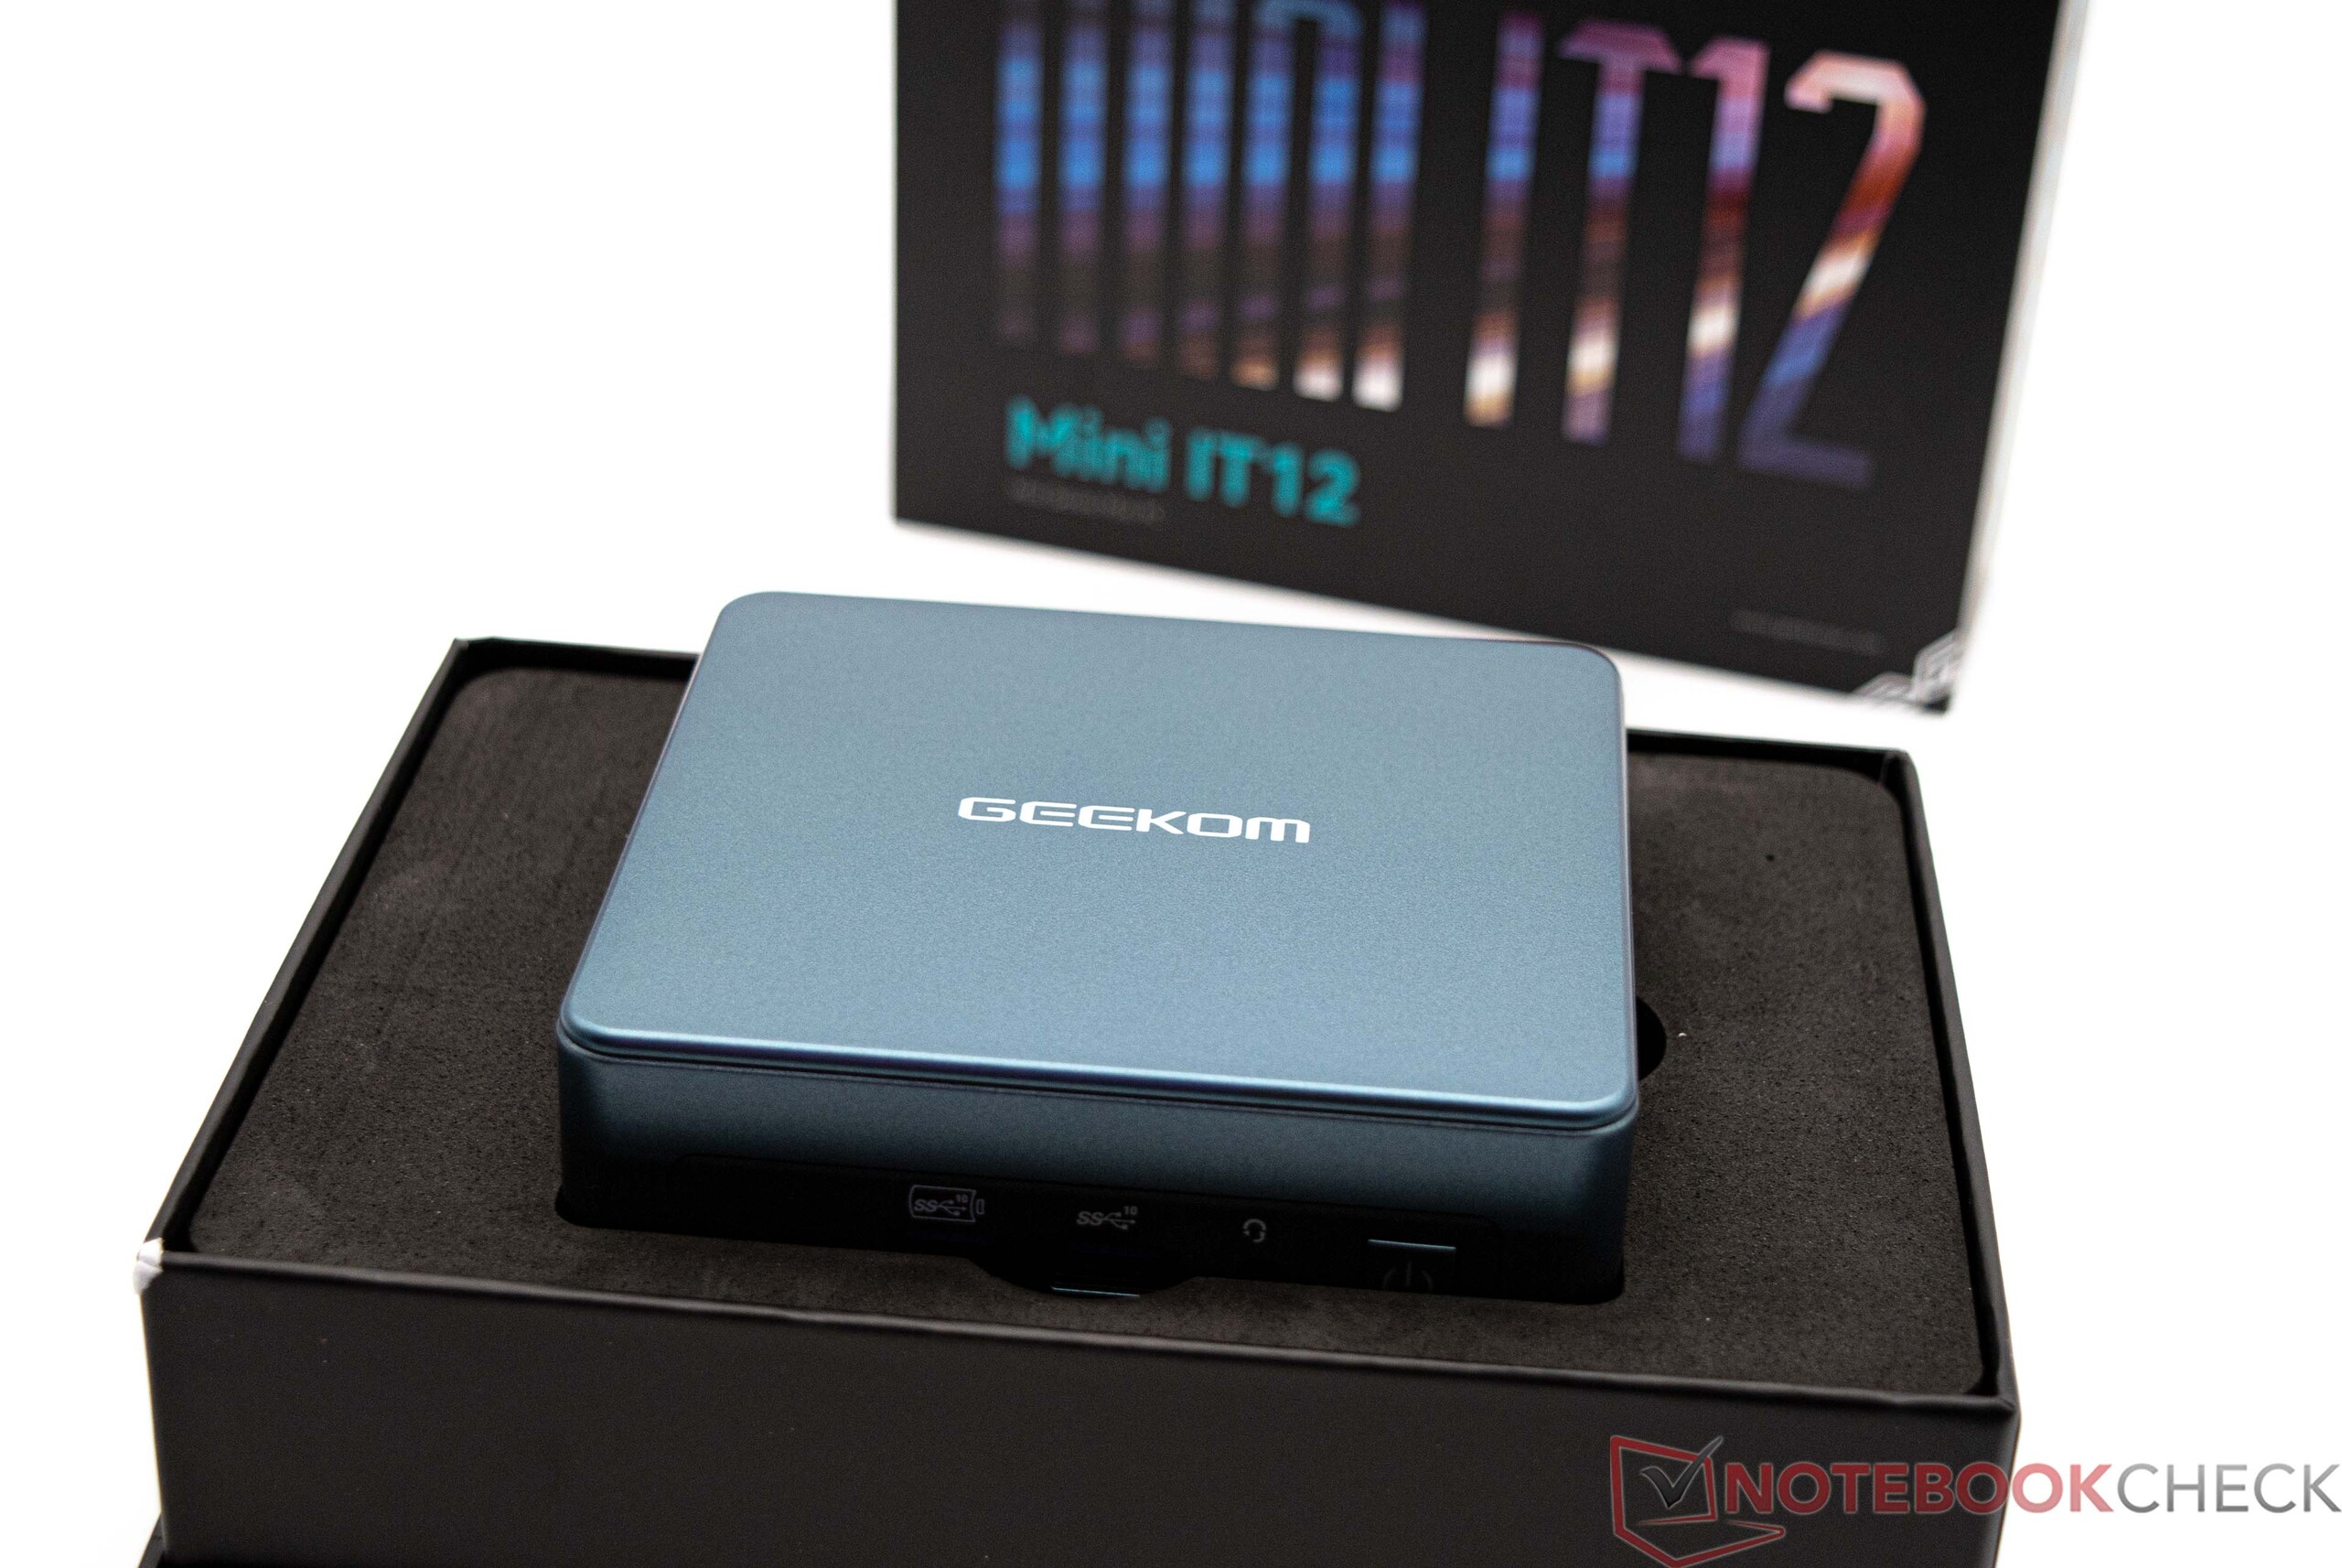


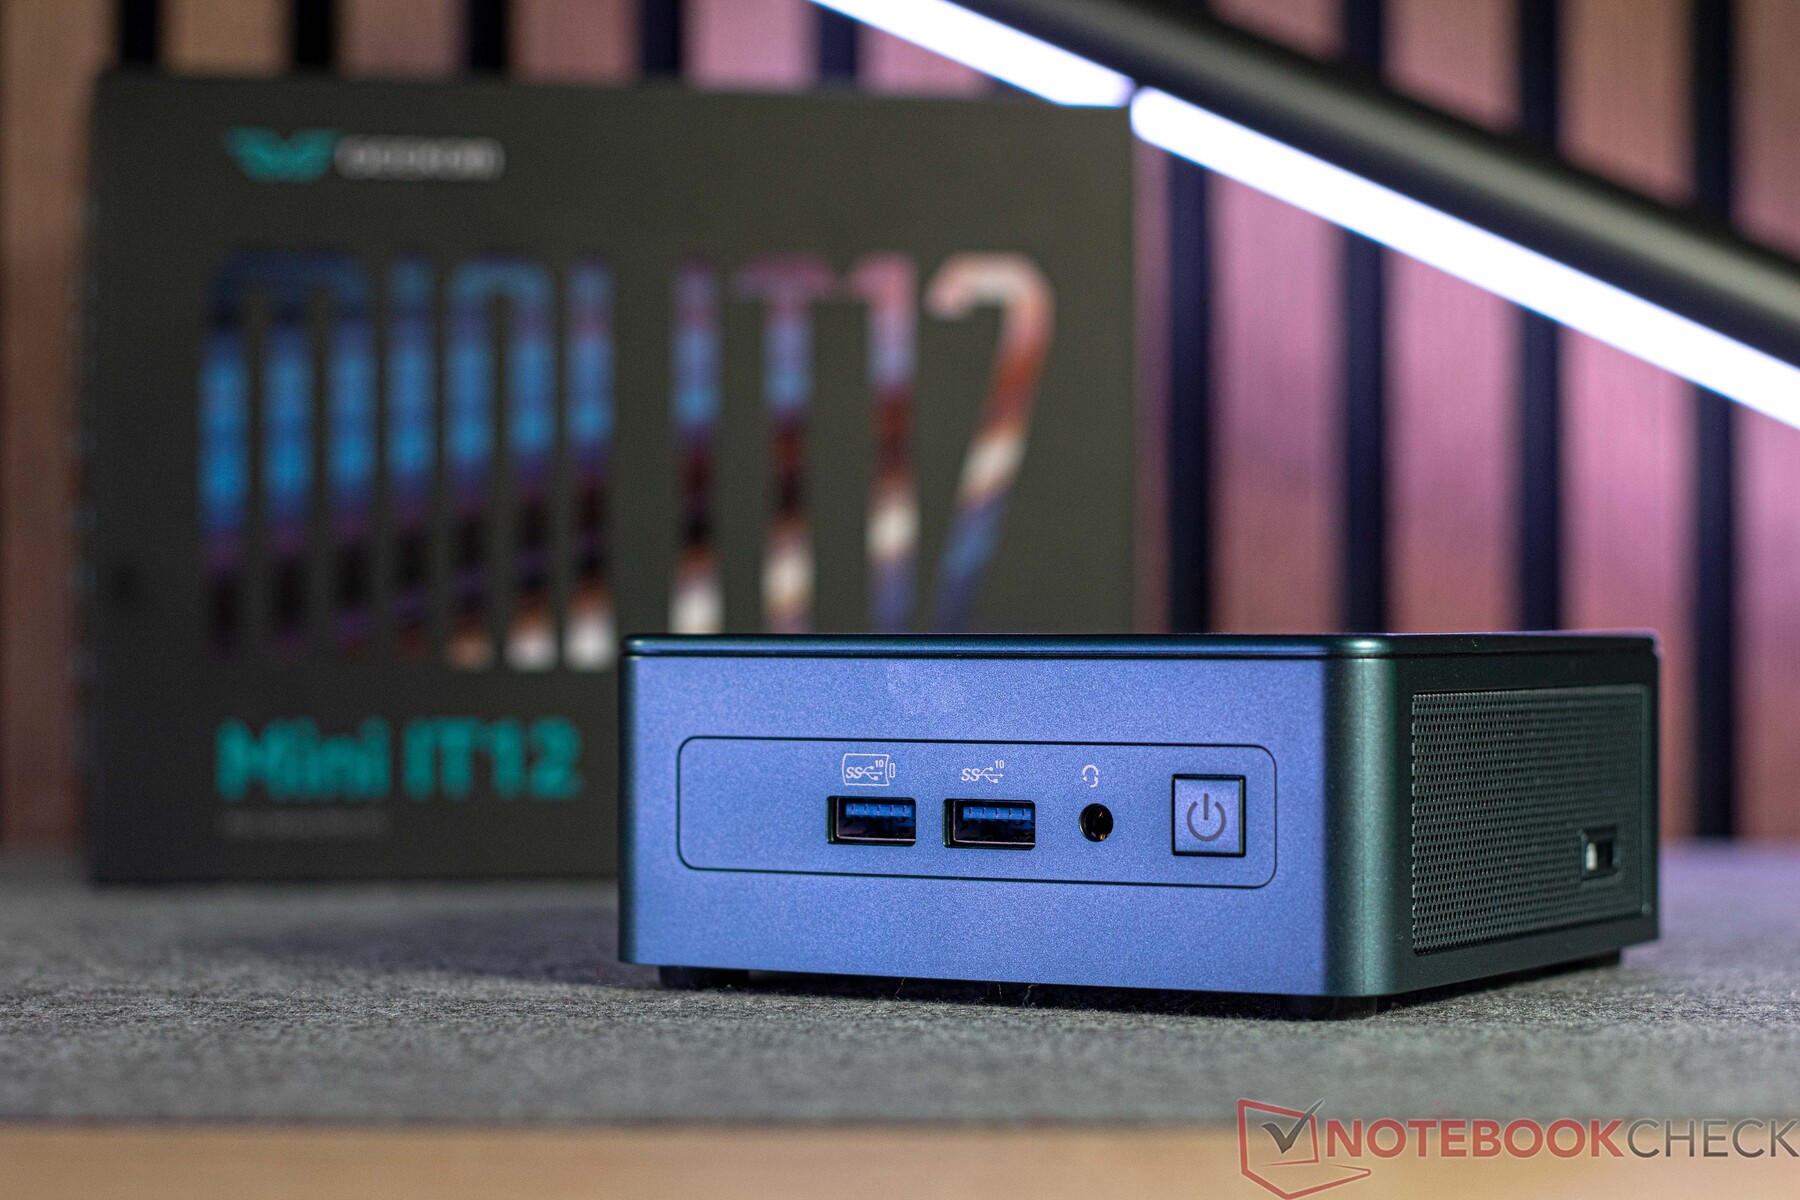
Gehäuse - Bekanntes Äußeres im Intel-NUC-Stil
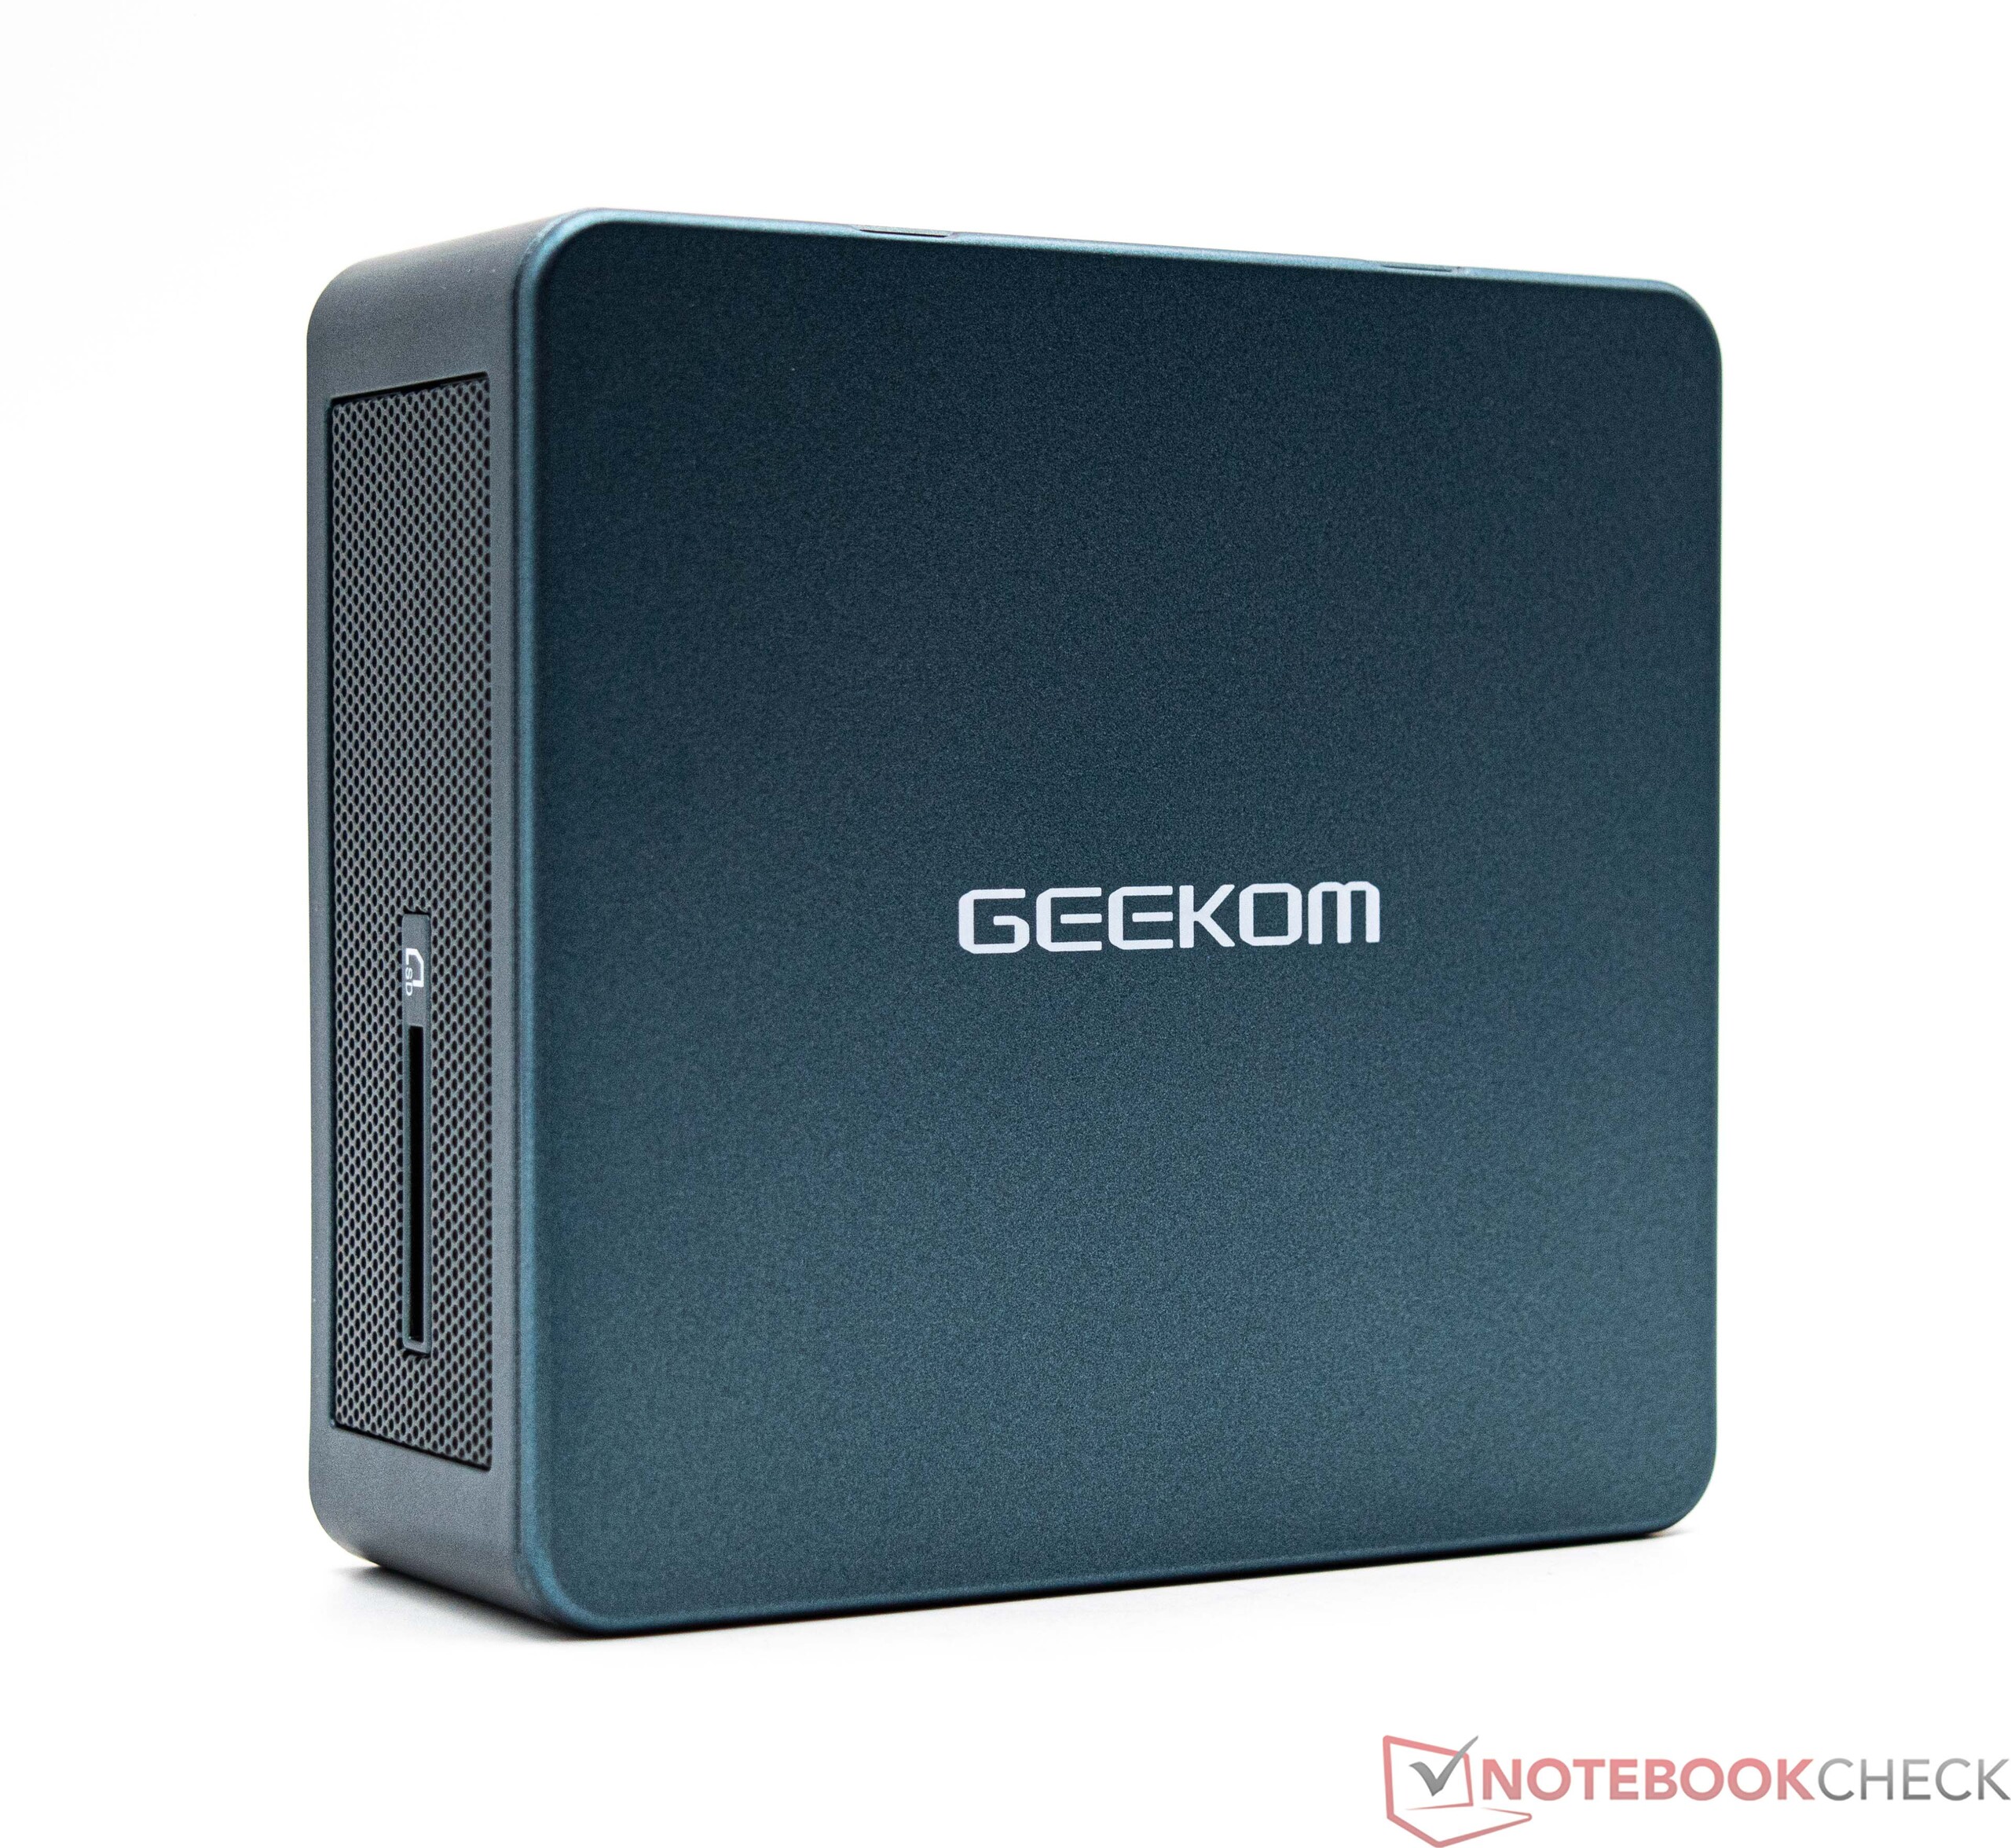
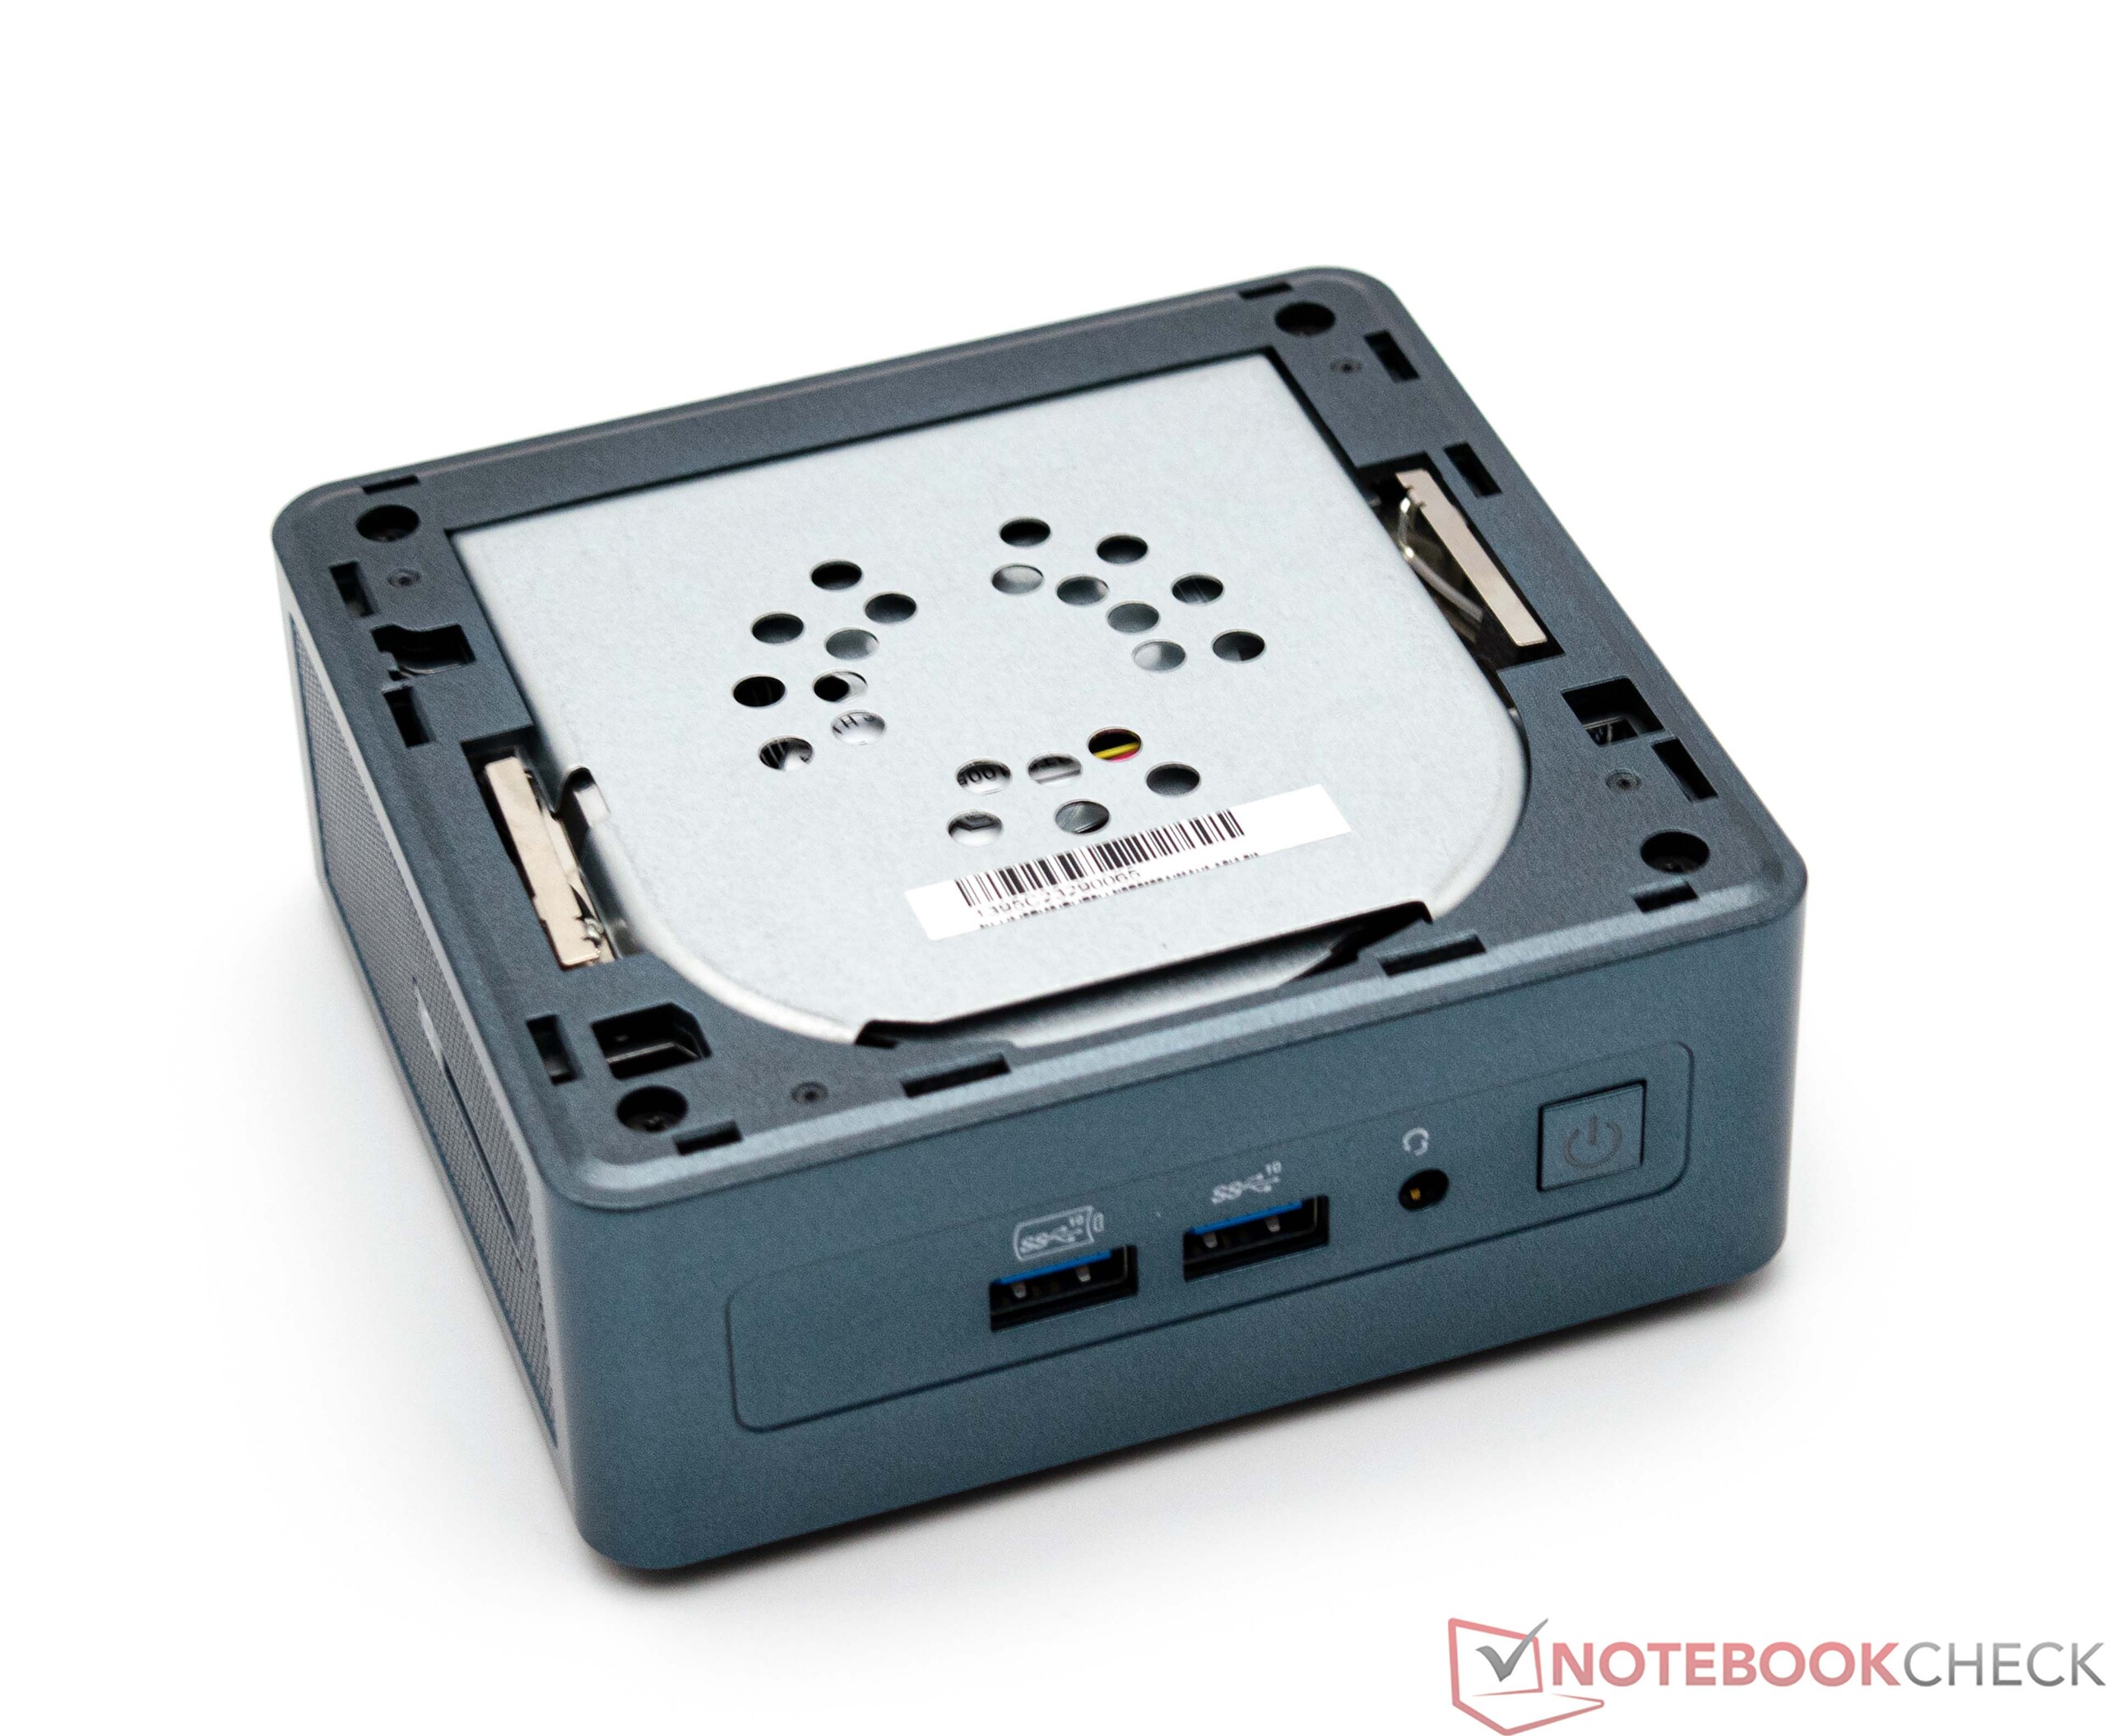
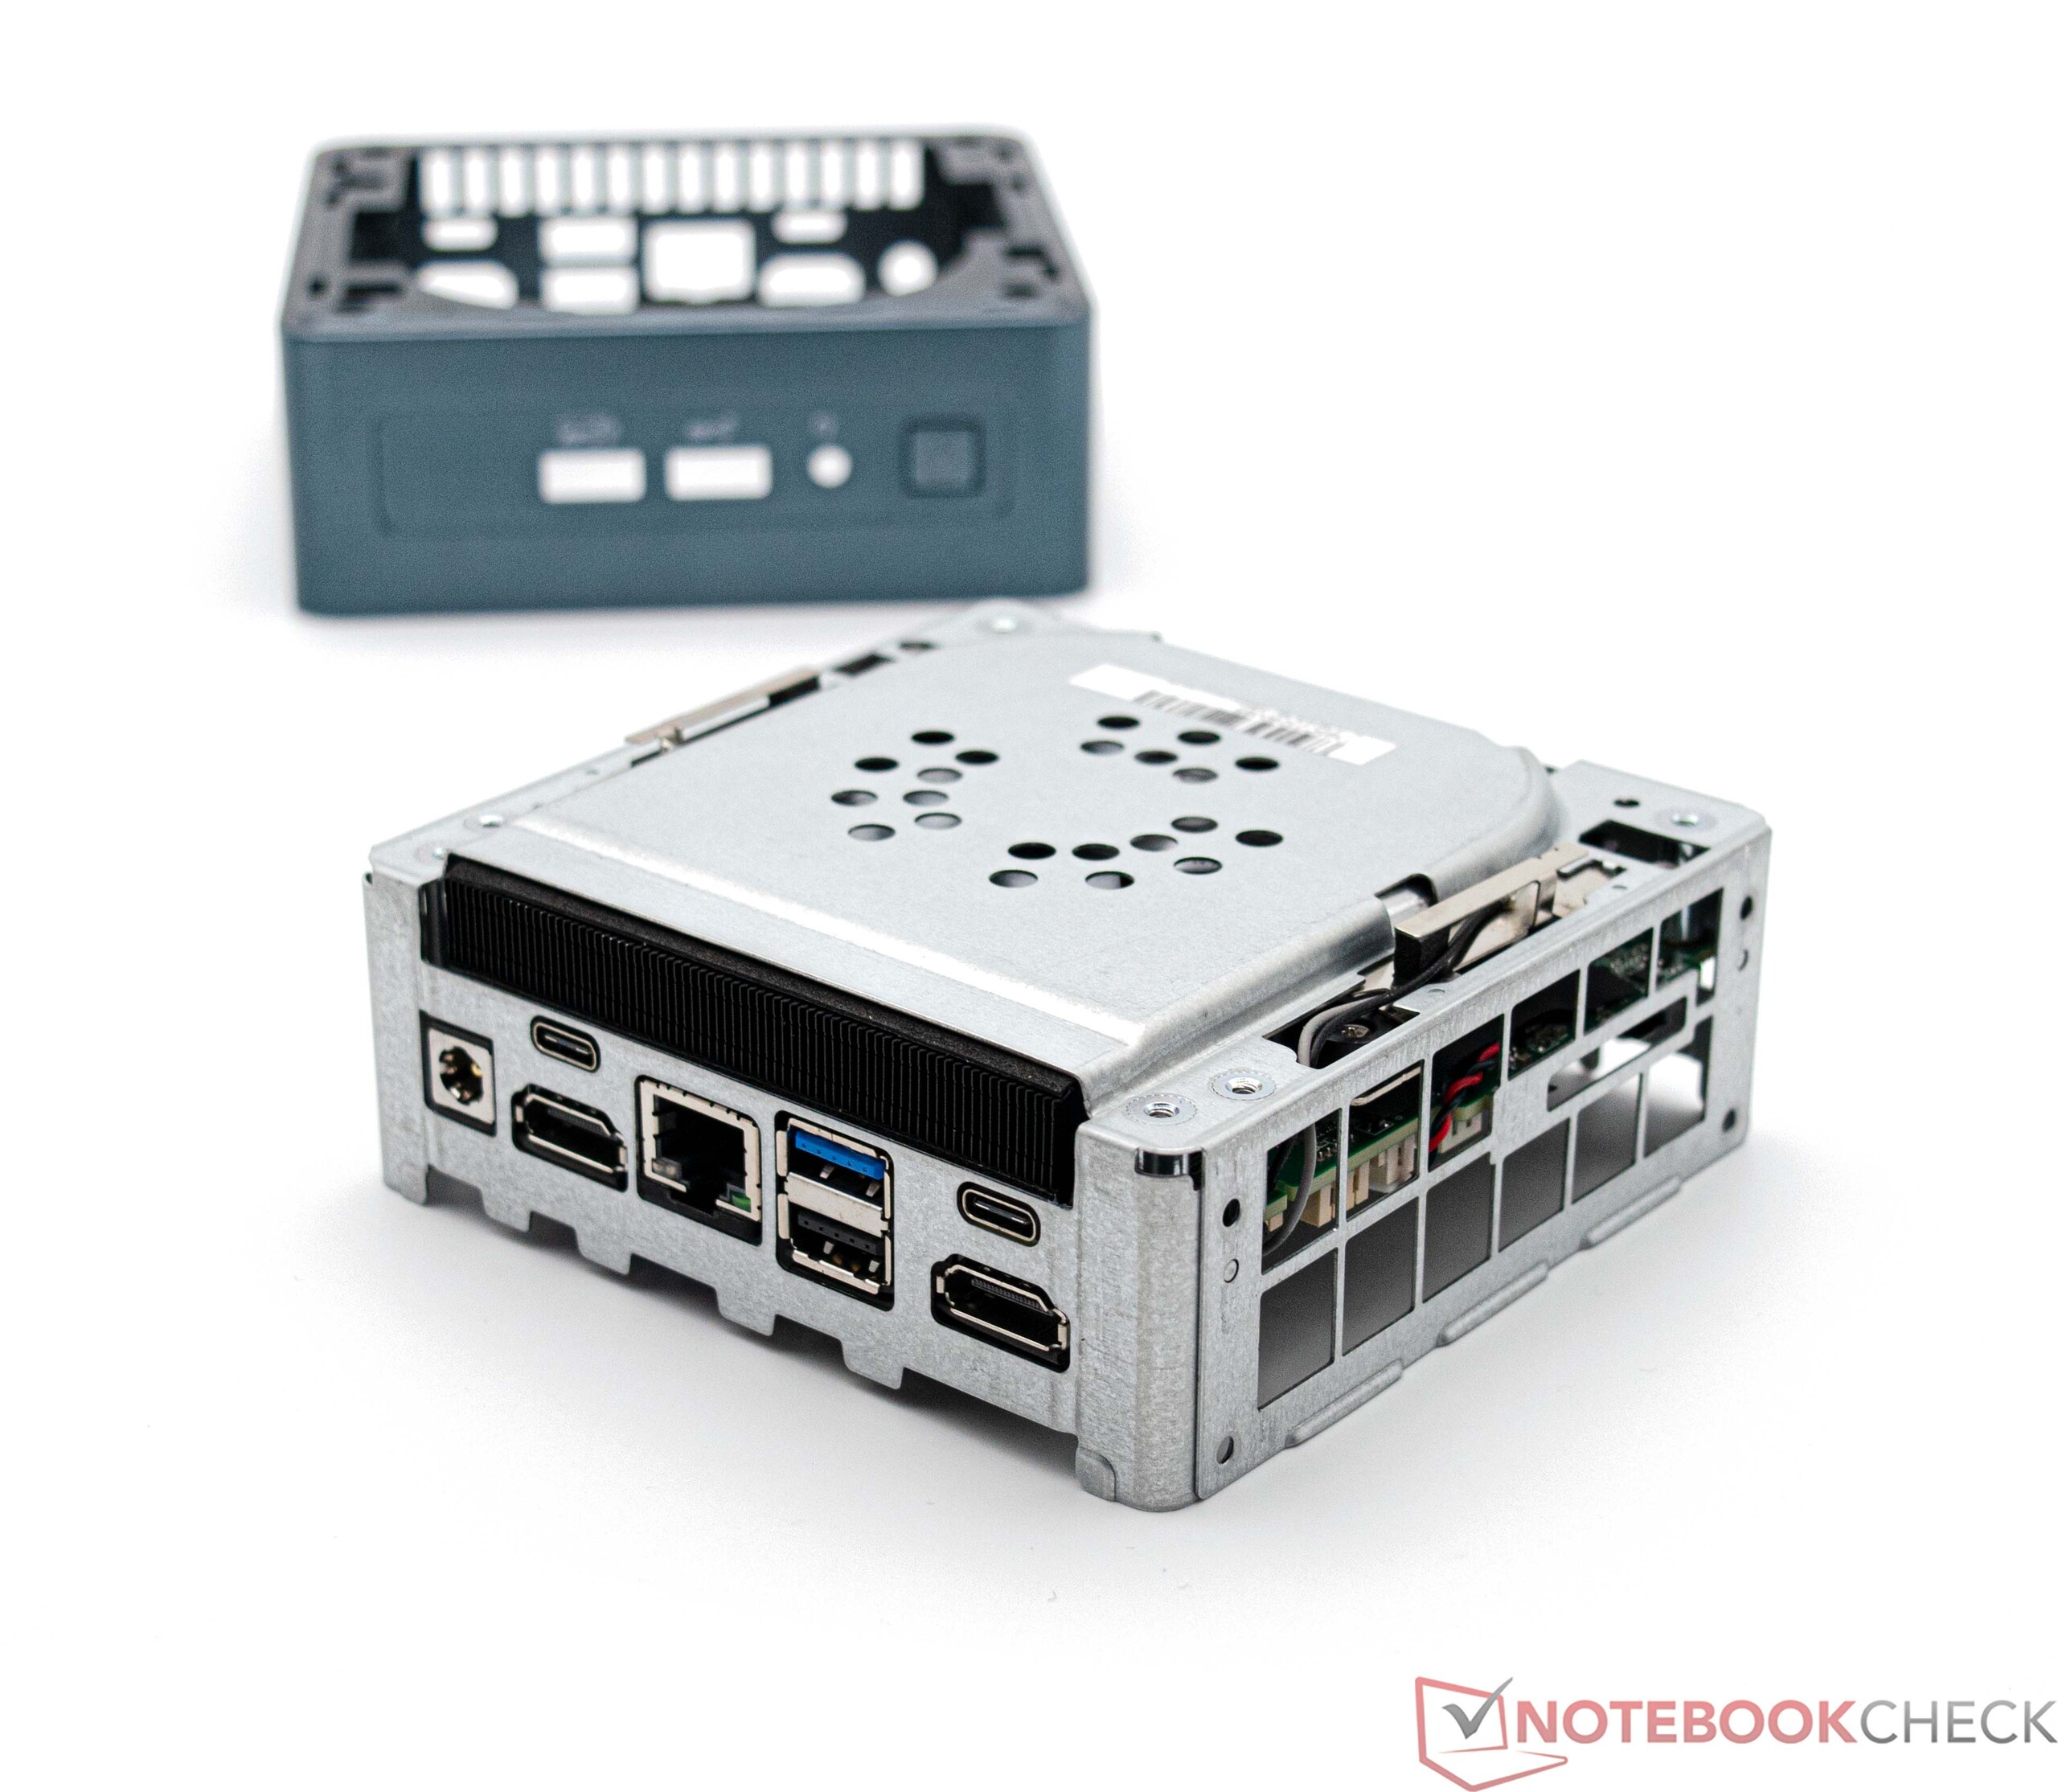
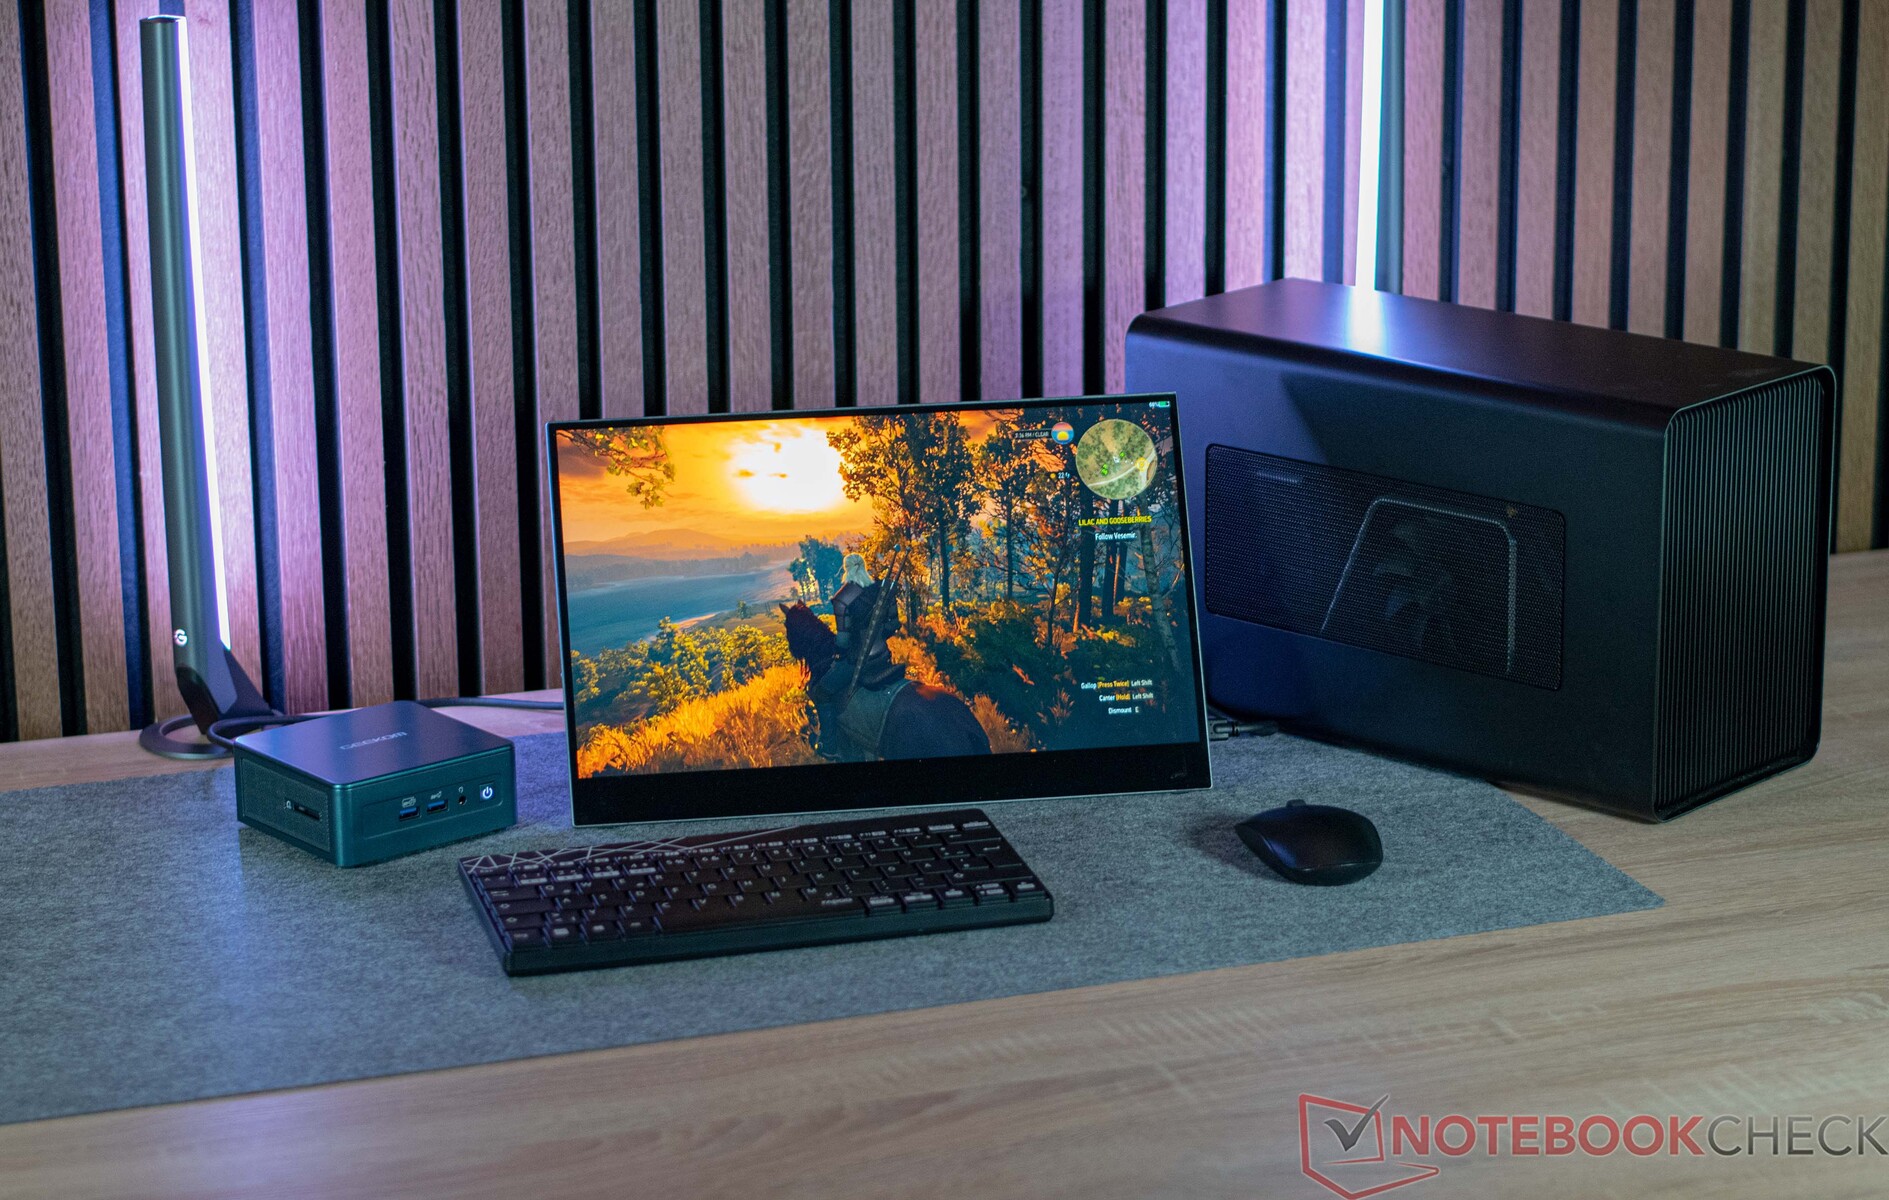
Der Geekom Mini IT12 erinnert optisch sehr stark an die Intel-NUC-Geräte. Gleichwohl wird der Mini IT12 nur in der höheren Bauform mit der Möglichkeit eines 2,5-Zoll-Datenträgers zu installieren angeboten. Intel selbst hatte bislang eine "Small"- und eine "Tall"-Variante im Portfolio. Mit 11,7 × 11,2 Zentimetern benötigt unser Testsample nicht viel Platz auf dem Schreibtisch. Der Geekom Mini IT12 kommt ein türkisfarbenes Gehäuse verpasst. Die Oberflächen wirken hochwertig und auf kratzempfindliche Klavierlackoberflächen wird glücklicherweise verzichtet. Bei der Materialauswahl hält Geekom weiterhin an Kunststoff fest. Im Vergleich zu den hier gewählten Kontrahenten geht das in Ordnung, doch mitunter haben einige Hersteller auch schon den Schritt gewagt und komplette Aluminiumgehäuse gefertigt, welche haptisch deutlich hochwertiger wirken. Übrigens kann auch der Geekom Mini IT12, wie viele andere Mini-PCs, über die mitgelieferte VESA-Halterung an einem Monitor befestigt werden.
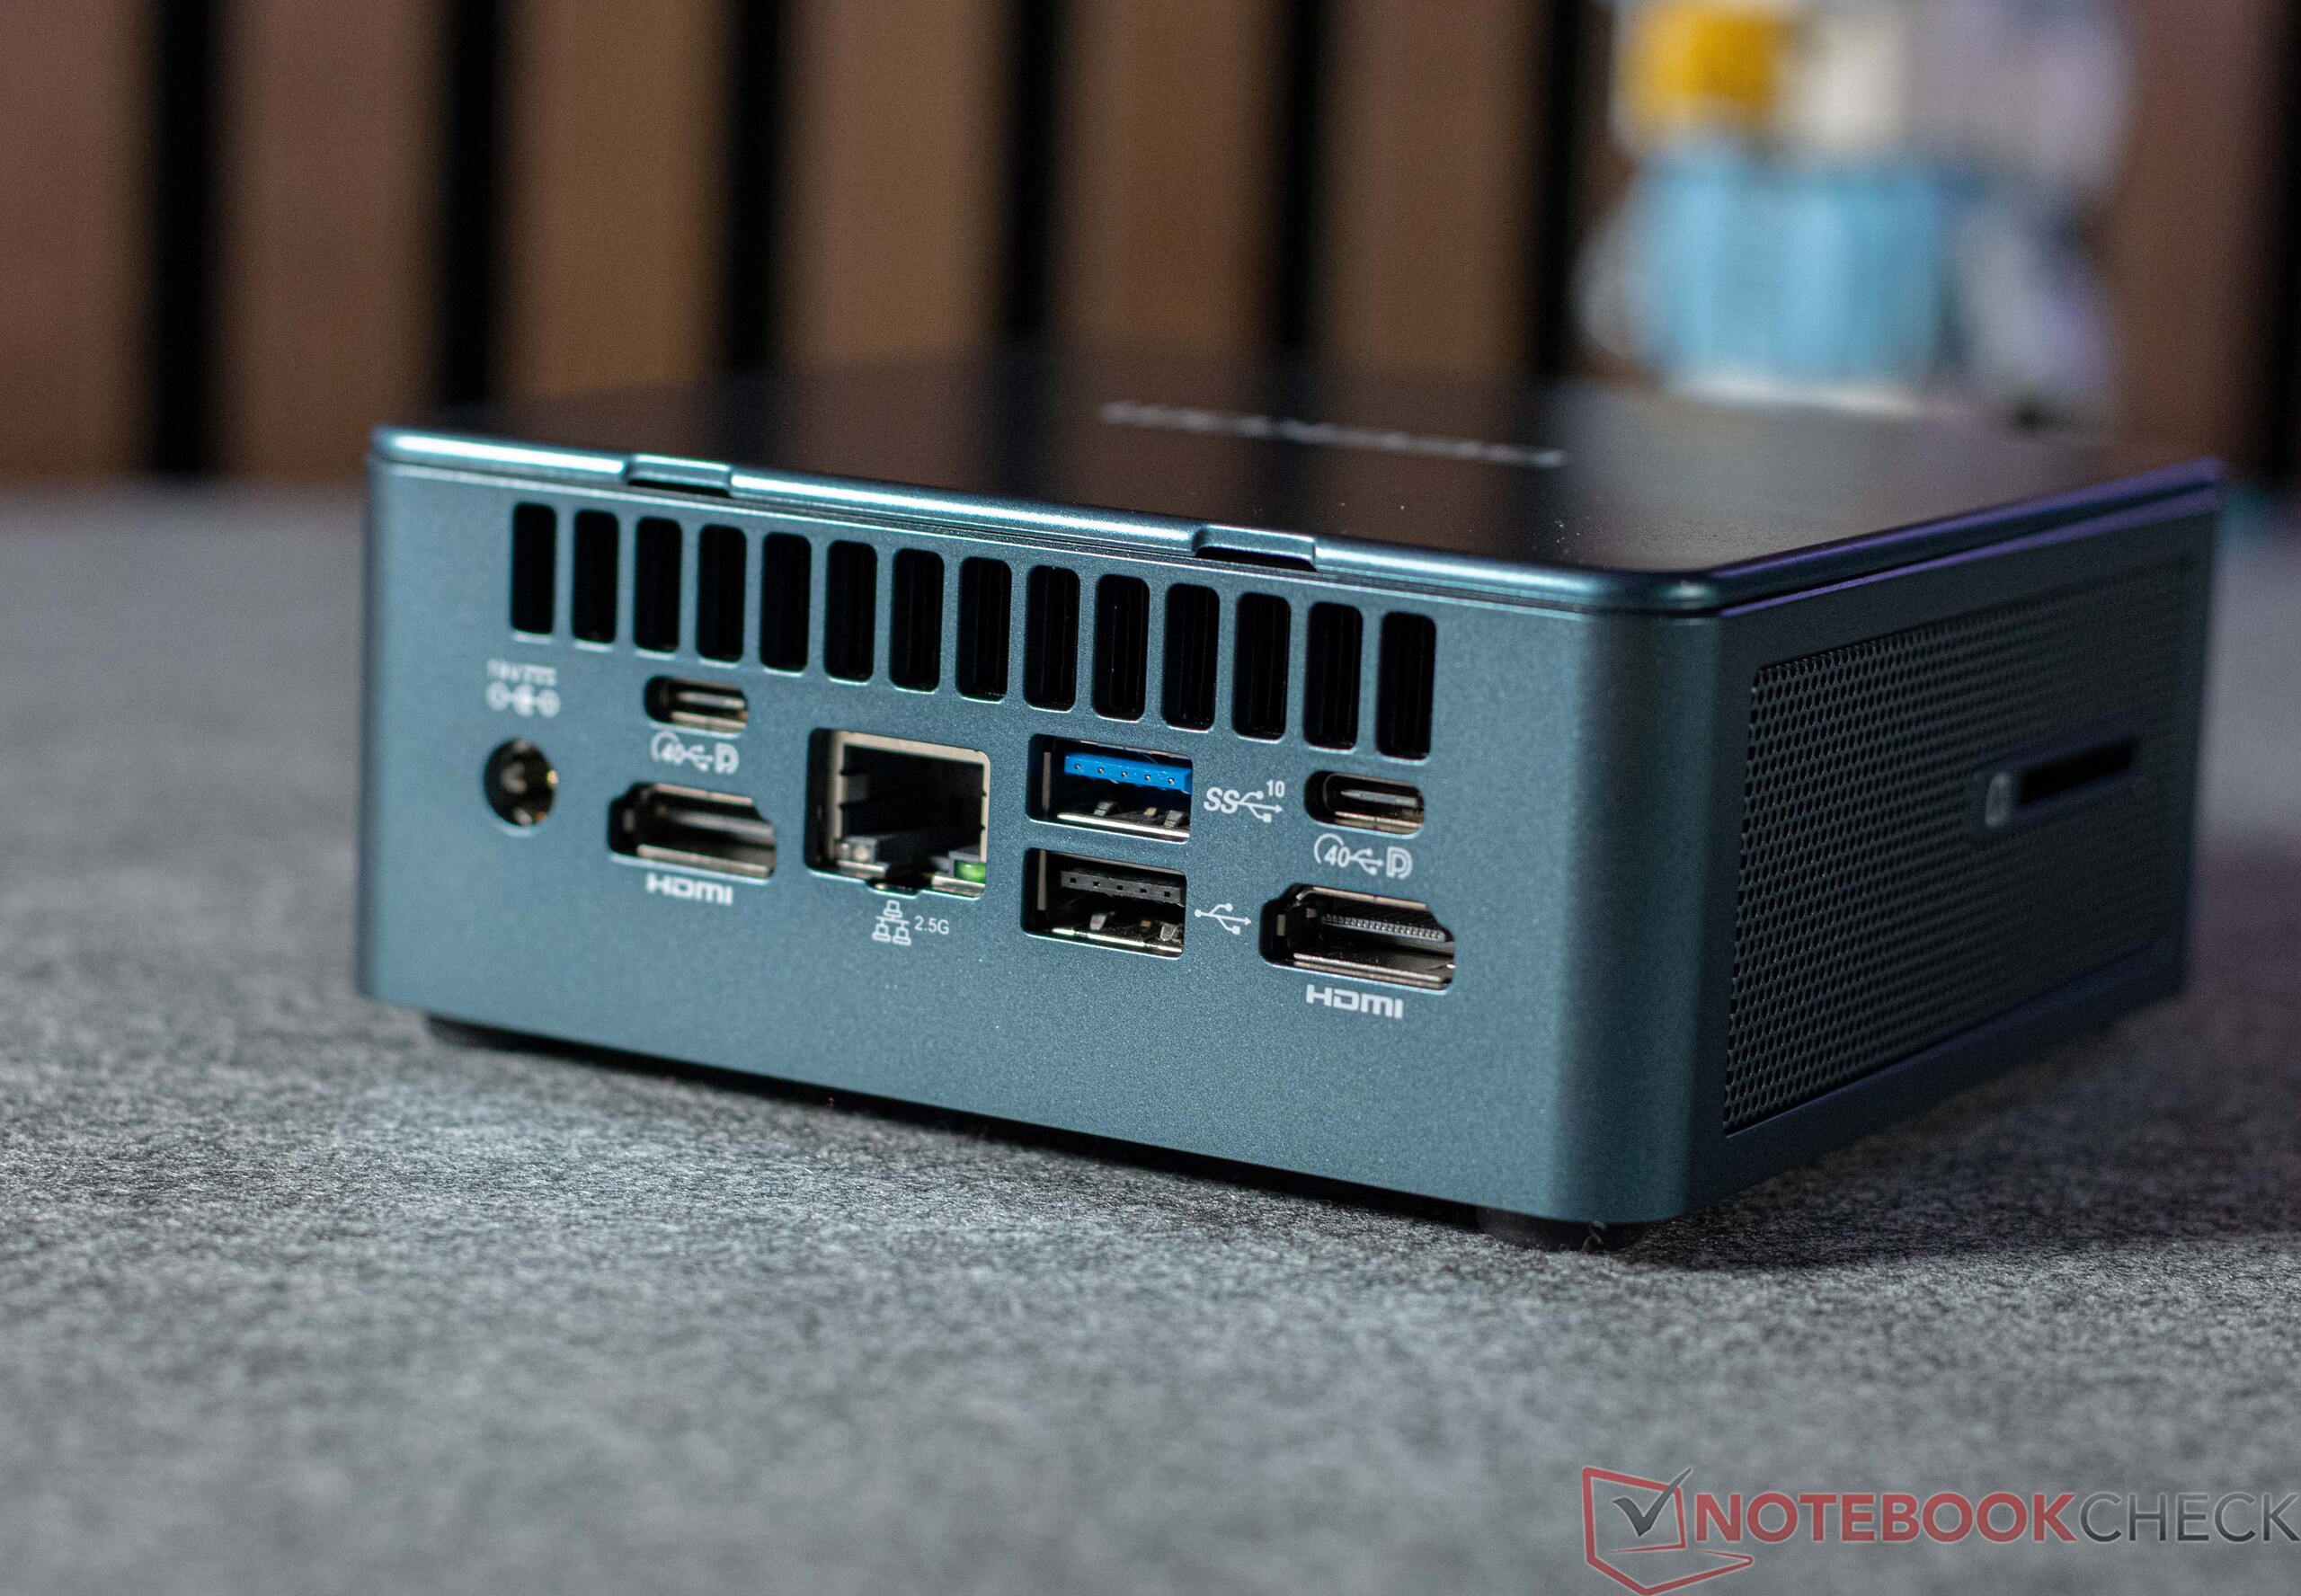
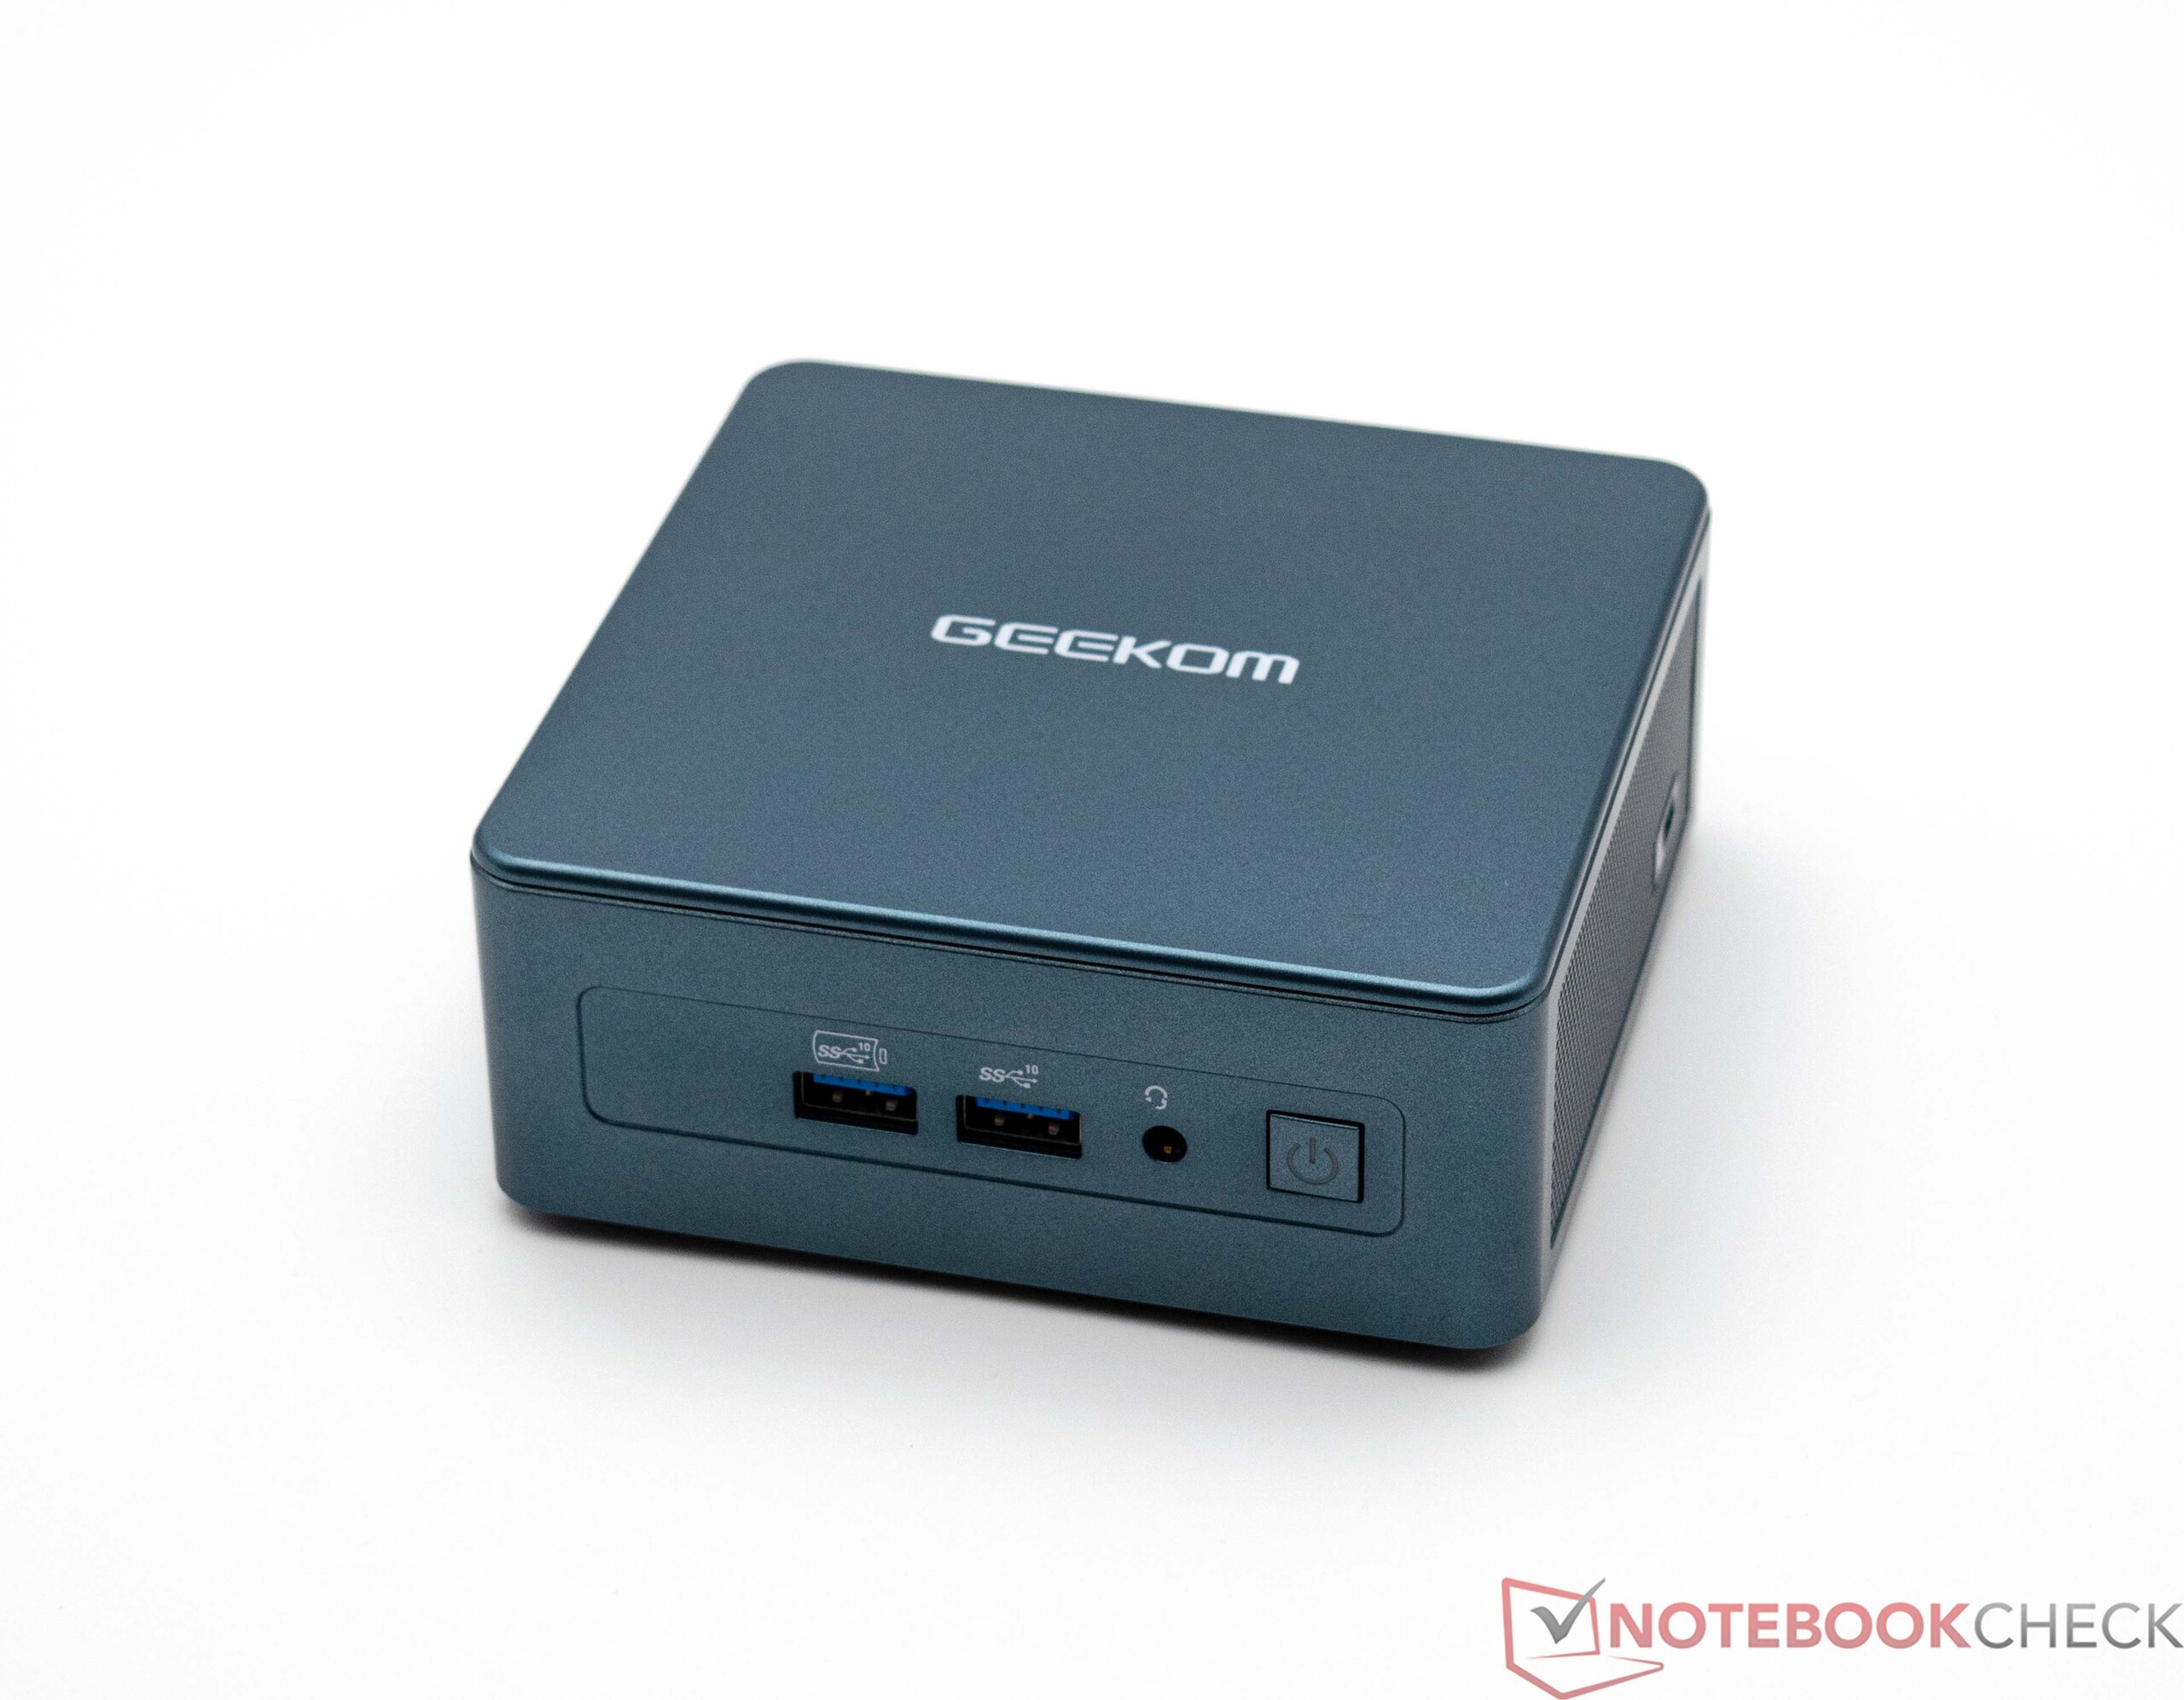
Ausstattung
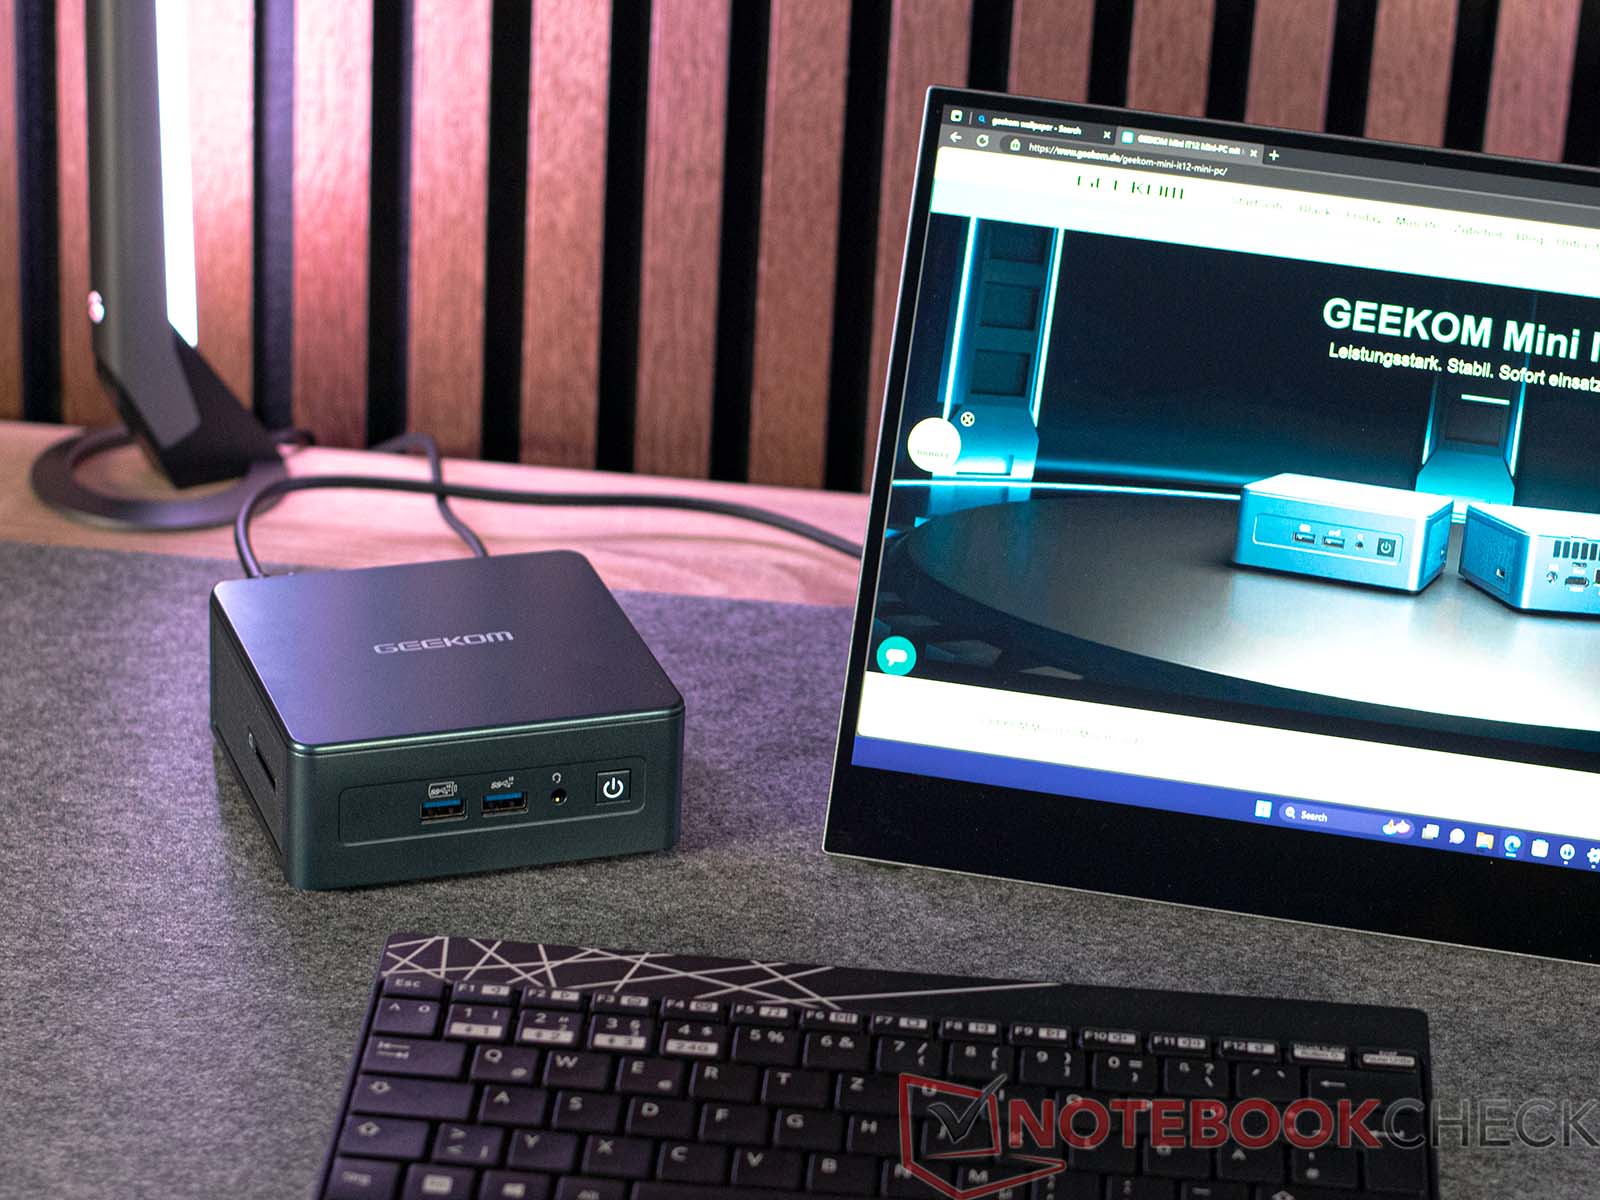
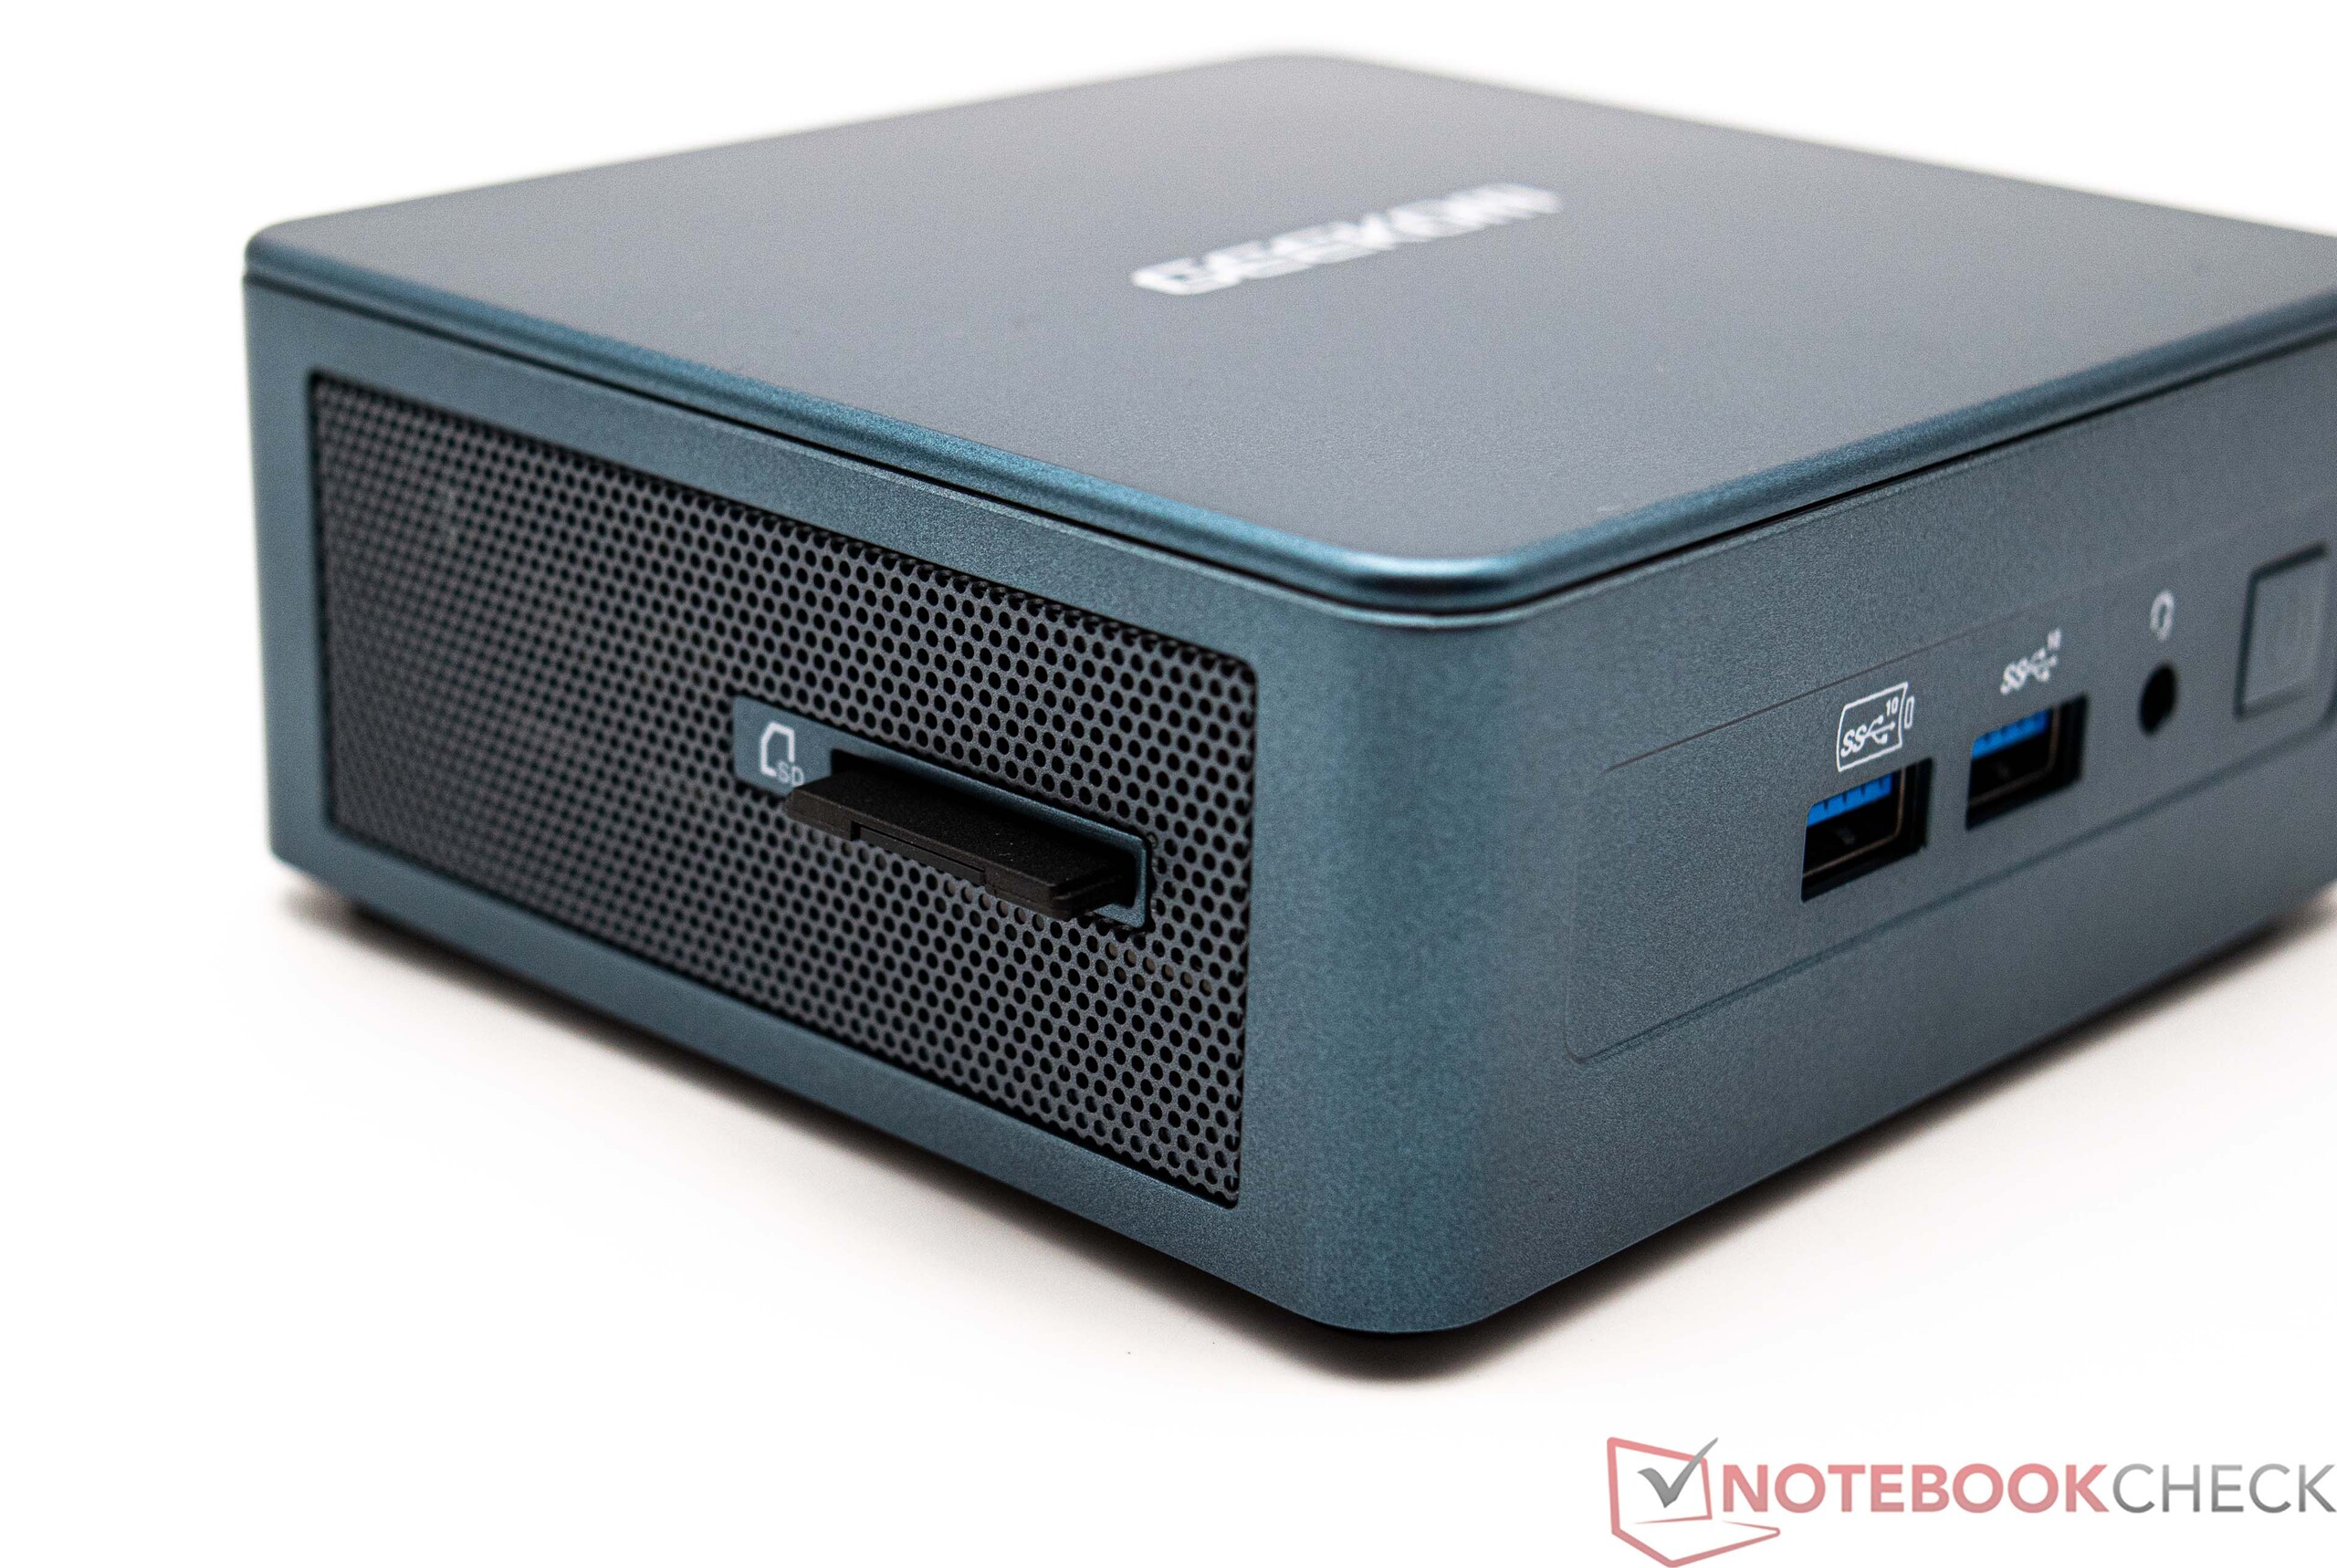
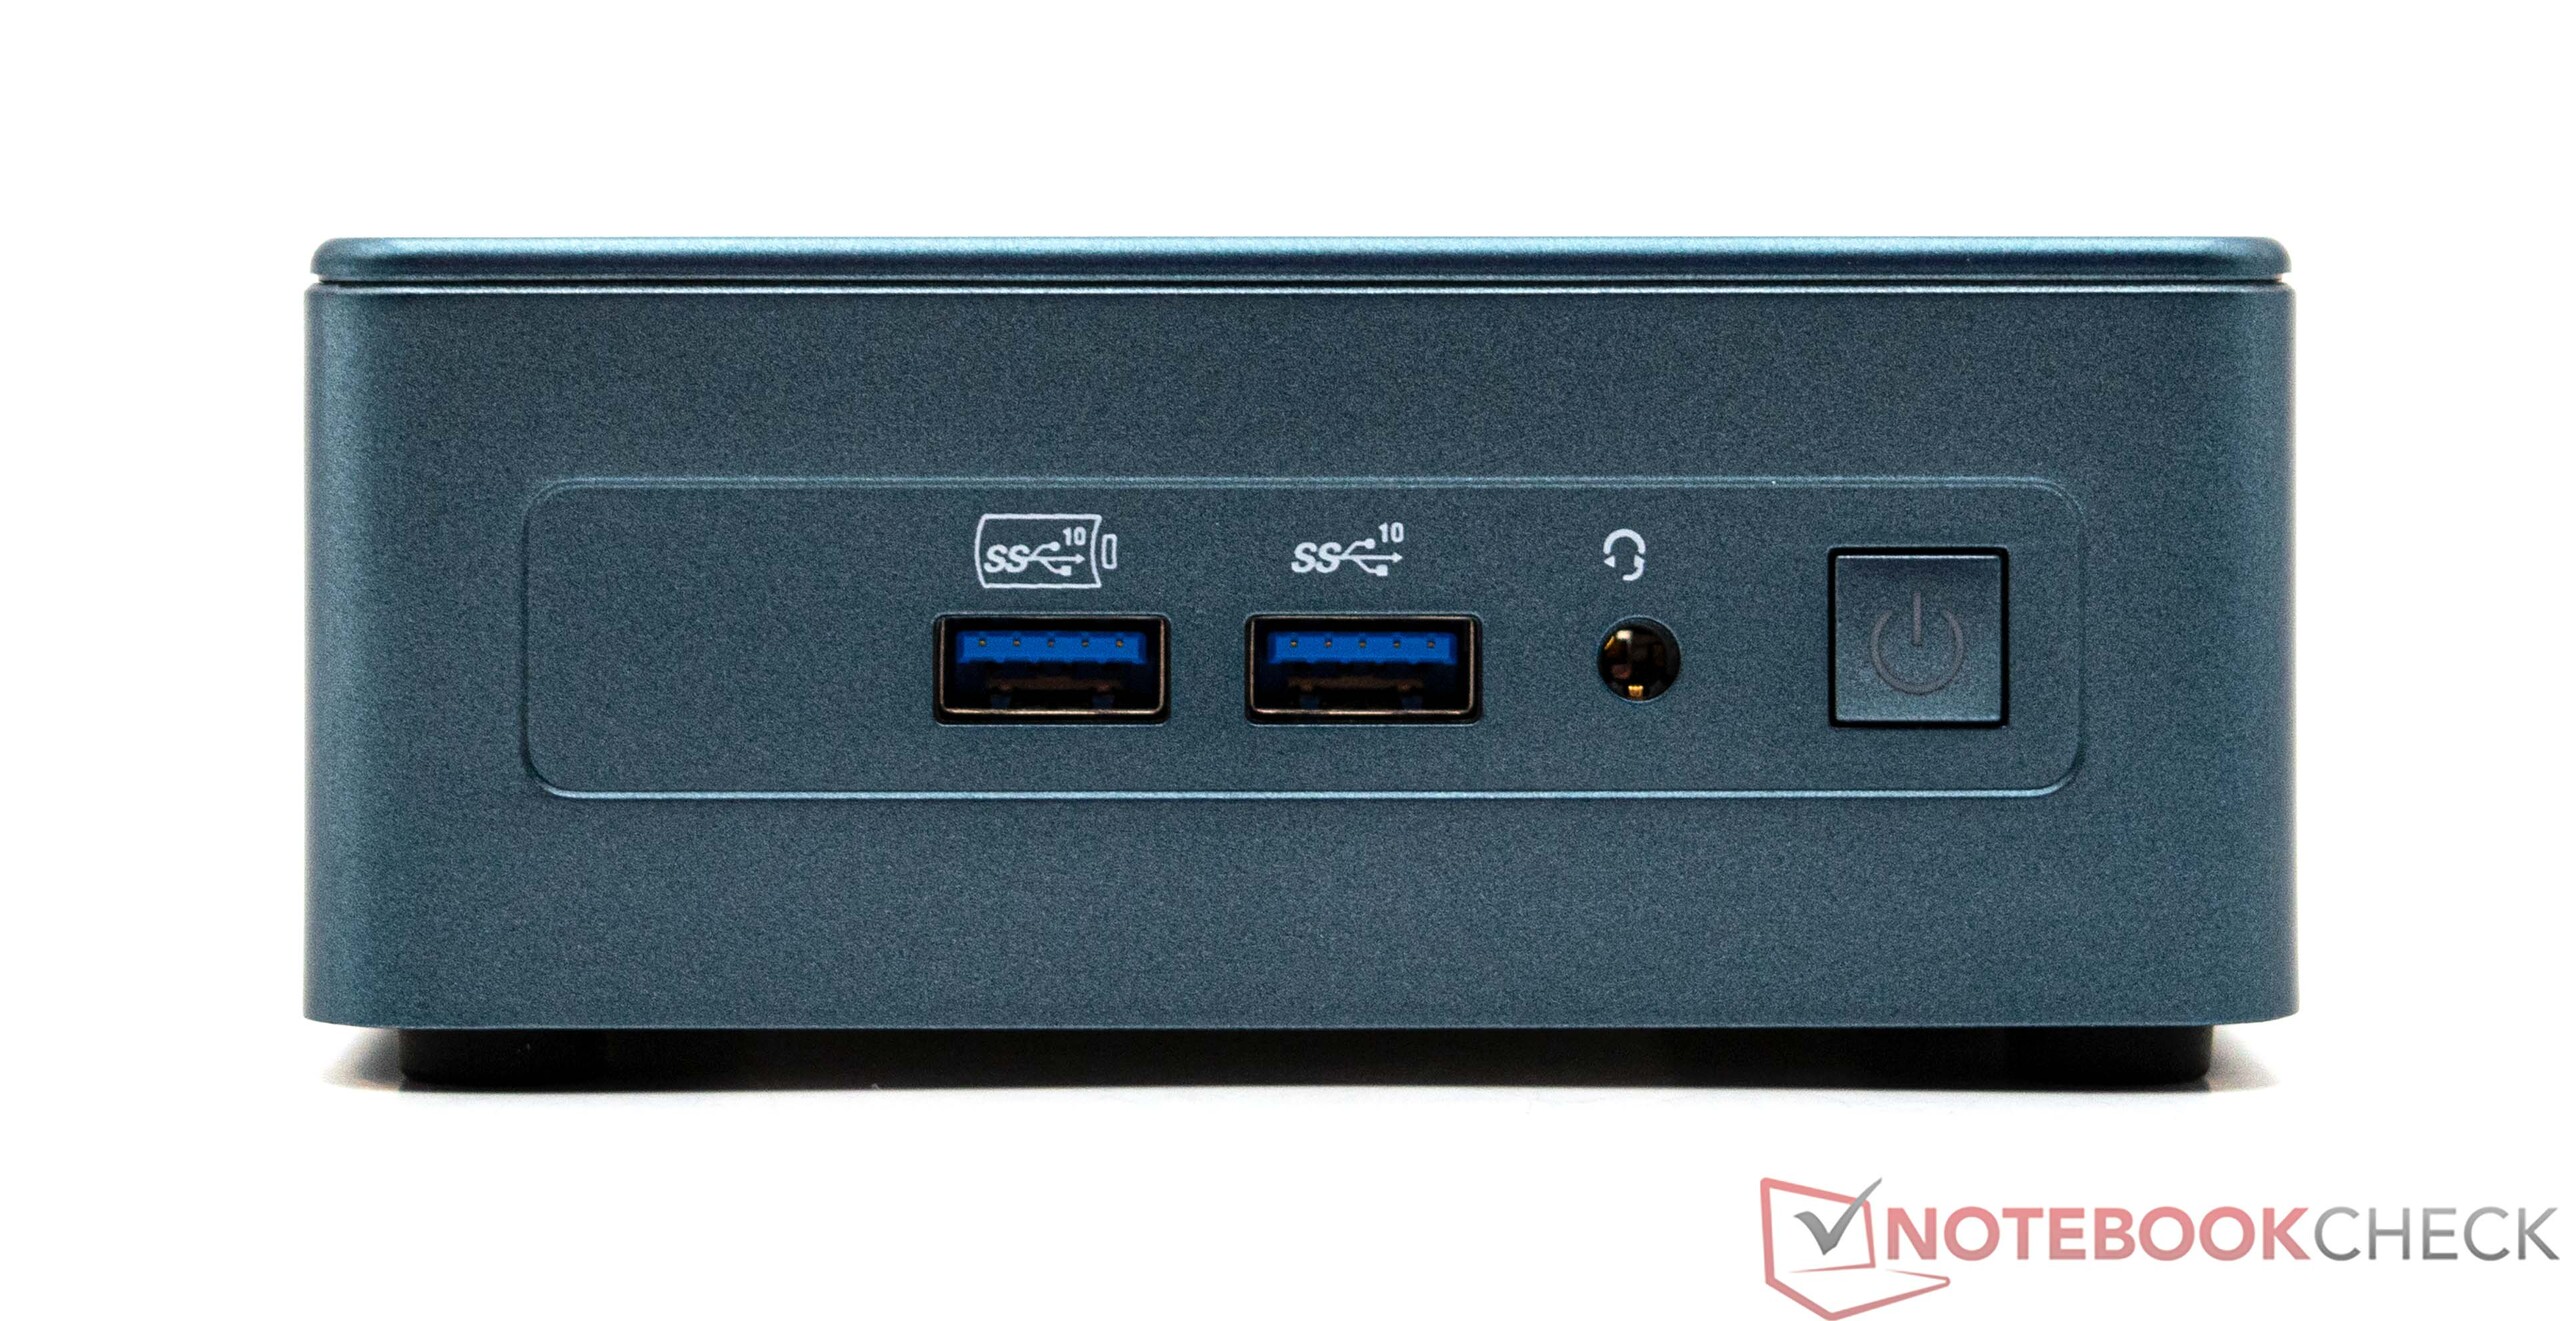
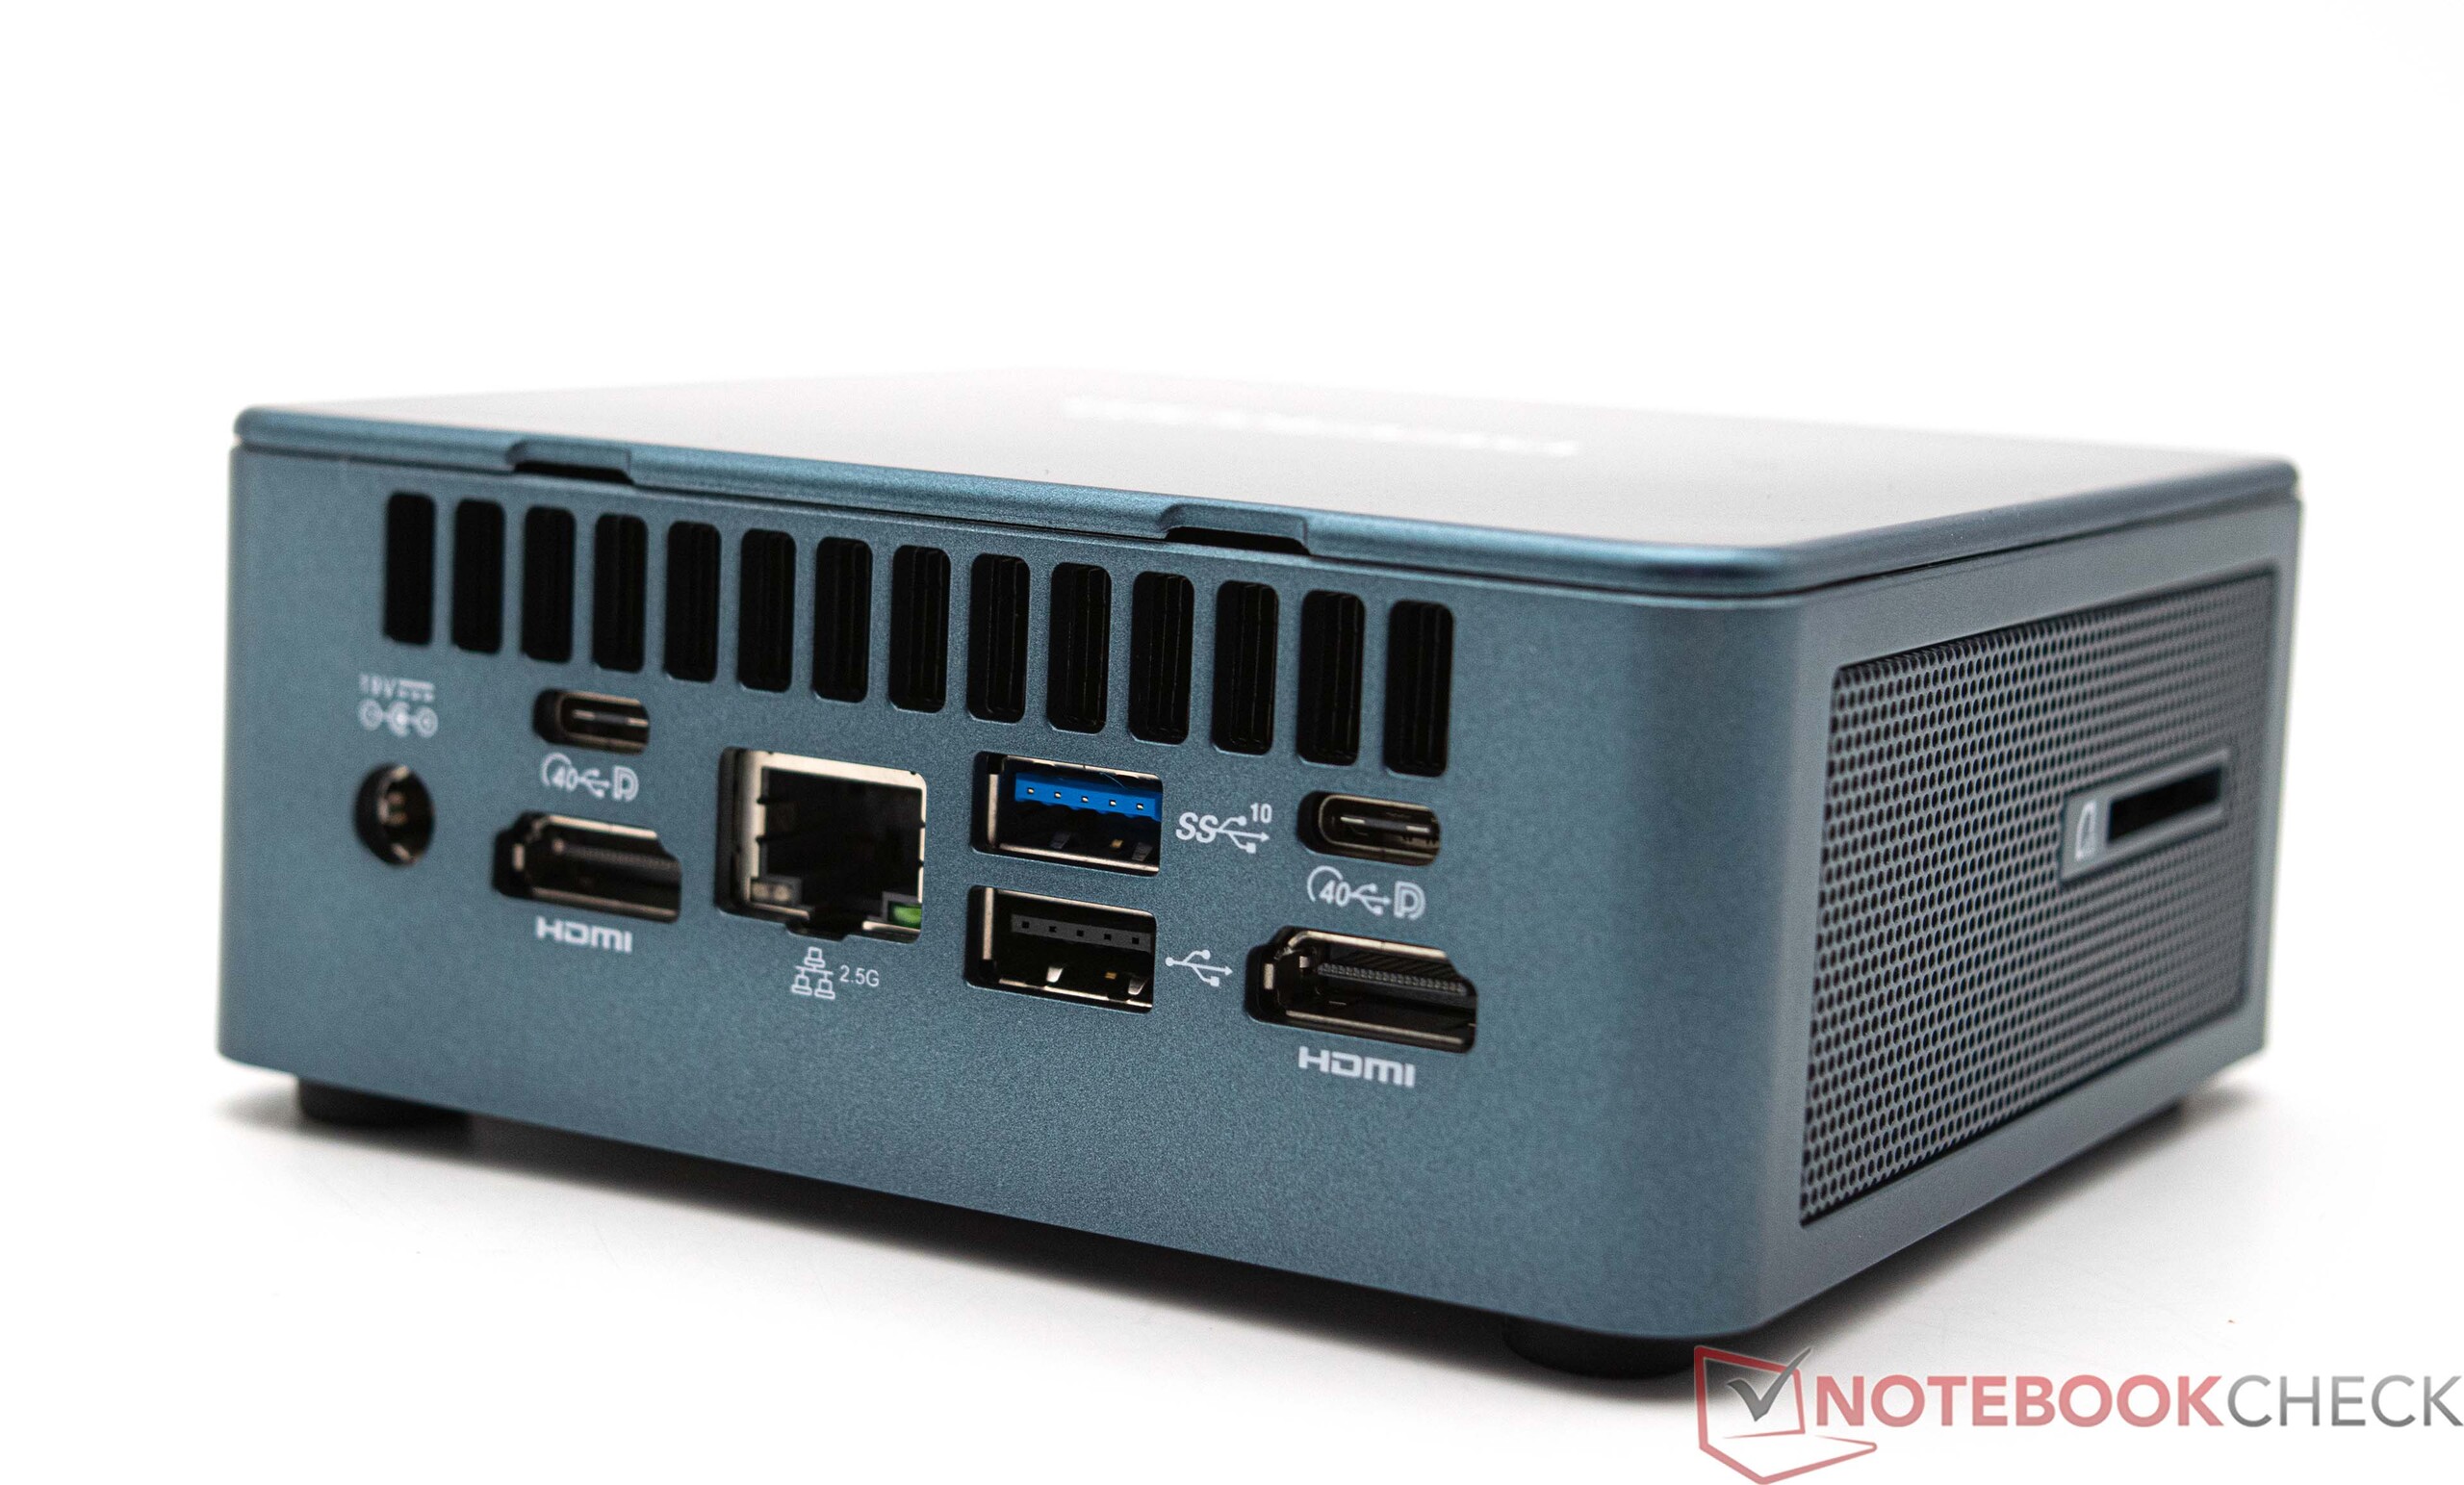
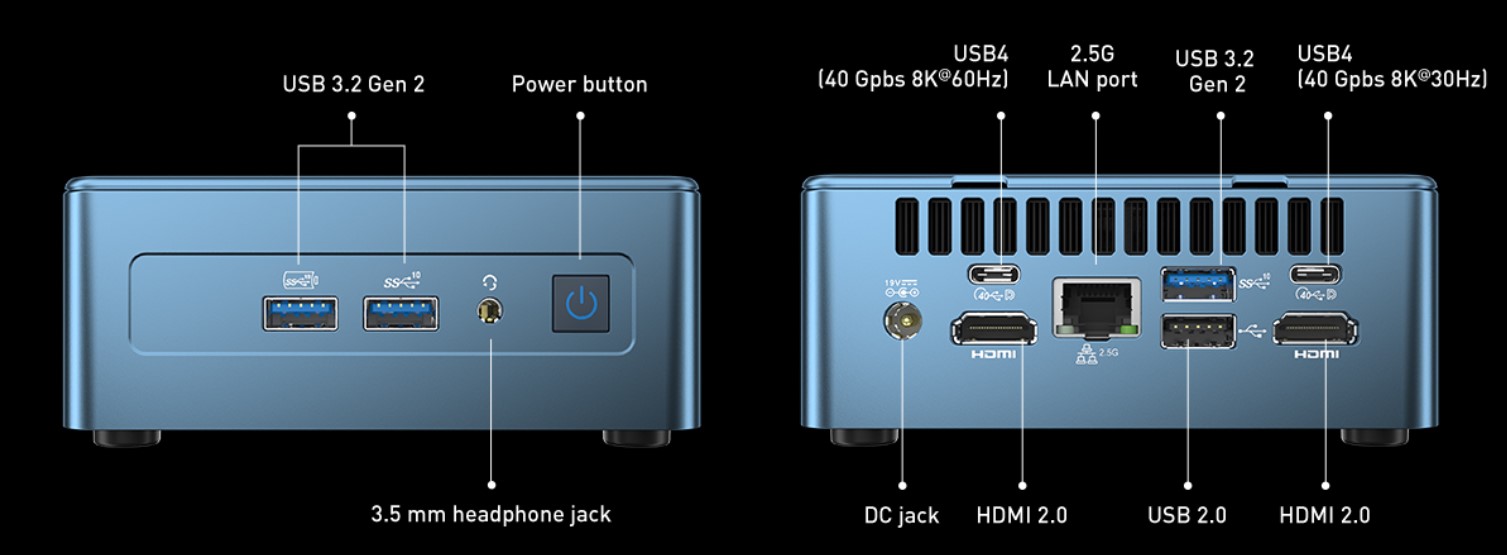
Anschlussseitig bietet der Geekom Mini IT12 viele Möglichkeiten, um externe Geräte anzuschließen. Unter anderem lassen sich bis zu vier Bildschirme gleichzeitig betreiben, was nicht zum Standard von Mini-PCs gehört. Vier Typ-A-USB-Anschlüsse sind ausreichend und gut auf Vorder- und Rückseite verteilt. Auf der Rückseite befinden sich zwei USB-4-Ports, womit zum Beispiel dedizierte Grafikkarten angeschlossen werden können. Hier gibt es viel Zubehör von Drittherstellern, welche per USB 4 die Einsatzmöglichkeiten des Geekom Mini IT12 erweitern kann.
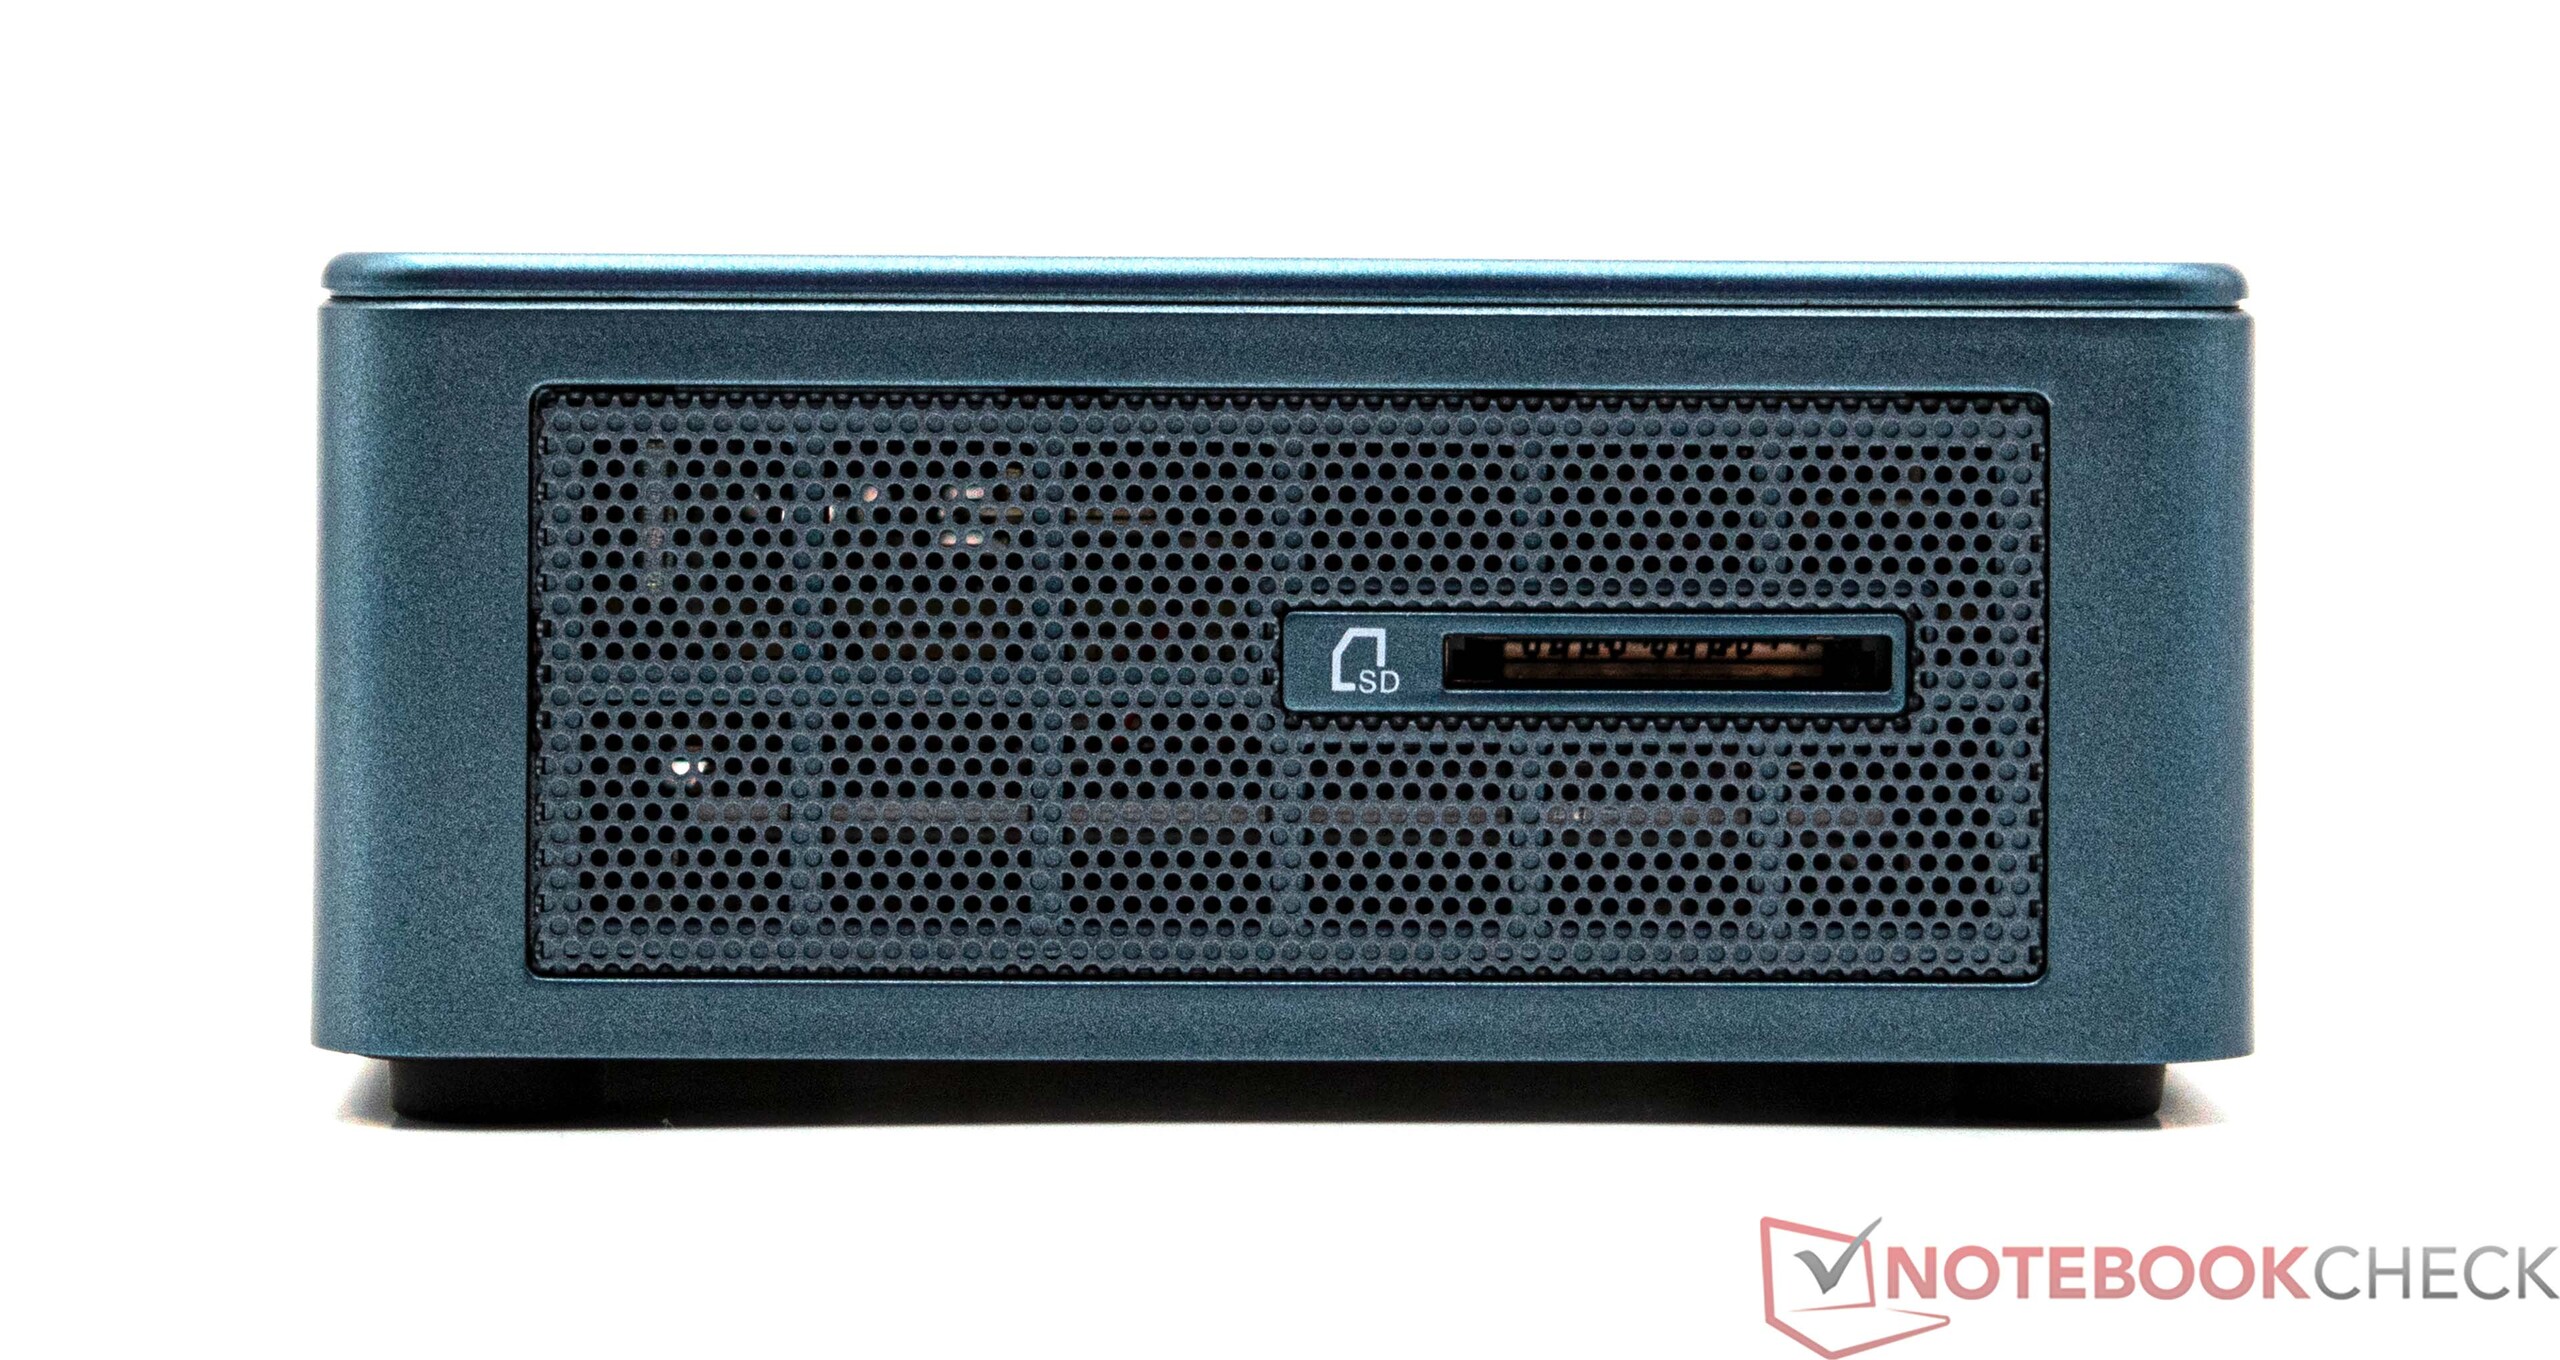
SD Kartenleser
Der Geekom Mini IT12 ist mit einem SD-Kartenleser ausgestattet, welcher eine hervorragende Leistung liefern kann. Zusammen mit unserer Referenzspeicherkarte (Angelbird SD Card AV PRO UHS-II 128GB V60) erreichen wir Transferraten von weit über 100 MB/s. Voraussetzung ist hier eine Speicherkarte, welche UHS-II Support bietet, um die Leistung auch komplett abrufen zu können.
| SD Card Reader | |
| average JPG Copy Test (av. of 3 runs) | |
| Intel Beast Canyon NUC (AV Pro SD microSD 128 GB V60) | |
| Intel Dragon Canyon NUC | |
| Geekom Mini IT12 (AV Pro SD microSD 128 GB V60) | |
| Geekom Mini IT12 (AV Pro SD microSD 128 GB V60) | |
| Durchschnitt der Klasse Mini PC (17.3 - 214, n=23, der letzten 2 Jahre) | |
| Zotac ZBOX Magnus EN173070C (AV Pro SD microSD 128 GB V60) | |
| Geekom MiniAir 11 Special Edition (AV Pro SD microSD 128 GB V60) | |
| maximum AS SSD Seq Read Test (1GB) | |
| Intel Beast Canyon NUC (AV Pro SD microSD 128 GB V60) | |
| Intel Dragon Canyon NUC | |
| Geekom Mini IT12 (AV Pro SD microSD 128 GB V60) | |
| Geekom Mini IT12 (AV Pro SD microSD 128 GB V60) | |
| Durchschnitt der Klasse Mini PC (17.9 - 250, n=23, der letzten 2 Jahre) | |
| Zotac ZBOX Magnus EN173070C (AV Pro SD microSD 128 GB V60) | |
| Geekom MiniAir 11 Special Edition (AV Pro SD microSD 128 GB V60) | |
Kommunikation
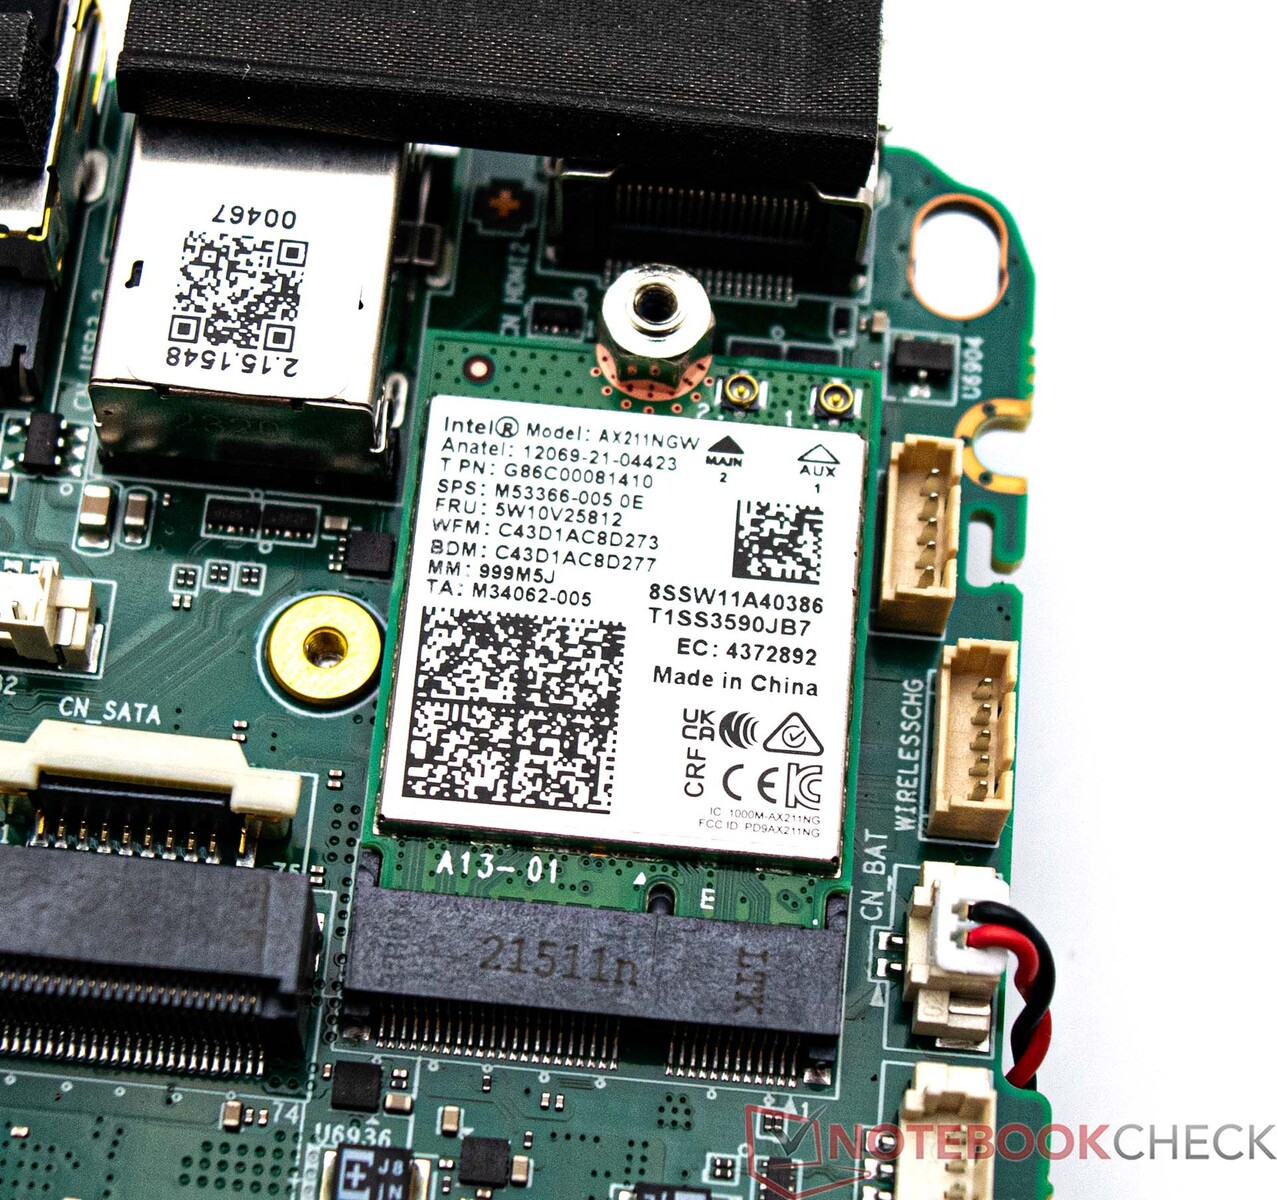
Geekom verbaut in dem Mini IT12 ein modernes Wi-Fi-6E-AX211-Modul von Intel. Dennoch ist die Leistung im Test nicht auf dem Niveau, welches wir erwartet haben. Die gemessenen Leistungen beim Senden und Empfangen von Daten sind sowohl im 5-GHz- als auch im 6-GHz-Band schlechter als bei den Kontrahenten mit gleichem WLAN-Modul. Für diesen Test kam unser Testrouter Asus ROG Rapture GT-AXE11000 zum Einsatz.
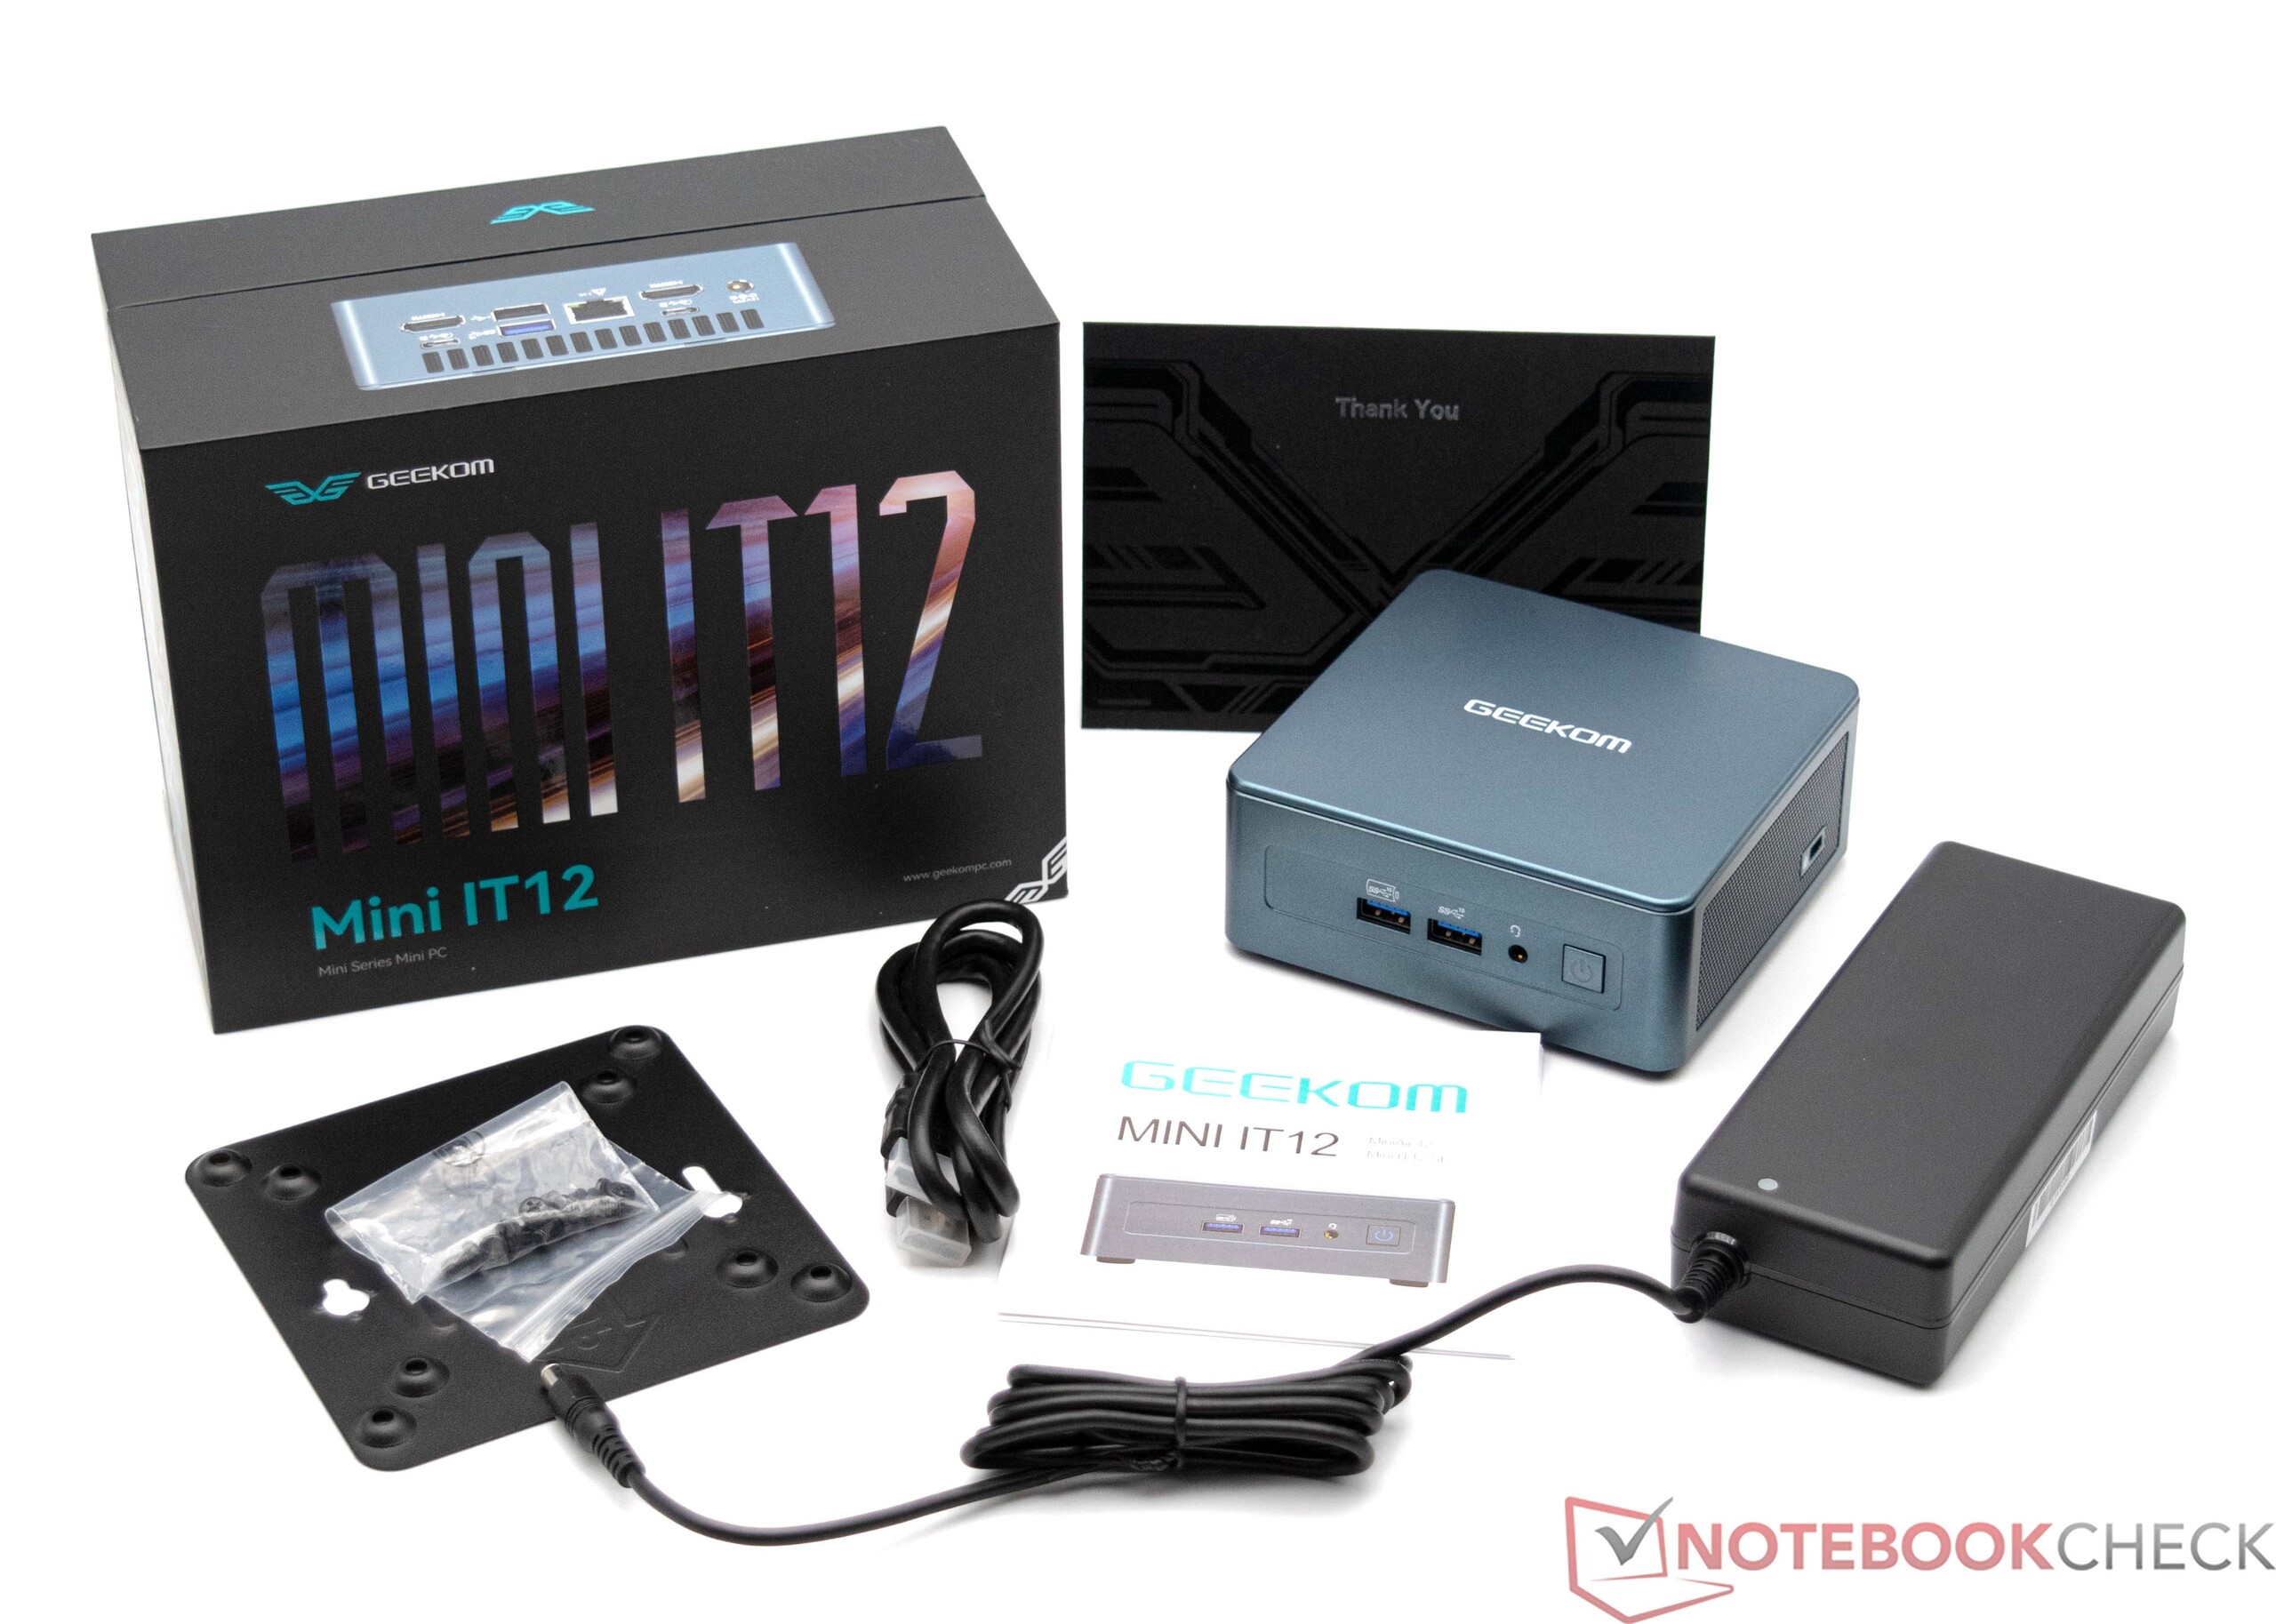
Zubehör
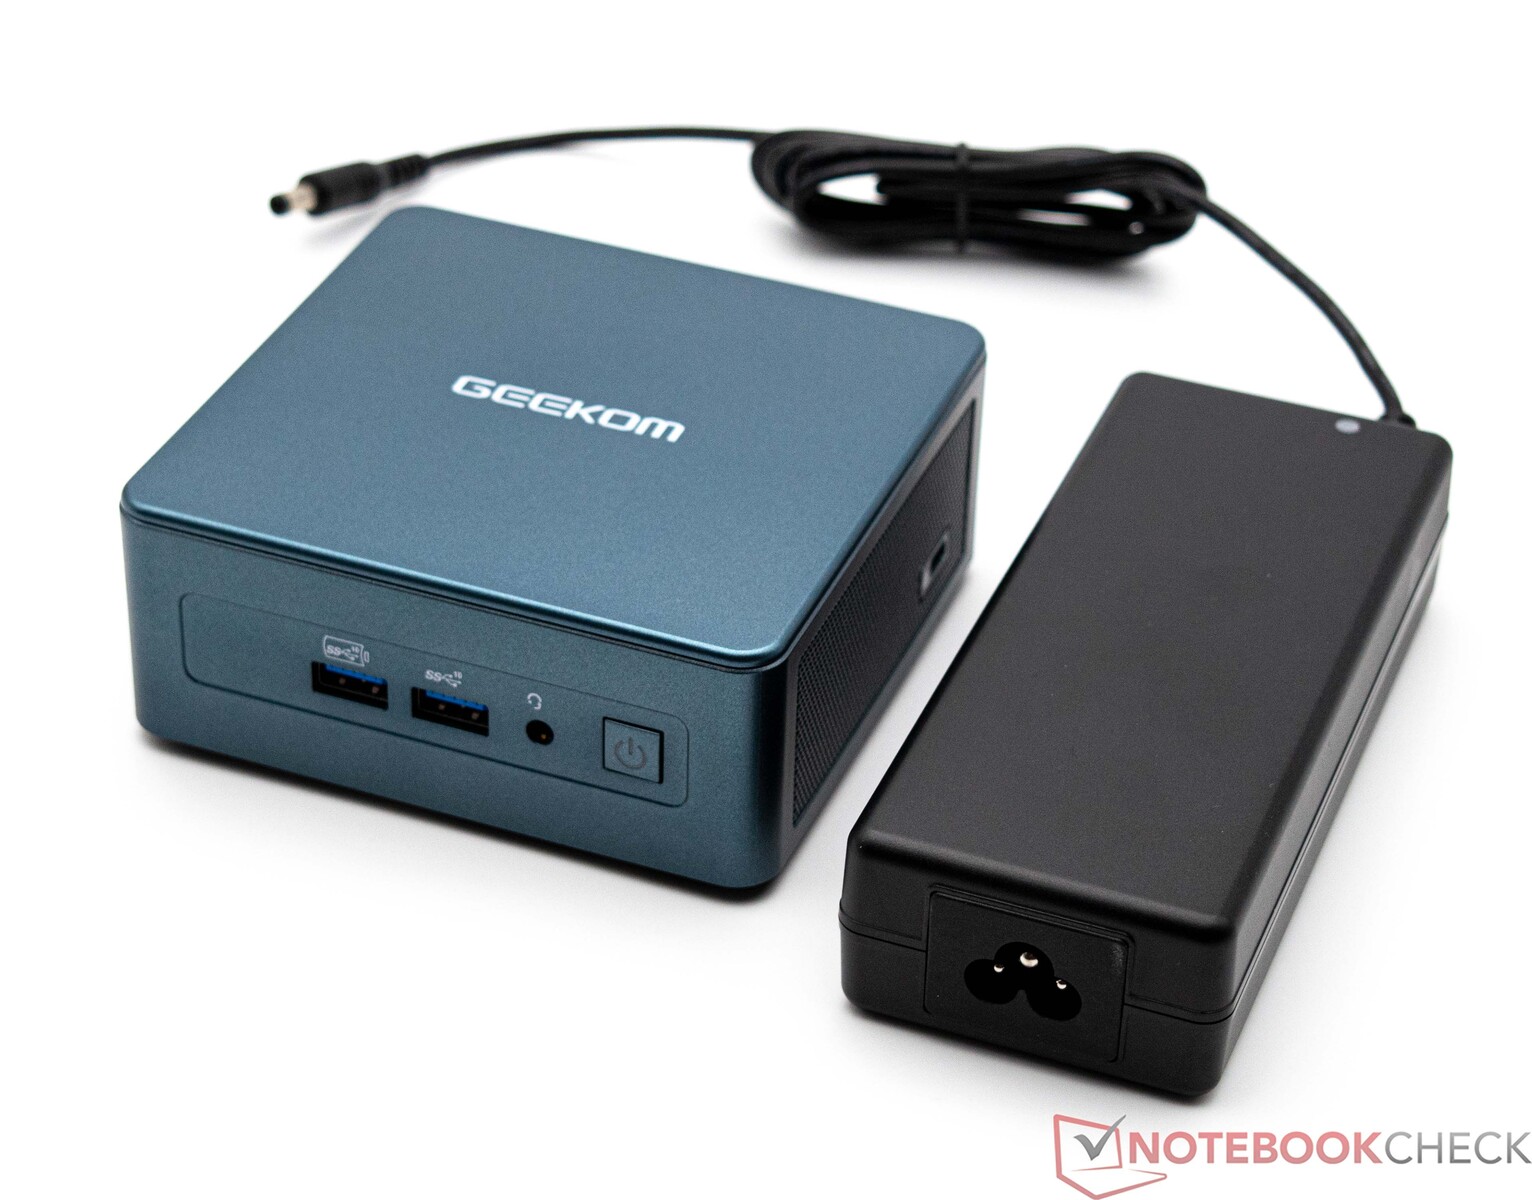
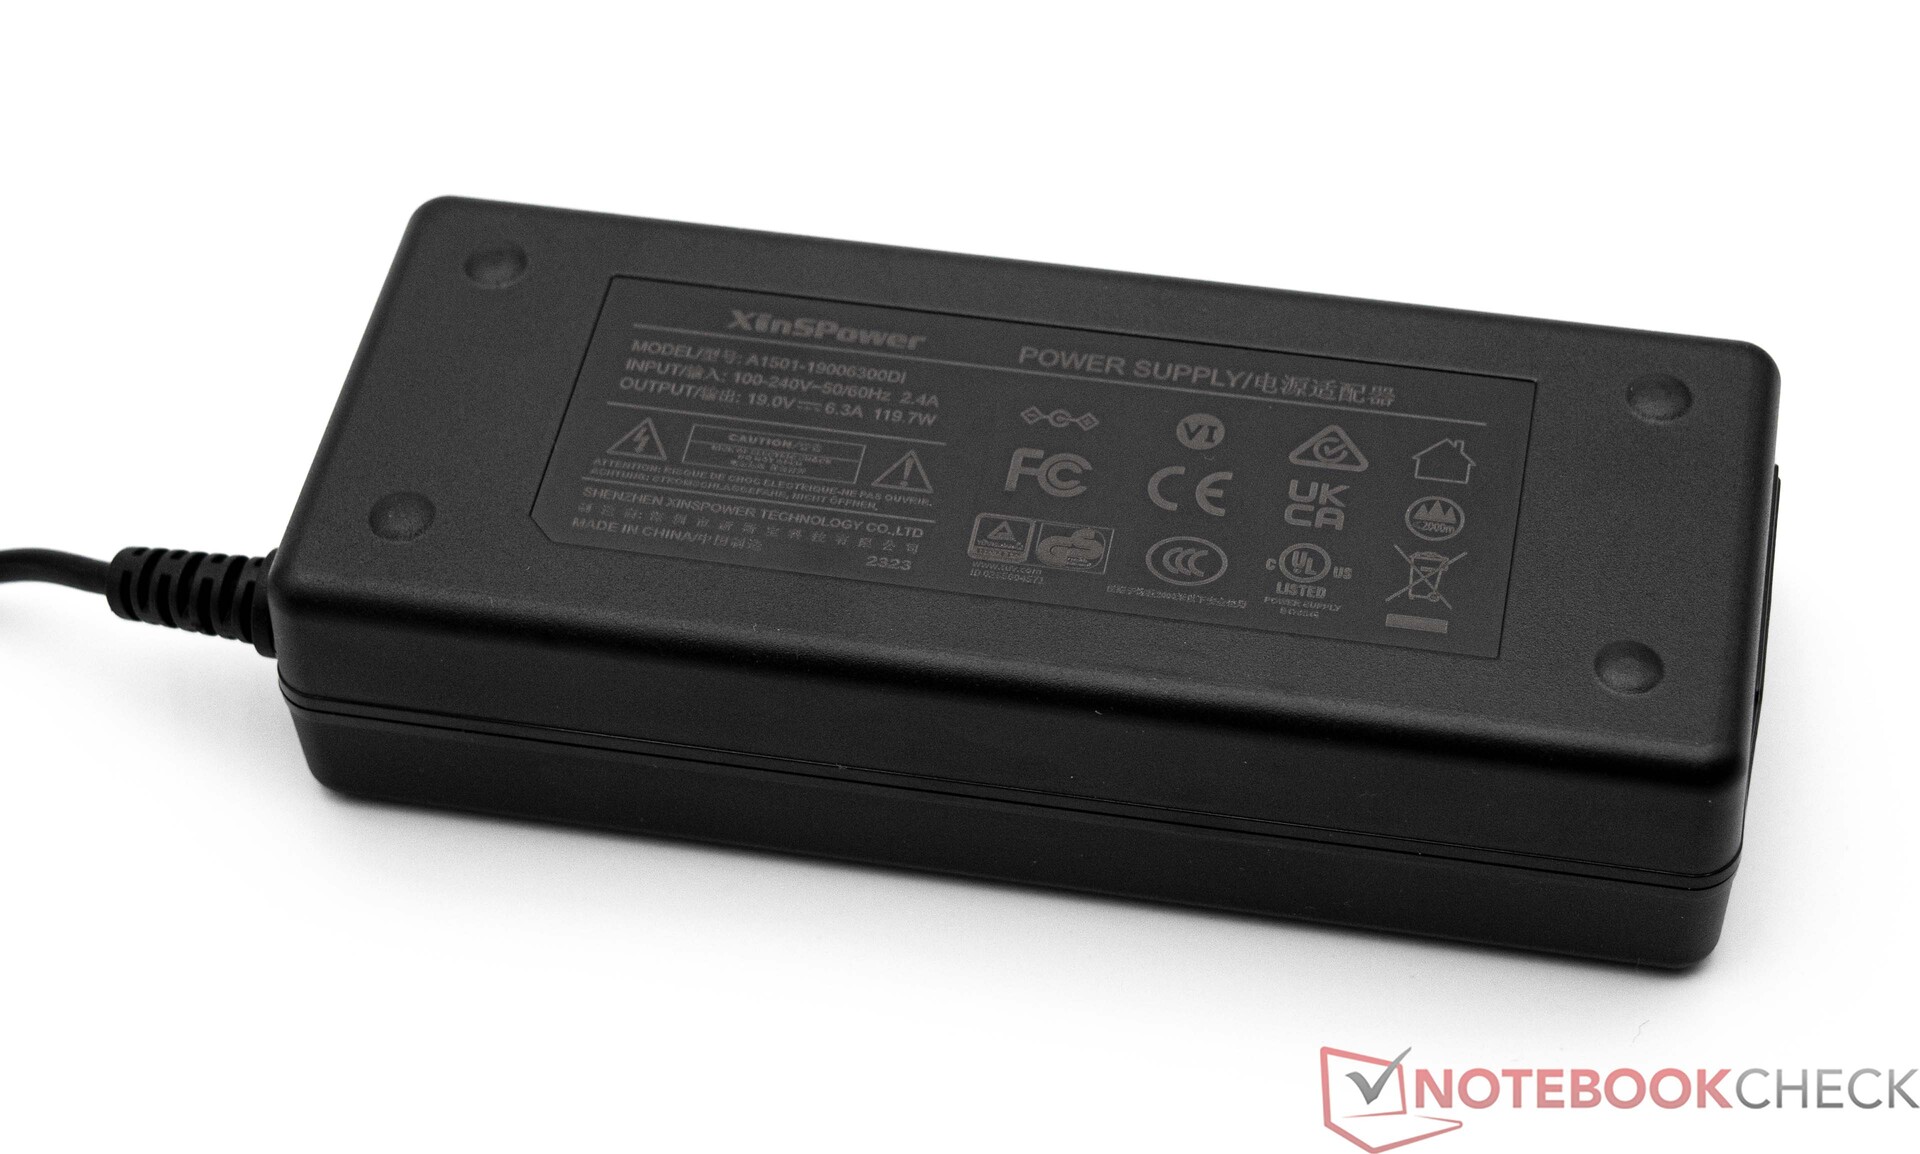
Im Lieferumfang finden wir nebst dem Gerät noch das 90-Watt-Netzteil sowie eine VESA-Halteplatte für die Montage an einen Monitor. Ein HDMI-Kabel sowie eine Kurzanleitung und eine Dankeskarte gehören ebenfalls dazu.
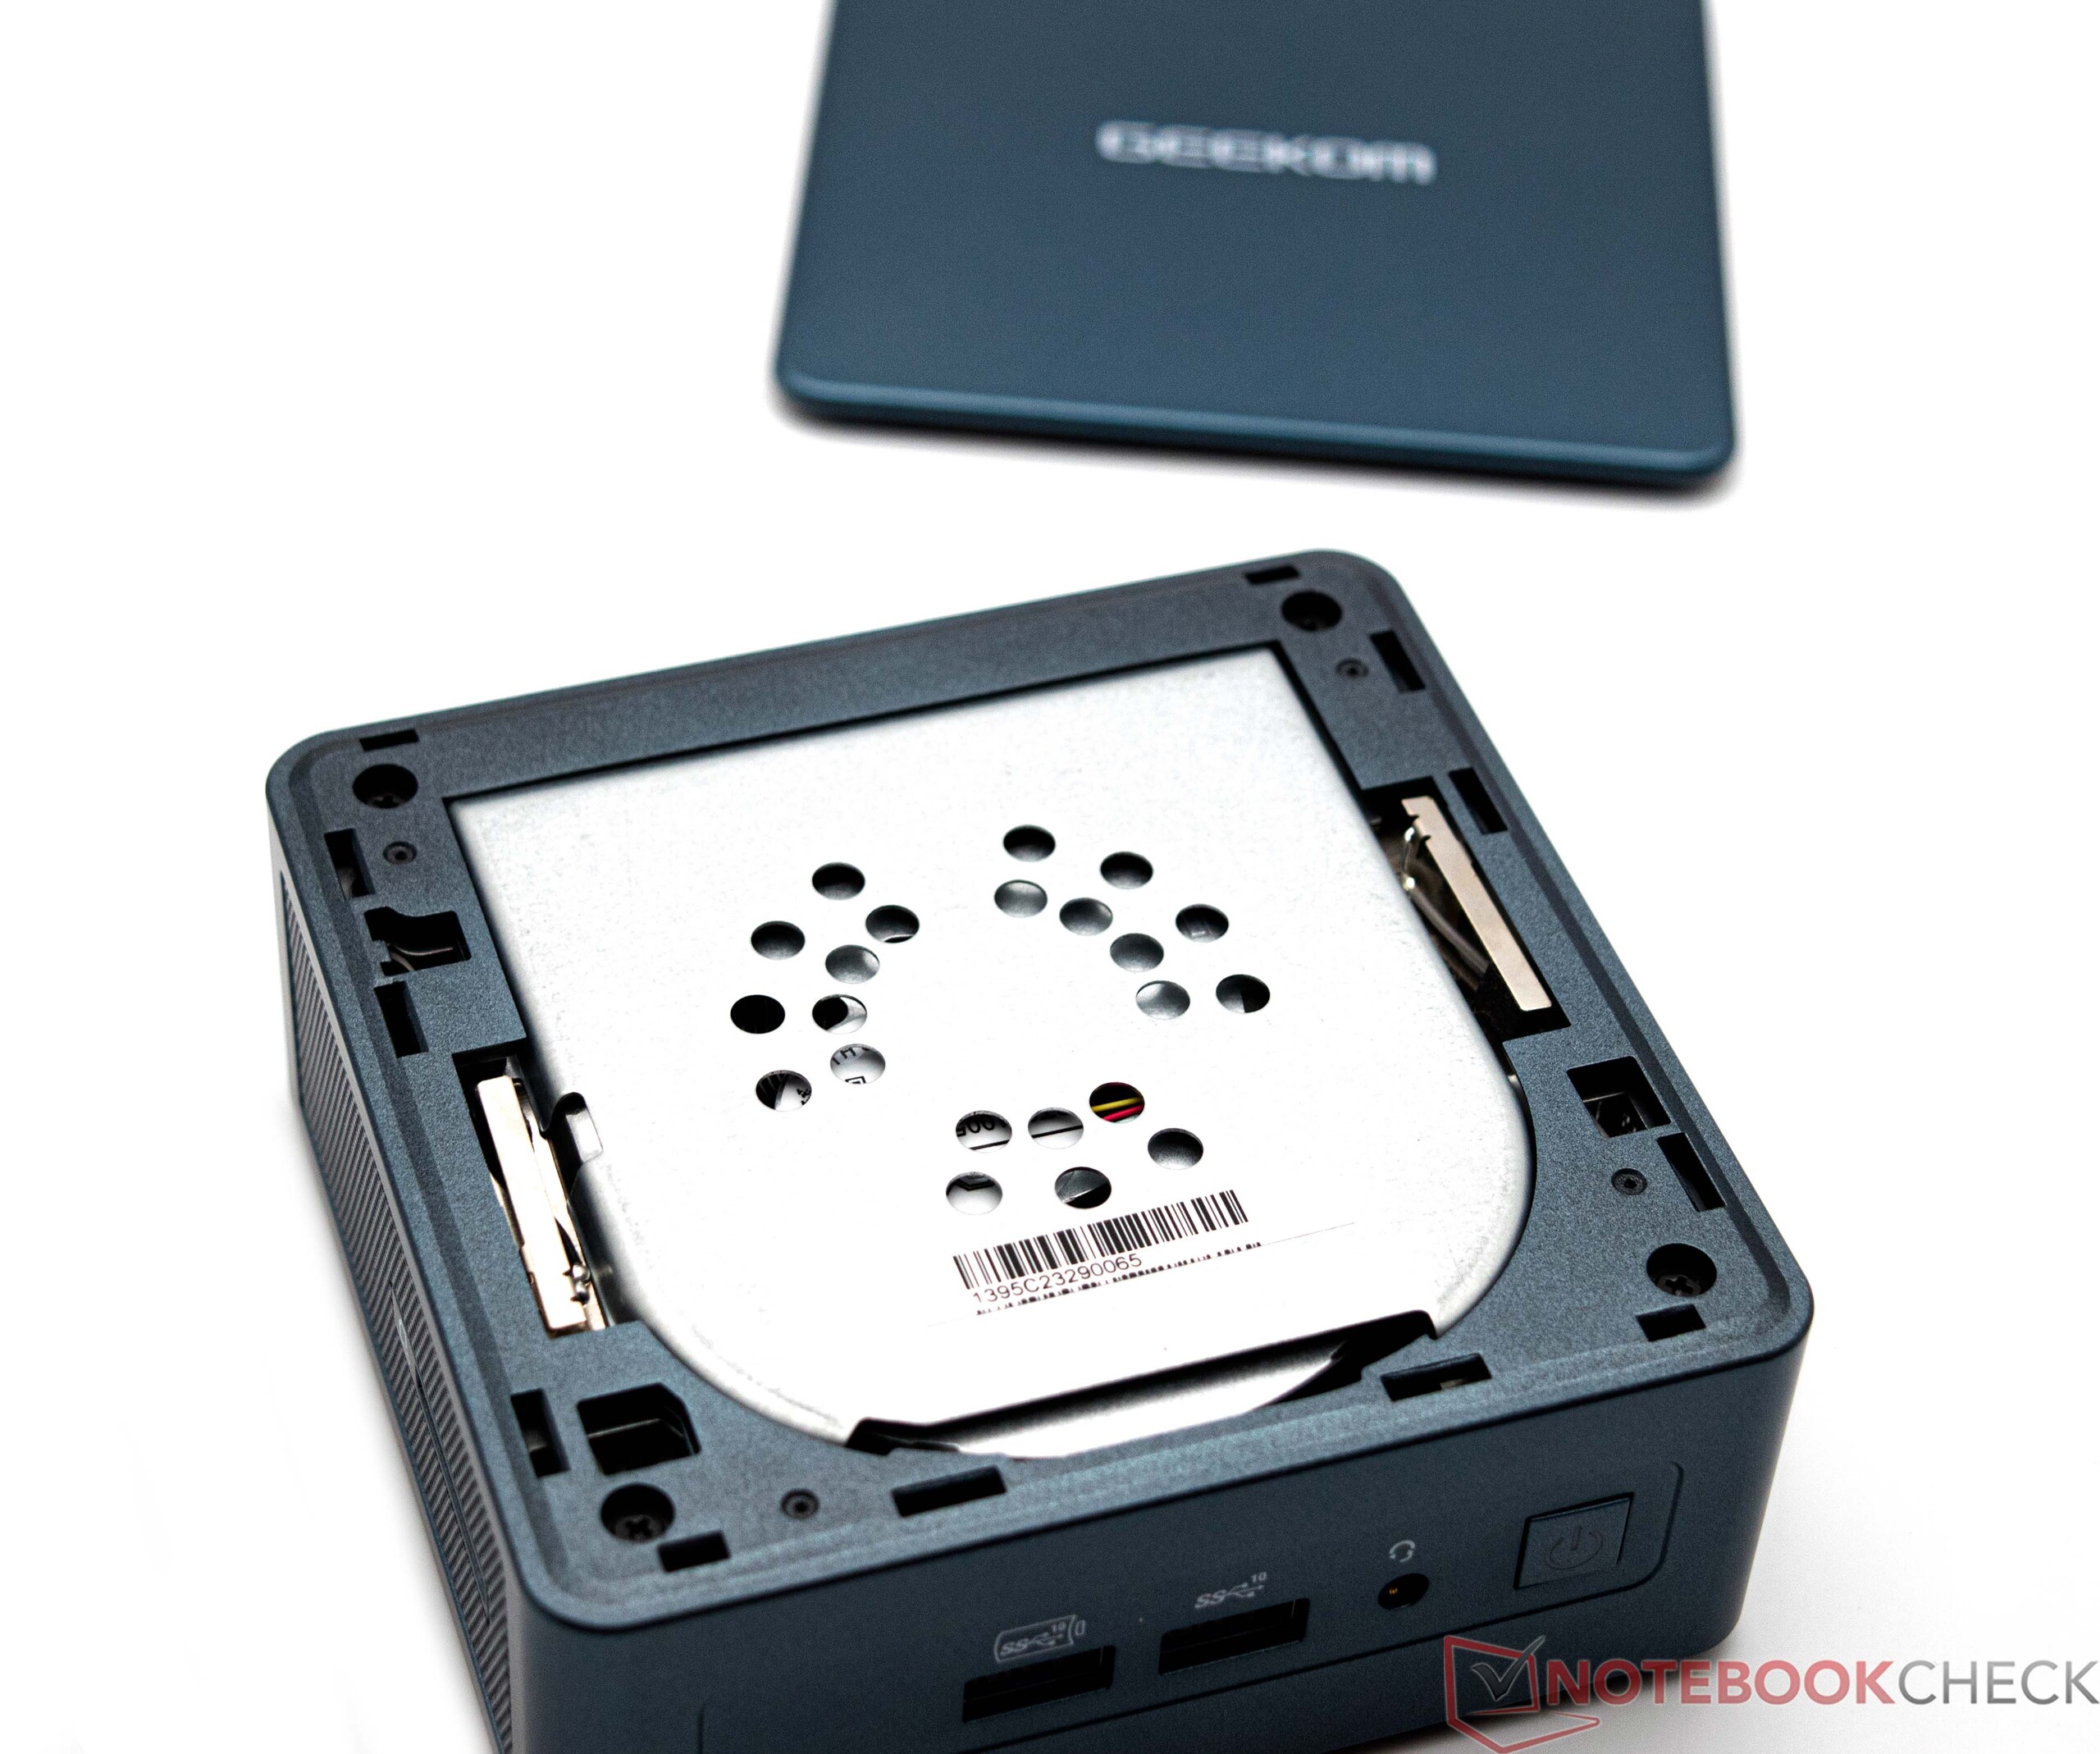
Wartung
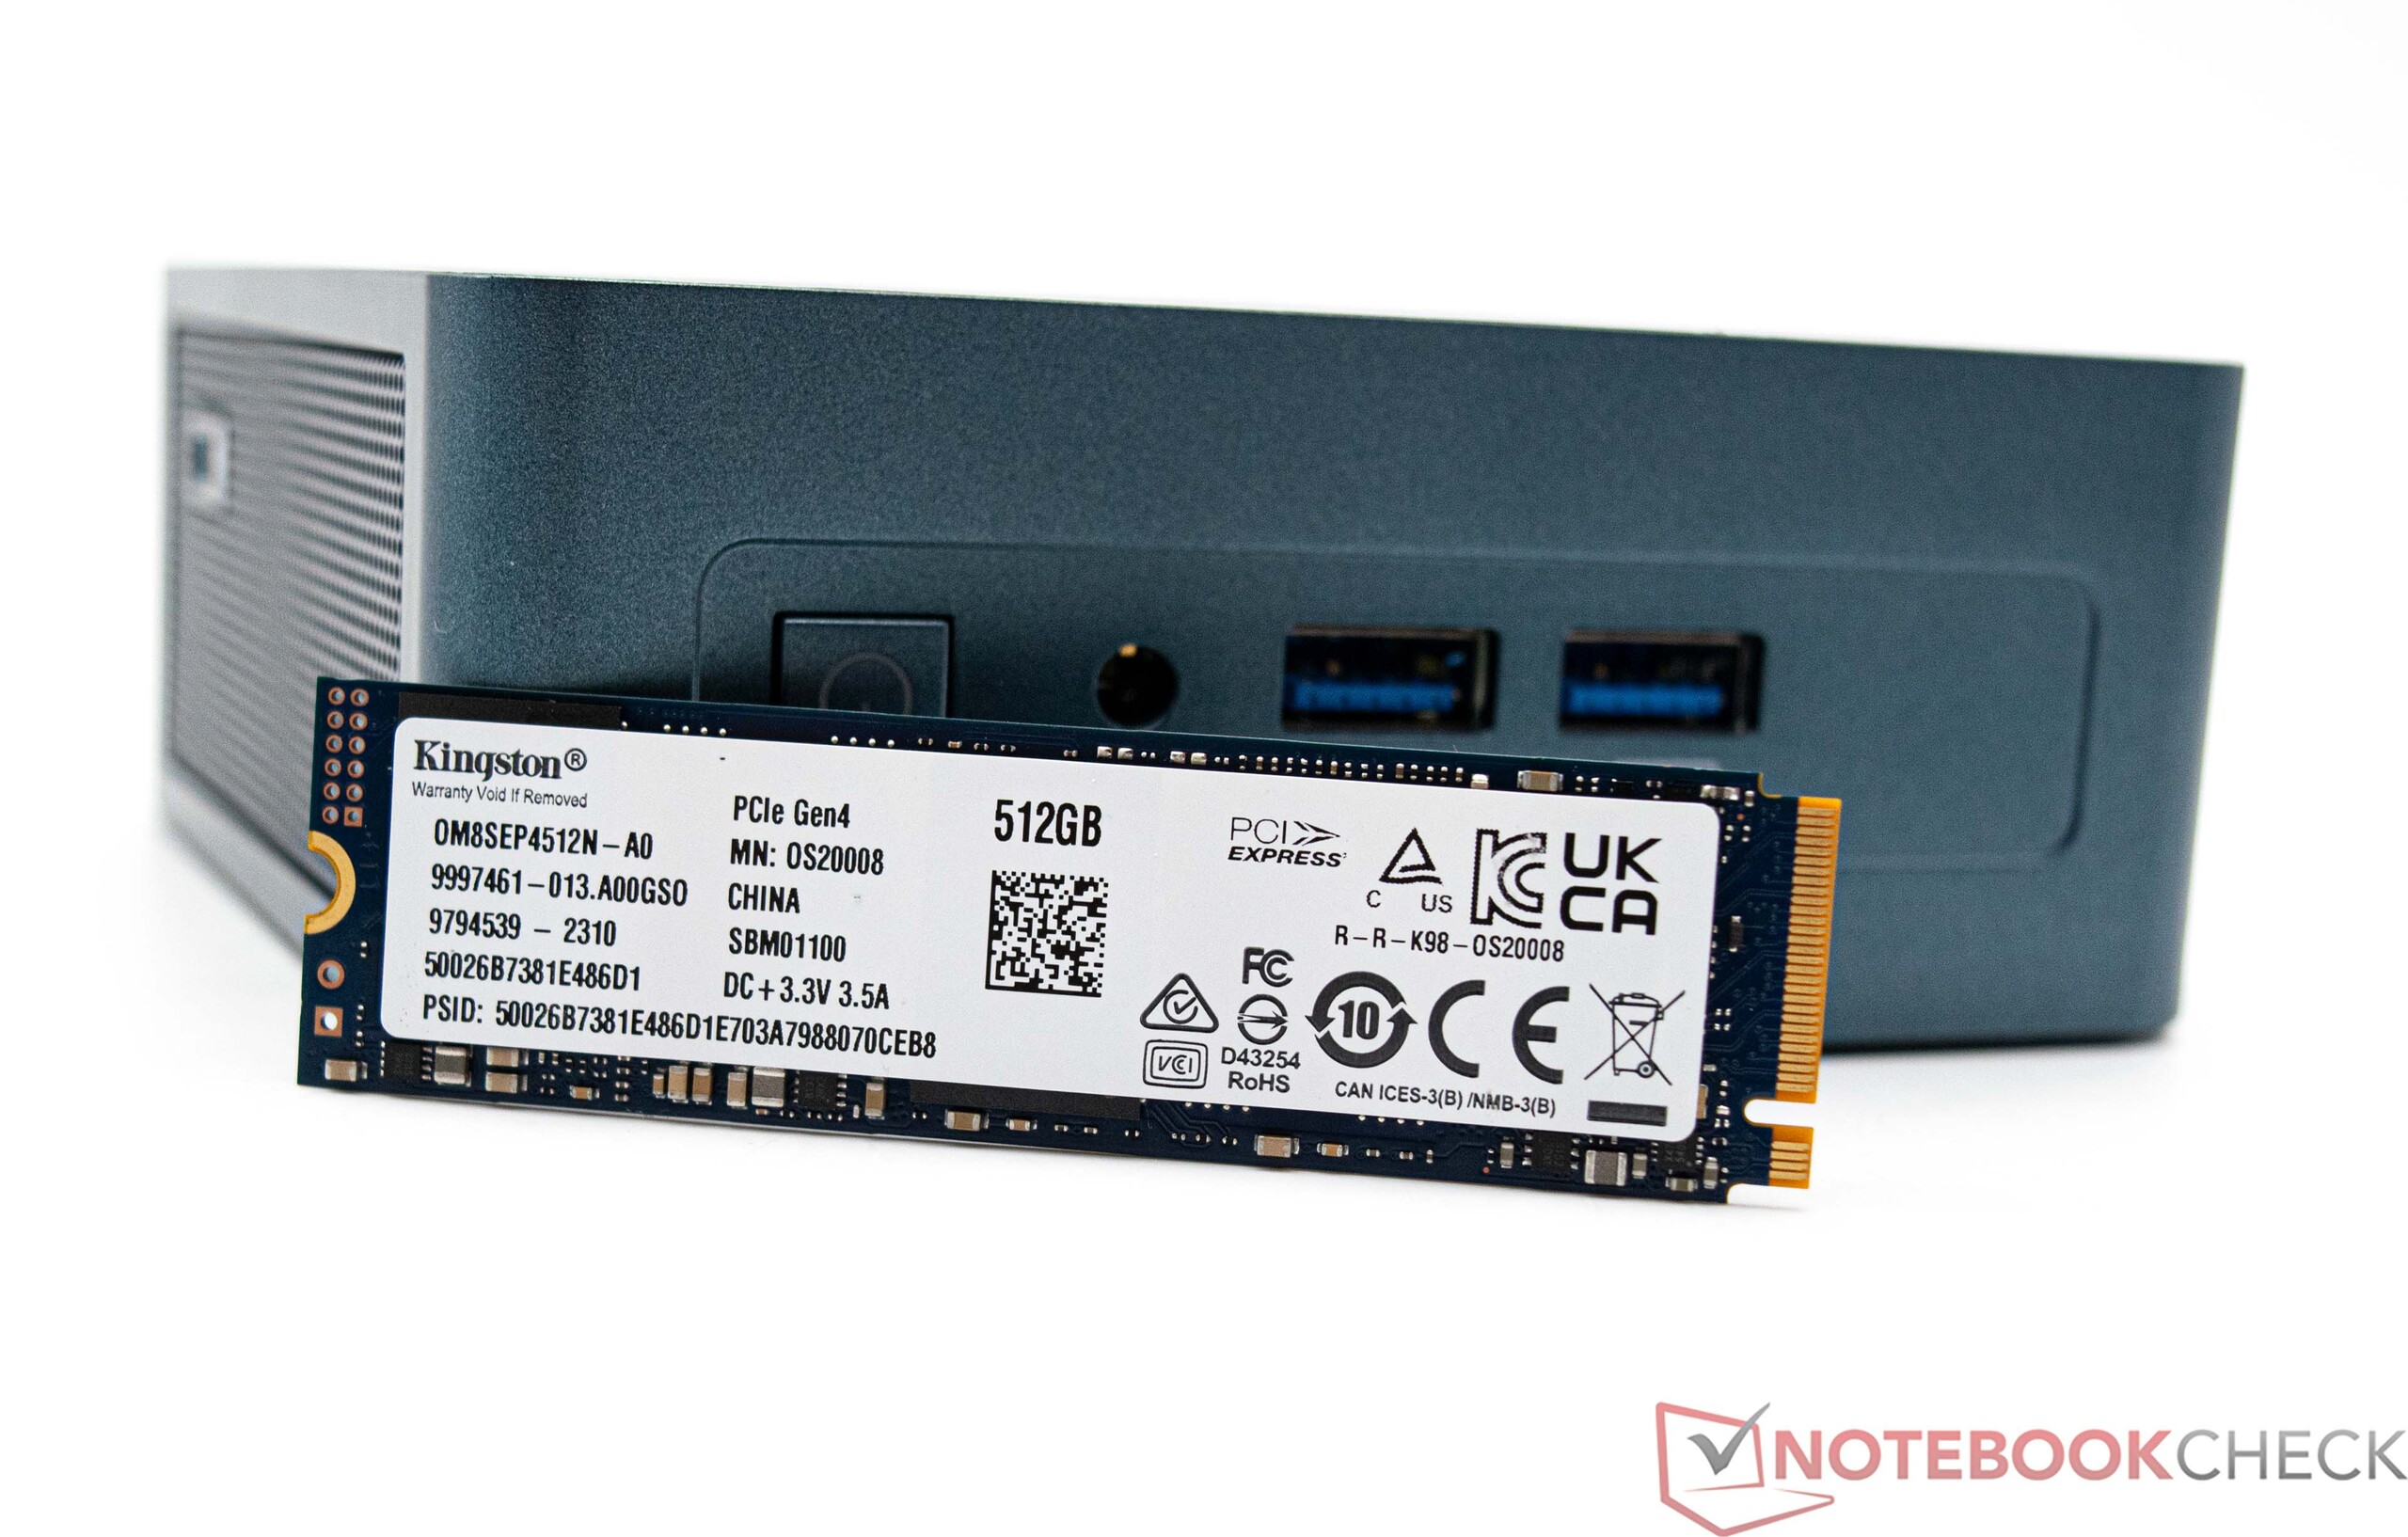
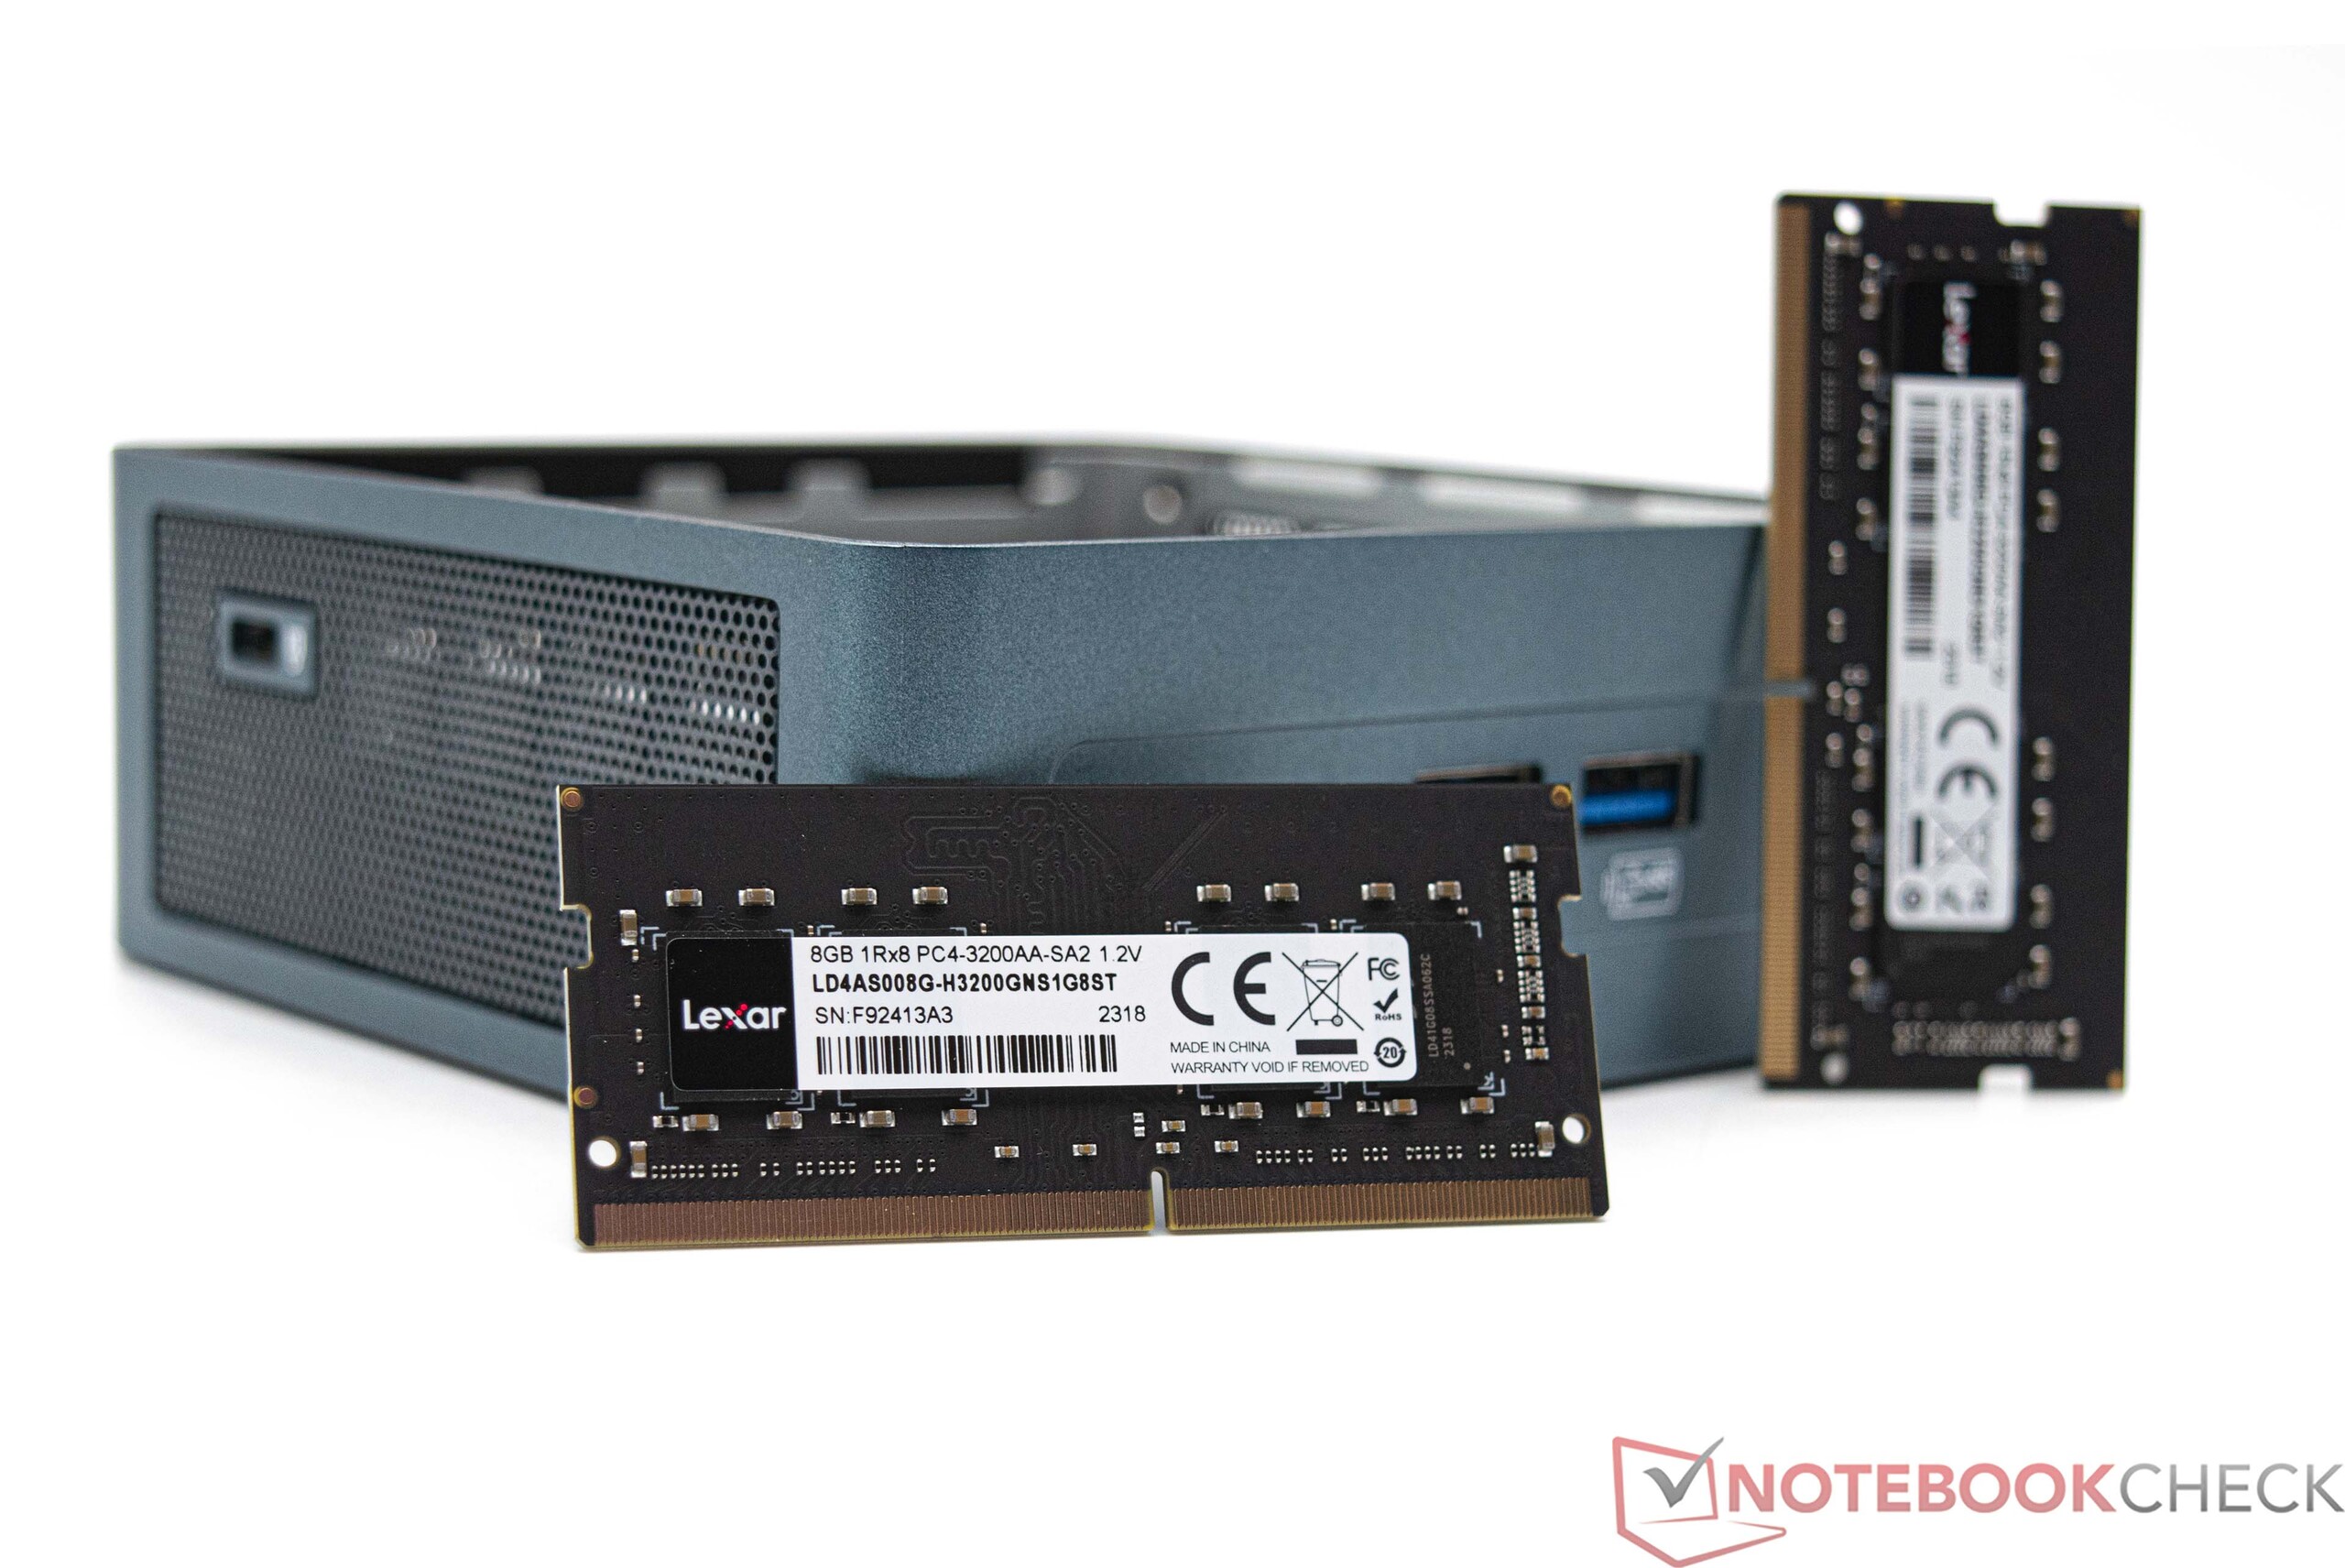
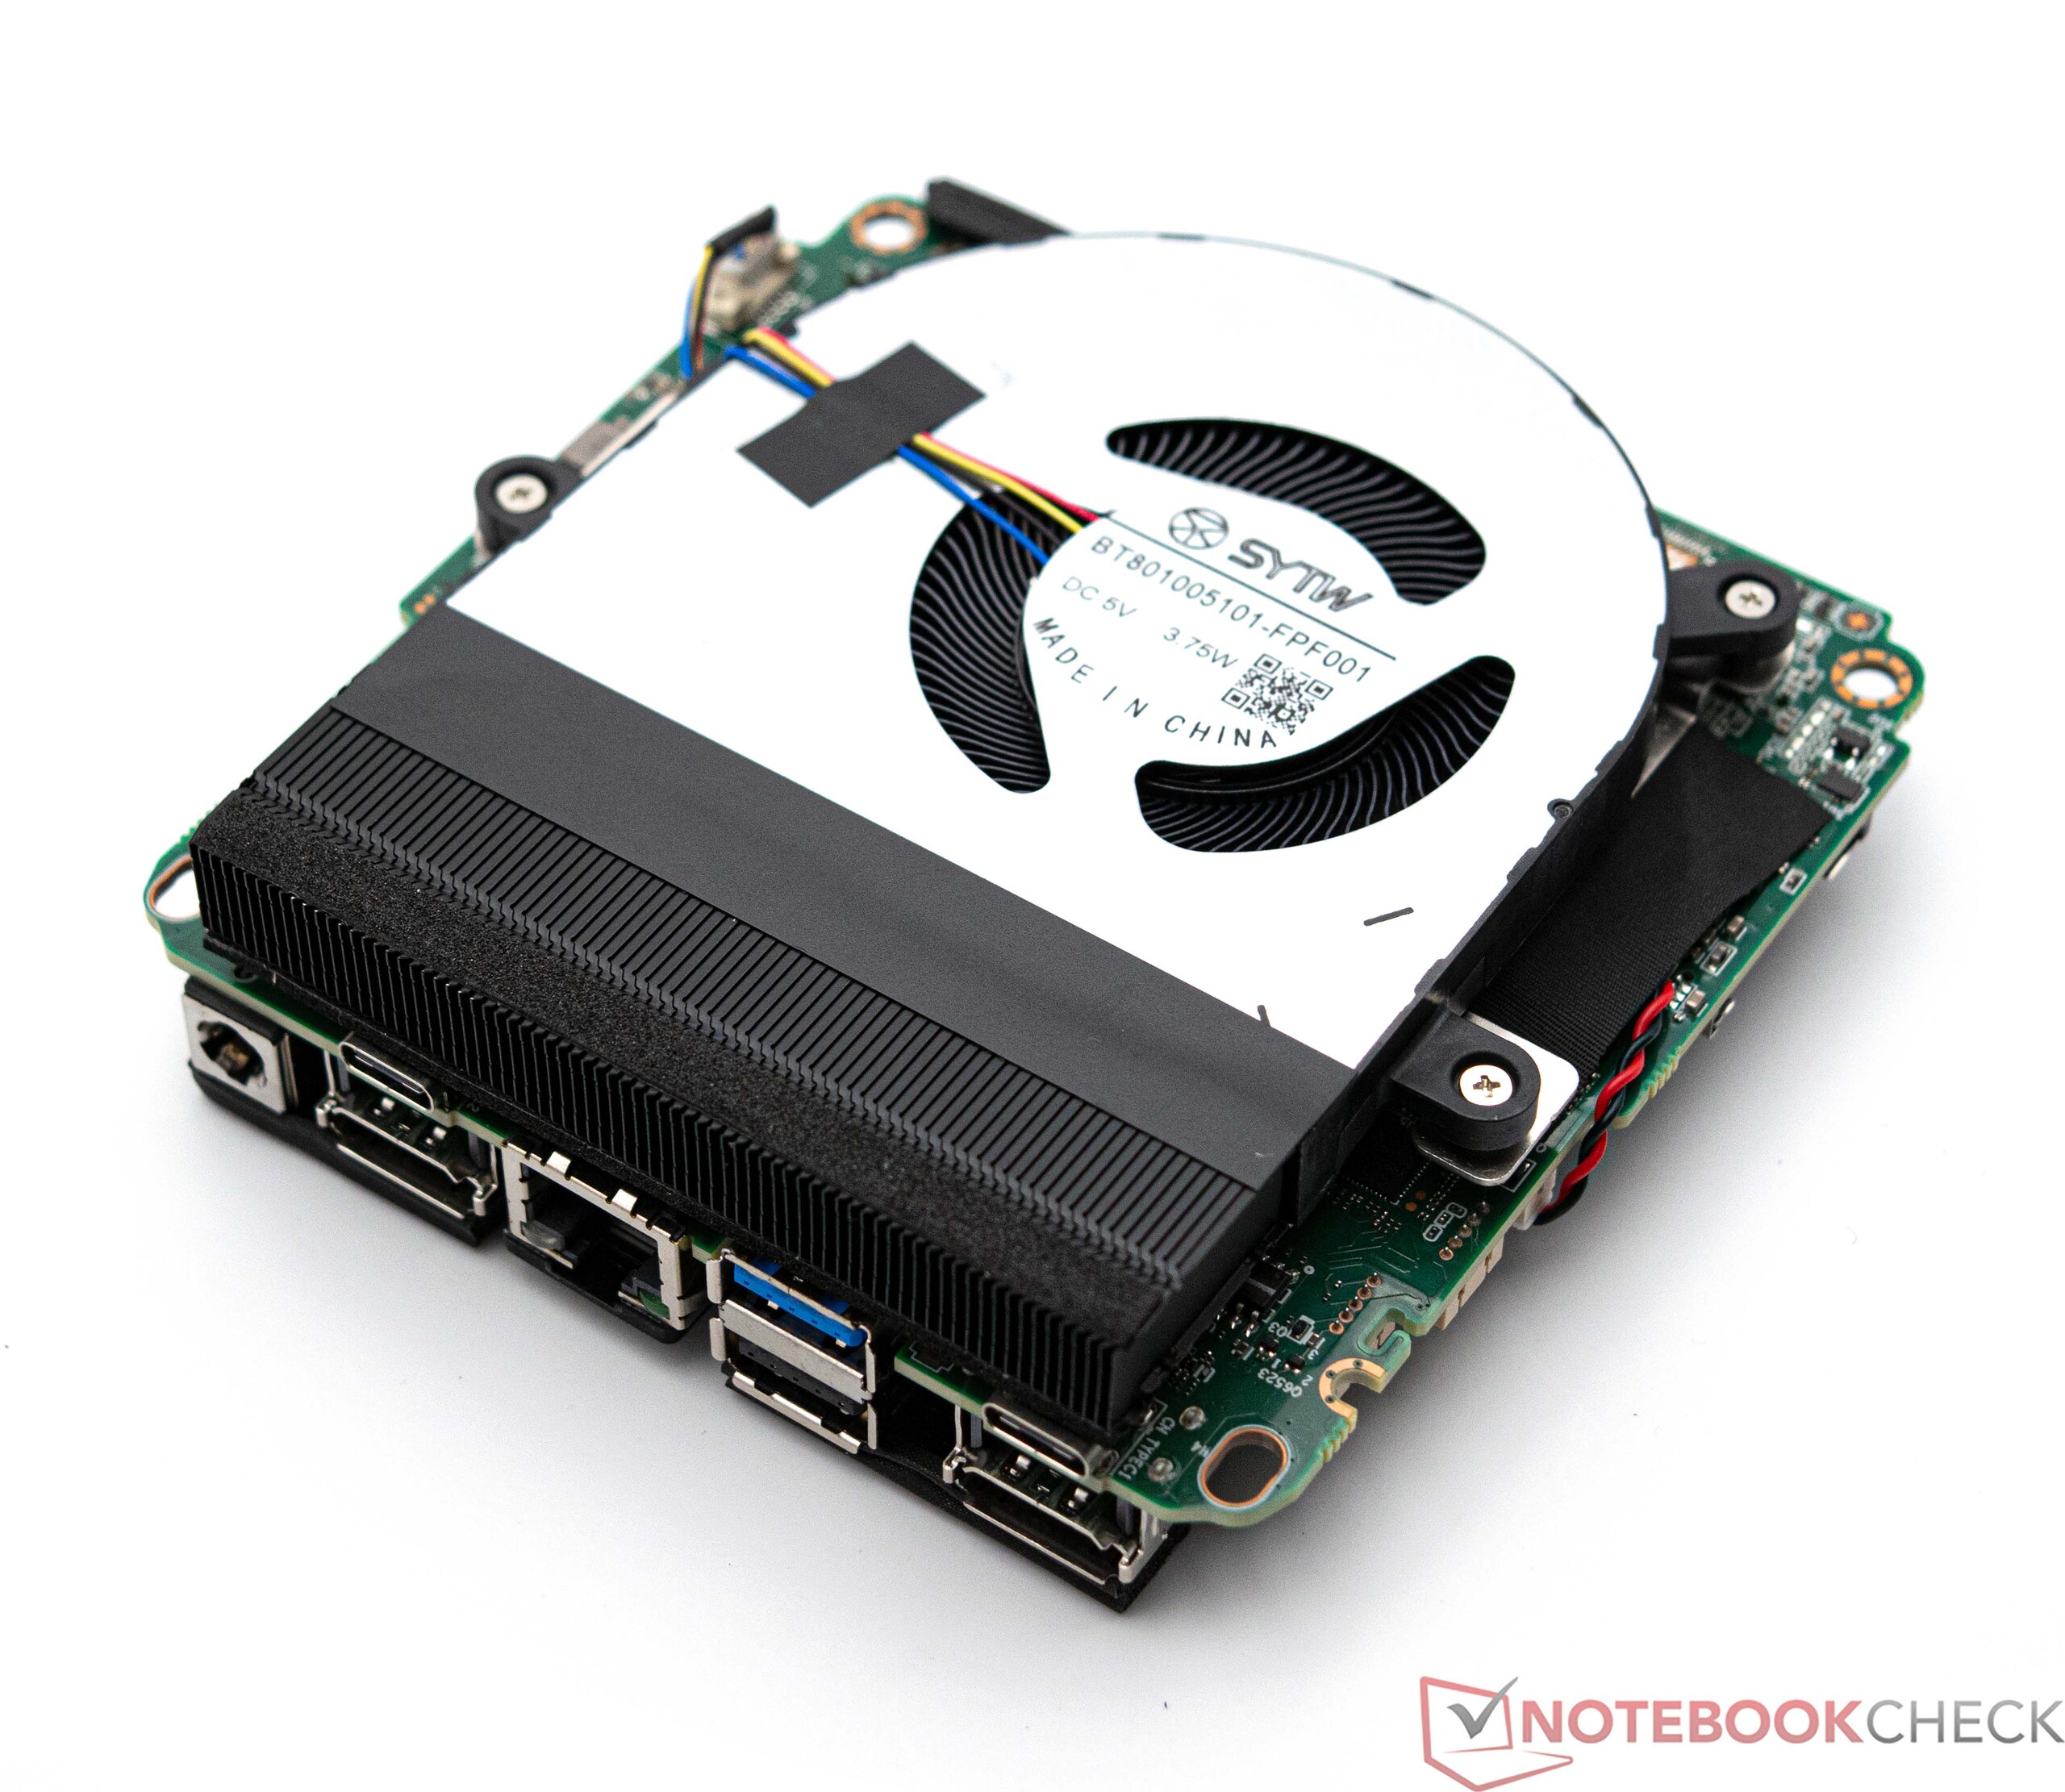
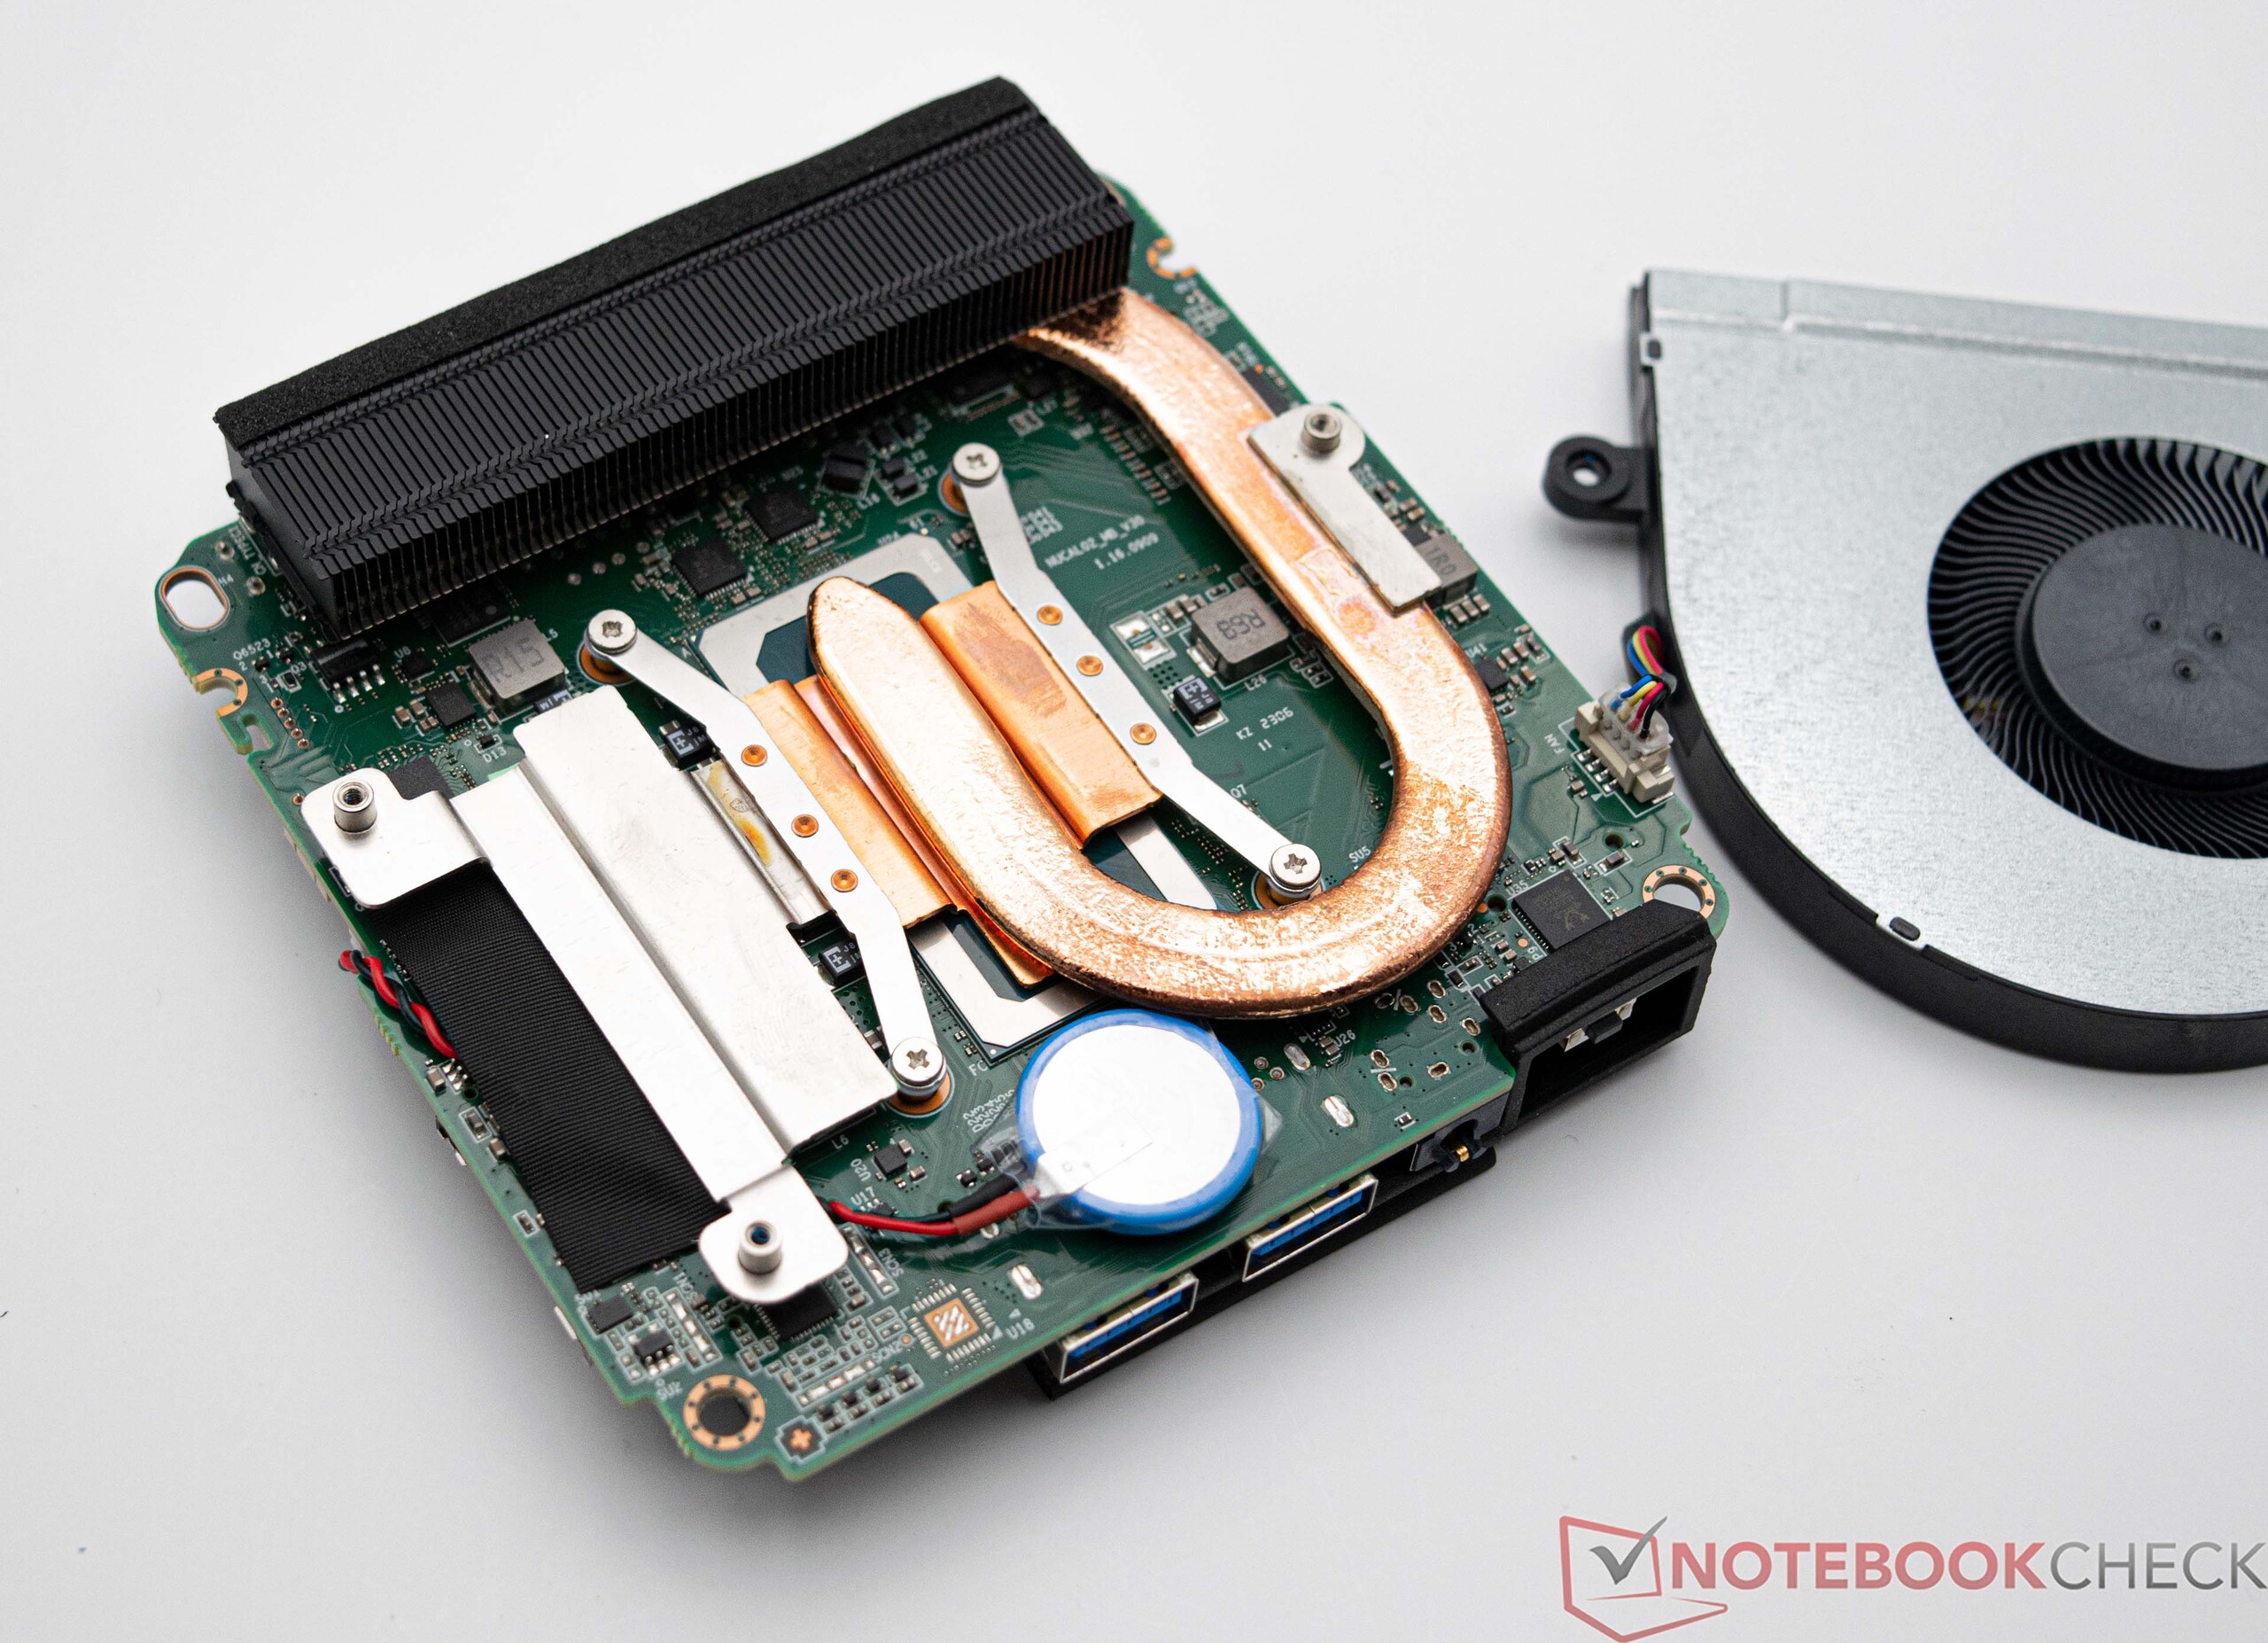
Wer das Gerät öffnen will, muss zunächst die Bodenplatte entfernen. Das ist problemlos möglich: In den vier Gummifüßen befinden sich die Schrauben, welche die Abdeckung am Gehäuse halten. Nach dem Entfernen gelangt man unkompliziert an die verbauten Komponenten wie RAM, SSD oder auch das WLAN-Modul. Ein weiterer M.2-Steckplatz ist noch vorhanden, um einen zusätzlichen Massenspeicher zu installieren. Selbst ein Massenspeicher im 2,5-Zoll-Format kann im Geekom Mini IT12 untergebracht werden. Das Gerät kann nach Bedarf auch noch weiter zerlegt werden, wenn der Lüfter gereinigt werden muss oder frische Wärmeleitpaste erforderlich ist.

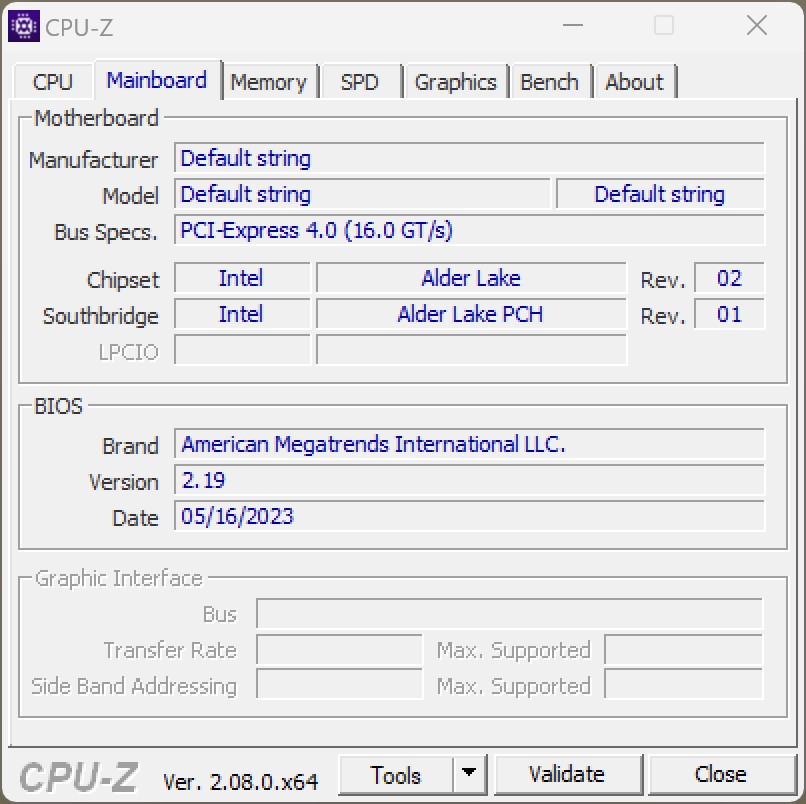
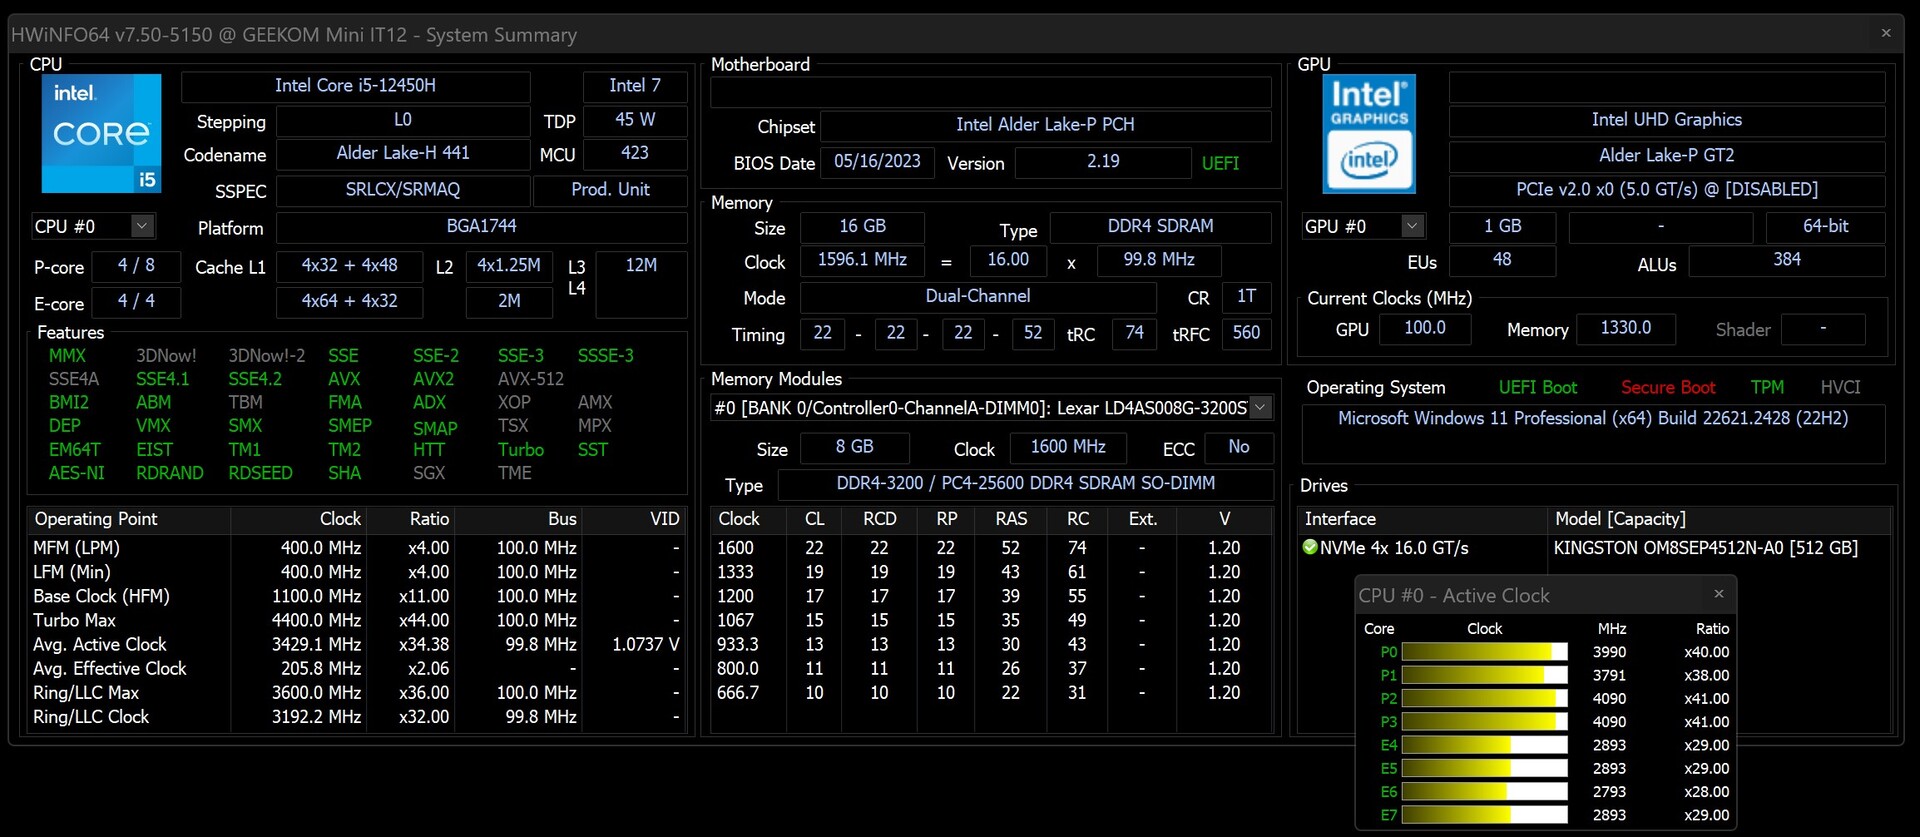
Leistung - Alder Lake-H mit P- und E-Kernen
Der Geekom Mini IT12 bietet mit dem Intel Core i5-12450H ein solides SoC, welches jedoch nicht zu den aktuellsten Modellen gehört. Im Alltag sollte es dennoch keine Probleme geben, denn mit insgesamt 8 Kernen und 12 Threads kommt der Prozessor auch mit anspruchsvollen Aufgaben gut zurecht. Den Geekom Mini IT12 kann auch mit dem Intel Core i7-12650H erworben werden.
Testbedingungen
Alle Leistungstests haben wir mit dem Energieprofil Ausgeglichen
durchgeführt. Die Leistung des SoC haben wir nicht verändert und gemäß der BIOS-Einstellungen im Auslieferungszustand belassen.
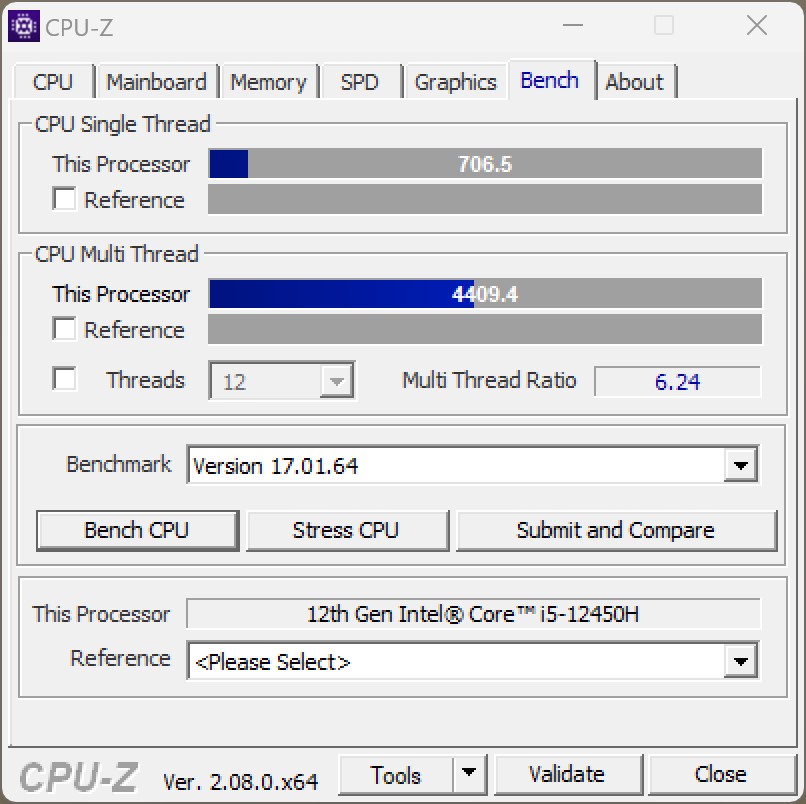
Prozessor
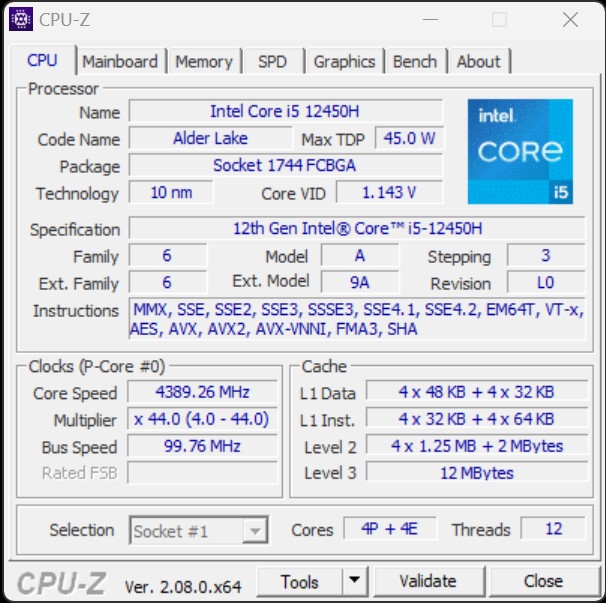
Geekom stattet den Mini IT12 mit dem Intel Core i5-12450H aus. Bei dem Prozessor handelt es sich um ein Modell der Alder-Lake-H-Serie und wird auch beim Minisforum Venus Series UN1245 und dem NiPoGi CK10 eingesetzt. Im direkten Triell kann sich Geekom hier durchsetzen und insgesamt besser abschneiden. Gegenüber den beiden Intel NUC-Kontrahenten muss sich unser Testsample geschlagen geben. Auch das interne Duell mit dem Geekom Mini IT12 auf Basis des Intel Core i7-1260P verliert unser Testmuster knapp.
Für weitere Vergleiche und Benchmarks verweisen wir auf unsere CPU-Vergleichstabelle.
| Performance Rating - Percent | |
| Intel NUC 13 Pro Kit NUC13ANK | |
| Intel NUC 12 Pro Kit NUC12WSKi7 | |
| Geekom Mini IT12 | |
| Geekom Mini IT12 | |
| Minisforum Venus Series UN1245 | |
| NiPoGi CK10 | |
| Minisforum Mars Series MC560 | |
| Blender - v2.79 BMW27 CPU | |
| Minisforum Mars Series MC560 | |
| NiPoGi CK10 | |
| Geekom Mini IT12 | |
| Minisforum Venus Series UN1245 | |
| Intel NUC 12 Pro Kit NUC12WSKi7 | |
| Geekom Mini IT12 | |
| Intel NUC 13 Pro Kit NUC13ANK | |
| WinRAR - Result | |
| Intel NUC 12 Pro Kit NUC12WSKi7 | |
| Minisforum Mars Series MC560 | |
| Geekom Mini IT12 | |
| Minisforum Venus Series UN1245 | |
| Geekom Mini IT12 | |
| Intel NUC 13 Pro Kit NUC13ANK | |
| NiPoGi CK10 | |
| 3DMark 11 - 1280x720 Performance Physics | |
| Intel NUC 12 Pro Kit NUC12WSKi7 | |
| Intel NUC 13 Pro Kit NUC13ANK | |
| Geekom Mini IT12 | |
| Minisforum Venus Series UN1245 | |
| NiPoGi CK10 | |
| Minisforum Mars Series MC560 | |
| Geekom Mini IT12 | |
| HWBOT x265 Benchmark v2.2 - 4k Preset | |
| Intel NUC 13 Pro Kit NUC13ANK | |
| Intel NUC 12 Pro Kit NUC12WSKi7 | |
| Minisforum Venus Series UN1245 | |
| Geekom Mini IT12 | |
| Minisforum Mars Series MC560 | |
| Geekom Mini IT12 | |
| NiPoGi CK10 | |
| R Benchmark 2.5 - Overall mean | |
| Minisforum Mars Series MC560 | |
| NiPoGi CK10 | |
| Minisforum Venus Series UN1245 | |
| Geekom Mini IT12 | |
| Intel NUC 12 Pro Kit NUC12WSKi7 | |
| Geekom Mini IT12 | |
| Intel NUC 13 Pro Kit NUC13ANK | |
| LibreOffice - 20 Documents To PDF | |
| Minisforum Mars Series MC560 | |
| Geekom Mini IT12 | |
| Geekom Mini IT12 | |
| Minisforum Venus Series UN1245 | |
| Intel NUC 12 Pro Kit NUC12WSKi7 | |
| Intel NUC 13 Pro Kit NUC13ANK | |
| NiPoGi CK10 | |
| WebXPRT 3 - Overall | |
| Intel NUC 13 Pro Kit NUC13ANK | |
| Geekom Mini IT12 | |
| Intel NUC 12 Pro Kit NUC12WSKi7 | |
| Minisforum Venus Series UN1245 | |
| Geekom Mini IT12 | |
| NiPoGi CK10 | |
| Minisforum Mars Series MC560 | |
| Mozilla Kraken 1.1 - Total | |
| Minisforum Mars Series MC560 | |
| Minisforum Venus Series UN1245 | |
| NiPoGi CK10 | |
| Geekom Mini IT12 | |
| Geekom Mini IT12 | |
| Intel NUC 12 Pro Kit NUC12WSKi7 | |
| Intel NUC 13 Pro Kit NUC13ANK | |
* ... kleinere Werte sind besser
AIDA64: FP32 Ray-Trace | FPU Julia | CPU SHA3 | CPU Queen | FPU SinJulia | FPU Mandel | CPU AES | CPU ZLib | FP64 Ray-Trace | CPU PhotoWorxx
| Performance Rating | |
| Durchschnitt der Klasse Mini PC | |
| Intel NUC 13 Pro Kit NUC13ANK | |
| Intel NUC 12 Pro Kit NUC12WSKi7 | |
| Minisforum Mars Series MC560 | |
| Minisforum Venus Series UN1245 | |
| Geekom Mini IT12 | |
| Geekom Mini IT12 | |
| NiPoGi CK10 | |
| AIDA64 / FP32 Ray-Trace | |
| Durchschnitt der Klasse Mini PC (974 - 82725, n=102, der letzten 2 Jahre) | |
| Intel NUC 13 Pro Kit NUC13ANK | |
| Intel NUC 12 Pro Kit NUC12WSKi7 | |
| Minisforum Mars Series MC560 | |
| Minisforum Venus Series UN1245 | |
| Geekom Mini IT12 | |
| Geekom Mini IT12 | |
| NiPoGi CK10 | |
| AIDA64 / FPU Julia | |
| Durchschnitt der Klasse Mini PC (6115 - 363782, n=102, der letzten 2 Jahre) | |
| Minisforum Mars Series MC560 | |
| Intel NUC 13 Pro Kit NUC13ANK | |
| Intel NUC 12 Pro Kit NUC12WSKi7 | |
| Minisforum Venus Series UN1245 | |
| Geekom Mini IT12 | |
| Geekom Mini IT12 | |
| NiPoGi CK10 | |
| AIDA64 / CPU SHA3 | |
| Durchschnitt der Klasse Mini PC (385 - 9475, n=102, der letzten 2 Jahre) | |
| Intel NUC 13 Pro Kit NUC13ANK | |
| Intel NUC 12 Pro Kit NUC12WSKi7 | |
| Minisforum Venus Series UN1245 | |
| Minisforum Mars Series MC560 | |
| Geekom Mini IT12 | |
| Geekom Mini IT12 | |
| NiPoGi CK10 | |
| AIDA64 / CPU Queen | |
| Durchschnitt der Klasse Mini PC (20501 - 162855, n=86, der letzten 2 Jahre) | |
| Intel NUC 13 Pro Kit NUC13ANK | |
| Intel NUC 12 Pro Kit NUC12WSKi7 | |
| Geekom Mini IT12 | |
| Minisforum Mars Series MC560 | |
| Minisforum Venus Series UN1245 | |
| Geekom Mini IT12 | |
| NiPoGi CK10 | |
| AIDA64 / FPU SinJulia | |
| Durchschnitt der Klasse Mini PC (1116 - 31931, n=102, der letzten 2 Jahre) | |
| Minisforum Mars Series MC560 | |
| Intel NUC 13 Pro Kit NUC13ANK | |
| Intel NUC 12 Pro Kit NUC12WSKi7 | |
| Minisforum Venus Series UN1245 | |
| Geekom Mini IT12 | |
| Geekom Mini IT12 | |
| NiPoGi CK10 | |
| AIDA64 / FPU Mandel | |
| Durchschnitt der Klasse Mini PC (3322 - 192994, n=102, der letzten 2 Jahre) | |
| Minisforum Mars Series MC560 | |
| Intel NUC 13 Pro Kit NUC13ANK | |
| Intel NUC 12 Pro Kit NUC12WSKi7 | |
| Minisforum Venus Series UN1245 | |
| Geekom Mini IT12 | |
| Geekom Mini IT12 | |
| NiPoGi CK10 | |
| AIDA64 / CPU AES | |
| Intel NUC 13 Pro Kit NUC13ANK | |
| Intel NUC 12 Pro Kit NUC12WSKi7 | |
| Durchschnitt der Klasse Mini PC (9915 - 204742, n=101, der letzten 2 Jahre) | |
| Minisforum Mars Series MC560 | |
| Minisforum Venus Series UN1245 | |
| Geekom Mini IT12 | |
| Geekom Mini IT12 | |
| NiPoGi CK10 | |
| AIDA64 / CPU ZLib | |
| Durchschnitt der Klasse Mini PC (127.2 - 2431, n=102, der letzten 2 Jahre) | |
| Intel NUC 13 Pro Kit NUC13ANK | |
| Intel NUC 12 Pro Kit NUC12WSKi7 | |
| Minisforum Venus Series UN1245 | |
| Geekom Mini IT12 | |
| Geekom Mini IT12 | |
| Minisforum Mars Series MC560 | |
| NiPoGi CK10 | |
| AIDA64 / FP64 Ray-Trace | |
| Durchschnitt der Klasse Mini PC (537 - 43587, n=102, der letzten 2 Jahre) | |
| Intel NUC 13 Pro Kit NUC13ANK | |
| Intel NUC 12 Pro Kit NUC12WSKi7 | |
| Minisforum Mars Series MC560 | |
| Minisforum Venus Series UN1245 | |
| Geekom Mini IT12 | |
| Geekom Mini IT12 | |
| NiPoGi CK10 | |
| AIDA64 / CPU PhotoWorxx | |
| Durchschnitt der Klasse Mini PC (8069 - 96843, n=102, der letzten 2 Jahre) | |
| Intel NUC 13 Pro Kit NUC13ANK | |
| Minisforum Venus Series UN1245 | |
| Intel NUC 12 Pro Kit NUC12WSKi7 | |
| Geekom Mini IT12 | |
| NiPoGi CK10 | |
| Geekom Mini IT12 | |
| Minisforum Mars Series MC560 | |
Der Geekom Mini IT12 vs. Cinebench-R15-Multi-Schleife
Mit der Cinebench-R15-Dauerschleife schauen wir uns die Leistungsfähigkeit der verbauten Kühlung im Zusammenspiel mit dem Power-Target des Intel Core i5-12450H an. Das Ergebnis zeigt uns, dass nur zu Beginn die maximale Leistung des Prozessors zur Verfügung steht. Schon nach dem zweiten Durchlauf sinkt die Leistung deutlich und bleibt dann im weiteren Verlauf stabil. Mit einem durchschnittlichen Ergebnis von 1.211 Punkten schneidet unser Testgerät mit dem fünften Platz zufriedengeben.

System Performance
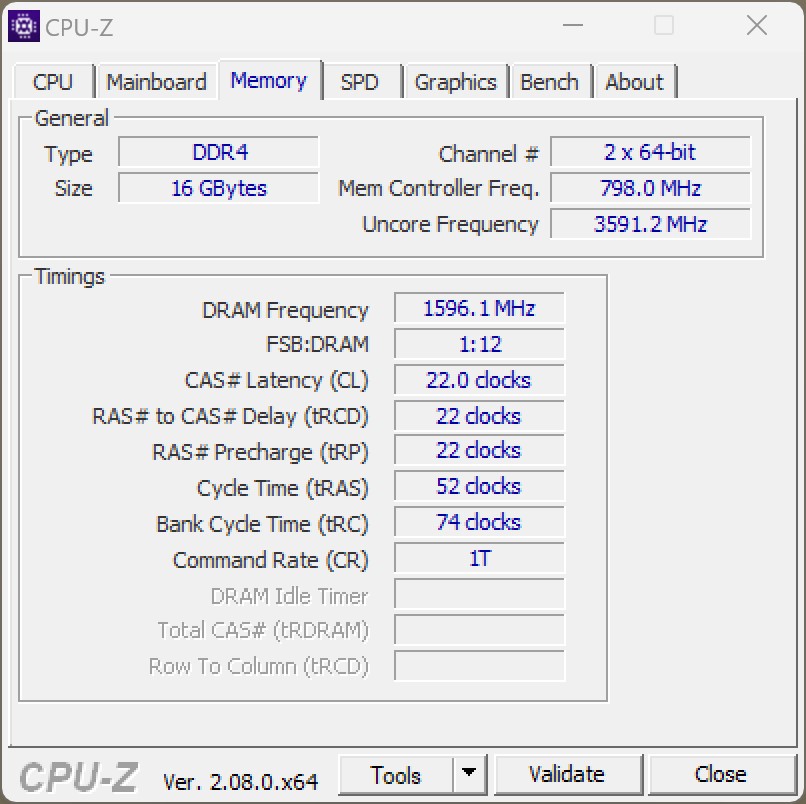
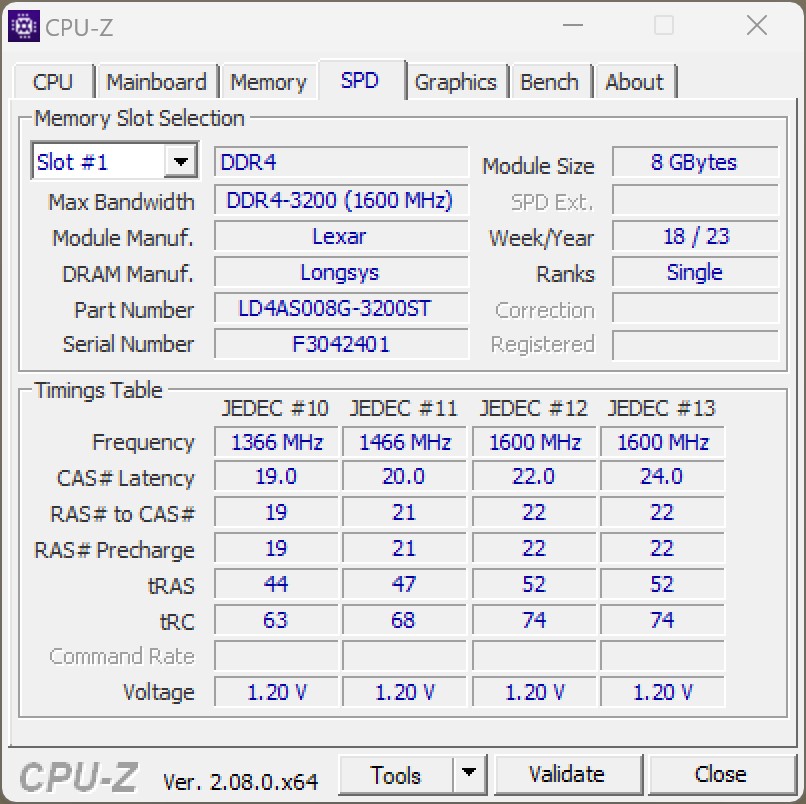
Die Benchmarks hinsichtlich der Systemleistung zeigen ein ähnliches Bild wie zuvor bei den reinen CPU-Leistungstests. Auch hier können die beiden Kontrahenten Minisforum Venus Series UN1245 und NiPoGi CK10 wieder geschlagen werden. Bei den RAM-Tests zeigen alle Geräte eine ähnliche Leistung, da hier kein Hersteller den Schritt wagt und schnelleren DDR5-Arbeitsspeicher verbaut. Dabei würde auch der Intel Core i5-12450H DDR5-RAM mit bis zu 5.200 MT/s unterstützen.
| AIDA64 / Memory Copy | |
| Durchschnitt der Klasse Mini PC (15933 - 163031, n=102, der letzten 2 Jahre) | |
| Intel NUC 13 Pro Kit NUC13ANK | |
| Geekom Mini IT12 | |
| Intel NUC 12 Pro Kit NUC12WSKi7 | |
| Geekom Mini IT12 | |
| NiPoGi CK10 | |
| Minisforum Venus Series UN1245 | |
| Minisforum Mars Series MC560 | |
| AIDA64 / Memory Read | |
| Durchschnitt der Klasse Mini PC (14143 - 123769, n=102, der letzten 2 Jahre) | |
| Geekom Mini IT12 | |
| Geekom Mini IT12 | |
| NiPoGi CK10 | |
| Minisforum Venus Series UN1245 | |
| Intel NUC 12 Pro Kit NUC12WSKi7 | |
| Intel NUC 13 Pro Kit NUC13ANK | |
| Minisforum Mars Series MC560 | |
| AIDA64 / Memory Write | |
| Durchschnitt der Klasse Mini PC (10630 - 216693, n=102, der letzten 2 Jahre) | |
| Geekom Mini IT12 | |
| NiPoGi CK10 | |
| Geekom Mini IT12 | |
| Minisforum Venus Series UN1245 | |
| Intel NUC 12 Pro Kit NUC12WSKi7 | |
| Intel NUC 13 Pro Kit NUC13ANK | |
| Minisforum Mars Series MC560 | |
| AIDA64 / Memory Latency | |
| Durchschnitt der Klasse Mini PC (88.1 - 184.8, n=103, der letzten 2 Jahre) | |
| Minisforum Mars Series MC560 | |
| Intel NUC 13 Pro Kit NUC13ANK | |
| Intel NUC 12 Pro Kit NUC12WSKi7 | |
| Geekom Mini IT12 | |
| Minisforum Venus Series UN1245 | |
| NiPoGi CK10 | |
| Geekom Mini IT12 | |
* ... kleinere Werte sind besser
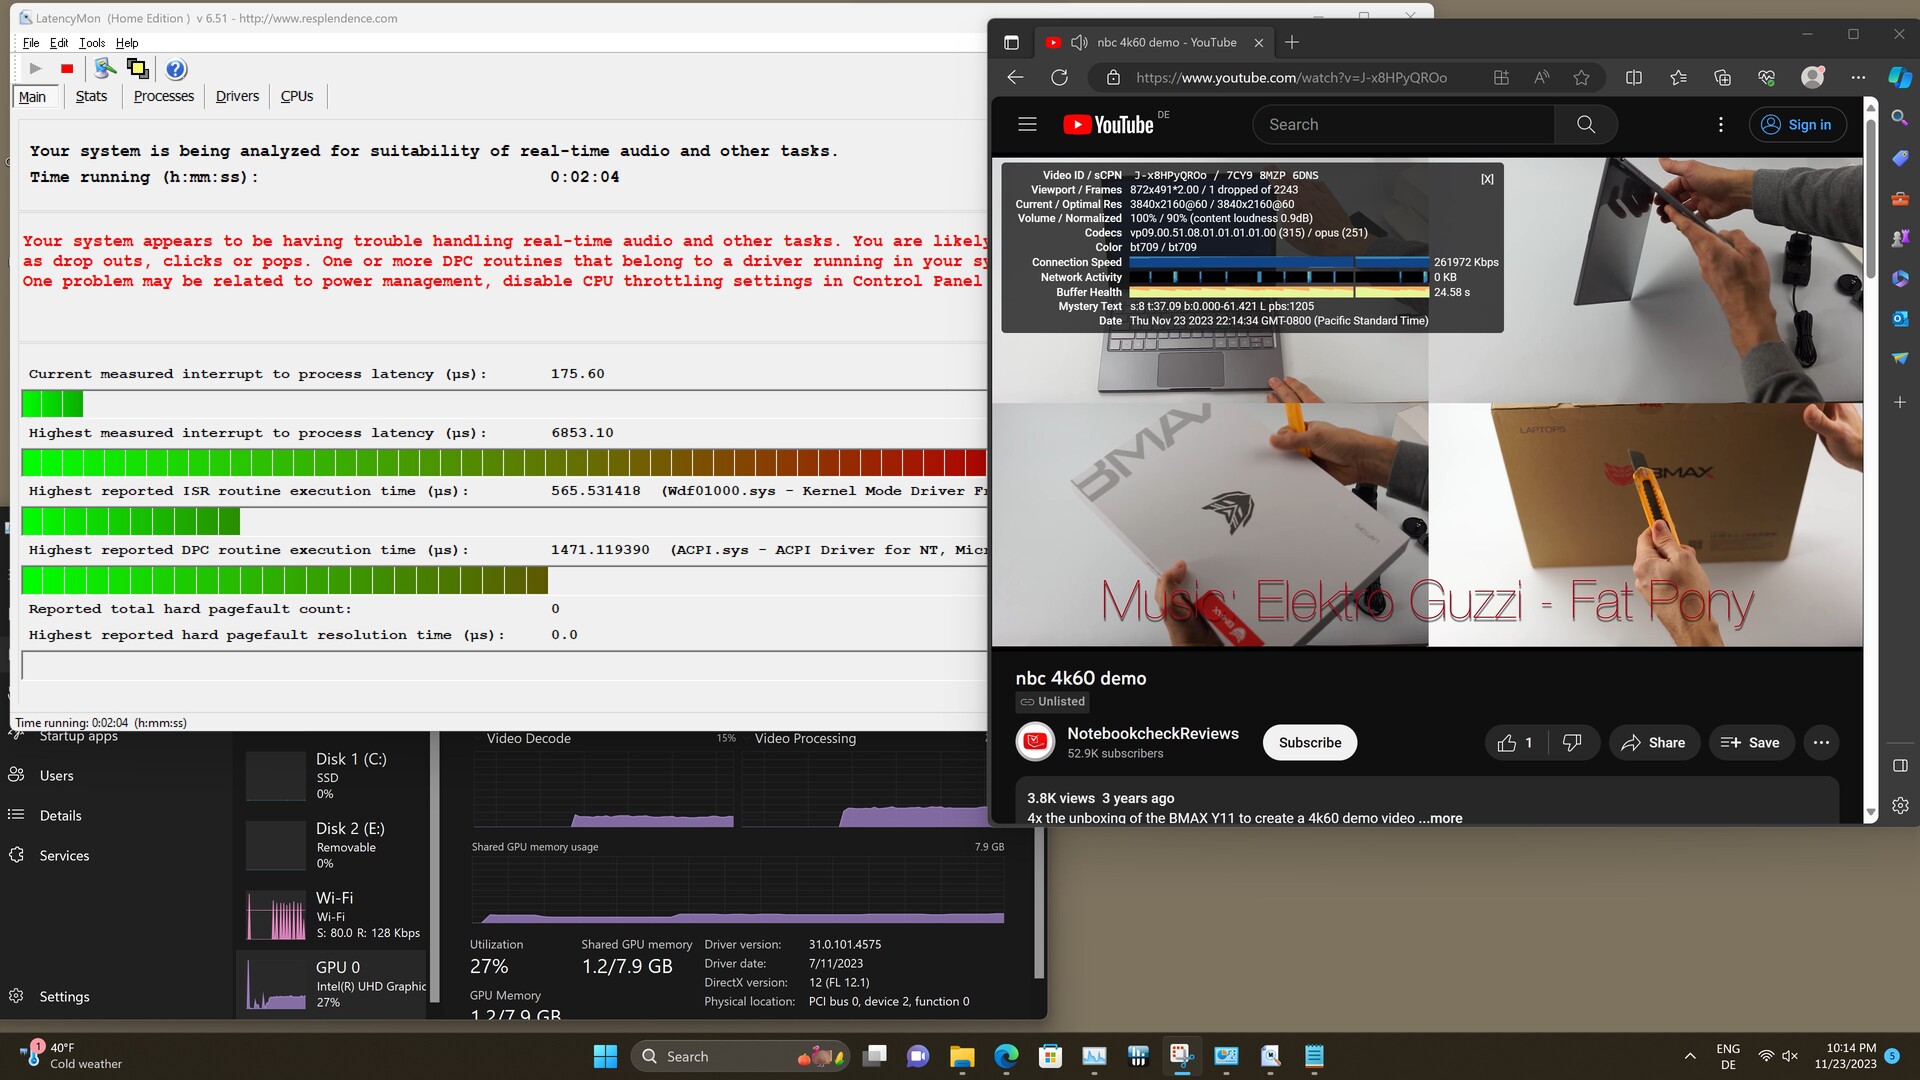
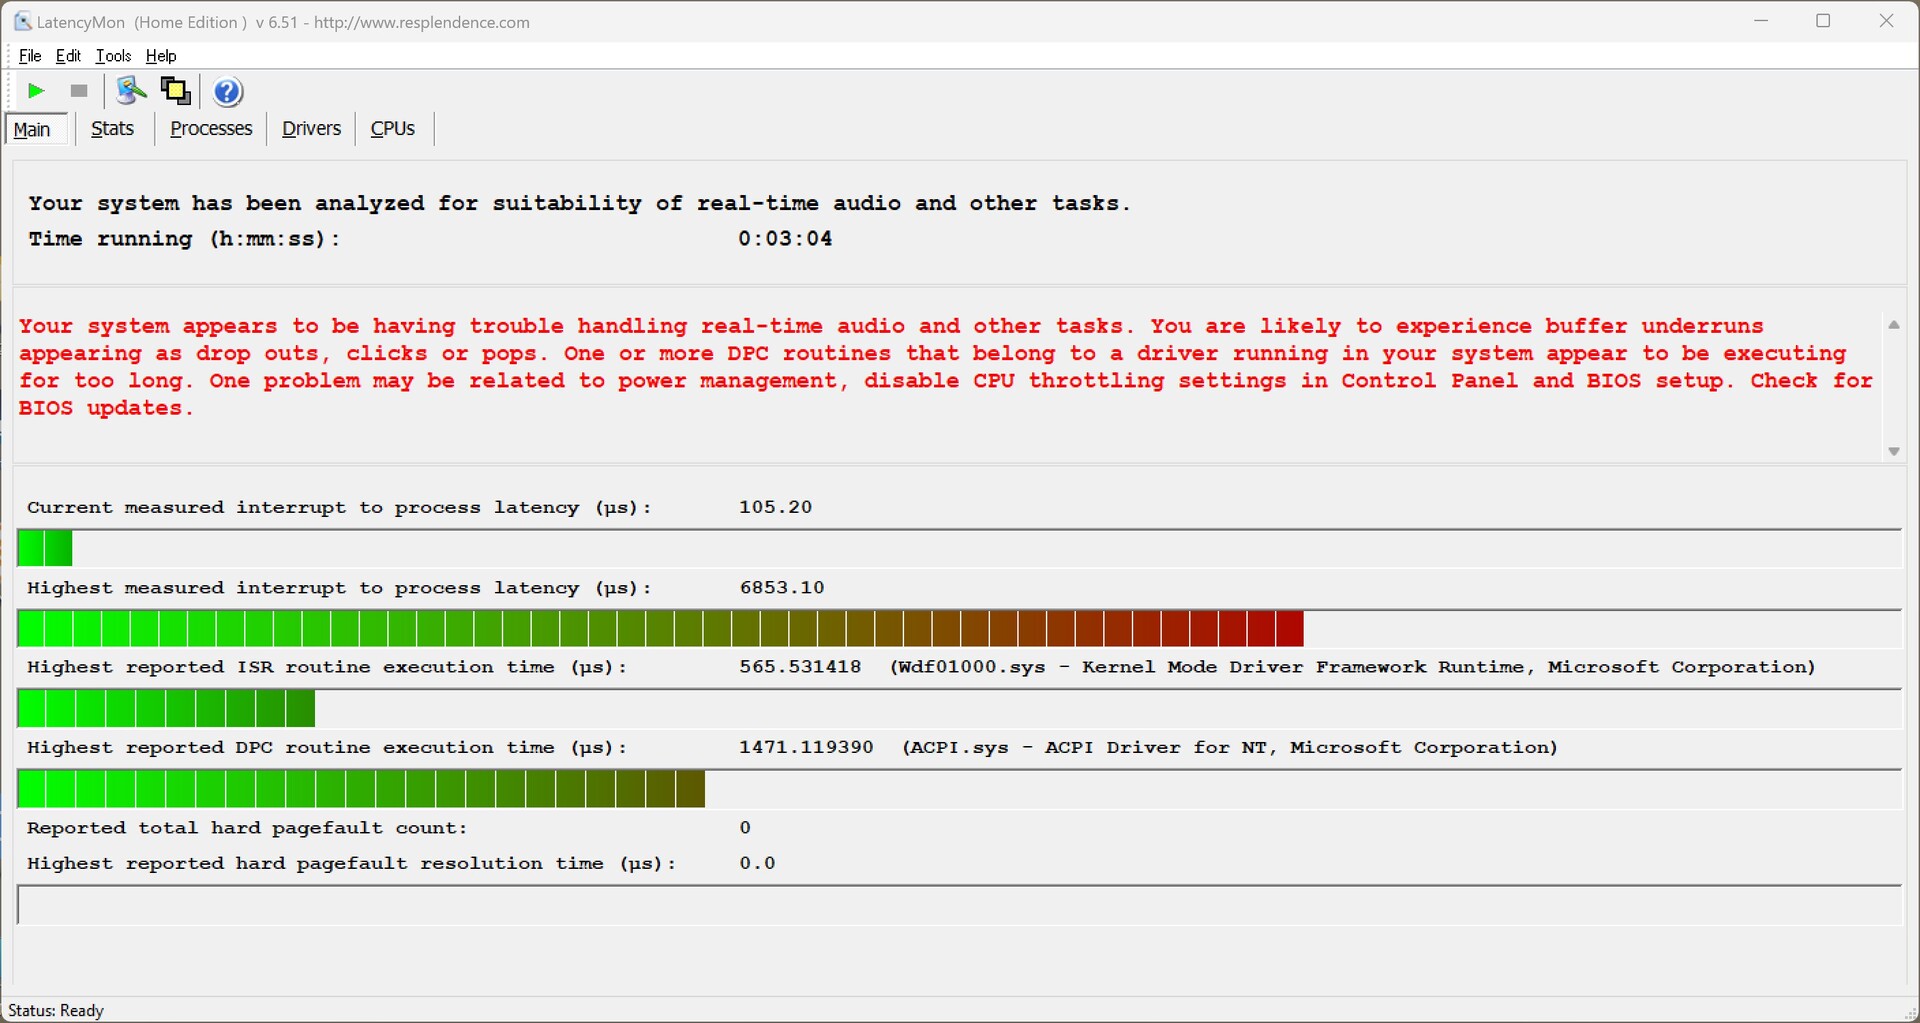
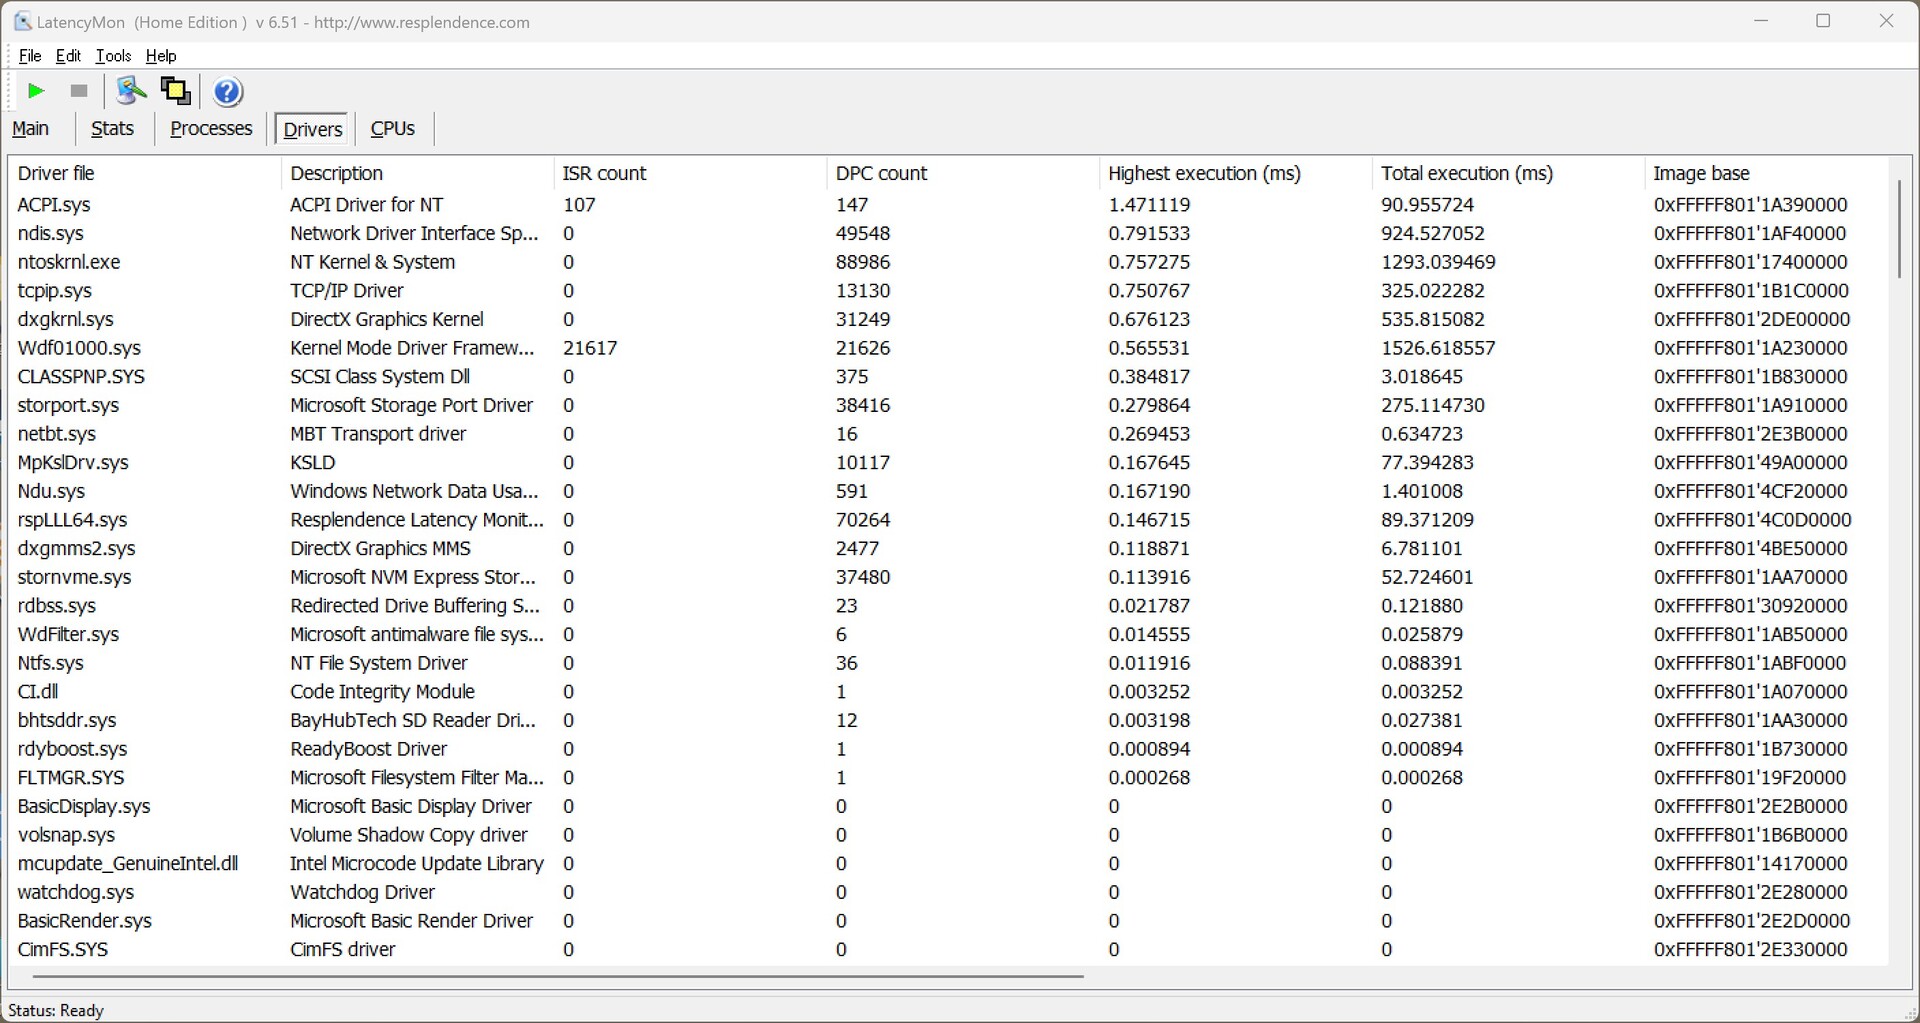
DPC-Latenzen
Bei den DPC-Latenzen kann der Geekom Mini IT12 auf Basis des Intel Core i5-12450H nicht glänzen. Schon beim Öffnen mehrerer Tabs im Edge-Brower zeigt uns LatencyMon sehr hohe Latenzen. Glücklicherweise sehen wir bei der Wiedergabe unseres 4K-Testvideos keine Verschlechterung. Aufgrund der geringen Anzahl an ausgelassenen Frames kann der Geekom Mini IT12 dennoch als Streaming-Client zum Beispiel im Wohnzimmer benutzt werden.
| DPC Latencies / LatencyMon - interrupt to process latency (max), Web, Youtube, Prime95 | |
| Geekom Mini IT12 | |
| Minisforum Mars Series MC560 | |
| Intel NUC 13 Pro Kit NUC13ANK | |
| Geekom Mini IT12 | |
| NiPoGi CK10 | |
| Intel NUC 12 Pro Kit NUC12WSKi7 | |
| Minisforum Venus Series UN1245 | |
* ... kleinere Werte sind besser
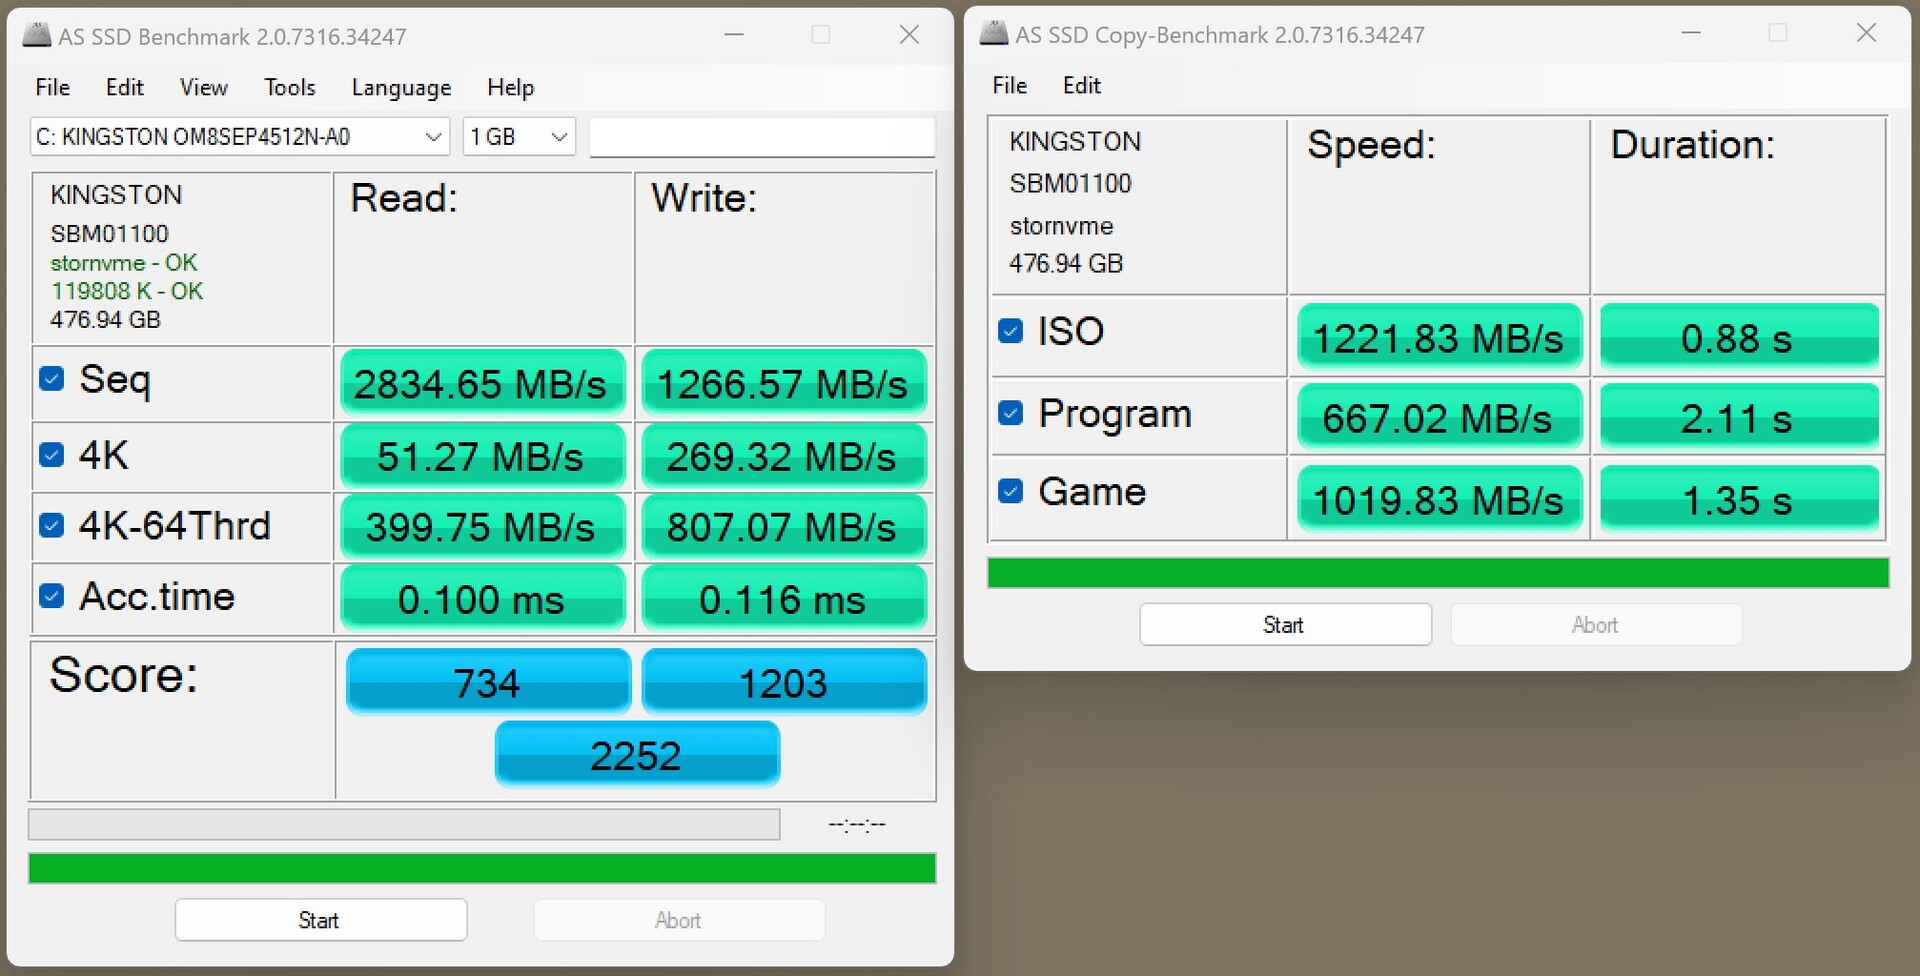
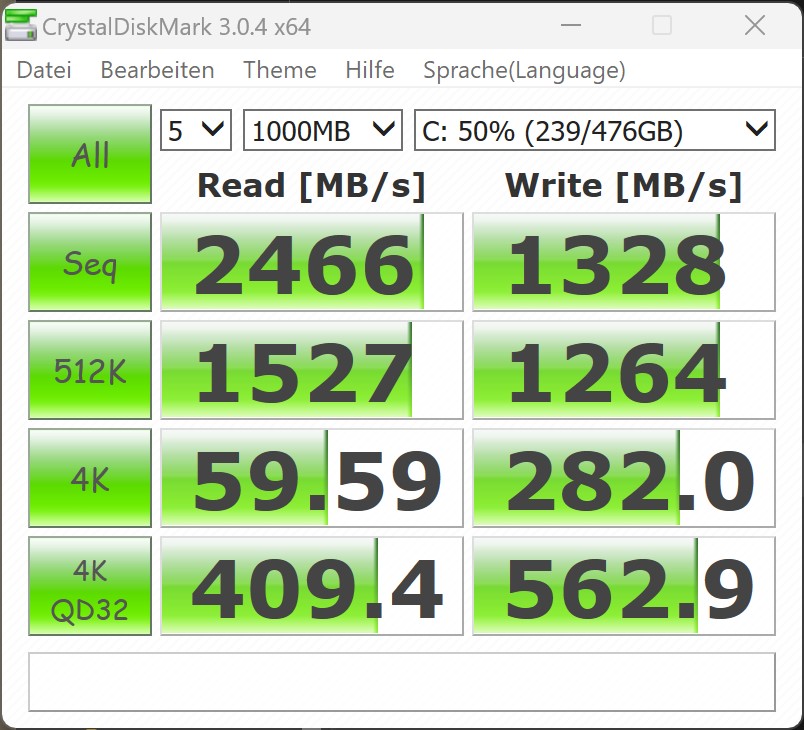
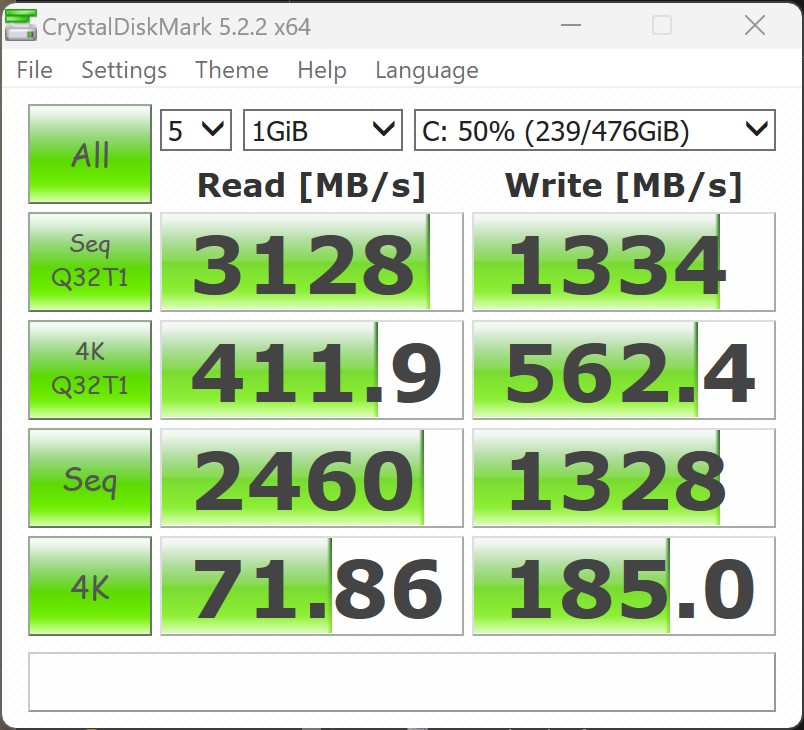
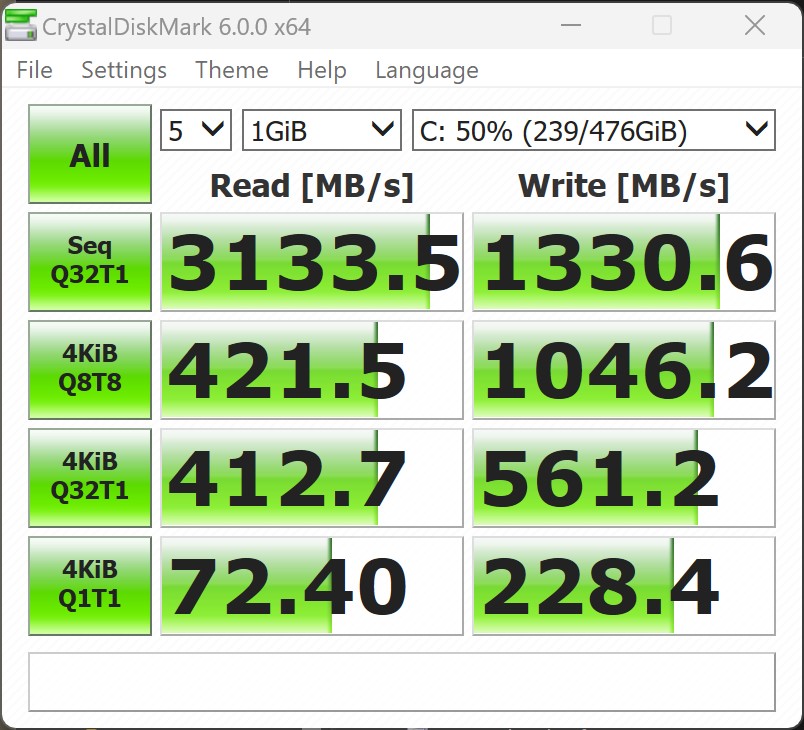
Massenspeicher
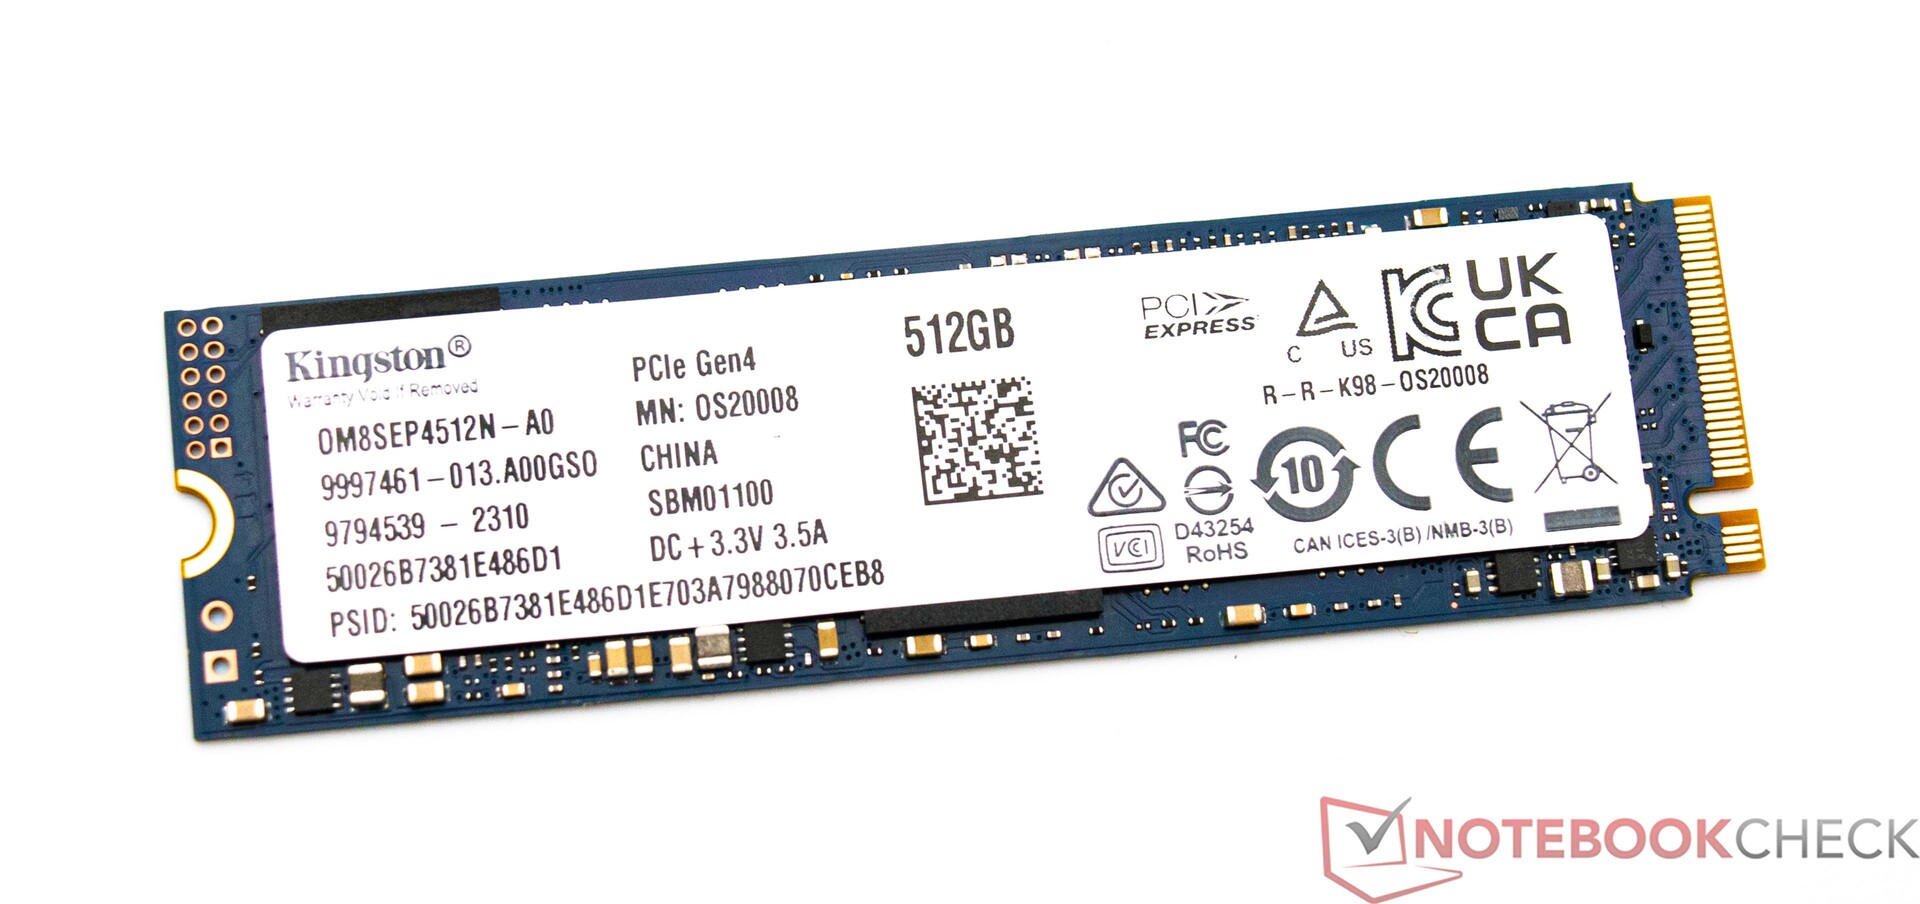
Geekom verpasst dem Mini IT12 eine bereits bekannte 512-GB-NVMe-SSD aus dem Hause Kingston. Das Modell haben wir bereits in anderen Systemen im Einsatz gesehen. Das SSD-Modell nutzt die NVMe-Schnittstelle und ist mit QLC-Speicher bestückt und mit PCIe 4.0x4 angebunden. Im Test kann die SSD jedoch nicht mit den Kontrahenten mithalten. Diese sind teilweise mit deutlich schnelleren SSDs ausgestattet. Im Alltag sollte es aber nicht zu einer spürbaren Leistungseinschränkung kommen. Die Schreib- und Leseraten sind schnell genug und auch das Installieren unserer Testprogramme war rasch erledigt. Dauerhafte Belastung steckt die SSD dank der passiven Kühlung über die Bodenplatte gut weg. Wir verzeichnen keine Leistungseinbrüche unter Last. Im Geekom Mini IT12 lassen sich bis zu drei Massenspeicher unterbringen. Neben der NVMe-SSD kann noch eine weitere SSD im M.2-2242-Format eingebaut werden. Hier muss man sich allerdings mit SATA-Geschwindigkeit zufriedengeben. Des Weiteren lässt sich auch ein 2,5-Zoll-Massenspeicher im Gerät unterbringen. Die maximale Bauhöhe von 7 Millimetern muss jedoch beachtet werden.
Für weitere Vergleiche und Benchmarks verweisen wir auf unsere Vergleichstabelle.


* ... kleinere Werte sind besser
Dauerleistung Lesen: DiskSpd Read Loop, Queue Depth 8
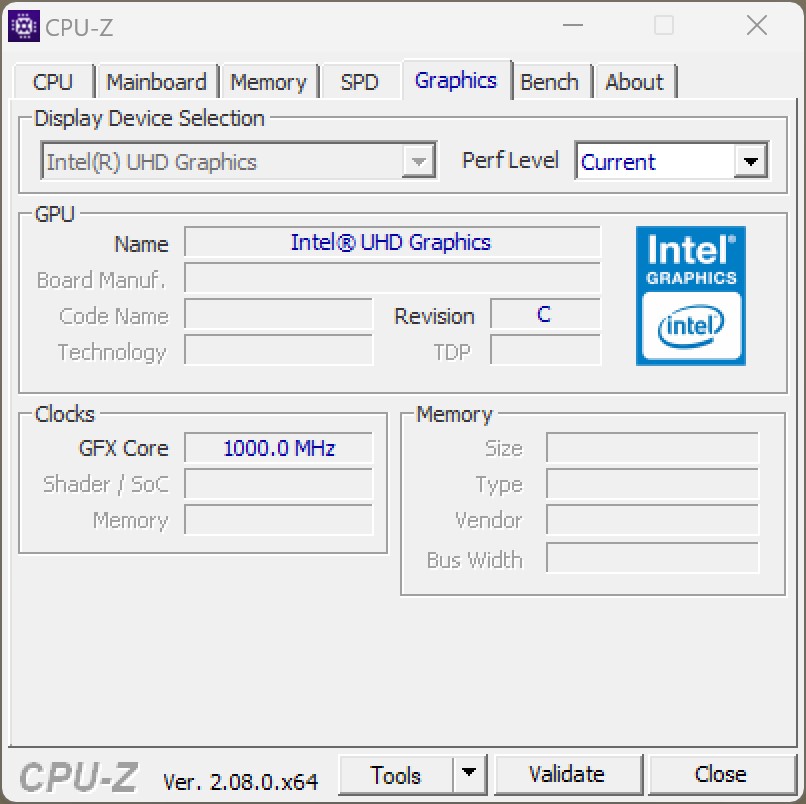
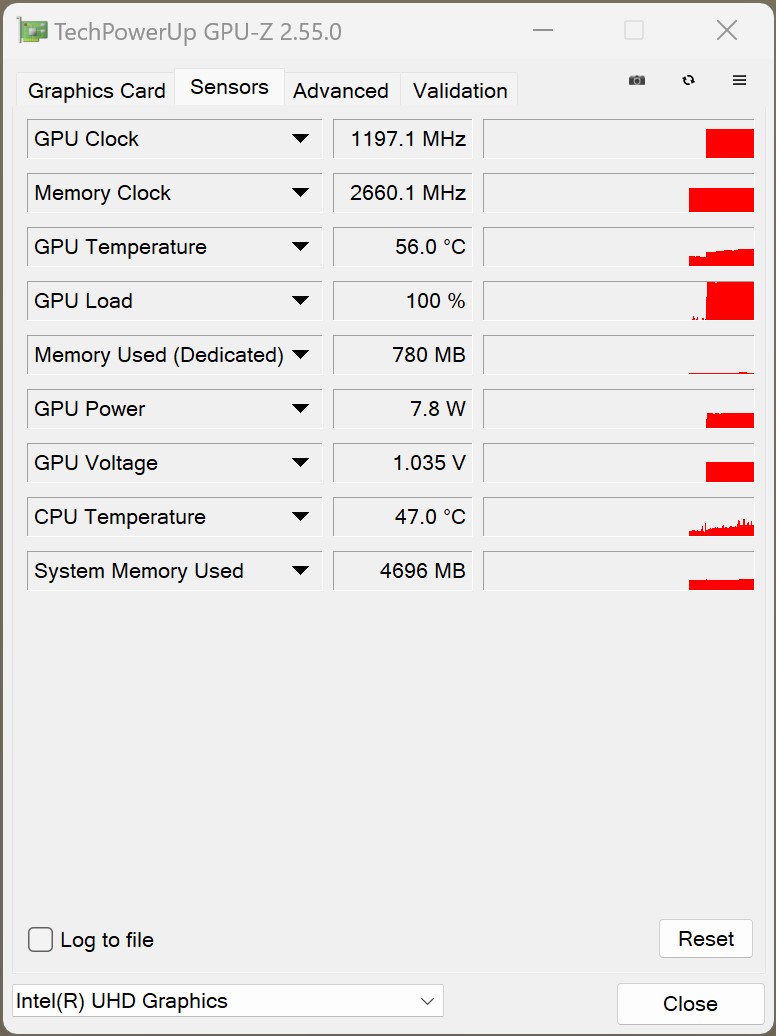
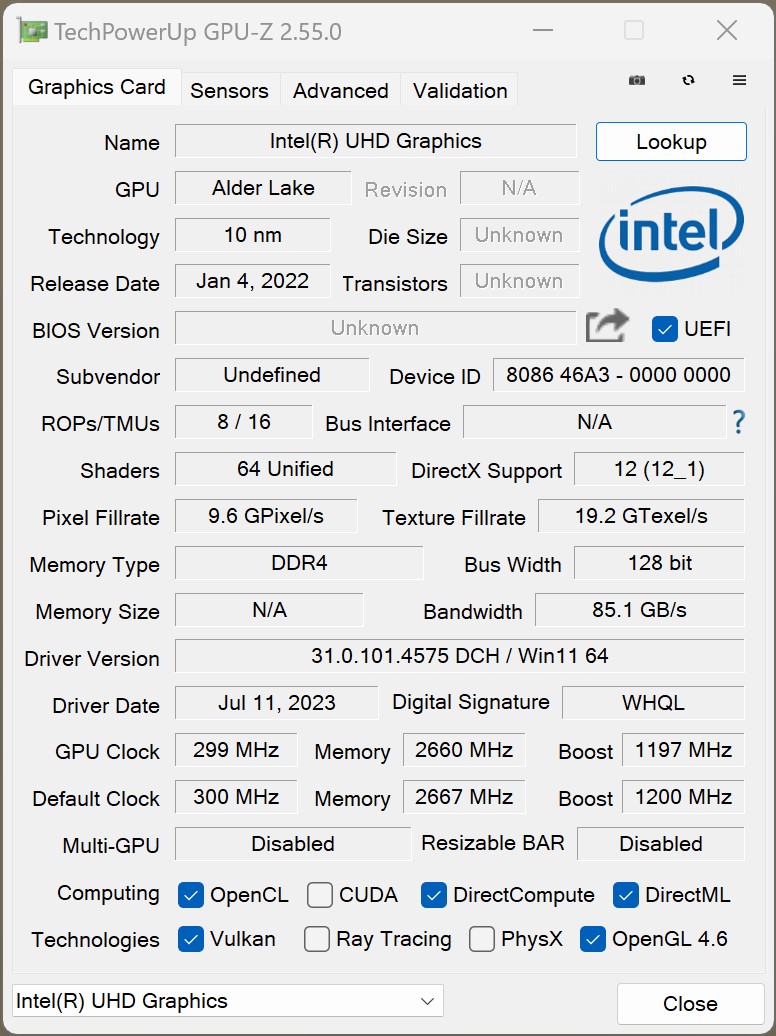
Grafikkarte
Mit der Intel UHD Graphics bekommt der Geekom Mini IT12 nur eine einfache iGPU mit 64 EUs verpasst. Die Leistung der integrierten Grafikeinheit unseres Testsamples liegt auf dem gleichen Niveau wie beim Minisforum Venus Series UN1245 und dem NiPoGi CK10. Gegenüber dem Geekom Mini IT12 mit Intel Core i7-1260P ergibt sich ein deutlicher Unterschied, da Intel bei den etwas schnelleren Prozessoren eine iGPU mit 96 EUs verbaut. Spürbar mehr Leistung kann man mit AMDs Radeon 680M oder der AMD Radeon 780M erwarten.
Weitere Vergleiche und Benchmarks entnehmen Sie bitte unserer GPU-Vergleichstabelle.
| 3DMark 05 Standard | 37574 Punkte | |
| 3DMark 06 Standard Score | 23680 Punkte | |
| 3DMark Vantage P Result | 15554 Punkte | |
| 3DMark 11 Performance | 4450 Punkte | |
| 3DMark Ice Storm Standard Score | 111432 Punkte | |
| 3DMark Cloud Gate Standard Score | 18265 Punkte | |
| 3DMark Fire Strike Score | 2879 Punkte | |
| 3DMark Fire Strike Extreme Score | 1348 Punkte | |
| 3DMark Time Spy Score | 982 Punkte | |
Hilfe | ||
Gaming Performance - iGPU
Die eingeschränkte 3D-Leistung der Intel UHD Graphics lässt keine Freude bei aufwendigen 3D-Spielen aufkommen. Der Einsatzzweck des Geekom Mini IT12 zielt auch gar nicht darauf ab. Mit Einschränkungen kann man jedoch das ein oder andere Spiel als Zeitvertreib mit dem Mini-PC spielen. Mehr 3D-Leistung bekommt man aktuell mit dem Minisforum UM790 Pro mit AMD Radeon 780M. Aber auch Geekom selbst hat mit dem AS 6 einen kompakten Mini PC im Portfolio, welcher mit dem AMD Ryzen 9 6900HX und der AMD Radeon 680M eine bessere Spieleleistung bietet. Wer einen kompakten PC mit dedizierter Grafikkarte sucht, sollte sich den Minisforum HX77G sowie den Minisforum NUCXi7 einmal genauer anschauen.
| min. | mittel | hoch | max. | |
|---|---|---|---|---|
| GTA V (2015) | 108.9 | 90.1 | 14.4 | 6.18 |
| The Witcher 3 (2015) | 60.8 | 37.5 | 20 | 10.2 |
| Dota 2 Reborn (2015) | 115.2 | 84.1 | 44.4 | 41 |
| X-Plane 11.11 (2018) | 36.8 | 24.4 | 21.9 | |
| Far Cry 5 (2018) | 36 | 17 | 16 | 15 |
| Strange Brigade (2018) | 63.4 | 25.1 | 19.9 | 16.8 |
| Shadow of the Tomb Raider (2018) | 34.2 | 15.3 | 14.1 | |
| Far Cry New Dawn (2019) | 35 | 17 | 16 | 15 |
| Metro Exodus (2019) | 27.5 | 12.9 | 9.61 | 7.86 |
| Borderlands 3 (2019) | 32.2 | 14.2 | 8.51 | 6.17 |
| F1 2021 (2021) | 69.2 | 31.1 | 24.8 | 16.1 |
| F1 22 (2022) | 27.3 | 24.5 | 17.5 | 13.5 |
| F1 23 (2023) | 24.6 | 22.1 | 15.2 |
3D-Performance via eGPU-Dock mit Nvidia GeForce RTX 3060 Ti
Da der Geekom Mini IT12 über zwei USB-4-Anschlüsse verfügt, schauen wir uns die Leistung zusammen mit dem Razer Core X und einer Nvidia GeForce RTX 3060 Ti an. Mit dieser Kombination lässt sich die 3D-Leistung spürbar verbessern. Aufgrund der Bandbreitenlimitierung (PCIe x4 3.0) ist die Leistung der dedizierten Grafikkarte nicht mit einem herkömmlichen Desktop-System vergleichbar. Im Test dokumentieren wir eine ähnliche Leistung wir bei anderen Mini-PCs, welche wir mit gleichem Zubehör getestet haben. Grundsätzlich funktioniert diese Kombination gut. Viele Spiele lassen sich mit diesem Zubehör mit adäquaten Frameraten und maximalen Details flüssig spielen.
| Performance Rating - Percent | |
| Intel NUC 13 Pro Kit NUC13ANK (Nvidia GeForce RTX 3060 Ti FE TB3) | |
| Geekom Mini IT12 (Nvidia GeForce RTX 3060 Ti FE TB3) | |
| Geekbench Mini IT12 (Nvidia GeForce RTX 3060 Ti FE) | |
| Morefine M600 (Nvidia GeForce RTX 3060 Ti FE TB3) | |
| Minisforum Venus Series UM690 (Nvidia GeForce RTX 3060 Ti FE TB3) | |
| Minisforum Venus Series UM790 Pro (Nvidia GeForce RTX 3060 Ti FE TB3) | |
| Ace Magician AM08Pro (Nvidia GeForce RTX 3060 Ti FE TB3) | |
| 3DMark 11 - 1280x720 Performance GPU | |
| Geekbench Mini IT12 (Nvidia GeForce RTX 3060 Ti FE) | |
| Intel NUC 13 Pro Kit NUC13ANK (Nvidia GeForce RTX 3060 Ti FE TB3) | |
| Geekom Mini IT12 (Nvidia GeForce RTX 3060 Ti FE TB3) | |
| Minisforum Venus Series UM790 Pro (Nvidia GeForce RTX 3060 Ti FE TB3) | |
| Morefine M600 (Nvidia GeForce RTX 3060 Ti FE TB3) | |
| Ace Magician AM08Pro (Nvidia GeForce RTX 3060 Ti FE TB3) | |
| Minisforum Venus Series UM690 (Nvidia GeForce RTX 3060 Ti FE TB3) | |
| 3DMark | |
| 2560x1440 Time Spy Graphics | |
| Geekbench Mini IT12 (Nvidia GeForce RTX 3060 Ti FE) | |
| Intel NUC 13 Pro Kit NUC13ANK (Nvidia GeForce RTX 3060 Ti FE TB3) | |
| Geekom Mini IT12 (Nvidia GeForce RTX 3060 Ti FE TB3) | |
| Morefine M600 (Nvidia GeForce RTX 3060 Ti FE TB3) | |
| Minisforum Venus Series UM790 Pro (Nvidia GeForce RTX 3060 Ti FE TB3) | |
| Ace Magician AM08Pro (Nvidia GeForce RTX 3060 Ti FE TB3) | |
| Minisforum Venus Series UM690 (Nvidia GeForce RTX 3060 Ti FE TB3) | |
| 1920x1080 Fire Strike Graphics | |
| Intel NUC 13 Pro Kit NUC13ANK (Nvidia GeForce RTX 3060 Ti FE TB3) | |
| Geekbench Mini IT12 (Nvidia GeForce RTX 3060 Ti FE) | |
| Geekom Mini IT12 (Nvidia GeForce RTX 3060 Ti FE TB3) | |
| Morefine M600 (Nvidia GeForce RTX 3060 Ti FE TB3) | |
| Ace Magician AM08Pro (Nvidia GeForce RTX 3060 Ti FE TB3) | |
| Minisforum Venus Series UM790 Pro (Nvidia GeForce RTX 3060 Ti FE TB3) | |
| Minisforum Venus Series UM690 (Nvidia GeForce RTX 3060 Ti FE TB3) | |
| 3840x2160 Fire Strike Ultra Graphics | |
| Geekbench Mini IT12 (Nvidia GeForce RTX 3060 Ti FE) | |
| Geekom Mini IT12 (Nvidia GeForce RTX 3060 Ti FE TB3) | |
| Morefine M600 (Nvidia GeForce RTX 3060 Ti FE TB3) | |
| Intel NUC 13 Pro Kit NUC13ANK (Nvidia GeForce RTX 3060 Ti FE TB3) | |
| Minisforum Venus Series UM790 Pro (Nvidia GeForce RTX 3060 Ti FE TB3) | |
| Ace Magician AM08Pro (Nvidia GeForce RTX 3060 Ti FE TB3) | |
| Minisforum Venus Series UM690 (Nvidia GeForce RTX 3060 Ti FE TB3) | |
| Unigine Superposition | |
| 1280x720 720p Low | |
| Minisforum Venus Series UM790 Pro (Nvidia GeForce RTX 3060 Ti FE TB3) | |
| Intel NUC 13 Pro Kit NUC13ANK (Nvidia GeForce RTX 3060 Ti FE TB3) | |
| Geekom Mini IT12 (Nvidia GeForce RTX 3060 Ti FE TB3) | |
| Minisforum Venus Series UM690 (Nvidia GeForce RTX 3060 Ti FE TB3) | |
| Ace Magician AM08Pro (Nvidia GeForce RTX 3060 Ti FE TB3) | |
| Morefine M600 (Nvidia GeForce RTX 3060 Ti FE TB3) | |
| Geekbench Mini IT12 (Nvidia GeForce RTX 3060 Ti FE) | |
| 1920x1080 1080p High | |
| Intel NUC 13 Pro Kit NUC13ANK (Nvidia GeForce RTX 3060 Ti FE TB3) | |
| Geekbench Mini IT12 (Nvidia GeForce RTX 3060 Ti FE) | |
| Geekom Mini IT12 (Nvidia GeForce RTX 3060 Ti FE TB3) | |
| Morefine M600 (Nvidia GeForce RTX 3060 Ti FE TB3) | |
| Minisforum Venus Series UM690 (Nvidia GeForce RTX 3060 Ti FE TB3) | |
| Ace Magician AM08Pro (Nvidia GeForce RTX 3060 Ti FE TB3) | |
| Minisforum Venus Series UM790 Pro (Nvidia GeForce RTX 3060 Ti FE TB3) | |
| 1920x1080 1080p Extreme | |
| Geekom Mini IT12 (Nvidia GeForce RTX 3060 Ti FE TB3) | |
| Intel NUC 13 Pro Kit NUC13ANK (Nvidia GeForce RTX 3060 Ti FE TB3) | |
| Geekbench Mini IT12 (Nvidia GeForce RTX 3060 Ti FE) | |
| Morefine M600 (Nvidia GeForce RTX 3060 Ti FE TB3) | |
| Minisforum Venus Series UM690 (Nvidia GeForce RTX 3060 Ti FE TB3) | |
| Ace Magician AM08Pro (Nvidia GeForce RTX 3060 Ti FE TB3) | |
| Minisforum Venus Series UM790 Pro (Nvidia GeForce RTX 3060 Ti FE TB3) | |
| 3840x2160 4k Optimized | |
| Geekom Mini IT12 (Nvidia GeForce RTX 3060 Ti FE TB3) | |
| Intel NUC 13 Pro Kit NUC13ANK (Nvidia GeForce RTX 3060 Ti FE TB3) | |
| Geekbench Mini IT12 (Nvidia GeForce RTX 3060 Ti FE) | |
| Morefine M600 (Nvidia GeForce RTX 3060 Ti FE TB3) | |
| Minisforum Venus Series UM690 (Nvidia GeForce RTX 3060 Ti FE TB3) | |
| Ace Magician AM08Pro (Nvidia GeForce RTX 3060 Ti FE TB3) | |
| Minisforum Venus Series UM790 Pro (Nvidia GeForce RTX 3060 Ti FE TB3) | |
| 7680x4320 8k Optimized | |
| Geekom Mini IT12 (Nvidia GeForce RTX 3060 Ti FE TB3) | |
| Morefine M600 (Nvidia GeForce RTX 3060 Ti FE TB3) | |
| Geekbench Mini IT12 (Nvidia GeForce RTX 3060 Ti FE) | |
| Intel NUC 13 Pro Kit NUC13ANK (Nvidia GeForce RTX 3060 Ti FE TB3) | |
| Minisforum Venus Series UM690 (Nvidia GeForce RTX 3060 Ti FE TB3) | |
| Ace Magician AM08Pro (Nvidia GeForce RTX 3060 Ti FE TB3) | |
| Minisforum Venus Series UM790 Pro (Nvidia GeForce RTX 3060 Ti FE TB3) | |
| Unigine Valley 1.0 | |
| 1920x1080 Extreme HD DirectX AA:x8 | |
| Intel NUC 13 Pro Kit NUC13ANK (Nvidia GeForce RTX 3060 Ti FE TB3) | |
| Geekom Mini IT12 (Nvidia GeForce RTX 3060 Ti FE TB3) | |
| Geekbench Mini IT12 (Nvidia GeForce RTX 3060 Ti FE) | |
| Minisforum Venus Series UM690 (Nvidia GeForce RTX 3060 Ti FE TB3) | |
| Minisforum Venus Series UM790 Pro (Nvidia GeForce RTX 3060 Ti FE TB3) | |
| Morefine M600 (Nvidia GeForce RTX 3060 Ti FE TB3) | |
| Ace Magician AM08Pro (Nvidia GeForce RTX 3060 Ti FE TB3) | |
| 1920x1080 Extreme HD Preset OpenGL AA:x8 | |
| Geekbench Mini IT12 (Nvidia GeForce RTX 3060 Ti FE) | |
| Intel NUC 13 Pro Kit NUC13ANK (Nvidia GeForce RTX 3060 Ti FE TB3) | |
| Geekom Mini IT12 (Nvidia GeForce RTX 3060 Ti FE TB3) | |
| Minisforum Venus Series UM690 (Nvidia GeForce RTX 3060 Ti FE TB3) | |
| Morefine M600 (Nvidia GeForce RTX 3060 Ti FE TB3) | |
| Ace Magician AM08Pro (Nvidia GeForce RTX 3060 Ti FE TB3) | |
| Minisforum Venus Series UM790 Pro (Nvidia GeForce RTX 3060 Ti FE TB3) | |
| Unigine Heaven 4.0 | |
| Extreme Preset OpenGL | |
| Intel NUC 13 Pro Kit NUC13ANK (Nvidia GeForce RTX 3060 Ti FE TB3) | |
| Geekom Mini IT12 (Nvidia GeForce RTX 3060 Ti FE TB3) | |
| Geekbench Mini IT12 (Nvidia GeForce RTX 3060 Ti FE) | |
| Minisforum Venus Series UM690 (Nvidia GeForce RTX 3060 Ti FE TB3) | |
| Morefine M600 (Nvidia GeForce RTX 3060 Ti FE TB3) | |
| Ace Magician AM08Pro (Nvidia GeForce RTX 3060 Ti FE TB3) | |
| Minisforum Venus Series UM790 Pro (Nvidia GeForce RTX 3060 Ti FE TB3) | |
| Extreme Preset DX11 | |
| Intel NUC 13 Pro Kit NUC13ANK (Nvidia GeForce RTX 3060 Ti FE TB3) | |
| Geekom Mini IT12 (Nvidia GeForce RTX 3060 Ti FE TB3) | |
| Geekbench Mini IT12 (Nvidia GeForce RTX 3060 Ti FE) | |
| Minisforum Venus Series UM690 (Nvidia GeForce RTX 3060 Ti FE TB3) | |
| Morefine M600 (Nvidia GeForce RTX 3060 Ti FE TB3) | |
| Ace Magician AM08Pro (Nvidia GeForce RTX 3060 Ti FE TB3) | |
| Minisforum Venus Series UM790 Pro (Nvidia GeForce RTX 3060 Ti FE TB3) | |
| ComputeMark v2.1 | |
| 1024x600 Normal, Score | |
| Geekom Mini IT12 (Nvidia GeForce RTX 3060 Ti FE TB3) | |
| Morefine M600 (Nvidia GeForce RTX 3060 Ti FE TB3) | |
| Minisforum Venus Series UM790 Pro (Nvidia GeForce RTX 3060 Ti FE TB3) | |
| Intel NUC 13 Pro Kit NUC13ANK (Nvidia GeForce RTX 3060 Ti FE TB3) | |
| Minisforum Venus Series UM690 (Nvidia GeForce RTX 3060 Ti FE TB3) | |
| Geekbench Mini IT12 (Nvidia GeForce RTX 3060 Ti FE) | |
| Ace Magician AM08Pro (Nvidia GeForce RTX 3060 Ti FE TB3) | |
| 1024x600 Normal, Fluid 3DTex | |
| Morefine M600 (Nvidia GeForce RTX 3060 Ti FE TB3) | |
| Intel NUC 13 Pro Kit NUC13ANK (Nvidia GeForce RTX 3060 Ti FE TB3) | |
| Geekom Mini IT12 (Nvidia GeForce RTX 3060 Ti FE TB3) | |
| Geekbench Mini IT12 (Nvidia GeForce RTX 3060 Ti FE) | |
| Minisforum Venus Series UM790 Pro (Nvidia GeForce RTX 3060 Ti FE TB3) | |
| Minisforum Venus Series UM690 (Nvidia GeForce RTX 3060 Ti FE TB3) | |
| Ace Magician AM08Pro (Nvidia GeForce RTX 3060 Ti FE TB3) | |
| 1024x600 Normal, Fluid 2DTexArr | |
| Morefine M600 (Nvidia GeForce RTX 3060 Ti FE TB3) | |
| Geekom Mini IT12 (Nvidia GeForce RTX 3060 Ti FE TB3) | |
| Minisforum Venus Series UM690 (Nvidia GeForce RTX 3060 Ti FE TB3) | |
| Intel NUC 13 Pro Kit NUC13ANK (Nvidia GeForce RTX 3060 Ti FE TB3) | |
| Minisforum Venus Series UM790 Pro (Nvidia GeForce RTX 3060 Ti FE TB3) | |
| Geekbench Mini IT12 (Nvidia GeForce RTX 3060 Ti FE) | |
| Ace Magician AM08Pro (Nvidia GeForce RTX 3060 Ti FE TB3) | |
| 1024x600 Normal, Mandel Vector | |
| Geekom Mini IT12 (Nvidia GeForce RTX 3060 Ti FE TB3) | |
| Minisforum Venus Series UM790 Pro (Nvidia GeForce RTX 3060 Ti FE TB3) | |
| Intel NUC 13 Pro Kit NUC13ANK (Nvidia GeForce RTX 3060 Ti FE TB3) | |
| Morefine M600 (Nvidia GeForce RTX 3060 Ti FE TB3) | |
| Minisforum Venus Series UM690 (Nvidia GeForce RTX 3060 Ti FE TB3) | |
| Geekbench Mini IT12 (Nvidia GeForce RTX 3060 Ti FE) | |
| Ace Magician AM08Pro (Nvidia GeForce RTX 3060 Ti FE TB3) | |
| 1024x600 Normal, Mandel Scalar | |
| Geekom Mini IT12 (Nvidia GeForce RTX 3060 Ti FE TB3) | |
| Morefine M600 (Nvidia GeForce RTX 3060 Ti FE TB3) | |
| Minisforum Venus Series UM790 Pro (Nvidia GeForce RTX 3060 Ti FE TB3) | |
| Intel NUC 13 Pro Kit NUC13ANK (Nvidia GeForce RTX 3060 Ti FE TB3) | |
| Minisforum Venus Series UM690 (Nvidia GeForce RTX 3060 Ti FE TB3) | |
| Geekbench Mini IT12 (Nvidia GeForce RTX 3060 Ti FE) | |
| Ace Magician AM08Pro (Nvidia GeForce RTX 3060 Ti FE TB3) | |
| 1024x600 Normal, QJuliaRayTrace | |
| Geekom Mini IT12 (Nvidia GeForce RTX 3060 Ti FE TB3) | |
| Intel NUC 13 Pro Kit NUC13ANK (Nvidia GeForce RTX 3060 Ti FE TB3) | |
| Minisforum Venus Series UM790 Pro (Nvidia GeForce RTX 3060 Ti FE TB3) | |
| Morefine M600 (Nvidia GeForce RTX 3060 Ti FE TB3) | |
| Minisforum Venus Series UM690 (Nvidia GeForce RTX 3060 Ti FE TB3) | |
| Geekbench Mini IT12 (Nvidia GeForce RTX 3060 Ti FE) | |
| Ace Magician AM08Pro (Nvidia GeForce RTX 3060 Ti FE TB3) | |
| Performance Rating - Percent | |
| Intel NUC 13 Pro Kit NUC13ANK (Nvidia GeForce RTX 3060 Ti FE TB3) | |
| Geekom Mini IT12 (Nvidia GeForce RTX 3060 Ti FE TB3) | |
| Geekom AS 6 (Nvidia GeForce RTX 3060 Ti FE TB3) | |
| Minisforum Venus Series UM790 Pro (Nvidia GeForce RTX 3060 Ti FE TB3) | |
| Ace Magician AM08Pro (Nvidia GeForce RTX 3060 Ti FE TB3) | |
| Geekbench Mini IT12 (Nvidia GeForce RTX 3060 Ti FE) | |
| GTA V - 1920x1080 Highest AA:4xMSAA + FX AF:16x | |
| Intel NUC 13 Pro Kit NUC13ANK (Nvidia GeForce RTX 3060 Ti FE TB3) | |
| Geekom Mini IT12 (Nvidia GeForce RTX 3060 Ti FE TB3) | |
| Geekom AS 6 (Nvidia GeForce RTX 3060 Ti FE TB3) | |
| Ace Magician AM08Pro (Nvidia GeForce RTX 3060 Ti FE TB3) | |
| Geekbench Mini IT12 (Nvidia GeForce RTX 3060 Ti FE) | |
| Minisforum Venus Series UM790 Pro (Nvidia GeForce RTX 3060 Ti FE TB3) | |
| The Witcher 3 - 1920x1080 Ultra Graphics & Postprocessing (HBAO+) | |
| Intel NUC 13 Pro Kit NUC13ANK (Nvidia GeForce RTX 3060 Ti FE TB3) | |
| Geekom Mini IT12 (Nvidia GeForce RTX 3060 Ti FE TB3) | |
| Geekbench Mini IT12 (Nvidia GeForce RTX 3060 Ti FE) | |
| Geekom AS 6 (Nvidia GeForce RTX 3060 Ti FE TB3) | |
| Minisforum Venus Series UM790 Pro (Nvidia GeForce RTX 3060 Ti FE TB3) | |
| Ace Magician AM08Pro (Nvidia GeForce RTX 3060 Ti FE TB3) | |
| Dota 2 Reborn - 1920x1080 ultra (3/3) best looking | |
| Minisforum Venus Series UM790 Pro (Nvidia GeForce RTX 3060 Ti FE TB3) | |
| Intel NUC 13 Pro Kit NUC13ANK (Nvidia GeForce RTX 3060 Ti FE TB3) | |
| Geekom Mini IT12 (Nvidia GeForce RTX 3060 Ti FE TB3) | |
| Geekom AS 6 (Nvidia GeForce RTX 3060 Ti FE TB3) | |
| Geekbench Mini IT12 (Nvidia GeForce RTX 3060 Ti FE) | |
| Ace Magician AM08Pro (Nvidia GeForce RTX 3060 Ti FE TB3) | |
| Final Fantasy XV Benchmark - 1920x1080 High Quality | |
| Geekom AS 6 (Nvidia GeForce RTX 3060 Ti FE TB3) | |
| Intel NUC 13 Pro Kit NUC13ANK (Nvidia GeForce RTX 3060 Ti FE TB3) | |
| Geekom Mini IT12 (Nvidia GeForce RTX 3060 Ti FE TB3) | |
| Minisforum Venus Series UM790 Pro (Nvidia GeForce RTX 3060 Ti FE TB3) | |
| Ace Magician AM08Pro (Nvidia GeForce RTX 3060 Ti FE TB3) | |
| Geekbench Mini IT12 (Nvidia GeForce RTX 3060 Ti FE) | |
| Strange Brigade - 1920x1080 ultra AA:ultra AF:16 | |
| Geekom AS 6 (Nvidia GeForce RTX 3060 Ti FE TB3) | |
| Intel NUC 13 Pro Kit NUC13ANK (Nvidia GeForce RTX 3060 Ti FE TB3) | |
| Geekom Mini IT12 (Nvidia GeForce RTX 3060 Ti FE TB3) | |
| Minisforum Venus Series UM790 Pro (Nvidia GeForce RTX 3060 Ti FE TB3) | |
| Ace Magician AM08Pro (Nvidia GeForce RTX 3060 Ti FE TB3) | |
| Geekbench Mini IT12 (Nvidia GeForce RTX 3060 Ti FE) | |
| Far Cry 5 - 1920x1080 Ultra Preset AA:T | |
| Intel NUC 13 Pro Kit NUC13ANK (Nvidia GeForce RTX 3060 Ti FE TB3) | |
| Minisforum Venus Series UM790 Pro (Nvidia GeForce RTX 3060 Ti FE TB3) | |
| Geekom Mini IT12 (Nvidia GeForce RTX 3060 Ti FE TB3) | |
| Ace Magician AM08Pro (Nvidia GeForce RTX 3060 Ti FE TB3) | |
| Geekom AS 6 (Nvidia GeForce RTX 3060 Ti FE TB3) | |
| Geekbench Mini IT12 (Nvidia GeForce RTX 3060 Ti FE) | |
| Far Cry New Dawn - 1920x1080 Ultra Preset | |
| Geekbench Mini IT12 (Nvidia GeForce RTX 3060 Ti FE) | |
| Intel NUC 13 Pro Kit NUC13ANK (Nvidia GeForce RTX 3060 Ti FE TB3) | |
| Minisforum Venus Series UM790 Pro (Nvidia GeForce RTX 3060 Ti FE TB3) | |
| Geekom Mini IT12 (Nvidia GeForce RTX 3060 Ti FE TB3) | |
| Ace Magician AM08Pro (Nvidia GeForce RTX 3060 Ti FE TB3) | |
| Geekom AS 6 (Nvidia GeForce RTX 3060 Ti FE TB3) | |
| Borderlands 3 - 1920x1080 Badass Overall Quality (DX11) | |
| Geekom Mini IT12 (Nvidia GeForce RTX 3060 Ti FE TB3) | |
| Intel NUC 13 Pro Kit NUC13ANK (Nvidia GeForce RTX 3060 Ti FE TB3) | |
| Geekom AS 6 (Nvidia GeForce RTX 3060 Ti FE TB3) | |
| Minisforum Venus Series UM790 Pro (Nvidia GeForce RTX 3060 Ti FE TB3) | |
| Ace Magician AM08Pro (Nvidia GeForce RTX 3060 Ti FE TB3) | |
| Geekbench Mini IT12 (Nvidia GeForce RTX 3060 Ti FE) | |
| F1 22 - 1920x1080 Ultra High Preset AA:T AF:16x | |
| Geekom AS 6 (Nvidia GeForce RTX 3060 Ti FE TB3) | |
| Intel NUC 13 Pro Kit NUC13ANK (Nvidia GeForce RTX 3060 Ti FE TB3) | |
| Geekbench Mini IT12 (Nvidia GeForce RTX 3060 Ti FE) | |
| Geekom Mini IT12 (Nvidia GeForce RTX 3060 Ti FE TB3) | |
| Minisforum Venus Series UM790 Pro (Nvidia GeForce RTX 3060 Ti FE TB3) | |
| Ace Magician AM08Pro (Nvidia GeForce RTX 3060 Ti FE TB3) | |
| Tiny Tina's Wonderlands - 1920x1080 Badass Preset (DX12) | |
| Geekom AS 6 (Nvidia GeForce RTX 3060 Ti FE TB3) | |
| Geekom Mini IT12 (Nvidia GeForce RTX 3060 Ti FE TB3) | |
| Intel NUC 13 Pro Kit NUC13ANK (Nvidia GeForce RTX 3060 Ti FE TB3) | |
| Minisforum Venus Series UM790 Pro (Nvidia GeForce RTX 3060 Ti FE TB3) | |
| Ace Magician AM08Pro (Nvidia GeForce RTX 3060 Ti FE TB3) | |
| Geekbench Mini IT12 (Nvidia GeForce RTX 3060 Ti FE) | |
| Shadow of the Tomb Raider - 1920x1080 Highest Preset AA:T | |
| Geekom AS 6 (Nvidia GeForce RTX 3060 Ti FE TB3) | |
| Geekom Mini IT12 (Nvidia GeForce RTX 3060 Ti FE TB3) | |
| Geekbench Mini IT12 (Nvidia GeForce RTX 3060 Ti FE) | |
| Intel NUC 13 Pro Kit NUC13ANK (Nvidia GeForce RTX 3060 Ti FE TB3) | |
| Minisforum Venus Series UM790 Pro (Nvidia GeForce RTX 3060 Ti FE TB3) | |
| Ace Magician AM08Pro (Nvidia GeForce RTX 3060 Ti FE TB3) | |
| Metro Exodus - 1920x1080 Ultra Quality AF:16x | |
| Intel NUC 13 Pro Kit NUC13ANK (Nvidia GeForce RTX 3060 Ti FE TB3) | |
| Geekom Mini IT12 (Nvidia GeForce RTX 3060 Ti FE TB3) | |
| Geekom AS 6 (Nvidia GeForce RTX 3060 Ti FE TB3) | |
| Minisforum Venus Series UM790 Pro (Nvidia GeForce RTX 3060 Ti FE TB3) | |
| Ace Magician AM08Pro (Nvidia GeForce RTX 3060 Ti FE TB3) | |
| Geekbench Mini IT12 (Nvidia GeForce RTX 3060 Ti FE) | |
| God of War - 1920x1080 Ultra Preset | |
| Geekom Mini IT12 (Nvidia GeForce RTX 3060 Ti FE TB3) | |
| Geekom AS 6 (Nvidia GeForce RTX 3060 Ti FE TB3) | |
| Intel NUC 13 Pro Kit NUC13ANK (Nvidia GeForce RTX 3060 Ti FE TB3) | |
| Minisforum Venus Series UM790 Pro (Nvidia GeForce RTX 3060 Ti FE TB3) | |
| Geekbench Mini IT12 (Nvidia GeForce RTX 3060 Ti FE) | |
| Ace Magician AM08Pro (Nvidia GeForce RTX 3060 Ti FE TB3) | |
| min. | mittel | hoch | max. | QHD | 4K | |
|---|---|---|---|---|---|---|
| GTA V (2015) | 175 | 169.3 | 152.3 | 91.6 | 86.9 | 102.8 |
| The Witcher 3 (2015) | 286 | 212 | 153.9 | 73.5 | 63.6 | 72.9 |
| Dota 2 Reborn (2015) | 155.9 | 138.1 | 127.2 | 120.9 | 102.6 | |
| Final Fantasy XV Benchmark (2018) | 144.7 | 87.9 | 64.1 | 43.5 | 23.7 | |
| Far Cry 5 (2018) | 127 | 89 | 84 | 80 | 50 | 24 |
| Strange Brigade (2018) | 176.3 | 121.6 | 112.2 | 107.6 | 74.1 | 32.8 |
| Shadow of the Tomb Raider (2018) | 145.3 | 102.6 | 100.1 | 92.8 | 76.1 | 50.1 |
| Far Cry New Dawn (2019) | 130 | 115 | 110 | 100 | 94 | 60 |
| Metro Exodus (2019) | 111.3 | 53.6 | 49.2 | 40.3 | 31.5 | 19.9 |
| Borderlands 3 (2019) | 121.8 | 82.5 | 65.6 | 55.9 | 38.8 | 21.5 |
| F1 2020 (2020) | 194.1 | 115.2 | 119.8 | 101.7 | 90.7 | 60 |
| F1 2021 (2021) | 138.2 | 107.2 | 69.4 | 52.5 | 48.7 | 41.3 |
| Far Cry 6 (2021) | 67.7 | 53.3 | 45.5 | 40.2 | 32.8 | |
| God of War (2022) | 108.1 | 97.6 | 81.6 | 60.2 | 53.6 | 39.9 |
| GRID Legends (2022) | 81 | 64.4 | 55.5 | 50.7 | 39 | 23.6 |
| Tiny Tina's Wonderlands (2022) | 103.7 | 84.3 | 64.2 | 55.2 | 39.2 | 21.8 |
| F1 22 (2022) | 60.2 | 55 | 42.6 | 27.9 | 26.1 | 19.7 |
| F1 23 (2023) | 66.8 | 65.4 | 54.1 | 33.5 | 31.2 | 17.7 |
| Intel UHD Graphics 64EUs (Alder Lake 12th Gen) i5-12450H | i5-12450H | Intel Arc A770 R9 7950X | NVIDIA GeForce RTX 2060 Super (Desktop) R9 7950X | NVIDIA GeForce RTX 2070 Super (Desktop) R9 7950X | NVIDIA GeForce RTX 3060 Ti R9 7950X | NVIDIA GeForce RTX 4060 R9 7950X | NVIDIA GeForce RTX 4060 Ti 16G R9 7950X | NVIDIA GeForce RTX 4070 R9 7950X | NVIDIA GeForce RTX 4070 Ti R9 7950X | AMD Radeon RX 7600 R9 7950X | AMD Radeon RX 7700 XT R9 7950X | AMD Radeon RX 7800 XT R9 7950X | AMD Radeon RX 7900 GRE R9 7950X | AMD Radeon RX 6600 R9 7950X | AMD Radeon RX 6650 XT R9 7950X | AMD Radeon RX 6700 XT R9 7950X | AMD Radeon RX 6750 XT R9 7950X | Durchschnitt der Klasse Mini PC | |
|---|---|---|---|---|---|---|---|---|---|---|---|---|---|---|---|---|---|---|---|
| SPECviewperf 12 | 1223% | 581% | 1056% | 1178% | 1354% | 1401% | 1888% | 2558% | 3571% | 2212% | 2928% | 3380% | 3586% | 2436% | 2953% | 3231% | 2707% | 1666% | |
| 1900x1060 3ds Max (3dsmax-05) (fps) | 29.8 | 147 393% | 179 501% | 220 638% | 247 729% | 297 897% | 251 742% | 290 873% | 382 1182% | 436 1363% | 279 836% | 373 1152% | 427 1333% | 444 1390% | 258 766% | 310 940% | 363 1118% | 377 1165% | 152.2 ? 411% |
| 1900x1060 Catia (catia-04) (fps) | 22.9 | 115 402% | 174 660% | 84.5 269% | 114 398% | 114 398% | 113 393% | 128 459% | 161 603% | 192 738% | 273 1092% | 351 1433% | 386 1586% | 448 1856% | 256 1018% | 314 1271% | 339 1380% | 360 1472% | 144.2 ? 530% |
| 1900x1060 Creo (creo-01) (fps) | 17.7 | 59.7 237% | 45.3 156% | 58.8 232% | 65.7 271% | 65.2 268% | 60.6 242% | 73.4 315% | 89.1 403% | 99.4 462% | 115 550% | 123 595% | 148 736% | 155 776% | 133 651% | 142 702% | 152 759% | 154 770% | 71.6 ? 305% |
| 1900x1060 Energy (energy-01) (fps) | 0.24 | 13.4 5483% | 2.44 917% | 11.6 4733% | 12.4 5067% | 14.4 5900% | 15.9 6525% | 22.6 9317% | 31.7 13108% | 48 19900% | 25.5 10525% | 33.4 13817% | 38.4 15900% | 40.3 16692% | 31.3 12942% | 37.6 15567% | 40.6 16817% | 30.1 12442% | 22.7 ? 9358% |
| 1900x1060 Maya (maya-04) (fps) | 22.8 | 203 790% | 183 703% | 200 777% | 225 887% | 251 1001% | 233 922% | 257 1027% | 284 1146% | 287 1159% | 236 935% | 283 1141% | 304 1233% | 323 1317% | 218 856% | 246 979% | 268 1075% | 277 1115% | 130.7 ? 473% |
| 1900x1060 Medical (medical-01) (fps) | 5.07 | 73.5 1350% | 46.7 821% | 49.5 876% | 55.9 1003% | 65.6 1194% | 82.4 1525% | 110 2070% | 132 2504% | 157 2997% | 128 2425% | 177 3391% | 200 3845% | 226 4358% | 102 1912% | 137 2602% | 150 2859% | 144 2740% | 80.8 ? 1494% |
| 1900x1060 Showcase (showcase-01) (fps) | 13.2 | 149 1029% | 119 802% | 121 817% | 135 923% | 150 1036% | 109 726% | 132 900% | 190 1339% | 244 1748% | 127 862% | 179 1256% | 235 1680% | 222 1582% | 125 847% | 151 1044% | 176 1233% | 186 1309% | 84.9 ? 543% |
| 1900x1060 Solidworks (sw-03) (fps) | 38.9 | 78.3 101% | 73.4 89% | 79.7 105% | 95.1 144% | 93.5 140% | 91.2 134% | 95.1 144% | 109 180% | 118 203% | 221 468% | 288 640% | 322 728% | 319 720% | 232 496% | 242 522% | 275 607% | 290 646% | 122.8 ? 216% |
| SPECviewperf 13 | 968% | 900% | 836% | 972% | 1081% | 1120% | 1395% | 1784% | 2251% | 2347% | 3236% | 3803% | 4102% | 1434% | 1814% | 2240% | 2534% | 1282% | |
| 3ds Max (3dsmax-06) (fps) | 29.6 | 147 397% | 179 505% | 218 636% | 247 734% | 297 903% | 252 751% | 289 876% | 381 1187% | 433 1363% | 280 846% | 371 1153% | 434 1366% | 439 1383% | 258 772% | 310 947% | 360 1116% | 379 1180% | 148.3 ? 401% |
| Catia (catia-05) (fps) | 32.7 | 163 398% | 260 695% | 119 264% | 163 398% | 167 411% | 163 398% | 189 478% | 241 637% | 290 787% | 410 1154% | 529 1518% | 588 1698% | 661 1921% | 387 1083% | 482 1374% | 528 1515% | 565 1628% | 199.1 ? 509% |
| Creo (creo-02) (fps) | 26.5 | 230 768% | 90 240% | 203 666% | 240 806% | 243 817% | 230 768% | 301 1036% | 375 1315% | 455 1617% | 294 1009% | 387 1360% | 442 1568% | 470 1674% | 279 953% | 317 1096% | 353 1232% | 389 1368% | 167.5 ? 532% |
| Energy (energy-02) (fps) | 0.94 | 25.8 2645% | 22.5 2294% | 21.9 2230% | 23.8 2432% | 26.1 2677% | 34.6 3581% | 45.3 4719% | 54.2 5666% | 72.8 7645% | 82.9 8719% | 115 12134% | 139 14687% | 150 15857% | 44 4581% | 59.8 6262% | 74.3 7804% | 80.6 8474% | 41 ? 4262% |
| Maya (maya-05) (fps) | 32.2 | 355 1002% | 319 891% | 291 804% | 344 968% | 372 1055% | 343 965% | 403 1152% | 510 1484% | 591 1735% | 333 934% | 487 1412% | 548 1602% | 580 1701% | 348 981% | 403 1152% | 462 1335% | 482 1397% | 207 ? 543% |
| Medical (medical-02) (fps) | 4.49 | 65.3 1354% | 80.8 1700% | 54.2 1107% | 63.7 1319% | 74.3 1555% | 76.5 1604% | 85.1 1795% | 112 2394% | 132 2840% | 226 4933% | 300 6582% | 332 7294% | 372 8185% | 88.8 1878% | 105 2239% | 148 3196% | 202 4399% | 154.2 ? 3334% |
| Showcase (showcase-02) (fps) | 13.1 | 150 1045% | 119 808% | 122 831% | 135 931% | 150 1045% | 108 724% | 133 915% | 191 1358% | 244 1763% | 127 869% | 179 1266% | 234 1686% | 221 1587% | 125 854% | 151 1053% | 176 1244% | 186 1320% | 80.5 ? 515% |
| Solidworks (sw-04) (fps) | 47.2 | 109 131% | 77.5 64% | 119 152% | 136 188% | 135 186% | 127 169% | 135 186% | 157 233% | 168 256% | 195 313% | 265 461% | 294 523% | 287 508% | 220 366% | 231 389% | 272 476% | 286 506% | 124.1 ? 163% |
| SPECviewperf 2020 | 1005% | 1724% | 1419% | 1368% | 1914% | 1896% | 2460% | 3213% | 4074% | 3597% | 5203% | 6877% | 7116% | 1932% | 2647% | 3171% | 3596% | 1981% | |
| 3840x2160 Medical (medical-03) (fps) | 0.78 | 9.9 1169% | 22.3 2759% | 10.3 1221% | 12 1438% | 11.9 1426% | 13.7 1656% | 16.5 2015% | 22.2 2746% | 26.9 3349% | 36.1 4528% | 56.2 7105% | 63.7 8067% | 76.1 9656% | 20.9 2579% | 27.3 3400% | 30.1 3759% | 39.9 5015% | 23.1 ? 2862% |
| 3840x2160 Maya (maya-06) (fps) | 15.3 | 148 867% | 195 1175% | 162 959% | 185 1109% | 235 1436% | 196 1181% | 237 1449% | 305 1893% | 372 2331% | 178 1063% | 261 1606% | 346 2161% | 161 952% | 192 1155% | 258 1586% | 279 1724% | 142.5 ? 831% | |
| 3840x2160 Energy (energy-03) (fps) | 0.52 | 13.4 2477% | 25 4708% | 22.9 4304% | 17.8 3323% | 31.2 5900% | 33.2 6285% | 44.9 8535% | 57.6 10977% | 75.7 14458% | 67 12785% | 95 18169% | 111 21246% | 133 25477% | 29.5 5573% | 44.2 8400% | 52.2 9938% | 56.3 10727% | 34.2 ? 6477% |
| 3840x2160 Creo (creo-03) (fps) | 9.17 | 59 543% | 52.9 477% | 77.2 742% | 85.8 836% | 91.2 895% | 85.9 837% | 95.9 946% | 112 1121% | 121 1220% | 106 1056% | 130 1318% | 151 1547% | 159 1634% | 93.4 919% | 105 1045% | 123 1241% | 130 1318% | 50.2 ? 447% |
| 3840x2160 CATIA (catia-06) (fps) | 5.24 | 31.2 495% | 38.9 642% | 30.5 482% | 36.7 600% | 40.5 673% | 34 549% | 38.5 635% | 51.6 885% | 61.2 1068% | 68 1198% | 88.8 1595% | 101 1827% | 107 1942% | 60.8 1060% | 70.1 1238% | 77.2 1373% | 83.8 1499% | 35.1 ? 570% |
| 3840x2160 3ds Max (3dsmax-07) (fps) | 6.95 | 40.1 477% | 47.4 582% | 63.1 808% | 69.7 903% | 87 1152% | 67.4 870% | 88.8 1178% | 122 1655% | 147 2015% | 72.9 949% | 106 1425% | 125 1699% | 134 1828% | 42.4 510% | 51.5 641% | 85.4 1129% | 96.8 1293% | 55.4 ? 697% |
| Durchschnitt gesamt (Programm / Settings) | 1065% /
1071% | 1068% /
1009% | 1104% /
1075% | 1173% /
1155% | 1450% /
1408% | 1472% /
1434% | 1914% /
1865% | 2518% /
2455% | 3299% /
3228% | 2719% /
2639% | 3789% /
3660% | 4687% /
4374% | 4935% /
4737% | 1934% /
1934% | 2471% /
2455% | 2881% /
2854% | 2946% /
2887% | 1643% /
1612% |
Emissionen - Sparsam mit fragwürdiger Lüftersteuerung
Geräuschemissionen
Bei den Lautstärkemessungen kann unser Testmuster nicht mit guten Werten punkten. Schon im Leerlauf notieren wir 36,5 dB(A), was im Vergleich zu allen Kontrahenten deutlich lauter ist. Hinzukommt noch, dass das Lüftergeräusch sehr hochfrequent ist, womit sich die subjektive Wahrnehmung der Lautstärke nochmals erhöht. Bei durchschnittlicher Last erhöht sich der Schalldruckpegel nur minimal, wenngleich in der Spitze 47,5 dB(A) erreicht werden. Im BIOS selbst gibt es die Möglichkeit zwischen den Profilen Silent, Auto und Performance zu wählen. Damit werden jedoch auch die Power-Limits des Prozessors verändert. Warum der Hersteller dem Nutzer nicht die Möglichkeit einräumt, die Power-Limits getrennt von der Lüfterdrehzahl zu definieren, ist uns ein Rätsel. Wir haben alle Messungen im Profi Auto durchgeführt, was dem Auslieferungszustand entspricht. Hier sollte Geekom dringend nachbessern, um die Lautstärke spürbar zu verringern. Beim Geekom Mini IT12 auf Basis des Intel Core i7-1260P hat es ja schlussendlich auch geklappt.
Lautstärkediagramm
| Idle |
| 36.5 / 36.5 / 36.5 dB(A) |
| Last |
| 36.6 / 47.5 dB(A) |
 | ||
30 dB leise 40 dB(A) deutlich hörbar 50 dB(A) störend |
||
min: | ||
| Geekom Mini IT12 i5-12450H, UHD Graphics 64EUs | Geekom Mini IT12 i7-1260P, Iris Xe G7 96EUs | Intel NUC 13 Pro Kit NUC13ANK i7-1360P, Iris Xe G7 96EUs | Minisforum Mars Series MC560 R5 5600U, Vega 7 | Intel NUC 12 Pro Kit NUC12WSKi7 i7-1260P, Iris Xe G7 96EUs | Minisforum Venus Series UN1245 i5-12450H, UHD Graphics 64EUs | NiPoGi CK10 i5-12450H, UHD Graphics 64EUs | |
|---|---|---|---|---|---|---|---|
| Geräuschentwicklung | 13% | 5% | 12% | 1% | 6% | 11% | |
| aus / Umgebung * (dB) | 24.8 | 29.8 -20% | 29.8 -20% | 30.2 -22% | 30.4 -23% | 25.2 -2% | 25 -1% |
| Idle min * (dB) | 36.5 | 29.9 18% | 30.2 17% | 30.4 17% | 33.1 9% | 32 12% | 30.6 16% |
| Idle avg * (dB) | 36.5 | 30.1 18% | 31.1 15% | 30.4 17% | 33.1 9% | 32.1 12% | 31.1 15% |
| Idle max * (dB) | 36.5 | 30.2 17% | 31.9 13% | 30.4 17% | 33.1 9% | 32.2 12% | 31.7 13% |
| Last avg * (dB) | 36.6 | 32.1 12% | 40 -9% | 31.8 13% | 38.1 -4% | 39.8 -9% | 32.9 10% |
| Witcher 3 ultra * (dB) | 36.6 | 36.2 1% | |||||
| Last max * (dB) | 47.5 | 32.5 32% | 40.5 15% | 33.4 30% | 43.6 8% | 43.3 9% | 36.1 24% |
* ... kleinere Werte sind besser
Temperatur
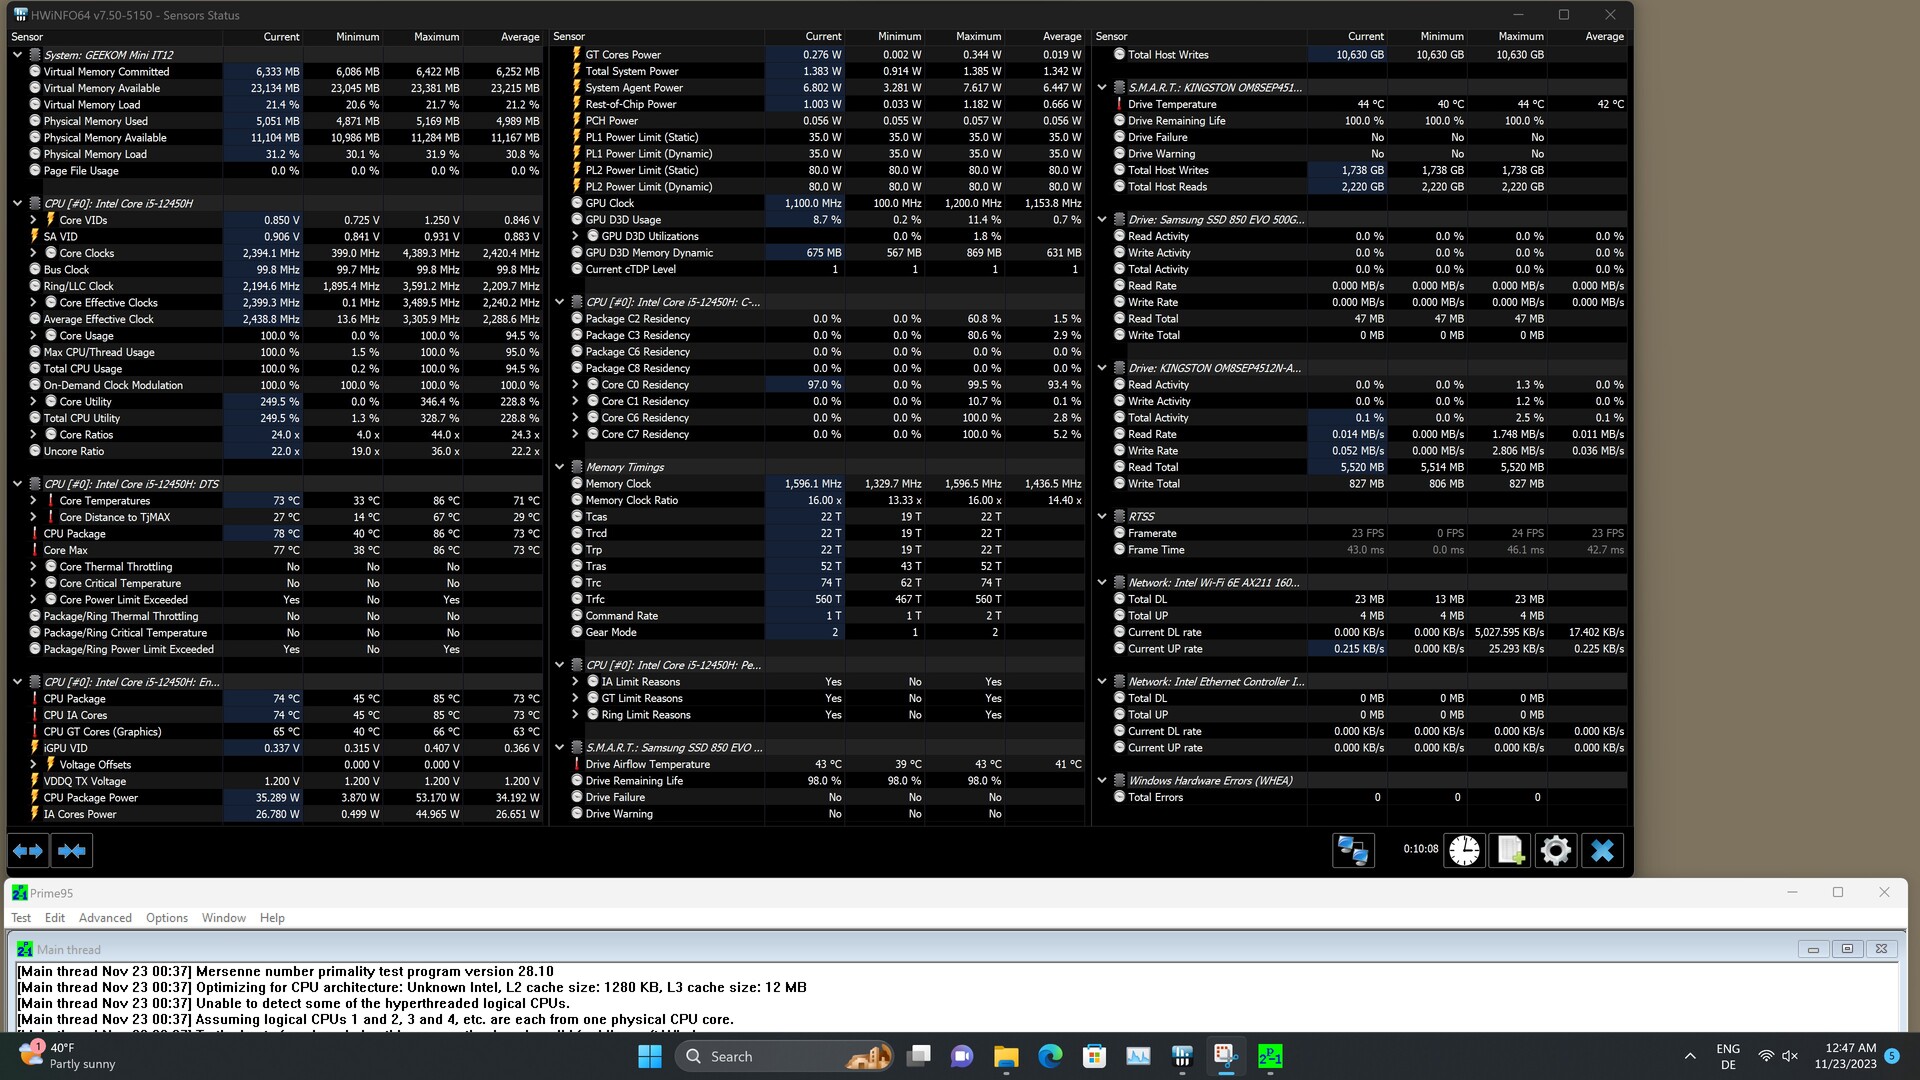
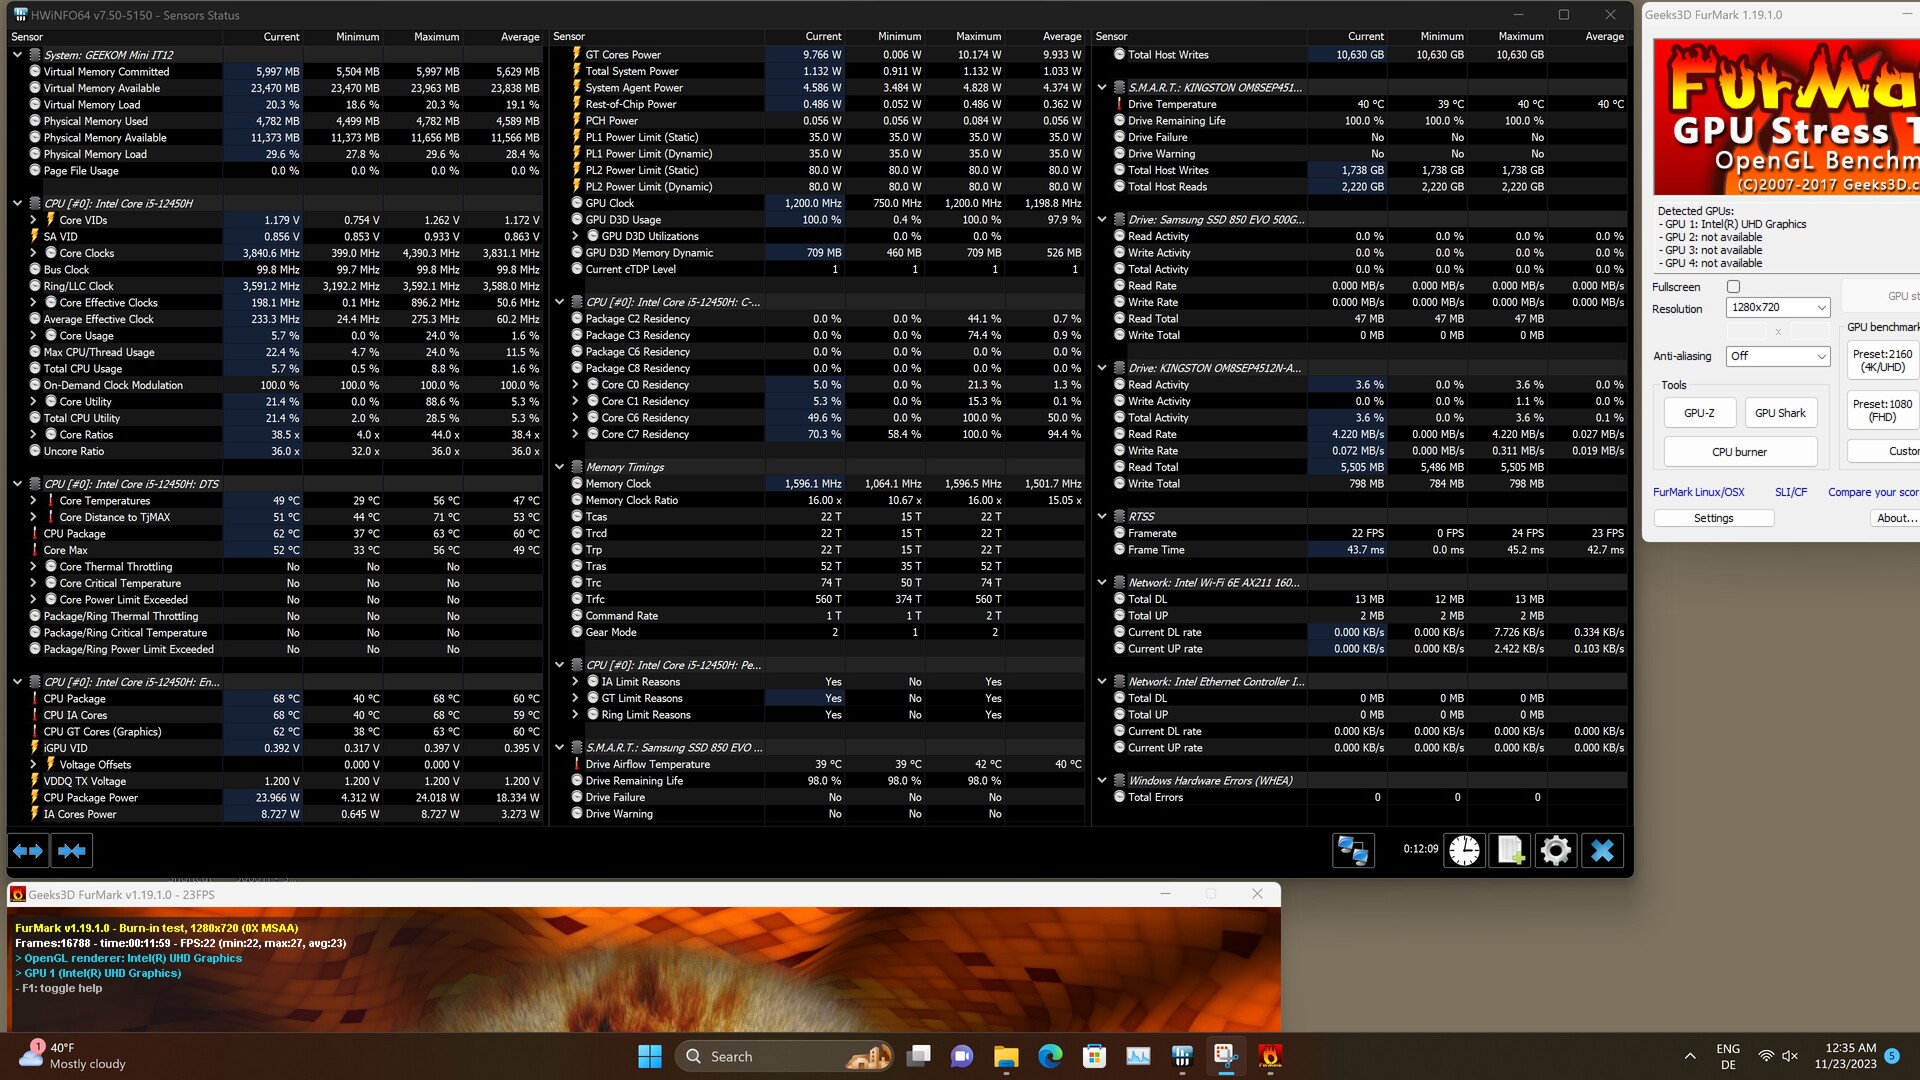
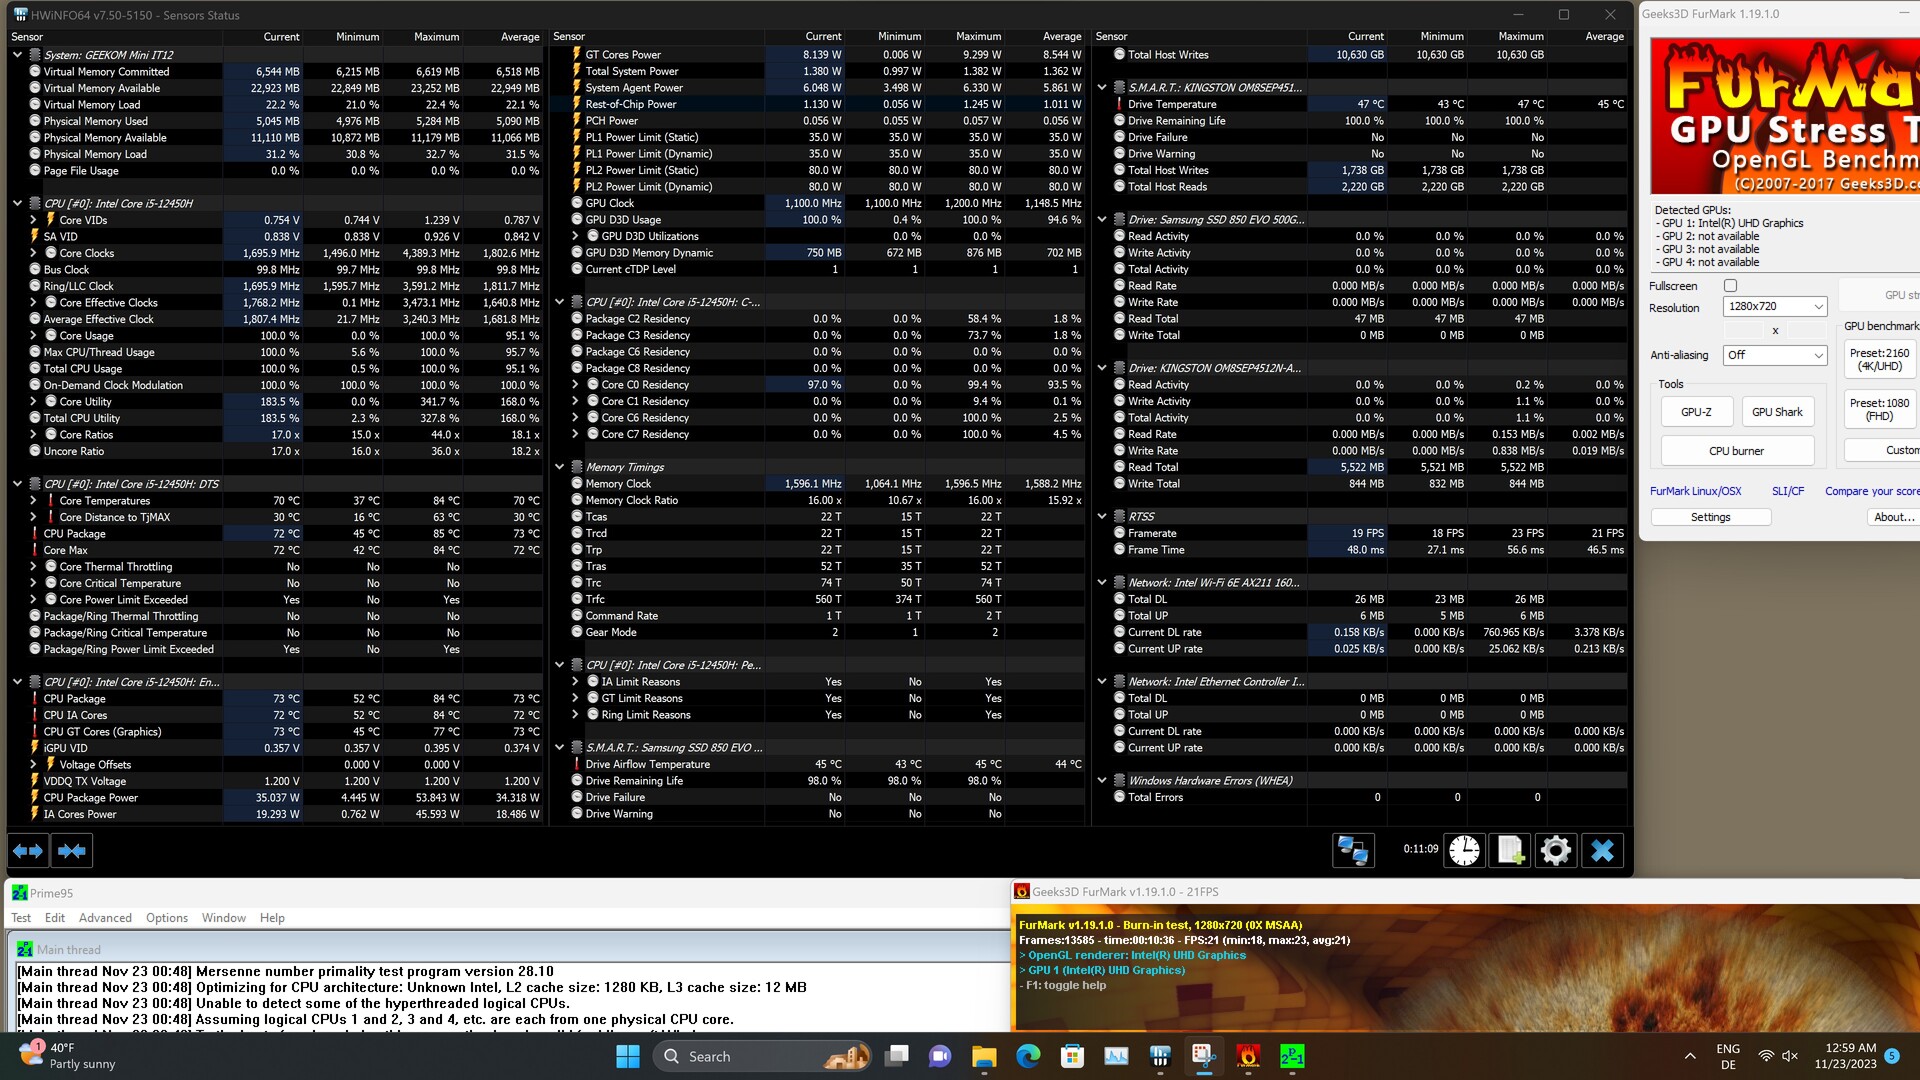
Das Gehäuse des Geekom Mini IT12 erwärmt sich im Leerlauf nur in geringem Maße, wenngleich unter Last spürbar wärmere Bereiche zu lokalisieren sind. Mit maximal 41,4 °C ist der Hotspot beim Stresstest aber unbedenklich. Der Intel Core i5-12450H benötigt unter Dauerlast 35 Watt, was auch durchweg beim Stresstest erreicht wird. Zu Beginn erreicht das SoC kurzfristig 53 Watt, woraus der maximale Temperaturwert von 85 °C resultiert. Hier scheint der Hersteller ein Limit gesetzt zu haben, denn das maximale Power-Limit von 80 Watt erreichen wir bei keinem Benchmark. Mit 73 °C pendelt sich die CPU-Temperatur auf einem guten Niveau ein.
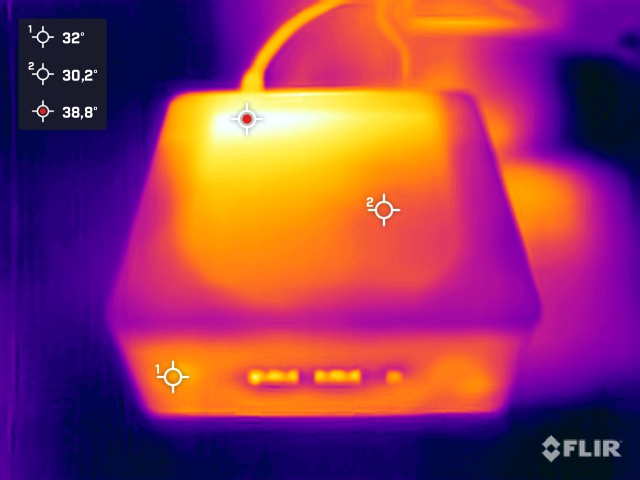
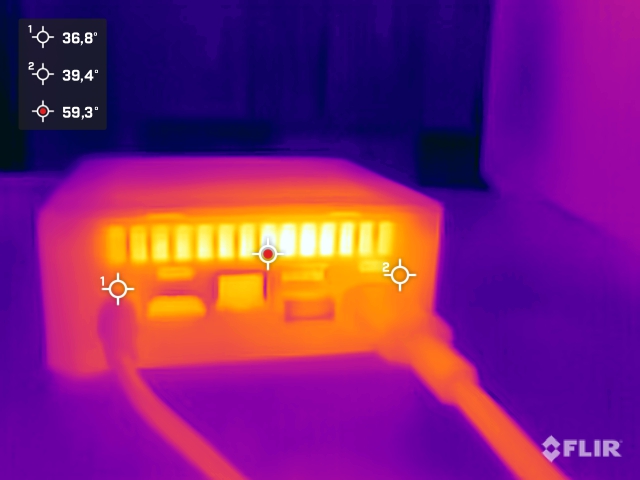
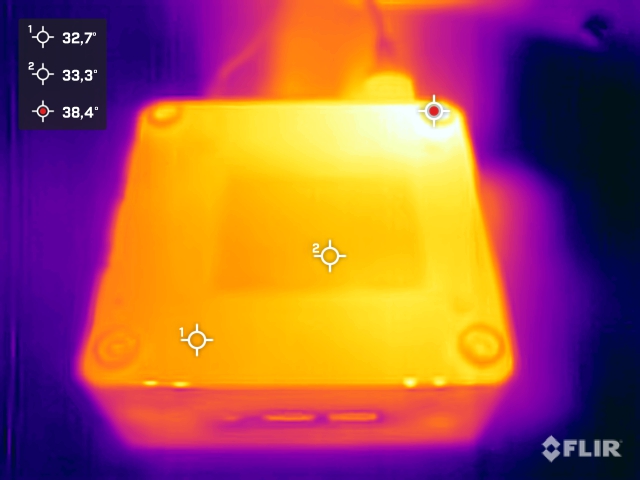
(±) Die maximale Temperatur auf der Oberseite ist 41.4 °C. Im Vergleich liegt der Klassendurchschnitt bei 35.4 °C (von 20.6 bis 69.5 °C für die Klasse Mini PC).
(+) Auf der Unterseite messen wir eine maximalen Wert von 39.1 °C (im Vergleich zum Durchschnitt von 36.1 °C).
(+) Ohne Last messen wir eine durchschnittliche Temperatur von 27.5 °C auf der Oberseite. Der Klassendurchschnitt erreicht 32.1 °C.
Energieaufnahme
Da Geekom den Prozessor mit seinen Power-Limits etwas einbremst, ist der Mini IT12 sowohl im Leerlauf als auch unter Last sehr sparsam. Nur 5,5 bis 11,3 Watt zeigt unser Messgerät im Leerlauf. Kurzfristig muss das 90-Watt-Netzteil aber auch mal knapp 87 Watt liefern, was jedoch kein Problem ist. Im Schnitt benötigt der Geekom Mini IT12 nur etwas mehr als 40 Watt, was im direkten Vergleich mit den Kontrahenten ein hervorragendes Ergebnis ist.
| Aus / Standby | |
| Idle | |
| Last |
|
Legende:
min: | |
| Geekom Mini IT12 i5-12450H, UHD Graphics 64EUs | Geekom Mini IT12 i7-1260P, Iris Xe G7 96EUs | Intel NUC 13 Pro Kit NUC13ANK i7-1360P, Iris Xe G7 96EUs | Minisforum Mars Series MC560 R5 5600U, Vega 7 | Intel NUC 12 Pro Kit NUC12WSKi7 i7-1260P, Iris Xe G7 96EUs | Minisforum Venus Series UN1245 i5-12450H, UHD Graphics 64EUs | NiPoGi CK10 i5-12450H, UHD Graphics 64EUs | Durchschnittliche Intel UHD Graphics 64EUs (Alder Lake 12th Gen) | Durchschnitt der Klasse Mini PC | |
|---|---|---|---|---|---|---|---|---|---|
| Stromverbrauch | 4% | -7% | 18% | -48% | -9% | -22% | -21% | -38% | |
| Idle min * (Watt) | 5.5 | 5 9% | 5.1 7% | 6.2 -13% | 12.1 -120% | 8.2 -49% | 9.1 -65% | 8.78 ? -60% | 8.68 ? -58% |
| Idle avg * (Watt) | 8.5 | 7 18% | 5.8 32% | 6.3 26% | 12.2 -44% | 8.6 -1% | 11.3 -33% | 10.4 ? -22% | 10.8 ? -27% |
| Idle max * (Watt) | 11.3 | 10.7 5% | 10.2 10% | 7.5 34% | 12.3 -9% | 9.6 15% | 13.7 -21% | 14.7 ? -30% | 13.7 ? -21% |
| Last avg * (Watt) | 42.3 | 50.3 -19% | 68.1 -61% | 41.3 2% | 64 -51% | 52.1 -23% | 49.5 -17% | 49 ? -16% | 64.8 ? -53% |
| Last max * (Watt) | 86.5 | 82 5% | 108.3 -25% | 49 43% | 98.8 -14% | 73.6 15% | 62.3 28% | 67.6 ? 22% | 112.6 ? -30% |
* ... kleinere Werte sind besser
Energieaufnahme mit externem Monitor
Pro
Contra
Fazit - Sparsamer Office-PC mit guter Ausstattung
Der Geekom Mini IT12 ist ein solider Mini-PC für den Heimgebrauch. Mit dem Intel Core i5-12450H bekommt der Rechenknecht einen guten Prozessor, welcher den meisten Aufgaben im Alltag gewachsen ist. Aufgrund der großzügigen Anschlussausstattung kann der Geekom Mini IT12 aber auch für viele weitere Anwendungsfälle verwendet werden. Selbst externe Grafikkarten lassen sich problemlos verwenden. Im hausinternen Duell mit dem gleichnamigen IT12 auf Basis des Intel Core i7-1260P unterliegt das Testgerät. Die ähnlich ausgestatteten Geräte von Minisforum und NiPoGi (Minisforum Venus Series UN1245 und NiPoGi CK10) können am Papier nicht ganz mit dem Geekom Mini IT12 mithalten, in der Realität ist der Leistungsunterschied aber sehr gering und nicht spürbar. Gegenüber den beiden Kontrahenten hat Geekom aber einen großen Vorteil: die bessere Anschlussausstattung. Minisforum und NiPoGi statten ihre Geräte nicht mit dem modernen USB-4-Anschluss aus, was ein Nachteil unserem Testmuster gegenüber ist.
Der Geekom Mini IT12 ist ein kompaktes Arbeitsgerät, welches viele Einsatzmöglichkeiten abdeckt. Die hervorragende Anschlussausstattung untermauert dies und ermöglicht sogar den Einsatz von externen Grafikkarten.
In puncto Verarbeitung und Design bleibt sich Geekom treu. Für etwas Abwechslung hätten wir uns jedoch mal etwas Neues gewünscht. Auch um aus der Masse herauszustechen, würde ein neues Äußeres den Geräten guttun. Größter Kritikpunkt an unserem Testgerät ist die Lüfterlautstärke, welche jederzeit hörbar ist. Das kann Geekom besser wie wir beim Test des Mini IT12 mit Intel Core i7-1260P gesehen haben. Ob der Hersteller hier in Form eines BIOS-Updates nacharbeitet, bleibt abzuwarten. Wer also ein Problem mit lauten Lüftergeräuschen hat, sollte einen großen Bogen um den Geekom Mini IT12 mit dem Intel Core i5-12450H machen und lieber zum Model mit dem Intel Core i7-1260P greifen, wenn man dieses noch bekommt. Sollte der Hersteller nachbessern, werden wir den Test dementsprechend anpassen.
Preise und Verfügbarkeit
Den Geekom Mini IT12 kann man direkt beim Hersteller kaufen. Aktuell werden hier 499 Euro für das Testgerät aufgerufen. Mit dem Code "gkm30it12" lassen sich momentan 30 Euro sparen, womit der Geekom Mini IT12 nur noch 469 Euro kostet. Auch bei Amazon kann man den Geekom Mini IT12 bekommen. Wer etwas mehr Leistung benötigt, kann den Mini IT12 auch mit Intel Core i7-12650H im Geekom-Shop erwerben. Mindestens 549 Euro muss man hier momentan einplanen.
Geekom Mini IT12
- 27.11.2023 v7 (old)
Sebastian Bade
Transparenz
Die Auswahl der zu testenden Geräte erfolgt innerhalb der Redaktion. Das vorliegende Testmuster wurde dem Autor vom Hersteller unentgeltlich zu Testzwecken überlassen. Eine Einflussnahme auf den Testbericht gab es nicht, der Hersteller erhielt keine Version des Reviews vor der Veröffentlichung. Es bestand keine Verpflichtung zur Publikation. Als eigenständiges, unabhängiges Unternehmen unterliegt Notebookcheck keiner Diktion von Herstellern, Shops und Verlagen.
So testet Notebookcheck
Pro Jahr werden von Notebookcheck hunderte Laptops und Smartphones unabhängig in von uns standardisierten technischen Verfahren getestet, um eine Vergleichbarkeit aller Testergebnisse zu gewährleisten. Seit rund 20 Jahren entwickeln wir diese Testmethoden kontinuierlich weiter und setzen damit Branchenstandards. In unseren Testlaboren kommt ausschließlich hochwertiges Messequipment in die Hände erfahrener Techniker und Redakteure. Die Tests unterliegen einer mehrstufigen Kontrolle. Unsere komplexe Gesamtbewertung basiert auf hunderten fundierten Messergebnissen und Benchmarks, womit Ihnen Objektivität garantiert ist. Weitere Informationen zu unseren Testmethoden gibt es hier.
