Minisforum BD770i im Test: Das Mini-ITX-Mainboard mit AMD Ryzen 7 7745HX als Basis für kleine Gaming-PCs
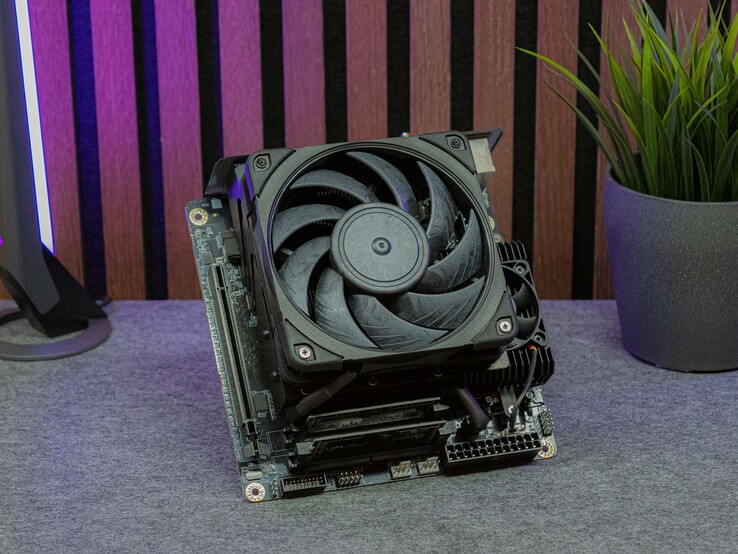
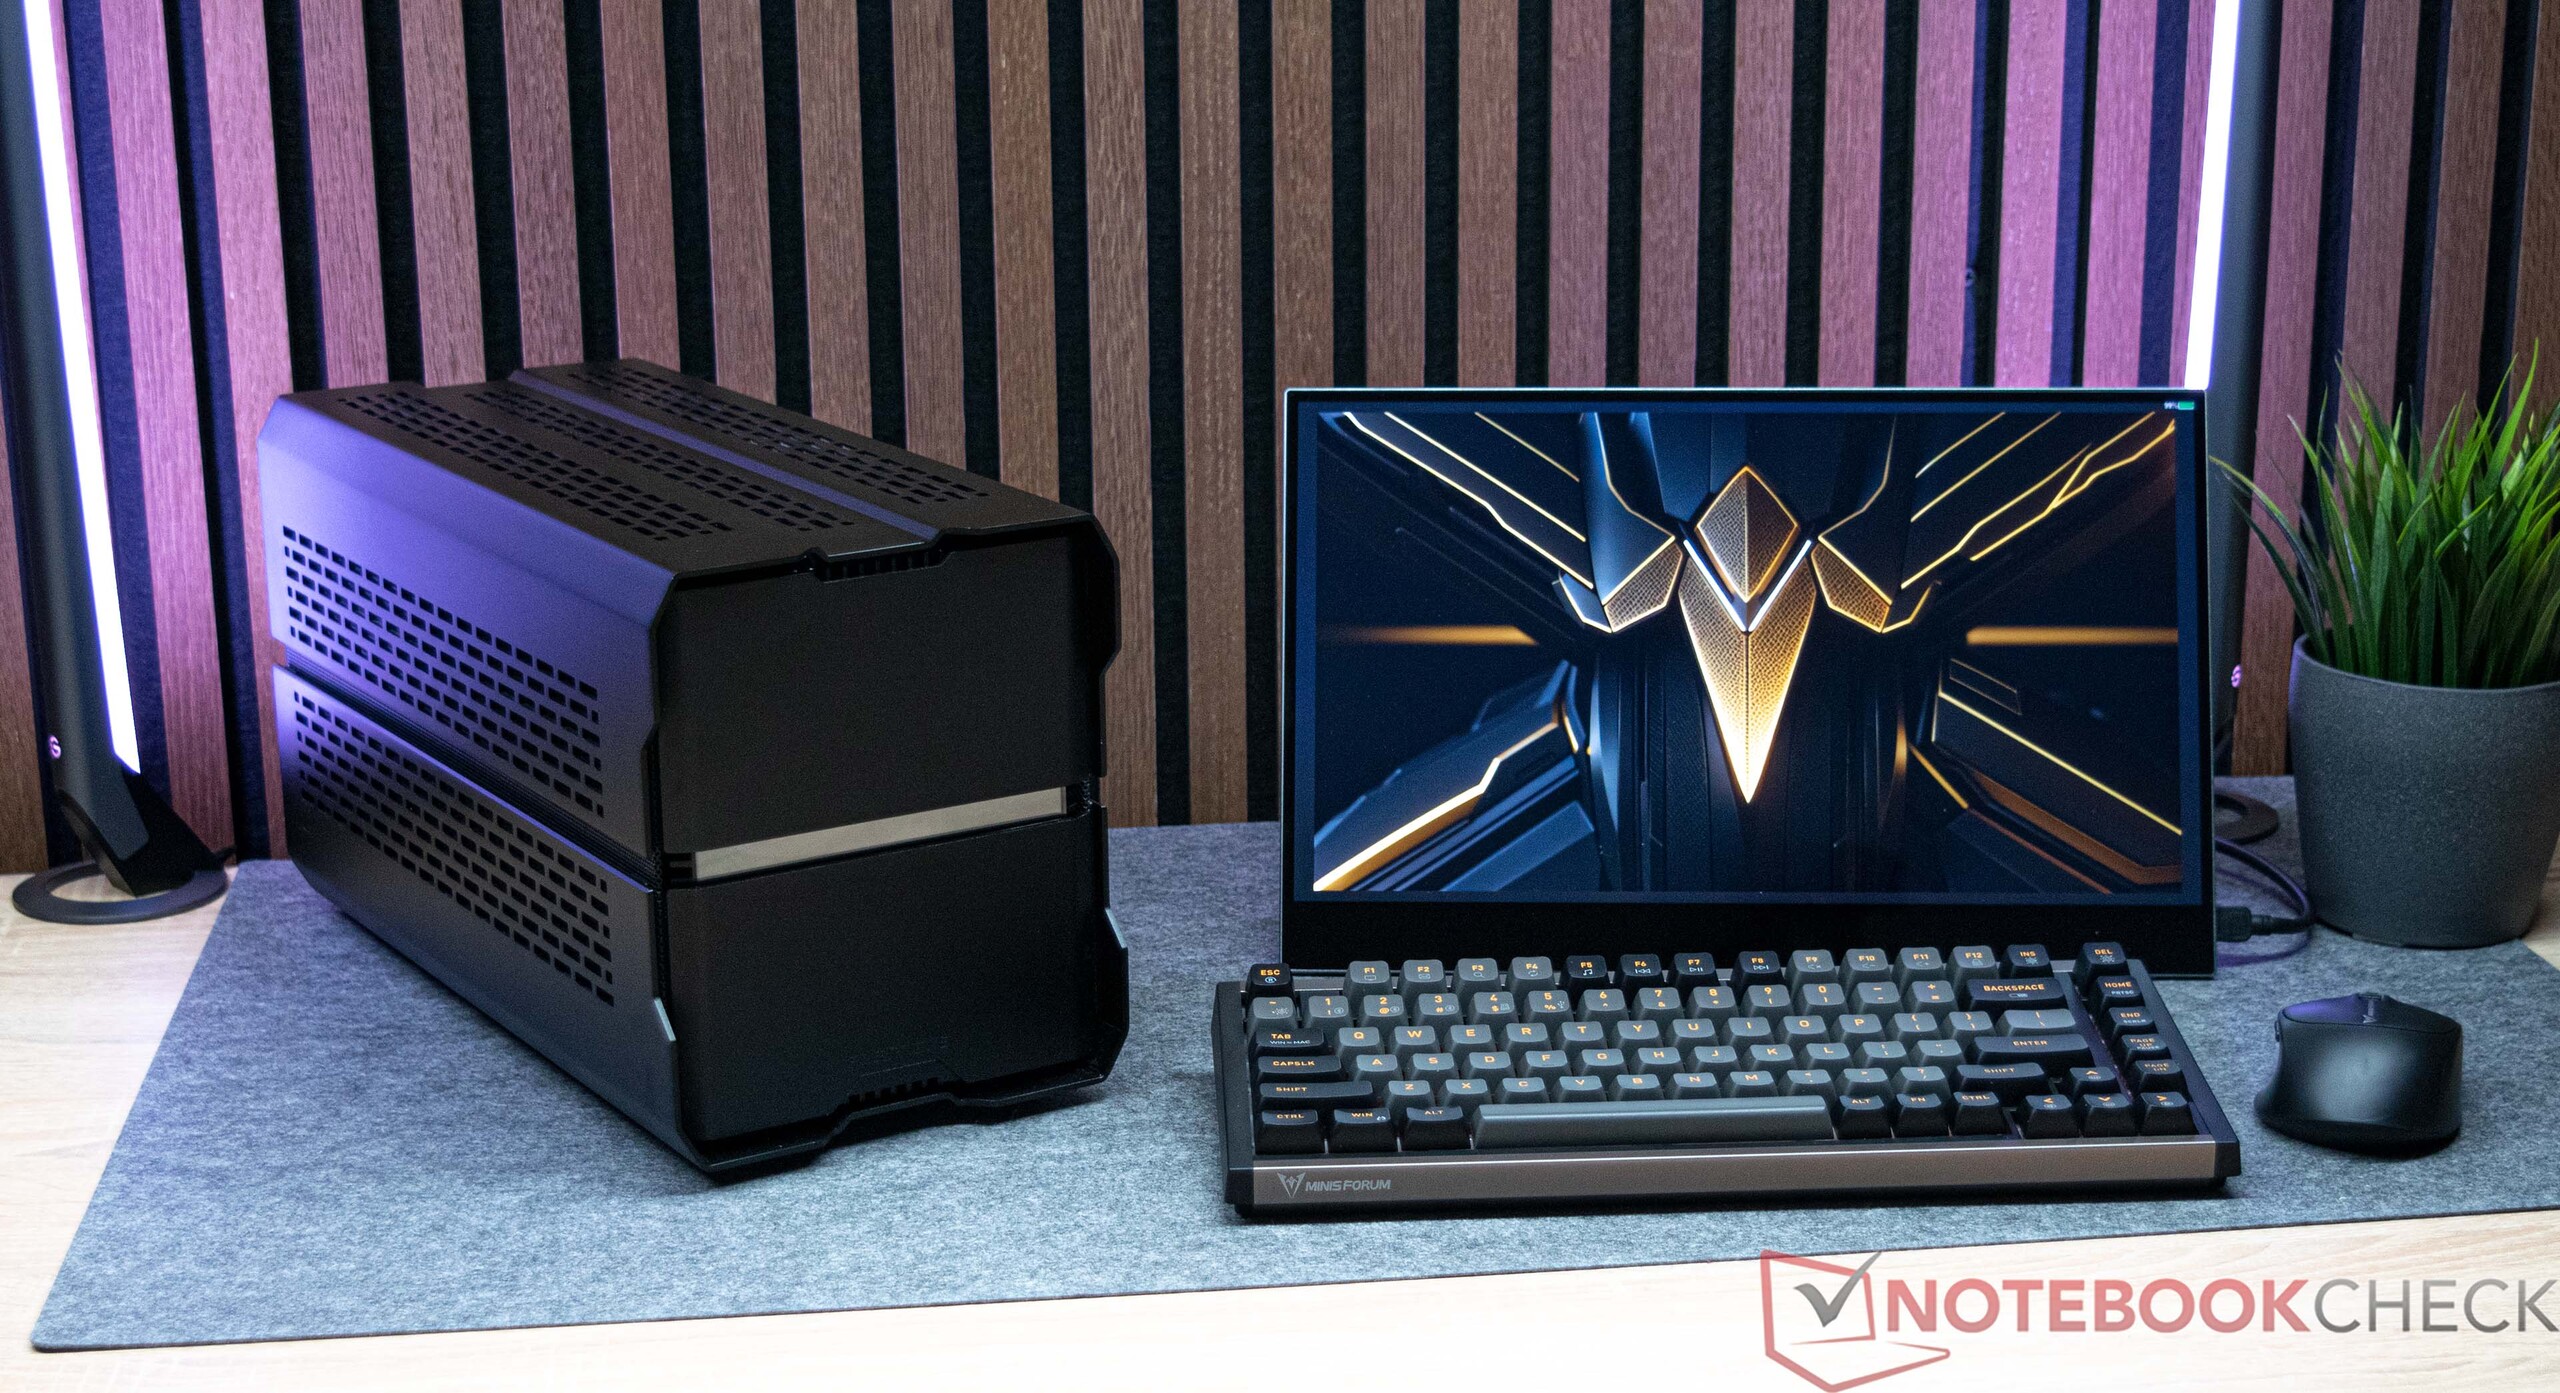
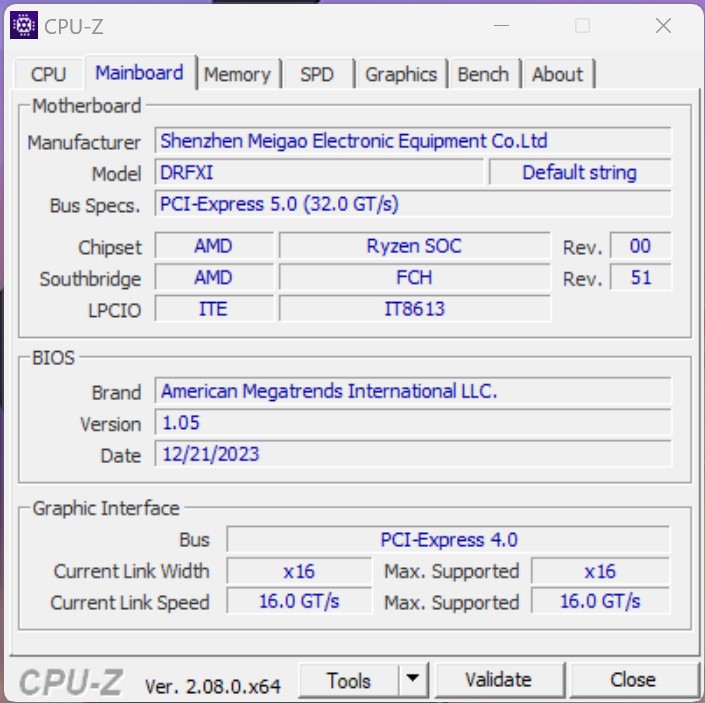
Minisforum kennen wir bereits als etablierten Mini-PC-Hersteller. Doch mit dem Minisforum BD770i wagt sich der Hersteller auf neues Terrain und bietet hier ein Mainboard samt verlöteter CPU an. Als Formfaktor hält sich Minisforum an den ITX-Standard, womit die Hauptplatine in den meisten PC-Gehäusen eingebaut werden kann. Aufgrund der Kompaktheit gehen wir davon aus, dass dieses Modell aber in den meisten Fällen wohl auch in einem sehr kompakten Mini-ITX-Gehäuse verwendet wird.
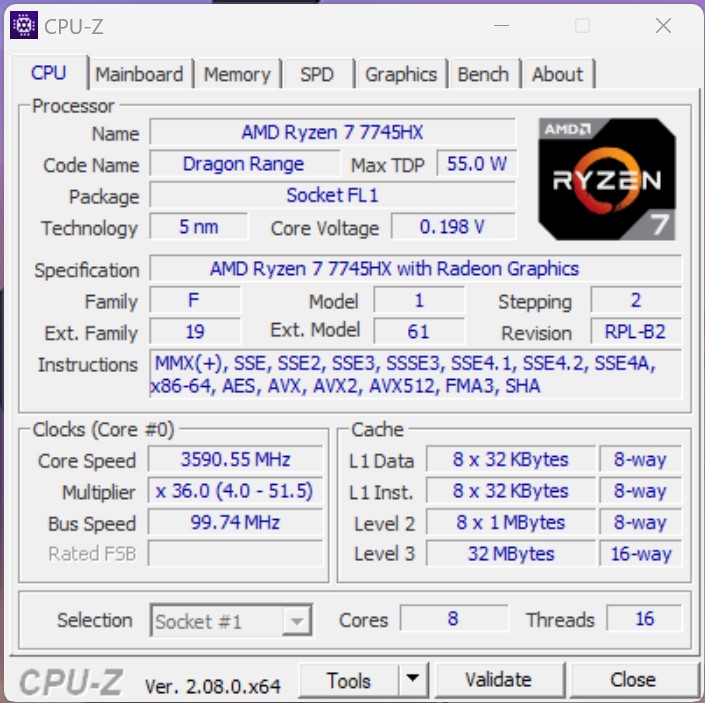
Beim Prozessor setzt Minisforum beim BD770i auf einen AMD Ryzen 7 7745HX, welcher mit acht Zen4-Kernen bestückt ist. In den meisten Fällen sollte das SoC genügend Leistung bieten, um auch rechenintensive Vorhaben zu meistern. Wir haben zudem die Spieleleistung zusammen mit einer Nvidia GeForce RTX 4090 unter die Lupe genommen, denn aufgrund des vollwertigen PCIe-x16-Slots kann die Grafikkarte mit der vollen Leistung arbeiten. Aktuell listet Minisforum insgesamt fünf verschiedene Mainboards, welche jeweils immer mit einem Prozessor aus dem Notebook-Bereich bestückt sind. In der folgenden Übersicht haben wir die Geräte einmal zusammengetragen und die wichtigsten Eckdaten zusammengefasst.
Minisforum Mainboards im Vergleich
| Bezeichnung | BD790i | BD770i | AR900i | AR650i | AD650i |
| CPU | AMD Ryzen 9 7945HX | AMD Ryzen 7 7745HX | Intel Core i9-13900HX Processor | Intel Core i7-13650HX | Intel Core i7-13650HX Processor |
| Cores / Threads | 16 / 32 | 8 / 16 | 24 / 32 | 14 / 20 | 14 / 20 |
| GPU | AMD Radeon 610M | AMD Radeon 610M | Intel UHD Graphics | Intel UHD Graphics | Intel UHD Graphics |
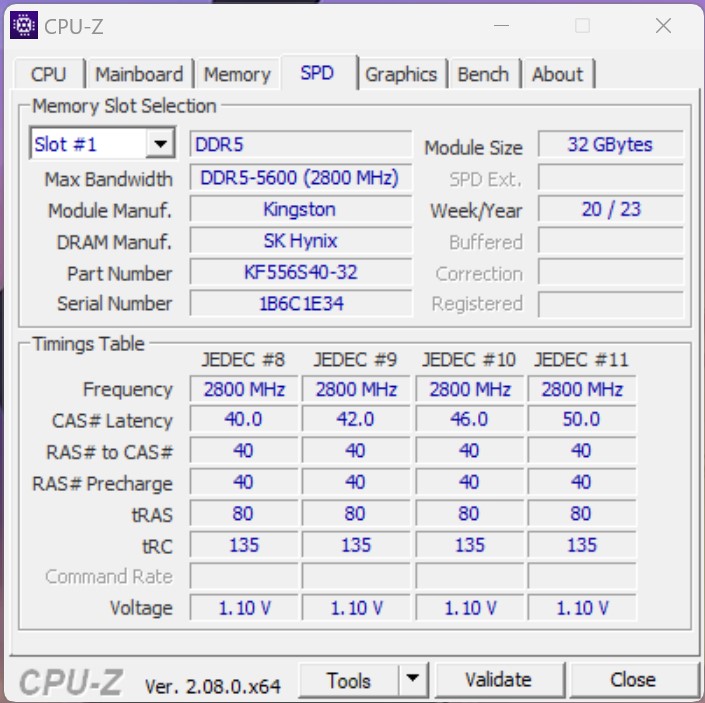
| Memory Types | DDR5-5200 SODIMM | DDR5-5200 SODIMM | DDR5-5600 SODIMM | DDR5-5600 SODIMM | DDR5-5600 SODIMM |
| Max Memory Size | 96GB | 64GB | 64 GB | 64 GB | 64 GB |
Minisforum BD770i und das Testsystem im Detail


Gehäuse und Testaufbau
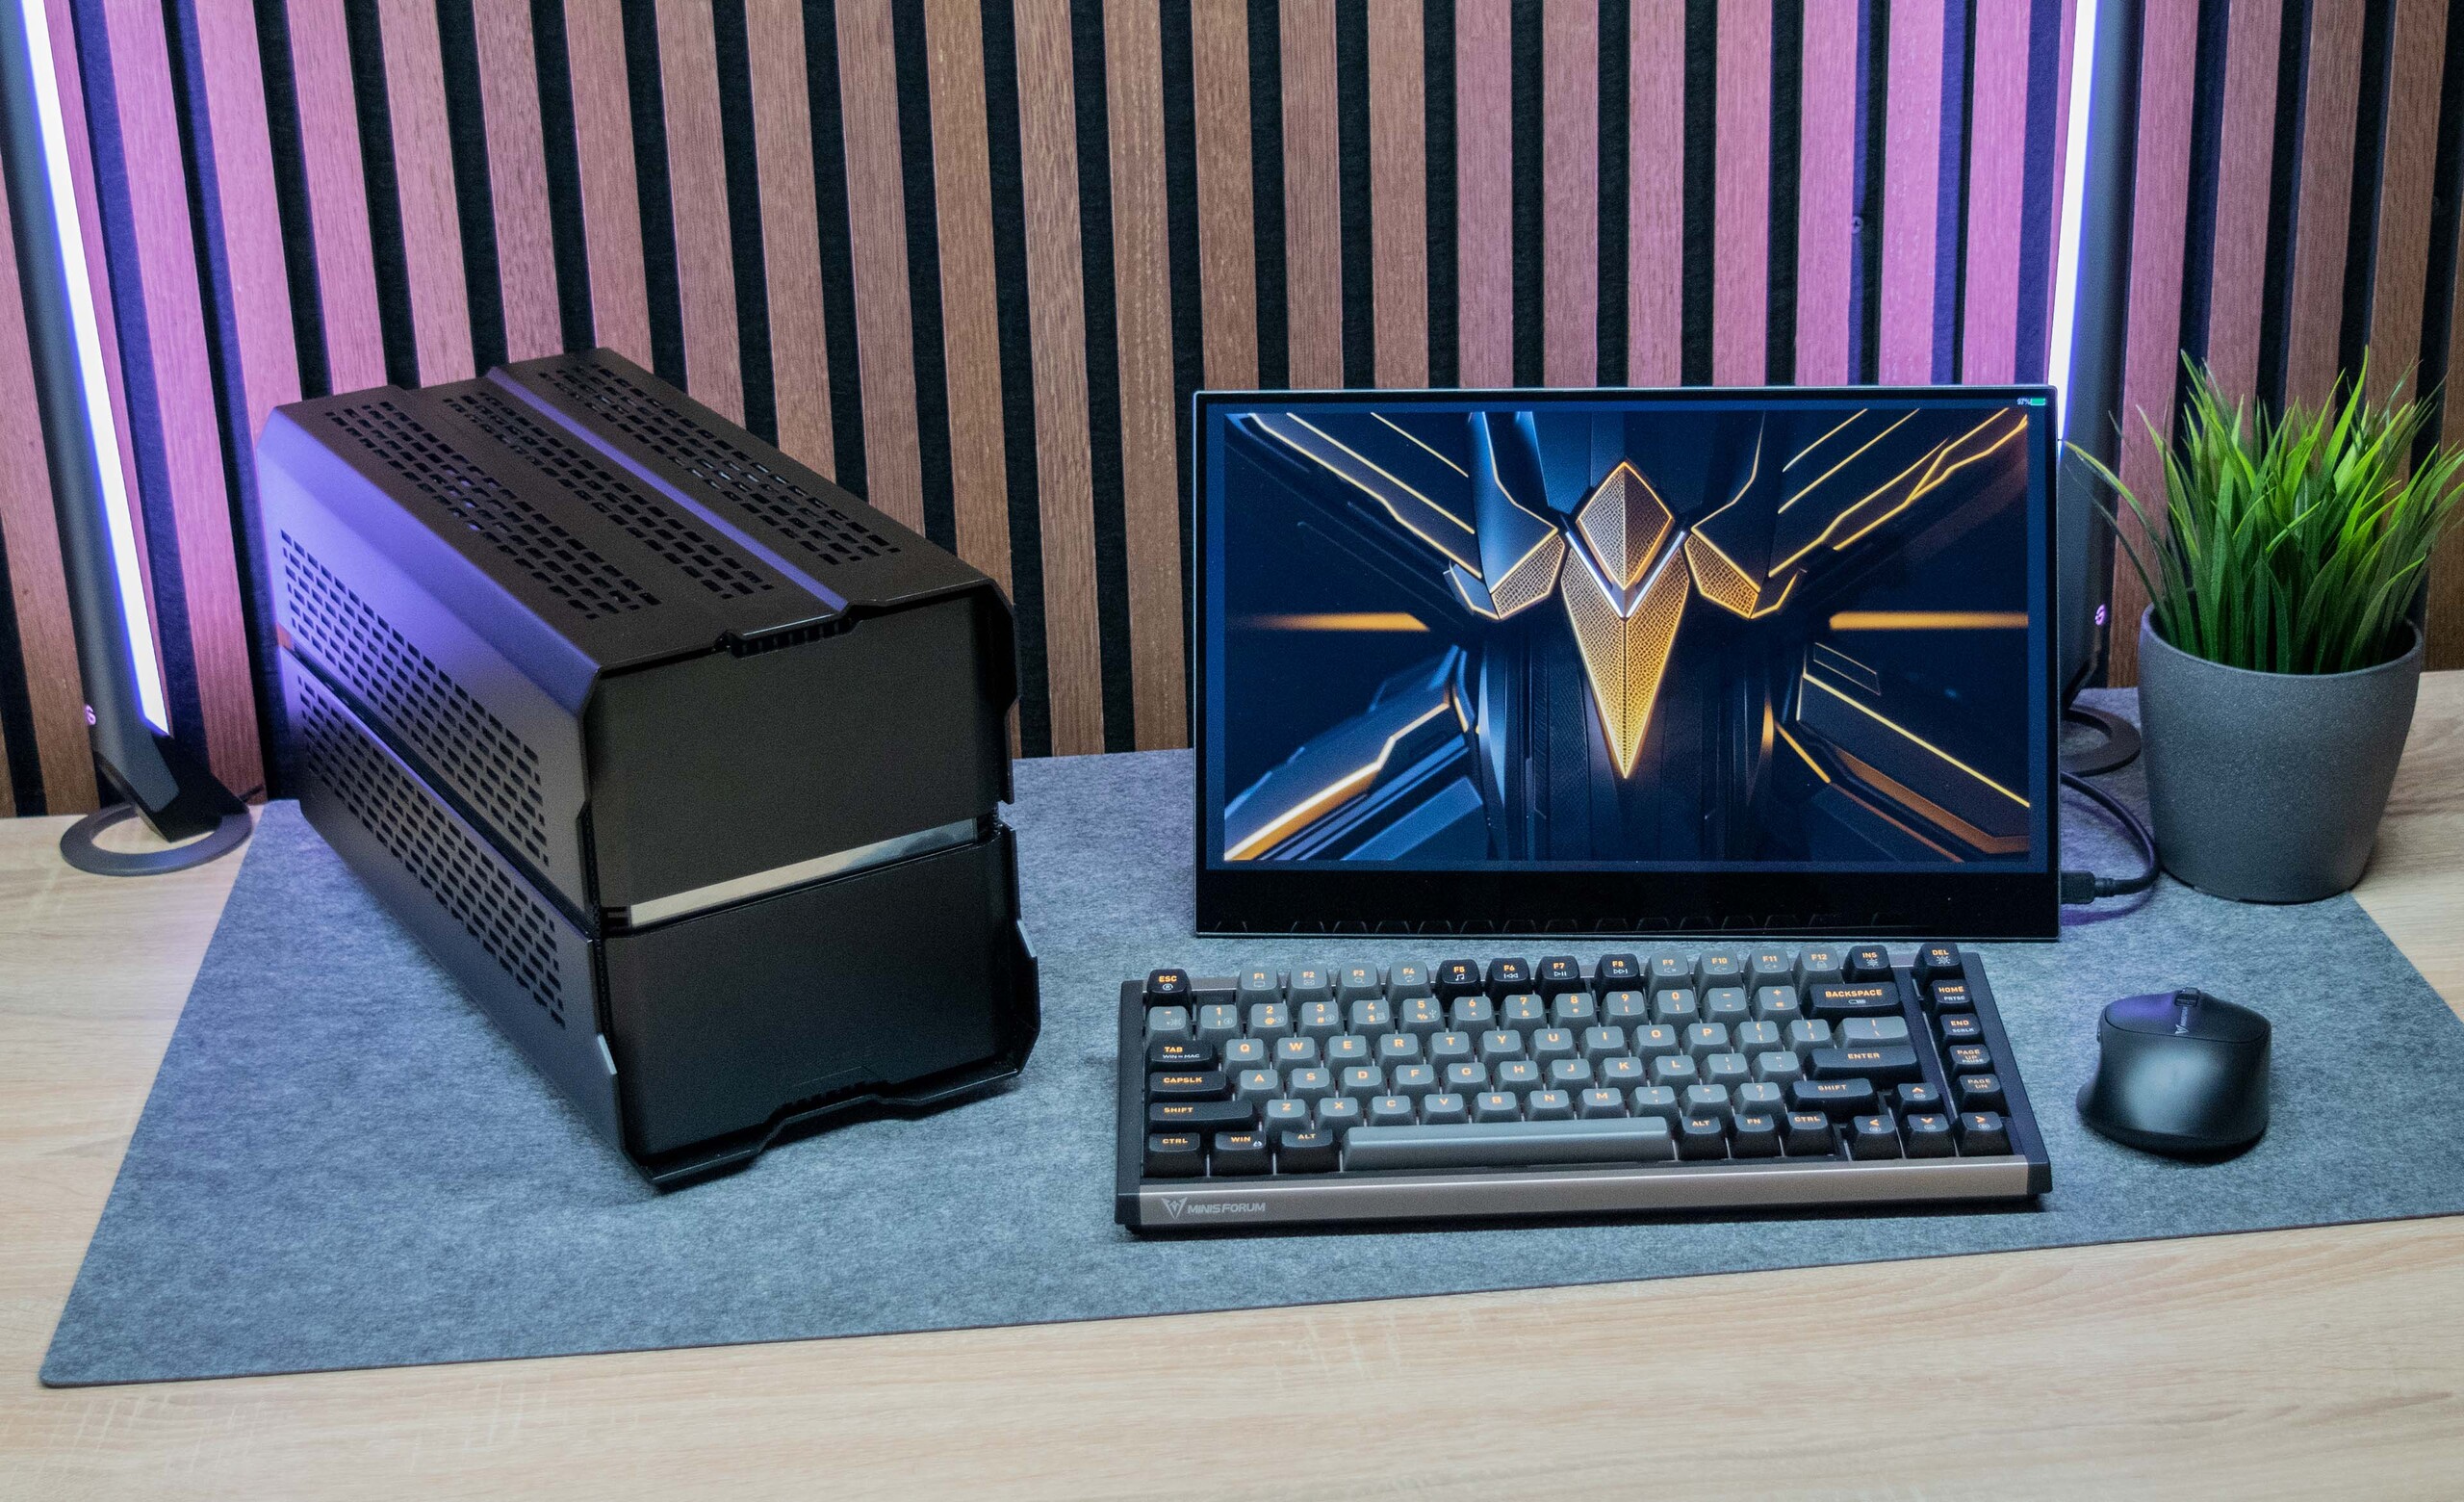
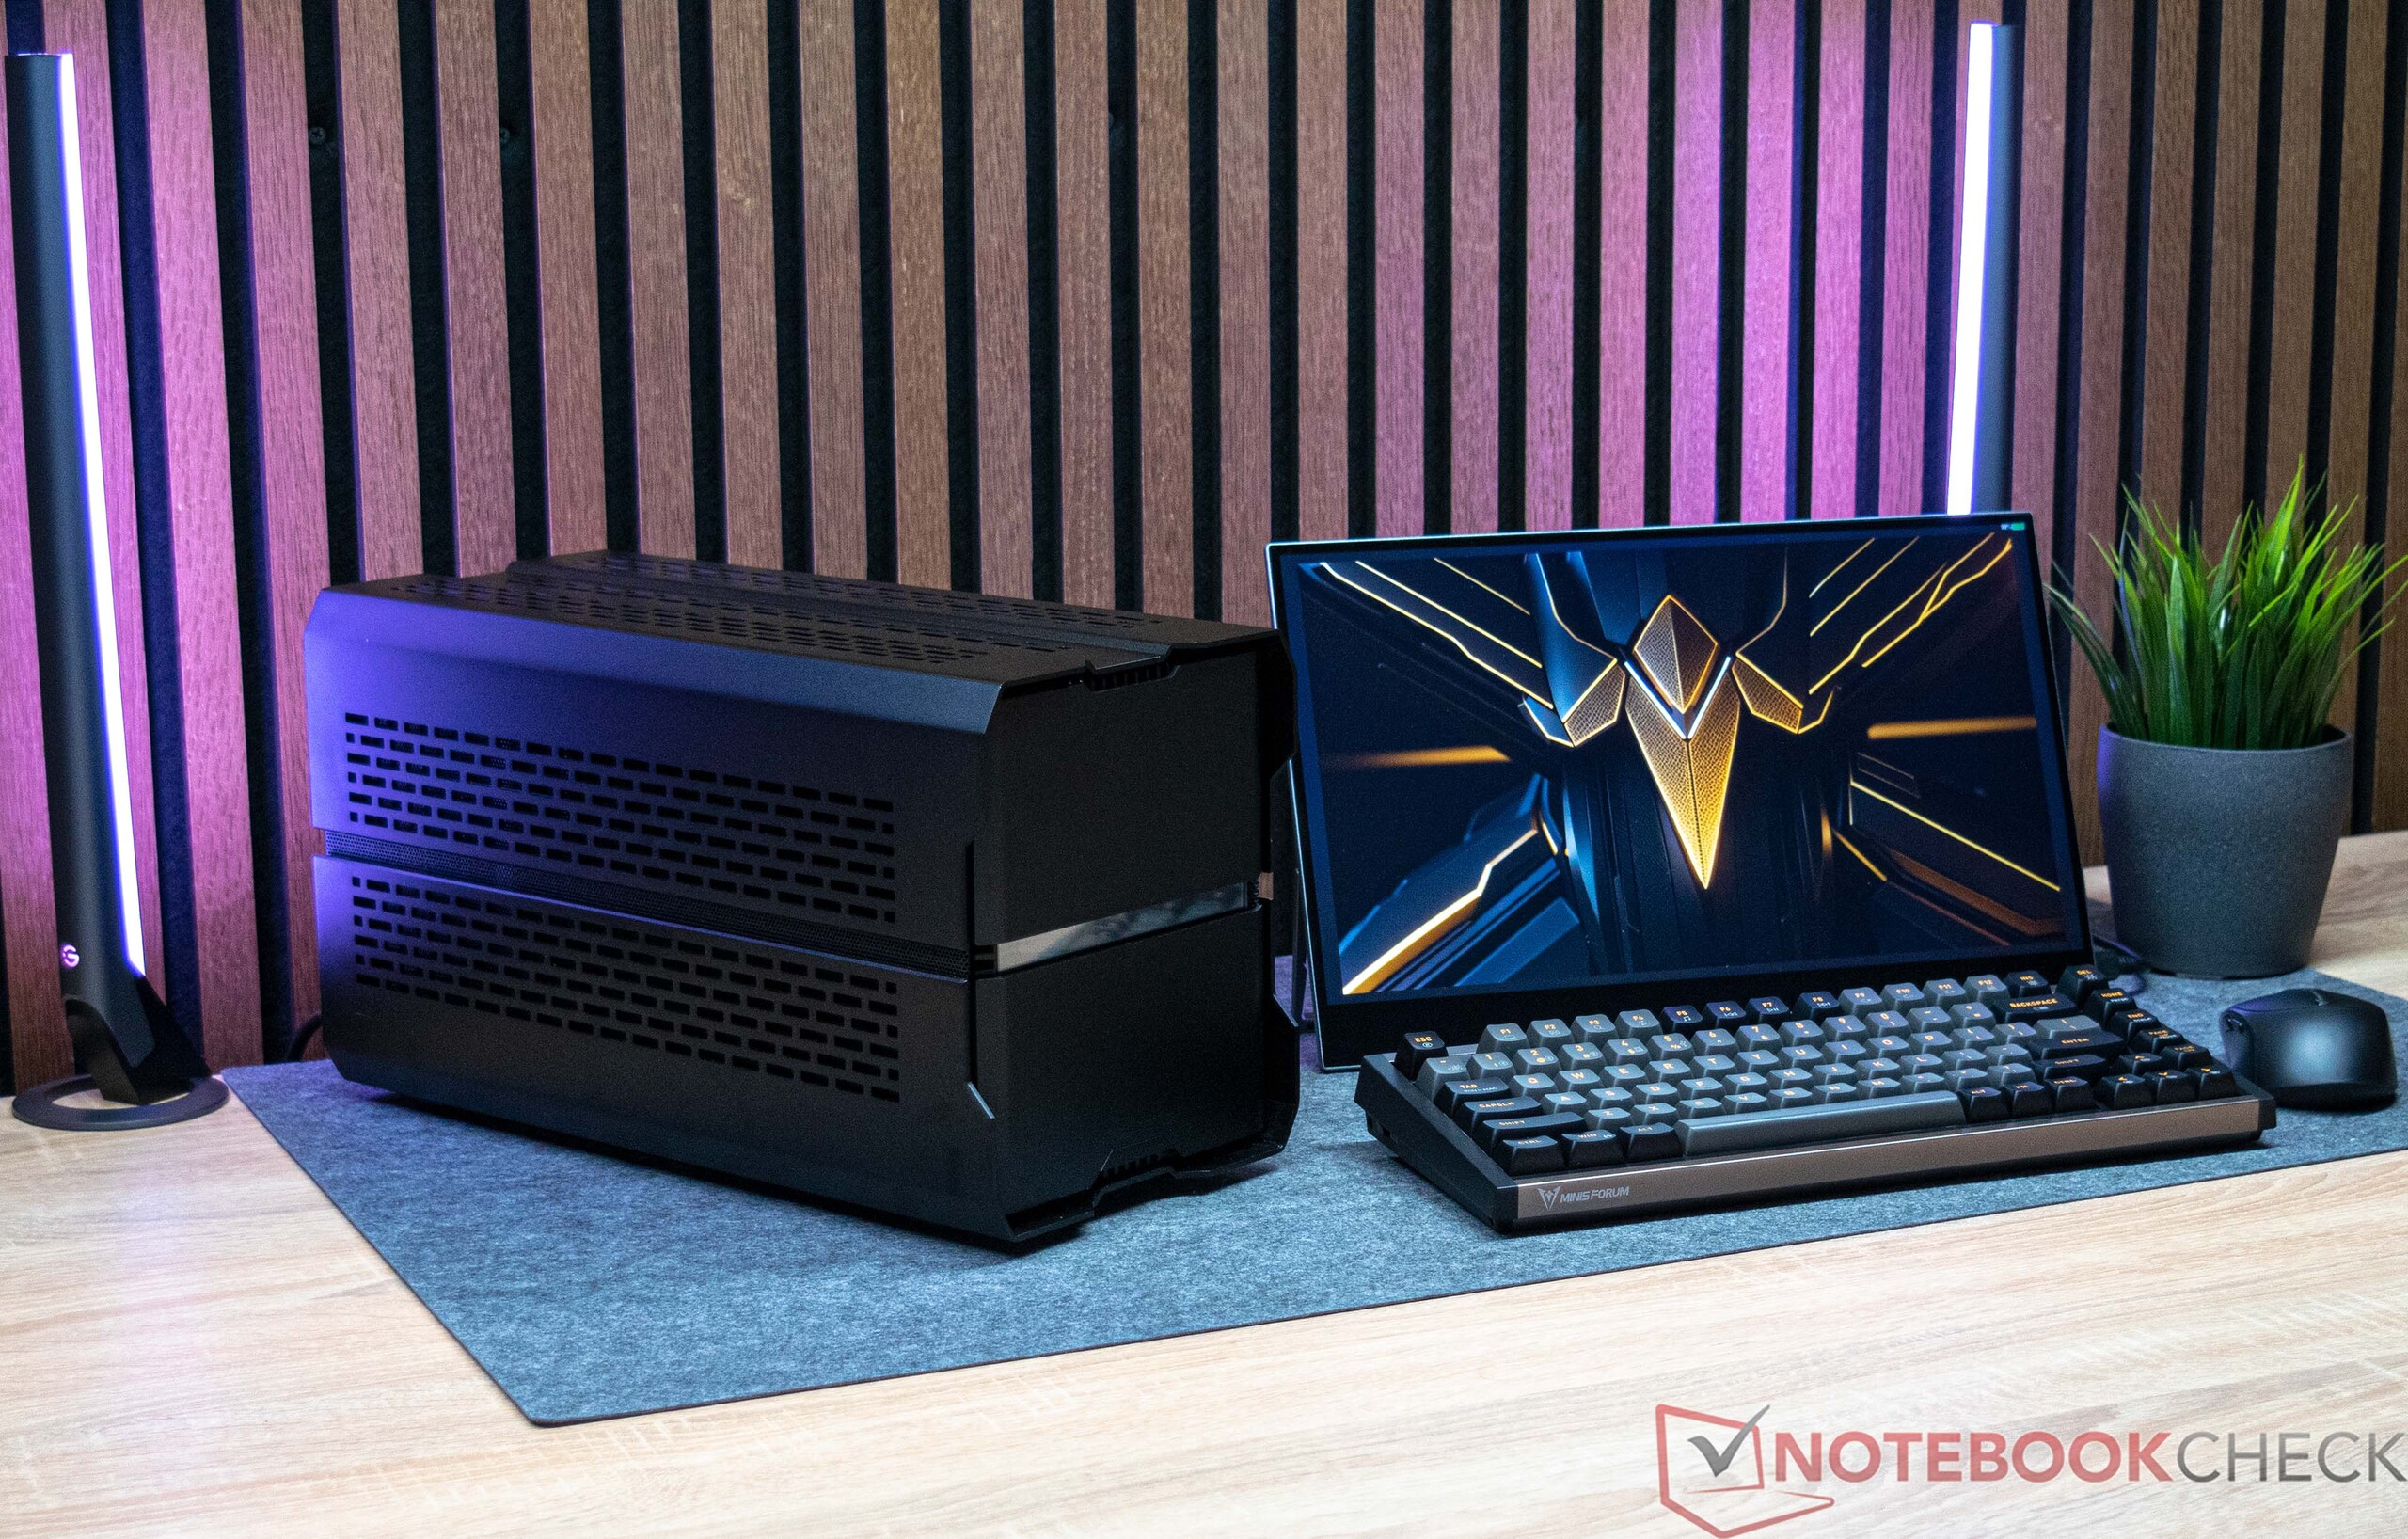
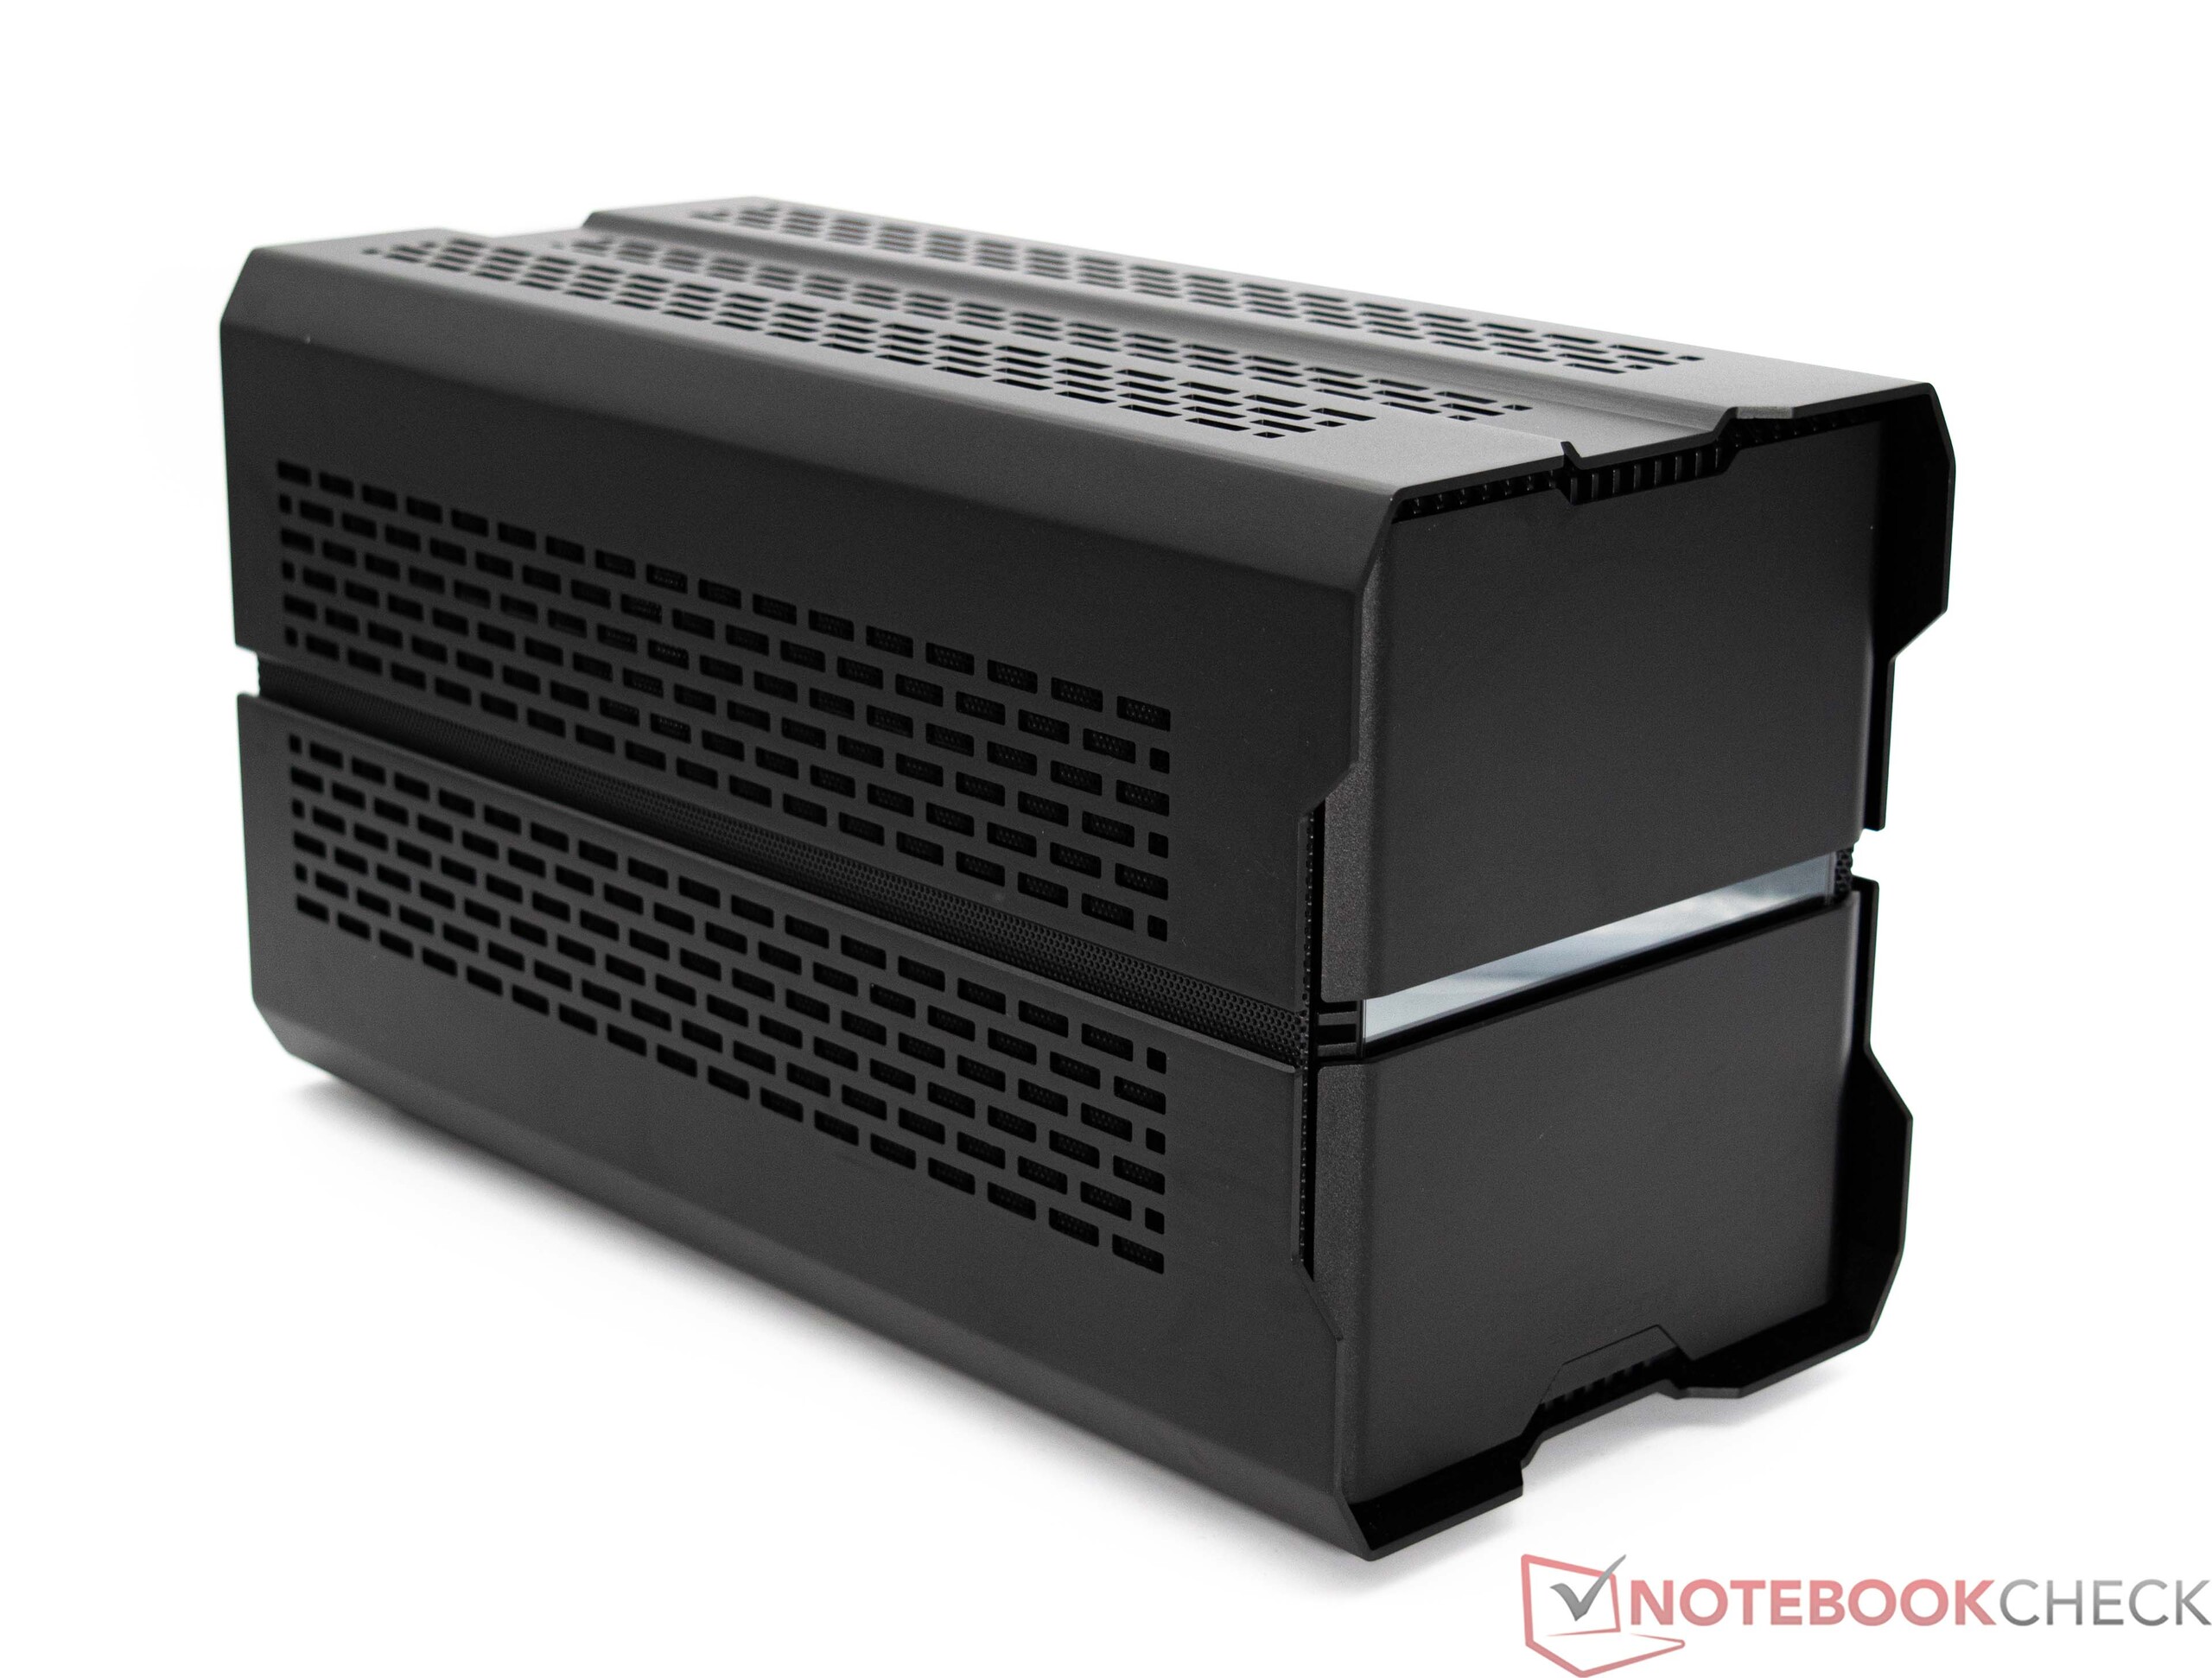
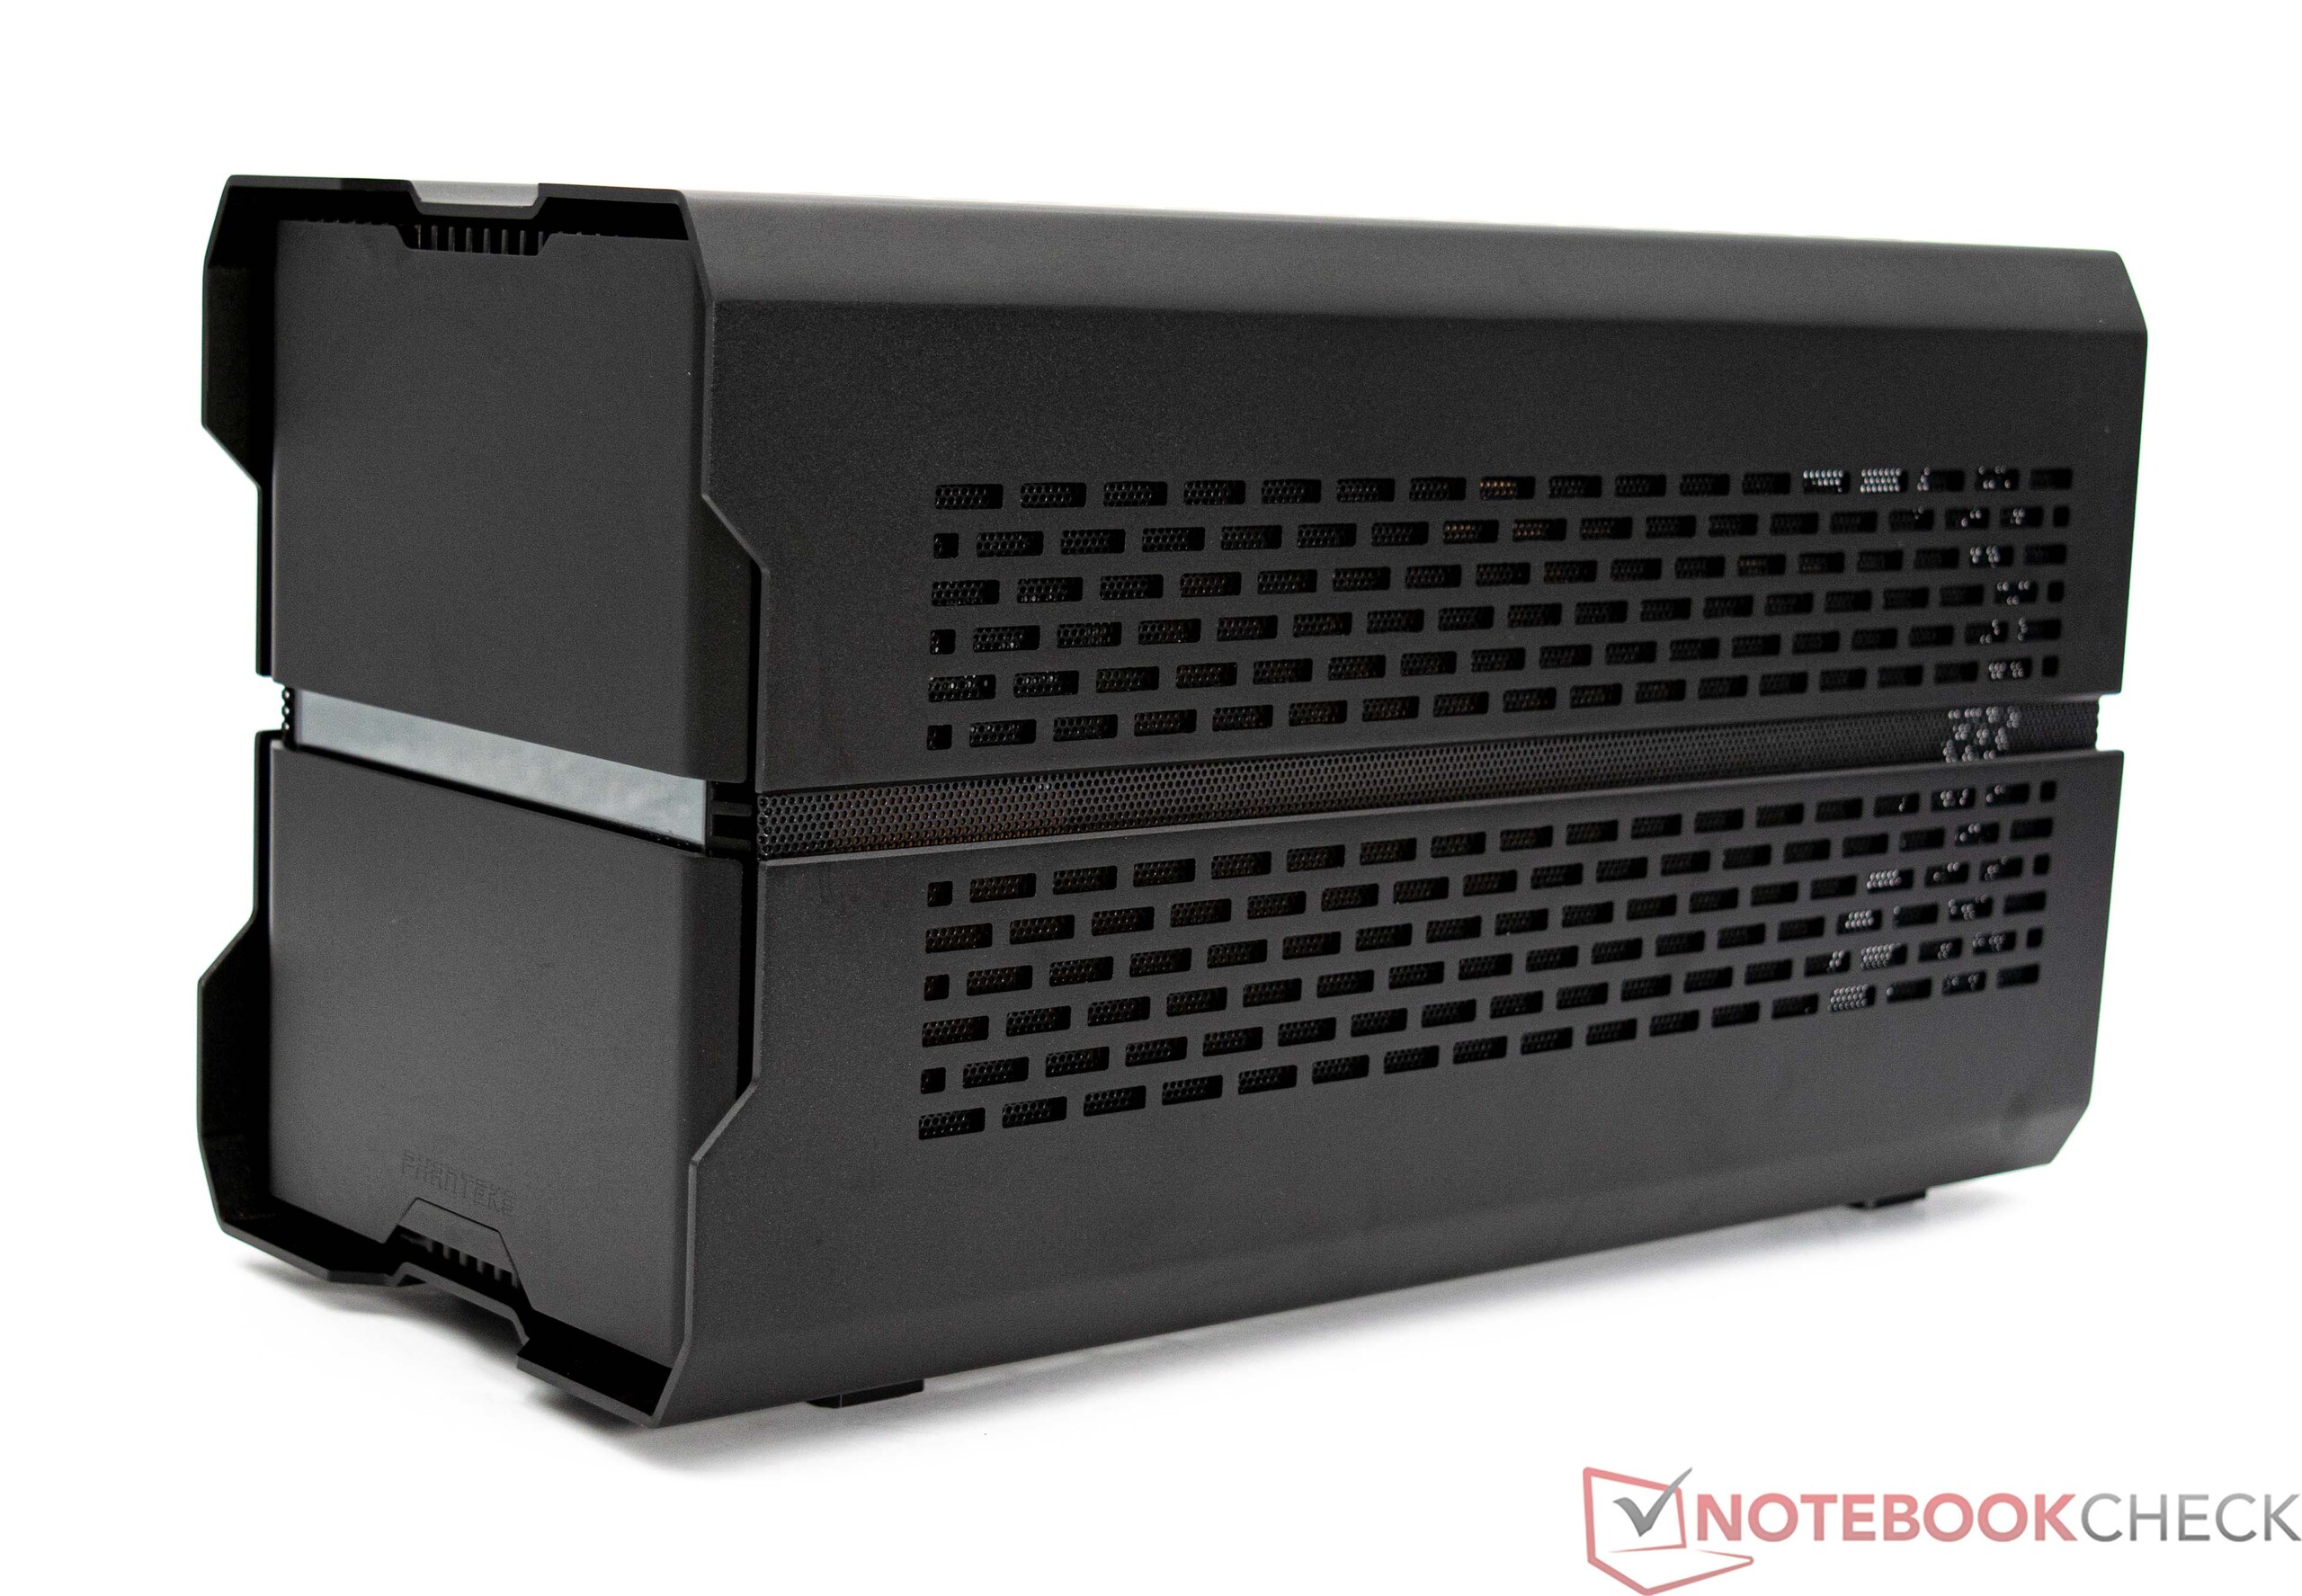
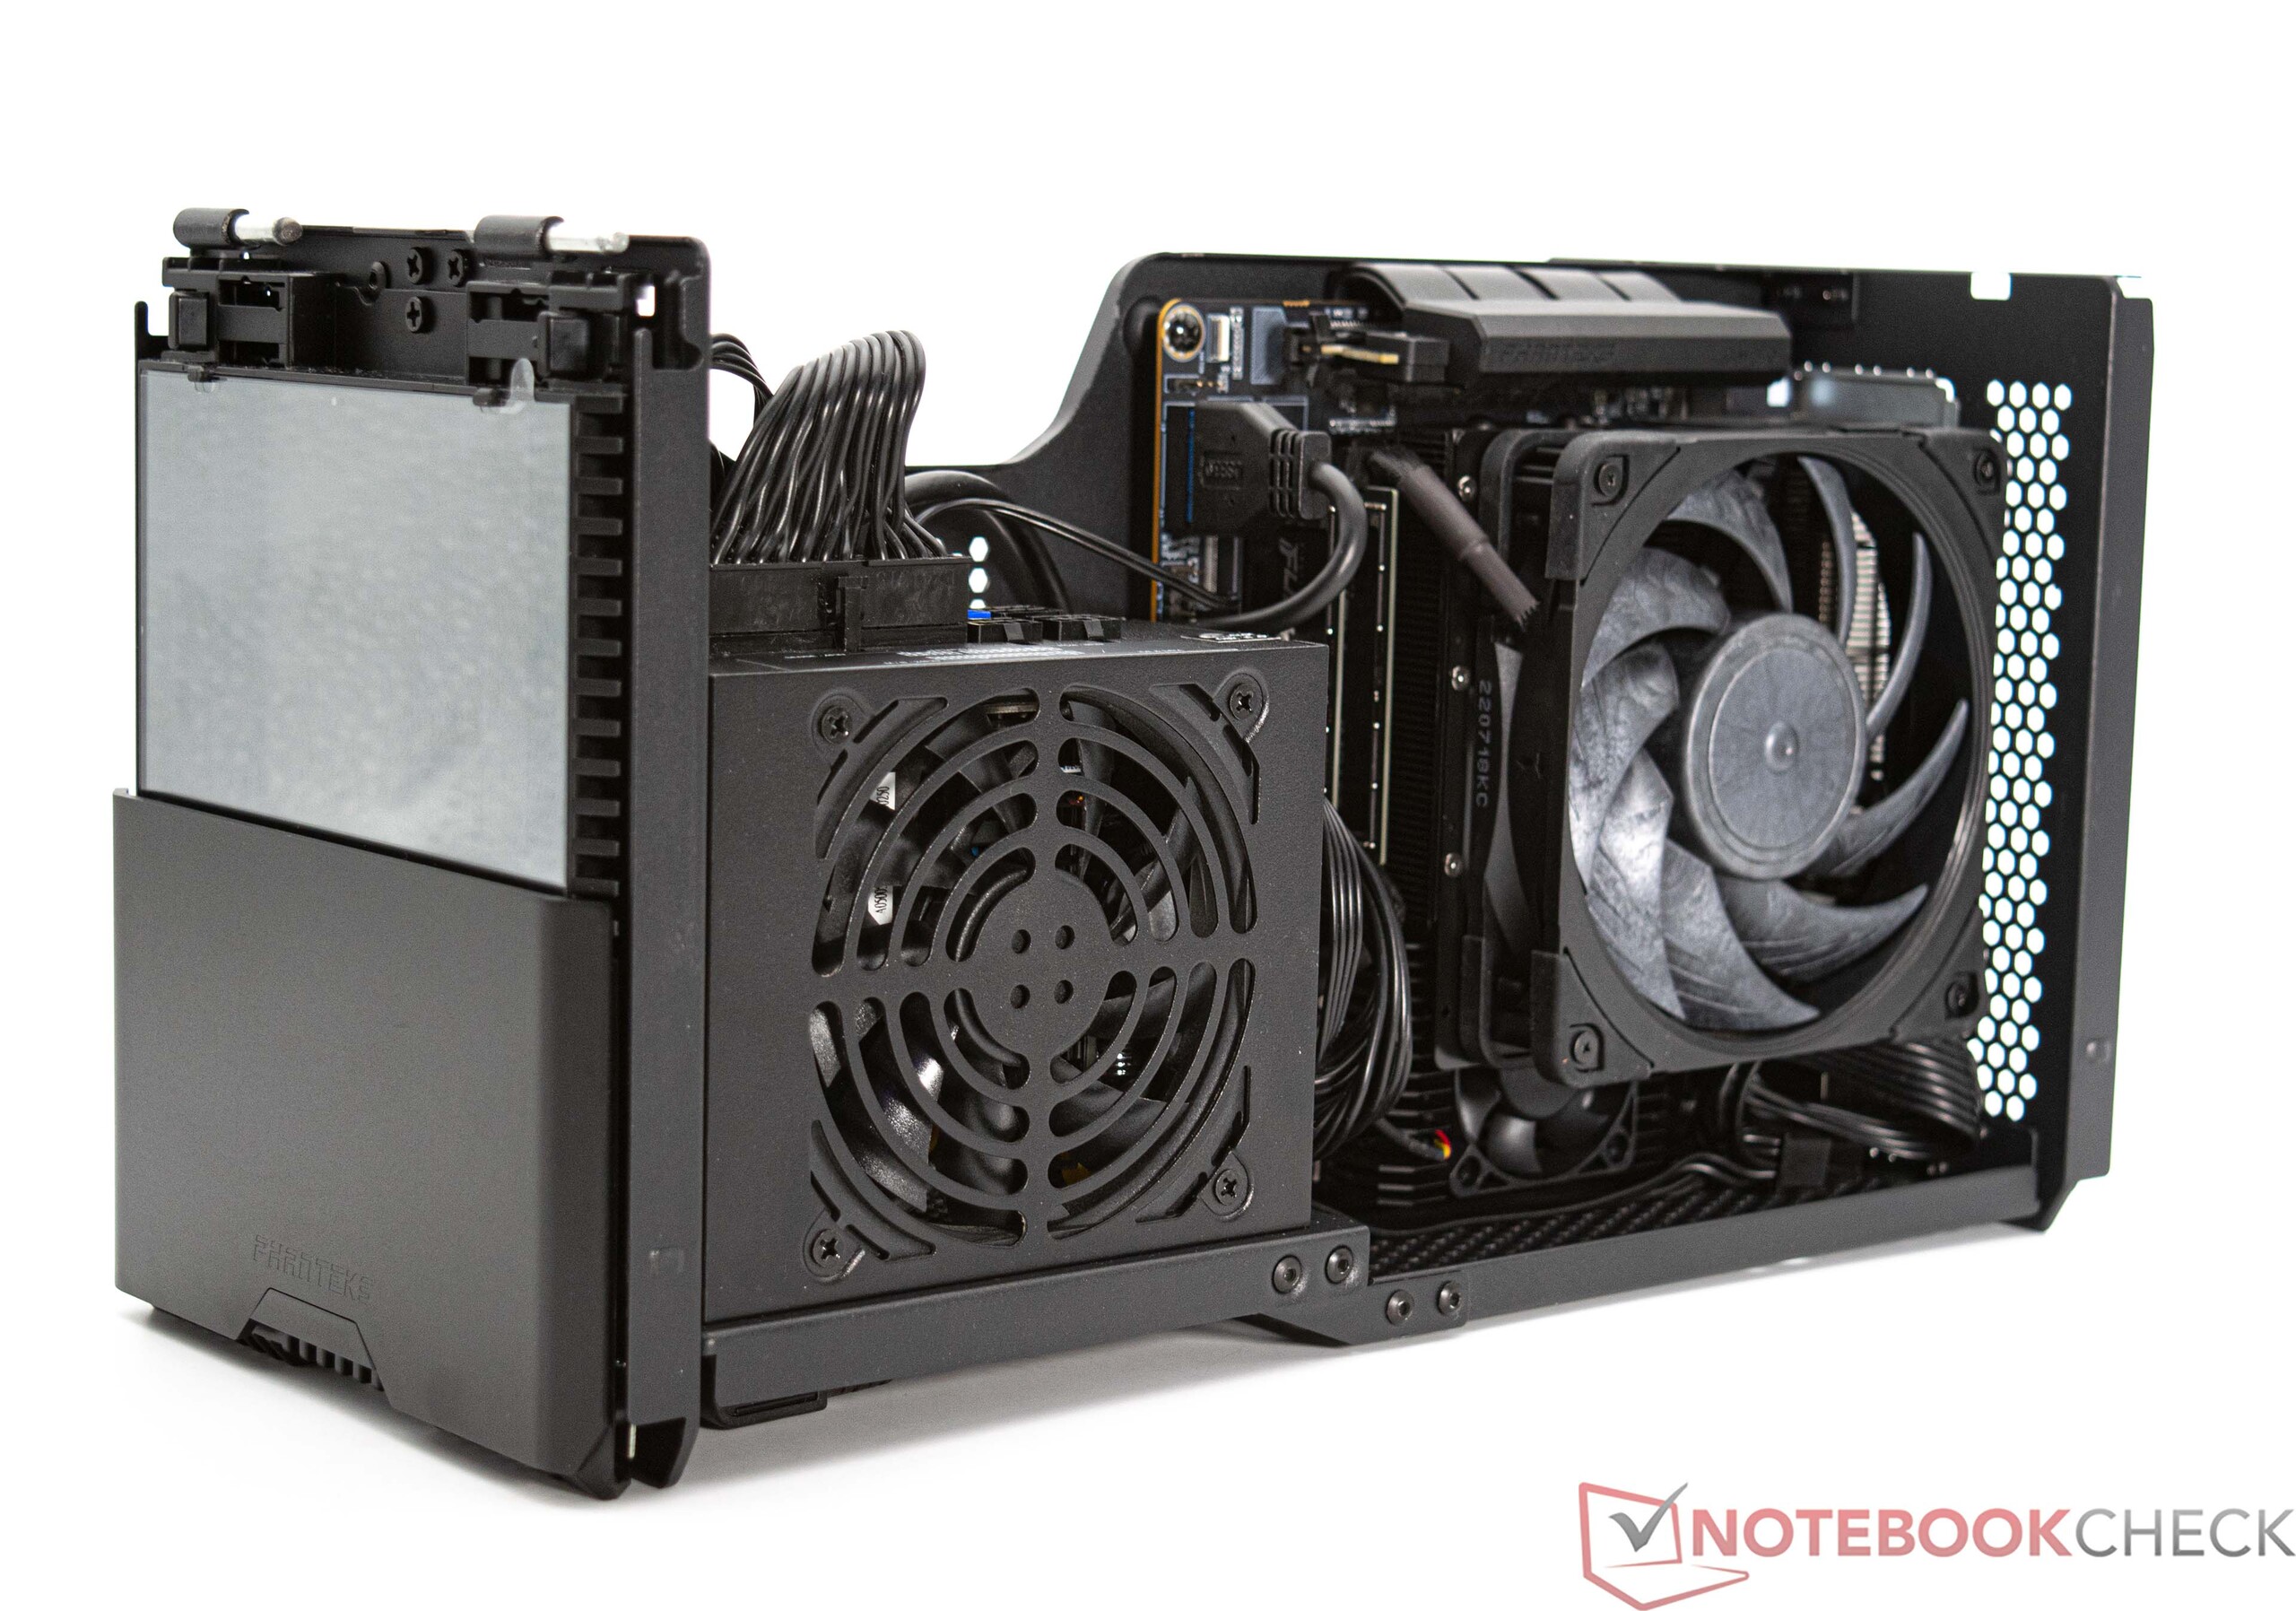
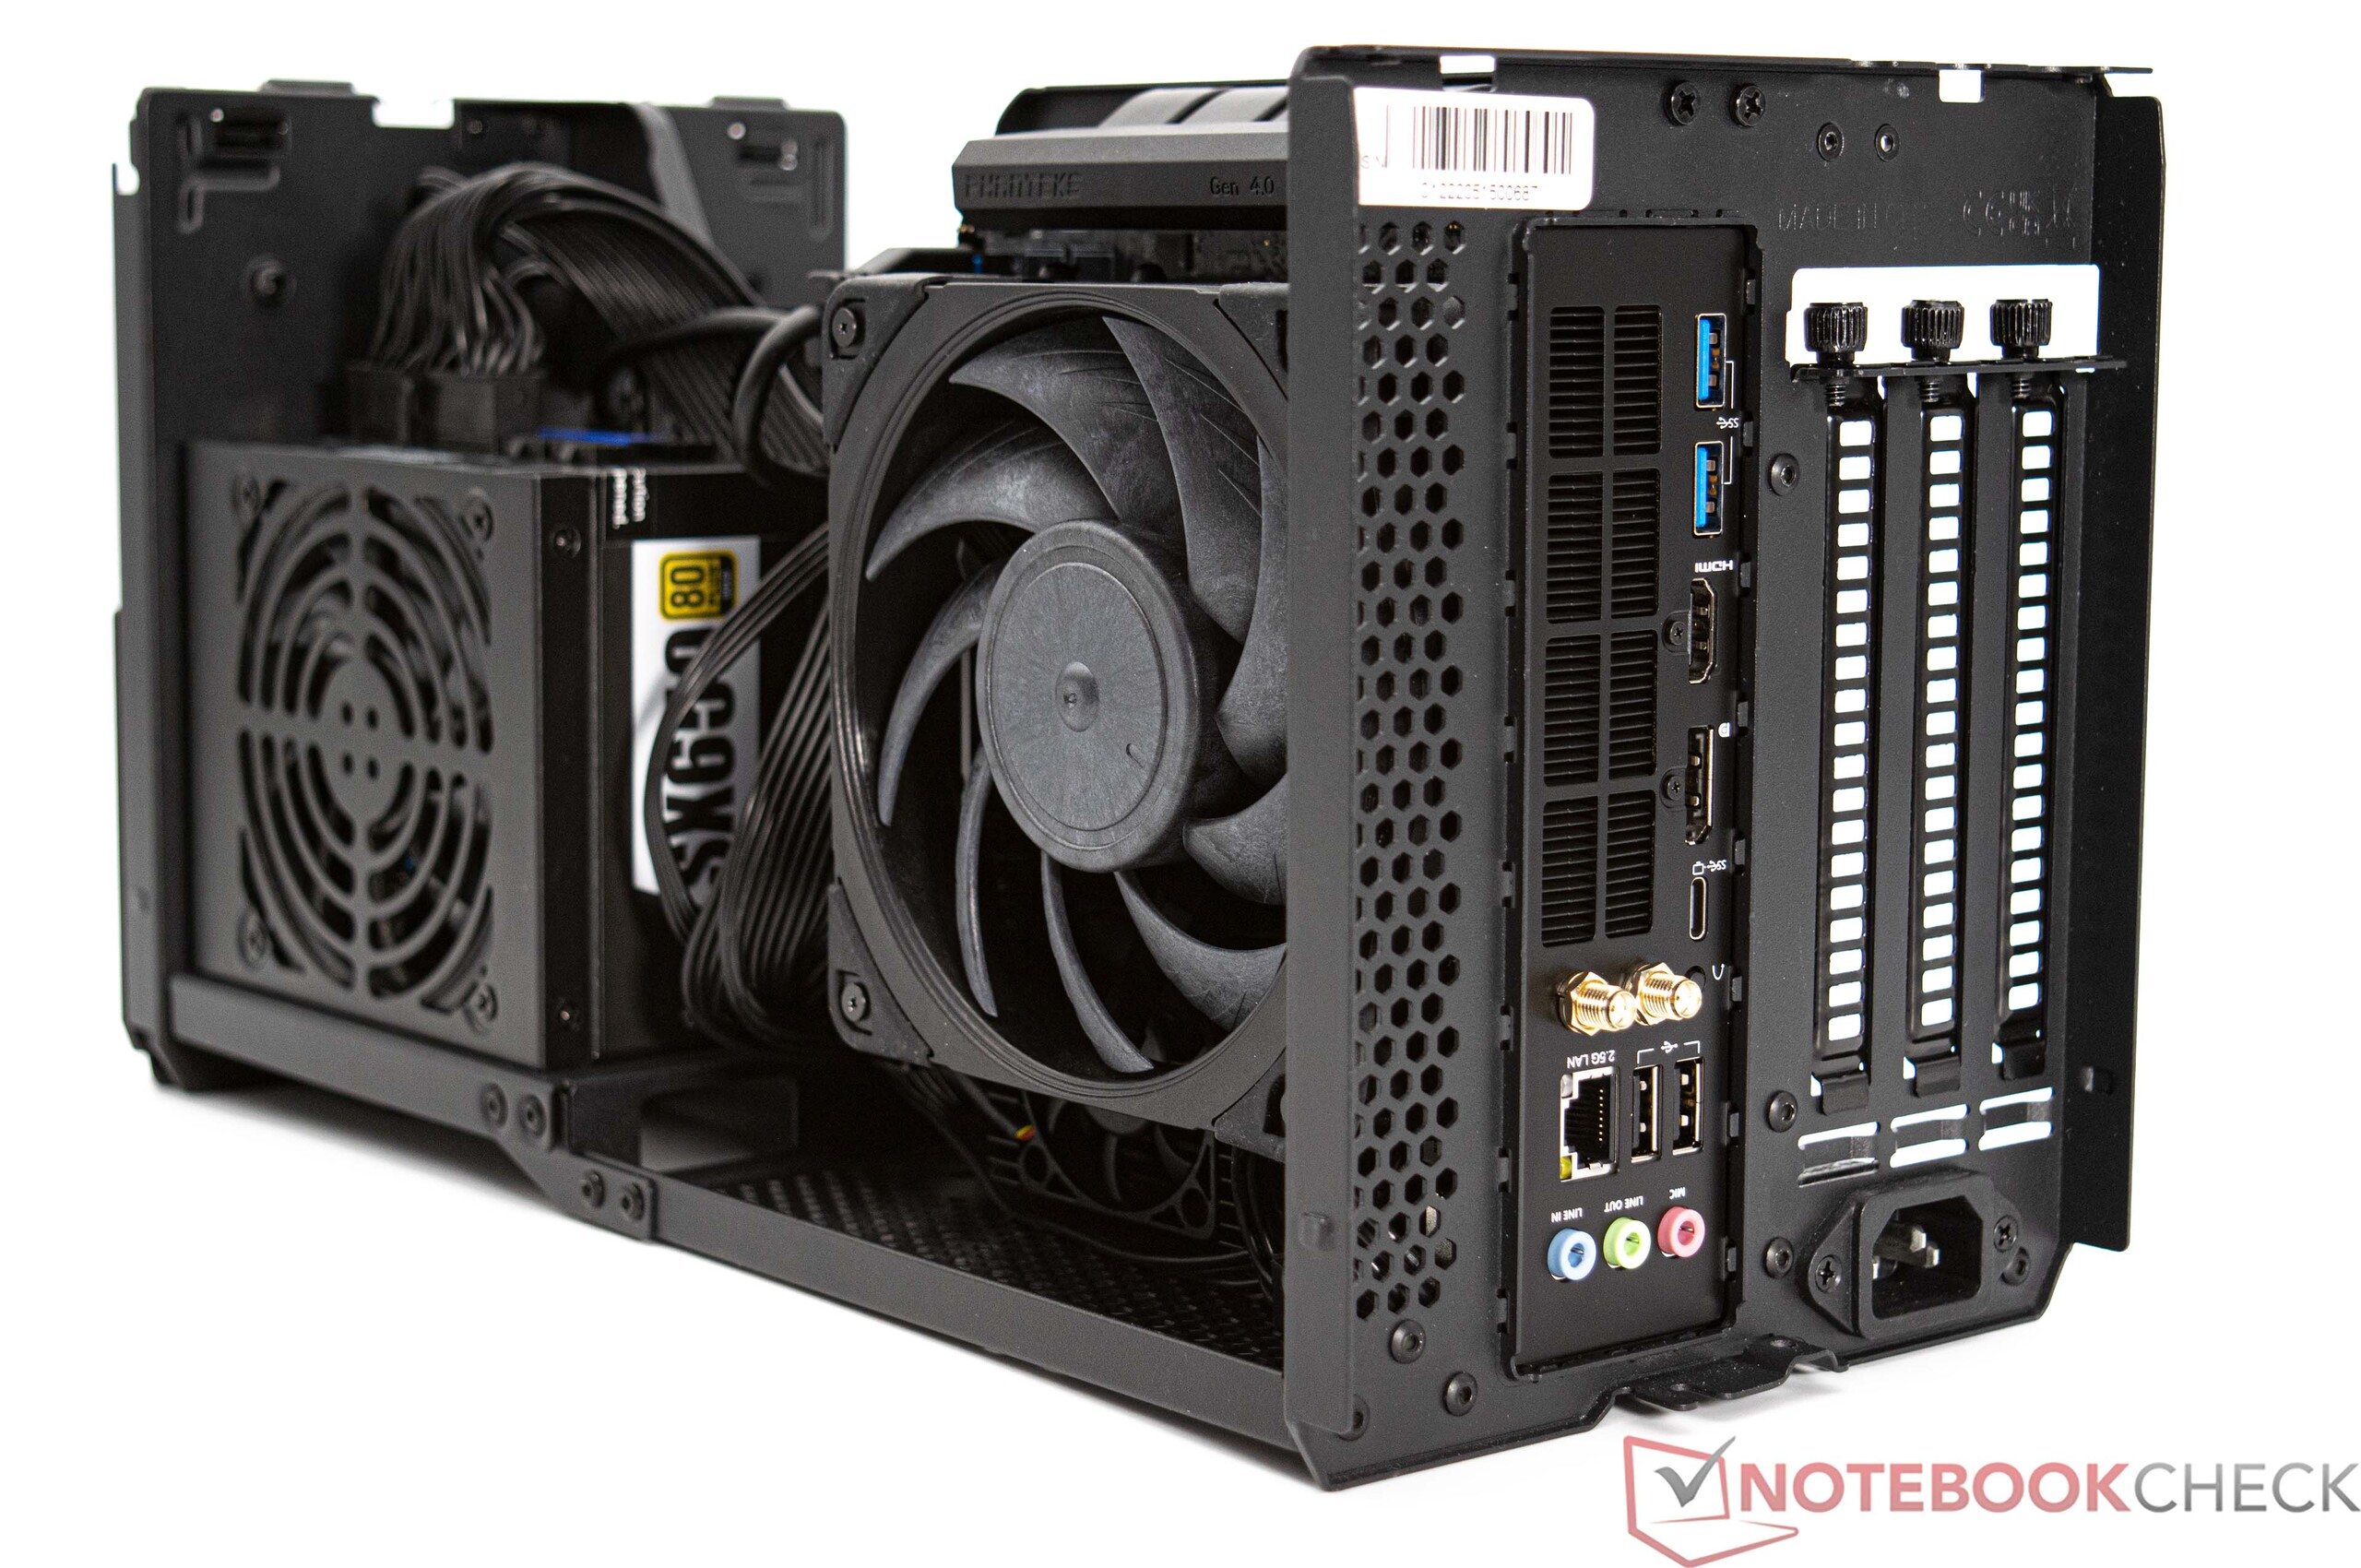
Um den Test so realistisch wie möglich zu gestalten, haben wir uns dazu entschieden, alle Tests ohne dedizierte Grafikkarte im eingebauten Zustand durchzuführen. Das Phanteks Enthoo Evolv Shift XT Gehäuse verwenden wir, welches aufgrund der Kompaktheit eine gute Basis bietet. Als Gehäuse haben wir das Phanteks Enthoo Evolv Shift XT genutzt.
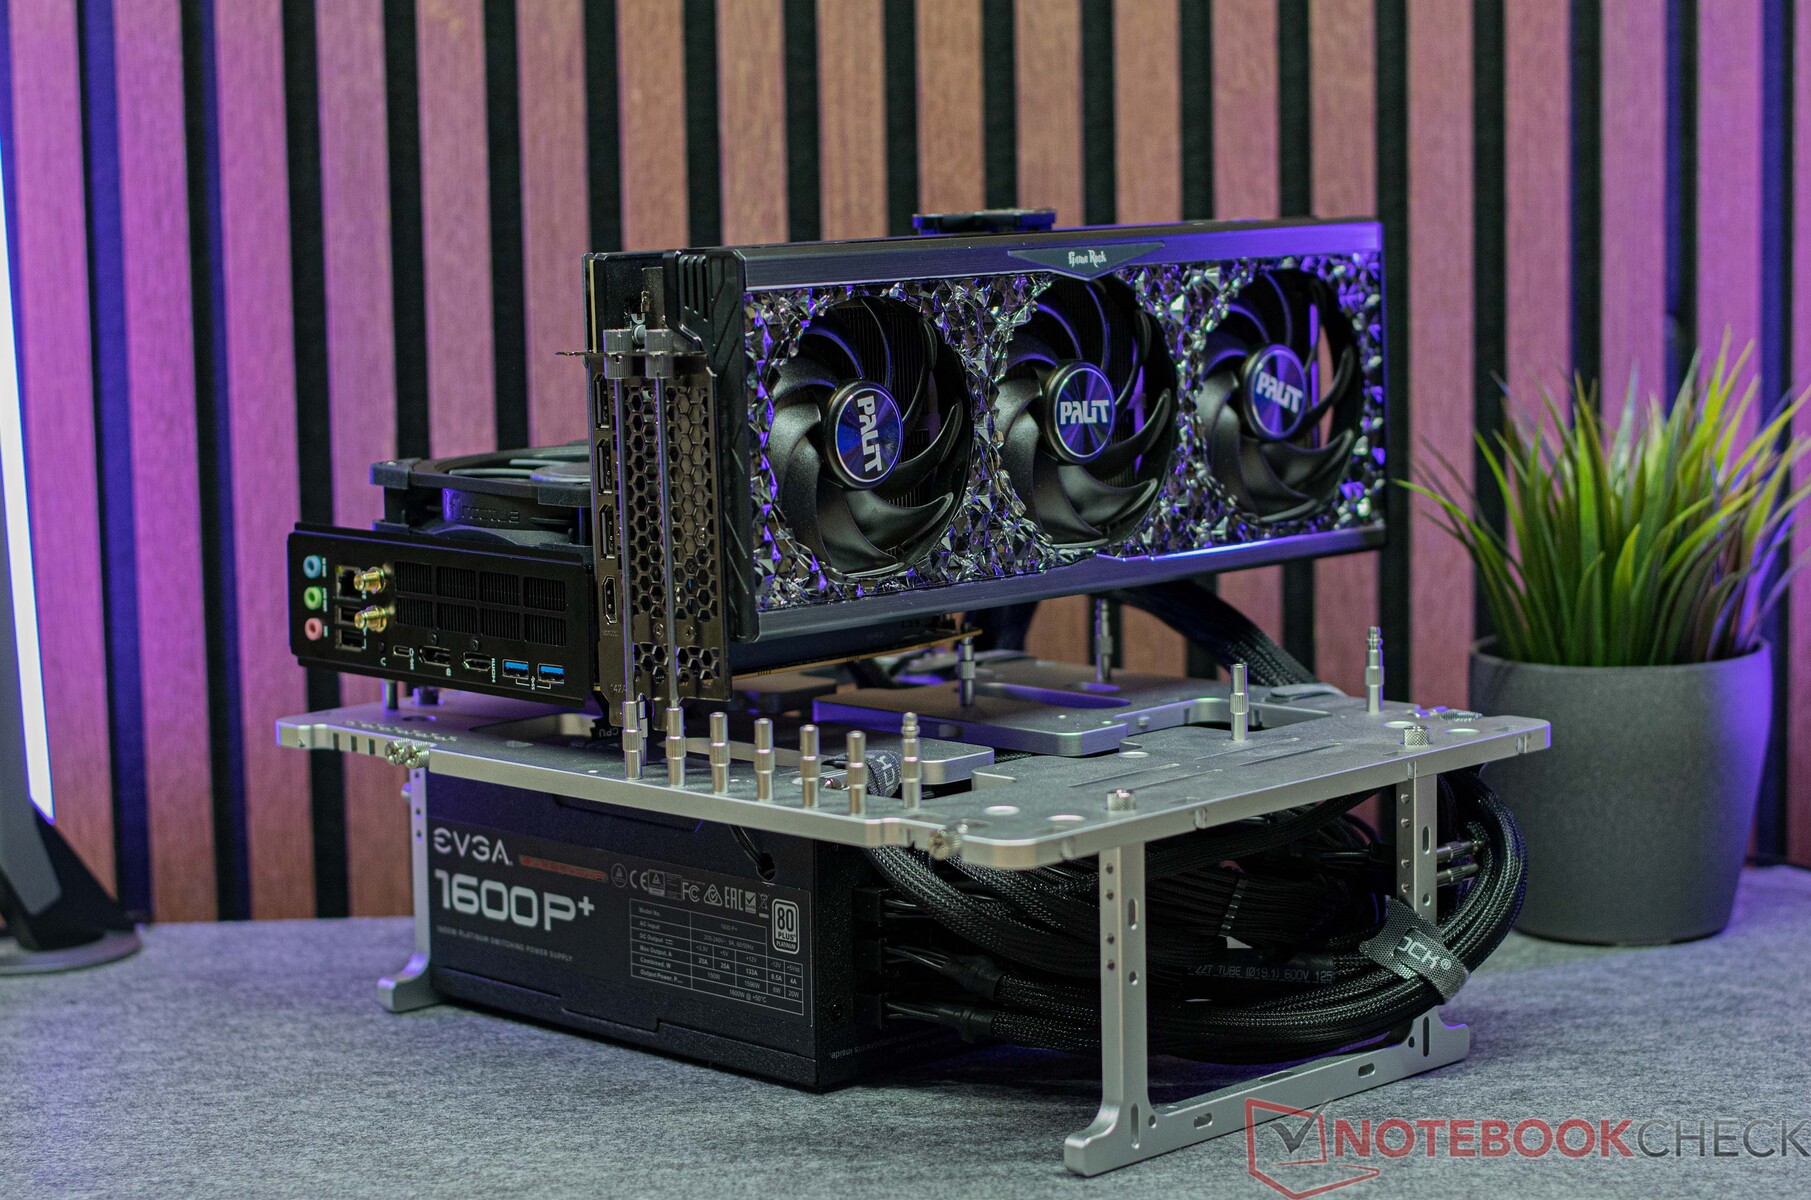
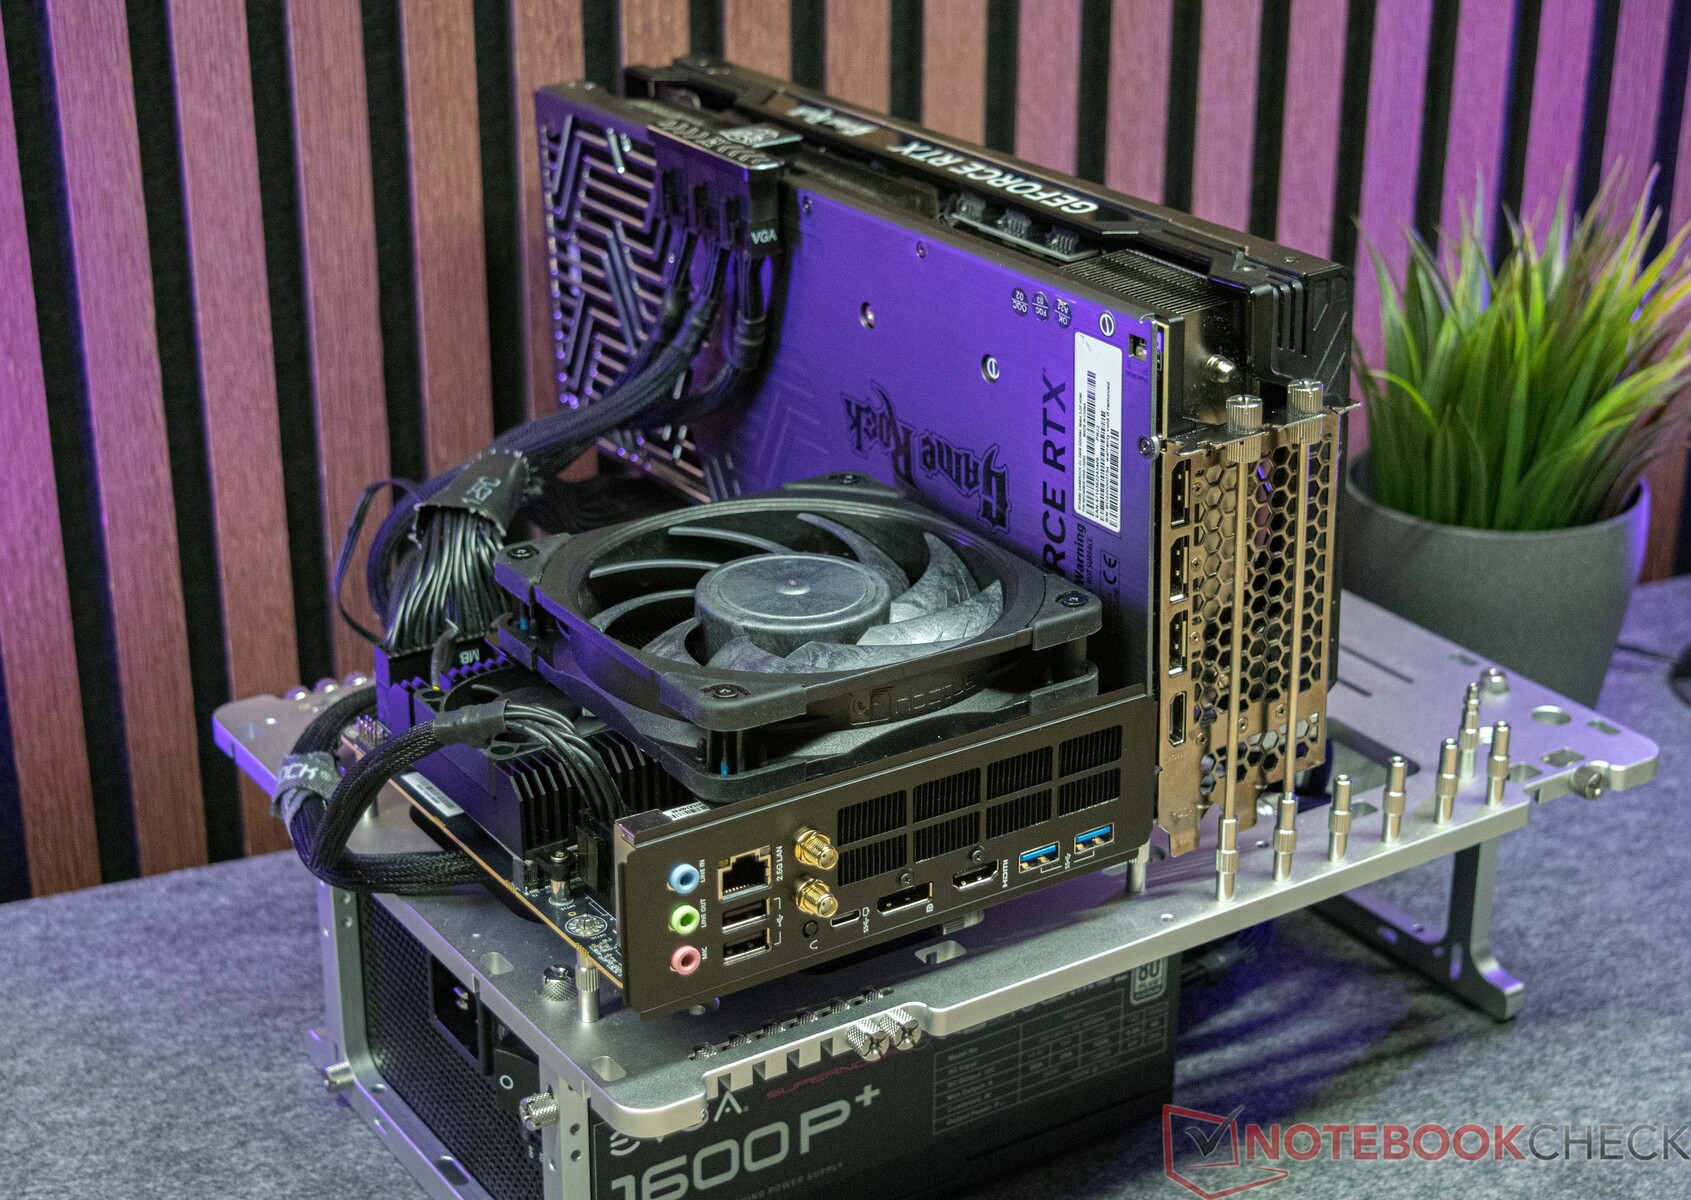
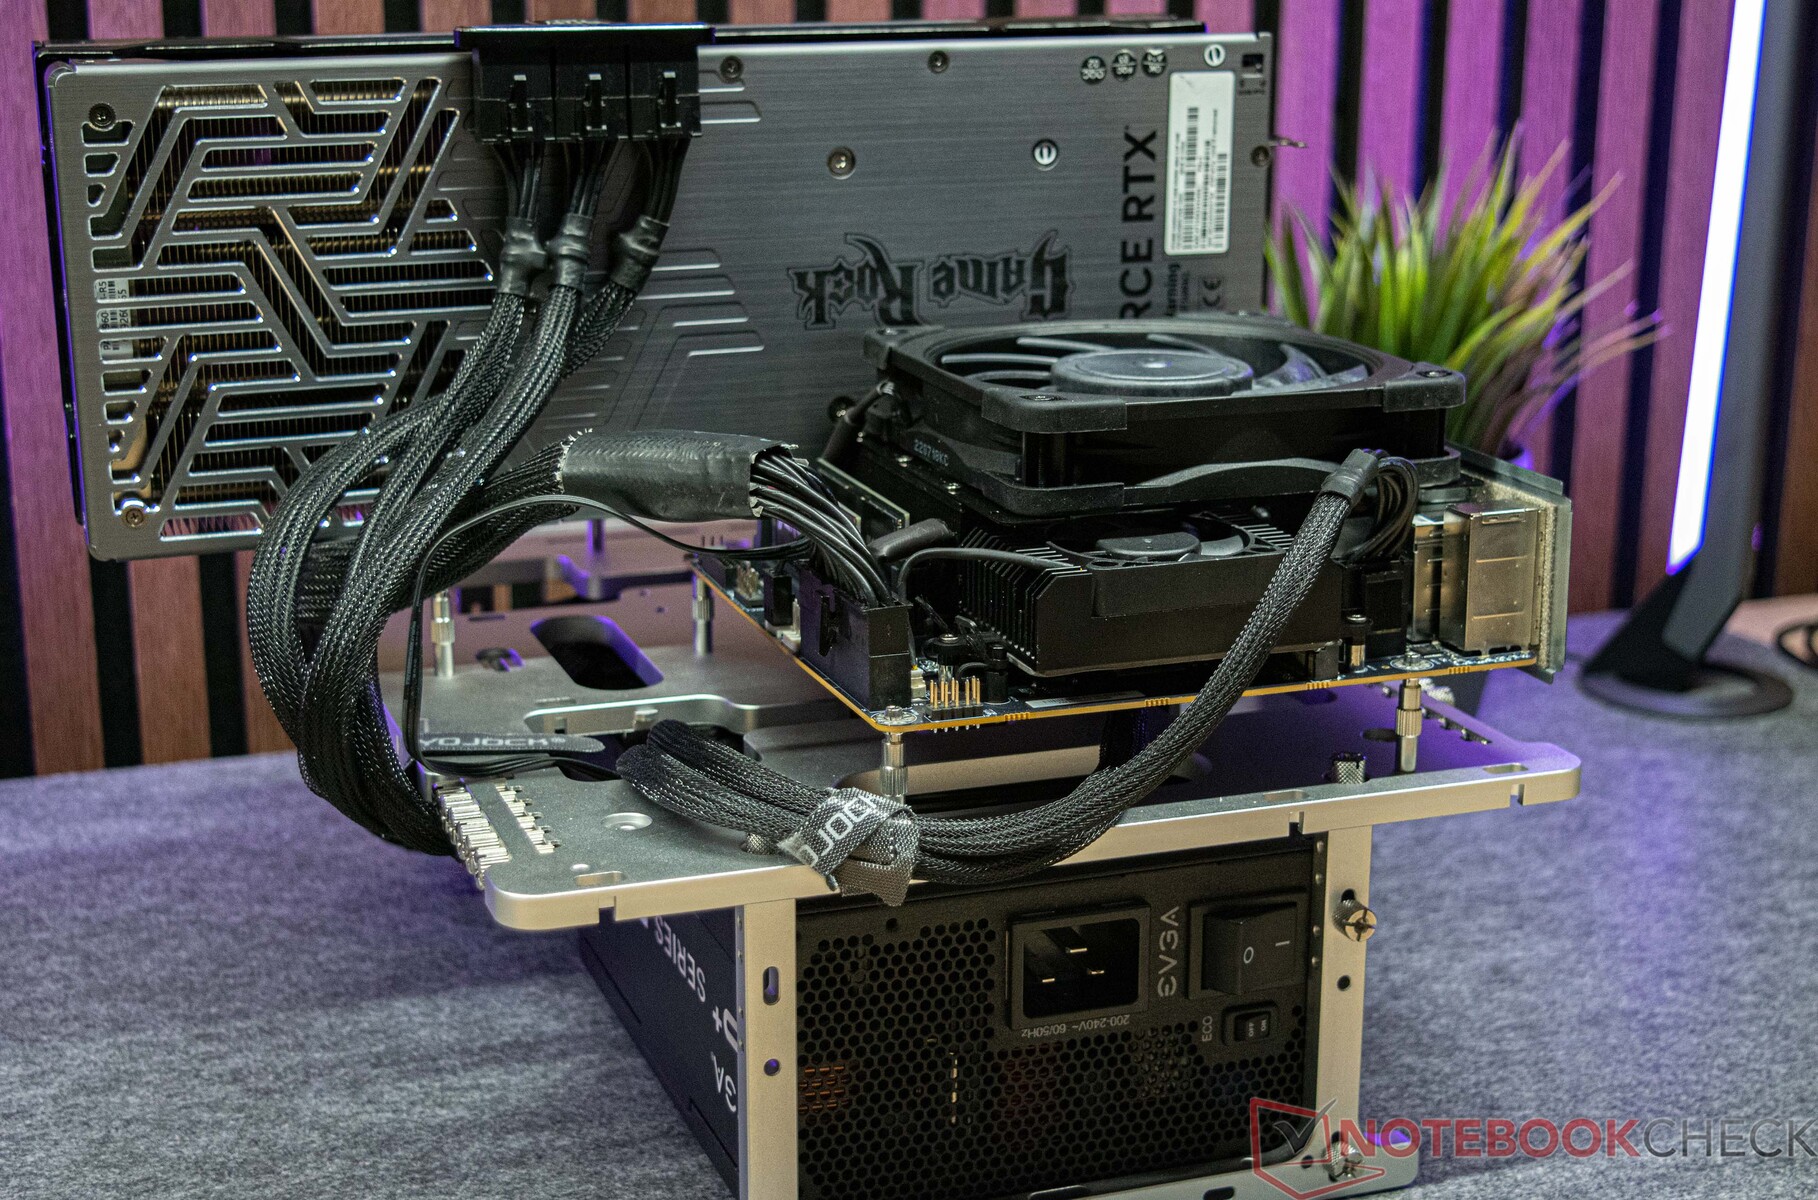
Für den Leistungsvergleich mit dedizierter Grafikkarte haben wir das Minisforum BD770i zusammen mit der Palit GeForce RTX 4090 GameRock OC im offenen Aufbau getestet. Aufgrund der Größe der Grafikkarte war ein Einbau in das Phanteks Enthoo Evolv Shift XT nicht möglich. In das Gehäuse passen Grafikkarten, welche eine Länge von 32,4 Zentimeter nicht überschreiten.
Lieferumfang
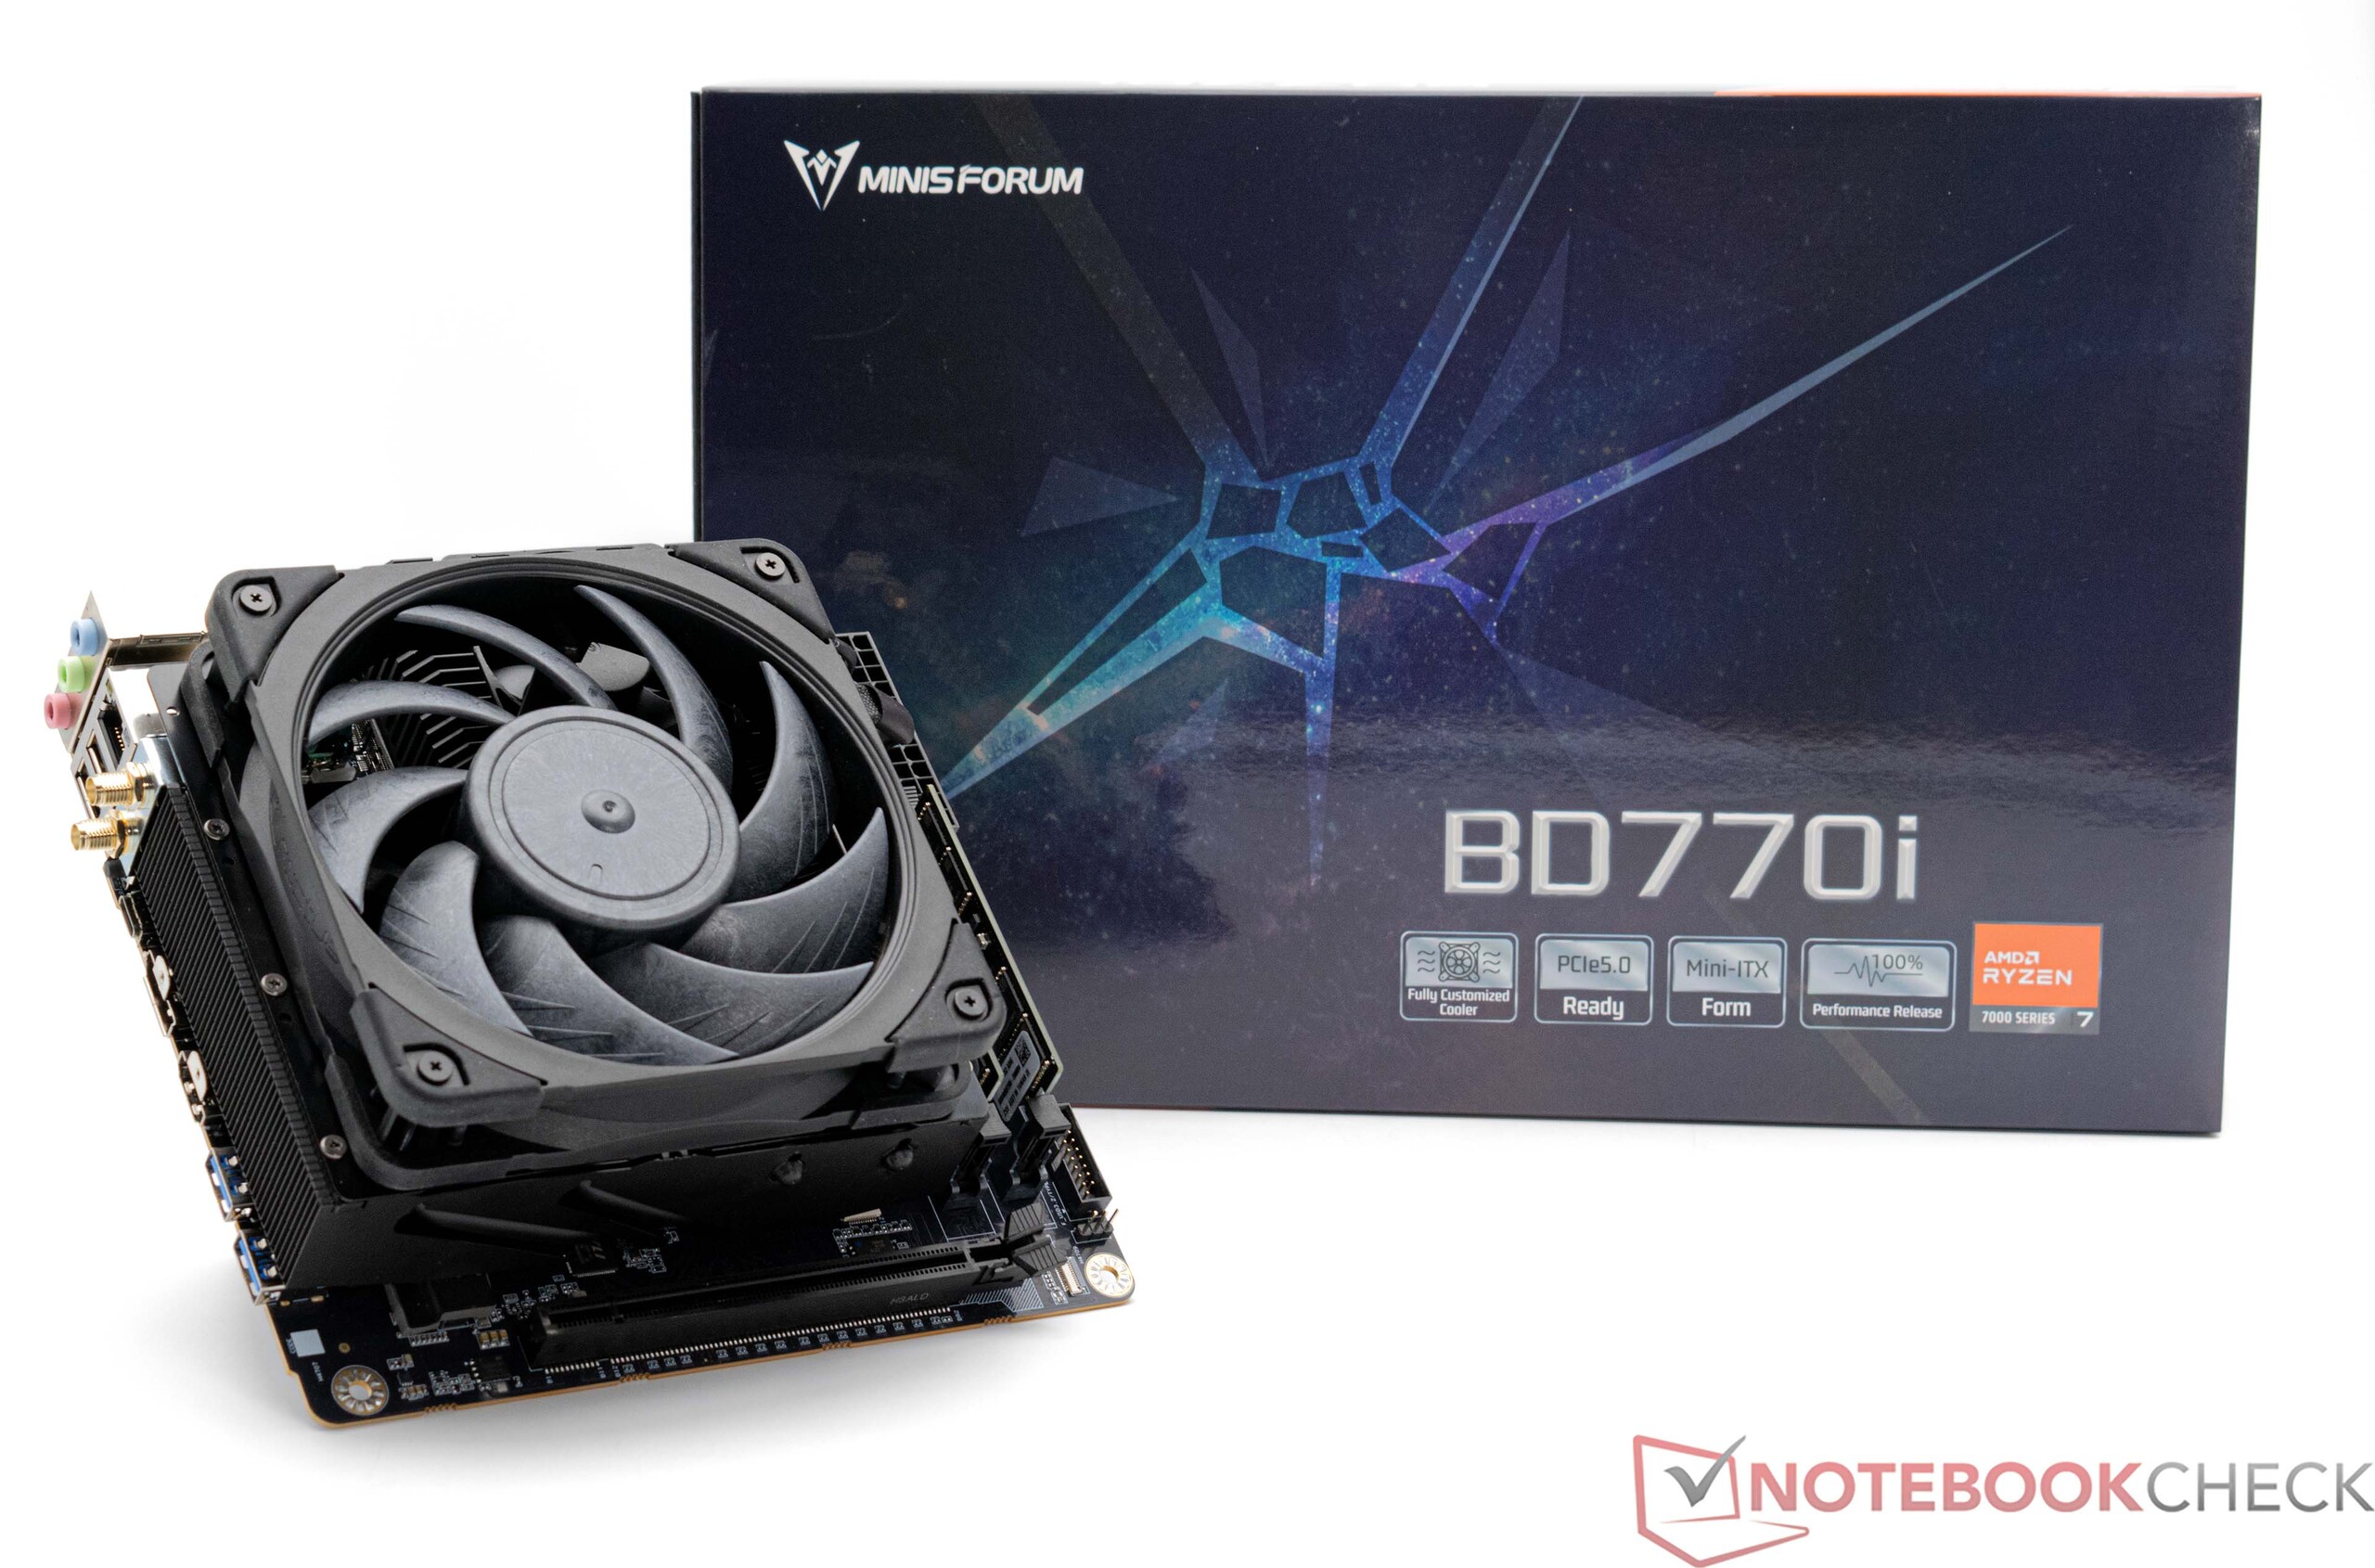
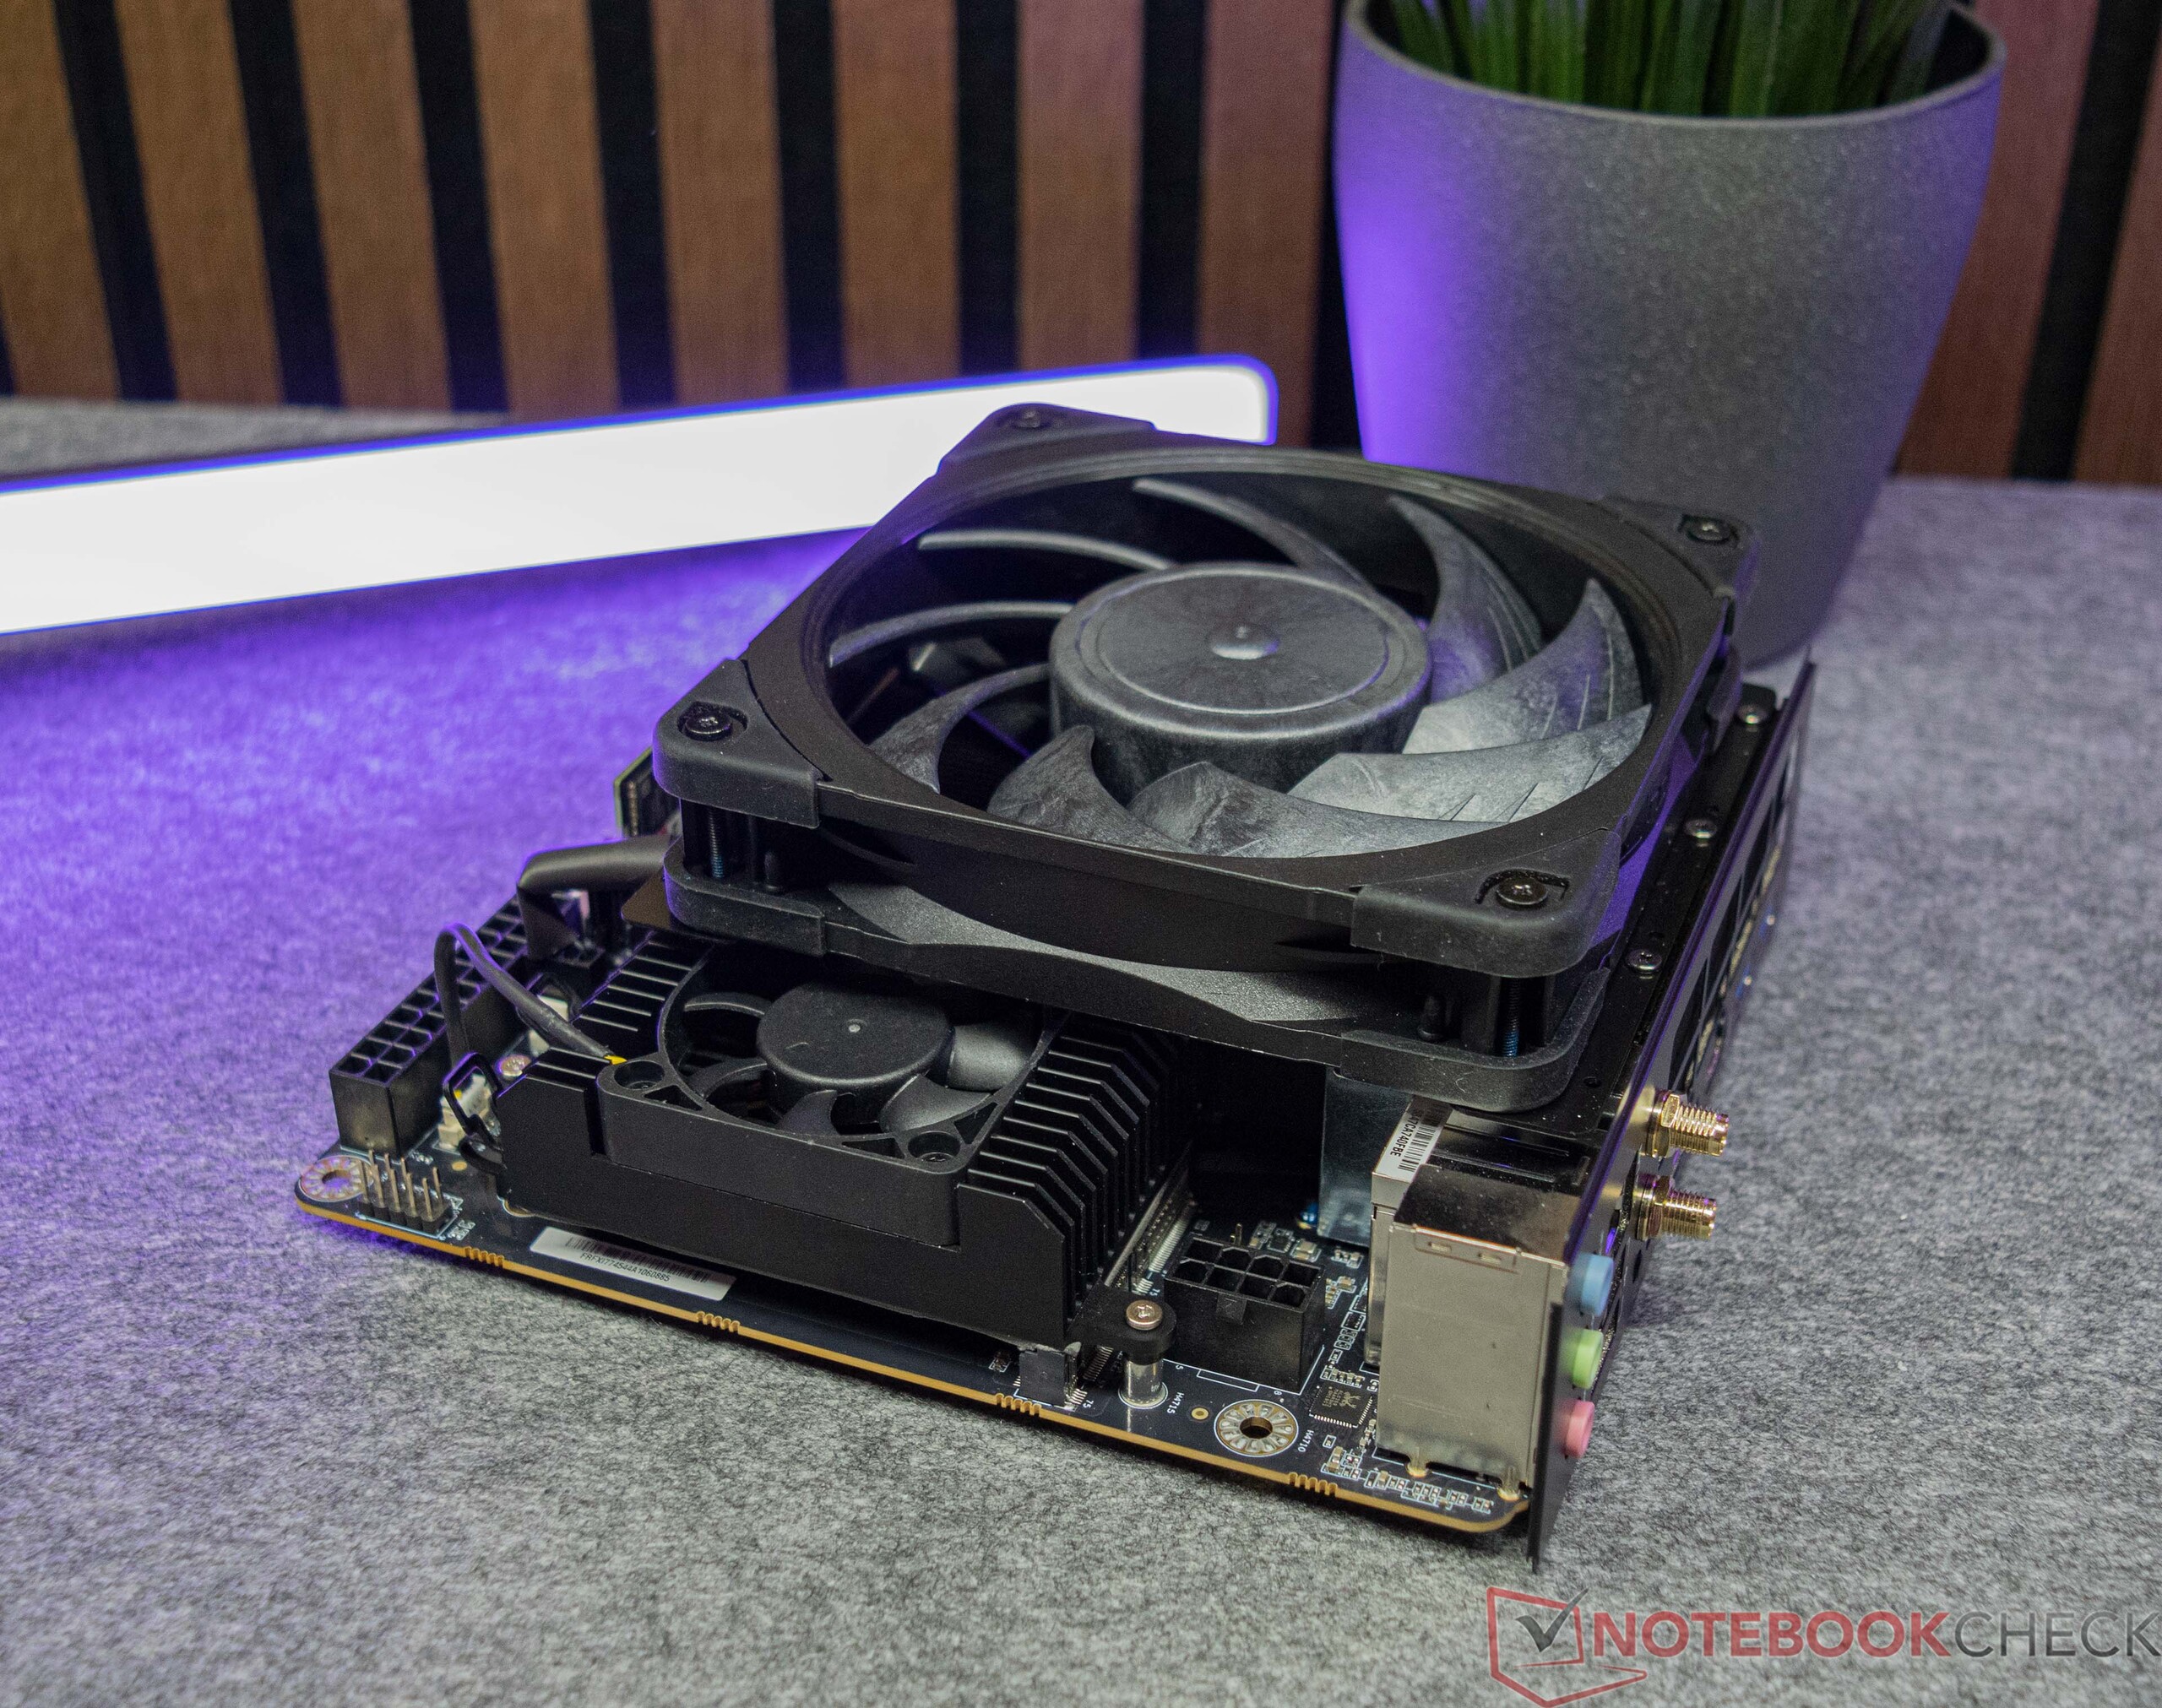
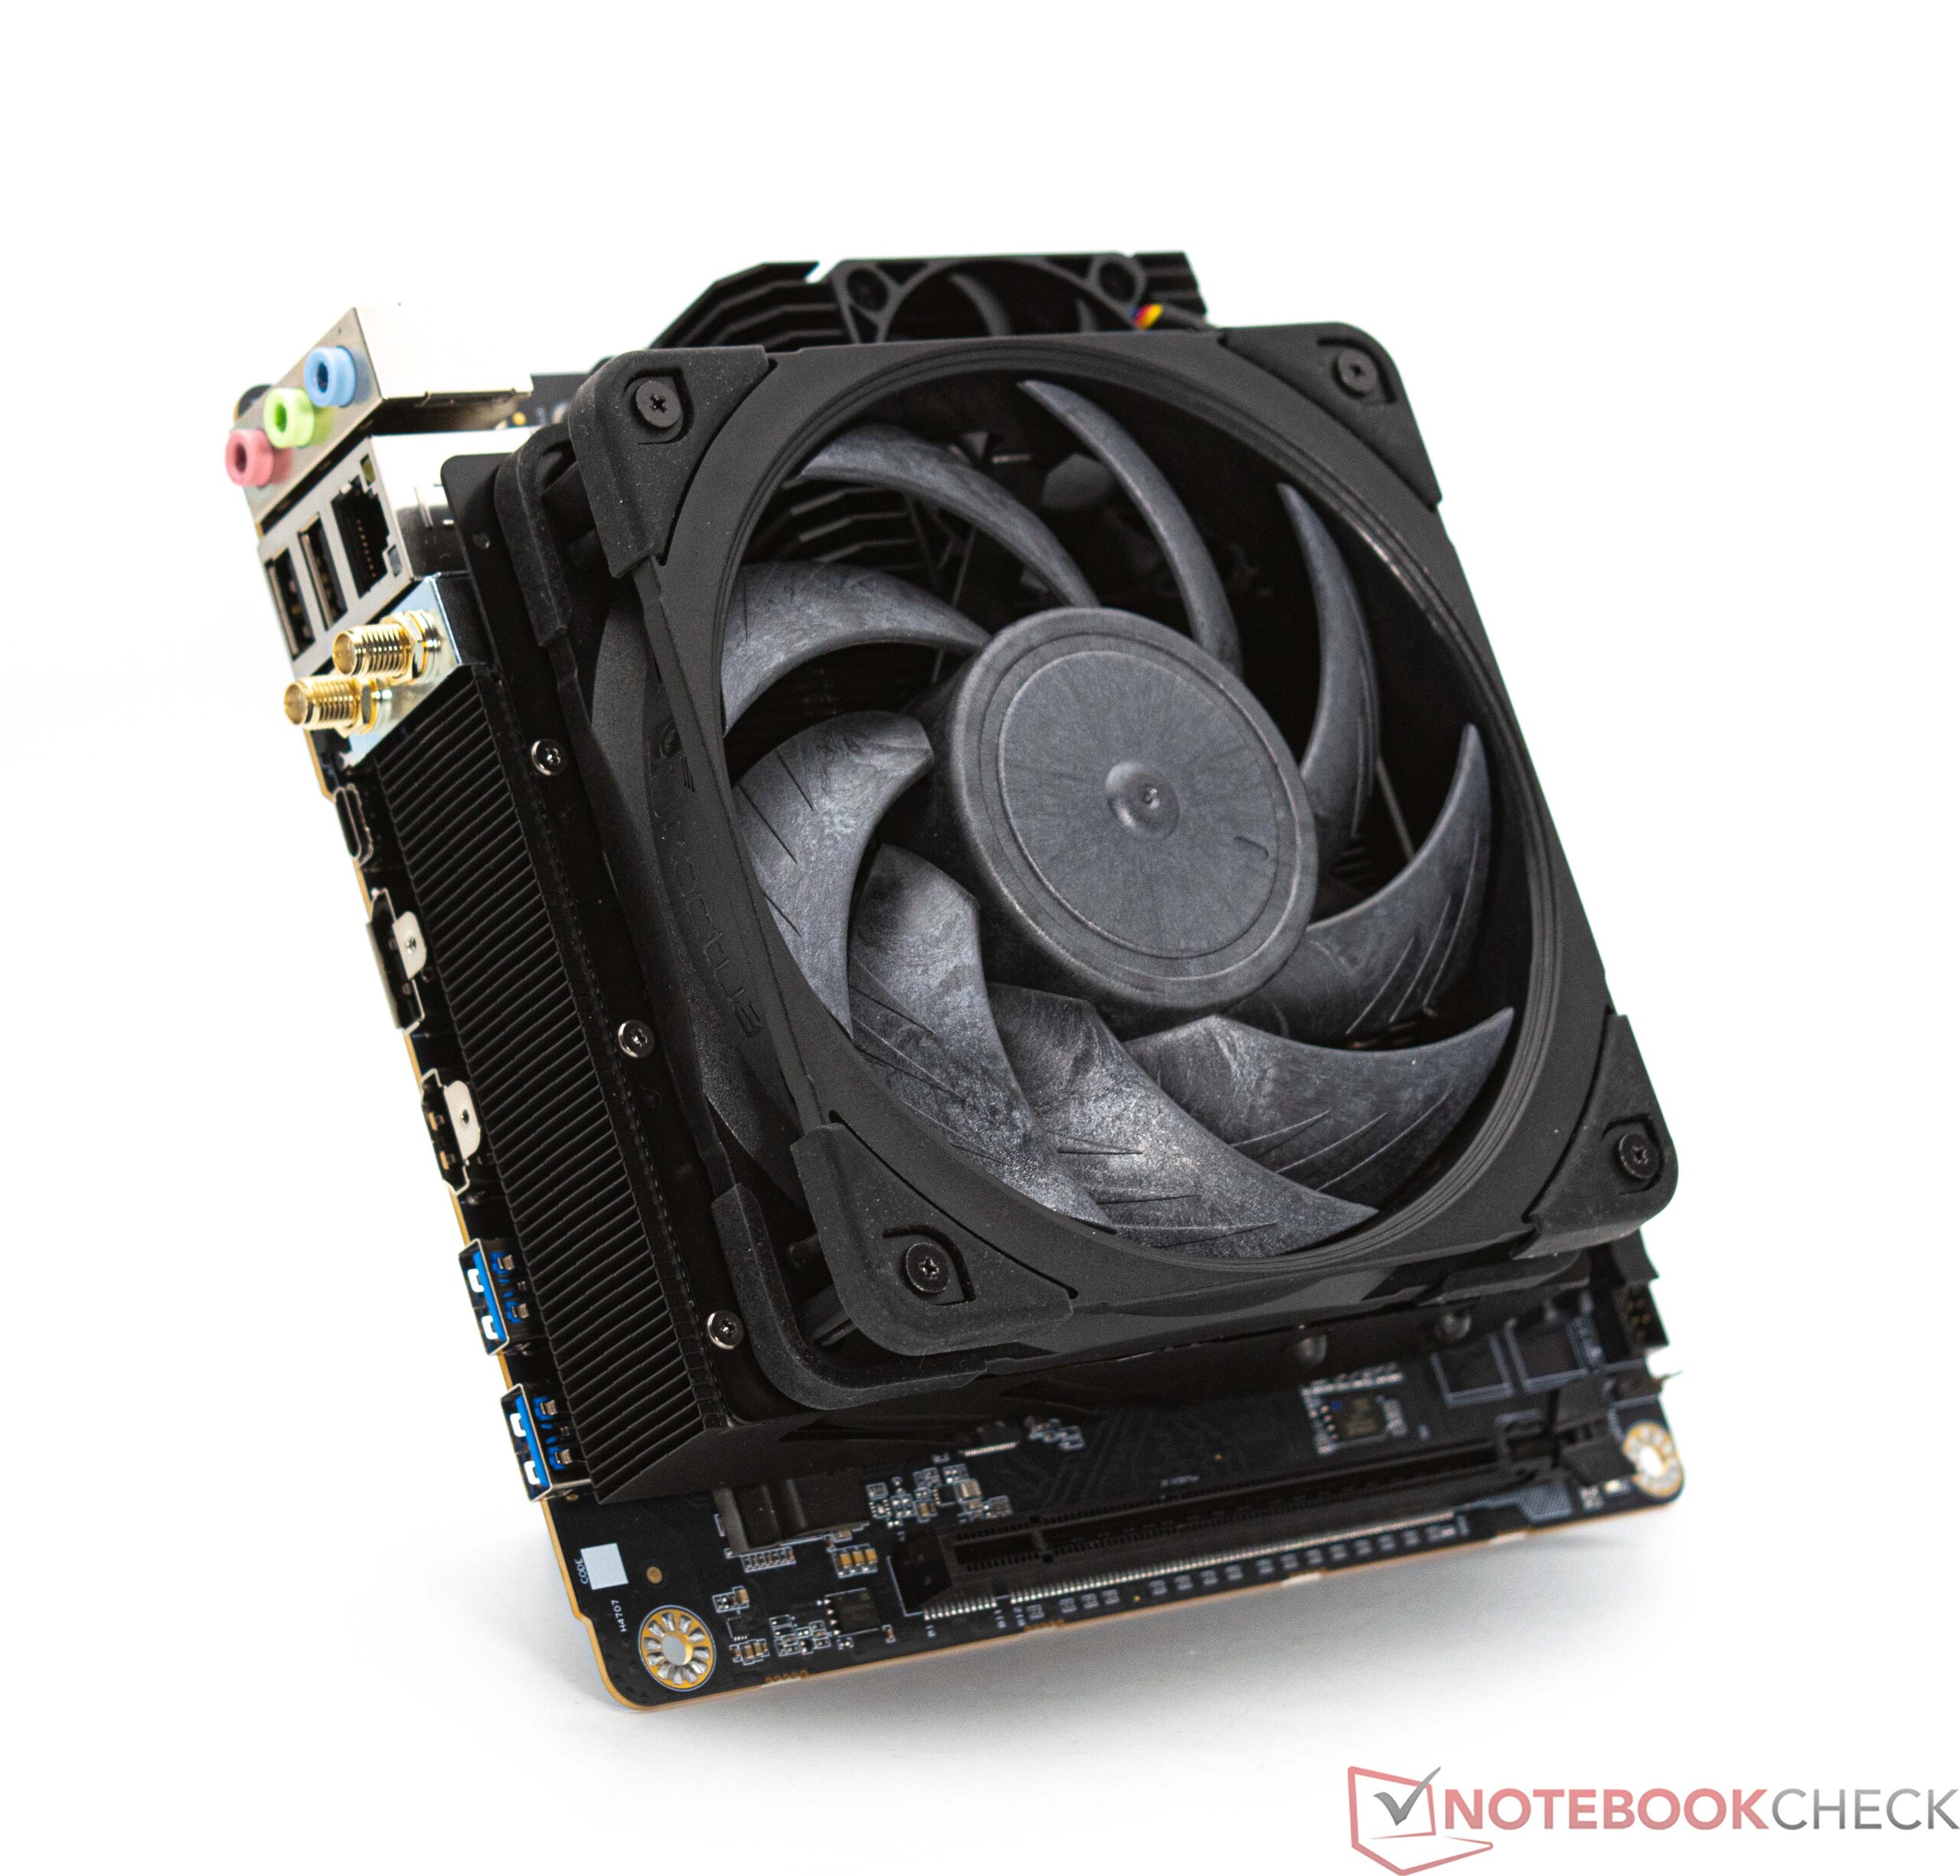
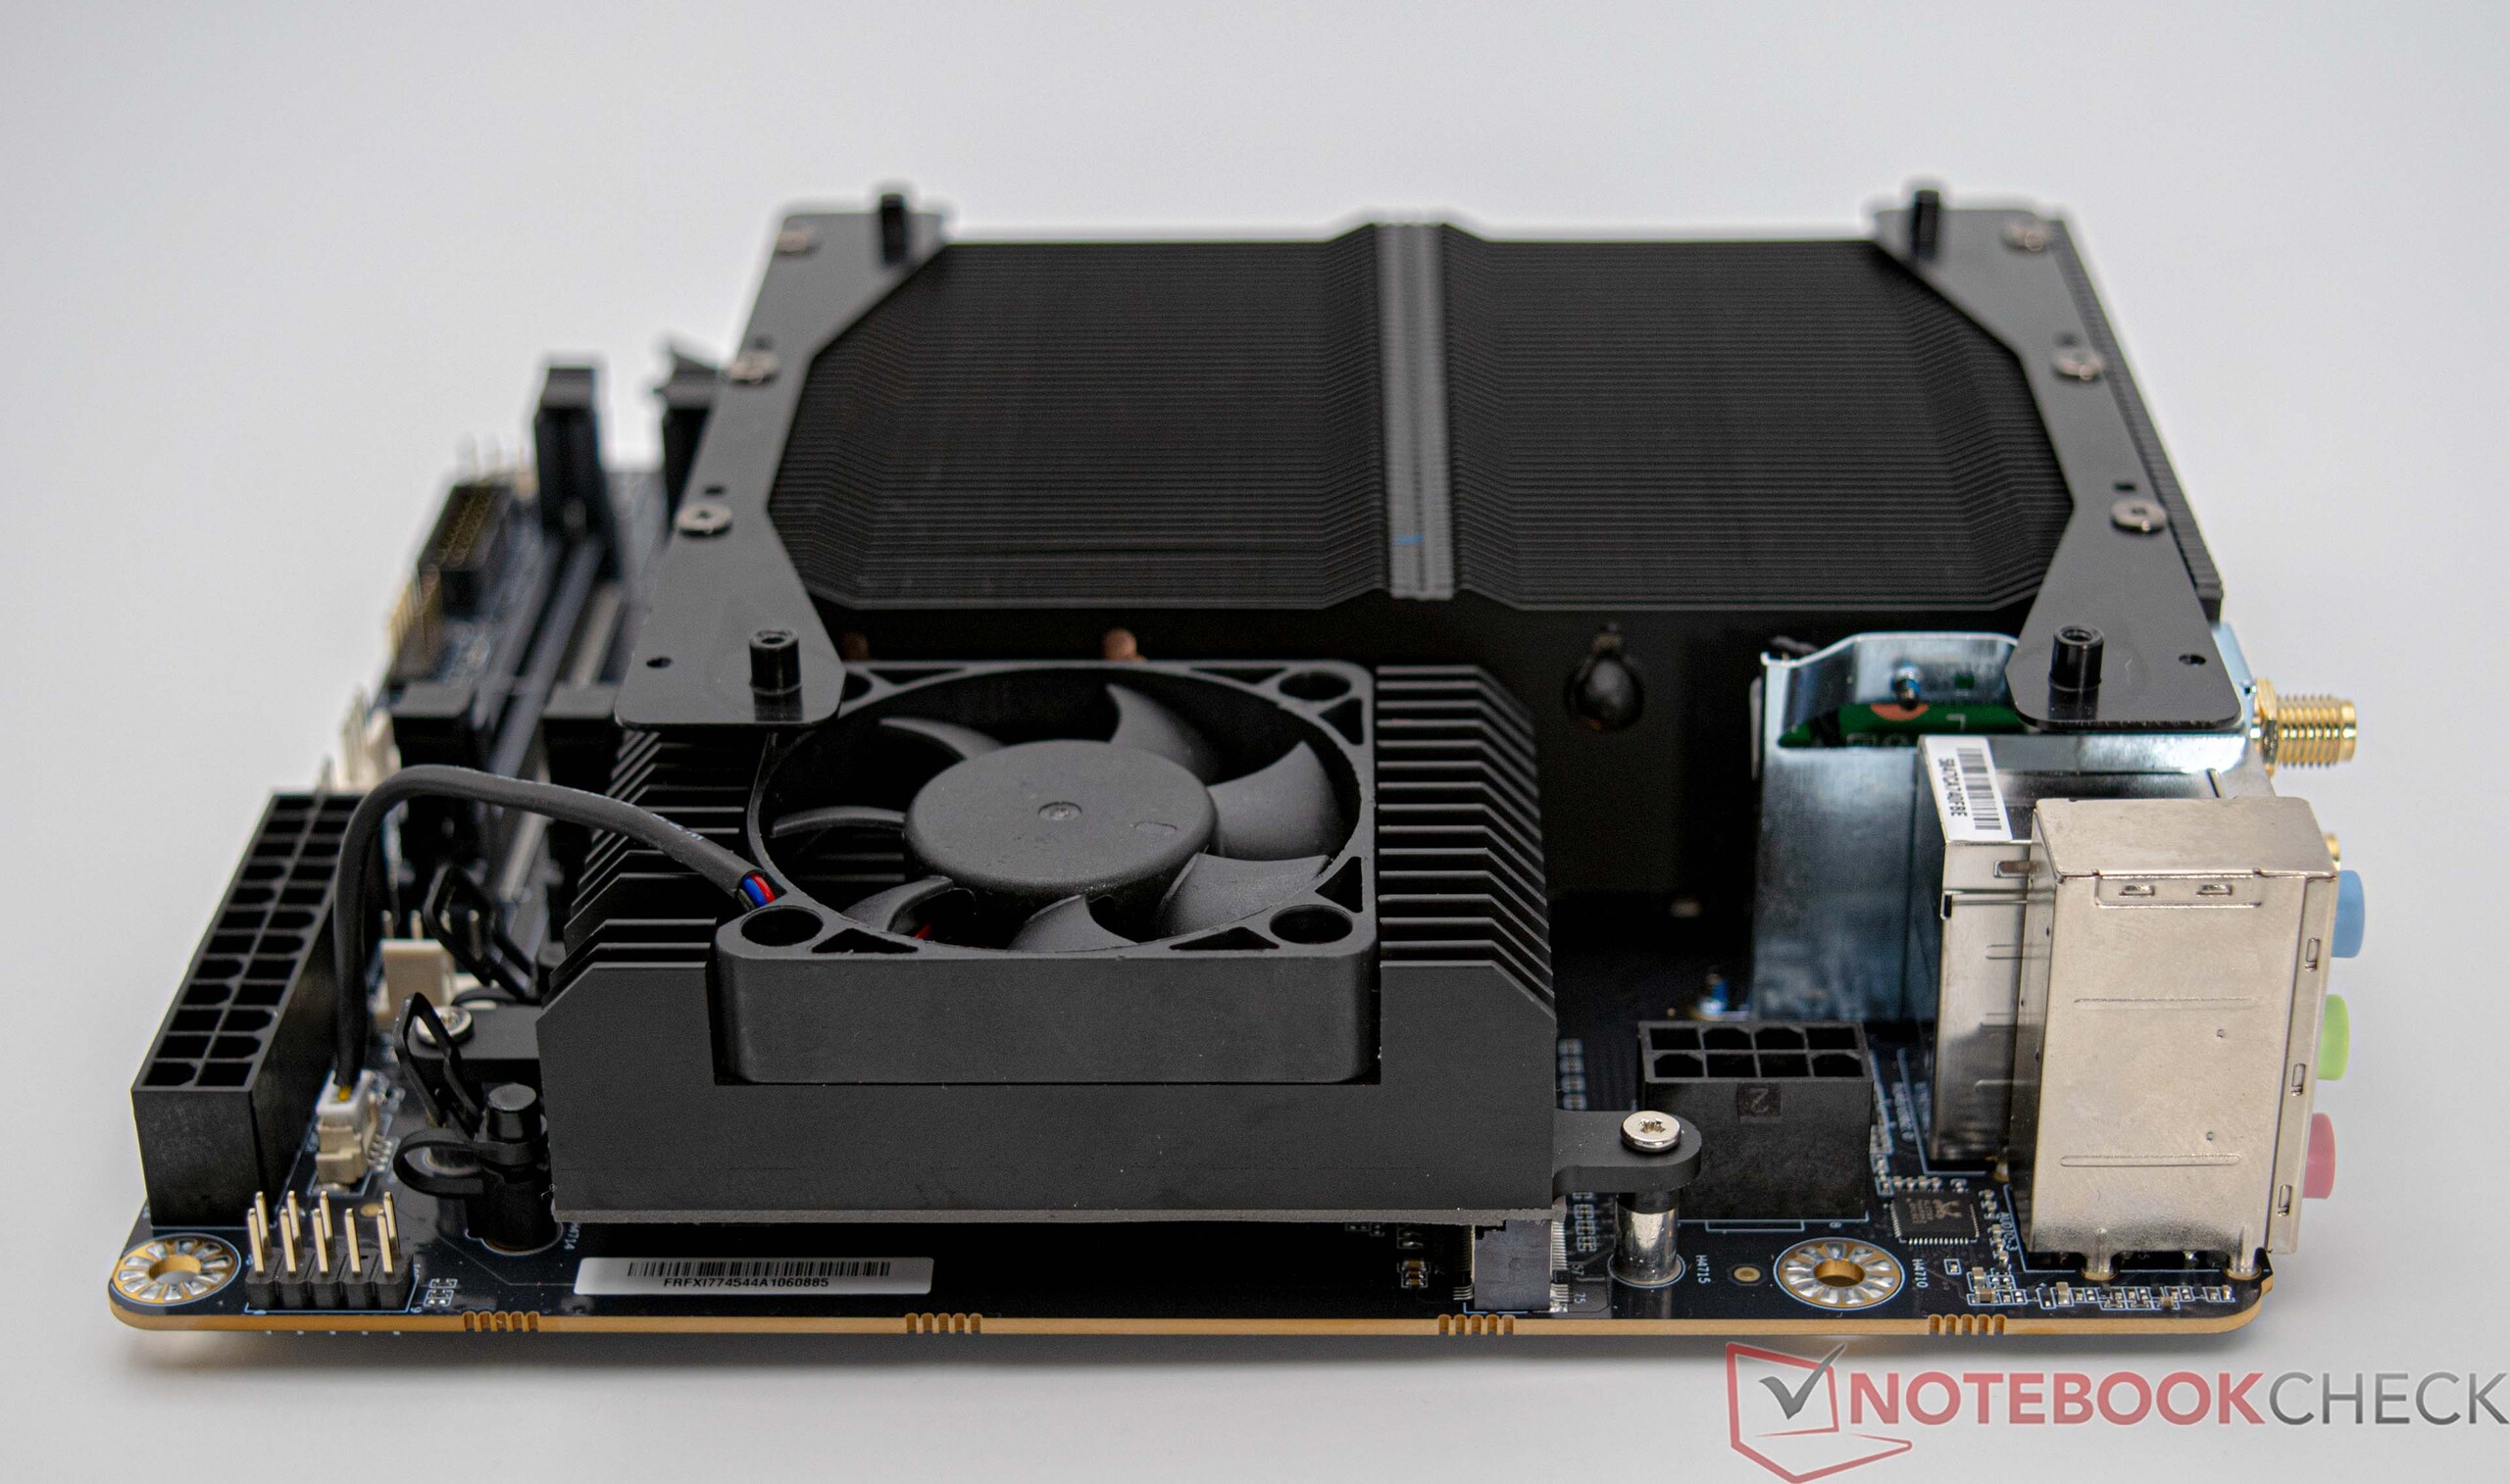
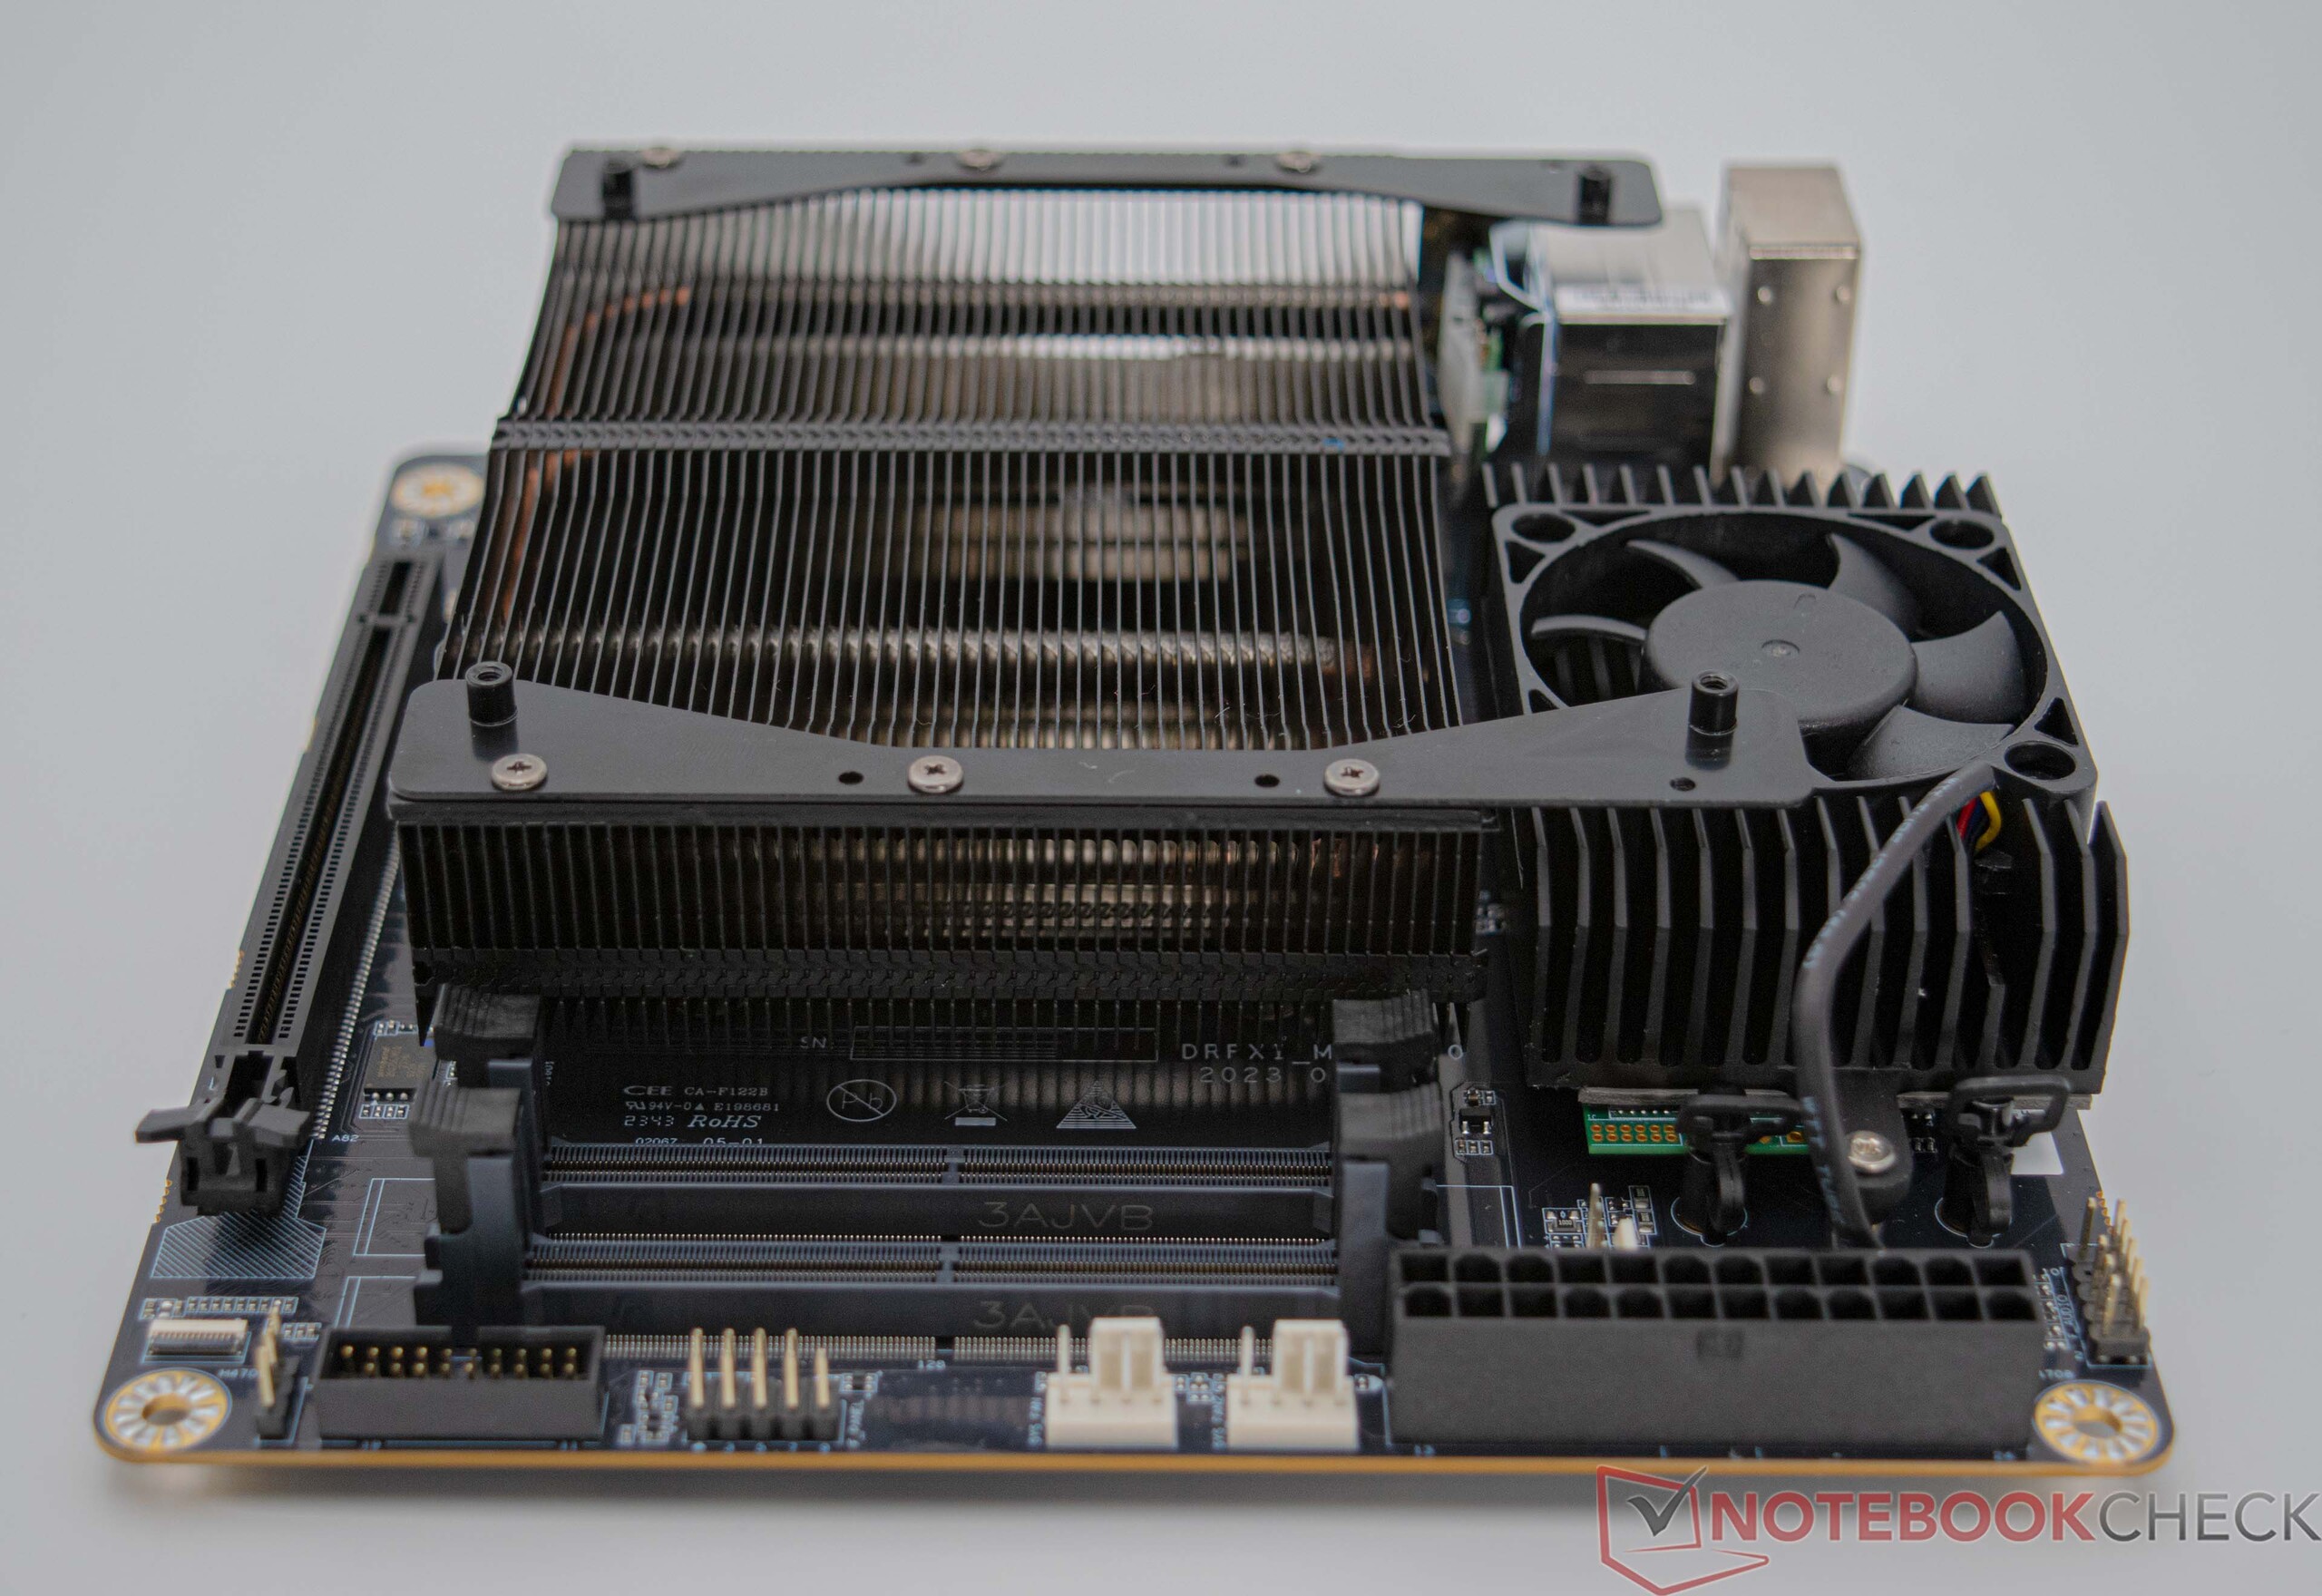
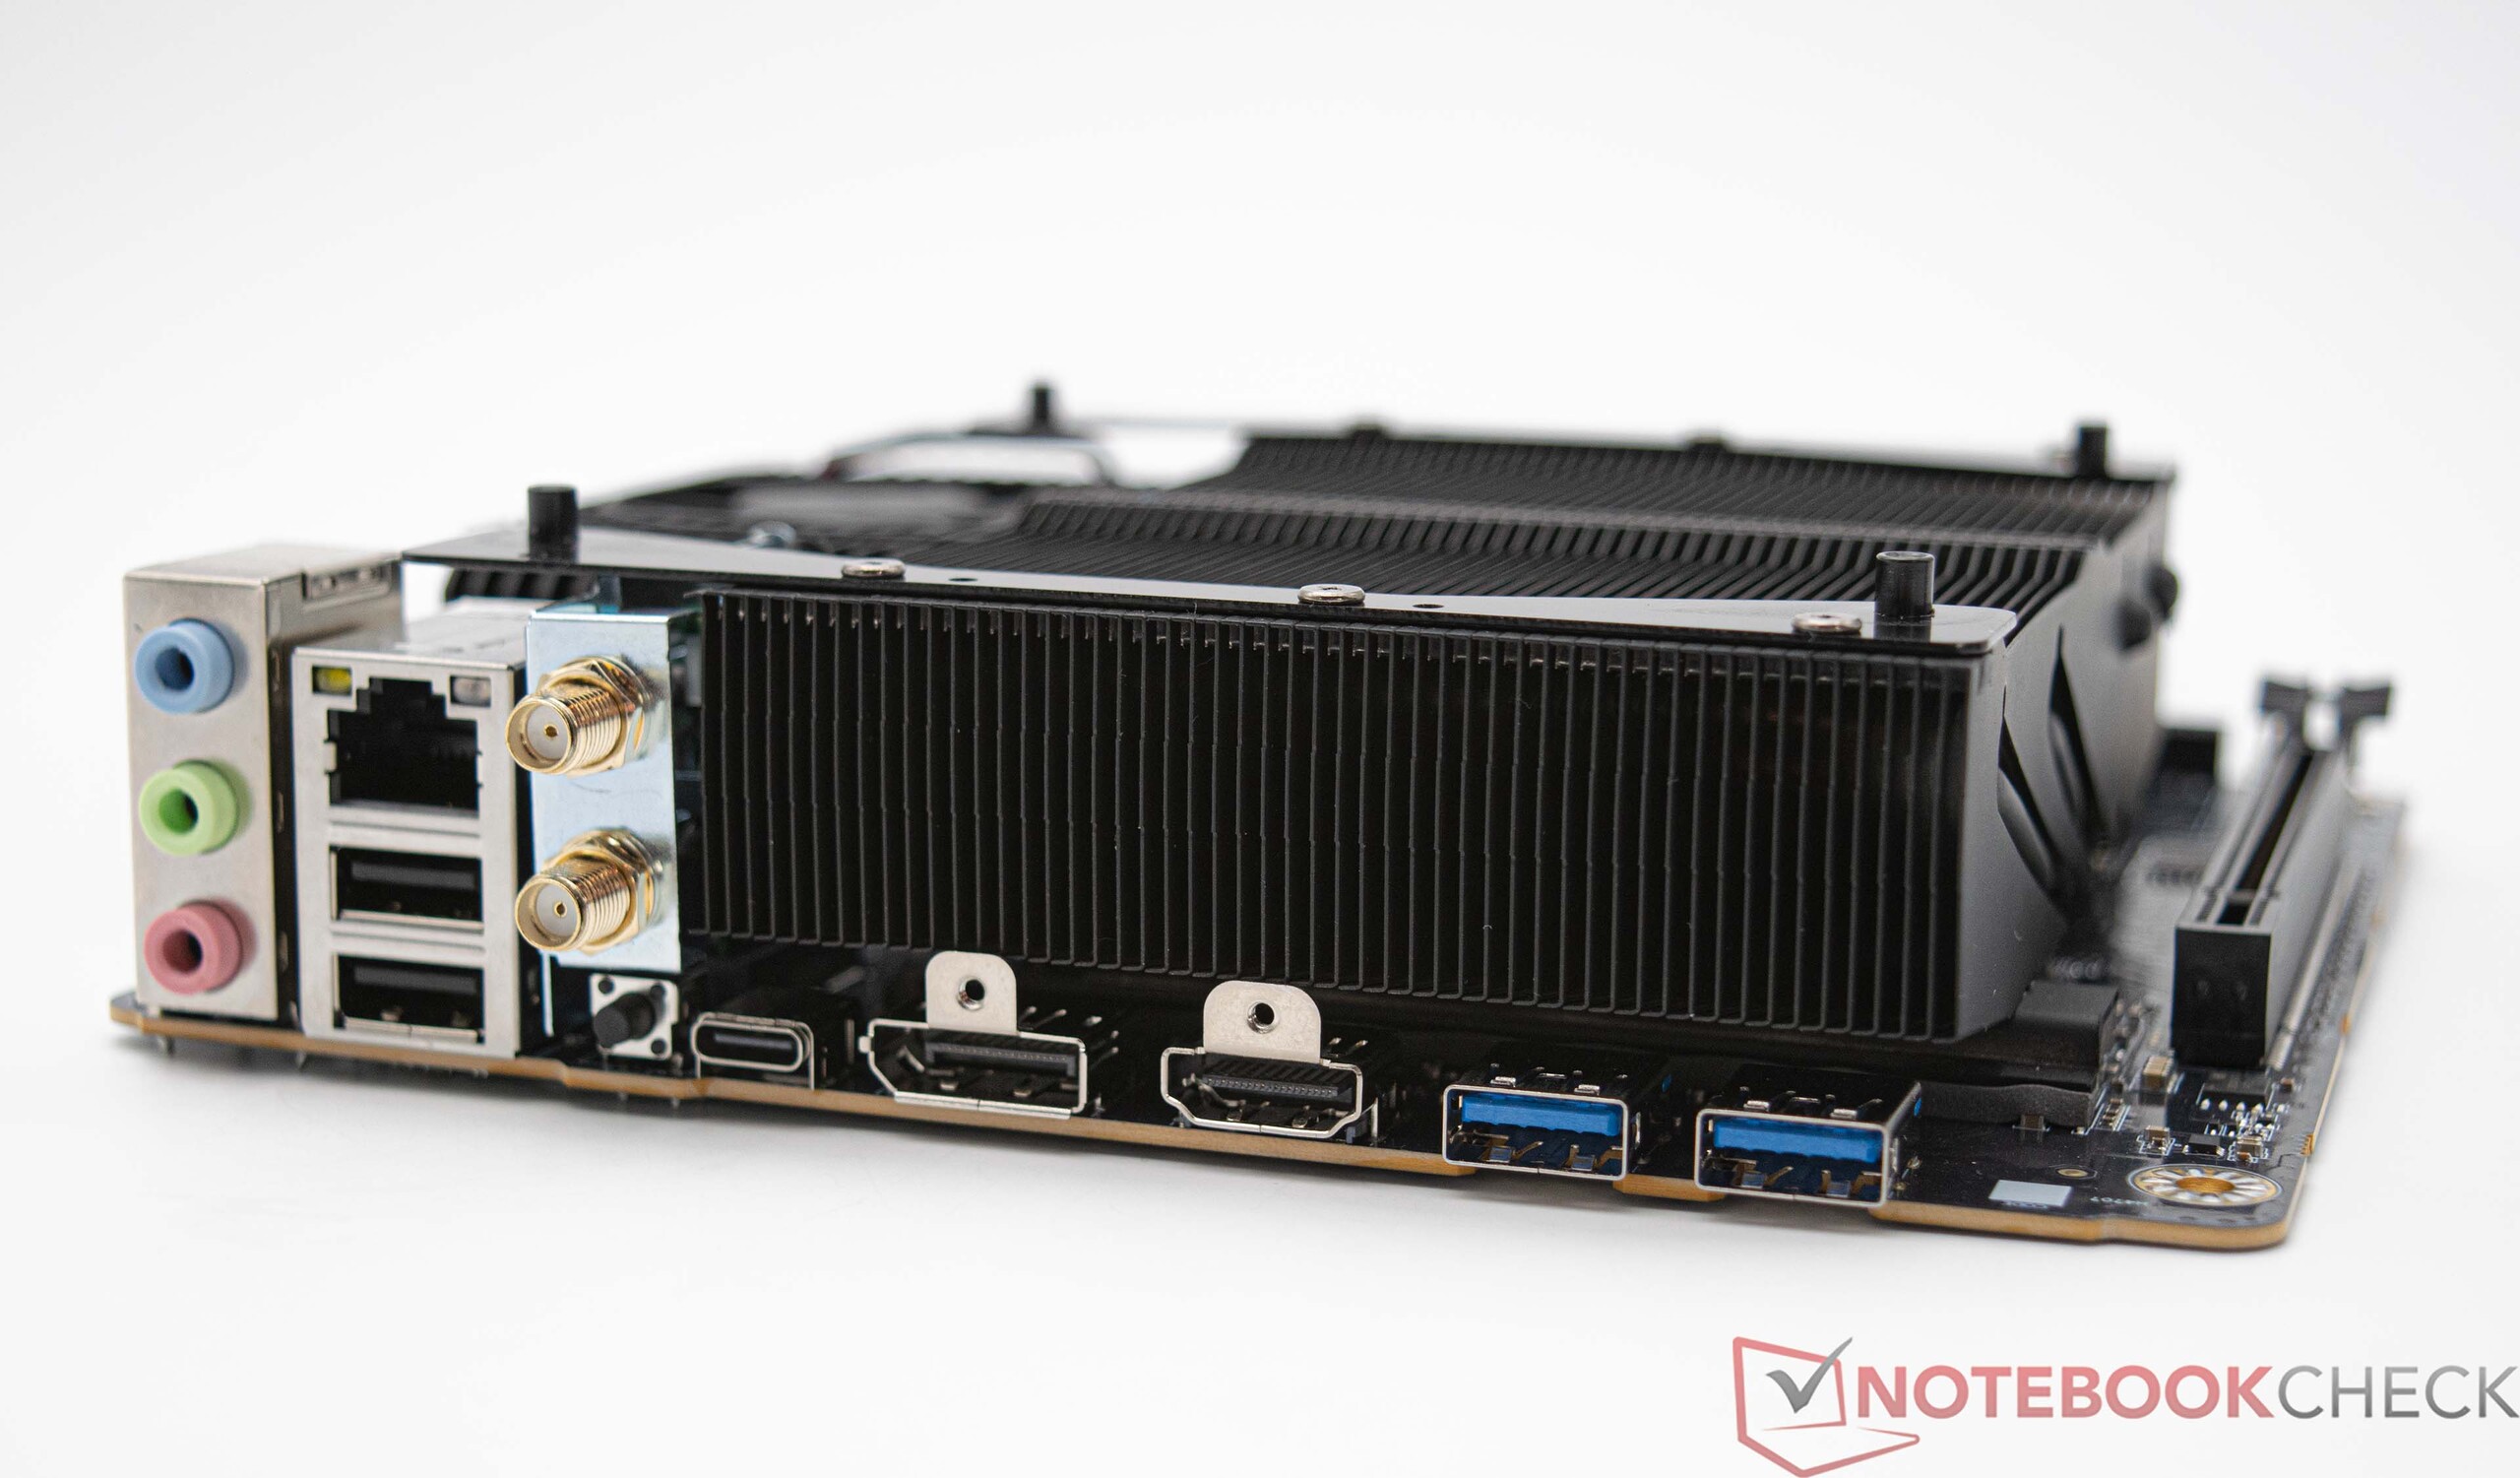
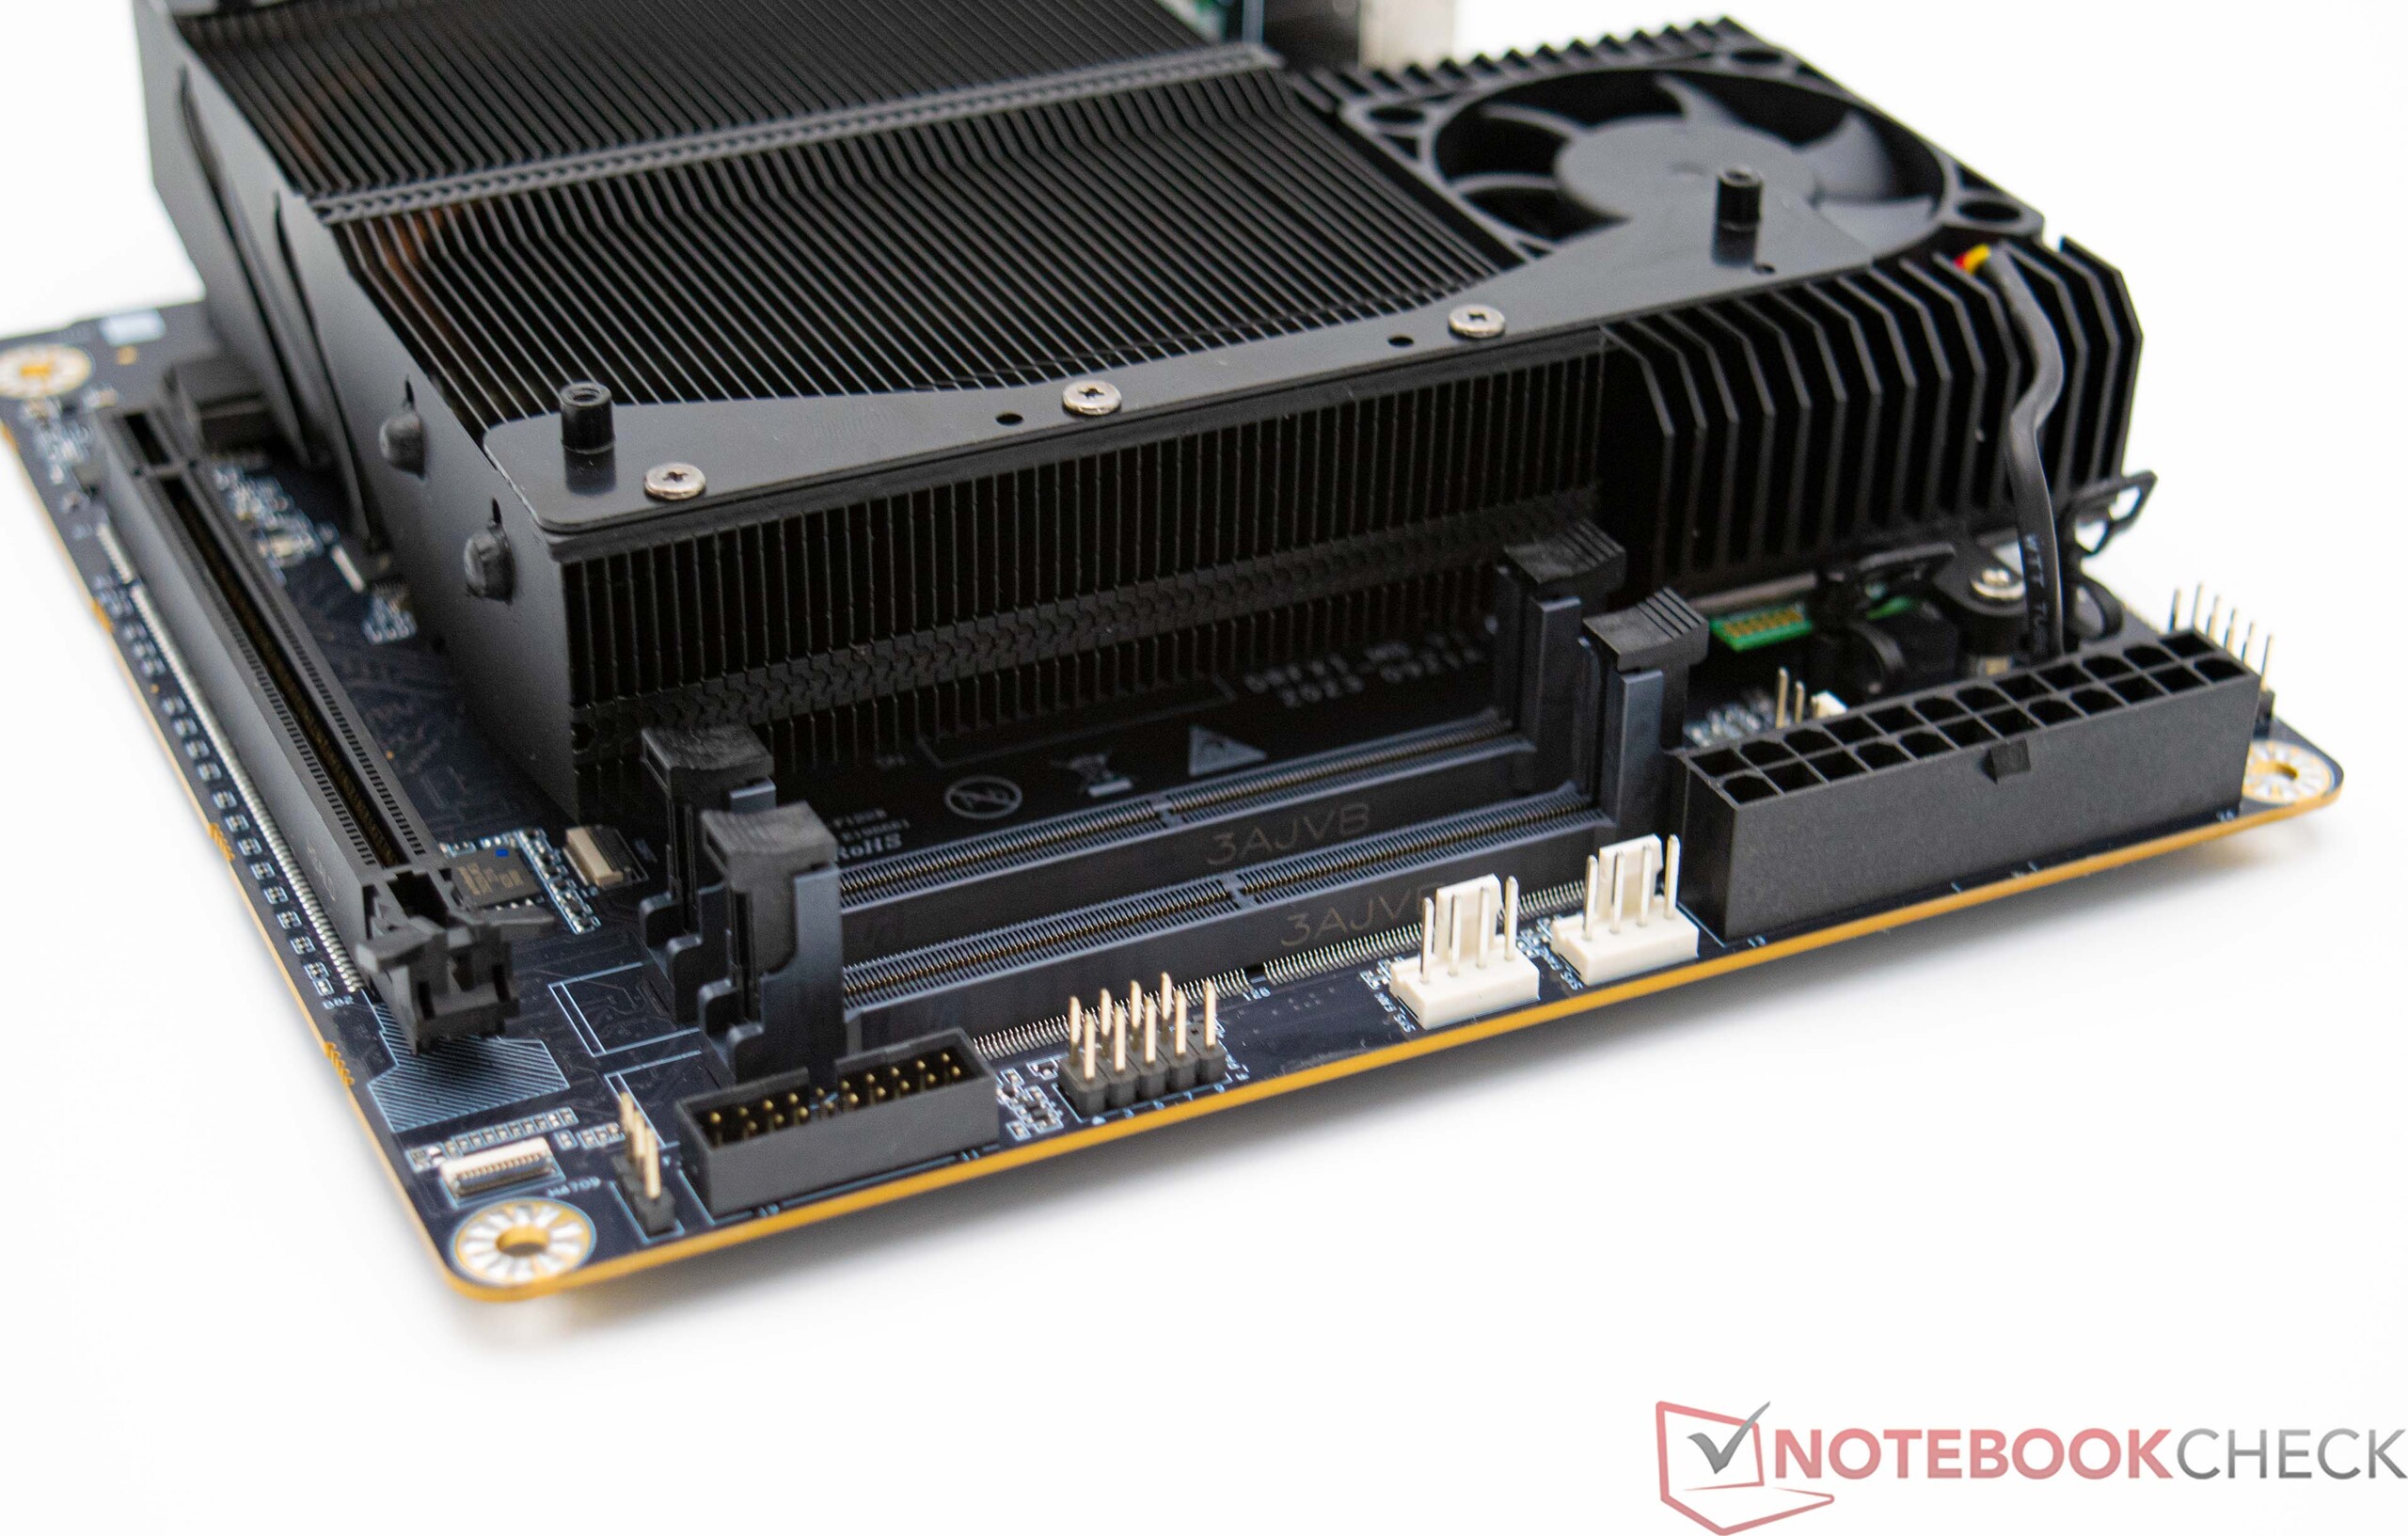
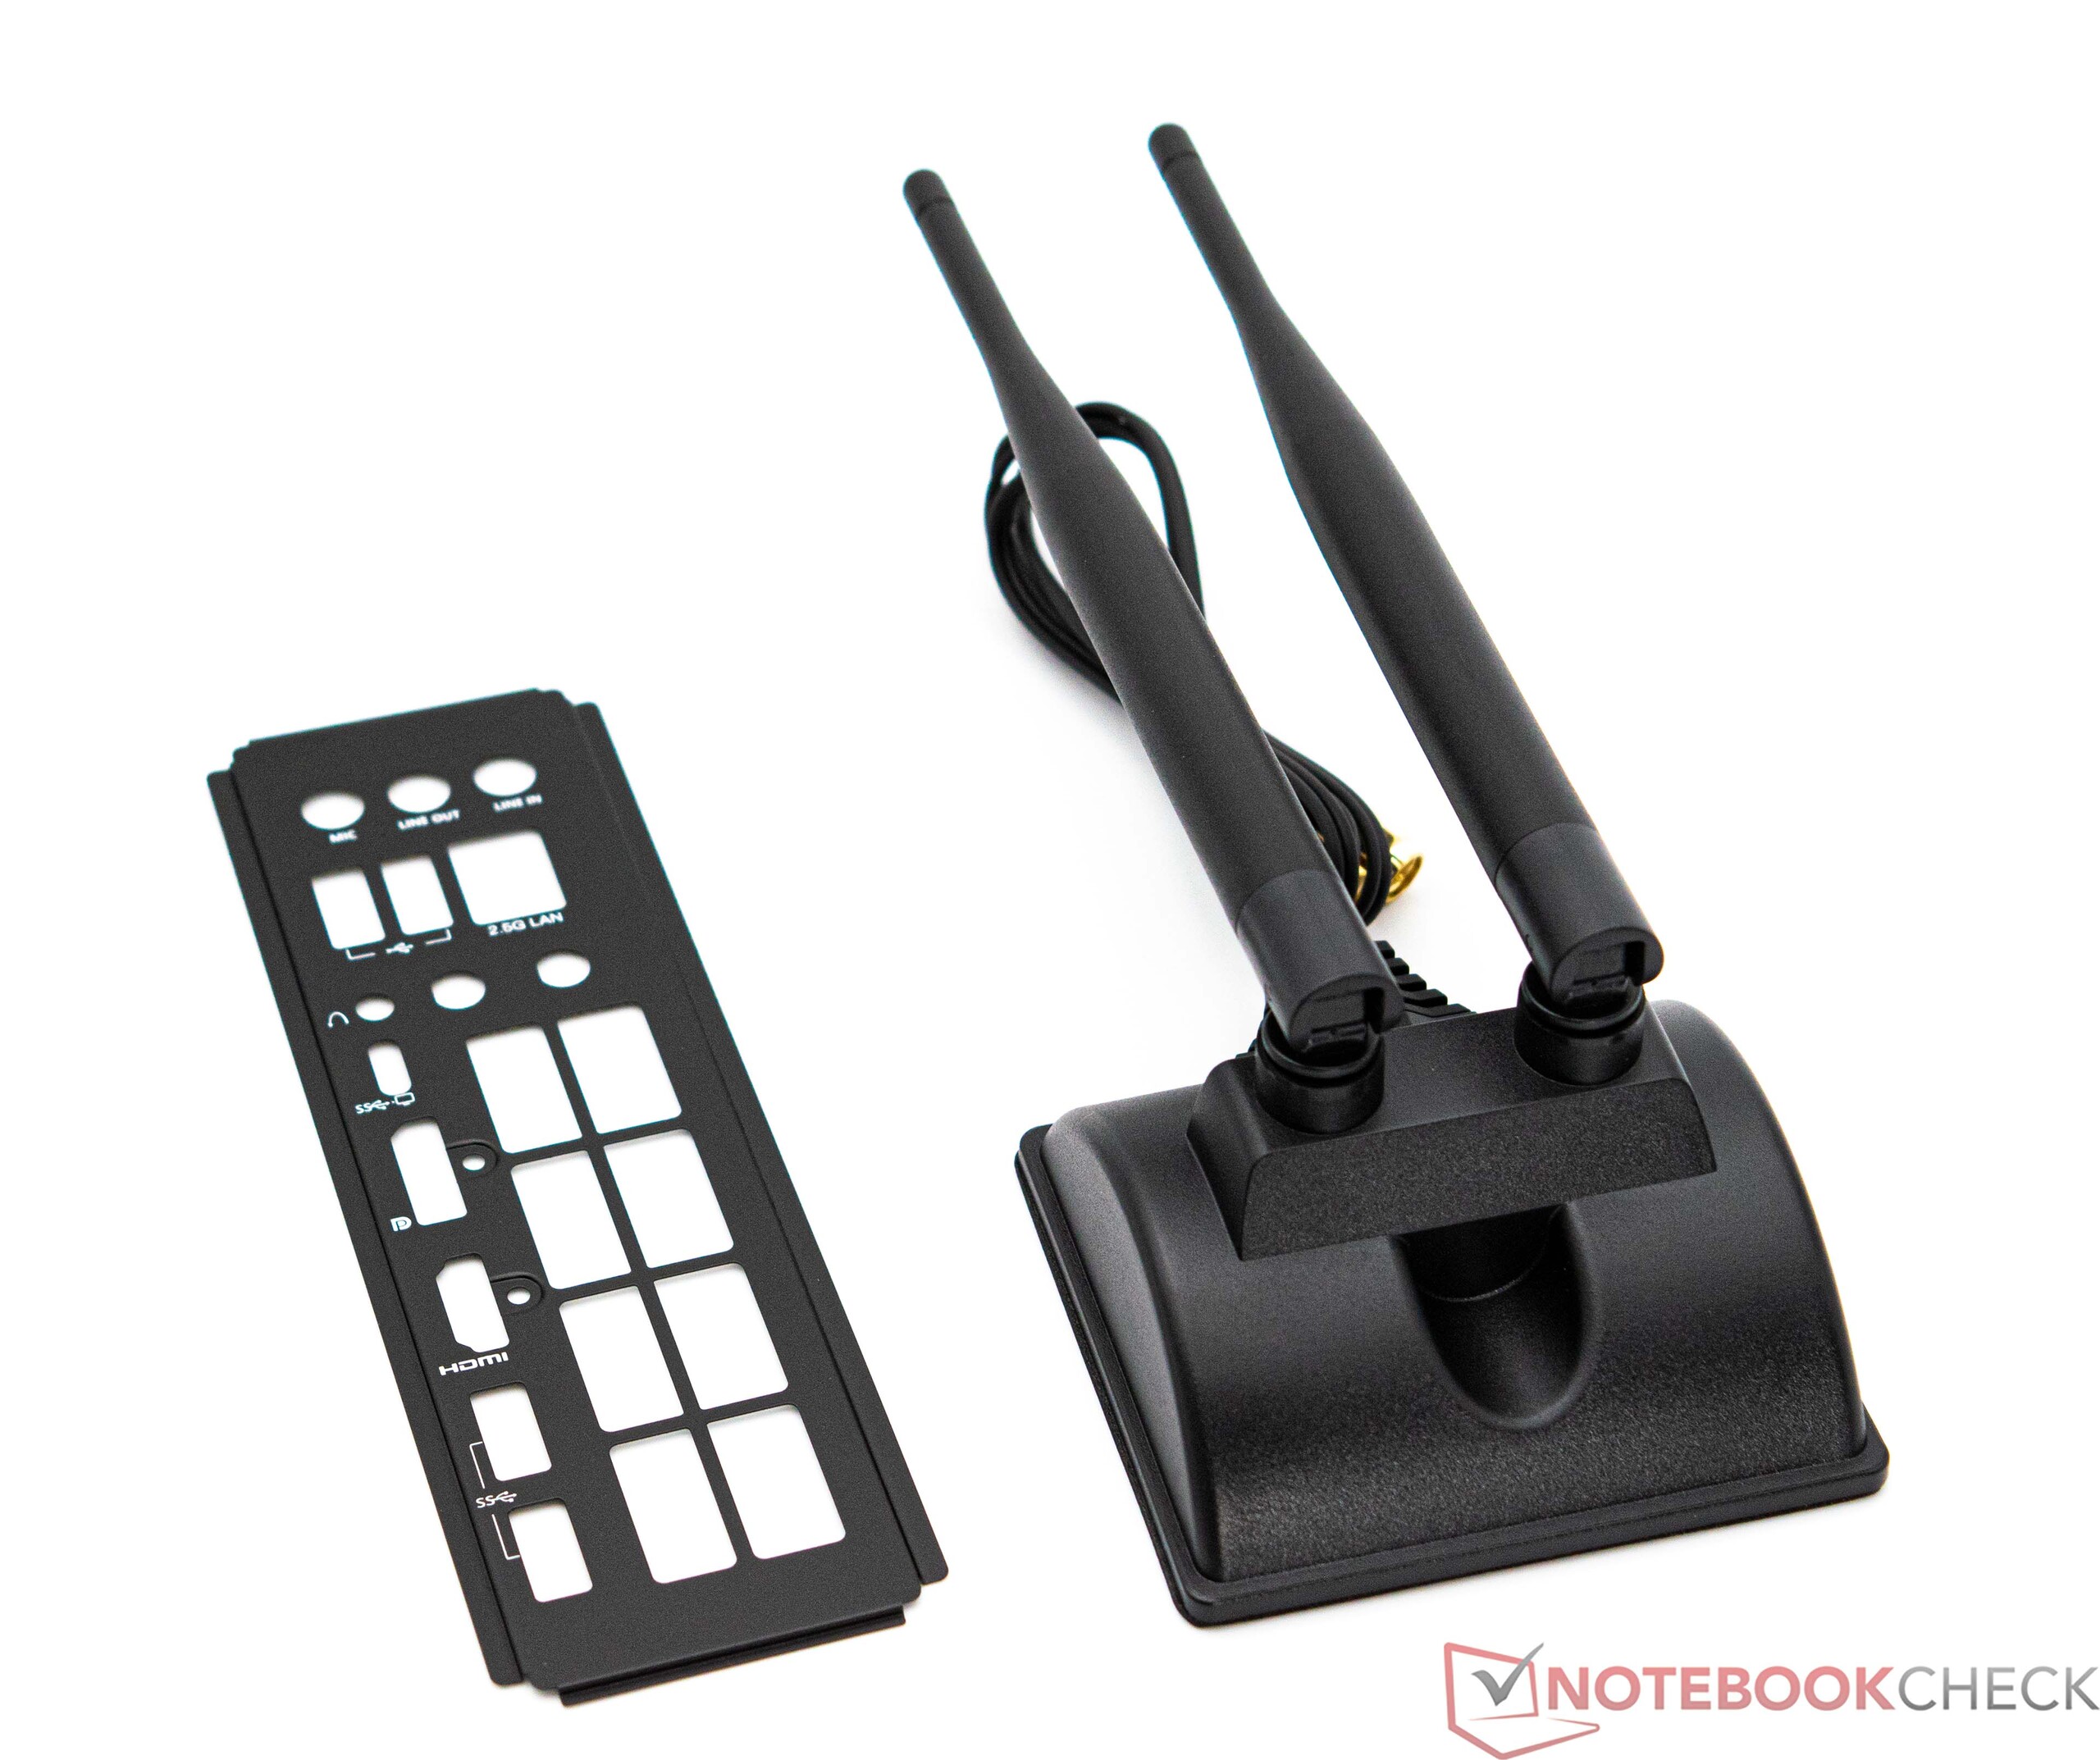
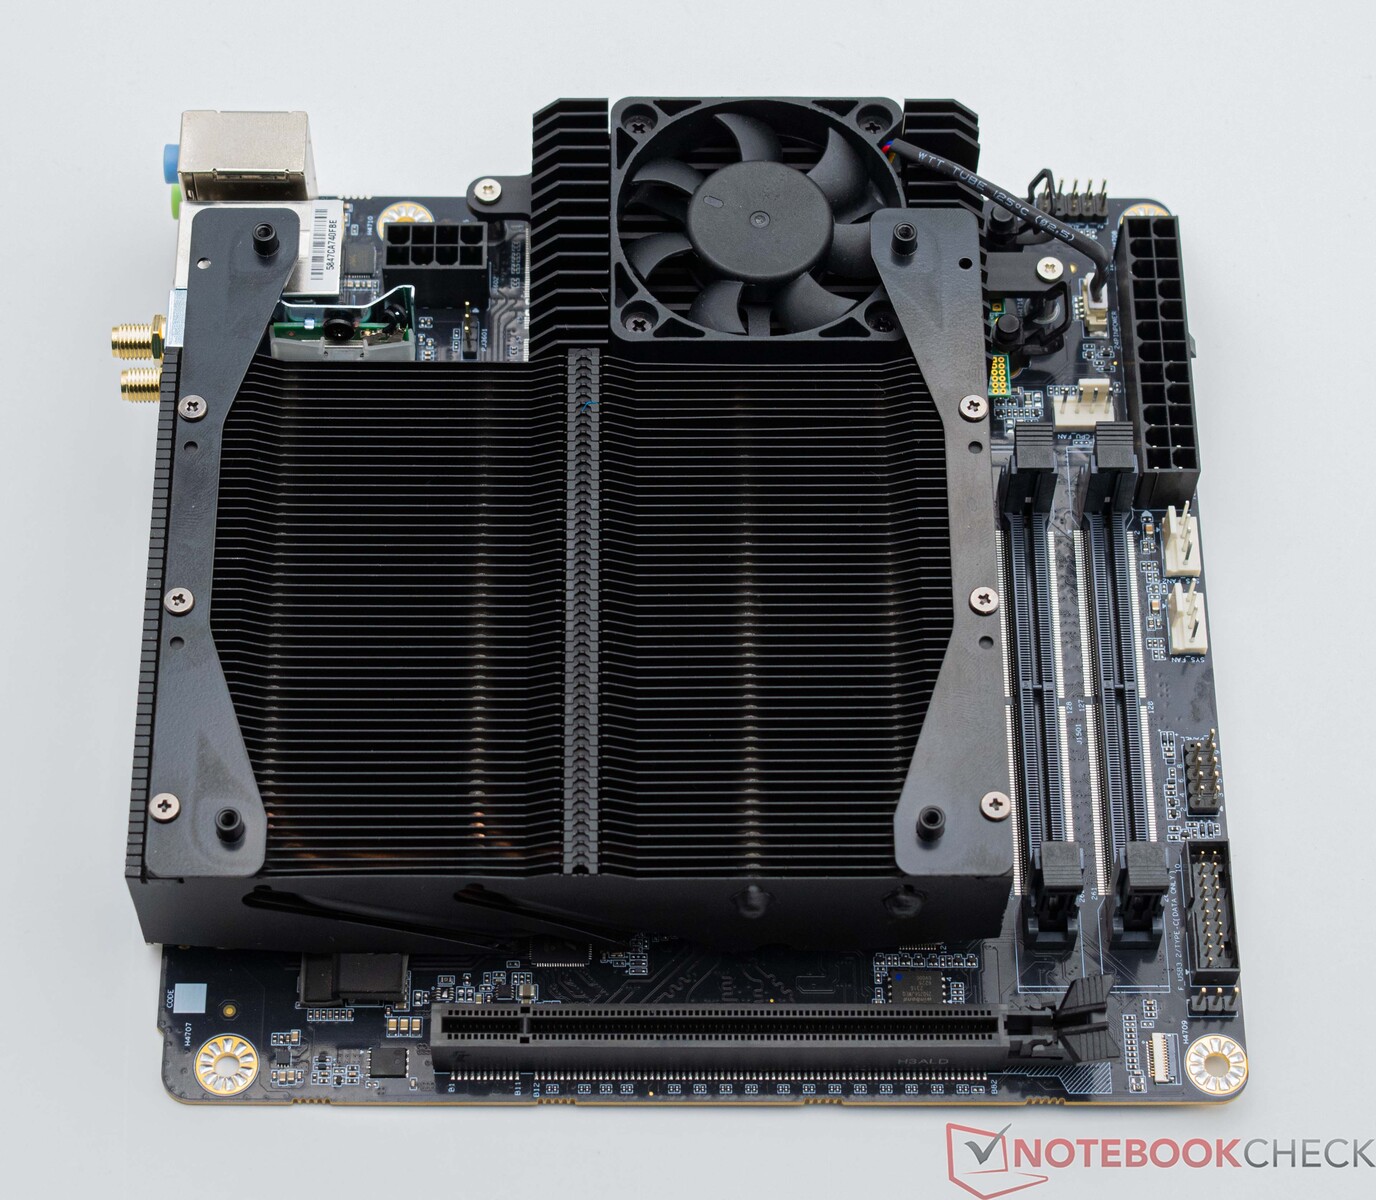
Zum Lieferumfang des Minisforum-BD770i-Mainboard gehört das Mainboard selbst, welches zugleich mit einem vorinstallierten Kühlkörper für das SoC bestückt ist. Weiterhin gibt es noch das passende IO-Shield sowie eine relativ große WLAN-Antenne, die unterdessen einen magnetischen Standfuß besitzt. Um das Minisforum BD770i in Betrieb nehmen zu können, bedarf es noch weiterer Komponenten. Der Hersteller legt weder einen 120-Millimeter-Lüfter bei, noch gibt es eine vorinstallierte SSD oder RAM. Außerdem wird ein passendes PC-Netzteil benötigt, welches in Verbindung mit dem Phanteks-Enthoo-Evolv-Shift-XT-Gehäuse ein kompaktes Netzteil im SFX-Format sein muss. Das Minisforum BD770i ist somit eine gute Grundlage für einen kompakten DIY-PC im Kleinstformat.

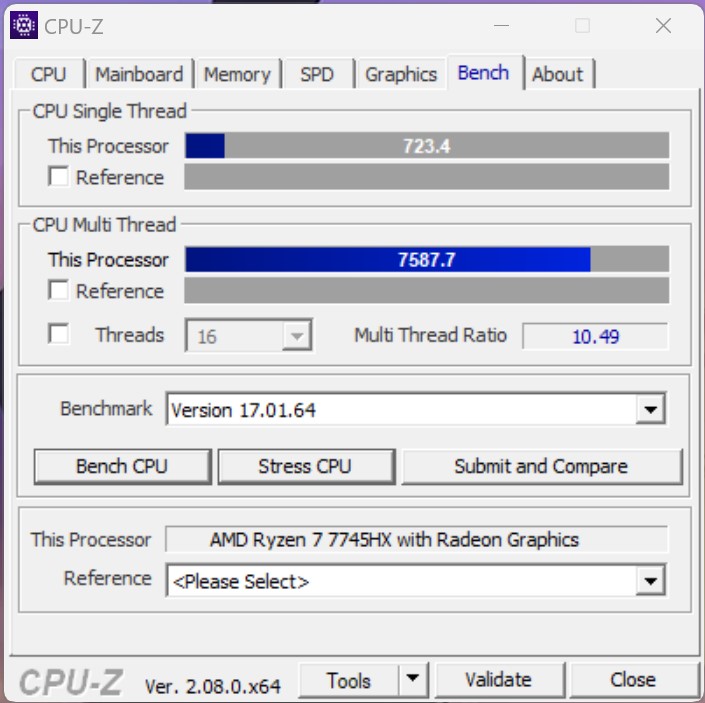
Prozessor-Benchmarks
Ausgestattet mit dem AMD Ryzen 7 7745HX bietet das Minisforum-BD770i-Mainboard ein modernes SoC, wenngleich hier jedoch nicht AMDs neueste Prozessoren verbaut werden. Dennoch braucht sich das hier installierte SoC nicht zu verstecken. Immerhin gibt es acht Zen4-Kerne, welche in Summe 16 Threads verarbeiten können. Zudem sorgt die hervorragende Kühlung für eine dauerhaft hohe Leistungsentfaltung. Thermische Einschränkungen sind nicht so gravierend wie in einem Laptop oder einem Mini-PC. In unserem Leistungsrating sortiert sich der AMD Ryzen 7 7745HX nur knapp hinter einem AMD Ryzen 7 7800X3D ein. Gegenüber Intel reicht es, um einen Core i5-12600K zu bezwingen, wenngleich ein Intel Core i5-13600K ein wenig besser abschneidet. Den Ansatz, einen mobilen Prozessor in einem herkömmlichen Desktop-PC zu verbauen, begrüßen wir, denn grundsätzlich lassen sich die CPUs leichter kühlen und bieten dennoch eine recht gute Leistung. Selbst ein aktueller Intel Core i5-14600K kann sich im Performance-Rating nur einen Vorsprung von zehn Prozent erarbeiten. Das spiegelt einmal mehr die gute Leistungsentfaltung der mobilen SoCs bei einer exzellenten Kühlung wider. In den Einzeltests kann der AMD Ryzen 7 7745HX aufgrund der geringeren Anzahl an Kernen nicht mit den bekannten Topmodellen mithalten.
Sehr interessant ist der Vergleich mit dem AMD Ryzen 7 7840HS und dem AMD Ryzen 9 7940HS, welche hier jeweils in einem Mini-PC von Minisforum (Minisforum EliteMini UM780 XTX und Minisforum Venus Series UM790 Pro) getestet wurden. Sicherlich muss man erwähnen, dass den beiden HS-Modellen etwas weniger Energie zugeführt wird. Dennoch können wir an dieser Stelle festhalten, dass mit einer guten Kühlung deutlich mehr Leistung aus mobilen SoCs herausgeholt werden kann. Hierzu sind aber auch eine sinnvolle UEFI-Einstellungen vonnöten, welche es dem Prozessor erlauben, auch dauerhaft mehr Energie zu erhalten, sofern es die thermischen Rahmenbedingungen zulassen. Minisforum hat hier beim BD770 die Werte nicht künstlich beschnitten. Manuell lässt sich das Power-Limit jedoch anpassen. Gleichwohl dokumentieren wir bei dem AMD Ryzen 7 7745HX im Auslieferungszustand eine stabile Leistungsaufnahme von 75 Watt.
Für weitere Vergleiche und Benchmarks verweisen wir auf unsere CPU-Vergleichstabelle.

| Performance Rating - Percent | |
| Intel Core i9-14900K | |
| Intel Core i9-13900K | |
| AMD Ryzen 9 7950X | |
| AMD Ryzen 9 7950X3D | |
| AMD Ryzen 9 7900X | |
| Intel Core i5-14600K | |
| Intel Core i9-12900K | |
| AMD Ryzen 9 5950X | |
| Intel Core i5-13600K | |
| AMD Ryzen 7 7800X3D | |
| AMD Ryzen 7 7745HX | |
| AMD Ryzen 5 7600X | |
| Intel Core i5-12600K | |
| AMD Ryzen 7 7840HS | |
| AMD Ryzen 9 7940HS | |
| Intel Core i5-13400 | |
| Intel Core i5-12400F | |
| Cinebench R15 | |
| CPU Single 64Bit | |
| Intel Core i9-14900K | |
| AMD Ryzen 9 7950X | |
| Intel Core i9-13900K | |
| AMD Ryzen 9 7950X3D | |
| AMD Ryzen 9 7900X | |
| AMD Ryzen 5 7600X | |
| Intel Core i5-14600K | |
| AMD Ryzen 7 7745HX | |
| AMD Ryzen 7 7800X3D | |
| Intel Core i5-13600K | |
| Intel Core i9-12900K | |
| AMD Ryzen 9 7940HS | |
| AMD Ryzen 7 7840HS | |
| Intel Core i5-12600K | |
| AMD Ryzen 9 5950X | |
| Intel Core i5-13400 | |
| Intel Core i5-12400F | |
| CPU Multi 64Bit | |
| Intel Core i9-14900K | |
| AMD Ryzen 9 7950X | |
| Intel Core i9-13900K | |
| AMD Ryzen 9 7950X3D | |
| AMD Ryzen 9 7900X | |
| AMD Ryzen 9 5950X | |
| Intel Core i9-12900K | |
| Intel Core i5-13600K | |
| Intel Core i5-14600K | |
| AMD Ryzen 7 7745HX | |
| AMD Ryzen 7 7800X3D | |
| AMD Ryzen 9 7940HS | |
| AMD Ryzen 7 7840HS | |
| Intel Core i5-12600K | |
| AMD Ryzen 5 7600X | |
| Intel Core i5-13400 | |
| Intel Core i5-12400F | |
| Cinebench R20 | |
| CPU (Single Core) | |
| Intel Core i9-14900K | |
| Intel Core i9-13900K | |
| AMD Ryzen 9 7950X | |
| AMD Ryzen 9 7950X3D | |
| Intel Core i5-14600K | |
| AMD Ryzen 9 7900X | |
| Intel Core i5-13600K | |
| Intel Core i9-12900K | |
| AMD Ryzen 5 7600X | |
| Intel Core i5-12600K | |
| AMD Ryzen 7 7745HX | |
| AMD Ryzen 9 7940HS | |
| AMD Ryzen 7 7800X3D | |
| AMD Ryzen 7 7840HS | |
| Intel Core i5-13400 | |
| Intel Core i5-12400F | |
| AMD Ryzen 9 5950X | |
| CPU (Multi Core) | |
| Intel Core i9-14900K | |
| Intel Core i9-13900K | |
| AMD Ryzen 9 7950X | |
| AMD Ryzen 9 7950X3D | |
| AMD Ryzen 9 7900X | |
| AMD Ryzen 9 5950X | |
| Intel Core i9-12900K | |
| Intel Core i5-14600K | |
| Intel Core i5-13600K | |
| AMD Ryzen 7 7745HX | |
| AMD Ryzen 7 7800X3D | |
| Intel Core i5-12600K | |
| AMD Ryzen 9 7940HS | |
| AMD Ryzen 7 7840HS | |
| Intel Core i5-13400 | |
| AMD Ryzen 5 7600X | |
| Intel Core i5-12400F | |
| Cinebench R23 | |
| Single Core | |
| Intel Core i9-14900K | |
| Intel Core i9-13900K | |
| Intel Core i5-14600K | |
| AMD Ryzen 9 7950X3D | |
| AMD Ryzen 9 7950X | |
| AMD Ryzen 9 7900X | |
| Intel Core i5-13600K | |
| Intel Core i9-12900K | |
| AMD Ryzen 5 7600X | |
| Intel Core i5-12600K | |
| AMD Ryzen 7 7745HX | |
| AMD Ryzen 7 7800X3D | |
| AMD Ryzen 9 7940HS | |
| Intel Core i5-13400 | |
| AMD Ryzen 7 7840HS | |
| Intel Core i5-12400F | |
| AMD Ryzen 9 5950X | |
| Multi Core | |
| Intel Core i9-14900K | |
| Intel Core i9-13900K | |
| AMD Ryzen 9 7950X | |
| AMD Ryzen 9 7950X3D | |
| AMD Ryzen 9 7900X | |
| AMD Ryzen 9 5950X | |
| Intel Core i9-12900K | |
| Intel Core i5-14600K | |
| Intel Core i5-13600K | |
| AMD Ryzen 7 7745HX | |
| AMD Ryzen 7 7800X3D | |
| Intel Core i5-12600K | |
| AMD Ryzen 9 7940HS | |
| AMD Ryzen 7 7840HS | |
| Intel Core i5-13400 | |
| AMD Ryzen 5 7600X | |
| Intel Core i5-12400F | |
| Cinebench R11.5 | |
| CPU Single 64Bit | |
| Intel Core i9-14900K | |
| Intel Core i9-13900K | |
| AMD Ryzen 9 7950X | |
| AMD Ryzen 9 7950X3D | |
| AMD Ryzen 9 7900X | |
| AMD Ryzen 5 7600X | |
| Intel Core i5-14600K | |
| AMD Ryzen 7 7745HX | |
| Intel Core i9-12900K | |
| Intel Core i5-13600K | |
| AMD Ryzen 9 7940HS | |
| AMD Ryzen 7 7800X3D | |
| AMD Ryzen 7 7840HS | |
| Intel Core i5-12600K | |
| AMD Ryzen 9 5950X | |
| Intel Core i5-13400 | |
| Intel Core i5-12400F | |
| CPU Multi 64Bit | |
| Intel Core i9-14900K | |
| Intel Core i9-13900K | |
| AMD Ryzen 9 7950X | |
| AMD Ryzen 9 7950X3D | |
| AMD Ryzen 9 7900X | |
| AMD Ryzen 9 5950X | |
| Intel Core i9-12900K | |
| Intel Core i5-13600K | |
| Intel Core i5-14600K | |
| AMD Ryzen 7 7745HX | |
| AMD Ryzen 7 7800X3D | |
| AMD Ryzen 9 7940HS | |
| AMD Ryzen 7 7840HS | |
| Intel Core i5-12600K | |
| AMD Ryzen 5 7600X | |
| Intel Core i5-13400 | |
| Intel Core i5-12400F | |
| Cinebench R10 | |
| Rendering Single CPUs 64Bit | |
| Intel Core i9-14900K | |
| Intel Core i9-13900K | |
| Intel Core i5-14600K | |
| AMD Ryzen 9 7900X | |
| AMD Ryzen 9 7950X | |
| Intel Core i5-13600K | |
| Intel Core i9-12900K | |
| AMD Ryzen 5 7600X | |
| Intel Core i5-12600K | |
| AMD Ryzen 7 7745HX | |
| AMD Ryzen 9 7940HS | |
| AMD Ryzen 7 7800X3D | |
| AMD Ryzen 7 7840HS | |
| Intel Core i5-13400 | |
| Intel Core i5-12400F | |
| AMD Ryzen 9 5950X | |
| AMD Ryzen 9 7950X3D | |
| Rendering Multiple CPUs 64Bit | |
| Intel Core i9-14900K | |
| Intel Core i9-13900K | |
| AMD Ryzen 9 7950X | |
| AMD Ryzen 9 7900X | |
| Intel Core i5-14600K | |
| Intel Core i9-12900K | |
| Intel Core i5-13600K | |
| AMD Ryzen 9 5950X | |
| AMD Ryzen 7 7745HX | |
| AMD Ryzen 7 7800X3D | |
| AMD Ryzen 5 7600X | |
| Intel Core i5-12600K | |
| AMD Ryzen 9 7940HS | |
| AMD Ryzen 7 7840HS | |
| Intel Core i5-13400 | |
| AMD Ryzen 9 7950X3D | |
| Intel Core i5-12400F | |
| Blender - v2.79 BMW27 CPU | |
| Intel Core i5-12400F | |
| Intel Core i5-13400 | |
| AMD Ryzen 5 7600X | |
| AMD Ryzen 7 7840HS | |
| Intel Core i5-12600K | |
| AMD Ryzen 9 7940HS | |
| AMD Ryzen 7 7800X3D | |
| AMD Ryzen 7 7745HX | |
| Intel Core i5-13600K | |
| Intel Core i5-14600K | |
| Intel Core i9-12900K | |
| AMD Ryzen 9 5950X | |
| AMD Ryzen 9 7900X | |
| AMD Ryzen 9 7950X3D | |
| AMD Ryzen 9 7950X | |
| Intel Core i9-13900K | |
| Intel Core i9-14900K | |
| wPrime 2.10 | |
| 32m | |
| Intel Core i9-12900K | |
| Intel Core i5-12600K | |
| Intel Core i5-12400F | |
| Intel Core i5-13400 | |
| AMD Ryzen 5 7600X | |
| AMD Ryzen 9 7940HS | |
| AMD Ryzen 7 7840HS | |
| AMD Ryzen 9 5950X | |
| Intel Core i5-13600K | |
| AMD Ryzen 7 7800X3D | |
| Intel Core i5-14600K | |
| AMD Ryzen 7 7745HX | |
| Intel Core i9-14900K | |
| AMD Ryzen 9 7950X3D | |
| Intel Core i9-13900K | |
| AMD Ryzen 9 7900X | |
| AMD Ryzen 9 7950X | |
| 1024m | |
| Intel Core i5-13400 | |
| Intel Core i5-12600K | |
| Intel Core i9-12900K | |
| Intel Core i5-13600K | |
| Intel Core i5-14600K | |
| Intel Core i5-12400F | |
| Intel Core i9-13900K | |
| AMD Ryzen 5 7600X | |
| Intel Core i9-14900K | |
| AMD Ryzen 7 7840HS | |
| AMD Ryzen 9 7940HS | |
| AMD Ryzen 9 5950X | |
| AMD Ryzen 7 7800X3D | |
| AMD Ryzen 7 7745HX | |
| AMD Ryzen 9 7900X | |
| AMD Ryzen 9 7950X3D | |
| AMD Ryzen 9 7950X | |
| X264 HD Benchmark 4.0 | |
| Pass 1 | |
| Intel Core i9-14900K | |
| Intel Core i9-13900K | |
| Intel Core i5-14600K | |
| AMD Ryzen 9 7950X3D | |
| Intel Core i5-13600K | |
| AMD Ryzen 9 7950X | |
| AMD Ryzen 9 7900X | |
| Intel Core i9-12900K | |
| AMD Ryzen 5 7600X | |
| AMD Ryzen 7 7745HX | |
| AMD Ryzen 7 7800X3D | |
| AMD Ryzen 9 5950X | |
| Intel Core i5-12600K | |
| Intel Core i5-13400 | |
| AMD Ryzen 9 7940HS | |
| AMD Ryzen 7 7840HS | |
| Intel Core i5-12400F | |
| Pass 2 | |
| Intel Core i9-14900K | |
| Intel Core i9-13900K | |
| AMD Ryzen 9 7950X | |
| AMD Ryzen 9 7950X3D | |
| AMD Ryzen 9 7900X | |
| AMD Ryzen 9 5950X | |
| Intel Core i5-14600K | |
| Intel Core i9-12900K | |
| Intel Core i5-13600K | |
| AMD Ryzen 7 7745HX | |
| AMD Ryzen 7 7800X3D | |
| AMD Ryzen 9 7940HS | |
| AMD Ryzen 7 7840HS | |
| Intel Core i5-12600K | |
| AMD Ryzen 5 7600X | |
| Intel Core i5-13400 | |
| Intel Core i5-12400F | |
| WinRAR - Result | |
| AMD Ryzen 9 7900X | |
| AMD Ryzen 7 7800X3D | |
| AMD Ryzen 9 7950X | |
| AMD Ryzen 5 7600X | |
| Intel Core i9-14900K | |
| AMD Ryzen 9 7950X3D | |
| Intel Core i9-13900K | |
| AMD Ryzen 7 7745HX | |
| AMD Ryzen 9 5950X | |
| Intel Core i5-14600K | |
| Intel Core i5-13600K | |
| Intel Core i9-12900K | |
| Intel Core i5-13400 | |
| Intel Core i5-12400F | |
| AMD Ryzen 7 7840HS | |
| AMD Ryzen 9 7940HS | |
| Intel Core i5-12600K | |
| Geekbench 5.5 | |
| Multi-Core | |
| Intel Core i9-14900K | |
| AMD Ryzen 9 7950X | |
| AMD Ryzen 9 7950X3D | |
| Intel Core i9-13900K | |
| AMD Ryzen 9 7900X | |
| Intel Core i9-12900K | |
| Intel Core i5-14600K | |
| AMD Ryzen 9 5950X | |
| Intel Core i5-13600K | |
| AMD Ryzen 7 7800X3D | |
| AMD Ryzen 7 7745HX | |
| Intel Core i5-12600K | |
| AMD Ryzen 7 7840HS | |
| Intel Core i5-13400 | |
| AMD Ryzen 5 7600X | |
| AMD Ryzen 9 7940HS | |
| Intel Core i5-12400F | |
| Single-Core | |
| AMD Ryzen 9 7950X | |
| AMD Ryzen 9 7950X3D | |
| Intel Core i9-13900K | |
| AMD Ryzen 9 7900X | |
| Intel Core i9-14900K | |
| AMD Ryzen 5 7600X | |
| AMD Ryzen 7 7745HX | |
| Intel Core i9-12900K | |
| AMD Ryzen 7 7800X3D | |
| Intel Core i5-14600K | |
| AMD Ryzen 9 7940HS | |
| Intel Core i5-13600K | |
| AMD Ryzen 7 7840HS | |
| Intel Core i5-12600K | |
| Intel Core i5-13400 | |
| Intel Core i5-12400F | |
| AMD Ryzen 9 5950X | |
| Geekbench 5.0 | |
| 5.0 Multi-Core | |
| Intel Core i9-14900K | |
| AMD Ryzen 9 7950X | |
| Intel Core i9-13900K | |
| AMD Ryzen 9 7950X3D | |
| AMD Ryzen 9 7900X | |
| Intel Core i9-12900K | |
| Intel Core i5-14600K | |
| Intel Core i5-13600K | |
| AMD Ryzen 9 5950X | |
| AMD Ryzen 7 7800X3D | |
| AMD Ryzen 7 7745HX | |
| Intel Core i5-12600K | |
| AMD Ryzen 7 7840HS | |
| AMD Ryzen 5 7600X | |
| Intel Core i5-13400 | |
| AMD Ryzen 9 7940HS | |
| Intel Core i5-12400F | |
| 5.0 Single-Core | |
| Intel Core i9-14900K | |
| AMD Ryzen 9 7950X | |
| Intel Core i9-13900K | |
| AMD Ryzen 9 7900X | |
| AMD Ryzen 9 7950X3D | |
| AMD Ryzen 5 7600X | |
| Intel Core i5-14600K | |
| AMD Ryzen 7 7745HX | |
| Intel Core i9-12900K | |
| AMD Ryzen 7 7800X3D | |
| Intel Core i5-13600K | |
| AMD Ryzen 7 7840HS | |
| AMD Ryzen 9 7940HS | |
| Intel Core i5-12600K | |
| Intel Core i5-13400 | |
| AMD Ryzen 9 5950X | |
| Intel Core i5-12400F | |
| Geekbench 4.4 | |
| 64 Bit Single-Core Score | |
| Intel Core i9-14900K | |
| Intel Core i9-13900K | |
| AMD Ryzen 9 7950X | |
| AMD Ryzen 9 7950X3D | |
| AMD Ryzen 9 7900X | |
| AMD Ryzen 7 7800X3D | |
| AMD Ryzen 5 7600X | |
| Intel Core i5-14600K | |
| Intel Core i9-12900K | |
| Intel Core i5-13600K | |
| AMD Ryzen 7 7745HX | |
| Intel Core i5-12600K | |
| AMD Ryzen 7 7840HS | |
| AMD Ryzen 9 7940HS | |
| Intel Core i5-13400 | |
| Intel Core i5-12400F | |
| AMD Ryzen 9 5950X | |
| 64 Bit Multi-Core Score | |
| AMD Ryzen 9 7950X | |
| Intel Core i9-14900K | |
| AMD Ryzen 9 7950X3D | |
| Intel Core i9-13900K | |
| AMD Ryzen 9 7900X | |
| Intel Core i5-14600K | |
| Intel Core i9-12900K | |
| AMD Ryzen 9 5950X | |
| Intel Core i5-13600K | |
| AMD Ryzen 7 7800X3D | |
| AMD Ryzen 7 7745HX | |
| AMD Ryzen 7 7840HS | |
| AMD Ryzen 5 7600X | |
| Intel Core i5-12600K | |
| AMD Ryzen 9 7940HS | |
| Intel Core i5-13400 | |
| Intel Core i5-12400F | |
| 3DMark 11 - 1280x720 Performance Physics | |
| AMD Ryzen 9 7950X3D | |
| AMD Ryzen 7 7800X3D | |
| Intel Core i9-13900K | |
| Intel Core i9-14900K | |
| Intel Core i5-14600K | |
| Intel Core i5-13600K | |
| AMD Ryzen 9 7900X | |
| AMD Ryzen 9 7950X | |
| Intel Core i9-12900K | |
| AMD Ryzen 7 7745HX | |
| AMD Ryzen 5 7600X | |
| AMD Ryzen 9 5950X | |
| Intel Core i5-12600K | |
| Intel Core i5-13400 | |
| AMD Ryzen 7 7840HS | |
| AMD Ryzen 9 7940HS | |
| Intel Core i5-12400F | |
| 7-Zip 18.03 | |
| 7z b 4 | |
| AMD Ryzen 9 7950X | |
| AMD Ryzen 9 7950X3D | |
| Intel Core i9-14900K | |
| Intel Core i9-13900K | |
| AMD Ryzen 9 5950X | |
| AMD Ryzen 9 7900X | |
| Intel Core i9-12900K | |
| Intel Core i5-14600K | |
| Intel Core i5-13600K | |
| AMD Ryzen 7 7800X3D | |
| AMD Ryzen 7 7745HX | |
| AMD Ryzen 7 7840HS | |
| AMD Ryzen 9 7940HS | |
| AMD Ryzen 5 7600X | |
| Intel Core i5-12600K | |
| Intel Core i5-13400 | |
| Intel Core i5-12400F | |
| 7z b 4 -mmt1 | |
| AMD Ryzen 9 7950X | |
| AMD Ryzen 9 7950X3D | |
| AMD Ryzen 9 7900X | |
| AMD Ryzen 7 7800X3D | |
| AMD Ryzen 5 7600X | |
| Intel Core i9-14900K | |
| AMD Ryzen 7 7745HX | |
| Intel Core i9-13900K | |
| AMD Ryzen 9 5950X | |
| Intel Core i5-14600K | |
| AMD Ryzen 9 7940HS | |
| Intel Core i9-12900K | |
| AMD Ryzen 7 7840HS | |
| Intel Core i5-13600K | |
| Intel Core i5-12600K | |
| Intel Core i5-13400 | |
| Intel Core i5-12400F | |
| HWBOT x265 Benchmark v2.2 - 4k Preset | |
| AMD Ryzen 9 7950X | |
| Intel Core i9-14900K | |
| Intel Core i9-13900K | |
| AMD Ryzen 9 7950X3D | |
| AMD Ryzen 9 7900X | |
| AMD Ryzen 9 5950X | |
| Intel Core i5-12600K | |
| Intel Core i9-12900K | |
| Intel Core i5-14600K | |
| Intel Core i5-13600K | |
| AMD Ryzen 7 7800X3D | |
| AMD Ryzen 7 7745HX | |
| AMD Ryzen 5 7600X | |
| AMD Ryzen 7 7840HS | |
| AMD Ryzen 9 7940HS | |
| Intel Core i5-13400 | |
| Intel Core i5-12400F | |
| R Benchmark 2.5 - Overall mean | |
| Intel Core i5-12400F | |
| Intel Core i5-13400 | |
| AMD Ryzen 9 5950X | |
| Intel Core i5-12600K | |
| AMD Ryzen 7 7840HS | |
| Intel Core i9-12900K | |
| AMD Ryzen 9 7940HS | |
| AMD Ryzen 7 7800X3D | |
| AMD Ryzen 7 7745HX | |
| Intel Core i5-13600K | |
| Intel Core i5-14600K | |
| AMD Ryzen 5 7600X | |
| AMD Ryzen 9 7900X | |
| AMD Ryzen 9 7950X3D | |
| AMD Ryzen 9 7950X | |
| Intel Core i9-13900K | |
| Intel Core i9-14900K | |
| LibreOffice - 20 Documents To PDF | |
| Intel Core i5-12600K | |
| AMD Ryzen 7 7840HS | |
| Intel Core i5-12400F | |
| AMD Ryzen 9 7940HS | |
| AMD Ryzen 9 5950X | |
| AMD Ryzen 7 7745HX | |
| AMD Ryzen 7 7800X3D | |
| Intel Core i9-12900K | |
| Intel Core i5-13400 | |
| AMD Ryzen 9 7950X3D | |
| AMD Ryzen 5 7600X | |
| Intel Core i9-13900K | |
| AMD Ryzen 9 7950X | |
| Intel Core i5-13600K | |
| AMD Ryzen 9 7900X | |
| Intel Core i9-14900K | |
| Intel Core i5-14600K | |
| WebXPRT 3 - Overall | |
| AMD Ryzen 9 7950X3D | |
| Intel Core i9-14900K | |
| AMD Ryzen 9 7900X | |
| AMD Ryzen 9 7950X | |
| AMD Ryzen 5 7600X | |
| Intel Core i9-13900K | |
| Intel Core i5-14600K | |
| AMD Ryzen 7 7800X3D | |
| AMD Ryzen 7 7745HX | |
| Intel Core i5-13600K | |
| AMD Ryzen 7 7840HS | |
| Intel Core i9-12900K | |
| Intel Core i5-13400 | |
| AMD Ryzen 9 7940HS | |
| Intel Core i5-12600K | |
| AMD Ryzen 9 5950X | |
| Intel Core i5-12400F | |
| Mozilla Kraken 1.1 - Total | |
| Intel Core i5-12400F | |
| AMD Ryzen 9 5950X | |
| Intel Core i5-13400 | |
| AMD Ryzen 7 7840HS | |
| Intel Core i5-12600K | |
| AMD Ryzen 7 7800X3D | |
| AMD Ryzen 9 7940HS | |
| Intel Core i9-12900K | |
| AMD Ryzen 7 7745HX | |
| Intel Core i5-13600K | |
| Intel Core i5-14600K | |
| AMD Ryzen 5 7600X | |
| AMD Ryzen 9 7950X3D | |
| AMD Ryzen 9 7950X | |
| Intel Core i9-13900K | |
| AMD Ryzen 9 7900X | |
| Intel Core i9-14900K | |
| 3DMark | |
| 1920x1080 Fire Strike Physics | |
| Intel Core i9-14900K | |
| Intel Core i9-13900K | |
| AMD Ryzen 9 7950X3D | |
| AMD Ryzen 9 7900X | |
| AMD Ryzen 9 7950X | |
| Intel Core i5-14600K | |
| AMD Ryzen 9 5950X | |
| Intel Core i9-12900K | |
| Intel Core i5-13600K | |
| AMD Ryzen 7 7800X3D | |
| AMD Ryzen 5 7600X | |
| Intel Core i5-12600K | |
| AMD Ryzen 7 7840HS | |
| AMD Ryzen 9 7940HS | |
| Intel Core i5-13400 | |
| Intel Core i5-12400F | |
| AMD Ryzen 7 7745HX | |
| 2560x1440 Time Spy CPU | |
| Intel Core i9-14900K | |
| Intel Core i9-13900K | |
| Intel Core i5-14600K | |
| Intel Core i9-12900K | |
| AMD Ryzen 9 7950X3D | |
| Intel Core i5-13600K | |
| AMD Ryzen 9 7900X | |
| AMD Ryzen 9 7950X | |
| AMD Ryzen 7 7800X3D | |
| Intel Core i5-12600K | |
| AMD Ryzen 9 5950X | |
| Intel Core i5-13400 | |
| AMD Ryzen 7 7840HS | |
| AMD Ryzen 7 7745HX | |
| AMD Ryzen 9 7940HS | |
| AMD Ryzen 5 7600X | |
| Intel Core i5-12400F | |
* ... kleinere Werte sind besser
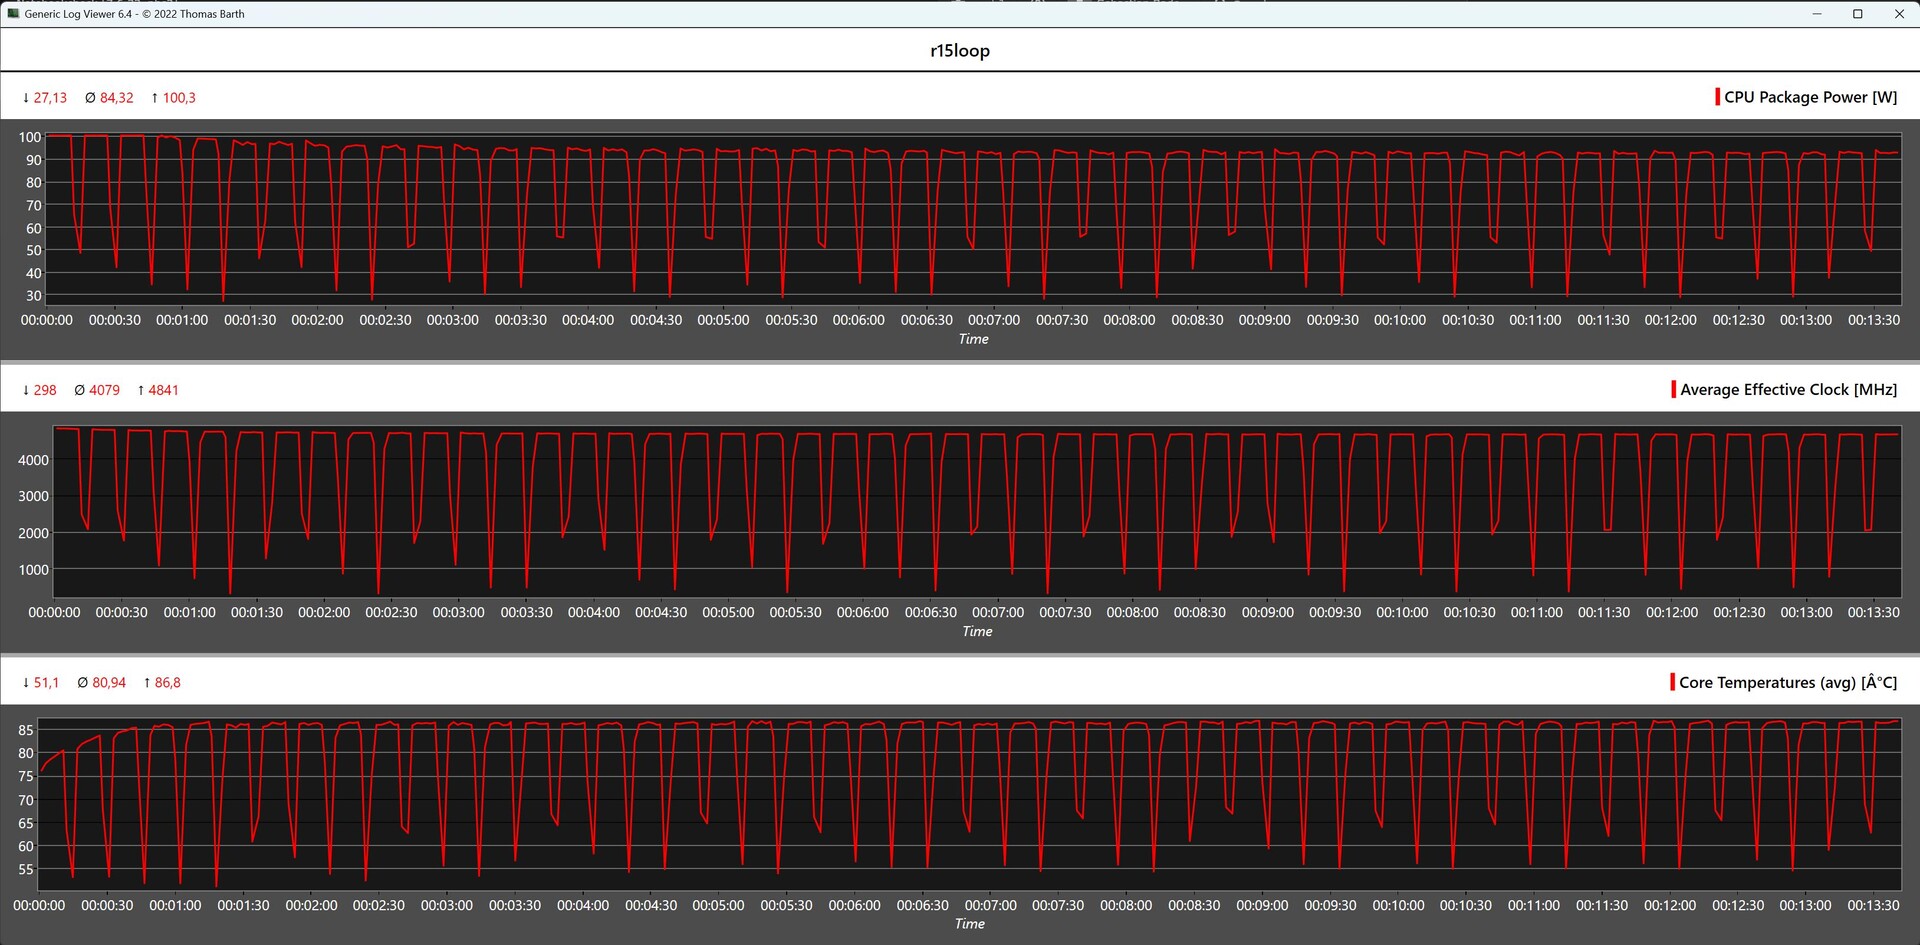
Cinebench-Ergebnisse AMD Ryzen 7 7745HX
Mit der Cinebench-R15-Dauerschleife bekommen wir einen guten Ersteindruck hinsichtlich der verbauten Kühleinheit. Grundsätzlich sehen wir eine relativ stabile Leistung des AMD Ryzen 7 7745HX. Mit durchschnittlich 2.867 Punkten liefert unser Testsample hier ein hervorragendes Ergebnis. Auch in dieser Messung kann das Ergebnis eines AMD Ryzen 7 7840HS wieder deutlich übertroffen werden.
System Performance
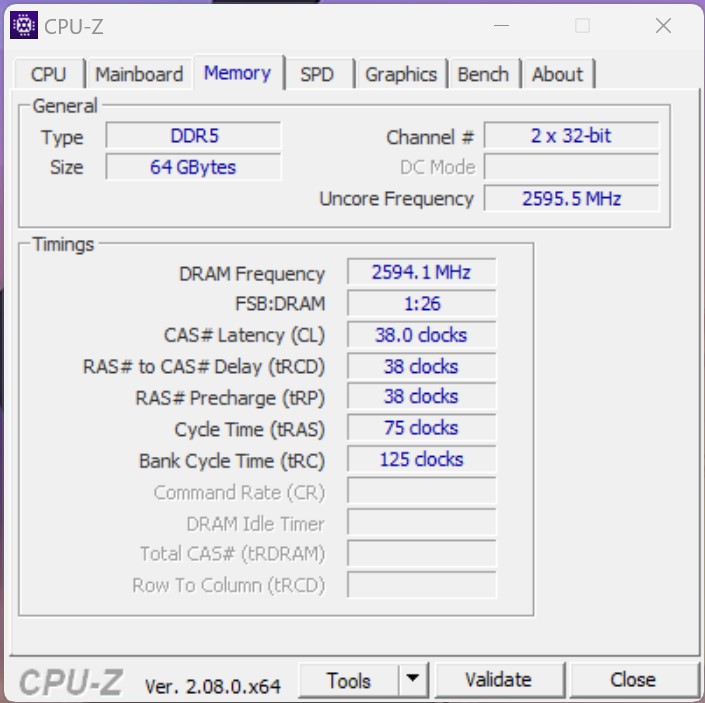
Bei der Systemleistung schildern wir kurz einmal unsere subjektive Erfahrung mit dem Minisforum-BD770i-Testsystem: Die Leistung des Systems ist grundsätzlich auf einem hohen Niveau. Der native 8-Kerner meistert die meisten leistungshungrigen Anwendungen recht gut und kann im Zusammenspiel mit der schnellen NVMe-SSD und dem DDR5-RAM für ein flottes Arbeitstempo sorgen. Prinzipiell gilt das für alle hier aufgeführten Vergleichssysteme. Hier leistet sich keine Kombination einen nennenswerten Patzer. Die Unterschiede sind lediglich messbar und zeigen, dass sich das Minisforum-BD770i-System nur im hinteren Mittelfeld einsortiert. Gleiches gilt auch für die beiden Mini-PCs aus dem Hause Minisforum, welche in puncto Leistung einem High-End-Desktop-System nicht gewachsen sind. Zugegebenermaßen ist das hier auch ein unfairer Vergleich, doch um die Leistung des Minisforum BD770i zusammen mit dem AMD Ryzen 7 7745HX besser einzuordnen, haben wir diese Geräte in die Übersicht einfließen lassen.
| Performance Rating - Percent | |
| AMD Ryzen 9 7950X3D, AMD Ryzen 9 7950X3D -1! | |
| NVIDIA GeForce RTX 3090 Founders Edition, AMD Ryzen 9 7950X | |
| AMD Ryzen 9 7900X, AMD Ryzen 9 7900X | |
| Palit GeForce RTX 4090 GameRock OC, Intel Core i9-14900K | |
| AMD Ryzen 5 7600X, AMD Ryzen 5 7600X | |
| Intel Core i9-13900K, Intel Core i9-13900K | |
| Intel Core i5-13600K, Intel Core i5-13600K | |
| Intel Core i5-14600K, Intel Core i5-14600K | |
| AMD Ryzen 7 7800X3D, AMD Ryzen 7 7800X3D | |
| AMD Ryzen 9 5950X, AMD Ryzen 9 5950X | |
| Intel Core i9-12900K, Intel Core i9-12900K | |
| Intel Core i5-13400, Intel Core i5-13400 | |
| Intel Core i5-12600K, Intel Core i5-12600K | |
| Minisforum BD770i, AMD Ryzen 7 7745HX | |
| Minisforum EliteMini UM780 XTX, AMD Ryzen 7 7840HS | |
| Minisforum Venus Series UM790 Pro, AMD Ryzen 9 7940HS | |
| Intel Core i5-12400F, Intel Core i5-12400F | |
| CrossMark / Overall | |
| Palit GeForce RTX 4090 GameRock OC, Palit GeForce RTX 4090 GameRock OC, Intel Core i9-14900K | |
| Intel Core i9-13900K, Intel Core i9-13900K, Intel Core i9-13900K | |
| NVIDIA GeForce RTX 3090 Founders Edition, NVIDIA GeForce RTX 3090 Founders Edition, AMD Ryzen 9 7950X | |
| AMD Ryzen 9 7900X, AMD Ryzen 9 7900X, AMD Ryzen 9 7900X | |
| Intel Core i5-14600K, Intel Core i5-14600K, Intel Core i5-14600K | |
| Intel Core i5-13600K, Intel Core i5-13600K, Intel Core i5-13600K | |
| AMD Ryzen 5 7600X, AMD Ryzen 5 7600X, AMD Ryzen 5 7600X | |
| AMD Ryzen 7 7800X3D, AMD Ryzen 7 7800X3D, AMD Ryzen 7 7800X3D | |
| AMD Ryzen 9 7950X3D, AMD Ryzen 9 7950X3D, AMD Ryzen 9 7950X3D | |
| Minisforum BD770i, AMD Ryzen 7 7745HX | |
| Intel Core i5-13400, Intel Core i5-13400, Intel Core i5-13400 | |
| Intel Core i5-12400F, Intel Core i5-12400F, Intel Core i5-12400F | |
| Minisforum EliteMini UM780 XTX, AMD Ryzen 7 7840HS | |
| Minisforum Venus Series UM790 Pro, AMD Ryzen 9 7940HS | |
| AMD Ryzen 9 5950X, AMD Ryzen 9 5950X, AMD Ryzen 9 5950X | |
| CrossMark / Productivity | |
| Palit GeForce RTX 4090 GameRock OC, Palit GeForce RTX 4090 GameRock OC, Intel Core i9-14900K | |
| Intel Core i9-13900K, Intel Core i9-13900K, Intel Core i9-13900K | |
| NVIDIA GeForce RTX 3090 Founders Edition, NVIDIA GeForce RTX 3090 Founders Edition, AMD Ryzen 9 7950X | |
| AMD Ryzen 9 7900X, AMD Ryzen 9 7900X, AMD Ryzen 9 7900X | |
| Intel Core i5-14600K, Intel Core i5-14600K, Intel Core i5-14600K | |
| Intel Core i5-13600K, Intel Core i5-13600K, Intel Core i5-13600K | |
| AMD Ryzen 5 7600X, AMD Ryzen 5 7600X, AMD Ryzen 5 7600X | |
| AMD Ryzen 7 7800X3D, AMD Ryzen 7 7800X3D, AMD Ryzen 7 7800X3D | |
| Minisforum BD770i, AMD Ryzen 7 7745HX | |
| AMD Ryzen 9 7950X3D, AMD Ryzen 9 7950X3D, AMD Ryzen 9 7950X3D | |
| Intel Core i5-13400, Intel Core i5-13400, Intel Core i5-13400 | |
| Minisforum Venus Series UM790 Pro, AMD Ryzen 9 7940HS | |
| Intel Core i5-12400F, Intel Core i5-12400F, Intel Core i5-12400F | |
| Minisforum EliteMini UM780 XTX, AMD Ryzen 7 7840HS | |
| AMD Ryzen 9 5950X, AMD Ryzen 9 5950X, AMD Ryzen 9 5950X | |
| CrossMark / Creativity | |
| Palit GeForce RTX 4090 GameRock OC, Palit GeForce RTX 4090 GameRock OC, Intel Core i9-14900K | |
| NVIDIA GeForce RTX 3090 Founders Edition, NVIDIA GeForce RTX 3090 Founders Edition, AMD Ryzen 9 7950X | |
| Intel Core i9-13900K, Intel Core i9-13900K, Intel Core i9-13900K | |
| AMD Ryzen 9 7900X, AMD Ryzen 9 7900X, AMD Ryzen 9 7900X | |
| Intel Core i5-14600K, Intel Core i5-14600K, Intel Core i5-14600K | |
| AMD Ryzen 9 7950X3D, AMD Ryzen 9 7950X3D, AMD Ryzen 9 7950X3D | |
| AMD Ryzen 7 7800X3D, AMD Ryzen 7 7800X3D, AMD Ryzen 7 7800X3D | |
| AMD Ryzen 5 7600X, AMD Ryzen 5 7600X, AMD Ryzen 5 7600X | |
| Intel Core i5-13600K, Intel Core i5-13600K, Intel Core i5-13600K | |
| Minisforum BD770i, AMD Ryzen 7 7745HX | |
| Minisforum EliteMini UM780 XTX, AMD Ryzen 7 7840HS | |
| Intel Core i5-13400, Intel Core i5-13400, Intel Core i5-13400 | |
| Minisforum Venus Series UM790 Pro, AMD Ryzen 9 7940HS | |
| Intel Core i5-12400F, Intel Core i5-12400F, Intel Core i5-12400F | |
| AMD Ryzen 9 5950X, AMD Ryzen 9 5950X, AMD Ryzen 9 5950X | |
| CrossMark / Responsiveness | |
| Intel Core i9-13900K, Intel Core i9-13900K, Intel Core i9-13900K | |
| Palit GeForce RTX 4090 GameRock OC, Palit GeForce RTX 4090 GameRock OC, Intel Core i9-14900K | |
| Intel Core i5-13600K, Intel Core i5-13600K, Intel Core i5-13600K | |
| NVIDIA GeForce RTX 3090 Founders Edition, NVIDIA GeForce RTX 3090 Founders Edition, AMD Ryzen 9 7950X | |
| AMD Ryzen 9 7900X, AMD Ryzen 9 7900X, AMD Ryzen 9 7900X | |
| AMD Ryzen 5 7600X, AMD Ryzen 5 7600X, AMD Ryzen 5 7600X | |
| Intel Core i5-14600K, Intel Core i5-14600K, Intel Core i5-14600K | |
| AMD Ryzen 7 7800X3D, AMD Ryzen 7 7800X3D, AMD Ryzen 7 7800X3D | |
| Minisforum BD770i, AMD Ryzen 7 7745HX | |
| Intel Core i5-13400, Intel Core i5-13400, Intel Core i5-13400 | |
| Intel Core i5-12400F, Intel Core i5-12400F, Intel Core i5-12400F | |
| AMD Ryzen 9 7950X3D, AMD Ryzen 9 7950X3D, AMD Ryzen 9 7950X3D | |
| Minisforum Venus Series UM790 Pro, AMD Ryzen 9 7940HS | |
| Minisforum EliteMini UM780 XTX, AMD Ryzen 7 7840HS | |
| AMD Ryzen 9 5950X, AMD Ryzen 9 5950X, AMD Ryzen 9 5950X | |
| AIDA64 / Memory Copy | |
| Palit GeForce RTX 4090 GameRock OC | |
| Palit GeForce RTX 4090 GameRock OC | |
| Intel Core i5-14600K | |
| Intel Core i9-13900K | |
| AMD Ryzen 9 7950X3D | |
| Intel Core i9-12900K | |
| NVIDIA GeForce RTX 3090 Founders Edition | |
| Intel Core i5-13400 | |
| Intel Core i5-13600K | |
| Intel Core i5-12400F | |
| Intel Core i5-12600K | |
| Durchschnitt der Klasse Desktop (54743 - 98416, n=21, der letzten 2 Jahre) | |
| AMD Ryzen 9 7900X | |
| Minisforum EliteMini UM780 XTX | |
| AMD Ryzen 7 7800X3D | |
| Minisforum Venus Series UM790 Pro | |
| AMD Ryzen 5 7600X | |
| AMD Ryzen 9 5950X | |
| Minisforum BD770i | |
| Durchschnittliche AMD Ryzen 7 7745HX (50007 - 53867, n=2) | |
| AIDA64 / Memory Read | |
| Palit GeForce RTX 4090 GameRock OC | |
| Palit GeForce RTX 4090 GameRock OC | |
| Intel Core i5-14600K | |
| Intel Core i9-13900K | |
| Intel Core i9-12900K | |
| AMD Ryzen 9 7950X3D | |
| NVIDIA GeForce RTX 3090 Founders Edition | |
| Intel Core i5-13400 | |
| Intel Core i5-12600K | |
| Intel Core i5-13600K | |
| Durchschnitt der Klasse Desktop (58375 - 110448, n=21, der letzten 2 Jahre) | |
| AMD Ryzen 9 7900X | |
| Intel Core i5-12400F | |
| AMD Ryzen 9 5950X | |
| AMD Ryzen 7 7800X3D | |
| Minisforum EliteMini UM780 XTX | |
| Minisforum Venus Series UM790 Pro | |
| AMD Ryzen 5 7600X | |
| Minisforum BD770i | |
| Durchschnittliche AMD Ryzen 7 7745HX (50703 - 54278, n=2) | |
| AIDA64 / Memory Write | |
| AMD Ryzen 7 7800X3D | |
| Minisforum EliteMini UM780 XTX | |
| AMD Ryzen 9 7950X3D | |
| Intel Core i5-14600K | |
| Palit GeForce RTX 4090 GameRock OC | |
| Palit GeForce RTX 4090 GameRock OC | |
| AMD Ryzen 5 7600X | |
| NVIDIA GeForce RTX 3090 Founders Edition | |
| Minisforum Venus Series UM790 Pro | |
| Durchschnitt der Klasse Desktop (60635 - 93889, n=21, der letzten 2 Jahre) | |
| AMD Ryzen 9 7900X | |
| Intel Core i9-13900K | |
| Intel Core i5-13400 | |
| Intel Core i5-12600K | |
| Intel Core i5-12400F | |
| Intel Core i9-12900K | |
| Intel Core i5-13600K | |
| Minisforum BD770i | |
| Durchschnittliche AMD Ryzen 7 7745HX (54587 - 70803, n=2) | |
| AMD Ryzen 9 5950X | |
| AIDA64 / Memory Latency | |
| Minisforum EliteMini UM780 XTX | |
| Durchschnitt der Klasse Desktop (68.5 - 168, n=21, der letzten 2 Jahre) | |
| Minisforum Venus Series UM790 Pro | |
| Durchschnittliche AMD Ryzen 7 7745HX (80.7 - 86.5, n=2) | |
| Intel Core i5-13600K | |
| Minisforum BD770i | |
| Intel Core i5-12400F | |
| Intel Core i5-13400 | |
| Intel Core i9-13900K | |
| Palit GeForce RTX 4090 GameRock OC | |
| Palit GeForce RTX 4090 GameRock OC | |
| Intel Core i5-14600K | |
| AMD Ryzen 7 7800X3D | |
| AMD Ryzen 9 5950X | |
| AMD Ryzen 9 7950X3D | |
| AMD Ryzen 5 7600X | |
| AMD Ryzen 9 7900X | |
| NVIDIA GeForce RTX 3090 Founders Edition | |
* ... kleinere Werte sind besser
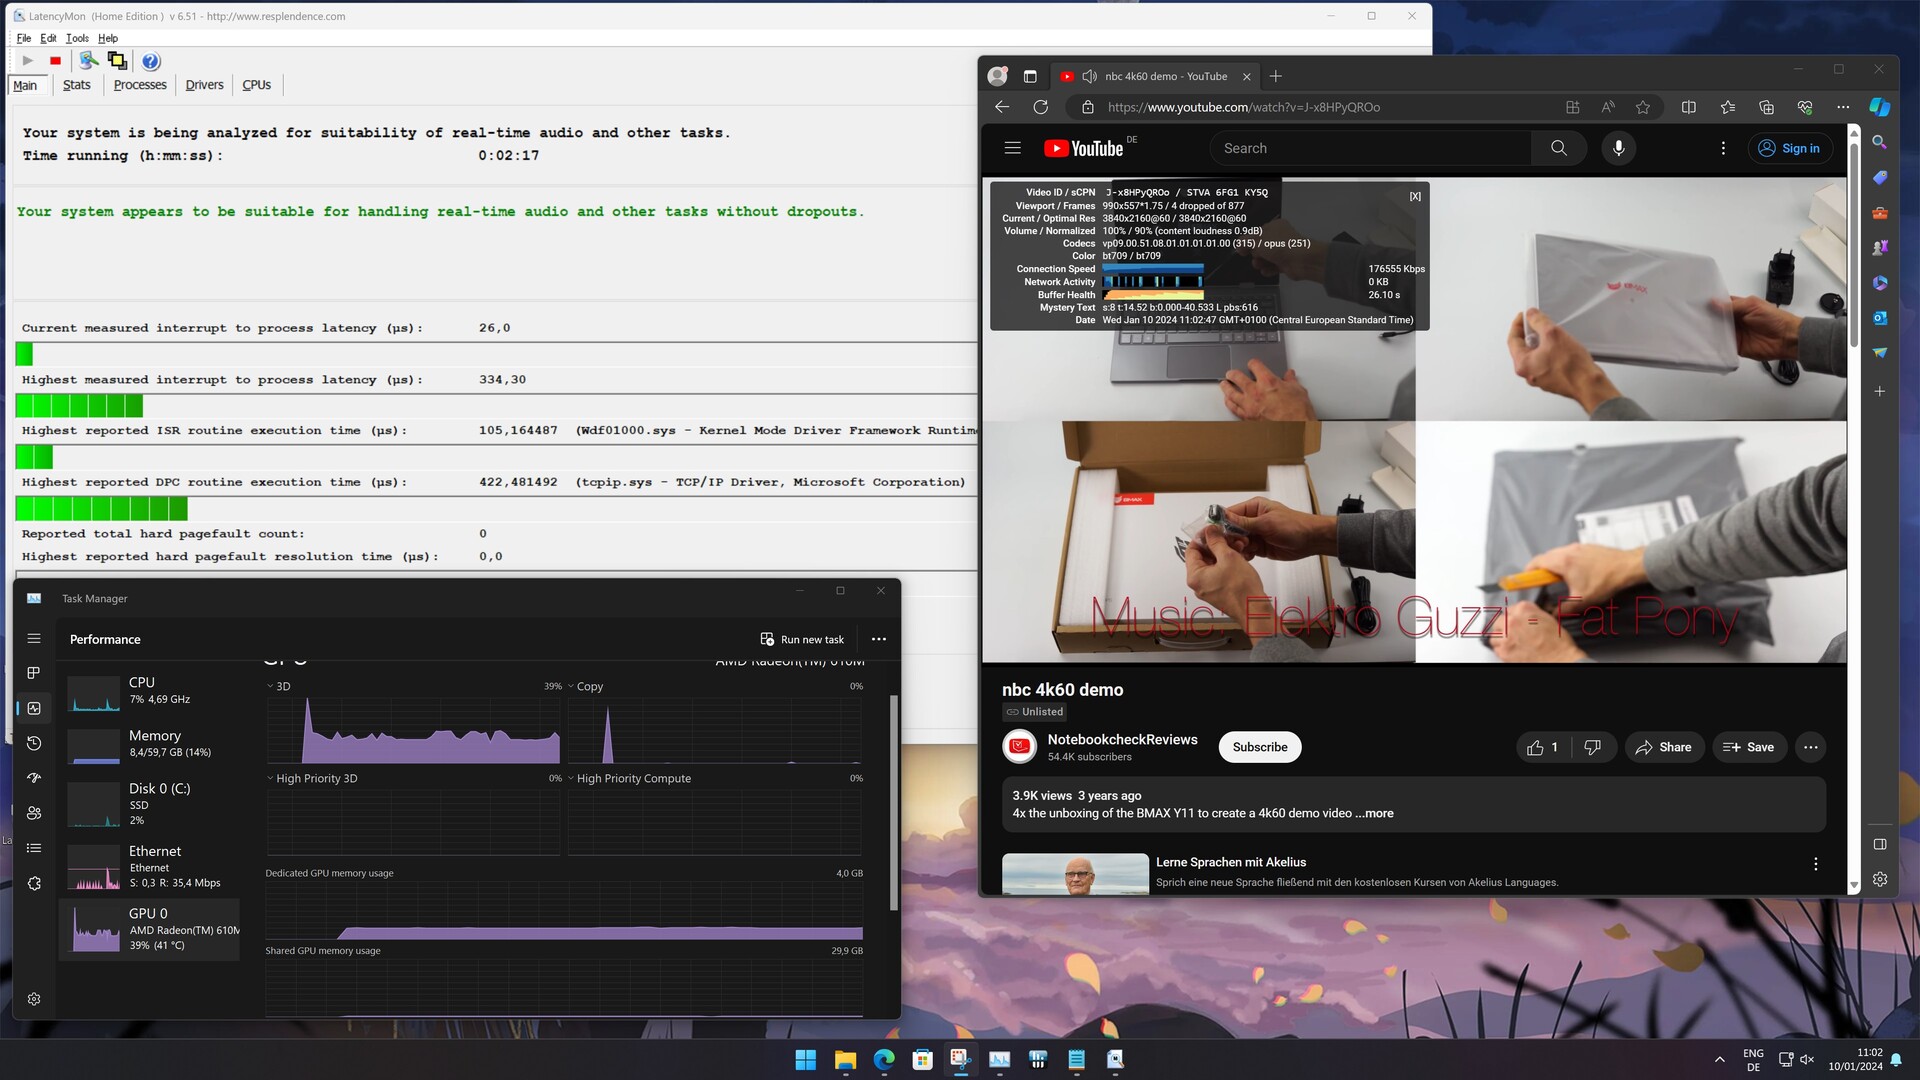
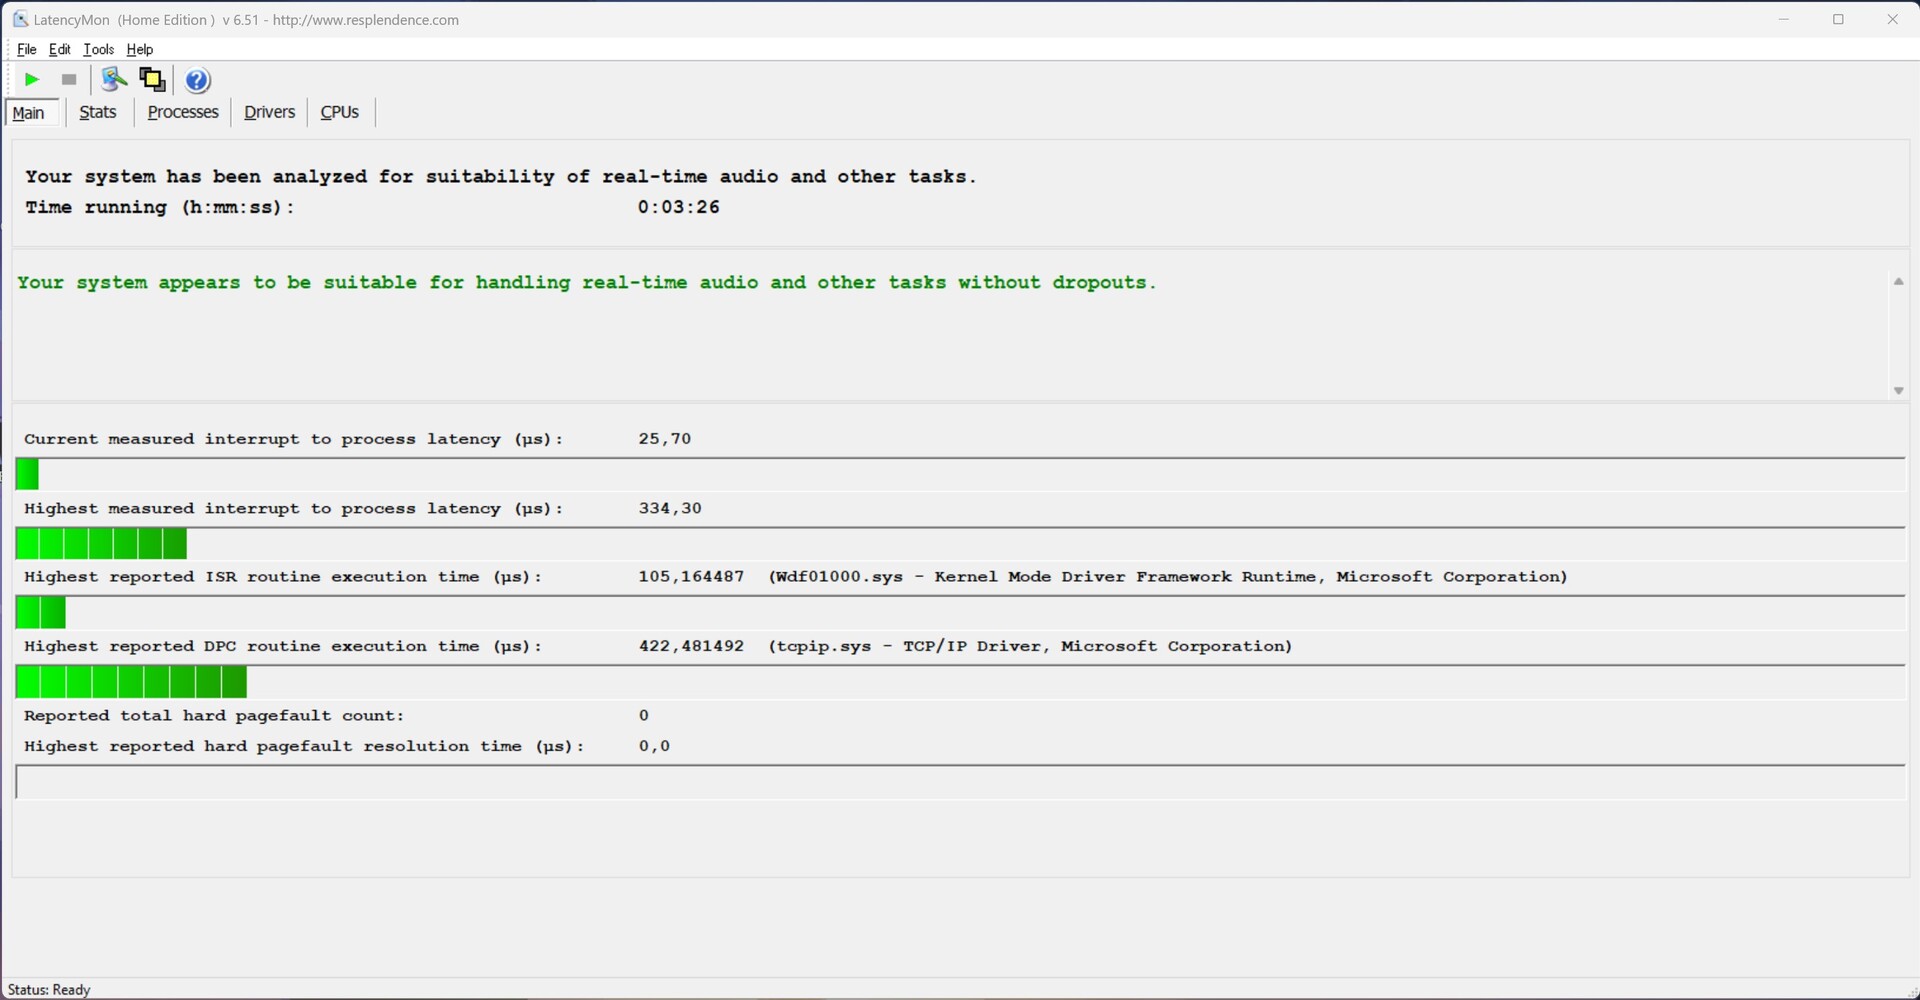
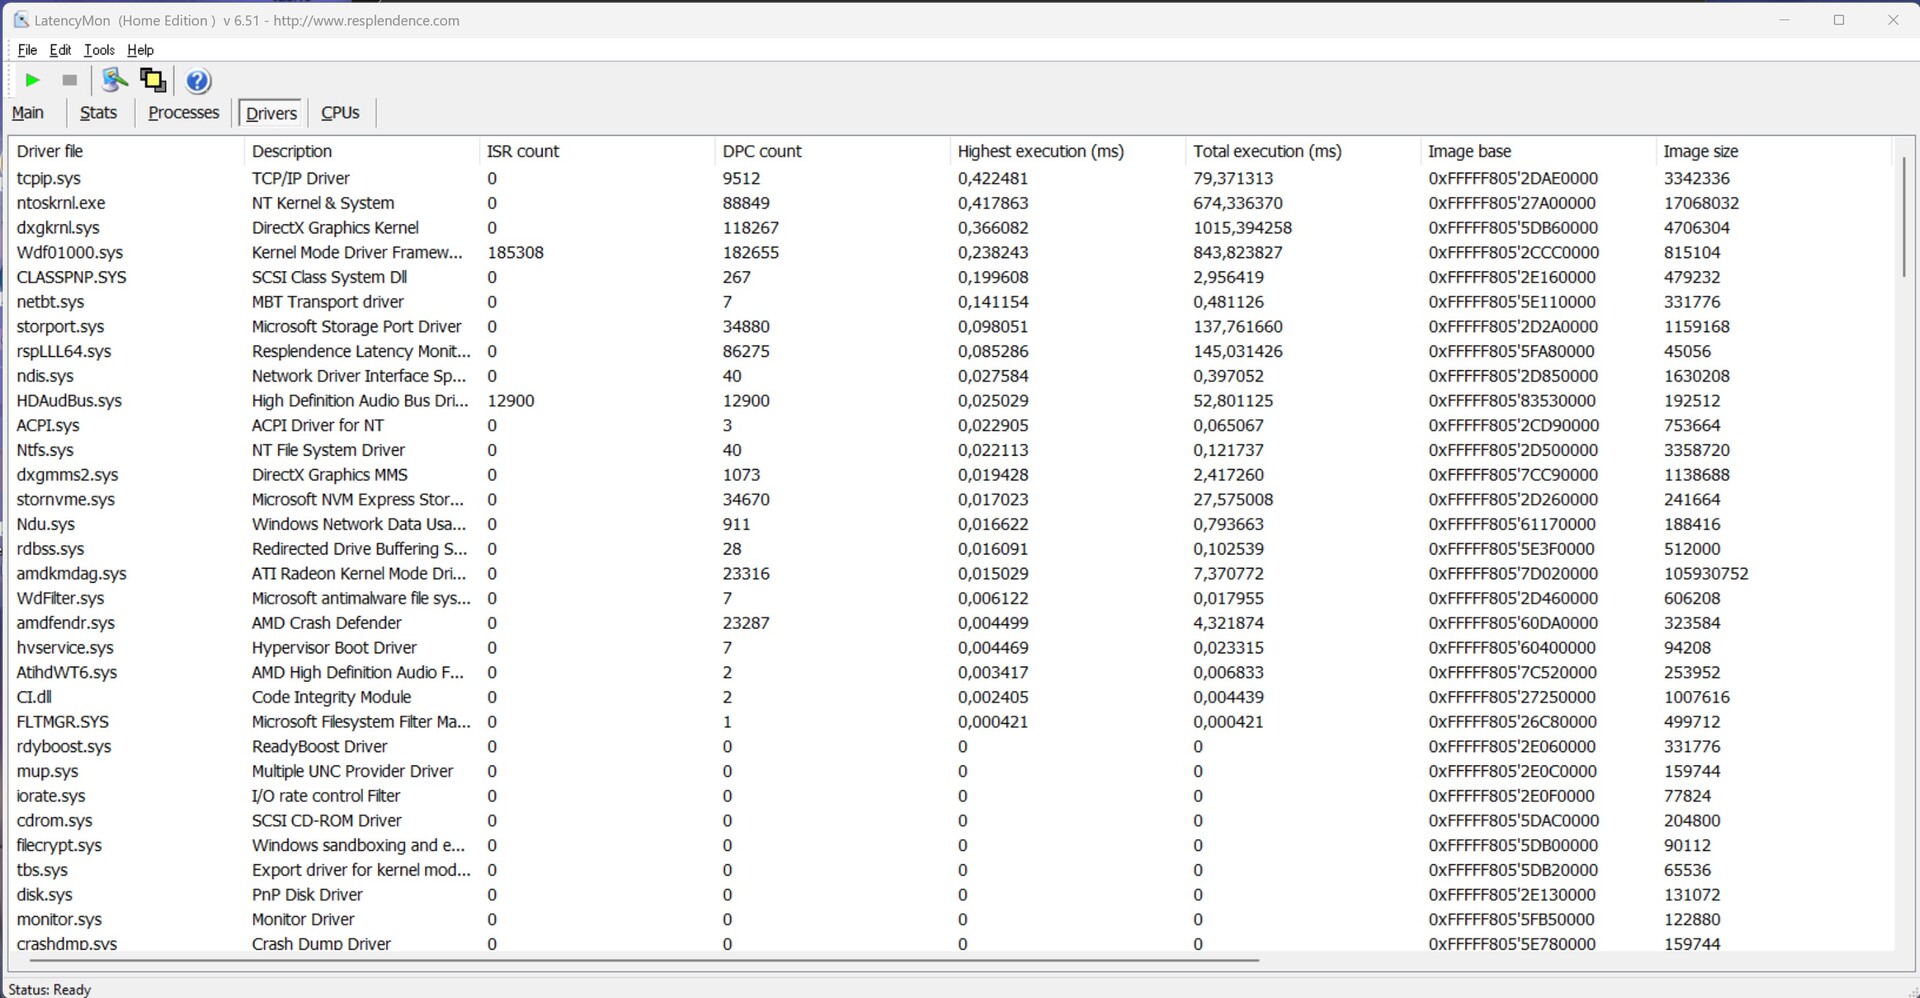
DPC-Latenzen
Bei den festgestellten Latenzen verzeichnen wir bei unsererm Testsystem auf Basis des Minisforum BD770i sehr geringe Latenzen. Egal, ob einfaches Surfen im Internet, oder die Wiedergabe des 4K-Testvideos als auch der Prime95 Stresstest können nicht für hohe Latenzen sorgen. Damit ist das Minisforum-BD770i-Mainboard prädestiniert, um kompakte und leise Streaming-Systeme für das Wohnzimmer auf die Beine zu stellen.
| DPC Latencies / LatencyMon - interrupt to process latency (max), Web, Youtube, Prime95 | |
| Minisforum EliteMini UM780 XTX | |
| Minisforum Venus Series UM790 Pro | |
| Minisforum BD770i | |
* ... kleinere Werte sind besser
Massenspeicher
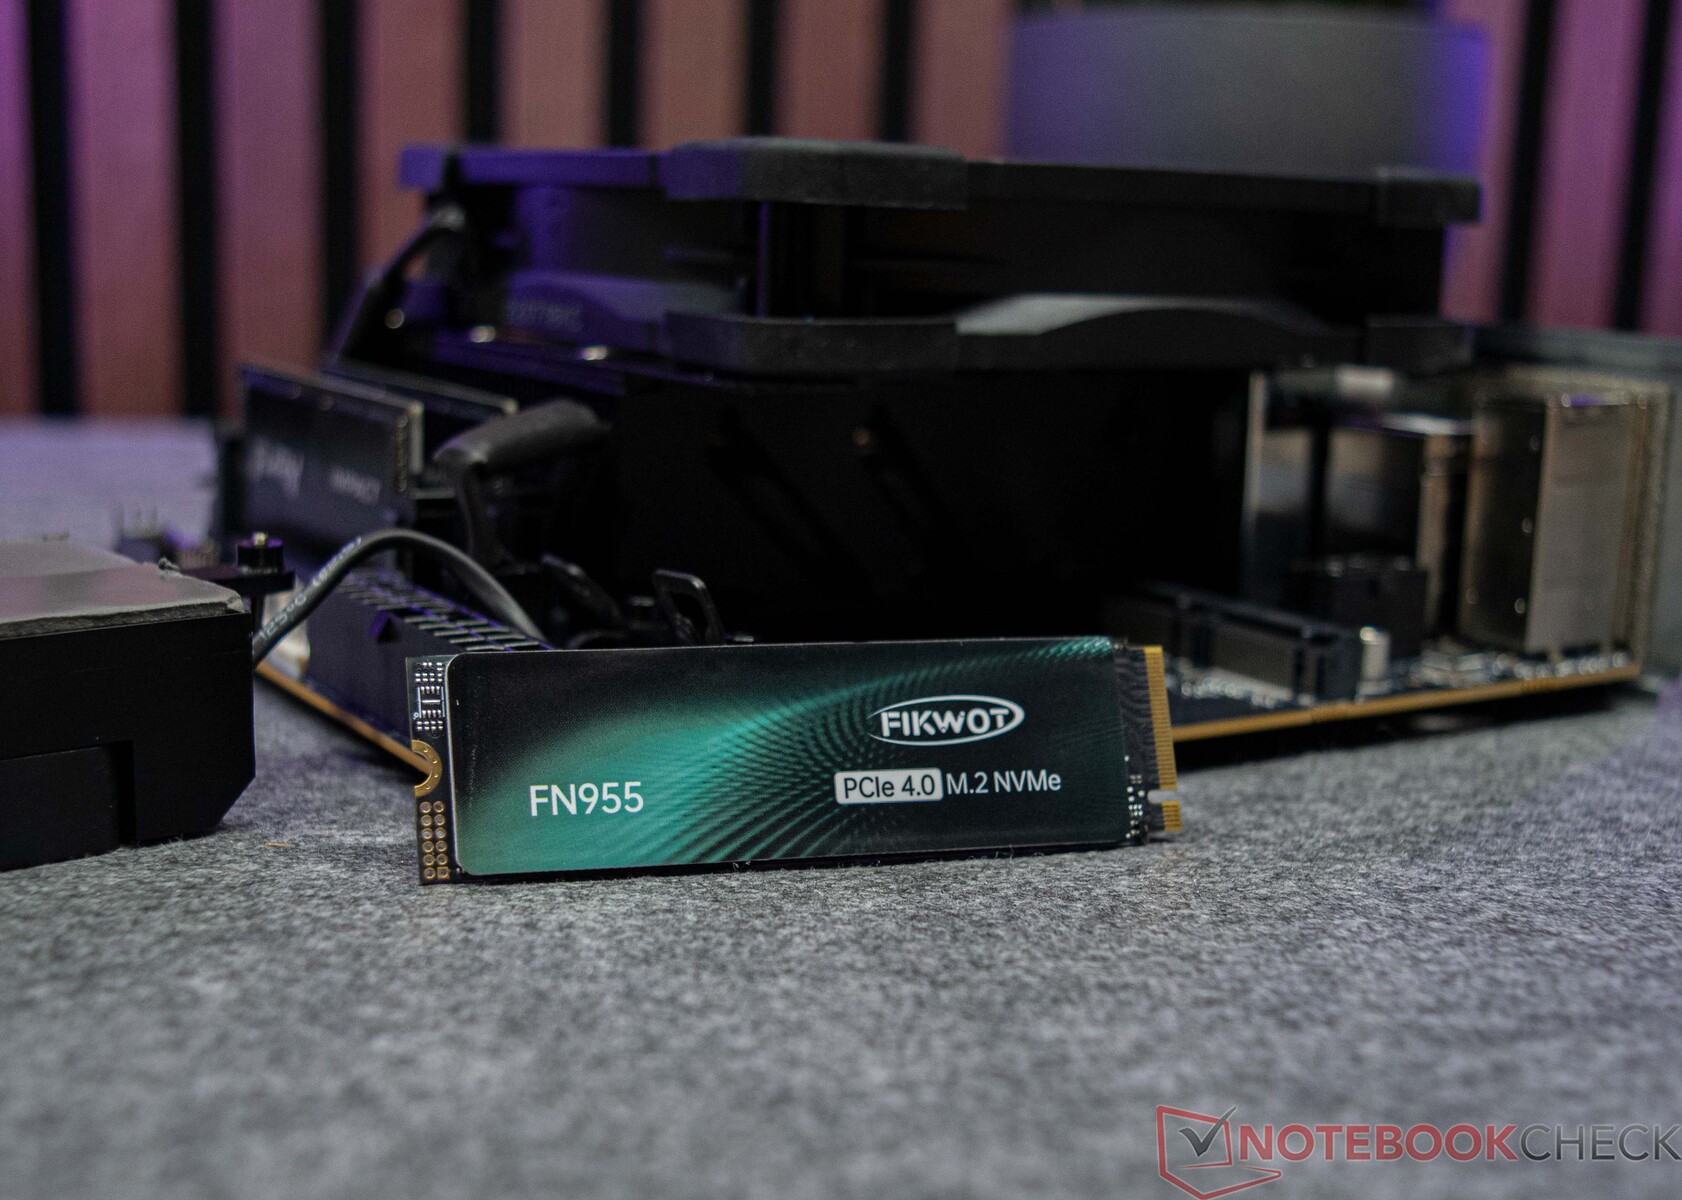
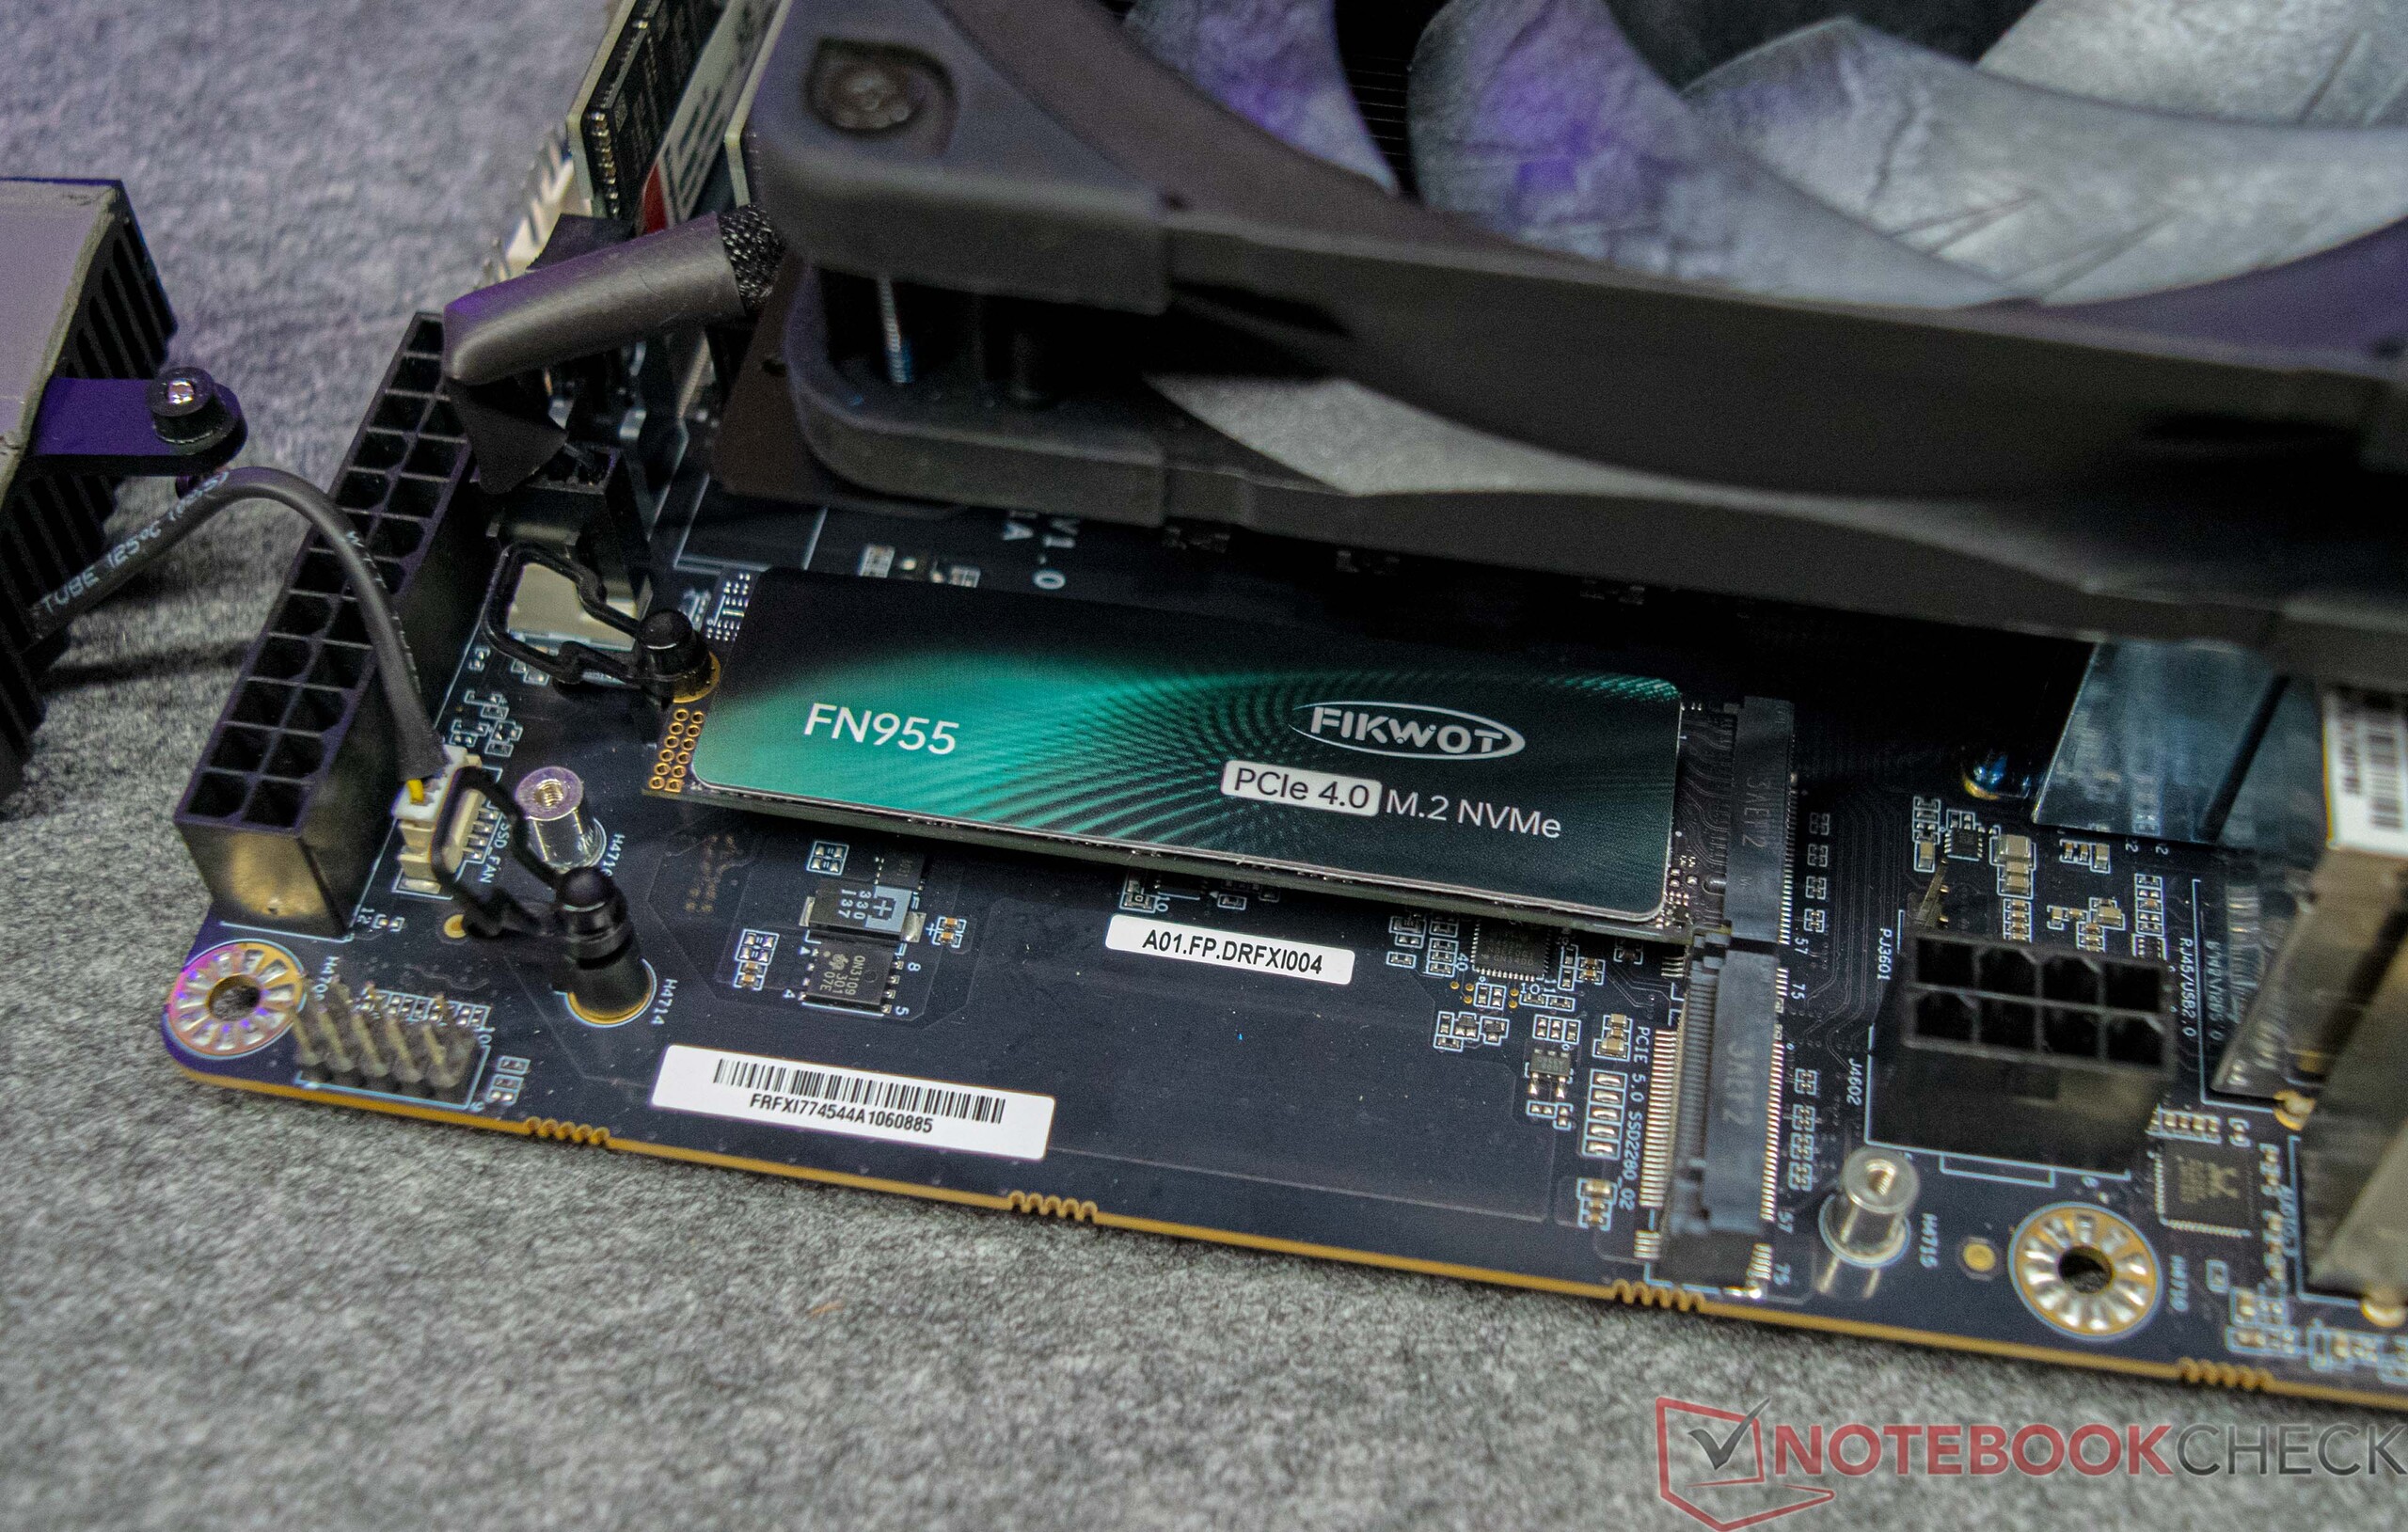
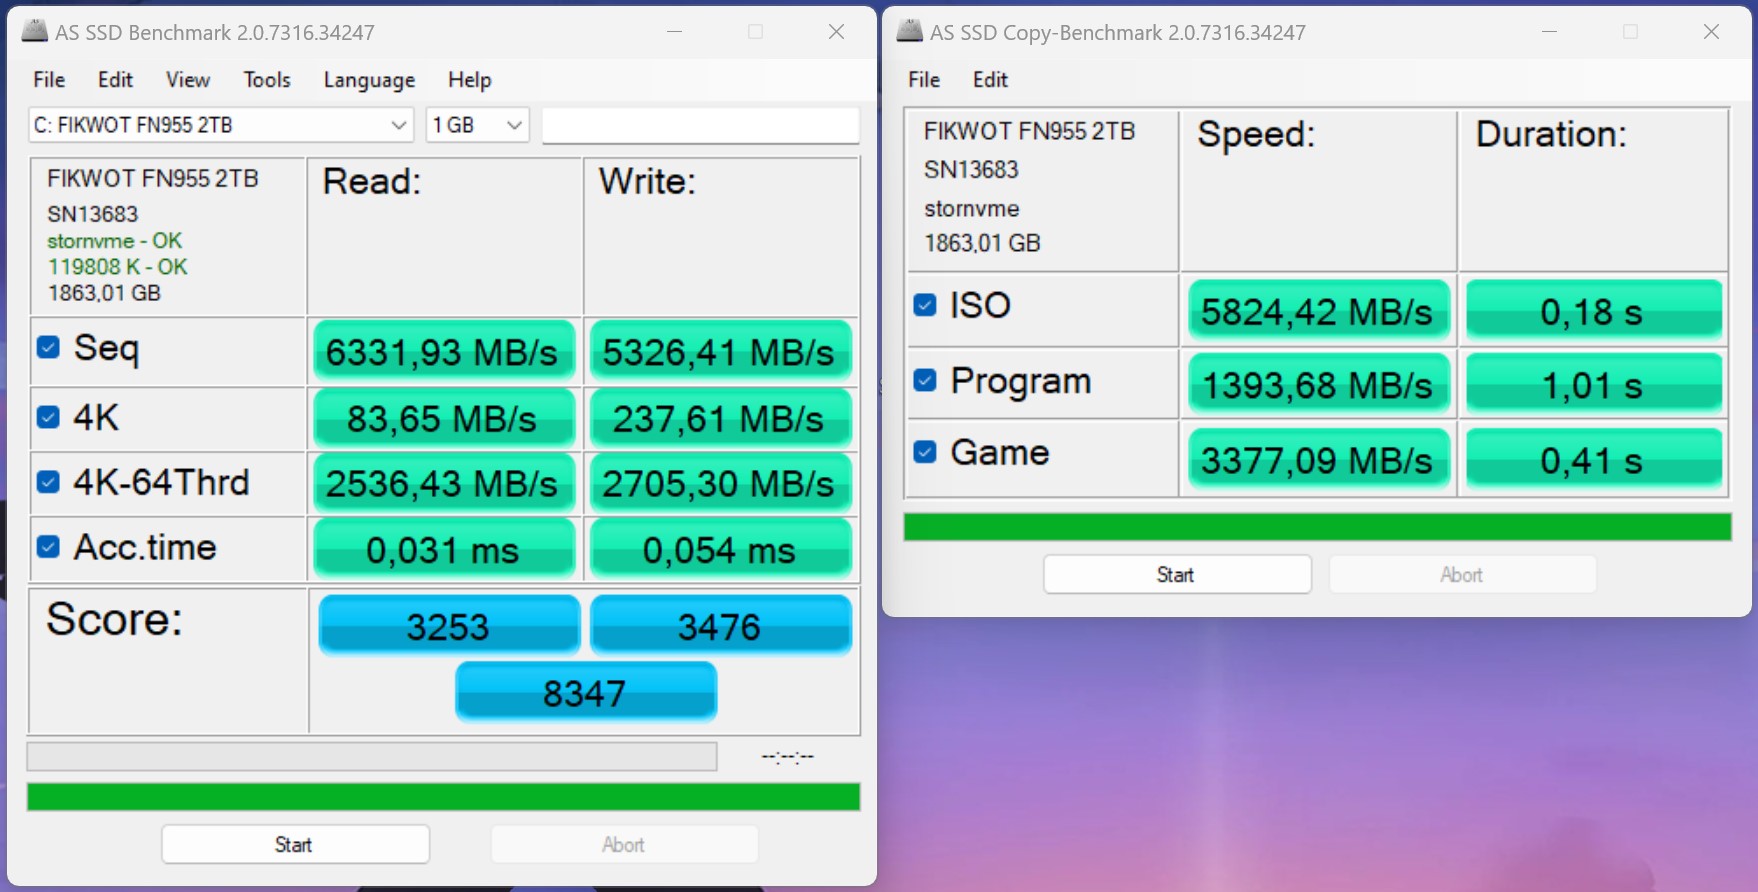
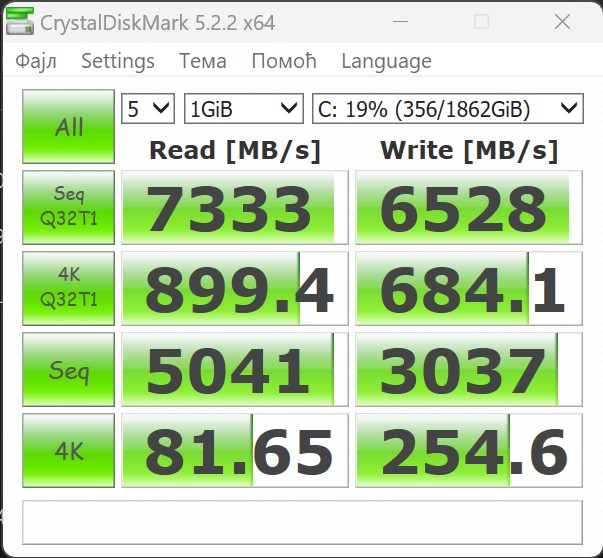
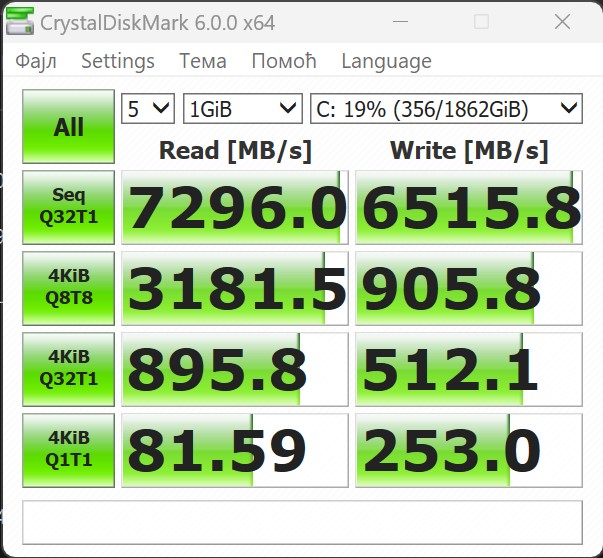
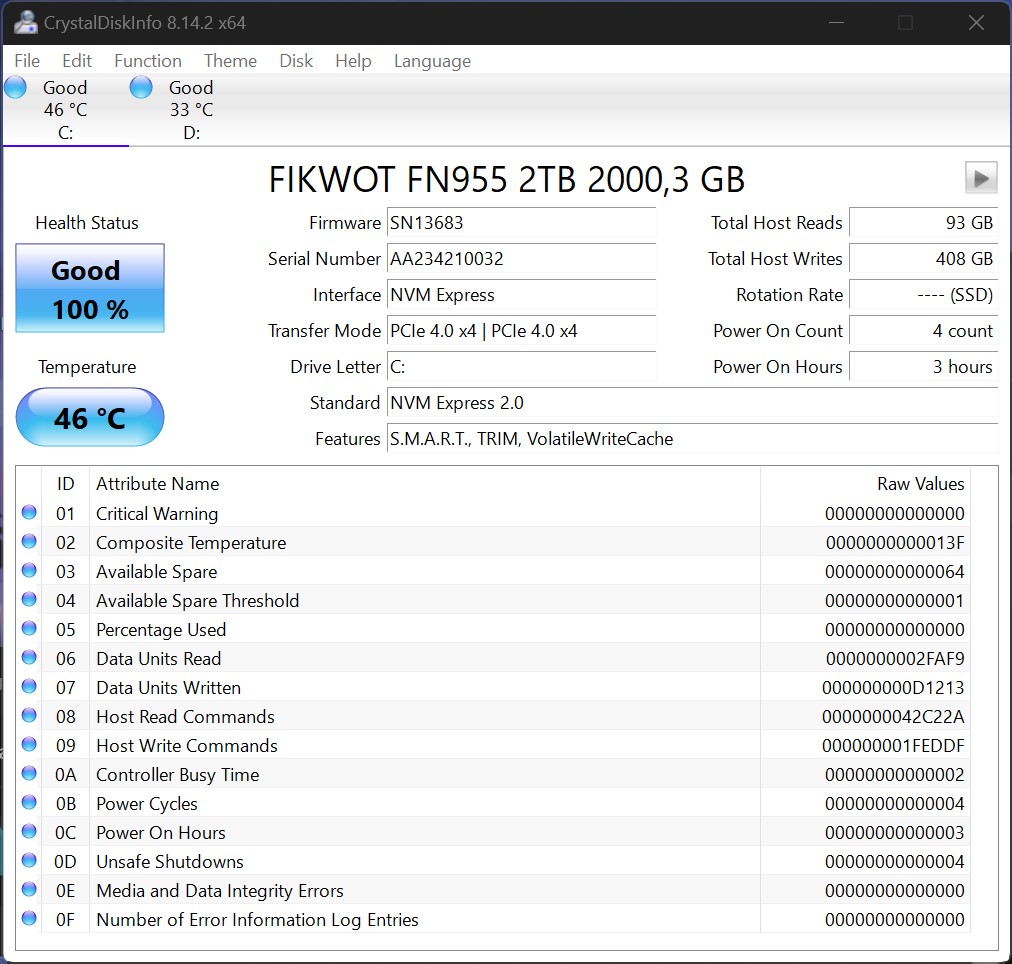
Wie schon erwähnt, liefert Minisforum das BD770i-Mainboard ohne Massenspeicher aus. Für den Test haben wir auf eine relativ preiswerte 2-TB-SSD des Herstellers Fikwot zurückgegriffen. Das Modell nutzt die M.2-Schnittstelle und ist über PCIe 4.0 x4 angebunden. Daraus resultieren auch die hervorragenden Transferraten. Insgesamt lässt sich das Mainboard mit zwei Massenspeichern bestücken. Dabei kann man sogar auf den neuesten PCI-5.0-Standard setzen. Zudem werden die SSDs mit einer aktiven Kühlung versehen, welche vorrangig bei PCIe-5.0-SSDs von Vorteil ist. Unsere SSD hat zu keiner Zeit thermische Probleme unter Last, was im Test zu keinen Leistungseinbrüchen führt.
Für weitere Vergleiche und Benchmarks verweisen wir auf unsere Vergleichstabelle.


Dauerleistung Lesen: DiskSpd Read Loop, Queue Depth 8
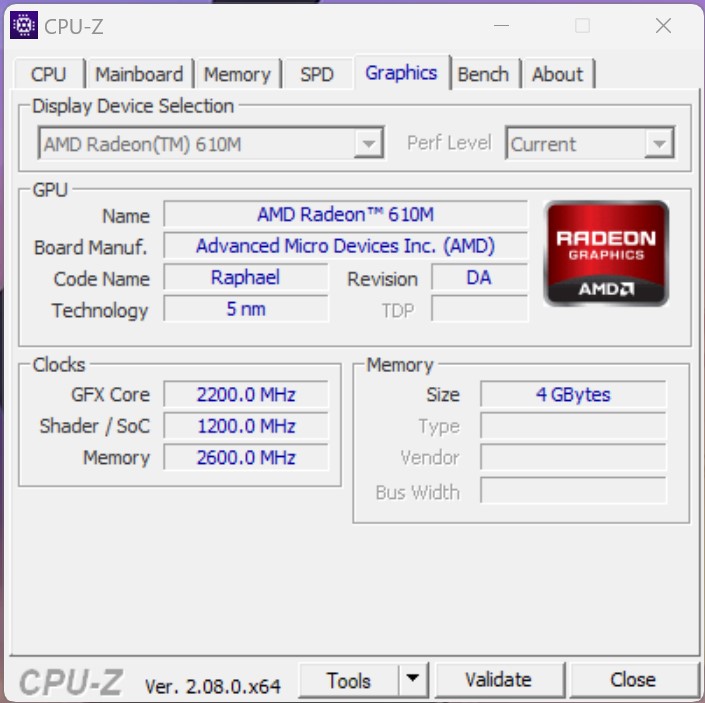
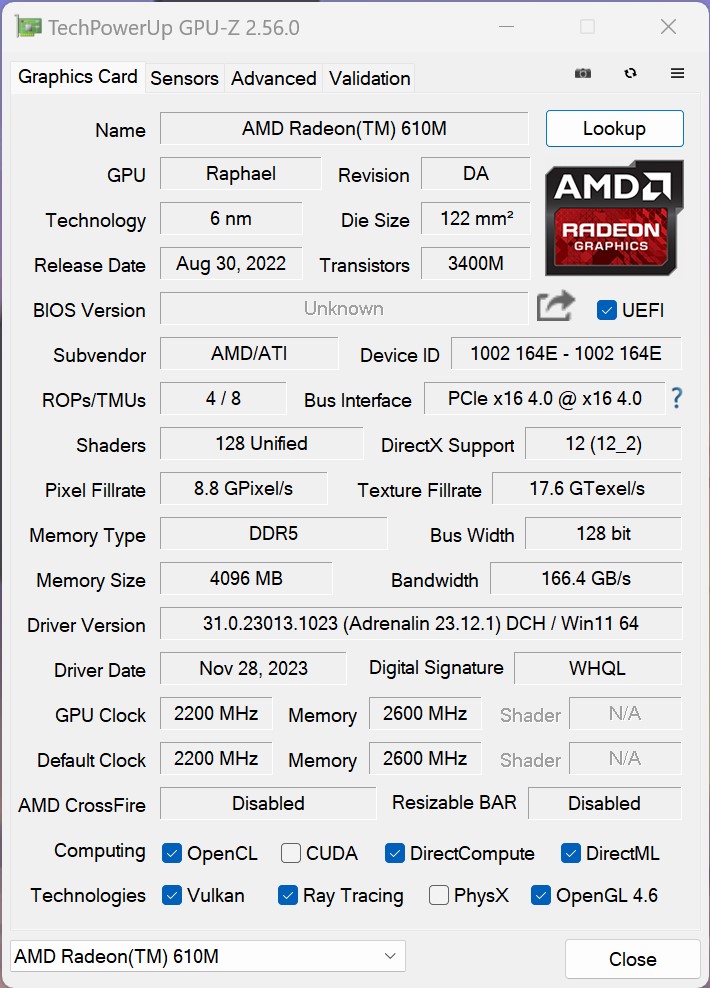
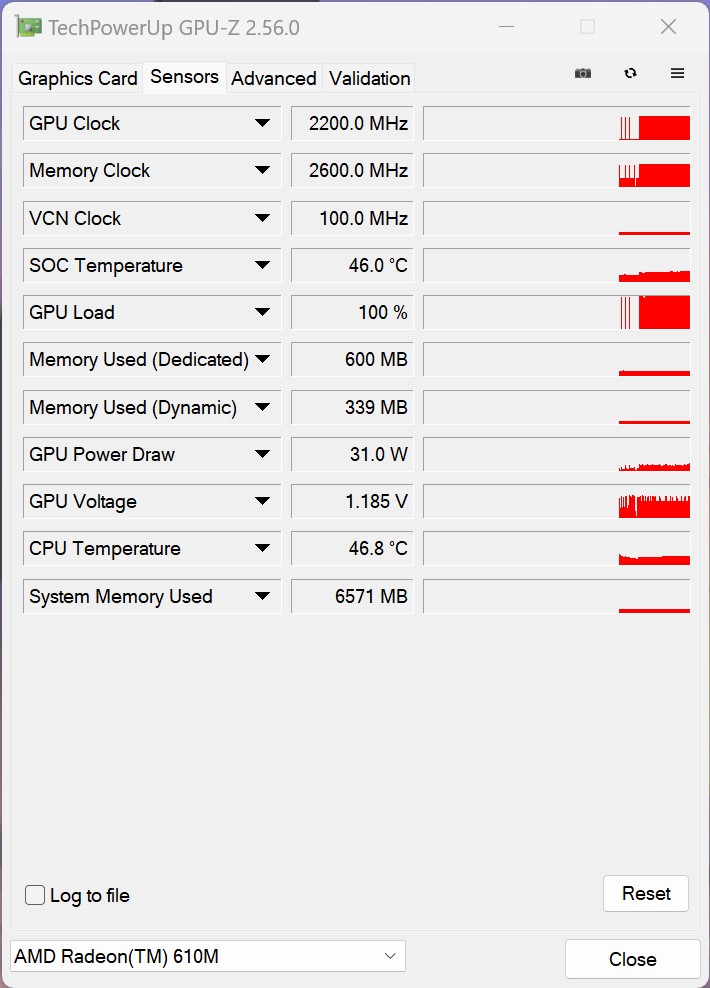
Grafikkarte - AMD Radeon 610M als iGPU
Der AMD Ryzen 7 7745HX bringt als iGPU eine AMD Radeon 610M mit. Diese basiert jedoch noch auf der RDNA2-Architektur und bietet nur 2 CUs, womit in Summe lediglich 128 Shader-Einheiten die 3D-Berechnungen übernehmen. Dementsprechend gering ist auch die hier gezeigte Leistung der AMD Radeon 610M. In unsererm Durchschnittsvergleich ist die iGPU des Minisforum BD770i trotzdem noch deutlich leistungsstärker als in einem herkömmlichen Laptop. Mehr als die einfache Bildausgabe sollte man der schwachbrüstigen Grafiklösung aber nicht zumuten.
Weitere Vergleiche und Benchmarks entnehmen Sie bitte unserer GPU-Vergleichstabelle.
| Performance Rating - Percent | |
| Minisforum EliteMini UM780 XTX | |
| Minisforum Venus Series UM790 Pro | |
| Minisforum Mars Series MC560 | |
| NiPoGi AD08 | |
| Acemagic AD15 | |
| Minisforum BD770i | |
| Durchschnittliche AMD Radeon 610M | |
| Performance Rating - Percent | |
| NiPoGi AD08 | |
| Minisforum EliteMini UM780 XTX | |
| Minisforum Venus Series UM790 Pro | |
| Durchschnittliche AMD Radeon 610M | |
| Acemagic AD15 | |
| Minisforum Mars Series MC560 | |
| Minisforum BD770i | |
| Unigine Valley 1.0 | |
| 1920x1080 Extreme HD DirectX AA:x8 | |
| Minisforum EliteMini UM780 XTX | |
| Minisforum Venus Series UM790 Pro | |
| Minisforum Mars Series MC560 | |
| NiPoGi AD08 | |
| Minisforum BD770i | |
| Durchschnittliche AMD Radeon 610M (9.8 - 10, n=4) | |
| Acemagic AD15 | |
| 1920x1080 Extreme HD Preset OpenGL AA:x8 | |
| Minisforum EliteMini UM780 XTX | |
| Minisforum Venus Series UM790 Pro | |
| NiPoGi AD08 | |
| Minisforum Mars Series MC560 | |
| Acemagic AD15 | |
| Minisforum BD770i | |
| Durchschnittliche AMD Radeon 610M (9.1 - 9.6, n=4) | |
| Affinity Photo 2 - Combined (Single / Multi GPU) | |
| NiPoGi AD08 | |
| Durchschnittliche AMD Radeon 610M (889 - 5750, n=4) | |
| Acemagic AD15 | |
| Minisforum EliteMini UM780 XTX | |
| Minisforum Mars Series MC560 | |
| Minisforum Venus Series UM790 Pro | |
| Minisforum BD770i | |
| 3DMark 06 Standard Score | 20555 Punkte | |
| 3DMark Vantage P Result | 12092 Punkte | |
| 3DMark 11 Performance | 3873 Punkte | |
| 3DMark Ice Storm Standard Score | 41556 Punkte | |
| 3DMark Cloud Gate Standard Score | 14629 Punkte | |
| 3DMark Fire Strike Score | 2156 Punkte | |
| 3DMark Fire Strike Extreme Score | 530 Punkte | |
| 3DMark Time Spy Score | 740 Punkte | |
Hilfe | ||
Gaming Performance - AMD Radeon 610M
Wie wir schon bei den synthetischen Benchmarks gesehen haben, ist die Leistung der AMD Radeon 610M nur bedingt für 3D-Anwendungen zu empfehlen. Das zeigt sich auch bei den Spieletests. Hier kann die iGPU nur bei geringsten Details und einer Auflösung von nur 1.280 x 720 Pixeln adäquate Frame-Raten erzeugen. Spürbar mehr Leistung bieten die beiden Mini-PCs mit AMD Radeon 780m iGPU. Aber auch hier sind schnell die Grenzen erreicht, wenn moderne Spiele mit dem System gespielt werden sollen. Über die PCI-Express-Schnittstelle lassen sich alle aktuellen Grafikkarten problemlos betreiben.
Für einen Überblick hinsichtlich der Leistung der iGPU im Vergleich zu anderen Grafikkarten verweisen wir hier auf unsere GPU-Spieleliste.
| The Witcher 3 | |
| 1024x768 Low Graphics & Postprocessing (nach Ergebnis sortieren) | |
| Minisforum EliteMini UM780 XTX | |
| Minisforum Venus Series UM790 Pro | |
| Minisforum BD770i | |
| NiPoGi AD08 | |
| Acemagic AD15 | |
| Minisforum Mars Series MC560 | |
| 1920x1080 High Graphics & Postprocessing (Nvidia HairWorks Off) (nach Ergebnis sortieren) | |
| Minisforum EliteMini UM780 XTX | |
| Minisforum Venus Series UM790 Pro | |
| Minisforum BD770i | |
| NiPoGi AD08 | |
| Acemagic AD15 | |
| Minisforum Mars Series MC560 | |
| Borderlands 3 | |
| 1280x720 Very Low Overall Quality (DX11) (nach Ergebnis sortieren) | |
| Minisforum EliteMini UM780 XTX | |
| Minisforum Venus Series UM790 Pro | |
| Minisforum BD770i | |
| NiPoGi AD08 | |
| Acemagic AD15 | |
| Minisforum Mars Series MC560 | |
| 1920x1080 High Overall Quality (DX11) (nach Ergebnis sortieren) | |
| Minisforum EliteMini UM780 XTX | |
| Minisforum Venus Series UM790 Pro | |
| Minisforum BD770i | |
| NiPoGi AD08 | |
| Acemagic AD15 | |
| Minisforum Mars Series MC560 | |
| GTA V | |
| 1024x768 Lowest Settings possible (nach Ergebnis sortieren) | |
| Minisforum EliteMini UM780 XTX | |
| Minisforum Venus Series UM790 Pro | |
| Minisforum BD770i | |
| NiPoGi AD08 | |
| Acemagic AD15 | |
| Minisforum Mars Series MC560 | |
| 1920x1080 High/On (Advanced Graphics Off) AA:2xMSAA + FX AF:8x (nach Ergebnis sortieren) | |
| Minisforum EliteMini UM780 XTX | |
| Minisforum Venus Series UM790 Pro | |
| Minisforum BD770i | |
| NiPoGi AD08 | |
| Acemagic AD15 | |
| Minisforum Mars Series MC560 | |
| Tiny Tina's Wonderlands | |
| 1280x720 Lowest Preset (DX12) (nach Ergebnis sortieren) | |
| Minisforum EliteMini UM780 XTX | |
| Minisforum Venus Series UM790 Pro | |
| Minisforum BD770i | |
| Acemagic AD15 | |
| Minisforum Mars Series MC560 | |
| 1920x1080 High Preset (DX12) (nach Ergebnis sortieren) | |
| Minisforum EliteMini UM780 XTX | |
| Minisforum Venus Series UM790 Pro | |
| Minisforum BD770i | |
| Acemagic AD15 | |
| Minisforum Mars Series MC560 | |
| Metro Exodus | |
| 1280x720 Low Quality AF:4x (nach Ergebnis sortieren) | |
| Minisforum EliteMini UM780 XTX | |
| Minisforum Venus Series UM790 Pro | |
| Minisforum BD770i | |
| NiPoGi AD08 | |
| 1920x1080 High Quality AF:16x (nach Ergebnis sortieren) | |
| Minisforum EliteMini UM780 XTX | |
| Minisforum Venus Series UM790 Pro | |
| Minisforum BD770i | |
| NiPoGi AD08 | |
| Shadow of the Tomb Raider | |
| 1280x720 Lowest Preset (nach Ergebnis sortieren) | |
| Minisforum EliteMini UM780 XTX | |
| Minisforum Venus Series UM790 Pro | |
| Minisforum BD770i | |
| NiPoGi AD08 | |
| Acemagic AD15 | |
| 1920x1080 High Preset AA:SM (nach Ergebnis sortieren) | |
| Minisforum EliteMini UM780 XTX | |
| Minisforum Venus Series UM790 Pro | |
| Minisforum BD770i | |
| NiPoGi AD08 | |
| Acemagic AD15 | |
| min. | mittel | hoch | max. | |
|---|---|---|---|---|
| GTA V (2015) | 134.5 | 101.9 | 23.1 | 10.5 |
| The Witcher 3 (2015) | 44 | 26.2 | 13.5 | 8.49 |
| Final Fantasy XV Benchmark (2018) | 26.8 | 12.3 | 8.79 | |
| X-Plane 11.11 (2018) | 44.7 | 26.2 | 22.9 | |
| Far Cry 5 (2018) | 34 | 15 | 14 | 13 |
| Strange Brigade (2018) | 67.7 | 21.4 | 17 | |
| Shadow of the Tomb Raider (2018) | 40 | 14 | 12.6 | 10.5 |
| Far Cry New Dawn (2019) | 35 | 17 | 16 | 14 |
| Metro Exodus (2019) | 28.4 | 11.8 | 8.4 | 6.95 |
| Borderlands 3 (2019) | 40.3 | 14.9 | 9.04 | 6.48 |
| Tiny Tina's Wonderlands (2022) | 18.1 | 14.5 | 9.24 | 6.92 |
Minisforum BD770i mit Nvidia GeForce RTX 4090
Wer das Minisforum-BD770i-Mainboard als Grundlage für ein Gaming-System verwenden möchte, kann hier bedenkenlos zugreifen. Der AMD Ryzen 7 7745HX hat genügend Leistungsreserven, um mit aktuellen Systemen mitzuhalten. Beim Blick auf die synthetischen Benchmarks kann sich unser Testsystem sogar den dritten Platz sichern. Aufgrund der Größe der Grafikkarte mussten wir für diese Tests das Minisforum BD770i im offenen Aufbau verwenden. Die Palit GeForce RTX 4090 Gamerock OC ist für das Phanteks-Enthoo-Evolv-Shift-XT-Gehäuse schlichtweg zu groß.
Beim Blick auf die Spiele-Benchmarks müssen wir zunächst unterscheiden: Um die reine CPU-Leistung zu ermitteln, ist es zunächst wichtig, immer im CPU-Limit zu bleiben. Hier liegt der AMD Ryzen 7 7745HX auf Augenhöhe mit einem Intel Core i7-13700. Selbst der Intel Core i7-13700K kann sich in diesem Szenario nicht absetzen. An der Platzierung unseres Testsamples ändert sich bei höherer Detailstufe und maximalen Details im Durchschnitt nichts. Weiterhin duelliert sich das Minisforum-BD770i-Mainboard mit dem Intel Core i7-13700. Wenn man sich jedoch die einzelnen Tests separat anschaut, kann der AMD Ryzen 7 7745HX zusammen mit der Palit GeForce RTX 4090 Gamerock OC stellenweise mit den Topmodellen mithalten. In dieser Kombination lassen sich alle aktuellen Spiele in 2.160p flüssig darstellen, ohne auf Details verzichten zu müssen.
Alle hier im Vergleich aufgelisteten Systeme wurden mit derselben Grafikkarte getestet. Als Grafikkarte diente eine Palit GeForce RTX 4090 Gamerock OC.
Wichtiger Hinweis in Kombination mit einer Nvidia GeForce RTX 4090:
Unser Testsample des Minisforum BD770i wurde nicht mit dem aktuellsten BIOS ausgestattet. Das hatte zur Folge, dass die Grafikkarte nur mit PCIe 4.0 x1 angebunden war. Erst mit der Version 1.05, welche der Hersteller auf der Support-Seite anbietet, kann die Grafikkarte mit der vollen Bandbreite arbeiten. Der BIOS-Update-Prozess kann dabei direkt aus Windows heraus gestartet werden.
| Performance Rating - Percent | |
| NVIDIA GeForce RTX 4090, Intel Core i9-14900K | |
| NVIDIA GeForce RTX 4090, Intel Core i5-14600K | |
| NVIDIA GeForce RTX 4090, AMD Ryzen 7 7745HX | |
| NVIDIA GeForce RTX 4090, AMD Ryzen 9 7950X | |
| NVIDIA GeForce RTX 4090, AMD Ryzen 7 7800X3D | |
| NVIDIA GeForce RTX 4090, Intel Core i7-13700 | |
| NVIDIA GeForce RTX 4090, Intel Core i7-12700 | |
| NVIDIA GeForce RTX 4090, Intel Core i5-13400 | |
| NVIDIA GeForce RTX 4090, Intel Core i5-12400F -6! | |
| 3DMark 11 - 1280x720 Performance GPU | |
| NVIDIA GeForce RTX 4090, AMD Ryzen 7 7745HX | |
| NVIDIA GeForce RTX 4090, AMD Ryzen 7 7800X3D | |
| NVIDIA GeForce RTX 4090, Intel Core i5-14600K | |
| NVIDIA GeForce RTX 4090, AMD Ryzen 9 7950X | |
| NVIDIA GeForce RTX 4090, Intel Core i7-13700 | |
| NVIDIA GeForce RTX 4090, Intel Core i7-12700 | |
| NVIDIA GeForce RTX 4090, Intel Core i5-13400 | |
| NVIDIA GeForce RTX 4090, Intel Core i9-14900K | |
| NVIDIA GeForce RTX 4090, Intel Core i5-12400F | |
| 3DMark | |
| 2560x1440 Time Spy Graphics | |
| NVIDIA GeForce RTX 4090, AMD Ryzen 7 7745HX | |
| NVIDIA GeForce RTX 4090, Intel Core i5-14600K | |
| NVIDIA GeForce RTX 4090, Intel Core i9-14900K | |
| NVIDIA GeForce RTX 4090, AMD Ryzen 7 7800X3D | |
| NVIDIA GeForce RTX 4090, Intel Core i7-13700 | |
| NVIDIA GeForce RTX 4090, AMD Ryzen 9 7950X | |
| NVIDIA GeForce RTX 4090, Intel Core i7-12700 | |
| NVIDIA GeForce RTX 4090, Intel Core i5-13400 | |
| NVIDIA GeForce RTX 4090, Intel Core i5-12400F | |
| 1920x1080 Fire Strike Graphics | |
| NVIDIA GeForce RTX 4090, AMD Ryzen 7 7745HX | |
| NVIDIA GeForce RTX 4090, Intel Core i5-14600K | |
| NVIDIA GeForce RTX 4090, Intel Core i5-12400F | |
| NVIDIA GeForce RTX 4090, Intel Core i7-12700 | |
| NVIDIA GeForce RTX 4090, Intel Core i7-13700 | |
| NVIDIA GeForce RTX 4090, Intel Core i5-13400 | |
| NVIDIA GeForce RTX 4090, AMD Ryzen 7 7800X3D | |
| NVIDIA GeForce RTX 4090, AMD Ryzen 9 7950X | |
| NVIDIA GeForce RTX 4090, Intel Core i9-14900K | |
| 3840x2160 Fire Strike Ultra Graphics | |
| NVIDIA GeForce RTX 4090, AMD Ryzen 7 7800X3D | |
| NVIDIA GeForce RTX 4090, AMD Ryzen 7 7745HX | |
| NVIDIA GeForce RTX 4090, Intel Core i5-14600K | |
| NVIDIA GeForce RTX 4090, Intel Core i7-13700 | |
| NVIDIA GeForce RTX 4090, Intel Core i5-13400 | |
| NVIDIA GeForce RTX 4090, AMD Ryzen 9 7950X | |
| NVIDIA GeForce RTX 4090, Intel Core i9-14900K | |
| NVIDIA GeForce RTX 4090, Intel Core i7-12700 | |
| NVIDIA GeForce RTX 4090, Intel Core i5-12400F | |
| Unigine Superposition | |
| 1280x720 720p Low | |
| NVIDIA GeForce RTX 4090, Intel Core i9-14900K | |
| NVIDIA GeForce RTX 4090, AMD Ryzen 7 7800X3D | |
| NVIDIA GeForce RTX 4090, AMD Ryzen 9 7950X | |
| NVIDIA GeForce RTX 4090, AMD Ryzen 7 7745HX | |
| NVIDIA GeForce RTX 4090, Intel Core i7-13700 | |
| NVIDIA GeForce RTX 4090, Intel Core i5-14600K | |
| NVIDIA GeForce RTX 4090, Intel Core i7-12700 | |
| NVIDIA GeForce RTX 4090, Intel Core i5-13400 | |
| NVIDIA GeForce RTX 4090, Intel Core i5-12400F | |
| 1920x1080 1080p High | |
| NVIDIA GeForce RTX 4090, Intel Core i9-14900K | |
| NVIDIA GeForce RTX 4090, AMD Ryzen 7 7800X3D | |
| NVIDIA GeForce RTX 4090, AMD Ryzen 9 7950X | |
| NVIDIA GeForce RTX 4090, AMD Ryzen 7 7745HX | |
| NVIDIA GeForce RTX 4090, Intel Core i7-13700 | |
| NVIDIA GeForce RTX 4090, Intel Core i5-14600K | |
| NVIDIA GeForce RTX 4090, Intel Core i7-12700 | |
| NVIDIA GeForce RTX 4090, Intel Core i5-13400 | |
| NVIDIA GeForce RTX 4090, Intel Core i5-12400F | |
| 1920x1080 1080p Extreme | |
| NVIDIA GeForce RTX 4090, AMD Ryzen 7 7800X3D | |
| NVIDIA GeForce RTX 4090, AMD Ryzen 7 7745HX | |
| NVIDIA GeForce RTX 4090, Intel Core i5-14600K | |
| NVIDIA GeForce RTX 4090, Intel Core i9-14900K | |
| NVIDIA GeForce RTX 4090, AMD Ryzen 9 7950X | |
| NVIDIA GeForce RTX 4090, Intel Core i7-13700 | |
| NVIDIA GeForce RTX 4090, Intel Core i5-13400 | |
| NVIDIA GeForce RTX 4090, Intel Core i7-12700 | |
| NVIDIA GeForce RTX 4090, Intel Core i5-12400F | |
| 3840x2160 4k Optimized | |
| NVIDIA GeForce RTX 4090, AMD Ryzen 9 7950X | |
| NVIDIA GeForce RTX 4090, Intel Core i7-13700 | |
| NVIDIA GeForce RTX 4090, Intel Core i9-14900K | |
| NVIDIA GeForce RTX 4090, Intel Core i5-14600K | |
| NVIDIA GeForce RTX 4090, AMD Ryzen 7 7800X3D | |
| NVIDIA GeForce RTX 4090, AMD Ryzen 7 7745HX | |
| NVIDIA GeForce RTX 4090, Intel Core i7-12700 | |
| NVIDIA GeForce RTX 4090, Intel Core i5-13400 | |
| NVIDIA GeForce RTX 4090, Intel Core i5-12400F | |
| 7680x4320 8k Optimized | |
| NVIDIA GeForce RTX 4090, AMD Ryzen 9 7950X | |
| NVIDIA GeForce RTX 4090, Intel Core i7-13700 | |
| NVIDIA GeForce RTX 4090, Intel Core i7-12700 | |
| NVIDIA GeForce RTX 4090, Intel Core i5-13400 | |
| NVIDIA GeForce RTX 4090, Intel Core i5-12400F | |
| NVIDIA GeForce RTX 4090, Intel Core i9-14900K | |
| NVIDIA GeForce RTX 4090, Intel Core i5-14600K | |
| NVIDIA GeForce RTX 4090, AMD Ryzen 7 7800X3D | |
| NVIDIA GeForce RTX 4090, AMD Ryzen 7 7745HX | |
| Unigine Valley 1.0 | |
| 1920x1080 Extreme HD DirectX AA:x8 | |
| NVIDIA GeForce RTX 4090, Intel Core i9-14900K | |
| NVIDIA GeForce RTX 4090, Intel Core i5-14600K | |
| NVIDIA GeForce RTX 4090, AMD Ryzen 9 7950X | |
| NVIDIA GeForce RTX 4090, Intel Core i7-13700 | |
| NVIDIA GeForce RTX 4090, AMD Ryzen 7 7745HX | |
| NVIDIA GeForce RTX 4090, AMD Ryzen 7 7800X3D | |
| NVIDIA GeForce RTX 4090, Intel Core i7-12700 | |
| NVIDIA GeForce RTX 4090, Intel Core i5-13400 | |
| NVIDIA GeForce RTX 4090, Intel Core i5-12400F | |
| 1920x1080 Extreme HD Preset OpenGL AA:x8 | |
| NVIDIA GeForce RTX 4090, Intel Core i9-14900K | |
| NVIDIA GeForce RTX 4090, Intel Core i5-14600K | |
| NVIDIA GeForce RTX 4090, Intel Core i7-13700 | |
| NVIDIA GeForce RTX 4090, AMD Ryzen 9 7950X | |
| NVIDIA GeForce RTX 4090, AMD Ryzen 7 7745HX | |
| NVIDIA GeForce RTX 4090, AMD Ryzen 7 7800X3D | |
| NVIDIA GeForce RTX 4090, Intel Core i7-12700 | |
| NVIDIA GeForce RTX 4090, Intel Core i5-13400 | |
| NVIDIA GeForce RTX 4090, Intel Core i5-12400F | |
| Unigine Heaven 4.0 | |
| Extreme Preset OpenGL | |
| NVIDIA GeForce RTX 4090, Intel Core i9-14900K | |
| NVIDIA GeForce RTX 4090, AMD Ryzen 7 7745HX | |
| NVIDIA GeForce RTX 4090, Intel Core i5-14600K | |
| NVIDIA GeForce RTX 4090, AMD Ryzen 9 7950X | |
| NVIDIA GeForce RTX 4090, Intel Core i7-13700 | |
| NVIDIA GeForce RTX 4090, AMD Ryzen 7 7800X3D | |
| NVIDIA GeForce RTX 4090, Intel Core i7-12700 | |
| NVIDIA GeForce RTX 4090, Intel Core i5-13400 | |
| NVIDIA GeForce RTX 4090, Intel Core i5-12400F | |
| Extreme Preset DX11 | |
| NVIDIA GeForce RTX 4090, AMD Ryzen 9 7950X | |
| NVIDIA GeForce RTX 4090, Intel Core i9-14900K | |
| NVIDIA GeForce RTX 4090, AMD Ryzen 7 7745HX | |
| NVIDIA GeForce RTX 4090, Intel Core i5-14600K | |
| NVIDIA GeForce RTX 4090, AMD Ryzen 7 7800X3D | |
| NVIDIA GeForce RTX 4090, Intel Core i7-13700 | |
| NVIDIA GeForce RTX 4090, Intel Core i7-12700 | |
| NVIDIA GeForce RTX 4090, Intel Core i5-13400 | |
| NVIDIA GeForce RTX 4090, Intel Core i5-12400F | |
| ComputeMark v2.1 | |
| 1024x600 Normal, Score | |
| NVIDIA GeForce RTX 4090, AMD Ryzen 7 7745HX | |
| NVIDIA GeForce RTX 4090, Intel Core i5-14600K | |
| NVIDIA GeForce RTX 4090, AMD Ryzen 9 7950X | |
| NVIDIA GeForce RTX 4090, Intel Core i9-14900K | |
| NVIDIA GeForce RTX 4090, Intel Core i7-12700 | |
| NVIDIA GeForce RTX 4090, AMD Ryzen 7 7800X3D | |
| NVIDIA GeForce RTX 4090, Intel Core i5-13400 | |
| NVIDIA GeForce RTX 4090, Intel Core i7-13700 | |
| 1024x600 Normal, Fluid 3DTex | |
| NVIDIA GeForce RTX 4090, AMD Ryzen 7 7800X3D | |
| NVIDIA GeForce RTX 4090, Intel Core i5-14600K | |
| NVIDIA GeForce RTX 4090, Intel Core i7-13700 | |
| NVIDIA GeForce RTX 4090, Intel Core i5-13400 | |
| NVIDIA GeForce RTX 4090, Intel Core i7-12700 | |
| NVIDIA GeForce RTX 4090, AMD Ryzen 9 7950X | |
| NVIDIA GeForce RTX 4090, AMD Ryzen 7 7745HX | |
| NVIDIA GeForce RTX 4090, Intel Core i9-14900K | |
| 1024x600 Normal, Fluid 2DTexArr | |
| NVIDIA GeForce RTX 4090, AMD Ryzen 7 7745HX | |
| NVIDIA GeForce RTX 4090, Intel Core i5-14600K | |
| NVIDIA GeForce RTX 4090, Intel Core i9-14900K | |
| NVIDIA GeForce RTX 4090, AMD Ryzen 9 7950X | |
| NVIDIA GeForce RTX 4090, Intel Core i7-12700 | |
| NVIDIA GeForce RTX 4090, Intel Core i7-13700 | |
| NVIDIA GeForce RTX 4090, AMD Ryzen 7 7800X3D | |
| NVIDIA GeForce RTX 4090, Intel Core i5-13400 | |
| 1024x600 Normal, Mandel Vector | |
| NVIDIA GeForce RTX 4090, AMD Ryzen 7 7745HX | |
| NVIDIA GeForce RTX 4090, Intel Core i5-14600K | |
| NVIDIA GeForce RTX 4090, AMD Ryzen 9 7950X | |
| NVIDIA GeForce RTX 4090, Intel Core i9-14900K | |
| NVIDIA GeForce RTX 4090, Intel Core i7-13700 | |
| NVIDIA GeForce RTX 4090, Intel Core i7-12700 | |
| NVIDIA GeForce RTX 4090, AMD Ryzen 7 7800X3D | |
| NVIDIA GeForce RTX 4090, Intel Core i5-13400 | |
| 1024x600 Normal, Mandel Scalar | |
| NVIDIA GeForce RTX 4090, AMD Ryzen 7 7745HX | |
| NVIDIA GeForce RTX 4090, Intel Core i5-14600K | |
| NVIDIA GeForce RTX 4090, Intel Core i9-14900K | |
| NVIDIA GeForce RTX 4090, AMD Ryzen 7 7800X3D | |
| NVIDIA GeForce RTX 4090, AMD Ryzen 9 7950X | |
| NVIDIA GeForce RTX 4090, Intel Core i7-12700 | |
| NVIDIA GeForce RTX 4090, Intel Core i7-13700 | |
| NVIDIA GeForce RTX 4090, Intel Core i5-13400 | |
| 1024x600 Normal, QJuliaRayTrace | |
| NVIDIA GeForce RTX 4090, AMD Ryzen 7 7745HX | |
| NVIDIA GeForce RTX 4090, Intel Core i5-14600K | |
| NVIDIA GeForce RTX 4090, AMD Ryzen 9 7950X | |
| NVIDIA GeForce RTX 4090, Intel Core i9-14900K | |
| NVIDIA GeForce RTX 4090, Intel Core i5-13400 | |
| NVIDIA GeForce RTX 4090, Intel Core i7-12700 | |
| NVIDIA GeForce RTX 4090, Intel Core i7-13700 | |
| NVIDIA GeForce RTX 4090, AMD Ryzen 7 7800X3D | |
| Performance Rating - Percent | |
| AMD Ryzen 7 7800X3D | |
| AMD Ryzen 9 7950X3D | |
| Intel Core i9-14900K | |
| AMD Ryzen 9 7950X | |
| AMD Ryzen 5 7600X | |
| Intel Core i9-13900K | |
| Intel Core i7-13700K | |
| Intel Core i7-13700 | |
| AMD Ryzen 7 7745HX | |
| Intel Core i7-12700 | |
| Intel Core i5-13400 | |
| F1 22 - 1280x720 Ultra Low Preset AA:T AF:16x | |
| AMD Ryzen 7 7800X3D | |
| Intel Core i9-14900K | |
| AMD Ryzen 9 7950X3D | |
| AMD Ryzen 9 7950X | |
| AMD Ryzen 5 7600X | |
| Intel Core i9-13900K | |
| AMD Ryzen 7 7745HX | |
| Intel Core i7-13700K | |
| Intel Core i7-13700 | |
| Intel Core i7-12700 | |
| Intel Core i5-13400 | |
| Far Cry 5 - 1280x720 Low Preset AA:T | |
| AMD Ryzen 7 7800X3D | |
| AMD Ryzen 9 7950X3D | |
| Intel Core i9-14900K | |
| Intel Core i9-13900K | |
| Intel Core i7-13700K | |
| AMD Ryzen 5 7600X | |
| AMD Ryzen 9 7950X | |
| Intel Core i7-13700 | |
| AMD Ryzen 7 7745HX | |
| Intel Core i7-12700 | |
| Intel Core i5-13400 | |
| X-Plane 11.11 - 1280x720 low (fps_test=1) | |
| Intel Core i9-13900K | |
| Intel Core i9-14900K | |
| AMD Ryzen 9 7950X3D | |
| Intel Core i7-13700K | |
| AMD Ryzen 9 7950X | |
| AMD Ryzen 7 7800X3D | |
| Intel Core i7-13700 | |
| AMD Ryzen 5 7600X | |
| AMD Ryzen 7 7745HX | |
| Intel Core i7-12700 | |
| Intel Core i5-13400 | |
| Final Fantasy XV Benchmark - 1280x720 Lite Quality | |
| AMD Ryzen 7 7745HX | |
| Intel Core i9-13900K | |
| AMD Ryzen 9 7950X | |
| AMD Ryzen 5 7600X | |
| Intel Core i7-13700 | |
| Intel Core i7-13700K | |
| AMD Ryzen 7 7800X3D | |
| Intel Core i9-14900K | |
| AMD Ryzen 9 7950X3D | |
| Intel Core i7-12700 | |
| Intel Core i5-13400 | |
| Dota 2 Reborn - 1280x720 min (0/3) fastest | |
| AMD Ryzen 7 7800X3D | |
| AMD Ryzen 9 7950X3D | |
| AMD Ryzen 9 7950X | |
| Intel Core i9-14900K | |
| Intel Core i9-13900K | |
| AMD Ryzen 5 7600X | |
| AMD Ryzen 7 7745HX | |
| Intel Core i7-13700K | |
| Intel Core i7-13700 | |
| Intel Core i7-12700 | |
| Intel Core i5-13400 | |
| The Witcher 3 - 1024x768 Low Graphics & Postprocessing | |
| AMD Ryzen 9 7950X3D | |
| AMD Ryzen 7 7800X3D | |
| Intel Core i9-14900K | |
| AMD Ryzen 9 7950X | |
| Intel Core i9-13900K | |
| AMD Ryzen 5 7600X | |
| AMD Ryzen 7 7745HX | |
| Intel Core i7-13700K | |
| Intel Core i7-13700 | |
| Intel Core i7-12700 | |
| Intel Core i5-13400 | |
| GTA V - 1024x768 Lowest Settings possible | |
| AMD Ryzen 7 7800X3D | |
| AMD Ryzen 9 7950X | |
| AMD Ryzen 9 7950X3D | |
| AMD Ryzen 5 7600X | |
| Intel Core i9-14900K | |
| Intel Core i9-13900K | |
| Intel Core i7-13700 | |
| Intel Core i7-13700K | |
| AMD Ryzen 7 7745HX | |
| Intel Core i7-12700 | |
| Intel Core i5-13400 | |
| Borderlands 3 - 1280x720 Very Low Overall Quality (DX11) | |
| AMD Ryzen 7 7800X3D | |
| AMD Ryzen 9 7950X3D | |
| Intel Core i9-14900K | |
| Intel Core i9-13900K | |
| AMD Ryzen 9 7950X | |
| AMD Ryzen 5 7600X | |
| Intel Core i7-13700 | |
| Intel Core i7-13700K | |
| AMD Ryzen 7 7745HX | |
| Intel Core i7-12700 | |
| Intel Core i5-13400 | |
| Far Cry New Dawn - 1280x720 Low Preset | |
| AMD Ryzen 7 7800X3D | |
| AMD Ryzen 9 7950X3D | |
| Intel Core i9-14900K | |
| Intel Core i9-13900K | |
| Intel Core i7-13700 | |
| Intel Core i7-13700K | |
| AMD Ryzen 9 7950X | |
| AMD Ryzen 5 7600X | |
| Intel Core i7-12700 | |
| AMD Ryzen 7 7745HX | |
| Intel Core i5-13400 | |
| Shadow of the Tomb Raider - 1280x720 Lowest Preset | |
| AMD Ryzen 7 7800X3D | |
| AMD Ryzen 9 7950X3D | |
| AMD Ryzen 9 7950X | |
| Intel Core i9-14900K | |
| AMD Ryzen 5 7600X | |
| Intel Core i9-13900K | |
| AMD Ryzen 7 7745HX | |
| Intel Core i7-13700 | |
| Intel Core i7-13700K | |
| Intel Core i7-12700 | |
| Intel Core i5-13400 | |
| Tiny Tina's Wonderlands - 1280x720 Lowest Preset (DX12) | |
| AMD Ryzen 7 7800X3D | |
| Intel Core i9-14900K | |
| AMD Ryzen 9 7950X3D | |
| AMD Ryzen 9 7950X | |
| AMD Ryzen 5 7600X | |
| Intel Core i9-13900K | |
| AMD Ryzen 7 7745HX | |
| Intel Core i7-13700 | |
| Intel Core i7-13700K | |
| Intel Core i7-12700 | |
| Intel Core i5-13400 | |
| Strange Brigade - 1280x720 lowest AF:1 | |
| AMD Ryzen 5 7600X | |
| Intel Core i9-14900K | |
| AMD Ryzen 7 7800X3D | |
| AMD Ryzen 9 7950X | |
| Intel Core i9-13900K | |
| AMD Ryzen 7 7745HX | |
| AMD Ryzen 9 7950X3D | |
| Intel Core i7-13700K | |
| Intel Core i7-13700 | |
| Intel Core i7-12700 | |
| Intel Core i5-13400 | |
| Metro Exodus - 1280x720 Low Quality AF:4x | |
| AMD Ryzen 7 7800X3D | |
| Intel Core i9-14900K | |
| AMD Ryzen 5 7600X | |
| AMD Ryzen 9 7950X | |
| AMD Ryzen 9 7950X3D | |
| AMD Ryzen 7 7745HX | |
| Intel Core i7-13700 | |
| Intel Core i9-13900K | |
| Intel Core i7-13700K | |
| Intel Core i7-12700 | |
| Intel Core i5-13400 | |
| F1 2020 - 1280x720 Ultra Low Preset | |
| AMD Ryzen 7 7800X3D | |
| Intel Core i9-14900K | |
| AMD Ryzen 9 7950X3D | |
| AMD Ryzen 9 7950X | |
| AMD Ryzen 5 7600X | |
| AMD Ryzen 7 7745HX | |
| Intel Core i9-13900K | |
| Intel Core i7-13700K | |
| Intel Core i7-13700 | |
| Intel Core i7-12700 | |
| Intel Core i5-13400 | |
| F1 2021 - 1280x720 Ultra Low Preset | |
| AMD Ryzen 7 7800X3D | |
| Intel Core i9-14900K | |
| AMD Ryzen 5 7600X | |
| AMD Ryzen 9 7950X3D | |
| AMD Ryzen 9 7950X | |
| Intel Core i9-13900K | |
| AMD Ryzen 7 7745HX | |
| Intel Core i7-13700K | |
| Intel Core i7-13700 | |
| Intel Core i7-12700 | |
| Intel Core i5-13400 | |
| Performance Rating - Percent | |
| AMD Ryzen 7 7800X3D | |
| AMD Ryzen 9 7950X3D | |
| Intel Core i9-14900K | |
| AMD Ryzen 9 7950X | |
| AMD Ryzen 5 7600X | |
| Intel Core i9-13900K | |
| Intel Core i7-13700K | |
| Intel Core i7-13700 | |
| AMD Ryzen 7 7745HX | |
| Intel Core i7-12700 | |
| Intel Core i5-13400 | |
| F1 22 | |
| 3840x2160 Ultra High Preset AA:T AF:16x | |
| AMD Ryzen 7 7745HX | |
| AMD Ryzen 7 7800X3D | |
| Intel Core i9-14900K | |
| AMD Ryzen 5 7600X | |
| AMD Ryzen 9 7950X | |
| Intel Core i7-13700K | |
| AMD Ryzen 9 7950X3D | |
| Intel Core i7-13700 | |
| Intel Core i7-12700 | |
| Intel Core i5-13400 | |
| Intel Core i9-13900K | |
| 2560x1440 Ultra High Preset AA:T AF:16x | |
| AMD Ryzen 7 7800X3D | |
| Intel Core i9-14900K | |
| AMD Ryzen 7 7745HX | |
| AMD Ryzen 9 7950X3D | |
| AMD Ryzen 5 7600X | |
| AMD Ryzen 9 7950X | |
| Intel Core i9-13900K | |
| Intel Core i7-13700K | |
| Intel Core i7-13700 | |
| Intel Core i7-12700 | |
| Intel Core i5-13400 | |
| 1920x1080 Ultra High Preset AA:T AF:16x | |
| AMD Ryzen 7 7800X3D | |
| Intel Core i9-14900K | |
| AMD Ryzen 5 7600X | |
| AMD Ryzen 9 7950X3D | |
| AMD Ryzen 9 7950X | |
| Intel Core i9-13900K | |
| AMD Ryzen 7 7745HX | |
| Intel Core i7-13700K | |
| Intel Core i7-13700 | |
| Intel Core i7-12700 | |
| Intel Core i5-13400 | |
| Far Cry 5 | |
| 3840x2160 Ultra Preset AA:T | |
| AMD Ryzen 7 7800X3D | |
| Intel Core i9-14900K | |
| Intel Core i9-13900K | |
| AMD Ryzen 9 7950X3D | |
| AMD Ryzen 9 7950X | |
| AMD Ryzen 5 7600X | |
| Intel Core i7-13700K | |
| Intel Core i7-13700 | |
| Intel Core i7-12700 | |
| AMD Ryzen 7 7745HX | |
| Intel Core i5-13400 | |
| 2560x1440 Ultra Preset AA:T | |
| AMD Ryzen 7 7800X3D | |
| AMD Ryzen 9 7950X3D | |
| Intel Core i9-14900K | |
| Intel Core i9-13900K | |
| AMD Ryzen 5 7600X | |
| AMD Ryzen 9 7950X | |
| Intel Core i7-13700K | |
| Intel Core i7-13700 | |
| AMD Ryzen 7 7745HX | |
| Intel Core i7-12700 | |
| Intel Core i5-13400 | |
| 1920x1080 Ultra Preset AA:T | |
| AMD Ryzen 7 7800X3D | |
| AMD Ryzen 9 7950X3D | |
| Intel Core i9-14900K | |
| Intel Core i9-13900K | |
| AMD Ryzen 9 7950X | |
| AMD Ryzen 5 7600X | |
| Intel Core i7-13700 | |
| Intel Core i7-13700K | |
| Intel Core i7-12700 | |
| AMD Ryzen 7 7745HX | |
| Intel Core i5-13400 | |
| Final Fantasy XV Benchmark | |
| 3840x2160 High Quality | |
| Intel Core i9-14900K | |
| Intel Core i9-13900K | |
| AMD Ryzen 9 7950X | |
| AMD Ryzen 7 7745HX | |
| AMD Ryzen 5 7600X | |
| AMD Ryzen 7 7800X3D | |
| Intel Core i7-13700 | |
| AMD Ryzen 9 7950X3D | |
| Intel Core i7-13700K | |
| Intel Core i7-12700 | |
| Intel Core i5-13400 | |
| 2560x1440 High Quality | |
| AMD Ryzen 7 7800X3D | |
| Intel Core i9-14900K | |
| Intel Core i9-13900K | |
| AMD Ryzen 9 7950X | |
| AMD Ryzen 9 7950X3D | |
| AMD Ryzen 5 7600X | |
| Intel Core i7-13700K | |
| Intel Core i7-13700 | |
| AMD Ryzen 7 7745HX | |
| Intel Core i7-12700 | |
| Intel Core i5-13400 | |
| 1920x1080 High Quality | |
| Intel Core i9-14900K | |
| AMD Ryzen 9 7950X | |
| AMD Ryzen 7 7800X3D | |
| Intel Core i9-13900K | |
| AMD Ryzen 9 7950X3D | |
| Intel Core i7-13700K | |
| AMD Ryzen 5 7600X | |
| Intel Core i7-13700 | |
| AMD Ryzen 7 7745HX | |
| Intel Core i7-12700 | |
| Intel Core i5-13400 | |
| Dota 2 Reborn | |
| 3840x2160 ultra (3/3) best looking | |
| AMD Ryzen 7 7800X3D | |
| AMD Ryzen 9 7950X3D | |
| AMD Ryzen 9 7950X | |
| Intel Core i9-13900K | |
| Intel Core i9-14900K | |
| AMD Ryzen 5 7600X | |
| Intel Core i7-13700K | |
| Intel Core i7-13700 | |
| AMD Ryzen 7 7745HX | |
| Intel Core i7-12700 | |
| Intel Core i5-13400 | |
| 1920x1080 ultra (3/3) best looking | |
| AMD Ryzen 7 7800X3D | |
| AMD Ryzen 9 7950X3D | |
| AMD Ryzen 9 7950X | |
| Intel Core i9-13900K | |
| Intel Core i9-14900K | |
| AMD Ryzen 5 7600X | |
| Intel Core i7-13700K | |
| Intel Core i7-13700 | |
| AMD Ryzen 7 7745HX | |
| Intel Core i7-12700 | |
| Intel Core i5-13400 | |
| The Witcher 3 | |
| 3840x2160 High Graphics & Postprocessing (Nvidia HairWorks Off) | |
| AMD Ryzen 5 7600X | |
| Intel Core i9-14900K | |
| AMD Ryzen 9 7950X | |
| Intel Core i5-13400 | |
| Intel Core i7-13700 | |
| Intel Core i7-12700 | |
| AMD Ryzen 7 7800X3D | |
| Intel Core i7-13700K | |
| AMD Ryzen 7 7745HX | |
| AMD Ryzen 9 7950X3D | |
| Intel Core i9-13900K | |
| 1920x1080 Ultra Graphics & Postprocessing (HBAO+) | |
| Intel Core i9-13900K | |
| AMD Ryzen 9 7950X | |
| AMD Ryzen 7 7800X3D | |
| Intel Core i9-14900K | |
| AMD Ryzen 5 7600X | |
| Intel Core i7-13700K | |
| Intel Core i7-13700 | |
| AMD Ryzen 9 7950X3D | |
| Intel Core i7-12700 | |
| AMD Ryzen 7 7745HX | |
| Intel Core i5-13400 | |
| GTA V | |
| 3840x2160 Highest AA:4xMSAA + FX AF:16x | |
| AMD Ryzen 7 7800X3D | |
| Intel Core i9-14900K | |
| Intel Core i9-13900K | |
| AMD Ryzen 9 7950X | |
| AMD Ryzen 9 7950X3D | |
| Intel Core i7-13700K | |
| AMD Ryzen 5 7600X | |
| Intel Core i7-13700 | |
| AMD Ryzen 7 7745HX | |
| Intel Core i7-12700 | |
| Intel Core i5-13400 | |
| 2560x1440 Highest AA:4xMSAA + FX AF:16x | |
| AMD Ryzen 7 7800X3D | |
| Intel Core i9-14900K | |
| Intel Core i9-13900K | |
| AMD Ryzen 9 7950X | |
| AMD Ryzen 9 7950X3D | |
| Intel Core i7-13700K | |
| Intel Core i7-13700 | |
| AMD Ryzen 5 7600X | |
| AMD Ryzen 7 7745HX | |
| Intel Core i7-12700 | |
| Intel Core i5-13400 | |
| 1920x1080 Highest AA:4xMSAA + FX AF:16x | |
| AMD Ryzen 7 7800X3D | |
| Intel Core i9-14900K | |
| Intel Core i9-13900K | |
| AMD Ryzen 9 7950X | |
| AMD Ryzen 9 7950X3D | |
| Intel Core i7-13700K | |
| AMD Ryzen 5 7600X | |
| Intel Core i7-13700 | |
| AMD Ryzen 7 7745HX | |
| Intel Core i7-12700 | |
| Intel Core i5-13400 | |
| Borderlands 3 | |
| 3840x2160 Badass Overall Quality (DX11) | |
| Intel Core i7-13700K | |
| Intel Core i9-14900K | |
| AMD Ryzen 7 7800X3D | |
| AMD Ryzen 9 7950X3D | |
| Intel Core i9-13900K | |
| AMD Ryzen 9 7950X | |
| AMD Ryzen 5 7600X | |
| Intel Core i7-13700 | |
| AMD Ryzen 7 7745HX | |
| Intel Core i7-12700 | |
| Intel Core i5-13400 | |
| 2560x1440 Badass Overall Quality (DX11) | |
| AMD Ryzen 7 7800X3D | |
| AMD Ryzen 9 7950X3D | |
| Intel Core i9-14900K | |
| AMD Ryzen 9 7950X | |
| Intel Core i9-13900K | |
| AMD Ryzen 5 7600X | |
| Intel Core i7-13700K | |
| Intel Core i7-13700 | |
| AMD Ryzen 7 7745HX | |
| Intel Core i7-12700 | |
| Intel Core i5-13400 | |
| 1920x1080 Badass Overall Quality (DX11) | |
| AMD Ryzen 9 7950X3D | |
| AMD Ryzen 7 7800X3D | |
| Intel Core i9-14900K | |
| AMD Ryzen 9 7950X | |
| Intel Core i9-13900K | |
| AMD Ryzen 5 7600X | |
| Intel Core i7-13700K | |
| Intel Core i7-13700 | |
| AMD Ryzen 7 7745HX | |
| Intel Core i7-12700 | |
| Intel Core i5-13400 | |
| Far Cry New Dawn | |
| 3840x2160 Ultra Preset | |
| AMD Ryzen 7 7800X3D | |
| AMD Ryzen 9 7950X3D | |
| Intel Core i9-14900K | |
| Intel Core i9-13900K | |
| AMD Ryzen 9 7950X | |
| Intel Core i7-13700 | |
| Intel Core i7-13700K | |
| AMD Ryzen 5 7600X | |
| Intel Core i7-12700 | |
| AMD Ryzen 7 7745HX | |
| Intel Core i5-13400 | |
| 2560x1440 Ultra Preset | |
| AMD Ryzen 7 7800X3D | |
| AMD Ryzen 9 7950X3D | |
| Intel Core i9-14900K | |
| Intel Core i9-13900K | |
| AMD Ryzen 9 7950X | |
| Intel Core i7-13700K | |
| AMD Ryzen 5 7600X | |
| Intel Core i7-13700 | |
| Intel Core i7-12700 | |
| AMD Ryzen 7 7745HX | |
| Intel Core i5-13400 | |
| 1920x1080 Ultra Preset | |
| AMD Ryzen 7 7800X3D | |
| AMD Ryzen 9 7950X3D | |
| Intel Core i9-14900K | |
| Intel Core i9-13900K | |
| AMD Ryzen 9 7950X | |
| Intel Core i7-13700K | |
| AMD Ryzen 5 7600X | |
| Intel Core i7-13700 | |
| Intel Core i7-12700 | |
| AMD Ryzen 7 7745HX | |
| Intel Core i5-13400 | |
| Shadow of the Tomb Raider | |
| 3840x2160 Highest Preset AA:T | |
| Intel Core i9-14900K | |
| Intel Core i7-13700K | |
| AMD Ryzen 7 7800X3D | |
| Intel Core i7-13700 | |
| AMD Ryzen 9 7950X3D | |
| AMD Ryzen 5 7600X | |
| AMD Ryzen 7 7745HX | |
| AMD Ryzen 9 7950X | |
| Intel Core i9-13900K | |
| Intel Core i7-12700 | |
| Intel Core i5-13400 | |
| 2560x1440 Highest Preset AA:T | |
| AMD Ryzen 7 7800X3D | |
| AMD Ryzen 9 7950X3D | |
| Intel Core i9-14900K | |
| Intel Core i9-13900K | |
| AMD Ryzen 9 7950X | |
| AMD Ryzen 5 7600X | |
| Intel Core i7-13700K | |
| Intel Core i7-13700 | |
| AMD Ryzen 7 7745HX | |
| Intel Core i7-12700 | |
| Intel Core i5-13400 | |
| 1920x1080 Highest Preset AA:T | |
| AMD Ryzen 7 7800X3D | |
| AMD Ryzen 9 7950X3D | |
| Intel Core i9-14900K | |
| AMD Ryzen 9 7950X | |
| Intel Core i9-13900K | |
| AMD Ryzen 5 7600X | |
| Intel Core i7-13700K | |
| Intel Core i7-13700 | |
| AMD Ryzen 7 7745HX | |
| Intel Core i7-12700 | |
| Intel Core i5-13400 | |
| Tiny Tina's Wonderlands | |
| 3840x2160 Badass Preset (DX12) | |
| Intel Core i9-14900K | |
| AMD Ryzen 9 7950X3D | |
| AMD Ryzen 7 7745HX | |
| AMD Ryzen 5 7600X | |
| AMD Ryzen 9 7950X | |
| Intel Core i7-13700 | |
| Intel Core i9-13900K | |
| AMD Ryzen 7 7800X3D | |
| Intel Core i7-12700 | |
| Intel Core i5-13400 | |
| Intel Core i7-13700K | |
| 2560x1440 Badass Preset (DX12) | |
| AMD Ryzen 9 7950X3D | |
| Intel Core i9-14900K | |
| AMD Ryzen 7 7800X3D | |
| AMD Ryzen 9 7950X | |
| AMD Ryzen 7 7745HX | |
| AMD Ryzen 5 7600X | |
| Intel Core i7-13700K | |
| Intel Core i9-13900K | |
| Intel Core i7-13700 | |
| Intel Core i7-12700 | |
| Intel Core i5-13400 | |
| 1920x1080 Badass Preset (DX12) | |
| AMD Ryzen 7 7800X3D | |
| Intel Core i9-14900K | |
| AMD Ryzen 9 7950X3D | |
| AMD Ryzen 9 7950X | |
| AMD Ryzen 5 7600X | |
| AMD Ryzen 7 7745HX | |
| Intel Core i9-13900K | |
| Intel Core i7-13700 | |
| Intel Core i7-13700K | |
| Intel Core i7-12700 | |
| Intel Core i5-13400 | |
| Strange Brigade | |
| 3840x2160 ultra AA:ultra AF:16 | |
| Intel Core i9-14900K | |
| AMD Ryzen 7 7800X3D | |
| AMD Ryzen 7 7745HX | |
| Intel Core i7-13700K | |
| AMD Ryzen 9 7950X3D | |
| Intel Core i7-12700 | |
| AMD Ryzen 5 7600X | |
| Intel Core i7-13700 | |
| AMD Ryzen 9 7950X | |
| Intel Core i9-13900K | |
| Intel Core i5-13400 | |
| 2560x1440 ultra AA:ultra AF:16 | |
| Intel Core i9-14900K | |
| AMD Ryzen 7 7800X3D | |
| AMD Ryzen 5 7600X | |
| AMD Ryzen 7 7745HX | |
| AMD Ryzen 9 7950X | |
| Intel Core i9-13900K | |
| AMD Ryzen 9 7950X3D | |
| Intel Core i7-13700K | |
| Intel Core i7-13700 | |
| Intel Core i7-12700 | |
| Intel Core i5-13400 | |
| 1920x1080 ultra AA:ultra AF:16 | |
| Intel Core i9-14900K | |
| AMD Ryzen 5 7600X | |
| AMD Ryzen 7 7800X3D | |
| AMD Ryzen 9 7950X | |
| Intel Core i9-13900K | |
| AMD Ryzen 7 7745HX | |
| AMD Ryzen 9 7950X3D | |
| Intel Core i7-13700K | |
| Intel Core i7-13700 | |
| Intel Core i7-12700 | |
| Intel Core i5-13400 | |
| Metro Exodus | |
| 3840x2160 Ultra Quality AF:16x | |
| Intel Core i9-14900K | |
| AMD Ryzen 7 7800X3D | |
| AMD Ryzen 9 7950X | |
| AMD Ryzen 9 7950X3D | |
| Intel Core i9-13900K | |
| AMD Ryzen 5 7600X | |
| Intel Core i7-13700 | |
| Intel Core i7-13700K | |
| AMD Ryzen 7 7745HX | |
| Intel Core i7-12700 | |
| Intel Core i5-13400 | |
| 2560x1440 Ultra Quality AF:16x | |
| AMD Ryzen 7 7800X3D | |
| Intel Core i9-14900K | |
| AMD Ryzen 9 7950X | |
| AMD Ryzen 5 7600X | |
| AMD Ryzen 7 7745HX | |
| AMD Ryzen 9 7950X3D | |
| Intel Core i9-13900K | |
| Intel Core i7-13700 | |
| Intel Core i7-13700K | |
| Intel Core i7-12700 | |
| Intel Core i5-13400 | |
| 1920x1080 Ultra Quality AF:16x | |
| AMD Ryzen 7 7800X3D | |
| Intel Core i9-14900K | |
| AMD Ryzen 9 7950X | |
| AMD Ryzen 7 7745HX | |
| AMD Ryzen 5 7600X | |
| AMD Ryzen 9 7950X3D | |
| Intel Core i9-13900K | |
| Intel Core i7-13700 | |
| Intel Core i7-13700K | |
| Intel Core i7-12700 | |
| Intel Core i5-13400 | |
| F1 2020 | |
| 3840x2160 Ultra High Preset AA:T AF:16x | |
| Intel Core i9-14900K | |
| AMD Ryzen 9 7950X3D | |
| AMD Ryzen 7 7800X3D | |
| AMD Ryzen 7 7745HX | |
| AMD Ryzen 9 7950X | |
| Intel Core i9-13900K | |
| AMD Ryzen 5 7600X | |
| Intel Core i7-13700K | |
| Intel Core i7-13700 | |
| Intel Core i7-12700 | |
| Intel Core i5-13400 | |
| 2560x1440 Ultra High Preset AA:T AF:16x | |
| AMD Ryzen 7 7800X3D | |
| Intel Core i9-14900K | |
| AMD Ryzen 9 7950X3D | |
| AMD Ryzen 9 7950X | |
| Intel Core i9-13900K | |
| AMD Ryzen 5 7600X | |
| AMD Ryzen 7 7745HX | |
| Intel Core i7-13700K | |
| Intel Core i7-13700 | |
| Intel Core i7-12700 | |
| Intel Core i5-13400 | |
| 1920x1080 Ultra High Preset AA:T AF:16x | |
| AMD Ryzen 7 7800X3D | |
| AMD Ryzen 9 7950X3D | |
| Intel Core i9-14900K | |
| AMD Ryzen 5 7600X | |
| AMD Ryzen 9 7950X | |
| AMD Ryzen 7 7745HX | |
| Intel Core i9-13900K | |
| Intel Core i7-13700K | |
| Intel Core i7-13700 | |
| Intel Core i7-12700 | |
| Intel Core i5-13400 | |
| F1 2021 | |
| 3840x2160 Ultra High Preset + Raytracing AA:T AF:16x | |
| AMD Ryzen 7 7800X3D | |
| AMD Ryzen 7 7745HX | |
| AMD Ryzen 5 7600X | |
| AMD Ryzen 9 7950X3D | |
| Intel Core i9-14900K | |
| AMD Ryzen 9 7950X | |
| Intel Core i7-13700K | |
| Intel Core i7-13700 | |
| Intel Core i9-13900K | |
| Intel Core i7-12700 | |
| Intel Core i5-13400 | |
| 2560x1440 Ultra High Preset + Raytracing AA:T AF:16x | |
| AMD Ryzen 7 7800X3D | |
| Intel Core i9-14900K | |
| AMD Ryzen 5 7600X | |
| AMD Ryzen 9 7950X3D | |
| AMD Ryzen 9 7950X | |
| Intel Core i7-13700K | |
| Intel Core i7-13700 | |
| AMD Ryzen 7 7745HX | |
| Intel Core i7-12700 | |
| Intel Core i5-13400 | |
| Intel Core i9-13900K | |
| 1920x1080 Ultra High Preset + Raytracing AA:T AF:16x | |
| AMD Ryzen 7 7800X3D | |
| Intel Core i9-14900K | |
| AMD Ryzen 5 7600X | |
| Intel Core i9-13900K | |
| AMD Ryzen 9 7950X | |
| AMD Ryzen 9 7950X3D | |
| Intel Core i7-13700K | |
| Intel Core i7-13700 | |
| AMD Ryzen 7 7745HX | |
| Intel Core i7-12700 | |
| Intel Core i5-13400 | |
Energieaufnahme mit externem Monitor
| min. | mittel | hoch | max. | QHD | 4K DLSS | 4K | |
|---|---|---|---|---|---|---|---|
| GTA V (2015) | 187.6 | 186.9 | 183.7 | 142.9 | 142.6 | 183.6 | |
| The Witcher 3 (2015) | 692 | 608 | 566 | 291 | 255 | 277 | |
| Dota 2 Reborn (2015) | 252 | 222 | 218 | 195.2 | 192.8 | ||
| Final Fantasy XV Benchmark (2018) | 237 | 236 | 217 | 212 | 160.2 | ||
| X-Plane 11.11 (2018) | 195.9 | 164.5 | 127.3 | 106.7 | |||
| Far Cry 5 (2018) | 205 | 176 | 168 | 155 | 157 | 152 | |
| Strange Brigade (2018) | 676 | 553 | 548 | 541 | 517 | 287 | |
| Shadow of the Tomb Raider (2018) | 275 | 253 | 246 | 254 | 242 | 186.4 | |
| Far Cry New Dawn (2019) | 170 | 148 | 143 | 128 | 128 | 124 | |
| Metro Exodus (2019) | 287 | 271 | 239 | 199.4 | 182.8 | 135.8 | |
| Borderlands 3 (2019) | 203 | 179.9 | 162.4 | 154.7 | 153.2 | 127.9 | |
| F1 2020 (2020) | 529 | 408 | 431 | 392 | 383 | 287 | |
| Death Stranding (2020) | 238 | 237 | 234 | 230 | 227 | 197.7 | |
| Horizon Zero Dawn (2020) | 290 | 268 | 250 | 237 | 230 | 208 | 165 |
| F1 2021 (2021) | 589 | 567 | 483 | 253 | 252 | 207 | |
| Forza Horizon 5 (2021) | 359 | 281 | 278 | 201 | 187 | 161 | |
| God of War (2022) | 230 | 233 | 229 | 205 | 179.7 | 127.1 | |
| GRID Legends (2022) | 229 | 205 | 190.1 | 184.2 | 181.8 | 173.9 | |
| Tiny Tina's Wonderlands (2022) | 393 | 333 | 295 | 279 | 229 | 130.8 | |
| F1 22 (2022) | 375 | 391 | 363 | 191.4 | 159.5 | 84.9 | |
| The Callisto Protocol (2022) | 211.1 | 199.9 | 196.8 | 185.5 | 179.2 | 149.6 | |
| High On Life (2023) | 343 | 325 | 292 | 278 | 224 | 109.9 | |
| The Witcher 3 v4 (2023) | 259 | 219 | 191.6 | 180.1 | 176.9 | 160.4 | |
| Dead Space Remake (2023) | 194.3 | 194.1 | 186.1 | 184.9 | 170.6 | 97.9 | |
| Returnal (2023) | 199 | 199 | 196 | 193 | 170 | 113 | |
| Atomic Heart (2023) | 258 | 214 | 190 | 177.9 | 164.6 | 105.6 | |
| Company of Heroes 3 (2023) | 312.3 | 284.6 | 268.8 | 267.4 | 236.3 | 195.4 | |
| The Last of Us (2023) | 182.3 | 171.4 | 170.3 | 166.5 | 142.5 | 123.9 | 82.2 |
| F1 23 (2023) | 384 | 401 | 379 | 174.6 | 153.2 | 133.2 | 80.7 |
| Starfield (2023) | 164 | 162.7 | 152.6 | 144.5 | 122.7 | 82.1 | |
| Lies of P (2023) | 315 | 296 | 276 | 257 | 245 | 224 | 165.8 |
| Cyberpunk 2077 (2023) | 203 | 201 | 185.5 | 170.7 | 152 | 75.9 | |
| Assassin's Creed Mirage (2023) | 253 | 244 | 232 | 166 | 160 | 144 | 130 |
| Total War Pharaoh (2023) | 544.4 | 319.5 | 211.7 | 163.1 | 162.8 | 150 | |
| Lords of the Fallen (2023) | 160.8 | 154.8 | 147.8 | 122.1 | 93.9 | 93.2 | 55.4 |
| EA Sports WRC (2023) | 224 | 147.3 | 138.3 | 134.7 | 131.7 | 123.2 | 120.7 |
| Call of Duty Modern Warfare 3 2023 (2023) | 246 | 245 | 244 | 243 | 230 | 164 | |
| Avatar Frontiers of Pandora (2023) | 236 | 224 | 201 | 169 | 126 | 113 | 68 |
| The Finals (2023) | 302 | 268 | 261 | 270 | 257 | 223 | 140.4 |
Energiebedarf und Temperaturen
Minisforum liefert das BD770i Mainboard samt vorinstallierter Heatpipe-Kühlung. Allerdings obliegt dem Anwender, welchen 120-Millimeter-Lüfter er installieren möchte. Abweichend zu unserem Noctua-NF-A12x25-Lüfter kann es also Temperaturabweichungen bei der Verwendung anderer Lüfter geben. Grundsätzlich haben wir an der Kühleinheit nicht viel auszusetzen. Das SoC und auch die Spannungswandler auf der Hauptplatine werden direkt gekühlt. Damit ist auch klar, dass hier kein alternativer Kühler installiert werden kann. Bei den Temperaturen des AMD Ryzen 7 7745HX bewegen wir uns im geschlossenen System als auch beim offenen Aufbau bei etwas über 90 °C. Das ist für eine CPU, welche aus dem Mobil-Bereich stammt, kein Problem. AMDs Spezifikationen räumen dem Prozessor ein Limit von bis zu 100 °C ein, bevor eine Leistungsreduzierung eintritt. Selbst bei einem längeren Stresstest haben wir die 100 °C nie erreicht.
Der größte Vorteil des Minisforum BD770i ist die Leistungsaufnahme: Nur 127,5 Watt dokumentieren wir beim Cinebench-R15-Multi-Test. In Verbindung mit dem ausgezeichneten Ergebnis resultiert hier eine exzellente Effizienz. Kein anderes Desktop-System kann da im Vergleich mithalten. Beim Spielen sieht es etwas anders aus, da hier ein Großteil der Energie für die Leistung der Grafikkarte verwendet wird. Im Vergleich dokumentieren wir mit durchschnittlich 495 Watt dennoch ein vergleichsweise gutes Ergebnis. Der sehr effiziente AMD Ryzen 7 7800X3D ist auf Augenhöhe. Bei der Effizienz im Gaming-Betrieb muss der AMD Ryzen 7 7745HX den AMD Ryzen 7 7800X3D aber ziehen lassen. Gleichauf mit einem AMD Ryzen 9 7950X3D braucht sich unser Testsample aber auch an dieser Stelle nicht zu verstecken. Ohne die Verwendung einer dedizierten Grafikkarte ist das Testsystem deutlich sparsamer und benötigt im Gaming-Betrieb nur 60 Watt im Durchschnitt.
Zum Gesamtbetrieb und der Lautstärke können wir in unserem Testaufbau nur sagen, dass unser verbautes Netzteil hörbar ist. Sowohl im Leerlauf als auch unter Last können wir hier keine Messungen durchführen, welche durch das verbaute Netzteil beeinflusst werden würden. Sogar der kleine vorinstallierte Lüfter zur aktiven Kühlung der SSD arbeitet durchweg sehr leise und ist nicht aus einem geschlossenen Gehäuse hörbar. Im BIOS selbst lassen sich nur wenige Parameter einstellen, welche sich auf die Lüftergeschwindigkeiten auswirken. Zum einen lässt sich die CPU-Leistung in vordefinierten Stritten (45-, 55- und 75 Watt) anpassen und zum anderen lässt sich auch die maximale CPU-Temperatur auf einen beliebigen Wert einstellen. Im Vergleich zu den bekannten Mainordherstellern fallen die Einstellungsoptionen beim Minisforum BD770i Mainboard jedoch deutlich dürftiger aus. Die Möglichkeit, die Lüfterkurve anzupassen, wäre sicherlich einfacher, als mit den Grenzwerten von Leistung und Temperatur des SoC zu experimentieren.
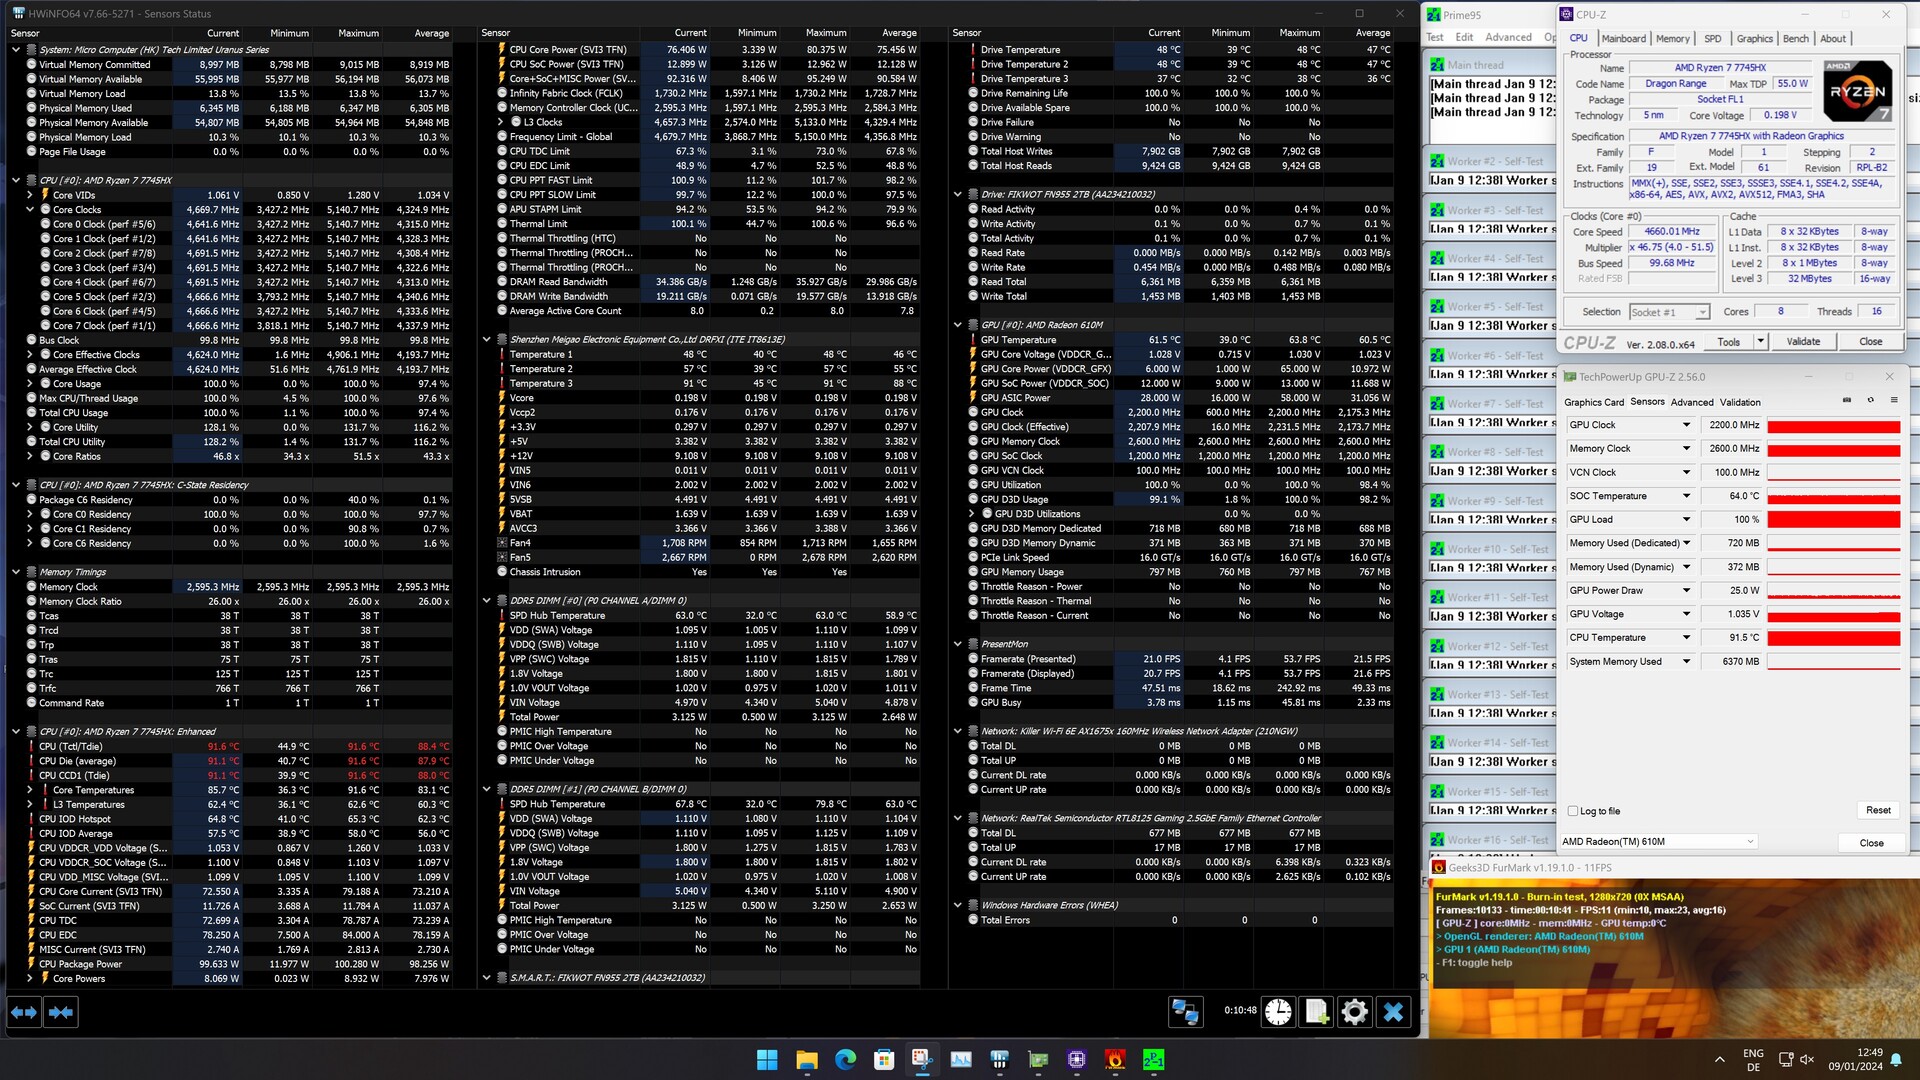
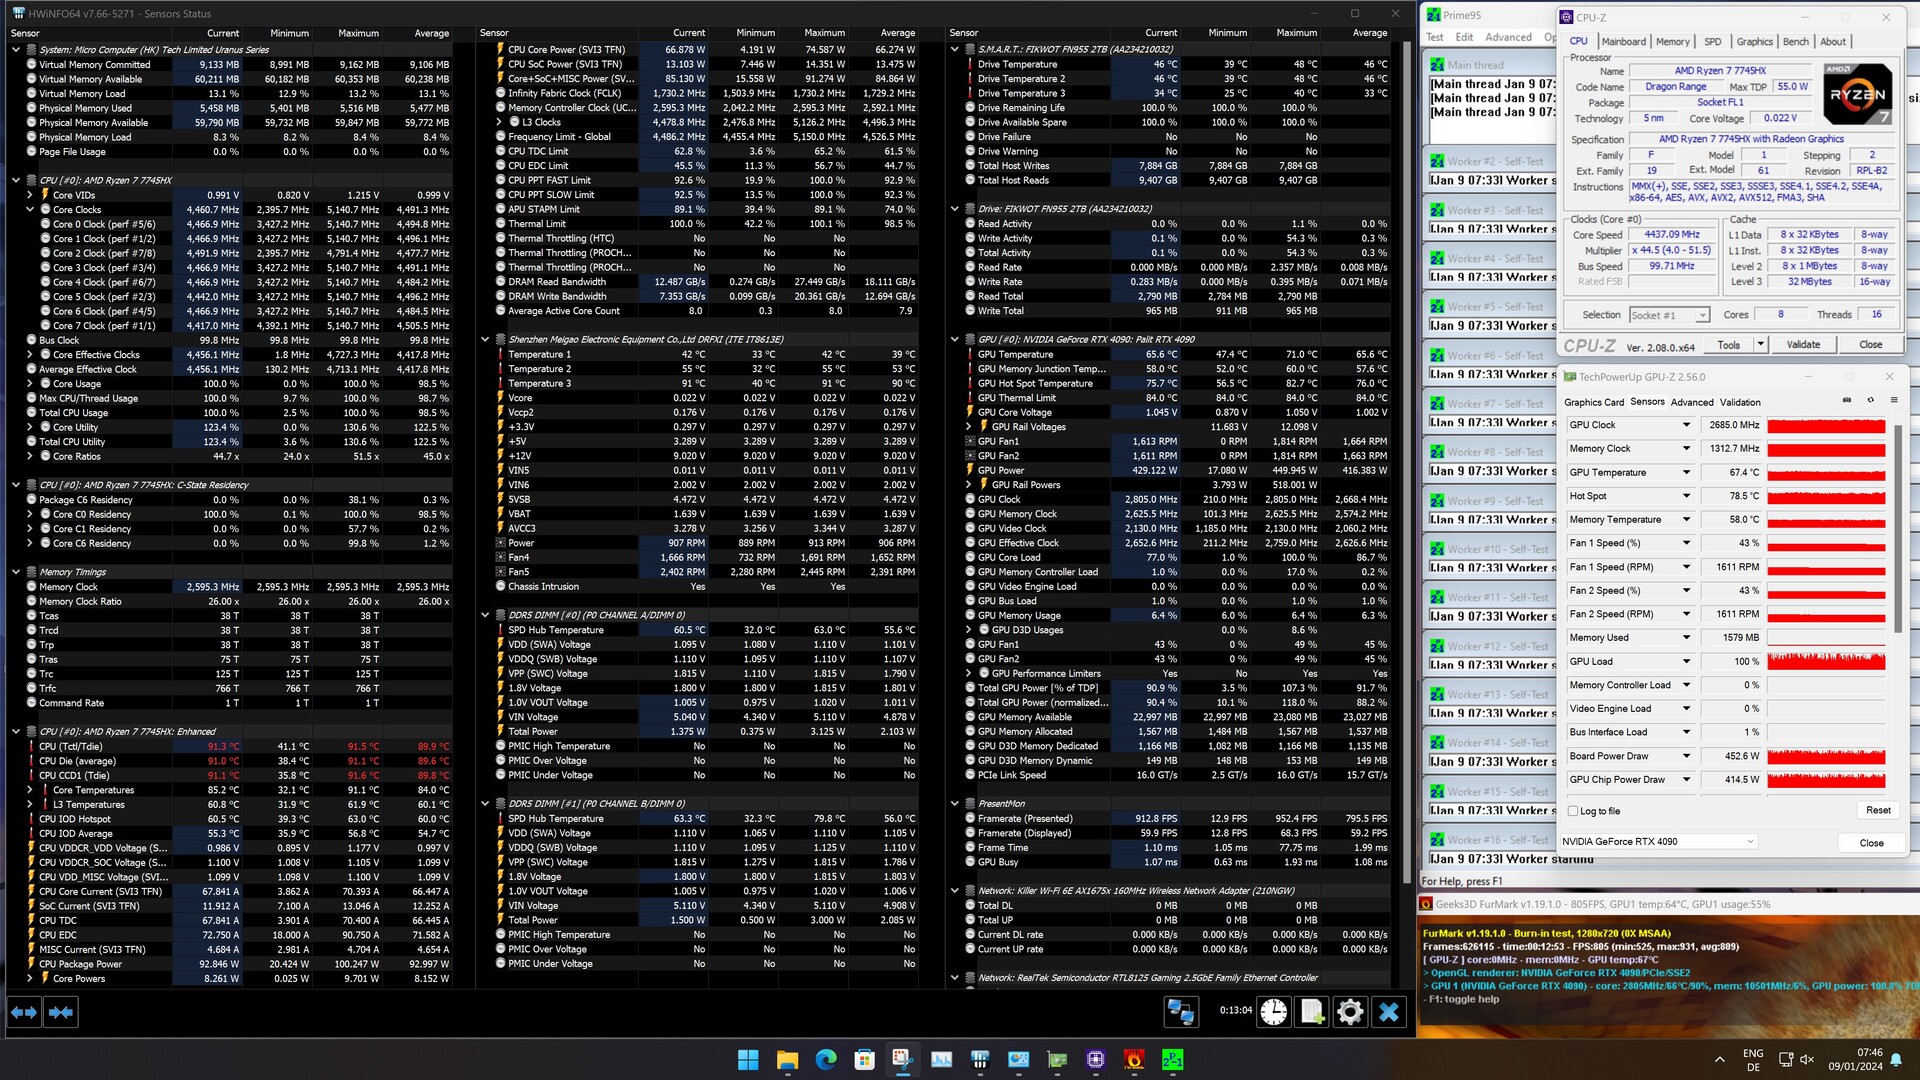
| Power Consumption / Cinebench R15 Multi (external Monitor) | |
| Intel Core i9-14900K | |
| Intel Core i9-13900K | |
| AMD Ryzen 9 7950X (Idle: 95.2 W) | |
| Intel Core i7-13700K | |
| Intel Core i5-14600K | |
| Intel Core i5-13600K | |
| Intel Core i7-12700 | |
| AMD Ryzen 9 7950X3D | |
| AMD Ryzen 7 7800X3D | |
| Intel Core i5-13400 | |
| Intel Core i5-12400F | |
| AMD Ryzen 7 7745HX | |
| Power Consumption / Prime95 V2810 Stress (external Monitor) | |
| Intel Core i9-14900K | |
| Intel Core i9-13900K | |
| Intel Core i5-14600K | |
| Intel Core i7-13700K | |
| Intel Core i5-13600K | |
| AMD Ryzen 9 7950X (Idle: 95.2 W) | |
| Intel Core i7-12700 | |
| AMD Ryzen 9 7950X3D | |
| Intel Core i5-12400F | |
| Intel Core i5-13400 | |
| AMD Ryzen 7 7800X3D | |
| AMD Ryzen 7 7745HX | |
| Power Consumption / Cinebench R23 Multi (external Monitor) | |
| Intel Core i9-14900K | |
| AMD Ryzen 9 7950X (95.2) | |
| Intel Core i5-14600K | |
| AMD Ryzen 9 7950X3D | |
| AMD Ryzen 7 7800X3D | |
| AMD Ryzen 7 7745HX | |
| Power Consumption / Cinebench R23 Single (external Monitor) | |
| AMD Ryzen 7 7800X3D | |
| AMD Ryzen 9 7950X (95.2) | |
| Intel Core i9-14900K | |
| Intel Core i5-14600K | |
| AMD Ryzen 7 7745HX | |
| Power Consumption / Cinebench R15 Multi Efficiency (external Monitor) | |
| AMD Ryzen 7 7745HX | |
| AMD Ryzen 9 7950X3D | |
| AMD Ryzen 9 7950X | |
| AMD Ryzen 7 7800X3D | |
| Intel Core i9-13900K | |
| Intel Core i5-13600K | |
| Intel Core i9-14900K | |
| Intel Core i5-14600K | |
* ... kleinere Werte sind besser
| Power Consumption / The Witcher 3 ultra (external Monitor) | |
| Intel Core i5-14600K | |
| Intel Core i9-14900K | |
| Intel Core i7-13700 | |
| Intel Core i7-13700K | |
| AMD Ryzen 9 7950X | |
| AMD Ryzen 9 7950X3D | |
| Intel Core i9-13900K | |
| Intel Core i7-12700 | |
| Intel Core i5-13400 | |
| AMD Ryzen 7 7800X3D | |
| AMD Ryzen 7 7745HX | |
| Intel Core i5-12400F | |
| AMD Ryzen 7 7745HX | |
| Power Consumption / Witcher 3 ultra Efficiency (external Monitor) | |
| AMD Ryzen 7 7800X3D | |
| Intel Core i5-12400F | |
| Intel Core i9-13900K | |
| AMD Ryzen 9 7950X | |
| Intel Core i7-12700 | |
| AMD Ryzen 9 7950X3D | |
| AMD Ryzen 7 7745HX | |
| Intel Core i7-13700K | |
| Intel Core i7-13700 | |
| Intel Core i9-14900K | |
| Intel Core i5-14600K | |
| Intel Core i5-13400 | |
| AMD Ryzen 7 7745HX | |
* ... kleinere Werte sind besser
Energieaufnahme mit externem Monitor
Pro
Contra
Fazit - Leistungsstarker AMD Ryzen 7 7745HX

Mit dem Minisforum BD770i bietet der chinesische Systemhersteller für kompakte PCs eine hervorragende Grundlage, um sehr effiziente PCs zu bauen. Mit dem BD770i bedient Minisforum Kunden, die ihr System selbst zusammenbauen möchten, denn im Lieferumfang befindet sich lediglich das Mainboard mit fest verbauter CPU und einem vormontierten Heatpipe-Kühler. Auf dieser Grundlage lassen sich sparsame Systeme für den Office-Alltag zusammenstellen, wenngleich auch mit einer dedizierten Grafikkarte sogar sehr leistungsstarke Gaming-Systeme realisiert werden können.
Das Minisforum BD770i bietet mit dem AMD Ryzen 7 7745HX viel Leistung und kann aufgrund der PCIe-5.0-Anbindung auch mit zukünftigen Grafikkarten umgehen.
Der Ansatz, eine mobile CPU in einem Desktop-System unterzubringen, ist hier gelungen. Die gute Leistungsentfaltung, welche nicht durch thermische Drosselung gemindert wird, kann durch die geringe Energieaufnahme für eine fantastische Effizienz sorgen. Selbst AMDs aktuelle X3D-Prozessoren, welche ebenfalls mit einer exzellenten Effizienz auf sich aufmerksam machen konnten, können Minisforum mit dem BD770i Mainboard schlagen.
Der Preis von aktuell 459 Euro klingt erst einmal sehr hoch, doch in Relation zu einem herkömmlichen Desktop-System in dieser Leistungsklasse könnte das Minisforum BD770i das Potenzial haben, auf der Wunschliste zu landen. Wer keinen Wert auf ein späteres CPU-Upgrade legt, kann hier getrost zugreifen. Beachtet werden sollte jedoch, dass es sich hierbei um eine Art Barebone-System handelt, welches weitere Kosten nach sich zieht, um das Gerät überhaupt erst in Betrieb nehmen zu können.
Preise und Verfügbarkeit
Das Minisforum BD770i kostet aktuell 459 Euro und kann direkt im Shop des Herstellers geordert werden. Aktuell bietet der Hersteller hier noch einen 60-Euro-Rabatt (Code: 2143DNJF7Z76), womit nur noch 399 Euro auf der Rechnung stehen.
Transparenz
Die Auswahl der zu testenden Geräte erfolgt innerhalb der Redaktion. Das vorliegende Testmuster wurde dem Autor vom Hersteller unentgeltlich zu Testzwecken überlassen. Eine Einflussnahme auf den Testbericht gab es nicht, der Hersteller erhielt keine Version des Reviews vor der Veröffentlichung. Es bestand keine Verpflichtung zur Publikation. Als eigenständiges, unabhängiges Unternehmen unterliegt Notebookcheck keiner Diktion von Herstellern, Shops und Verlagen.
So testet Notebookcheck
Pro Jahr werden von Notebookcheck hunderte Laptops und Smartphones unabhängig in von uns standardisierten technischen Verfahren getestet, um eine Vergleichbarkeit aller Testergebnisse zu gewährleisten. Seit rund 20 Jahren entwickeln wir diese Testmethoden kontinuierlich weiter und setzen damit Branchenstandards. In unseren Testlaboren kommt ausschließlich hochwertiges Messequipment in die Hände erfahrener Techniker und Redakteure. Die Tests unterliegen einer mehrstufigen Kontrolle. Unsere komplexe Gesamtbewertung basiert auf hunderten fundierten Messergebnissen und Benchmarks, womit Ihnen Objektivität garantiert ist. Weitere Informationen zu unseren Testmethoden gibt es hier.
