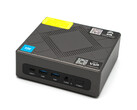
BMAX B7 Power im Test: Sparsamer Mini-PC mit Intel Core i7 für 320 Euro
Der (MaxMini) B7 Power ist nicht das erste Gerät, das wir von BMAX getestet haben. Das BMAX MaxBook Y11 H1M6 Convertible kam in unserem Test auf 75 Prozentpunkte. Daneben haben wir einen der Vorgänger des B7 Power, den BMAX B5 Pro getestet, allerdings ohne Wertungsvergabe. Ende 2022 war der B5 mit Intel Gen8 noch das Top-Modell, mittlerweile ist der B7 Power mit Intel Gen11 ausgestattet. Das macht ihn zwar nicht ultra-modern, hält dafür jedoch den Preis angenehm niedrig. Zwischenzeitlich lag dieser bei reduzierten rund 320 Euro! BMAX hat außerdem noch einen B7 Pro im Angebot, hier rechnet ein Intel Core i5-1145G7 statt Intel Core i7-11390H.
Beweisen muss sich der B7 Power gegen andere Mini-PCs. Mit dem Geekom Mini IT11 haben wir einen Kandidaten mit gleicher CPU, wir ermitteln aber auch das potentielle Leistungsdefizit zu Geräten mit aktueller CPU-Generation wie dem Intel NUC 13 Pro Kit. Dazwischen reiht sich das Intel NUC 12 Pro Kit mit Intel Gen12 ein. Weitere Vergleichgeräte finden wir im Beelink SEi11 sowie dem Quasi-Vorgänger, dem B5 Pro.
Mögliche Konkurrenten im Vergleich
Bew. | Datum | Modell | Gewicht | Dicke | Größe | Auflösung | Preis ab |
|---|---|---|---|---|---|---|---|
| 78.4 % v7 (old) | 09 / 2023 | BMAX B7 Power G7A2 i7-11390H, Iris Xe G7 96EUs | 363 g | 44 mm | x | ||
| 80.6 % v7 (old) | 07 / 2023 | Geekom Mini IT11, i7-11390H i7-11390H, Iris Xe G7 96EUs | 536 g | 48 mm | x | ||
| 80.8 % v7 (old) | 04 / 2023 | Intel NUC 13 Pro Kit NUC13ANK i7-1360P, Iris Xe G7 96EUs | 538 g | 37 mm | x | ||
v (old) | 03 / 2023 | Intel NUC 12 Pro Kit NUC12WSBi5 i5-1240P, Iris Xe G7 80EUs | 549 g | 45.6 mm | x | ||
v (old) | 09 / 2022 | Beelink SEi11 Pro i5-11320H, Iris Xe G7 96EUs | 440 g | 40 mm | x | ||
v (old) | 11 / 2022 | BMAX B5 Pro G7H8 i5-8260U, UHD Graphics 620 | 369 g | 43.2 mm | x |
Gehäuse - B7 Power aus Plastik
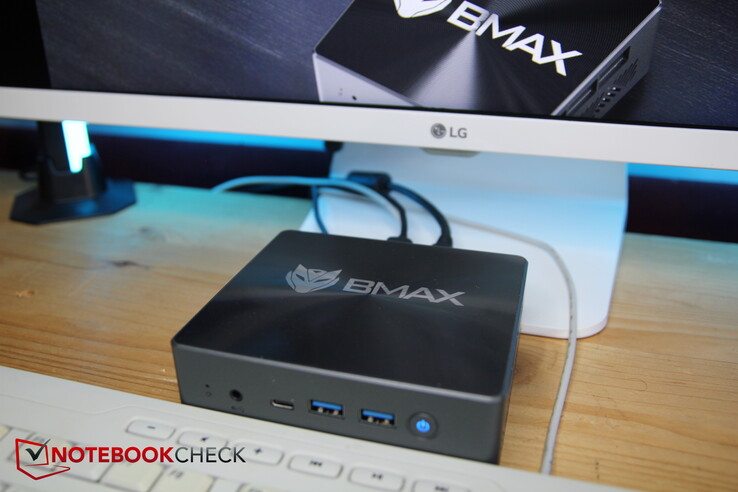
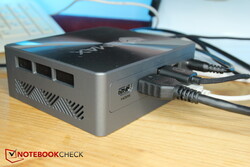
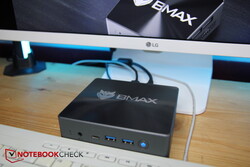
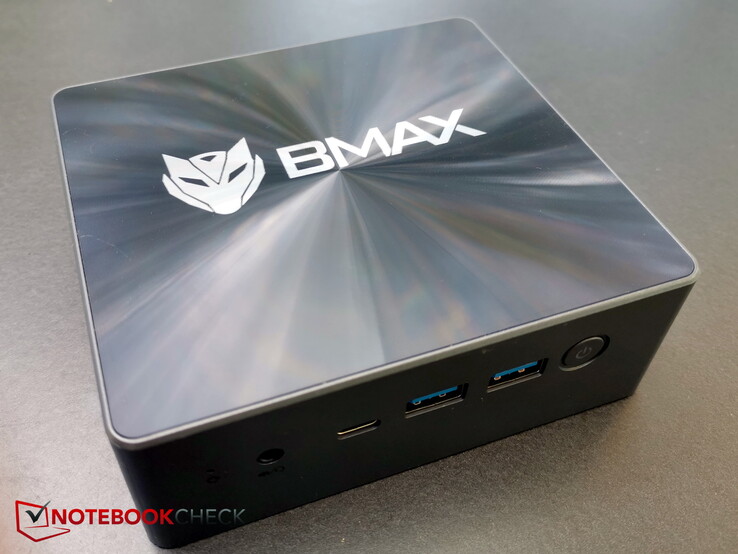
Das Gehäuse besteht quasi komplett aus dunkelgrauem bis schwarzem Plastik. Durch die kompakte Quaderform ist das Konstrukt dennoch recht verwindungssteif. Zu viel Kraft sollte man jedoch nicht aufwenden, es kommt schon bald zu unschönem Knacken der Plastikteile. Gleichzeitig sorgt der Kunststoff für ein vergleichsweise geringes Gewicht von nur 363 Gramm.
Die Oberseite ist dabei ein kleiner Hingucker, denn über dem BMAX-Logo ist eine Art Overlay in Fresnel-Linsen-Strucktur angebracht, welche die Oberseite je nach Blickwinkel verschieden schimmern lässt.
Der B7 Power ist einer der leichtesten Mini-PC-Vertreter. Mit 363 Gramm wiegt er deutlich weniger als die Intel-NUC-Vertreter (mind. 538 g). Der nächst leichteste Konkurrent ist der Mini-PC von Beelink, aber auch dieser wiegt mit 440 g einiges mehr.
Dafür sind einige Konkurrenten wie die Intel NUCs geringfügig kleiner, ihre Frontseite misst etwa 8 mm kürzer. Der Beelink hat ähnliche Abmessungen.
Ausstattung - USB-C ohne Thunderbolt, aber mit PD
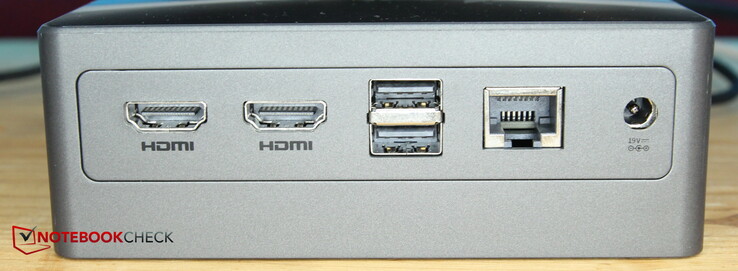
Auf der Rückseite befinden sich alle Ports für die notwendigen Dauerverbindungen, darunter zweimal USB-A zum Anschluss von Maus und Tastatur, zweimal HDMI 2.0 für den Anschluss von bis zu zwei Monitoren, dazu LAN und Strom.
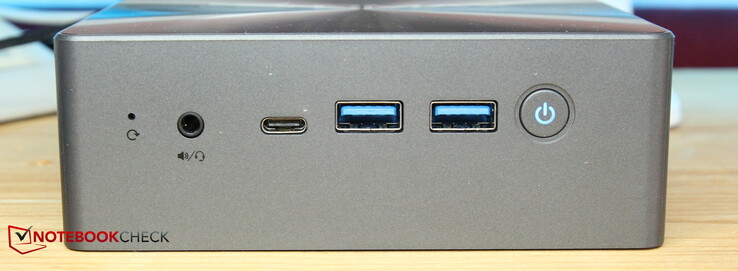
Vorne sitzen dann die zusätzlichen Ports zum Verbinden mit externen USB-Geräten oder Kopfhörern. Hier findet man auch einen USB-C-Port. BMAX gibt hier "full featured" an. Klar ist, dass dieser kein Thunderbolt unterstützt, dafür aber Displayport, sodass insgesamt bis zu drei Monitore an den B7 Power angeschlossen werden können.
Power Delivery unterstützt der Anschluss ebenfalls, wie unser Test mit zwei USB-C-Ladegeräten beweist. Das 30-W-Ladegerät eines MacBook Air funktionierte nicht, dafür aber ein 45 W-Netzteil. Offiziell benötigt der B7 19 V und 2,5 A (47,5 W).
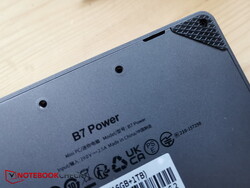
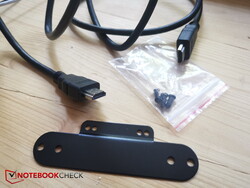
Einen Kartenleser bietet der B7 nicht. Interessant sind noch die Schraubbohrungen auf der Unterseite, durch die sich der Mini-PC beispielsweise über den VESA-Anschluss an die Rückseite eines Monitors anbringen lässt, die dazu notwendige Schiene liefert der Hersteller mit.
Kommunikation
Neben dem Gigabit-LAN-Anschluss beherrscht der B7 Power auch WiFi. Dafür ist ein Chip von Realtek fest verbaut, welches immerhin auch WiFi 6 beherrschen soll. Damit empfängt man auch im 5-GHz-Netz, jedoch noch nicht im 6-GHz-Netz.
So ist der Mini-PC im 5-GHz-Netz recht flott unterwegs. Komplett anders ist der Eindruck jedoch im "normalen" 2,4-GHz-Netz. Hier sind die Übertragungsraten in unserer Testumgebung (Mietwohnung, mehrere überlagernde Netzwerke in der Nähe) geradezu unterirdisch, wir messen nur noch 100 bis 150 Mb/s.
Sicherheit
TPM ist durch den Intel-Chip natürlich an Bord, darüber hinaus bietet der B7 Power jedoch nicht einmal einen Kensington-Anschluss. Bei einem Mini-PC wird diesen aber kaum jemand vermissen.
Zubehör & Garantie
Wartung
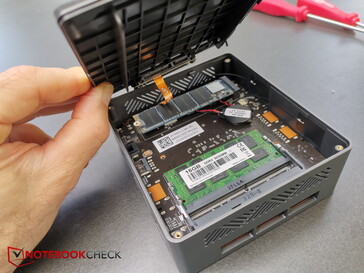
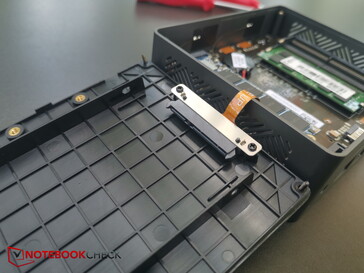
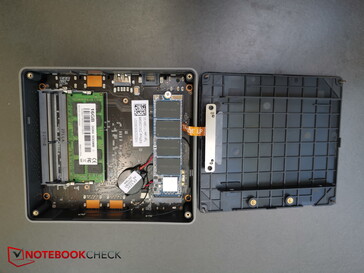
Die Wartung gestaltet sich als angenehm einfach. Lediglich 4 Kreuzschrauben halten die Bodenplatte fest. Nachdem sie gelöst sind, muss man die Unterseite vorsichtig zur Seite hin (von vorne oben gesehen nach links) hochklappen, da an besagter Seite noch ein Flachbandkabel hängt, welches den SATA-Port auf der inneren Bodenplatte mit dem Mainboard verbindet.
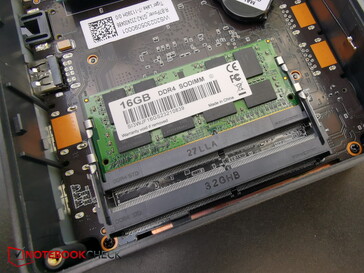
Danach hat man im Inneren Zugriff auf die beiden RAM-Slots, die NVMe-SSD sowie den besagten SATA-Port für 2,5-Zoll-HDDs oder -SSDs. Um an den Lüfter zu kommen, müsste man allerdings weiter demontieren.
Leistung - Selbst für Gen11 langsam
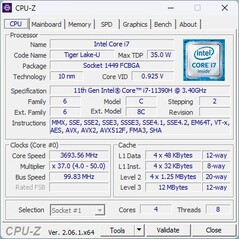
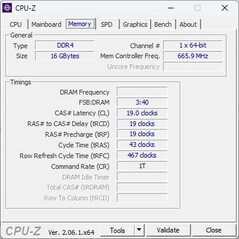
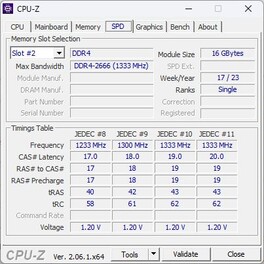
Mit Intel Gen11, spezifisch dem Intel Core i7-11390H, hat der B7 Power grundsätzlich eine gute CPU verbaut, hinkt der aktuellen Technik rund um Intel Gen13 wie im Intel NUC 13 Pro Kit aber dennoch ein paar Jahre hinterher. 16 GB RAM mit Aufrüstmöglichkeit und eine 1 TB große No-Name-SSD komplettieren die Ausstattung. Eine dedizierte Grafikkarte ist nicht vorhanden, dafür agiert die in die CPU integrierte XE Graphics im Vollausbau mit 96 EUs. Verwendung findet der PC vor allem als alltagstaugliches Office-Gerät, vielleicht auch als Retro-Konsole.
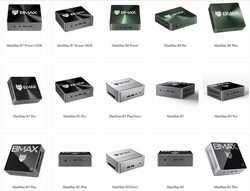
Auf der Webseite von BMAX werden noch zahlreiche anderen Mini-PCs angeboten, darunter auch der B7 Pro mit i5-1145G7, allerdings ist der B7 Power schon das aktuelle Top-Modell des Herstellers.
Testbedingungen
Angenehm leicht kommt der B7 Power daher, Bloatware oder Hersteller-eigene Software wie Control Center sucht man vergeblich. Für die besten Benchmarkergebnisse testen wir im Windows-Modus beste Leistung.
Bei der ersten Inbetriebnahme blieb unser Bildschirm schwarz. Das ließ sich durch die Tastenkombination Windows + P beheben.
Prozessor
Der Intel Core i7-11390H gehört noch der Tiger-Lake-Serie an, zwei seiner 4 Kerne können einzeln auf bis zu 5 GHz hoch-takten. Alle 4 Kerne beherrschen Hyperthreading, wodurch 8 Threads gleichzeitig bearbeitet werden können.
Der Chip kann von 28 bis 35 Watt (TDP) konfiguriert werden, davon abhängig ist der garantierte Basistakt, welcher so von 2,9 (28 W) bis 3,4 GHz (35 W) betragen kann. Beim B7 Power scheint eher das untere TDP-Ende konfiguriert zu sein. In unserer Cinebench-R15-Schleife liegt die Leistungsaufnahme im ersten Durchgang bei rund 30 W. Ab dem zweiten Durchgang erreicht der B7 nur noch 25 W und auch nur sehr kurz, den überwiegenden Rest eines Durchganges erreicht der Mini-PC nur noch knapp 20 W.
Nach dem ersten Cinebench-R15-Durchlauf sinkt die Leistung um etwa 10 Prozent ab und bleibt danach stabil. Allerdings enttäuscht die Leistung insgesamt eher. Natürlich sind der NUC 12 und 13 deutlich voraus, aber selbst der Geekom Mini mit gleicher CPU ist über alle CPU-Tests ganze 17 Prozent schneller. Im Vergleich mit dem durchschnittlichen i7-11390H in unserer Datenbank fällt die CPU-Leistung des B7 Power etwa 13 Prozent schwächer aus. Das bedeutet, dass das Potential der CPU keineswegs ausgeschöpft wird. Selbst der B5 Power mit Intel Gen8 kann im Cinebench kaum abgehängt werden, die beiden Geräte trennen im CPU-Gesamtscore zwar ganze 87 Prozent, in der Cinebench-Schleife sind es hingegen nur etwa 18 Prozent.
Cinebench R15 Multi Dauertest
Cinebench R23: Multi Core | Single Core
Cinebench R20: CPU (Multi Core) | CPU (Single Core)
Cinebench R15: CPU Multi 64Bit | CPU Single 64Bit
Blender: v2.79 BMW27 CPU
7-Zip 18.03: 7z b 4 | 7z b 4 -mmt1
Geekbench 5.5: Multi-Core | Single-Core
HWBOT x265 Benchmark v2.2: 4k Preset
LibreOffice : 20 Documents To PDF
R Benchmark 2.5: Overall mean
| CPU Performance Rating | |
| Durchschnitt der Klasse Mini PC | |
| Intel NUC 13 Pro Kit NUC13ANK | |
| Intel NUC 12 Pro Kit NUC12WSBi5 -2! | |
| Geekom Mini IT11, i7-11390H | |
| Durchschnittliche Intel Core i7-11390H | |
| Beelink SEi11 Pro | |
| BMAX B7 Power G7A2 | |
| BMAX B5 Pro G7H8 | |
| Cinebench R23 / Multi Core | |
| Durchschnitt der Klasse Mini PC (1571 - 39416, n=107, der letzten 2 Jahre) | |
| Intel NUC 13 Pro Kit NUC13ANK | |
| Intel NUC 12 Pro Kit NUC12WSBi5 | |
| Intel NUC 12 Pro Kit NUC12WSBi5 | |
| Intel NUC 12 Pro Kit NUC12WSBi5 | |
| Geekom Mini IT11, i7-11390H | |
| Beelink SEi11 Pro | |
| Durchschnittliche Intel Core i7-11390H (4570 - 6379, n=3) | |
| BMAX B7 Power G7A2 | |
| BMAX B5 Pro G7H8 | |
| Cinebench R23 / Single Core | |
| Intel NUC 13 Pro Kit NUC13ANK | |
| Durchschnitt der Klasse Mini PC (455 - 2303, n=107, der letzten 2 Jahre) | |
| Intel NUC 12 Pro Kit NUC12WSBi5 | |
| Geekom Mini IT11, i7-11390H | |
| Durchschnittliche Intel Core i7-11390H (1407 - 1602, n=3) | |
| Beelink SEi11 Pro | |
| BMAX B7 Power G7A2 | |
| BMAX B5 Pro G7H8 | |
| Cinebench R20 / CPU (Multi Core) | |
| Durchschnitt der Klasse Mini PC (555 - 15041, n=107, der letzten 2 Jahre) | |
| Intel NUC 13 Pro Kit NUC13ANK | |
| Intel NUC 12 Pro Kit NUC12WSBi5 | |
| Geekom Mini IT11, i7-11390H | |
| Beelink SEi11 Pro | |
| Durchschnittliche Intel Core i7-11390H (1767 - 2362, n=3) | |
| BMAX B7 Power G7A2 | |
| BMAX B5 Pro G7H8 | |
| Cinebench R20 / CPU (Single Core) | |
| Intel NUC 13 Pro Kit NUC13ANK | |
| Durchschnitt der Klasse Mini PC (173.6 - 884, n=107, der letzten 2 Jahre) | |
| Intel NUC 12 Pro Kit NUC12WSBi5 | |
| Geekom Mini IT11, i7-11390H | |
| Durchschnittliche Intel Core i7-11390H (550 - 620, n=3) | |
| Beelink SEi11 Pro | |
| BMAX B7 Power G7A2 | |
| BMAX B5 Pro G7H8 | |
| Cinebench R15 / CPU Multi 64Bit | |
| Durchschnitt der Klasse Mini PC (254 - 5881, n=107, der letzten 2 Jahre) | |
| Intel NUC 13 Pro Kit NUC13ANK | |
| Intel NUC 12 Pro Kit NUC12WSBi5 | |
| Intel NUC 12 Pro Kit NUC12WSBi5 | |
| Geekom Mini IT11, i7-11390H | |
| Durchschnittliche Intel Core i7-11390H (775 - 1041, n=3) | |
| Beelink SEi11 Pro | |
| BMAX B7 Power G7A2 | |
| BMAX B5 Pro G7H8 | |
| Cinebench R15 / CPU Single 64Bit | |
| Intel NUC 13 Pro Kit NUC13ANK | |
| Durchschnitt der Klasse Mini PC (78.3 - 340, n=107, der letzten 2 Jahre) | |
| Intel NUC 12 Pro Kit NUC12WSBi5 | |
| Intel NUC 12 Pro Kit NUC12WSBi5 | |
| Geekom Mini IT11, i7-11390H | |
| Durchschnittliche Intel Core i7-11390H (209 - 239, n=3) | |
| Beelink SEi11 Pro | |
| BMAX B7 Power G7A2 | |
| BMAX B5 Pro G7H8 | |
| Blender / v2.79 BMW27 CPU | |
| BMAX B5 Pro G7H8 | |
| BMAX B7 Power G7A2 | |
| Durchschnittliche Intel Core i7-11390H (495 - 665, n=3) | |
| Beelink SEi11 Pro | |
| Geekom Mini IT11, i7-11390H | |
| Durchschnitt der Klasse Mini PC (86 - 2330, n=103, der letzten 2 Jahre) | |
| Intel NUC 12 Pro Kit NUC12WSBi5 | |
| Intel NUC 13 Pro Kit NUC13ANK | |
| 7-Zip 18.03 / 7z b 4 | |
| Durchschnitt der Klasse Mini PC (8146 - 136872, n=102, der letzten 2 Jahre) | |
| Intel NUC 13 Pro Kit NUC13ANK | |
| Intel NUC 12 Pro Kit NUC12WSBi5 | |
| Geekom Mini IT11, i7-11390H | |
| Durchschnittliche Intel Core i7-11390H (20822 - 28173, n=3) | |
| Beelink SEi11 Pro | |
| BMAX B7 Power G7A2 | |
| BMAX B5 Pro G7H8 | |
| 7-Zip 18.03 / 7z b 4 -mmt1 | |
| Intel NUC 13 Pro Kit NUC13ANK | |
| Geekom Mini IT11, i7-11390H | |
| Durchschnitt der Klasse Mini PC (2454 - 7609, n=103, der letzten 2 Jahre) | |
| Durchschnittliche Intel Core i7-11390H (5539 - 5895, n=3) | |
| BMAX B7 Power G7A2 | |
| Intel NUC 12 Pro Kit NUC12WSBi5 | |
| Beelink SEi11 Pro | |
| BMAX B5 Pro G7H8 | |
| Geekbench 5.5 / Multi-Core | |
| Durchschnitt der Klasse Mini PC (1638 - 24593, n=106, der letzten 2 Jahre) | |
| Intel NUC 13 Pro Kit NUC13ANK | |
| Durchschnittliche Intel Core i7-11390H (4457 - 6297, n=4) | |
| Geekom Mini IT11, i7-11390H | |
| Beelink SEi11 Pro | |
| BMAX B7 Power G7A2 | |
| BMAX B5 Pro G7H8 | |
| Geekbench 5.5 / Single-Core | |
| Intel NUC 13 Pro Kit NUC13ANK | |
| Durchschnitt der Klasse Mini PC (466 - 2395, n=106, der letzten 2 Jahre) | |
| Geekom Mini IT11, i7-11390H | |
| Durchschnittliche Intel Core i7-11390H (1486 - 1677, n=4) | |
| Beelink SEi11 Pro | |
| BMAX B7 Power G7A2 | |
| BMAX B5 Pro G7H8 | |
| HWBOT x265 Benchmark v2.2 / 4k Preset | |
| Durchschnitt der Klasse Mini PC (1.5 - 40.3, n=103, der letzten 2 Jahre) | |
| Intel NUC 13 Pro Kit NUC13ANK | |
| Intel NUC 12 Pro Kit NUC12WSBi5 | |
| Geekom Mini IT11, i7-11390H | |
| Beelink SEi11 Pro | |
| Durchschnittliche Intel Core i7-11390H (5.84 - 7.86, n=3) | |
| BMAX B7 Power G7A2 | |
| BMAX B5 Pro G7H8 | |
| LibreOffice / 20 Documents To PDF | |
| BMAX B5 Pro G7H8 | |
| Durchschnitt der Klasse Mini PC (33.1 - 132.6, n=103, der letzten 2 Jahre) | |
| BMAX B7 Power G7A2 | |
| Beelink SEi11 Pro | |
| Intel NUC 12 Pro Kit NUC12WSBi5 | |
| Durchschnittliche Intel Core i7-11390H (43.2 - 52.6, n=3) | |
| Geekom Mini IT11, i7-11390H | |
| Intel NUC 13 Pro Kit NUC13ANK | |
| R Benchmark 2.5 / Overall mean | |
| BMAX B5 Pro G7H8 | |
| Beelink SEi11 Pro | |
| BMAX B7 Power G7A2 | |
| Durchschnittliche Intel Core i7-11390H (0.537 - 0.571, n=3) | |
| Geekom Mini IT11, i7-11390H | |
| Durchschnitt der Klasse Mini PC (0.3517 - 1.56, n=103, der letzten 2 Jahre) | |
| Intel NUC 12 Pro Kit NUC12WSBi5 | |
| Intel NUC 13 Pro Kit NUC13ANK | |
* ... kleinere Werte sind besser
AIDA64: FP32 Ray-Trace | FPU Julia | CPU SHA3 | CPU Queen | FPU SinJulia | FPU Mandel | CPU AES | CPU ZLib | FP64 Ray-Trace | CPU PhotoWorxx
| Performance Rating | |
| Durchschnitt der Klasse Mini PC | |
| Intel NUC 13 Pro Kit NUC13ANK | |
| Intel NUC 12 Pro Kit NUC12WSBi5 | |
| Beelink SEi11 Pro | |
| Durchschnittliche Intel Core i7-11390H | |
| Geekom Mini IT11, i7-11390H | |
| BMAX B7 Power G7A2 | |
| BMAX B5 Pro G7H8 | |
| AIDA64 / FP32 Ray-Trace | |
| Durchschnitt der Klasse Mini PC (974 - 82725, n=104, der letzten 2 Jahre) | |
| Intel NUC 13 Pro Kit NUC13ANK | |
| Beelink SEi11 Pro | |
| Durchschnittliche Intel Core i7-11390H (5904 - 7741, n=4) | |
| Geekom Mini IT11, i7-11390H | |
| Intel NUC 12 Pro Kit NUC12WSBi5 | |
| BMAX B7 Power G7A2 | |
| BMAX B5 Pro G7H8 | |
| AIDA64 / FPU Julia | |
| Durchschnitt der Klasse Mini PC (6115 - 227429, n=104, der letzten 2 Jahre) | |
| Intel NUC 13 Pro Kit NUC13ANK | |
| Beelink SEi11 Pro | |
| Durchschnittliche Intel Core i7-11390H (25054 - 32624, n=4) | |
| Intel NUC 12 Pro Kit NUC12WSBi5 | |
| Geekom Mini IT11, i7-11390H | |
| BMAX B7 Power G7A2 | |
| BMAX B5 Pro G7H8 | |
| AIDA64 / CPU SHA3 | |
| Durchschnitt der Klasse Mini PC (385 - 9475, n=104, der letzten 2 Jahre) | |
| Intel NUC 13 Pro Kit NUC13ANK | |
| Intel NUC 12 Pro Kit NUC12WSBi5 | |
| Beelink SEi11 Pro | |
| Durchschnittliche Intel Core i7-11390H (1747 - 2168, n=4) | |
| Geekom Mini IT11, i7-11390H | |
| BMAX B7 Power G7A2 | |
| BMAX B5 Pro G7H8 | |
| AIDA64 / CPU Queen | |
| Durchschnitt der Klasse Mini PC (20501 - 184747, n=104, der letzten 2 Jahre) | |
| Intel NUC 13 Pro Kit NUC13ANK | |
| Intel NUC 12 Pro Kit NUC12WSBi5 | |
| Durchschnittliche Intel Core i7-11390H (47355 - 58761, n=4) | |
| Geekom Mini IT11, i7-11390H | |
| BMAX B7 Power G7A2 | |
| Beelink SEi11 Pro | |
| BMAX B5 Pro G7H8 | |
| AIDA64 / FPU SinJulia | |
| Durchschnitt der Klasse Mini PC (1019 - 31931, n=104, der letzten 2 Jahre) | |
| Intel NUC 13 Pro Kit NUC13ANK | |
| Intel NUC 12 Pro Kit NUC12WSBi5 | |
| Beelink SEi11 Pro | |
| Durchschnittliche Intel Core i7-11390H (4106 - 5412, n=4) | |
| Geekom Mini IT11, i7-11390H | |
| BMAX B5 Pro G7H8 | |
| BMAX B7 Power G7A2 | |
| AIDA64 / FPU Mandel | |
| Durchschnitt der Klasse Mini PC (3322 - 121827, n=104, der letzten 2 Jahre) | |
| Intel NUC 13 Pro Kit NUC13ANK | |
| Beelink SEi11 Pro | |
| Durchschnittliche Intel Core i7-11390H (15441 - 19348, n=4) | |
| Geekom Mini IT11, i7-11390H | |
| Intel NUC 12 Pro Kit NUC12WSBi5 | |
| BMAX B7 Power G7A2 | |
| BMAX B5 Pro G7H8 | |
| AIDA64 / CPU AES | |
| Intel NUC 13 Pro Kit NUC13ANK | |
| Durchschnitt der Klasse Mini PC (9214 - 325960, n=103, der letzten 2 Jahre) | |
| Beelink SEi11 Pro | |
| Intel NUC 12 Pro Kit NUC12WSBi5 | |
| Durchschnittliche Intel Core i7-11390H (57644 - 77817, n=4) | |
| BMAX B7 Power G7A2 | |
| Geekom Mini IT11, i7-11390H | |
| BMAX B5 Pro G7H8 | |
| AIDA64 / CPU ZLib | |
| Durchschnitt der Klasse Mini PC (127.2 - 2431, n=104, der letzten 2 Jahre) | |
| Intel NUC 12 Pro Kit NUC12WSBi5 | |
| Intel NUC 13 Pro Kit NUC13ANK | |
| Durchschnittliche Intel Core i7-11390H (362 - 424, n=4) | |
| Geekom Mini IT11, i7-11390H | |
| Beelink SEi11 Pro | |
| BMAX B7 Power G7A2 | |
| BMAX B5 Pro G7H8 | |
| AIDA64 / FP64 Ray-Trace | |
| Durchschnitt der Klasse Mini PC (537 - 43587, n=104, der letzten 2 Jahre) | |
| Intel NUC 13 Pro Kit NUC13ANK | |
| Beelink SEi11 Pro | |
| Geekom Mini IT11, i7-11390H | |
| Durchschnittliche Intel Core i7-11390H (3138 - 4197, n=4) | |
| Intel NUC 12 Pro Kit NUC12WSBi5 | |
| BMAX B7 Power G7A2 | |
| BMAX B5 Pro G7H8 | |
| AIDA64 / CPU PhotoWorxx | |
| Durchschnitt der Klasse Mini PC (8069 - 94259, n=104, der letzten 2 Jahre) | |
| Intel NUC 13 Pro Kit NUC13ANK | |
| Intel NUC 12 Pro Kit NUC12WSBi5 | |
| Beelink SEi11 Pro | |
| Geekom Mini IT11, i7-11390H | |
| Durchschnittliche Intel Core i7-11390H (11409 - 39871, n=4) | |
| BMAX B5 Pro G7H8 | |
| BMAX B7 Power G7A2 | |
System Performance
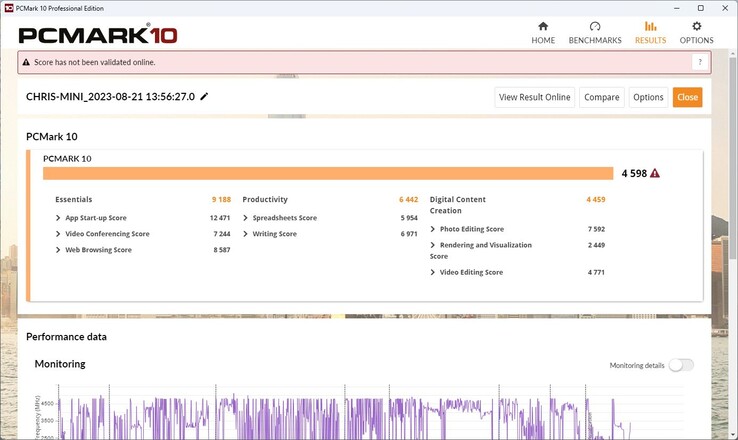
Auch im PCMark 10 hinkt die Leistung einem typischen i7-11390H hinterher und zwar um 9 Prozent. Im CrossMark sind es noch 6 Prozent.
Der Arbeitsalltag mit Browsing und Office-Anwendungen gestaltet sich subjektiv dennoch flüssig.
CrossMark: Overall | Productivity | Creativity | Responsiveness
| PCMark 10 / Score | |
| Durchschnitt der Klasse Mini PC (2191 - 9326, n=109, der letzten 2 Jahre) | |
| Intel NUC 13 Pro Kit NUC13ANK | |
| Intel NUC 12 Pro Kit NUC12WSBi5 | |
| Beelink SEi11 Pro | |
| Durchschnittliche Intel Core i7-11390H, Intel Iris Xe Graphics G7 96EUs (4598 - 5475, n=3) | |
| Geekom Mini IT11, i7-11390H | |
| BMAX B7 Power G7A2 | |
| BMAX B5 Pro G7H8 | |
| PCMark 10 / Essentials | |
| Intel NUC 13 Pro Kit NUC13ANK | |
| Intel NUC 12 Pro Kit NUC12WSBi5 | |
| Beelink SEi11 Pro | |
| Durchschnitt der Klasse Mini PC (5031 - 12286, n=108, der letzten 2 Jahre) | |
| Durchschnittliche Intel Core i7-11390H, Intel Iris Xe Graphics G7 96EUs (9188 - 10451, n=3) | |
| Geekom Mini IT11, i7-11390H | |
| BMAX B7 Power G7A2 | |
| BMAX B5 Pro G7H8 | |
| PCMark 10 / Productivity | |
| Durchschnitt der Klasse Mini PC (3646 - 12260, n=108, der letzten 2 Jahre) | |
| Intel NUC 13 Pro Kit NUC13ANK | |
| Intel NUC 12 Pro Kit NUC12WSBi5 | |
| Beelink SEi11 Pro | |
| Durchschnittliche Intel Core i7-11390H, Intel Iris Xe Graphics G7 96EUs (6442 - 7197, n=3) | |
| Geekom Mini IT11, i7-11390H | |
| BMAX B7 Power G7A2 | |
| BMAX B5 Pro G7H8 | |
| PCMark 10 / Digital Content Creation | |
| Durchschnitt der Klasse Mini PC (1558 - 17556, n=108, der letzten 2 Jahre) | |
| Intel NUC 13 Pro Kit NUC13ANK | |
| Intel NUC 12 Pro Kit NUC12WSBi5 | |
| Durchschnittliche Intel Core i7-11390H, Intel Iris Xe Graphics G7 96EUs (4459 - 5920, n=3) | |
| Beelink SEi11 Pro | |
| Geekom Mini IT11, i7-11390H | |
| BMAX B7 Power G7A2 | |
| BMAX B5 Pro G7H8 | |
| CrossMark / Overall | |
| Intel NUC 13 Pro Kit NUC13ANK | |
| Durchschnitt der Klasse Mini PC (385 - 2244, n=105, der letzten 2 Jahre) | |
| Geekom Mini IT11, i7-11390H | |
| Durchschnittliche Intel Core i7-11390H, Intel Iris Xe Graphics G7 96EUs (1274 - 1438, n=2) | |
| Beelink SEi11 Pro | |
| BMAX B7 Power G7A2 | |
| BMAX B5 Pro G7H8 | |
| CrossMark / Productivity | |
| Intel NUC 13 Pro Kit NUC13ANK | |
| Durchschnitt der Klasse Mini PC (446 - 2790, n=105, der letzten 2 Jahre) | |
| Geekom Mini IT11, i7-11390H | |
| Durchschnittliche Intel Core i7-11390H, Intel Iris Xe Graphics G7 96EUs (1399 - 1523, n=2) | |
| Beelink SEi11 Pro | |
| BMAX B7 Power G7A2 | |
| BMAX B5 Pro G7H8 | |
| CrossMark / Creativity | |
| Intel NUC 13 Pro Kit NUC13ANK | |
| Durchschnitt der Klasse Mini PC (340 - 2879, n=105, der letzten 2 Jahre) | |
| Geekom Mini IT11, i7-11390H | |
| Durchschnittliche Intel Core i7-11390H, Intel Iris Xe Graphics G7 96EUs (1198 - 1359, n=2) | |
| Beelink SEi11 Pro | |
| BMAX B7 Power G7A2 | |
| BMAX B5 Pro G7H8 | |
| CrossMark / Responsiveness | |
| Intel NUC 13 Pro Kit NUC13ANK | |
| Durchschnitt der Klasse Mini PC (363 - 2205, n=105, der letzten 2 Jahre) | |
| Geekom Mini IT11, i7-11390H | |
| Beelink SEi11 Pro | |
| Durchschnittliche Intel Core i7-11390H, Intel Iris Xe Graphics G7 96EUs (1159 - 1434, n=2) | |
| BMAX B7 Power G7A2 | |
| BMAX B5 Pro G7H8 | |
| PCMark 10 Score | 4598 Punkte | |
Hilfe | ||
| AIDA64 / Memory Copy | |
| Durchschnitt der Klasse Mini PC (15933 - 163031, n=104, der letzten 2 Jahre) | |
| Intel NUC 13 Pro Kit NUC13ANK | |
| Intel NUC 12 Pro Kit NUC12WSBi5 | |
| Geekom Mini IT11, i7-11390H | |
| Durchschnittliche Intel Core i7-11390H (19409 - 64750, n=4) | |
| Beelink SEi11 Pro | |
| BMAX B5 Pro G7H8 | |
| BMAX B7 Power G7A2 | |
| AIDA64 / Memory Read | |
| Durchschnitt der Klasse Mini PC (14143 - 123769, n=104, der letzten 2 Jahre) | |
| Intel NUC 12 Pro Kit NUC12WSBi5 | |
| Geekom Mini IT11, i7-11390H | |
| Beelink SEi11 Pro | |
| Intel NUC 13 Pro Kit NUC13ANK | |
| Durchschnittliche Intel Core i7-11390H (21253 - 59793, n=4) | |
| BMAX B5 Pro G7H8 | |
| BMAX B7 Power G7A2 | |
| AIDA64 / Memory Write | |
| Durchschnitt der Klasse Mini PC (10630 - 216693, n=104, der letzten 2 Jahre) | |
| Geekom Mini IT11, i7-11390H | |
| Intel NUC 12 Pro Kit NUC12WSBi5 | |
| Beelink SEi11 Pro | |
| Intel NUC 13 Pro Kit NUC13ANK | |
| Durchschnittliche Intel Core i7-11390H (19684 - 66881, n=4) | |
| BMAX B5 Pro G7H8 | |
| BMAX B7 Power G7A2 | |
| AIDA64 / Memory Latency | |
| Durchschnitt der Klasse Mini PC (82.3 - 184.8, n=104, der letzten 2 Jahre) | |
| Intel NUC 13 Pro Kit NUC13ANK | |
| BMAX B5 Pro G7H8 | |
| Intel NUC 12 Pro Kit NUC12WSBi5 | |
| Beelink SEi11 Pro | |
| Durchschnittliche Intel Core i7-11390H (66.3 - 95.3, n=4) | |
| Geekom Mini IT11, i7-11390H | |
| BMAX B7 Power G7A2 | |
* ... kleinere Werte sind besser
DPC-Latenzen
Der Aufruf unserer Webseiten bringt den Würfel-PC nicht in Schwierigkeiten. Auch das Öffnen mehrerer Tabs auf unserer Homepage nicht, ganz im Gegenteil zu den meisten aktuellen Gaming-Laptops.
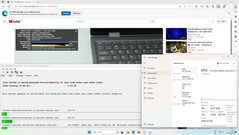
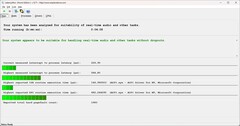
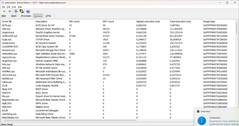
Dafür läuft die Wiedergabe unseres 4K/60-fps-YouTubevideos nicht ganz perfekt, es werden drei ausgelassene Frames angezeigt, ansonsten lief das Video jedoch flüssig. Damit ist der B7 für die Wiedergabe von Echtzeitaudio & Co geeignet.
Im Vergleich sind die Latenzen bei den Intel NUCs höher, die Last-Gen-Mini-PCs von Geekom und Beelink schneiden aber nochmals knapp besser ab.
| DPC Latencies / LatencyMon - interrupt to process latency (max), Web, Youtube, Prime95 | |
| Intel NUC 13 Pro Kit NUC13ANK | |
| Intel NUC 12 Pro Kit NUC12WSBi5 | |
| BMAX B7 Power G7A2 | |
| Geekom Mini IT11, i7-11390H | |
| BMAX B5 Pro G7H8 | |
| Beelink SEi11 Pro | |
* ... kleinere Werte sind besser
Massenspeicher
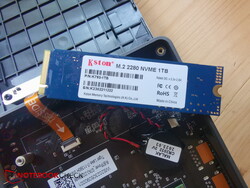
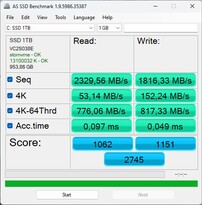
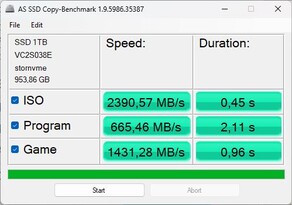
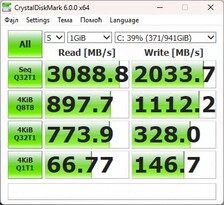
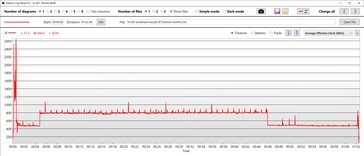
BMAX verbaut eine SSD mit 1 TB - und genauso ist das Medium auch überall in Windows und sogar dem BIOS gelabelt. Überall steht nur ""SSD 1 TB". Um das Modell und den Hersteller zu ermitteln, muss man den B7 Power schon aufschrauben und die SSD ausbauen. Auf der Rückseite befindet sich dann das Typenschild. Eine "Kston K765-1TB" dürfte hierzulande dennoch recht unbekannt sein. Wirklich verstecken muss sie sich dennoch nicht, sie kommt im Vergleich auf ordentliche Übertragungswerte, nur die Samsung-SSD im NUC 13 ist über alle Tests hinweg deutlich schneller.
* ... kleinere Werte sind besser
Dauerleistung Lesen: DiskSpd Read Loop, Queue Depth 8
Grafikkarte
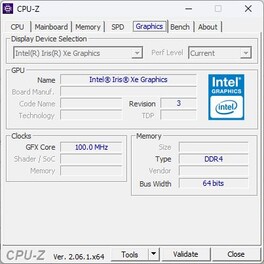
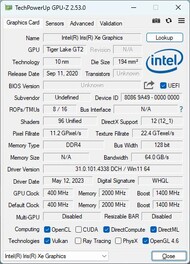
Als Grafikkarte dient die in den Prozessor integrierte Intel Iris Xe Graphics G7 96EUs. Je nach Prozessor und Leistungsaufnahme kann ihre Leistung stark variieren.
Auch im Bereich der 3D-Benchmarks ist die Leistung stark unterdurchschnittlich. Im Schnitt leistet die Xe Graphics G7 96 EUs in unserer Datenbank 51 Prozent mehr! Immerhin kann sich der B7 Power vom B5 mit Intel UHD Graphics 620 um 118 Prozent absetzen. Dennoch ist die Leistung deutlich zu schwach, die verbaute Hardware stark gedrosselt. Die Konkurrenz mit gleicher iGPU streut viel dichter um die Durchschnittswerte herum und liegt somit deutlich vor dem B7. Der NUC 13 Pro führt das Feld wenig überraschend an.
| 3DMark 11 Performance | 4743 Punkte | |
| 3DMark Cloud Gate Standard Score | 13442 Punkte | |
| 3DMark Fire Strike Score | 2546 Punkte | |
| 3DMark Time Spy Score | 1103 Punkte | |
Hilfe | ||
* ... kleinere Werte sind besser
Gaming Performance
Für Gaming ist der B7 trotz "Power" im Namen nicht bestimmt, hier geht es eher um die Alltagsverwendung als Office-Gerät.
In Witcher 3 Ultra kommt der PC auf nur 8 bis 9 fps durchschnittlich. Der Geekom Mini IT11 mit gleicher CPU/iGPU ist hier 30 Prozent schneller. Der Beelink SEi11 Pro ist beim Gaming trotz leicht schwächerer CPU beiden voraus.
In der niedrigsten Auflösung und den niedrigsten Details kommt man in Witcher 3 immerhin auf 48 fps im Schnitt. Noch um die 30 fps erreicht man unter 720p und Medium-Details.
Far Cry 5 ist auch in den niedrigsten Einstellungen (1.280 x 720, Low) praktisch kaum spielbar (~ 29 fps). Daher eignen sich, wenn überhaupt, nur ältere oder wenig anspruchsvolle Spiele, und auch diese oftmals nur in reduzierten Einstellungen. Empfehlen können wir hingegen die Verwendung als Retro-Konsole, beispielsweise mit RetroArch.
| Performance Rating - Percent | |
| Durchschnitt der Klasse Mini PC | |
| Intel NUC 13 Pro Kit NUC13ANK -3! | |
| Beelink SEi11 Pro -1! | |
| Intel NUC 12 Pro Kit NUC12WSBi5 -5! | |
| Geekom Mini IT11, i7-11390H -2! | |
| BMAX B7 Power G7A2 | |
| BMAX B5 Pro G7H8 -5! | |
| The Witcher 3 - 1920x1080 Ultra Graphics & Postprocessing (HBAO+) | |
| Durchschnitt der Klasse Mini PC (13.7 - 264, n=59, der letzten 2 Jahre) | |
| Intel NUC 13 Pro Kit NUC13ANK | |
| Beelink SEi11 Pro | |
| Geekom Mini IT11, i7-11390H | |
| BMAX B7 Power G7A2 | |
| GTA V - 1920x1080 Highest AA:4xMSAA + FX AF:16x | |
| Durchschnitt der Klasse Mini PC (2.71 - 124.7, n=80, der letzten 2 Jahre) | |
| Geekom Mini IT11, i7-11390H | |
| Geekom Mini IT11, i7-11390H | |
| BMAX B7 Power G7A2 | |
| Final Fantasy XV Benchmark - 1920x1080 High Quality | |
| Durchschnitt der Klasse Mini PC (4.49 - 209, n=101, der letzten 2 Jahre) | |
| Beelink SEi11 Pro | |
| BMAX B7 Power G7A2 | |
| Strange Brigade - 1920x1080 ultra AA:ultra AF:16 | |
| Durchschnitt der Klasse Mini PC (14.6 - 245, n=60, der letzten 2 Jahre) | |
| Intel NUC 13 Pro Kit NUC13ANK | |
| Beelink SEi11 Pro | |
| Geekom Mini IT11, i7-11390H | |
| BMAX B7 Power G7A2 | |
| Dota 2 Reborn - 1920x1080 ultra (3/3) best looking | |
| Durchschnitt der Klasse Mini PC (8.2 - 213, n=105, der letzten 2 Jahre) | |
| Intel NUC 13 Pro Kit NUC13ANK | |
| Beelink SEi11 Pro | |
| Geekom Mini IT11, i7-11390H | |
| Intel NUC 12 Pro Kit NUC12WSBi5 | |
| BMAX B7 Power G7A2 | |
| BMAX B5 Pro G7H8 | |
| X-Plane 11.11 - 1920x1080 high (fps_test=3) | |
| Durchschnitt der Klasse Mini PC (4.77 - 147.9, n=88, der letzten 2 Jahre) | |
| Beelink SEi11 Pro | |
| BMAX B7 Power G7A2 | |
Die Leistung in Witcher 3 über eine Stunde hinweg fluktuiert stark, was auf thermische Drosselung hindeutet. Zumindest das Tool CapframeX misst fluktuierende Werte zwischen 7 und etwa 20 fps. Letztere werden nur sehr sprunghaft erreicht, die durchschnittliche fps-Zahl liegt bei 8,8.
Witcher 3 FPS-Diagramm
| min. | mittel | hoch | max. | |
|---|---|---|---|---|
| GTA V (2015) | 56.4 | 44.8 | 4.13 | |
| The Witcher 3 (2015) | 48.4 | 31.3 | 8.8 | |
| Dota 2 Reborn (2015) | 92.3 | 64.9 | 32.9 | 29.6 |
| Final Fantasy XV Benchmark (2018) | 22.1 | 10.5 | 8.15 | |
| X-Plane 11.11 (2018) | 38 | 30 | 27.9 | |
| Far Cry 5 (2018) | 29 | |||
| Strange Brigade (2018) | 49 | 18.2 | 15.4 | 13.2 |
| Diablo 4 (2023) | 16.3 |
Emissionen - Leiser B7 Power
Geräuschemissionen
Ok, die Leistung ist unterdurchschnittlich, aber macht das B7 Power das wenigstens bei den Emissionen wieder wett und stellt sich als ruhiger, sparsamer Mini-PC dar?
Der B7 Power verfügt über einen einzelnen Lüfter. Dieser ist nach kurzer Zeit auch im Idle aktiv, allerdings muss man schon mit dem Ohr an das Gehäuse herangehen, um die rund 25 dB wirklich hören zu können. Und selbst unter maximaler Last säuselt der Lüfter mit kaum wahrnehmbaren 27 dB vor sich hin.
Der leistungsstärkere NUC 13 dröhnt dagegen mit bis über 40 dB deutlich lauter. Der B7 Power ist der mit Abstand leiseste Mini-PC im Vergleich.
Lautstärkediagramm
| Idle |
| 23 / 25.12 / 25.12 dB(A) |
| Last |
| 27.15 / 27.15 dB(A) |
 | ||
30 dB leise 40 dB(A) deutlich hörbar 50 dB(A) störend |
||
min: | ||
| BMAX B7 Power G7A2 Iris Xe G7 96EUs, i7-11390H, Kston K765-1TB | Geekom Mini IT11, i7-11390H Iris Xe G7 96EUs, i7-11390H, Lexar 1024GB LNM6A1X001T-HNNNG | Intel NUC 13 Pro Kit NUC13ANK Iris Xe G7 96EUs, i7-1360P, Samsung PM9A1 MZVL2512HCJQ | Beelink SEi11 Pro Iris Xe G7 96EUs, i5-11320H, Kingston NV1 SNVS/500GCN | BMAX B5 Pro G7H8 UHD Graphics 620, i5-8260U | |
|---|---|---|---|---|---|
| Geräuschentwicklung | -23% | -35% | -13% | -7% | |
| aus / Umgebung * (dB) | 23 | 29.7 -29% | 29.8 -30% | 22.8 1% | 23 -0% |
| Idle min * (dB) | 23 | 30.2 -31% | 30.2 -31% | 24.7 -7% | 25.1 -9% |
| Idle avg * (dB) | 25.12 | 30.2 -20% | 31.1 -24% | 24.7 2% | 25.1 -0% |
| Idle max * (dB) | 25.12 | 30.2 -20% | 31.9 -27% | 25.3 -1% | 25.1 -0% |
| Last avg * (dB) | 27.15 | 30.6 -13% | 40 -47% | 33.2 -22% | 28.6 -5% |
| Witcher 3 ultra * (dB) | 27.15 | 30.5 -12% | 34.5 -27% | 30.1 -11% | |
| Last max * (dB) | 27.15 | 36.4 -34% | 40.5 -49% | 37.8 -39% | 34 -25% |
* ... kleinere Werte sind besser
Temperatur
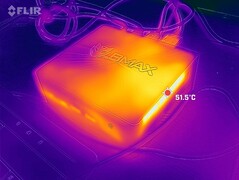
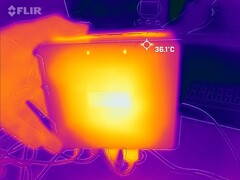
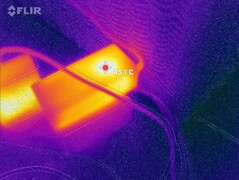
Der ruhige Lüfter sorgt jedoch auch für recht hohe Temperaturen. Allerdings nur im Bereich der Luftgitter, oben und unten bleibt der B7 mit maximal 43 °C beim Stress oder Gaming durchschnittlich warm. Im Bereich des Luftaustritts auf der rechten Seite messen wir hingegen bis zu 54 °C.
(±) Die maximale Temperatur auf der Oberseite ist 43 °C. Im Vergleich liegt der Klassendurchschnitt bei 35.8 °C (von 20.6 bis 69.5 °C für die Klasse Mini PC).
(±) Auf der Unterseite messen wir eine maximalen Wert von 42 °C (im Vergleich zum Durchschnitt von 36.3 °C).
(±) Ohne Last messen wir eine durchschnittliche Temperatur von 35.2 °C auf der Oberseite. Der Klassendurchschnitt erreicht 32.4 °C.
Stresstest
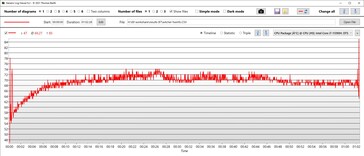
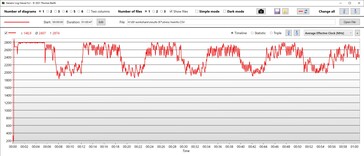
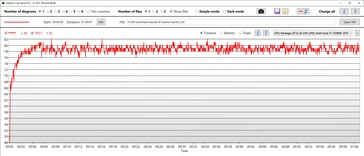
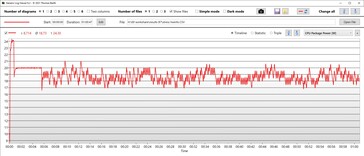
Im Stresstest laufen Prime95 und Furmark gleichzeitig. Die CPU taktet kurz auf über 2,8 GHz hoch, nach einem kurzen Einbruch kann der Prozessor für die folgenden fünf Minuten einen Takt von 2,8 GHz halten, danach bricht dieser zyklisch immer wieder auf 1,8 bis 2,3 GHz ein. Dabei steigen die einzelnen Kerntemperaturen nie höher als bis auf 78°C. Die CPU als Gesamtpaket erhitzt sich allerdings auf bis zu 82 °C, im Schnitt werden hier 78 °C eingehalten.
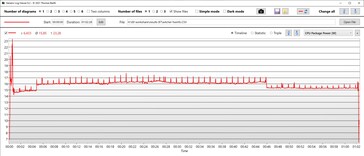
Die CPU-Leistungsaufnahme liegt anfangs bei 24 W, im Schnitt jedoch nur bei etwa 19 W.
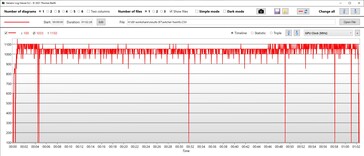
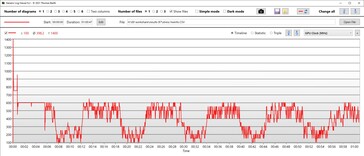
Die integrierte GPU taktet ganz kurz mit 1,4 GHz, danach findet hier das gleiche, periodische Absinken des Taktes von etwa 600 MHz auf 100 bis 350 MHz statt. Im Schnitt taktet die Grafikeinheit mit 400 MHz.
| CPU Clock (GHz) | GPU Clock (MHz) | Average CPU Temperature (°C) | Average GPU Temperature (°C) | |
| Prime95 + FurMark Stress | 2,4 | 400 | 79 | 79 |
| Witcher 3 Stress | 0,7 | 1033 | 69 | 69 |
Energieverwaltung - Sehr sparsamer Bmax B7
Energieaufnahme
Generell ist der B7 Power sehr sparsam. Im Idle messen wir je nach Energiemodus zwischen 9 und 10 W. Seine Sparsamkeit stellt der B7 vor allem unter Last unter Beweis.
Der absolute Maximalverbrauch liegt bei temporär knapp unter 44 W, im Schnitt verbraucht der B7 Power aber nicht mehr als 35 W dauerhaft. Das kleine Netzteil ist auf 47,5 W ausgelegt (19 V und 2,5 A), alternativ kann man den B7 auch via USB-C-Netzteil betreiben, sofern dieses den Mindestvorgaben entspricht.
Achtung: Ist der B7 ausgeschaltet, so verbraucht er immer noch beinahe 1 W. Zudem schleifen die USB-Ports Strom durch. So wird unsere RGB-Maus auch im ausgeschalteten Zustand weiter beleuchtet. Ohne Tastatur und Maus verbraucht der B7 ausgeschaltet 830 mW, mit Maus und Tastatur liegt der Verbrauch teils über 1 W. Je nach Anwendungsfall bietet sich also eine Schaltersteckdose für den B7 Power an.
| Aus / Standby | |
| Idle | |
| Last |
|
Legende:
min: | |
| BMAX B7 Power G7A2 i7-11390H, Iris Xe G7 96EUs, Kston K765-1TB, , x, | Geekom Mini IT11, i7-11390H i7-11390H, Iris Xe G7 96EUs, Lexar 1024GB LNM6A1X001T-HNNNG, , x, | Intel NUC 13 Pro Kit NUC13ANK i7-1360P, Iris Xe G7 96EUs, Samsung PM9A1 MZVL2512HCJQ, , x, | Beelink SEi11 Pro i5-11320H, Iris Xe G7 96EUs, Kingston NV1 SNVS/500GCN, , x, | BMAX B5 Pro G7H8 i5-8260U, UHD Graphics 620, , , x, | Durchschnittliche Intel Iris Xe Graphics G7 96EUs | Durchschnitt der Klasse Mini PC | |
|---|---|---|---|---|---|---|---|
| Stromverbrauch | -8% | -61% | -48% | -8% | -28% | -92% | |
| Idle min * (Watt) | 9.1 | 7.3 20% | 5.1 44% | 9.8 -8% | 6 34% | 5.51 ? 39% | 9.19 ? -1% |
| Idle avg * (Watt) | 9.5 | 7.8 18% | 5.8 39% | 10.3 -8% | 6.2 35% | 8.66 ? 9% | 11.3 ? -19% |
| Idle max * (Watt) | 10 | 8.4 16% | 10.2 -2% | 10.5 -5% | 6.3 37% | 10.9 ? -9% | 14.8 ? -48% |
| Last avg * (Watt) | 27.1 | 28.7 -6% | 68.1 -151% | 54.2 -100% | 42.8 -58% | 45.6 ? -68% | 65.5 ? -142% |
| Witcher 3 ultra * (Watt) | 29.1 | 53.1 -82% | 35 -20% | ||||
| Last max * (Watt) | 32.3 | 61.1 -89% | 108.3 -235% | 59 -83% | 55.8 -73% | 67.8 ? -110% | 112.7 ? -249% |
* ... kleinere Werte sind besser
Energieaufnahme mit externem Monitor
Pro
Contra
Fazit - Eher "B7 Economical"
Der Bmax B7 Power erweckt unnötig einen falschen Eindruck. Der verbaute Prozessor ist von der vorletzten Generation und selbst für dessen Verhältnisse sehr langsam, da gedrosselt. Dabei muss sich der B7 aber nicht schämen, denn seine Stärken, nämlich Laufruhe und Sparsamkeit, empfehlen ihn für ganz andere Einsatzzwecke.
Gut eignet sich der X86-Mini-PC für alle Anwendungen, bei denen eine gewisse Leistung mit möglichst wenig Energieverbrauch und hoher Laufruhe gefragt sind. Davon gibt es reichlich, zum Beispiel als Homeserver, als Retrokonsole und und und. Der B7 Power wird einfach falsch vermarktet. Wer jetzt noch einen Intel Gen11 kauft schielt eh nicht auf die höchste Leistung, daher sollte man lieber mit den wahren Stärken des B7 werben. Ein B7 Powerserver oder B7 Homeserver oder B7 Efficient wären wohl passendere Bezeichnungen.
Wer maximale "Power" sucht, ist beim Bmax B7 Power mit gedrosselter Gen11-CPU falsch, wer ein kleines, ruhiges und sparsames X86-Gerät für einen Homeserver oder ähnliche Anwendungsfelder sucht, ist hingegen genau richtig.
Preis und Verfügbarkeit
Auf der Webseite von Bmax war der Mini-PC lange ausverkauft und ist erst jetzt wieder verfügbar, allerdings zum sehr hohen Preis von 399,99 US-Dollar. Bei Amazon kommt man mit "70 -€-Coupon" auf 369,99 Euro. Allerdings gab es den B7 Power auch schon für rund 320 Euro, bei Geekbying kostet unser Testmodell aktuell rund 360 Euro. Es lohnt sich also die Augen nach einem guten Angebot offen zu halten, insbesondere in den Importshops.
BMAX B7 Power G7A2
- 12.09.2023 v7 (old)
Christian Hintze
Transparenz
Die Auswahl der zu testenden Geräte erfolgt innerhalb der Redaktion. Das vorliegende Testmuster wurde dem Autor vom Hersteller oder einem Shop zu Testzwecken leihweise zur Verfügung gestellt. Eine Einflussnahme des Leihstellers auf den Testbericht gab es nicht, der Hersteller erhielt keine Version des Reviews vor der Veröffentlichung. Es bestand keine Verpflichtung zur Publikation. Als eigenständiges, unabhängiges Unternehmen unterliegt Notebookcheck keiner Diktion von Herstellern, Shops und Verlagen.
So testet Notebookcheck
Pro Jahr werden von Notebookcheck hunderte Laptops und Smartphones unabhängig in von uns standardisierten technischen Verfahren getestet, um eine Vergleichbarkeit aller Testergebnisse zu gewährleisten. Seit rund 20 Jahren entwickeln wir diese Testmethoden kontinuierlich weiter und setzen damit Branchenstandards. In unseren Testlaboren kommt ausschließlich hochwertiges Messequipment in die Hände erfahrener Techniker und Redakteure. Die Tests unterliegen einer mehrstufigen Kontrolle. Unsere komplexe Gesamtbewertung basiert auf hunderten fundierten Messergebnissen und Benchmarks, womit Ihnen Objektivität garantiert ist. Weitere Informationen zu unseren Testmethoden gibt es hier.


