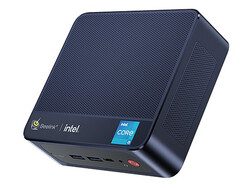
Beelink SEi11 im Test: Günstiger als ein Intel NUC 11, aber genau so schnell ↺
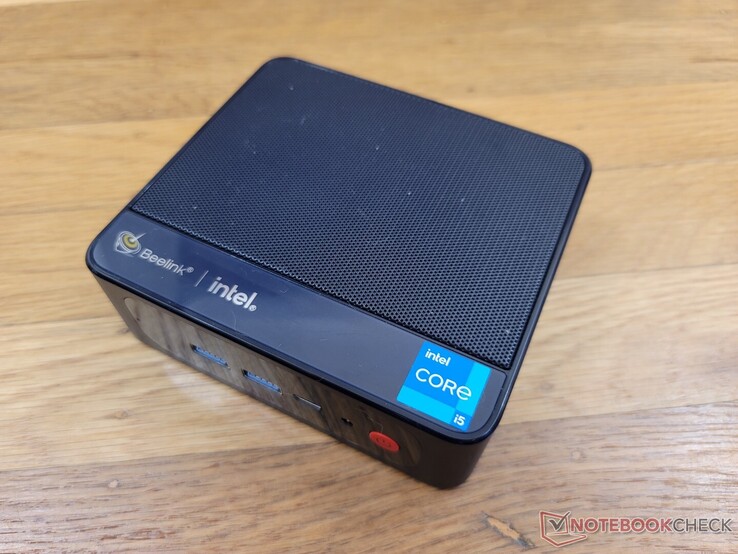
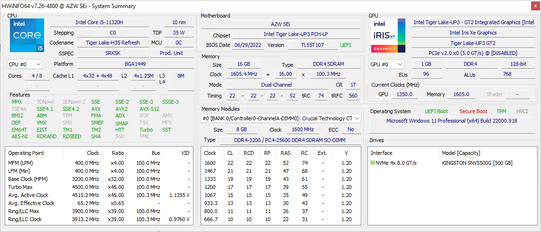
Im Gegensatz zum Beelink GTI 11 wird der SEi11 von einer CPU der Intel-Core-H-Serie statt der Core-U-Serie angetrieben. Derzeit ist nur eine Konfiguration mit dem 11. Generation Tiger Lake-H Core i5-11320H, 16 GB RAM und 500-GB-NVMe-SSD für etwa 589 Euro erhältlich.
Der SEi11 konkurriert direkt mit der Intel NUC-Serie wie dem NUC11PAQ oder NUC11TNK
Mehr Beelink Tests:
Potentielle Konkurrenten im Vergleich
Bew. | Datum | Modell | Gewicht | Dicke | Größe | Auflösung | Preis ab |
|---|---|---|---|---|---|---|---|
v (old) | 09 / 2022 | Beelink SEi11 Pro i5-11320H, Iris Xe G7 96EUs | 440 g | 40 mm | x | ||
v (old) | 02 / 2022 | Beelink GTR5 R9 5900HX, Vega 8 | 686 g | 39 mm | x | ||
v (old) | Beelink GTI 11 i5-1135G7, Iris Xe G7 80EUs | 638 g | 39 mm | x | |||
v (old) | Beelink SER4 R7 4800U, Vega 8 | 494 g | 40 mm | x | |||
v (old) | 04 / 2021 | Intel NUC11TNKi5 i5-1135G7, Iris Xe G7 80EUs | 504 g | 37 mm | x |
Gehäuse
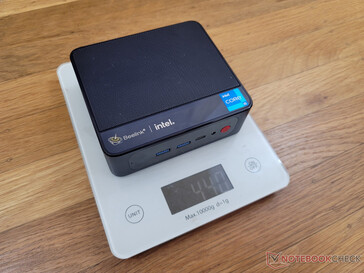
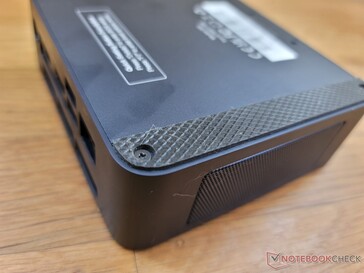
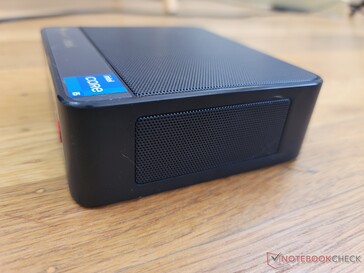
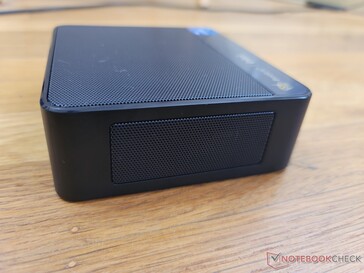
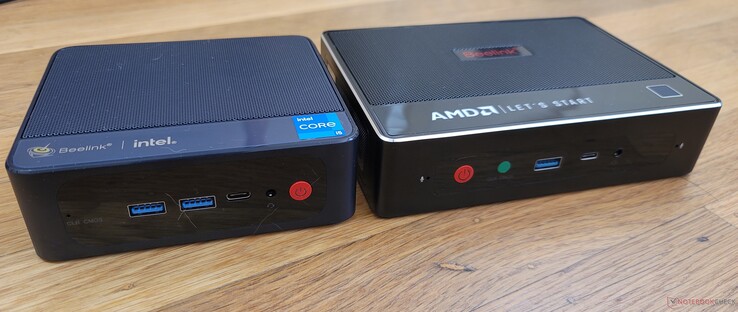
Das Gehäuse ist im Wesentlichen die Intel Version des AMD betriebenen Beelink SER4. Abmessungen und Aufbau sind fast identisch, aber der SEi11 ist etwa 50 Gramm leichter, was wahrscheinlich auf einige kleinere interne Änderungen zurückzuführen ist. Optisch fehlt dem Gerät das rote Mesh an den Seiten sowie die verchromten Kanten und Ecken des SER4.
Anschlüsse
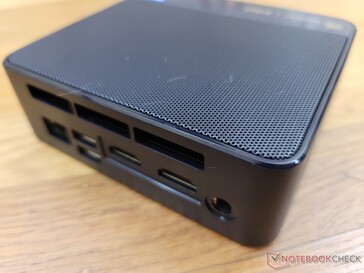
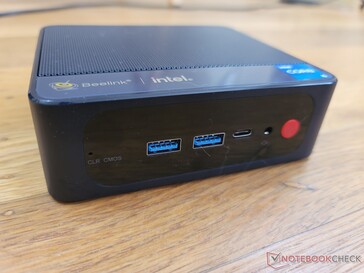
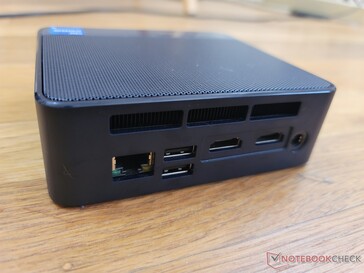
Die Anschlussoptionen und Positionierung der Anschlüsse sind mit denen des SER4 identisch. Nicht zu vergessen ist, dass der USB-C und der Port DisplayPort Stromzufuhr nicht unterstützen, sie sind also nur für Datenübertragung oder das Laden externer Geräte geeignet. Wir haben versucht, externe USB-C-Monitore und USB-C-Adapter mit dem Gerät zu verbinden, allerdings funktionierten keine von beiden mit dem SEi11.
Kommunikation
Das Gerät wird mit dem relativ neuen MediaTek RZ608 mit Wi-Fi 6E und Bluetooth 5.2 ausgeliefert. Leider ist das Modul weder so zuverlässig noch so schnell wie die üblichen Intel-AX-Lösungen. Wenn es mit unserem 6-GHz-Netzwerk verbunden ist, erreichen die Übertragungsraten nur ~750 Mbps, verglichen mit fast dem Doppelten eines Intel AX201 oder AX210. Außerdem hatte das System Probleme, unser 6-GHz-Netzwerk überhaupt zu erkennen.
| Networking | |
| iperf3 transmit AX12 | |
| Intel NUC11TNKi5 | |
| Beelink GTI 11 | |
| Beelink SER4 | |
| Beelink GTR5 | |
| iperf3 receive AX12 | |
| Intel NUC11TNKi5 | |
| Beelink GTI 11 | |
| Beelink SER4 | |
| Beelink GTR5 | |
| iperf3 receive AXE11000 6GHz | |
| Beelink SEi11 Pro | |
| iperf3 transmit AXE11000 6GHz | |
| Beelink SEi11 Pro | |
Wartung
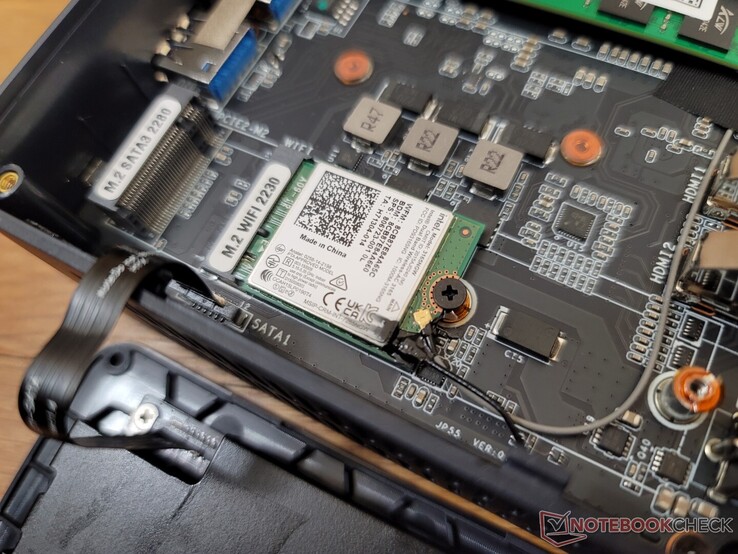
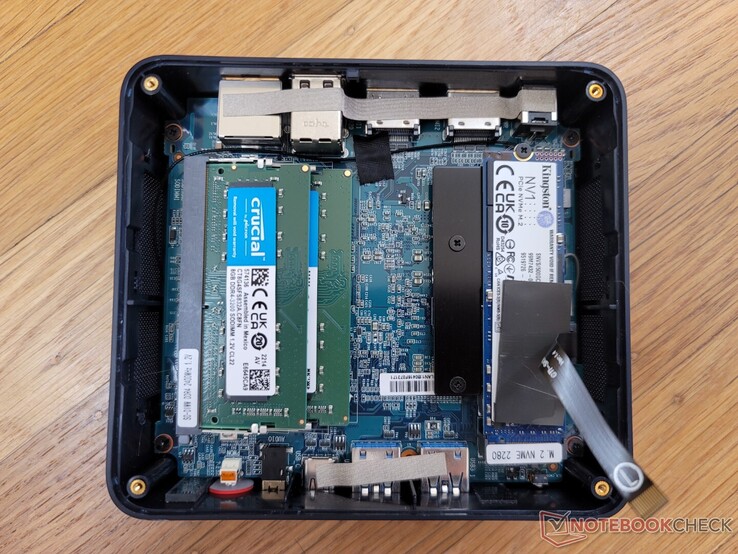
Die Bodenplatte ist mit vier Philips Schrauben befestigt. Um sie tatsächlich zu entfernen, empfehlen wir jedoch, die VESA-Halterung anzubringen, damit sie als Griff verwendet werden kann, um die flache Platte herauszuziehen.
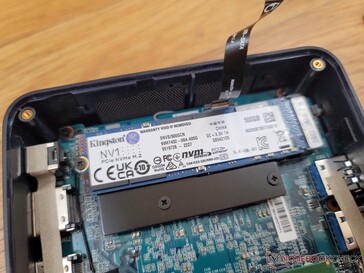
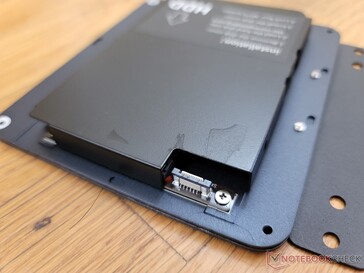
Der Nutzer hat direkten Zugriff auf den M.2-2280-SSD-Steckplatz, den 2,5-Zoll-SATA-III-Schacht, das WLAN-Modul und die 2x-DDR4-SODIMM-Steckplätze.
Zubehör und Garantie
Im Lieferumfang enthalten sind zwei HDMI-Kabel, ein Netzadapter, Papierkram, eine VESA-Halterung und zusätzliche Schrauben.
Abgesehen von der üblichen gesetzlichen Garantie erhält man beim SEi11 Mini ein Jahr Bring-in.
Leistung
Testbedingungen
Wir haben unser Gerät über Windows in den Performance-Modus versetzt, bevor wir die folgenden Benchmarks durchgeführt haben. Es gibt keine vorinstallierte Anwendung im Stil eines Control Centers, um die Leistung der CPU anzupassen.
Prozessor
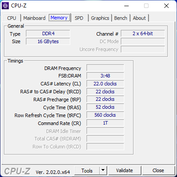
Die Core i5-11320H ist eine selten genutzte CPU, da die meisten anderen PCs mit Tiger-Lake-H-CPUs normalerweise den Core i5-11300H nutzen. Die Leistung des i5-11320H ist in jeder Hinsicht gleich. Auf dem Papier gibt es geringfügige Unterschiede in der Taktrate, die nach unseren Beobachtungen mit dem Beelink in den meisten Anwendungen keine Auswirkungen haben.
Cinebench R15 Multi Loop
Cinebench R23: Multi Core | Single Core
Cinebench R15: CPU Multi 64Bit | CPU Single 64Bit
Blender: v2.79 BMW27 CPU
7-Zip 18.03: 7z b 4 | 7z b 4 -mmt1
Geekbench 5.5: Multi-Core | Single-Core
HWBOT x265 Benchmark v2.2: 4k Preset
LibreOffice : 20 Documents To PDF
R Benchmark 2.5: Overall mean
| Cinebench R20 / CPU (Multi Core) | |
| Honor MagicBook 14 2022 | |
| Beelink GTR5 | |
| Lenovo IdeaPad Gaming 3 15ARH7 | |
| Beelink SER4 | |
| Minipc Union Ace Magician AMR5 | |
| Dell Inspiron 15 Plus | |
| Razer Blade 15 Advanced Model Early 2021 | |
| Durchschnittliche Intel Core i5-11320H (2208 - 2349, n=4) | |
| Lenovo Ideapad Gaming 3 15IHU-82K1002RGE | |
| Beelink SEi11 Pro | |
| Prime Computer PrimeBook Circular-i7-1165G7 | |
| Intel NUC11TNKi5 | |
| Cinebench R20 / CPU (Single Core) | |
| Honor MagicBook 14 2022 | |
| Beelink GTR5 | |
| Prime Computer PrimeBook Circular-i7-1165G7 | |
| Lenovo IdeaPad Gaming 3 15ARH7 | |
| Dell Inspiron 15 Plus | |
| Beelink SEi11 Pro | |
| Durchschnittliche Intel Core i5-11320H (557 - 567, n=4) | |
| Minipc Union Ace Magician AMR5 | |
| Intel NUC11TNKi5 | |
| Lenovo Ideapad Gaming 3 15IHU-82K1002RGE | |
| Beelink SER4 | |
| Razer Blade 15 Advanced Model Early 2021 | |
| Cinebench R23 / Multi Core | |
| Honor MagicBook 14 2022 | |
| Beelink GTR5 | |
| Lenovo IdeaPad Gaming 3 15ARH7 | |
| Beelink SER4 | |
| Dell Inspiron 15 Plus | |
| Minipc Union Ace Magician AMR5 | |
| Razer Blade 15 Advanced Model Early 2021 | |
| Durchschnittliche Intel Core i5-11320H (5720 - 6051, n=4) | |
| Beelink SEi11 Pro | |
| Lenovo Ideapad Gaming 3 15IHU-82K1002RGE | |
| Prime Computer PrimeBook Circular-i7-1165G7 | |
| Intel NUC11TNKi5 | |
| Cinebench R23 / Single Core | |
| Honor MagicBook 14 2022 | |
| Beelink GTR5 | |
| Prime Computer PrimeBook Circular-i7-1165G7 | |
| Beelink SEi11 Pro | |
| Dell Inspiron 15 Plus | |
| Lenovo IdeaPad Gaming 3 15ARH7 | |
| Durchschnittliche Intel Core i5-11320H (1341 - 1467, n=4) | |
| Minipc Union Ace Magician AMR5 | |
| Intel NUC11TNKi5 | |
| Lenovo Ideapad Gaming 3 15IHU-82K1002RGE | |
| Beelink SER4 | |
| Razer Blade 15 Advanced Model Early 2021 | |
| Cinebench R15 / CPU Multi 64Bit | |
| Honor MagicBook 14 2022 | |
| Honor MagicBook 14 2022 | |
| Beelink GTR5 | |
| Lenovo IdeaPad Gaming 3 15ARH7 | |
| Beelink SER4 | |
| Minipc Union Ace Magician AMR5 | |
| Dell Inspiron 15 Plus | |
| Razer Blade 15 Advanced Model Early 2021 | |
| Lenovo Ideapad Gaming 3 15IHU-82K1002RGE | |
| Durchschnittliche Intel Core i5-11320H (857 - 1019, n=4) | |
| Beelink SEi11 Pro | |
| Prime Computer PrimeBook Circular-i7-1165G7 | |
| Intel NUC11TNKi5 | |
| Cinebench R15 / CPU Single 64Bit | |
| Beelink GTR5 | |
| Honor MagicBook 14 2022 | |
| Lenovo IdeaPad Gaming 3 15ARH7 | |
| Minipc Union Ace Magician AMR5 | |
| Prime Computer PrimeBook Circular-i7-1165G7 | |
| Dell Inspiron 15 Plus | |
| Beelink SEi11 Pro | |
| Durchschnittliche Intel Core i5-11320H (212 - 215, n=4) | |
| Lenovo Ideapad Gaming 3 15IHU-82K1002RGE | |
| Intel NUC11TNKi5 | |
| Razer Blade 15 Advanced Model Early 2021 | |
| Beelink SER4 | |
| Blender / v2.79 BMW27 CPU | |
| Prime Computer PrimeBook Circular-i7-1165G7 | |
| Intel NUC11TNKi5 | |
| Beelink SEi11 Pro | |
| Durchschnittliche Intel Core i5-11320H (507 - 543, n=4) | |
| Lenovo Ideapad Gaming 3 15IHU-82K1002RGE | |
| Dell Inspiron 15 Plus | |
| Razer Blade 15 Advanced Model Early 2021 | |
| Minipc Union Ace Magician AMR5 | |
| Beelink SER4 | |
| Lenovo IdeaPad Gaming 3 15ARH7 | |
| Honor MagicBook 14 2022 | |
| Beelink GTR5 | |
| 7-Zip 18.03 / 7z b 4 | |
| Beelink GTR5 | |
| Honor MagicBook 14 2022 | |
| Beelink SER4 | |
| Lenovo IdeaPad Gaming 3 15ARH7 | |
| Minipc Union Ace Magician AMR5 | |
| Razer Blade 15 Advanced Model Early 2021 | |
| Dell Inspiron 15 Plus | |
| Durchschnittliche Intel Core i5-11320H (24718 - 26858, n=4) | |
| Beelink SEi11 Pro | |
| Lenovo Ideapad Gaming 3 15IHU-82K1002RGE | |
| Prime Computer PrimeBook Circular-i7-1165G7 | |
| Intel NUC11TNKi5 | |
| 7-Zip 18.03 / 7z b 4 -mmt1 | |
| Beelink GTR5 | |
| Lenovo IdeaPad Gaming 3 15ARH7 | |
| Razer Blade 15 Advanced Model Early 2021 | |
| Honor MagicBook 14 2022 | |
| Prime Computer PrimeBook Circular-i7-1165G7 | |
| Minipc Union Ace Magician AMR5 | |
| Beelink SEi11 Pro | |
| Dell Inspiron 15 Plus | |
| Durchschnittliche Intel Core i5-11320H (4813 - 5119, n=4) | |
| Lenovo Ideapad Gaming 3 15IHU-82K1002RGE | |
| Intel NUC11TNKi5 | |
| Beelink SER4 | |
| Geekbench 5.5 / Multi-Core | |
| Honor MagicBook 14 2022 | |
| Beelink GTR5 | |
| Razer Blade 15 Advanced Model Early 2021 | |
| Lenovo IdeaPad Gaming 3 15ARH7 | |
| Beelink SER4 | |
| Minipc Union Ace Magician AMR5 | |
| Durchschnittliche Intel Core i5-11320H (4927 - 5955, n=4) | |
| Beelink SEi11 Pro | |
| Prime Computer PrimeBook Circular-i7-1165G7 | |
| Dell Inspiron 15 Plus | |
| Intel NUC11TNKi5 | |
| Lenovo Ideapad Gaming 3 15IHU-82K1002RGE | |
| Geekbench 5.5 / Single-Core | |
| Honor MagicBook 14 2022 | |
| Beelink GTR5 | |
| Prime Computer PrimeBook Circular-i7-1165G7 | |
| Beelink SEi11 Pro | |
| Durchschnittliche Intel Core i5-11320H (1453 - 1523, n=4) | |
| Lenovo IdeaPad Gaming 3 15ARH7 | |
| Minipc Union Ace Magician AMR5 | |
| Intel NUC11TNKi5 | |
| Dell Inspiron 15 Plus | |
| Lenovo Ideapad Gaming 3 15IHU-82K1002RGE | |
| Razer Blade 15 Advanced Model Early 2021 | |
| Beelink SER4 | |
| HWBOT x265 Benchmark v2.2 / 4k Preset | |
| Beelink GTR5 | |
| Honor MagicBook 14 2022 | |
| Lenovo IdeaPad Gaming 3 15ARH7 | |
| Beelink SER4 | |
| Minipc Union Ace Magician AMR5 | |
| Razer Blade 15 Advanced Model Early 2021 | |
| Dell Inspiron 15 Plus | |
| Lenovo Ideapad Gaming 3 15IHU-82K1002RGE | |
| Durchschnittliche Intel Core i5-11320H (7.25 - 7.91, n=4) | |
| Beelink SEi11 Pro | |
| Intel NUC11TNKi5 | |
| Prime Computer PrimeBook Circular-i7-1165G7 | |
| LibreOffice / 20 Documents To PDF | |
| Beelink SER4 | |
| Lenovo IdeaPad Gaming 3 15ARH7 | |
| Razer Blade 15 Advanced Model Early 2021 | |
| Lenovo Ideapad Gaming 3 15IHU-82K1002RGE | |
| Dell Inspiron 15 Plus | |
| Prime Computer PrimeBook Circular-i7-1165G7 | |
| Intel NUC11TNKi5 | |
| Minipc Union Ace Magician AMR5 | |
| Beelink GTR5 | |
| Beelink SEi11 Pro | |
| Durchschnittliche Intel Core i5-11320H (44 - 50, n=4) | |
| Honor MagicBook 14 2022 | |
| R Benchmark 2.5 / Overall mean | |
| Intel NUC11TNKi5 | |
| Lenovo Ideapad Gaming 3 15IHU-82K1002RGE | |
| Prime Computer PrimeBook Circular-i7-1165G7 | |
| Dell Inspiron 15 Plus | |
| Durchschnittliche Intel Core i5-11320H (0.581 - 0.622, n=4) | |
| Beelink SEi11 Pro | |
| Razer Blade 15 Advanced Model Early 2021 | |
| Beelink SER4 | |
| Minipc Union Ace Magician AMR5 | |
| Lenovo IdeaPad Gaming 3 15ARH7 | |
| Honor MagicBook 14 2022 | |
| Beelink GTR5 | |
* ... kleinere Werte sind besser
AIDA64: FP32 Ray-Trace | FPU Julia | CPU SHA3 | CPU Queen | FPU SinJulia | FPU Mandel | CPU AES | CPU ZLib | FP64 Ray-Trace | CPU PhotoWorxx
| Performance Rating | |
| Beelink GTR5 | |
| Beelink SER4 | |
| Beelink GTI 11 | |
| Durchschnittliche Intel Core i5-11320H | |
| Beelink SEi11 Pro | |
| Intel NUC11TNKi5 | |
| AIDA64 / FP32 Ray-Trace | |
| Beelink GTR5 | |
| Beelink SER4 | |
| Beelink GTI 11 | |
| Beelink SEi11 Pro | |
| Durchschnittliche Intel Core i5-11320H (6369 - 7489, n=4) | |
| Intel NUC11TNKi5 | |
| AIDA64 / FPU Julia | |
| Beelink GTR5 | |
| Beelink SER4 | |
| Beelink GTI 11 | |
| Beelink SEi11 Pro | |
| Durchschnittliche Intel Core i5-11320H (27391 - 31637, n=4) | |
| Intel NUC11TNKi5 | |
| AIDA64 / CPU SHA3 | |
| Beelink GTR5 | |
| Beelink GTI 11 | |
| Beelink SEi11 Pro | |
| Durchschnittliche Intel Core i5-11320H (1847 - 2099, n=4) | |
| Intel NUC11TNKi5 | |
| Beelink SER4 | |
| AIDA64 / CPU Queen | |
| Beelink GTR5 | |
| Beelink SER4 | |
| Durchschnittliche Intel Core i5-11320H (43565 - 52477, n=4) | |
| Beelink SEi11 Pro | |
| Beelink GTI 11 | |
| Intel NUC11TNKi5 | |
| AIDA64 / FPU SinJulia | |
| Beelink GTR5 | |
| Beelink SER4 | |
| Beelink SEi11 Pro | |
| Durchschnittliche Intel Core i5-11320H (4381 - 5011, n=4) | |
| Intel NUC11TNKi5 | |
| Beelink GTI 11 | |
| AIDA64 / FPU Mandel | |
| Beelink GTR5 | |
| Beelink SER4 | |
| Beelink GTI 11 | |
| Beelink SEi11 Pro | |
| Durchschnittliche Intel Core i5-11320H (16659 - 18770, n=4) | |
| Intel NUC11TNKi5 | |
| AIDA64 / CPU AES | |
| Beelink GTR5 | |
| Beelink SEi11 Pro | |
| Durchschnittliche Intel Core i5-11320H (59851 - 76500, n=4) | |
| Beelink GTI 11 | |
| Intel NUC11TNKi5 | |
| Beelink SER4 | |
| AIDA64 / CPU ZLib | |
| Beelink GTR5 | |
| Beelink SER4 | |
| Intel NUC11TNKi5 | |
| Beelink GTI 11 | |
| Beelink SEi11 Pro | |
| Durchschnittliche Intel Core i5-11320H (330 - 410, n=4) | |
| AIDA64 / FP64 Ray-Trace | |
| Beelink GTR5 | |
| Beelink SER4 | |
| Beelink GTI 11 | |
| Beelink SEi11 Pro | |
| Durchschnittliche Intel Core i5-11320H (3536 - 4021, n=4) | |
| Intel NUC11TNKi5 | |
| AIDA64 / CPU PhotoWorxx | |
| Beelink GTI 11 | |
| Durchschnittliche Intel Core i5-11320H (25964 - 36644, n=4) | |
| Beelink SEi11 Pro | |
| Beelink SER4 | |
| Beelink GTR5 | |
| Intel NUC11TNKi5 | |
CrossMark: Overall | Productivity | Creativity | Responsiveness
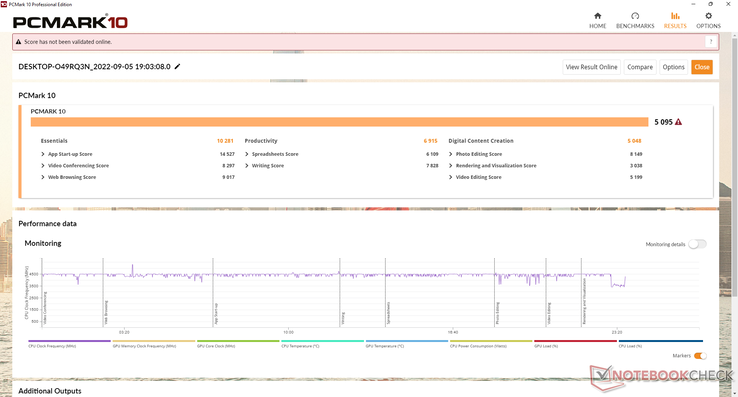
| PCMark 10 / Score | |
| Beelink GTR5 | |
| Beelink SER4 | |
| Durchschnittliche Intel Core i5-11320H, Intel Iris Xe Graphics G7 96EUs (5095 - 5302, n=3) | |
| Beelink SEi11 Pro | |
| Beelink GTI 11 | |
| Intel NUC11TNKi5 | |
| PCMark 10 / Essentials | |
| Beelink GTR5 | |
| Beelink SEi11 Pro | |
| Durchschnittliche Intel Core i5-11320H, Intel Iris Xe Graphics G7 96EUs (9556 - 10558, n=3) | |
| Beelink GTI 11 | |
| Beelink SER4 | |
| Intel NUC11TNKi5 | |
| PCMark 10 / Productivity | |
| Beelink GTR5 | |
| Beelink SER4 | |
| Beelink SEi11 Pro | |
| Durchschnittliche Intel Core i5-11320H, Intel Iris Xe Graphics G7 96EUs (6832 - 6963, n=3) | |
| Beelink GTI 11 | |
| Intel NUC11TNKi5 | |
| PCMark 10 / Digital Content Creation | |
| Beelink GTR5 | |
| Beelink SER4 | |
| Durchschnittliche Intel Core i5-11320H, Intel Iris Xe Graphics G7 96EUs (5048 - 5615, n=3) | |
| Beelink GTI 11 | |
| Beelink SEi11 Pro | |
| Intel NUC11TNKi5 | |
| CrossMark / Overall | |
| Beelink GTR5 | |
| Beelink SEi11 Pro | |
| Durchschnittliche Intel Core i5-11320H, Intel Iris Xe Graphics G7 96EUs (1300 - 1371, n=3) | |
| CrossMark / Productivity | |
| Beelink GTR5 | |
| Beelink SEi11 Pro | |
| Durchschnittliche Intel Core i5-11320H, Intel Iris Xe Graphics G7 96EUs (1376 - 1456, n=3) | |
| CrossMark / Creativity | |
| Beelink GTR5 | |
| Beelink SEi11 Pro | |
| Durchschnittliche Intel Core i5-11320H, Intel Iris Xe Graphics G7 96EUs (1241 - 1256, n=3) | |
| CrossMark / Responsiveness | |
| Durchschnittliche Intel Core i5-11320H, Intel Iris Xe Graphics G7 96EUs (1260 - 1494, n=3) | |
| Beelink SEi11 Pro | |
| Beelink GTR5 | |
| PCMark 10 Score | 5095 Punkte | |
Hilfe | ||
| AIDA64 / Memory Copy | |
| Durchschnittliche Intel Core i5-11320H (41106 - 55961, n=4) | |
| Beelink GTR5 | |
| Beelink SEi11 Pro | |
| Beelink GTI 11 | |
| Beelink SER4 | |
| Intel NUC11TNKi5 | |
| AIDA64 / Memory Read | |
| Durchschnittliche Intel Core i5-11320H (46516 - 52799, n=4) | |
| Beelink GTR5 | |
| Beelink GTI 11 | |
| Beelink SEi11 Pro | |
| Beelink SER4 | |
| Intel NUC11TNKi5 | |
| AIDA64 / Memory Write | |
| Durchschnittliche Intel Core i5-11320H (46760 - 63323, n=4) | |
| Beelink SEi11 Pro | |
| Beelink GTI 11 | |
| Beelink SER4 | |
| Beelink GTR5 | |
| Intel NUC11TNKi5 | |
| AIDA64 / Memory Latency | |
| Beelink SER4 | |
| Durchschnittliche Intel Core i5-11320H (77.6 - 114.1, n=4) | |
| Intel NUC11TNKi5 | |
| Beelink SEi11 Pro | |
| Beelink GTR5 | |
| Beelink GTI 11 | |
* ... kleinere Werte sind besser
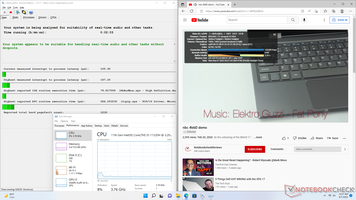
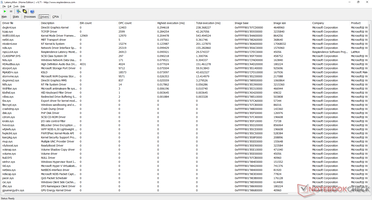
DPC-Latency
| DPC Latencies / LatencyMon - interrupt to process latency (max), Web, Youtube, Prime95 | |
| Intel NUC11TNKi5 | |
| Beelink SER4 | |
| Beelink GTI 11 | |
| Beelink SEi11 Pro | |
| Beelink GTR5 | |
* ... kleinere Werte sind besser
Massenspeicher
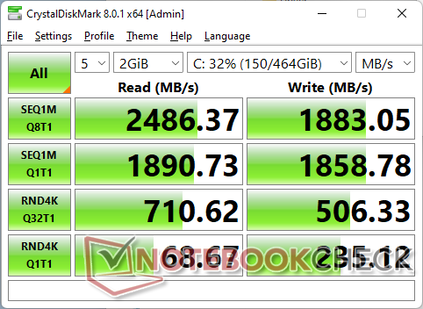
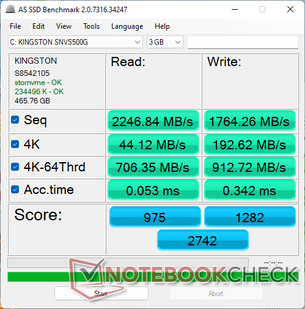
Der SEi11 Pro wird mit derselben Kingston NV1 SBVS500GCN M.2 SSD ausgeliefert wie beim GTR5. Dabei handelt es sich um ein PCIe3-x4-Laufwerk der Mittelklasse mit sequenziellen Leseraten von etwa 2.300 MB/s im Vergleich zu >3.000 MB/s bei einer Samsung PM981a.
| Drive Performance Rating - Percent | |
| Beelink GTI 11 | |
| Beelink GTR5 | |
| Beelink SEi11 Pro | |
| Beelink SER4 | |
| Intel NUC11TNKi5 | |
| DiskSpd | |
| seq read | |
| Beelink GTR5 | |
| Beelink SEi11 Pro | |
| Beelink GTI 11 | |
| Beelink SER4 | |
| Intel NUC11TNKi5 | |
| seq write | |
| Beelink GTI 11 | |
| Beelink GTR5 | |
| Beelink SEi11 Pro | |
| Beelink SER4 | |
| Intel NUC11TNKi5 | |
| seq q8 t1 read | |
| Beelink GTR5 | |
| Beelink SEi11 Pro | |
| Beelink GTI 11 | |
| Beelink SER4 | |
| Intel NUC11TNKi5 | |
| seq q8 t1 write | |
| Beelink GTI 11 | |
| Beelink GTR5 | |
| Beelink SEi11 Pro | |
| Beelink SER4 | |
| Intel NUC11TNKi5 | |
| 4k q1 t1 read | |
| Beelink GTI 11 | |
| Beelink SER4 | |
| Beelink GTR5 | |
| Beelink SEi11 Pro | |
| Intel NUC11TNKi5 | |
| 4k q1 t1 write | |
| Beelink GTI 11 | |
| Beelink GTR5 | |
| Beelink SER4 | |
| Beelink SEi11 Pro | |
| Intel NUC11TNKi5 | |
| 4k q32 t16 read | |
| Beelink GTI 11 | |
| Beelink GTR5 | |
| Beelink SEi11 Pro | |
| Beelink SER4 | |
| Intel NUC11TNKi5 | |
| 4k q32 t16 write | |
| Beelink GTI 11 | |
| Beelink SER4 | |
| Beelink GTR5 | |
| Beelink SEi11 Pro | |
| Intel NUC11TNKi5 | |
| AS SSD | |
| Score Total | |
| Beelink GTI 11 | |
| Beelink SEi11 Pro | |
| Beelink GTR5 | |
| Beelink SER4 | |
| Intel NUC11TNKi5 | |
| Score Read | |
| Beelink GTI 11 | |
| Beelink SEi11 Pro | |
| Beelink GTR5 | |
| Beelink SER4 | |
| Intel NUC11TNKi5 | |
| Score Write | |
| Beelink GTI 11 | |
| Beelink SEi11 Pro | |
| Beelink GTR5 | |
| Beelink SER4 | |
| Intel NUC11TNKi5 | |
| Seq Read | |
| Beelink GTR5 | |
| Beelink SEi11 Pro | |
| Beelink GTI 11 | |
| Beelink SER4 | |
| Intel NUC11TNKi5 | |
| Seq Write | |
| Beelink GTI 11 | |
| Beelink SEi11 Pro | |
| Beelink GTR5 | |
| Beelink SER4 | |
| Intel NUC11TNKi5 | |
| 4K Read | |
| Beelink GTI 11 | |
| Beelink SER4 | |
| Beelink SEi11 Pro | |
| Beelink GTR5 | |
| Intel NUC11TNKi5 | |
| 4K Write | |
| Beelink GTI 11 | |
| Beelink SEi11 Pro | |
| Beelink SER4 | |
| Beelink GTR5 | |
| Intel NUC11TNKi5 | |
| 4K-64 Read | |
| Beelink GTI 11 | |
| Beelink SEi11 Pro | |
| Beelink GTR5 | |
| Beelink SER4 | |
| Intel NUC11TNKi5 | |
| 4K-64 Write | |
| Beelink GTI 11 | |
| Beelink SEi11 Pro | |
| Beelink GTR5 | |
| Beelink SER4 | |
| Intel NUC11TNKi5 | |
| Access Time Read | |
| Intel NUC11TNKi5 | |
| Beelink SER4 | |
| Beelink GTR5 | |
| Beelink SEi11 Pro | |
| Beelink GTI 11 | |
| Access Time Write | |
| Beelink SEi11 Pro | |
| Beelink GTR5 | |
| Intel NUC11TNKi5 | |
| Beelink SER4 | |
| Beelink GTI 11 | |
* ... kleinere Werte sind besser
Dauerleistung Lesen: DiskSpd Read Loop, Queue Depth 8
Grafikleistung
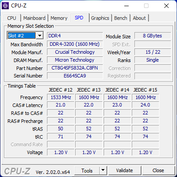
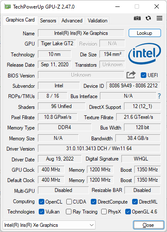
Die integrierte Grafikleistung zeigt sich genau so performant wie bei anderen PCs mit der gleichen Iris-Xe-96-EUs-GPU. Man sollte aufpassen, den SEi11 mit Dual-Channel-RAM auszustatten. Ansonsten kann die Grafikleistung um 30 bis 40 Prozent sinken.
| 3DMark 11 - 1280x720 Performance GPU | |
| Honor MagicBook 14 2022 | |
| Beelink GTR5 | |
| Beelink SEi11 Pro | |
| Durchschnittliche Intel Iris Xe Graphics G7 96EUs (2867 - 7676, n=209) | |
| Prime Computer PrimeBook Circular-i7-1165G7 | |
| Beelink SER4 | |
| Minipc Union Ace Magician AMR5 | |
| Intel NUC11TNKi5 | |
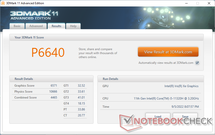
| 3DMark 11 Performance | 6640 Punkte | |
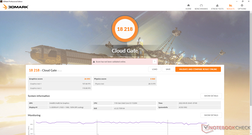
| 3DMark Cloud Gate Standard Score | 18218 Punkte | |
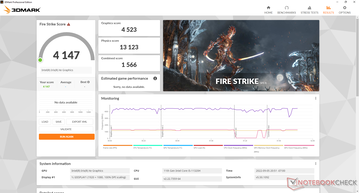
| 3DMark Fire Strike Score | 4147 Punkte | |
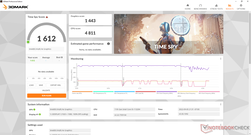
| 3DMark Time Spy Score | 1612 Punkte | |
Hilfe | ||
| The Witcher 3 | |
| 1024x768 Low Graphics & Postprocessing | |
| Beelink SEi11 Pro | |
| Beelink GTR5 | |
| Durchschnittliche Intel Iris Xe Graphics G7 96EUs (28.9 - 117.2, n=188) | |
| Beelink GTI 11 | |
| Beelink SER4 | |
| Intel NUC11TNKi5 | |
| 1366x768 Medium Graphics & Postprocessing | |
| Beelink GTR5 | |
| Beelink SEi11 Pro | |
| Durchschnittliche Intel Iris Xe Graphics G7 96EUs (21.4 - 77.8, n=185) | |
| Beelink GTI 11 | |
| Beelink SER4 | |
| 1920x1080 High Graphics & Postprocessing (Nvidia HairWorks Off) | |
| Durchschnittliche Intel Iris Xe Graphics G7 96EUs (10.6 - 45.9, n=191) | |
| Beelink SEi11 Pro | |
| Beelink GTR5 | |
| Beelink GTI 11 | |
| Beelink SER4 | |
| 1920x1080 Ultra Graphics & Postprocessing (HBAO+) | |
| Beelink GTR5 | |
| Beelink SER4 | |
| Durchschnittliche Intel Iris Xe Graphics G7 96EUs (8.79 - 20.1, n=181) | |
| Beelink SEi11 Pro | |
| Beelink GTI 11 | |
| Cyberpunk 2077 1.6 | |
| 1920x1080 Low Preset | |
| Durchschnittliche Intel Iris Xe Graphics G7 96EUs (13 - 25.9, n=42) | |
| Beelink SEi11 Pro | |
| 1920x1080 Medium Preset | |
| Durchschnittliche Intel Iris Xe Graphics G7 96EUs (10.8 - 21.7, n=37) | |
| Beelink SEi11 Pro | |
| 1920x1080 High Preset | |
| Durchschnittliche Intel Iris Xe Graphics G7 96EUs (9.8 - 16.9, n=34) | |
| Beelink SEi11 Pro | |
| 1920x1080 Ultra Preset | |
| Durchschnittliche Intel Iris Xe Graphics G7 96EUs (7.4 - 16.8, n=32) | |
| Beelink SEi11 Pro | |
| GTA V | |
| 1024x768 Lowest Settings possible | |
| Beelink GTR5 | |
| Beelink SER4 | |
| Durchschnittliche Intel Iris Xe Graphics G7 96EUs (52 - 166.4, n=168) | |
| Beelink GTI 11 | |
| Beelink SEi11 Pro | |
| 1920x1080 Lowest Settings possible | |
| Beelink GTR5 | |
| Durchschnittliche Intel Iris Xe Graphics G7 96EUs (34.7 - 132.1, n=141) | |
| Beelink SER4 | |
| Beelink SEi11 Pro | |
| Beelink GTI 11 | |
| 1366x768 Normal/Off AF:4x | |
| Beelink GTR5 | |
| Beelink SER4 | |
| Durchschnittliche Intel Iris Xe Graphics G7 96EUs (24.1 - 152.7, n=169) | |
| Beelink GTI 11 | |
| Beelink SEi11 Pro | |
| 1920x1080 Normal/Off AF:4x | |
| Beelink GTR5 | |
| Beelink SER4 | |
| Durchschnittliche Intel Iris Xe Graphics G7 96EUs (20 - 119.3, n=142) | |
| Beelink SEi11 Pro | |
| Beelink GTI 11 | |
| 1920x1080 High/On (Advanced Graphics Off) AA:2xMSAA + FX AF:8x | |
| Beelink GTR5 | |
| Beelink SER4 | |
| Beelink SEi11 Pro | |
| Durchschnittliche Intel Iris Xe Graphics G7 96EUs (9.39 - 51.6, n=162) | |
| Beelink GTI 11 | |
| 1920x1080 Highest AA:4xMSAA + FX AF:16x | |
| Beelink GTR5 | |
| Beelink SER4 | |
| Durchschnittliche Intel Iris Xe Graphics G7 96EUs (4.13 - 22.9, n=156) | |
| Beelink GTI 11 | |
| Final Fantasy XV Benchmark | |
| 1280x720 Lite Quality | |
| Beelink GTR5 | |
| Durchschnittliche Intel Iris Xe Graphics G7 96EUs (14.9 - 56.5, n=189) | |
| Beelink SEi11 Pro | |
| Beelink SER4 | |
| Beelink GTI 11 | |
| Intel NUC11TNKi5 | |
| 1920x1080 Standard Quality | |
| Beelink GTR5 | |
| Durchschnittliche Intel Iris Xe Graphics G7 96EUs (10.5 - 31.2, n=185) | |
| Beelink SEi11 Pro | |
| Beelink SER4 | |
| Beelink GTI 11 | |
| Intel NUC11TNKi5 | |
| 1920x1080 High Quality | |
| Durchschnittliche Intel Iris Xe Graphics G7 96EUs (8.15 - 27.8, n=178) | |
| Beelink GTR5 | |
| Beelink SEi11 Pro | |
| Beelink SER4 | |
| Beelink GTI 11 | |
| Intel NUC11TNKi5 | |
| X-Plane 11.11 | |
| 1280x720 low (fps_test=1) | |
| Beelink GTR5 | |
| Beelink SEi11 Pro | |
| Durchschnittliche Intel Iris Xe Graphics G7 96EUs (13.4 - 88.4, n=213) | |
| Beelink SER4 | |
| Intel NUC11TNKi5 | |
| Beelink GTI 11 | |
| 1920x1080 med (fps_test=2) | |
| Beelink GTR5 | |
| Beelink SEi11 Pro | |
| Durchschnittliche Intel Iris Xe Graphics G7 96EUs (11.6 - 69.5, n=214) | |
| Beelink SER4 | |
| Intel NUC11TNKi5 | |
| Beelink GTI 11 | |
| 1920x1080 high (fps_test=3) | |
| Beelink GTR5 | |
| Beelink SEi11 Pro | |
| Durchschnittliche Intel Iris Xe Graphics G7 96EUs (11.1 - 59.8, n=213) | |
| Beelink SER4 | |
| Intel NUC11TNKi5 | |
| Beelink GTI 11 | |
| Dota 2 Reborn | |
| 1280x720 min (0/3) fastest | |
| Beelink GTR5 | |
| Beelink GTI 11 | |
| Beelink SEi11 Pro | |
| Beelink SER4 | |
| Durchschnittliche Intel Iris Xe Graphics G7 96EUs (36 - 148, n=221) | |
| Intel NUC11TNKi5 | |
| 1366x768 med (1/3) | |
| Beelink GTR5 | |
| Beelink SER4 | |
| Beelink GTI 11 | |
| Beelink SEi11 Pro | |
| Durchschnittliche Intel Iris Xe Graphics G7 96EUs (31.6 - 108.5, n=221) | |
| Intel NUC11TNKi5 | |
| 1920x1080 high (2/3) | |
| Beelink GTR5 | |
| Durchschnittliche Intel Iris Xe Graphics G7 96EUs (23.2 - 88.1, n=221) | |
| Beelink SER4 | |
| Beelink SEi11 Pro | |
| Beelink GTI 11 | |
| Intel NUC11TNKi5 | |
| 1920x1080 ultra (3/3) best looking | |
| Beelink GTR5 | |
| Beelink SER4 | |
| Durchschnittliche Intel Iris Xe Graphics G7 96EUs (20.6 - 78.5, n=221) | |
| Beelink SEi11 Pro | |
| Beelink GTI 11 | |
| Intel NUC11TNKi5 | |
| Strange Brigade | |
| 1280x720 lowest AF:1 | |
| Beelink GTR5 | |
| Durchschnittliche Intel Iris Xe Graphics G7 96EUs (48.5 - 115.1, n=172) | |
| Beelink SER4 | |
| Beelink SEi11 Pro | |
| Beelink GTI 11 | |
| 1920x1080 medium AA:medium AF:4 | |
| Beelink GTR5 | |
| Durchschnittliche Intel Iris Xe Graphics G7 96EUs (18.2 - 51.4, n=170) | |
| Beelink SEi11 Pro | |
| Beelink SER4 | |
| Beelink GTI 11 | |
| 1920x1080 high AA:high AF:8 | |
| Beelink GTR5 | |
| Durchschnittliche Intel Iris Xe Graphics G7 96EUs (15.4 - 39.8, n=169) | |
| Beelink SER4 | |
| Beelink SEi11 Pro | |
| Beelink GTI 11 | |
| 1920x1080 ultra AA:ultra AF:16 | |
| Beelink GTR5 | |
| Beelink SER4 | |
| Durchschnittliche Intel Iris Xe Graphics G7 96EUs (13.2 - 31.7, n=167) | |
| Beelink SEi11 Pro | |
| Beelink GTI 11 | |
Witcher 3 FPS Chart
| min. | mittel | hoch | max. | |
|---|---|---|---|---|
| GTA V (2015) | 94.2 | 77.6 | 23.2 | |
| The Witcher 3 (2015) | 89.7 | 53.7 | 27.8 | 13.8 |
| Dota 2 Reborn (2015) | 119.6 | 78.6 | 50.4 | 47.4 |
| Final Fantasy XV Benchmark (2018) | 38.6 | 20.3 | 14.9 | |
| X-Plane 11.11 (2018) | 58.2 | 41.2 | 37.3 | |
| Strange Brigade (2018) | 79.3 | 33.9 | 27.7 | 22.2 |
| Cyberpunk 2077 1.6 (2022) | 18.6 | 15.6 | 11.7 | 9.8 |
Emissionen
Systemlautstärke
Von der Benutzung unabhängig ist der Lüfter im Gerät immer aktiv. Zum Glück ist er mit nur 24,7 dB(A) gegenüber einer Hintergrundlautstärke von 22,8 dB(A) relativ leise. Der Erwartung eines lautlosen Mini-PCs wird dieses Gerät allerdings nicht gerecht.
Insgesamt ist das Lüftergeräusch bei anspruchsvolleren Aufgaben immer noch leiser als bei vielen anderen Mini-PCs. Beim Surfen im Internet oder beim Videostreaming bewegt sich das Lüftergeräusch beispielsweise zwischen 25 und 28 dB(A) im Vergleich zu über 30 dB(A) beim GTR5 oder Intel NUC11. Der Lüfter erreicht seinen Höchstwert von knapp 38 dB(A), wenn die CPU über einen längeren Zeitraum zu 100 Prozent ausgelastet ist, was ebenfalls deutlich leiser ist als bei vielen Alternativen.
Lautstärkediagramm
| Idle |
| 24.7 / 24.7 / 25.3 dB(A) |
| Last |
| 33.2 / 37.8 dB(A) |
 | ||
30 dB leise 40 dB(A) deutlich hörbar 50 dB(A) störend |
||
min: | ||
| Beelink SEi11 Pro Iris Xe G7 96EUs, i5-11320H, Kingston NV1 SNVS/500GCN | Beelink GTR5 Vega 8, R9 5900HX, Kingston NV1 SNVS/500GCN | Beelink GTI 11 Iris Xe G7 80EUs, i5-1135G7, Kingston SA2000M8500G | Beelink SER4 Vega 8, R7 4800U, Intel SSD 660p SSDPEKNW512G8 | Intel NUC11TNKi5 Iris Xe G7 80EUs, i5-1135G7, Transcend M.2 SSD 430S TS512GMTS430S | |
|---|---|---|---|---|---|
| Geräuschentwicklung | -26% | -31% | -20% | -26% | |
| aus / Umgebung * (dB) | 22.8 | 23.1 -1% | 25.7 -13% | 23.4 -3% | 24.8 -9% |
| Idle min * (dB) | 24.7 | 34.2 -38% | 28.4 -15% | 33.2 -34% | 35.6 -44% |
| Idle avg * (dB) | 24.7 | 34.2 -38% | 32 -30% | 33.2 -34% | 35.6 -44% |
| Idle max * (dB) | 25.3 | 34.2 -35% | 37.7 -49% | 33.2 -31% | 35.6 -41% |
| Last avg * (dB) | 33.2 | 44.6 -34% | 44.2 -33% | 38.6 -16% | 36.2 -9% |
| Witcher 3 ultra * (dB) | 34.5 | 41.4 -20% | 44.5 -29% | 39.2 -14% | 38 -10% |
| Last max * (dB) | 37.8 | 45.1 -19% | 56 -48% | 40.8 -8% | 47.6 -26% |
* ... kleinere Werte sind besser
Temperatur
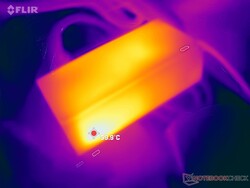
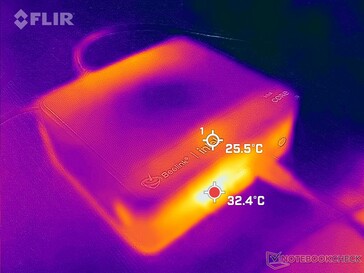
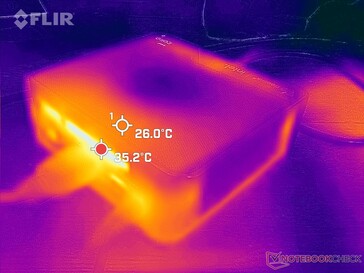
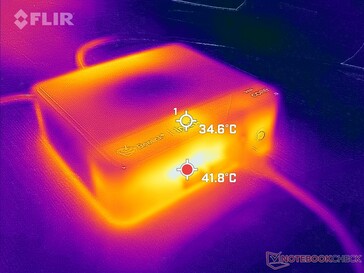
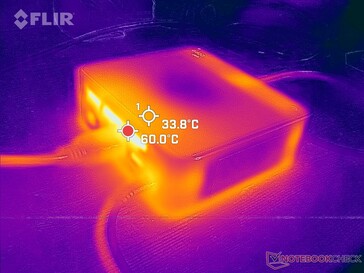
Kühle Luft wird über die Oberseite des Geräts angesaugt, während die Abluft über die Rückseite austritt, wie die Bilder unten zeigen. Gegenstände wie Bücher und Papiere sollten daher nicht auf die Oberseite gelegt werden.
Zu beachten ist, dass das Netzteil merklich wärmer werden kann als Netzteile, die mit Laptops ausgeliefert werden.
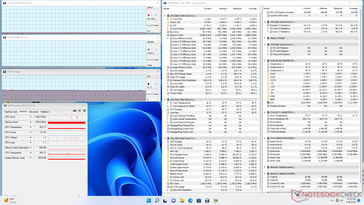
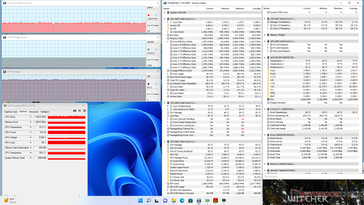
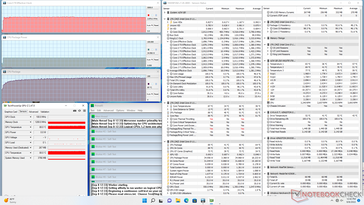
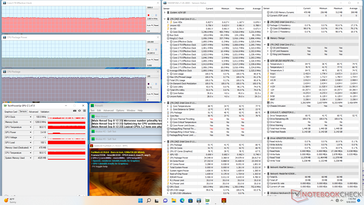
Stresstest
Die Taktraten und die Leistungsaufnahme des Boards steigen auf 2,9 GHz bzw. 35 W, wenn Prime95 läuft. Das System ist in der Lage, diese Werte unbegrenzt aufrechtzuerhalten, wenn auch bei einer relativ hohen Kerntemperatur von 90 °C. 35 W ist der obere TDP-Bereich für den Core i5-11320H, und somit nutzt der SEi11 den Prozessor nahe an seinem maximalen Potenzial aus.
Die GPU-Taktraten und die Temperatur beim Betrieb von Witcher 3 sind relativ stabil bei 1.350 MHz bzw. 83 °C. Die Durchführung des gleichen Tests auf dem Intel NUC11 mit dem Core i5-1135G7 würde im Vergleich dazu zu einer viel kühleren Kerntemperatur von 58 °C führen.
| CPU-Takt (GHz) | GPU-Takt (MHz) | Durchschnittliche CPU-Temperatur (°C) | |
| System Leerlauf | -- | -- | 41 |
| Prime95 Stress | 2.9 | -- | 89 |
| Prime95 + FurMark Stress | ~2.9 | 600 | 91 |
| Witcher 3 Stress | ~1.8 | 1350 | 83 |
Energiemanagement
Energieverbrauch
Das System beansprucht eine höhere Energieaufnahme als Mini-PCs, welche mit Core-U-Serien-CPUs der 11. Generation wie dem GTI 11 oder dem Intel NUC11 bestückt sind. Wenn man jedoch Wert auf die reine CPU-Multi-Thread-Leistung legt, dann könnte der SER4 die bessere Option sein, da er eine schnellere Multi-Thread-Leistung bietet und dabei über 30 Prozent weniger Strom verbraucht als unser SEi11.
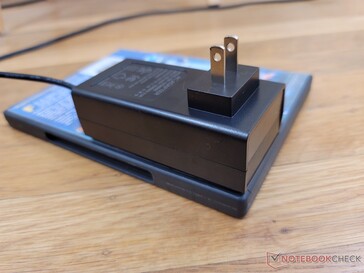
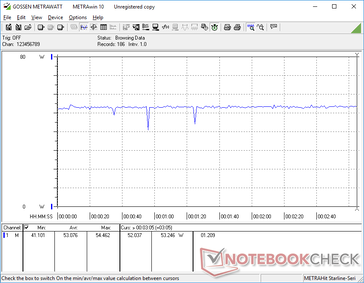
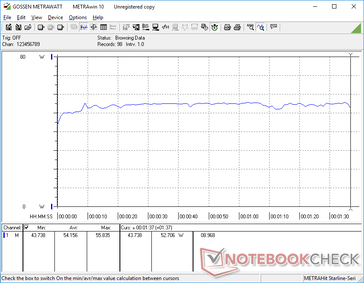
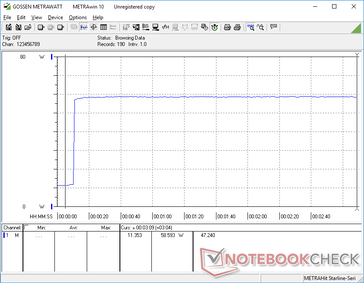
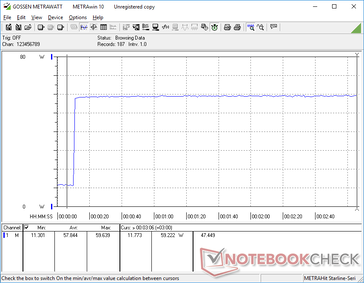
Wir konnten mit dem relativ kleinen (~10 x 4,3 x 4,8 cm) 57-Watt-Netzteil (19 V, 3 A) eine maximale Leistungsaufnahme von 59 W aufzeichnen, wenn Prime95 läuft.
| Aus / Standby | |
| Idle | |
| Last |
|
Legende:
min: | |
| Beelink SEi11 Pro i5-11320H, Iris Xe G7 96EUs, Kingston NV1 SNVS/500GCN, , x, | Beelink GTR5 R9 5900HX, Vega 8, Kingston NV1 SNVS/500GCN, , x, | Beelink GTI 11 i5-1135G7, Iris Xe G7 80EUs, Kingston SA2000M8500G, , x, | Beelink SER4 R7 4800U, Vega 8, Intel SSD 660p SSDPEKNW512G8, , x, | Intel NUC11TNKi5 i5-1135G7, Iris Xe G7 80EUs, Transcend M.2 SSD 430S TS512GMTS430S, , x, | |
|---|---|---|---|---|---|
| Stromverbrauch | -2% | -38% | 46% | -7% | |
| Idle min * (Watt) | 9.8 | 6.2 37% | 15.2 -55% | 4.1 58% | 11.5 -17% |
| Idle avg * (Watt) | 10.3 | 8.9 14% | 16 -55% | 4.1 60% | 12.4 -20% |
| Idle max * (Watt) | 10.5 | 9 14% | 16 -52% | 4.6 56% | 12.9 -23% |
| Last avg * (Watt) | 54.2 | 66.8 -23% | 48.6 10% | 35.6 34% | 40.7 25% |
| Witcher 3 ultra * (Watt) | 53.1 | 62.6 -18% | 53.8 -1% | 35.6 33% | 43.9 17% |
| Last max * (Watt) | 59 | 81.6 -38% | 104.3 -77% | 39.9 32% | 73.5 -25% |
* ... kleinere Werte sind besser
Leistungsaufnahme Witcher 3 / Stresstest
Energieverbrauch mit externem Monitor
Pro
Contra
Fazit - Ausgewogener Mini-PC mit gutem Preis-Leistungs-Verhältnis
Beelinks Auswahl an Mini PCs bietet eine Handvoll "Intel-NUC-Killer", die zum größten Teil die gleichen Features bieten, aber für Hunderte Euro weniger. Der SEi11 ist eine weitere Erfolgsstory für Beelink, hauptsächlich dank dem Core i5-11320H, welcher vergleichbare Performance zu einem i7-1165G7 zeigt, aber nur halb so viel kostet.
Oder kurz gesagt: Anwender müssen sich nicht mit der langsameren Performance einer Core i3, Ryzen 3, Celeron oder Atom CPU abfinden, nur weil die NUC-Alternative viel günstiger ist.
Der gut erreichbare RAM, zwei Massenspeicher-Slots und viele Anschlüsse sind genug, um den Ansprüchen von HTPC oder Home-Office-Setups zu genügen.
Preis und Verfügbarkeit
In den USA ist der Beelink SEi11 mit Windows 11 Pro, 500-GB-SSD und 16 GB Ram für 479 U$ bei Amazon.com erhältlich oder alternativ beim Hersteller für 429 U$.
Im deutschsprachigen Raum ist er in dieser Version nicht verfügbar. Allerdings kann man ein ähnliches, aber älteres Modell in zwei Konfigurationen bei Amazon.de für 439 (8 GB/265 GB) bzw. 589 (16 GB/512 GB) Euro kaufen.


