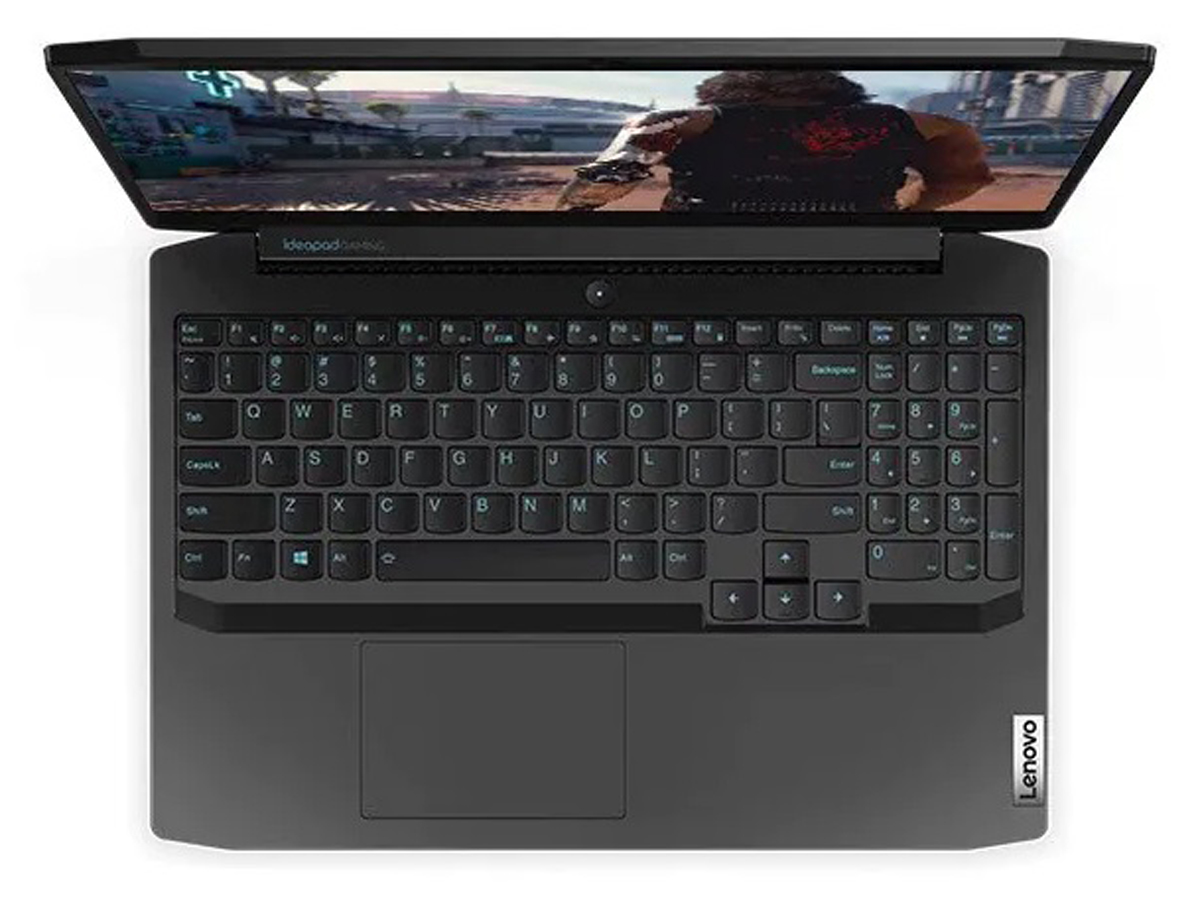
Premiere für den Ryzen 5 6600H: Test Lenovo IdeaPad Gaming 3 15ARH7 Laptop
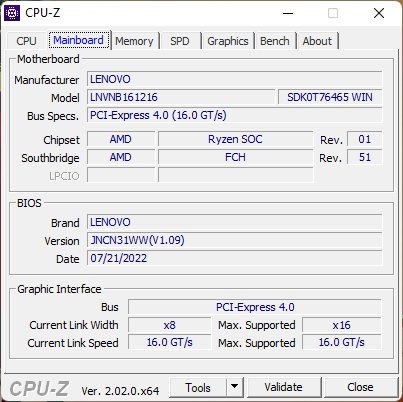
Die IdeaPad-Gaming-3-Reihe beinhaltet Lenovos günstigsten Gaming-Laptop, während die Mittelklasse-Laptops in der Legion-5-Pro- und die High-End-Laptops in der Legion-7-Reihe zu finden sind. Das aktuelle Modell bietet als eines der ersten eine AMD-Zen-3+-Ryzen-5-6600-CPU und nicht mehr wie das IdeaPad Gaming 3i 2020 Intel-Prozessoren aus der 10. Generation. Außerdem setzt Lenovo hier auf ein neues Gehäuse, durch das sich das Modell vom Vorgäner abheben soll.
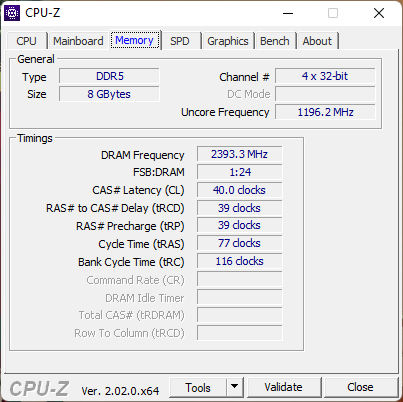
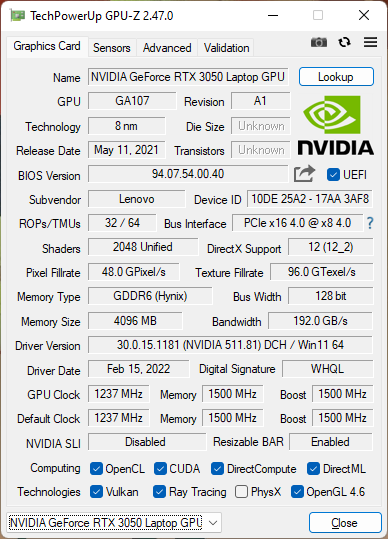
Der Laptop kann mit dem Ryzen 5 6600H oder dem Ryzen 7 6800H und einer GeForce RTX 3050 oder einer 3050 Ti mit jeweils 85 W konfiguriert werden. Bei allen Modellen kommt ein 120-Hz-1080p-IPS-Panel zum Einsatz. Unser Testgerät verfügt über einen 6600H, eine RTX 3050, eine 256-GB-SSD und 8 GB RAM und kostet ca. 800 USD.
Zur Konkurrenz zählen andere günstige 15,6- und 16-Zoll-Gaming-Laptops wie das Acer Nitro 5, HP Victus, Asus TUF Dash 15 und die MSI-GF-Serie.
Weitere Lenovo-Tests:
Mögliche Konkurrenten im Vergleich
Bew. | Datum | Modell | Gewicht | Dicke | Größe | Auflösung | Preis ab |
|---|---|---|---|---|---|---|---|
| 80.8 % v7 (old) | 09 / 2022 | Lenovo IdeaPad Gaming 3 15ARH7 R5 6600H, GeForce RTX 3050 4GB Laptop GPU | 2.4 kg | 21.8 mm | 15.60" | 1920x1080 | |
| 78.4 % v7 (old) | 07 / 2020 | Lenovo IdeaPad Gaming 3i 15IMH05 i5-10300H, GeForce GTX 1650 Mobile | 2.2 kg | 24.9 mm | 15.60" | 1920x1080 | |
| 82.6 % v7 (old) | 04 / 2022 | Lenovo Legion 5 15ACH6A-82NW0010GE R5 5600H, Radeon RX 6600M | 2.5 kg | 25.75 mm | 15.60" | 1920x1080 | |
| 82.3 % v7 (old) | 09 / 2022 | Gigabyte A5 K1 R5 5600H, GeForce RTX 3060 Laptop GPU | 2.2 kg | 34 mm | 15.60" | 1920x1080 | |
| 85.8 % v7 (old) | 07 / 2022 | Asus TUF Dash F15 FX517ZR i7-12650H, GeForce RTX 3070 Laptop GPU | 2 kg | 20.7 mm | 15.60" | 2560x1440 | |
| 81 % v7 (old) | 06 / 2022 | Dell G15 5510 i5-10500H, GeForce RTX 3050 4GB Laptop GPU | 2.5 kg | 23 mm | 15.60" | 1920x1080 |
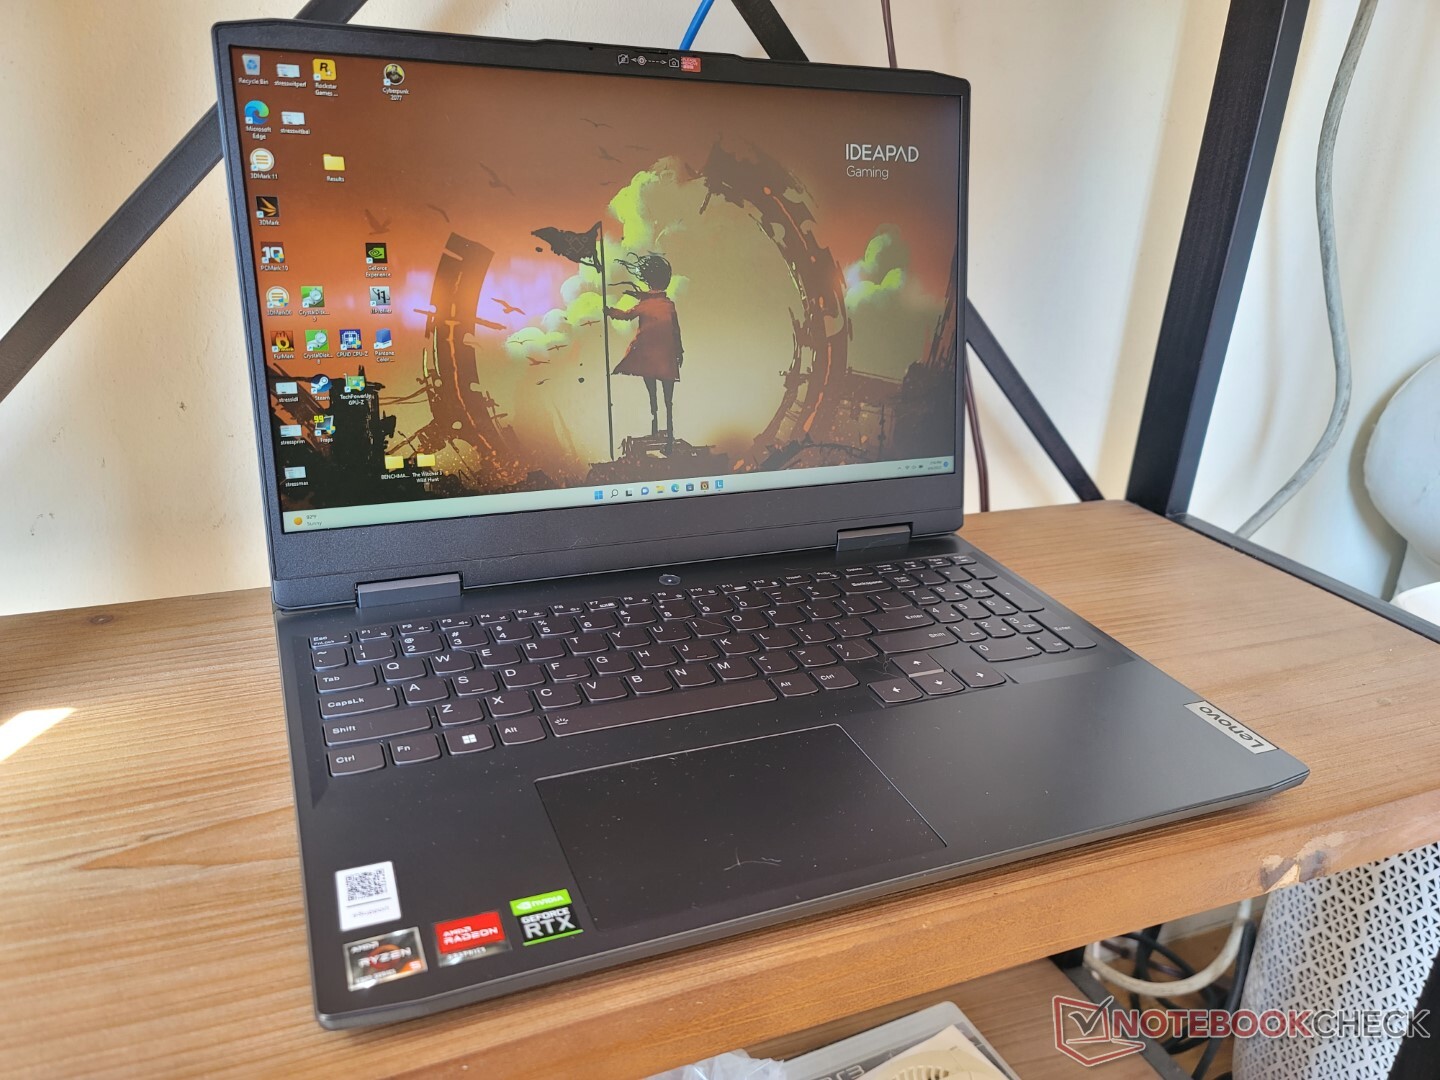
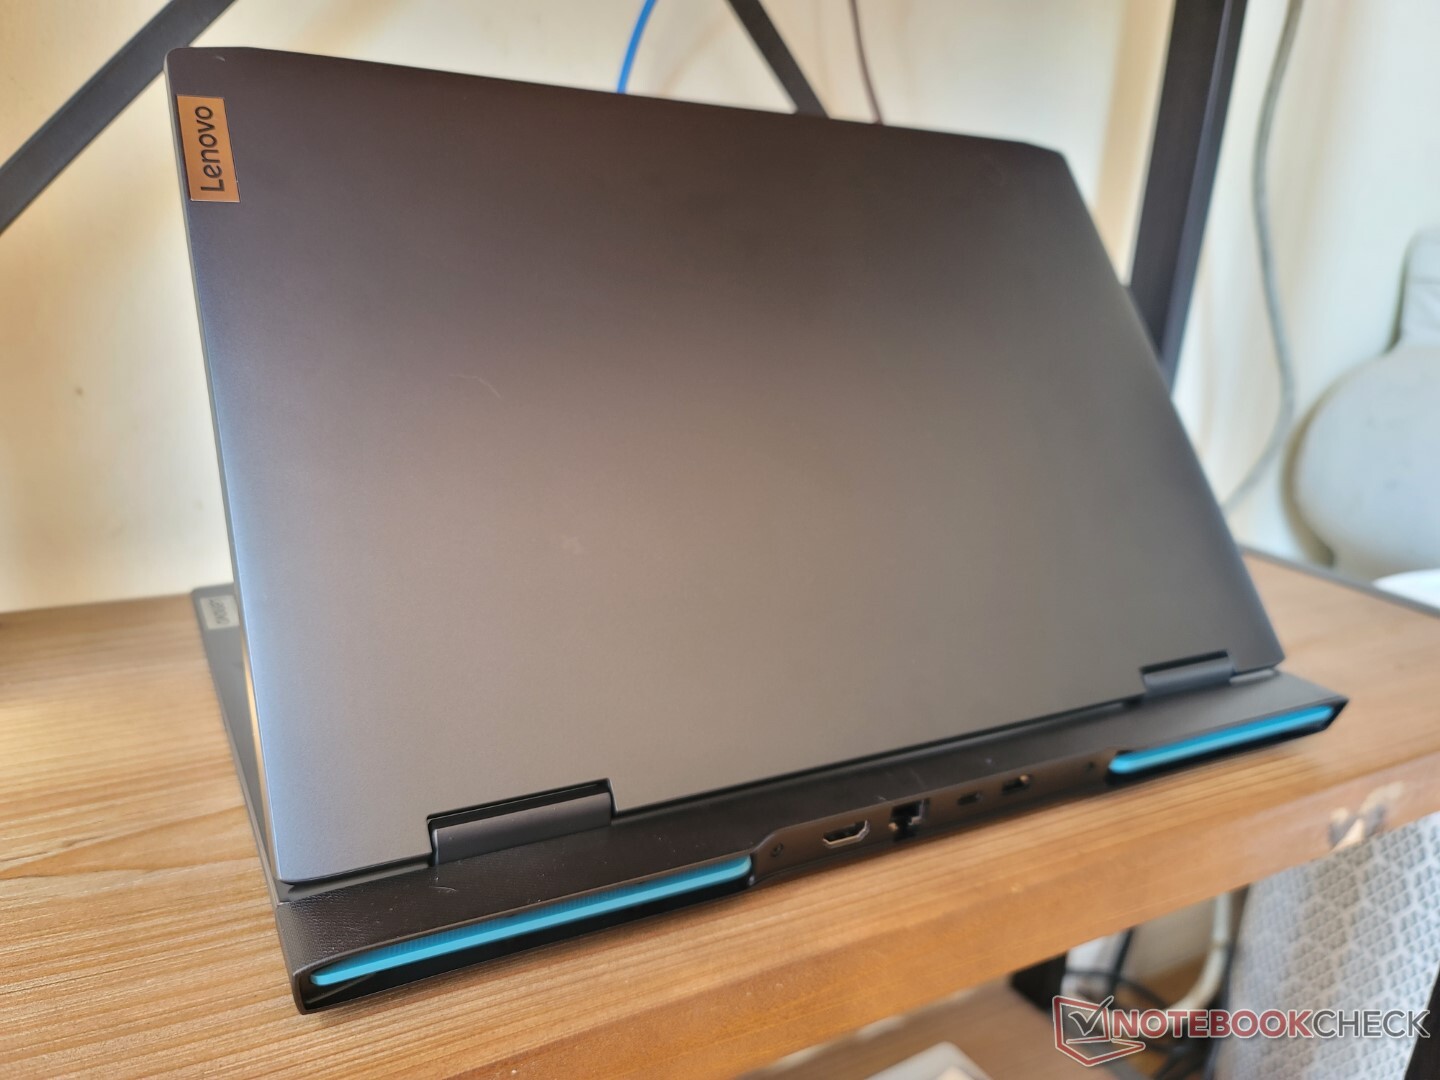
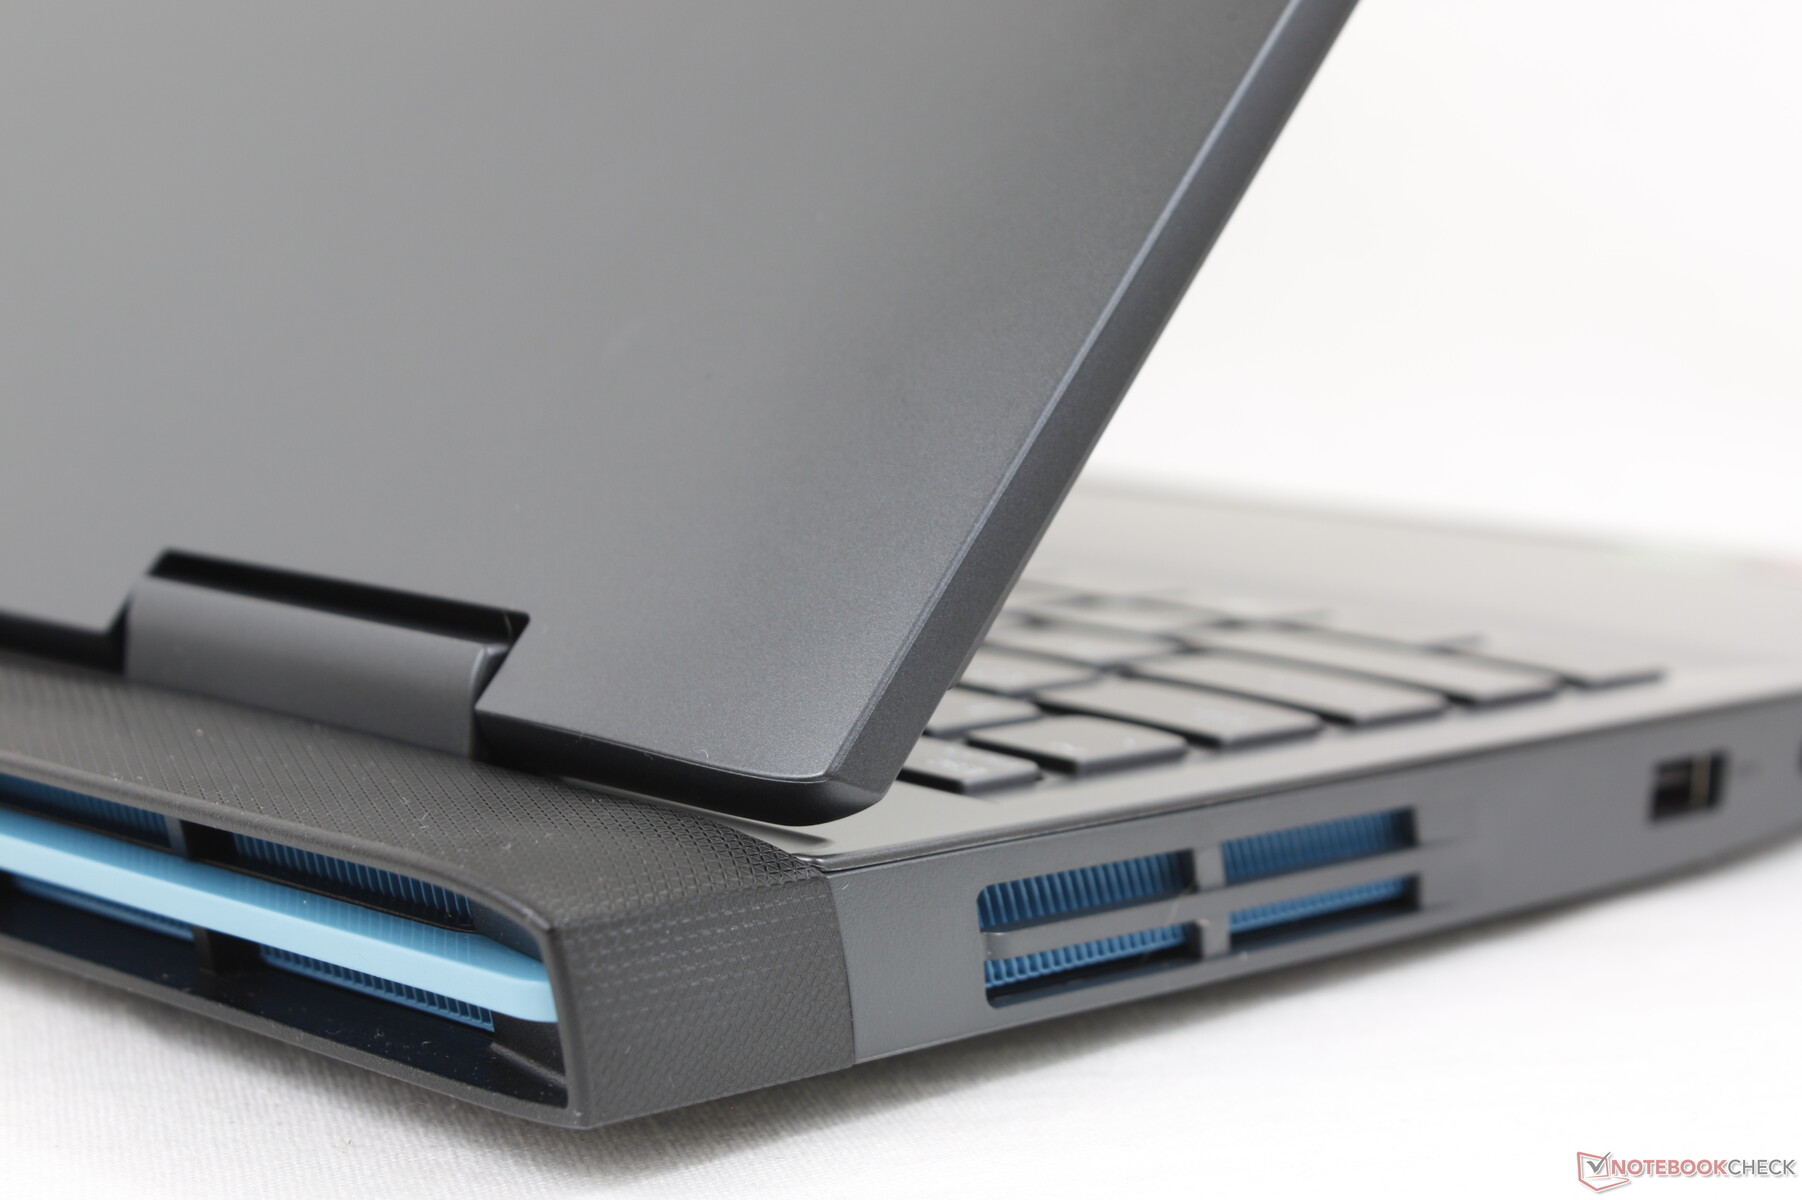
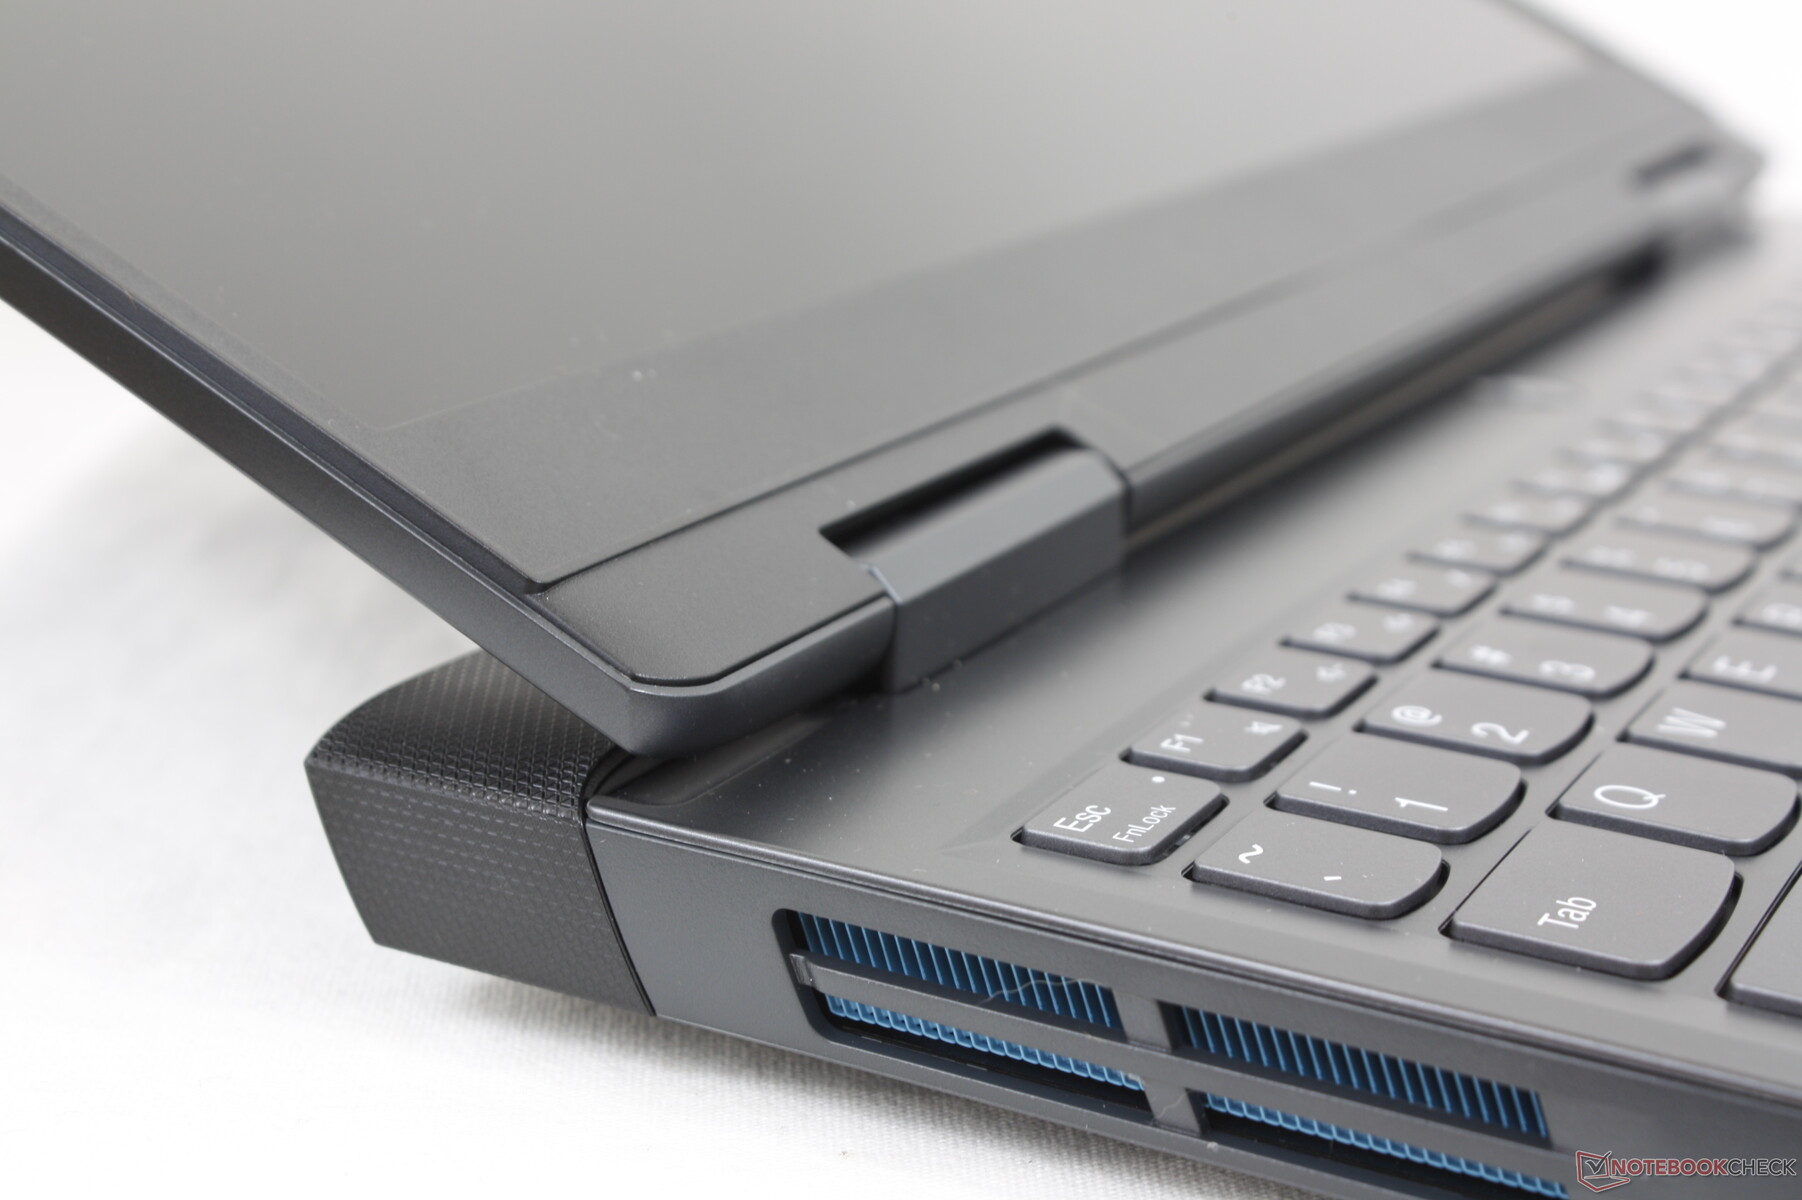
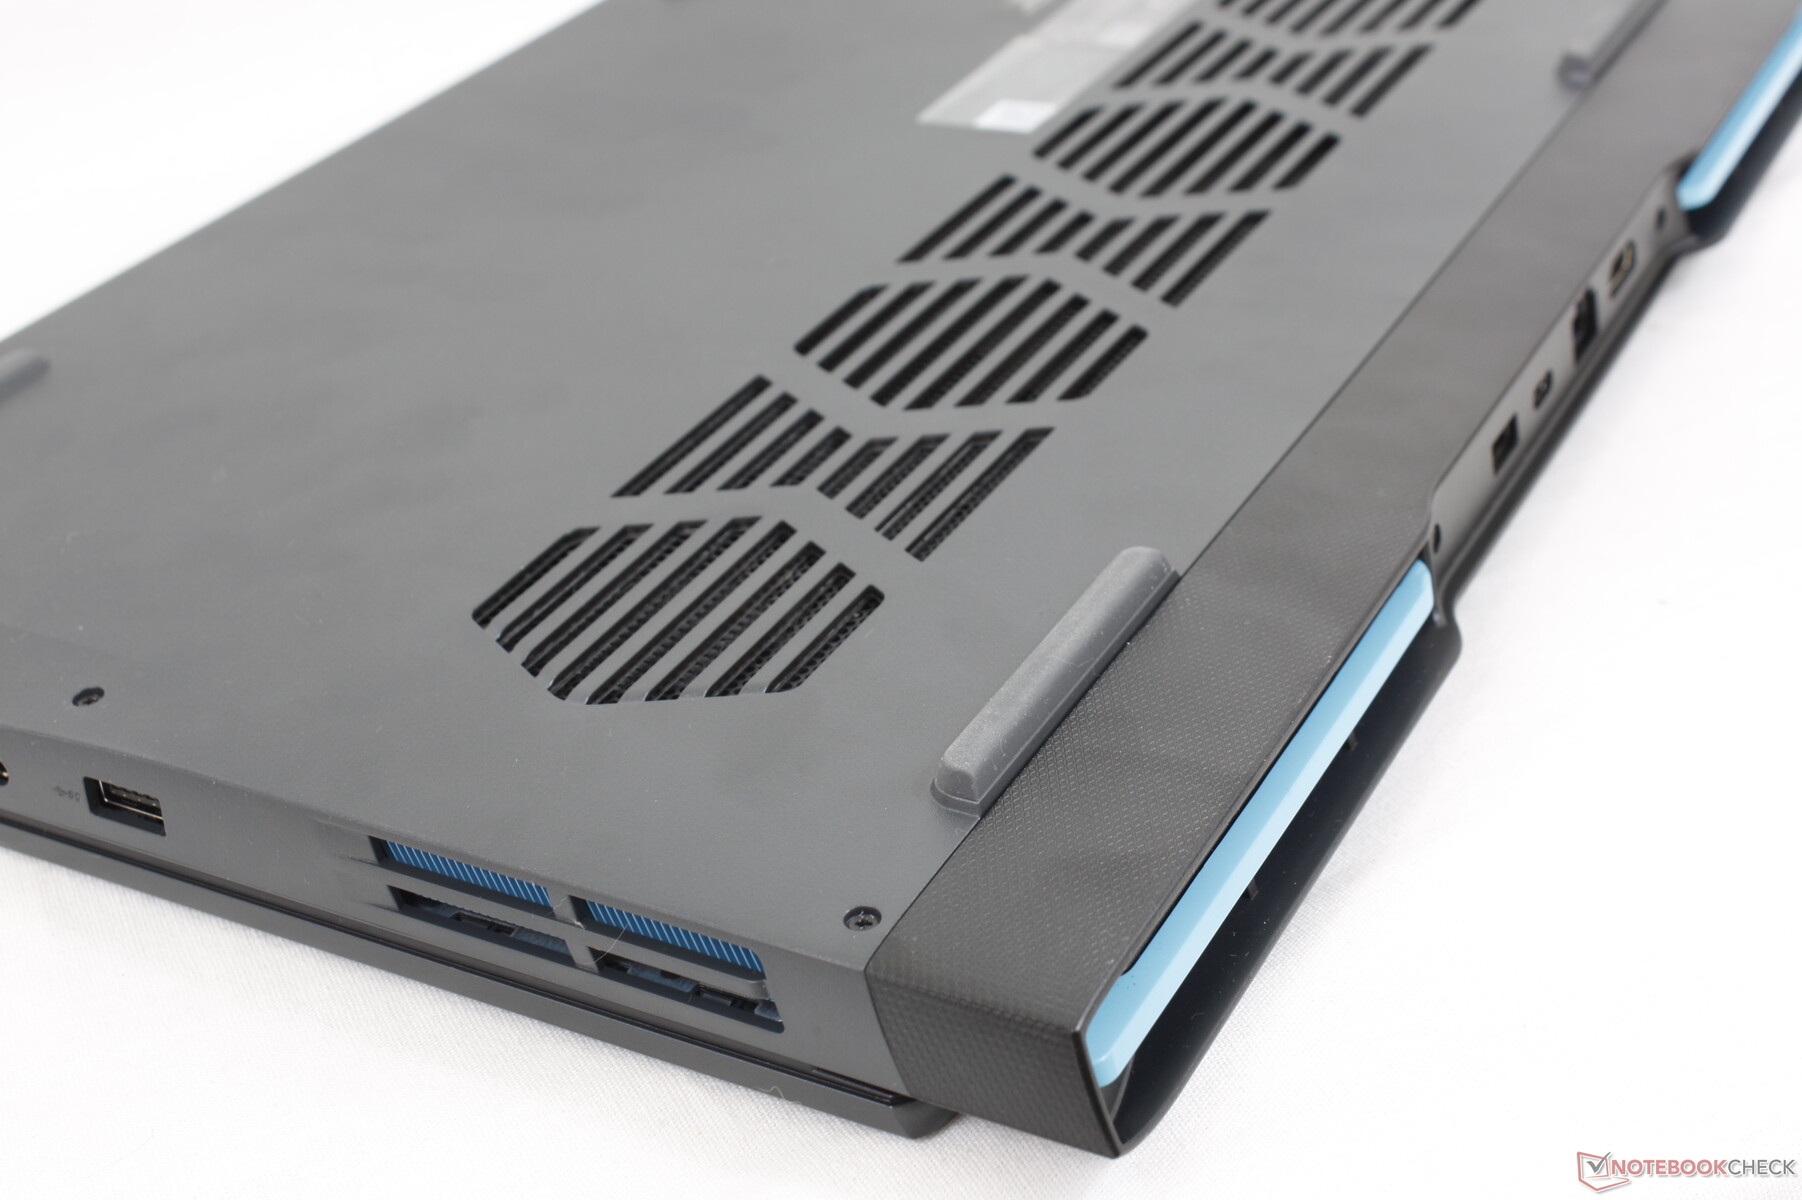
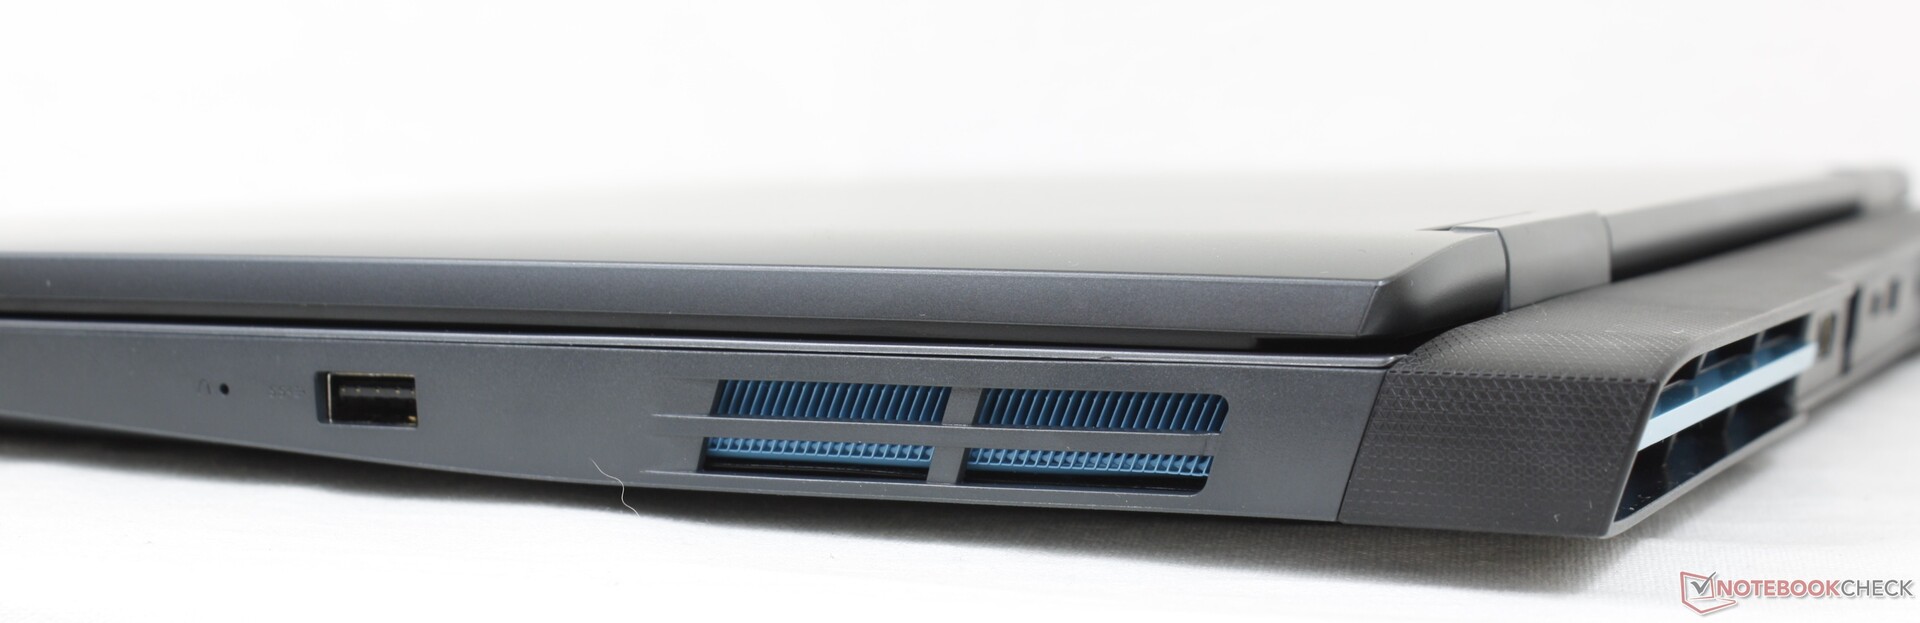
Gehäuse — Legion-inspirierte Optik
Das überarbeitete Gehäuse ist im Prinzip eine günstigere Version des Legion-5-Gehäuses; während Letzteres zum Großteil aus einer Metalllegierung besteht, setzt das neue IdeaPad Gaming 3 15 hauptsächlich auf Kunststoff. Die auffälligste optische Änderung ist das neue Heckdesign, das im Vergleich zum IdeaPad 2020 die Kühlung auf Kosten des Gewichts und den Abmessungen verbessern soll.
Im Gegensatz zu anderen günstigen Gaming-Laptops wie dem MSI GF63 und dem HP Pavilion Gaming 15 weist die Basiseinheit eine gute Gehäusestabilität und Verwindungsresistenz auf und gibt unter Druck kaum nach. Leider trifft das nicht auf die Scharniere zu, die das Display beim Ändern des Öffnungswinkel etwas zu stark hin- und herwippen lassen. Wenn man das Display ganz aufklappt, knarzt das Gehäuse, was nach langjähriger Nutzung möglicherweise problematisch werden kann.
Im Vergleich zum IdeaPad Gaming 3 aus 2020 ist unser 2022er-Modell größer und ca. 200 g schwerer. Obwohl es auch ein paar Millimeter dünner ist, macht sich das aufgrund des etwas klobigen Gehäuses insgesamt kaum bemerkbar. Die größeren Abmessungen und das höhere Gewicht stammen vom neuen, von der Legion-Reihe inspirierten langen Heck.
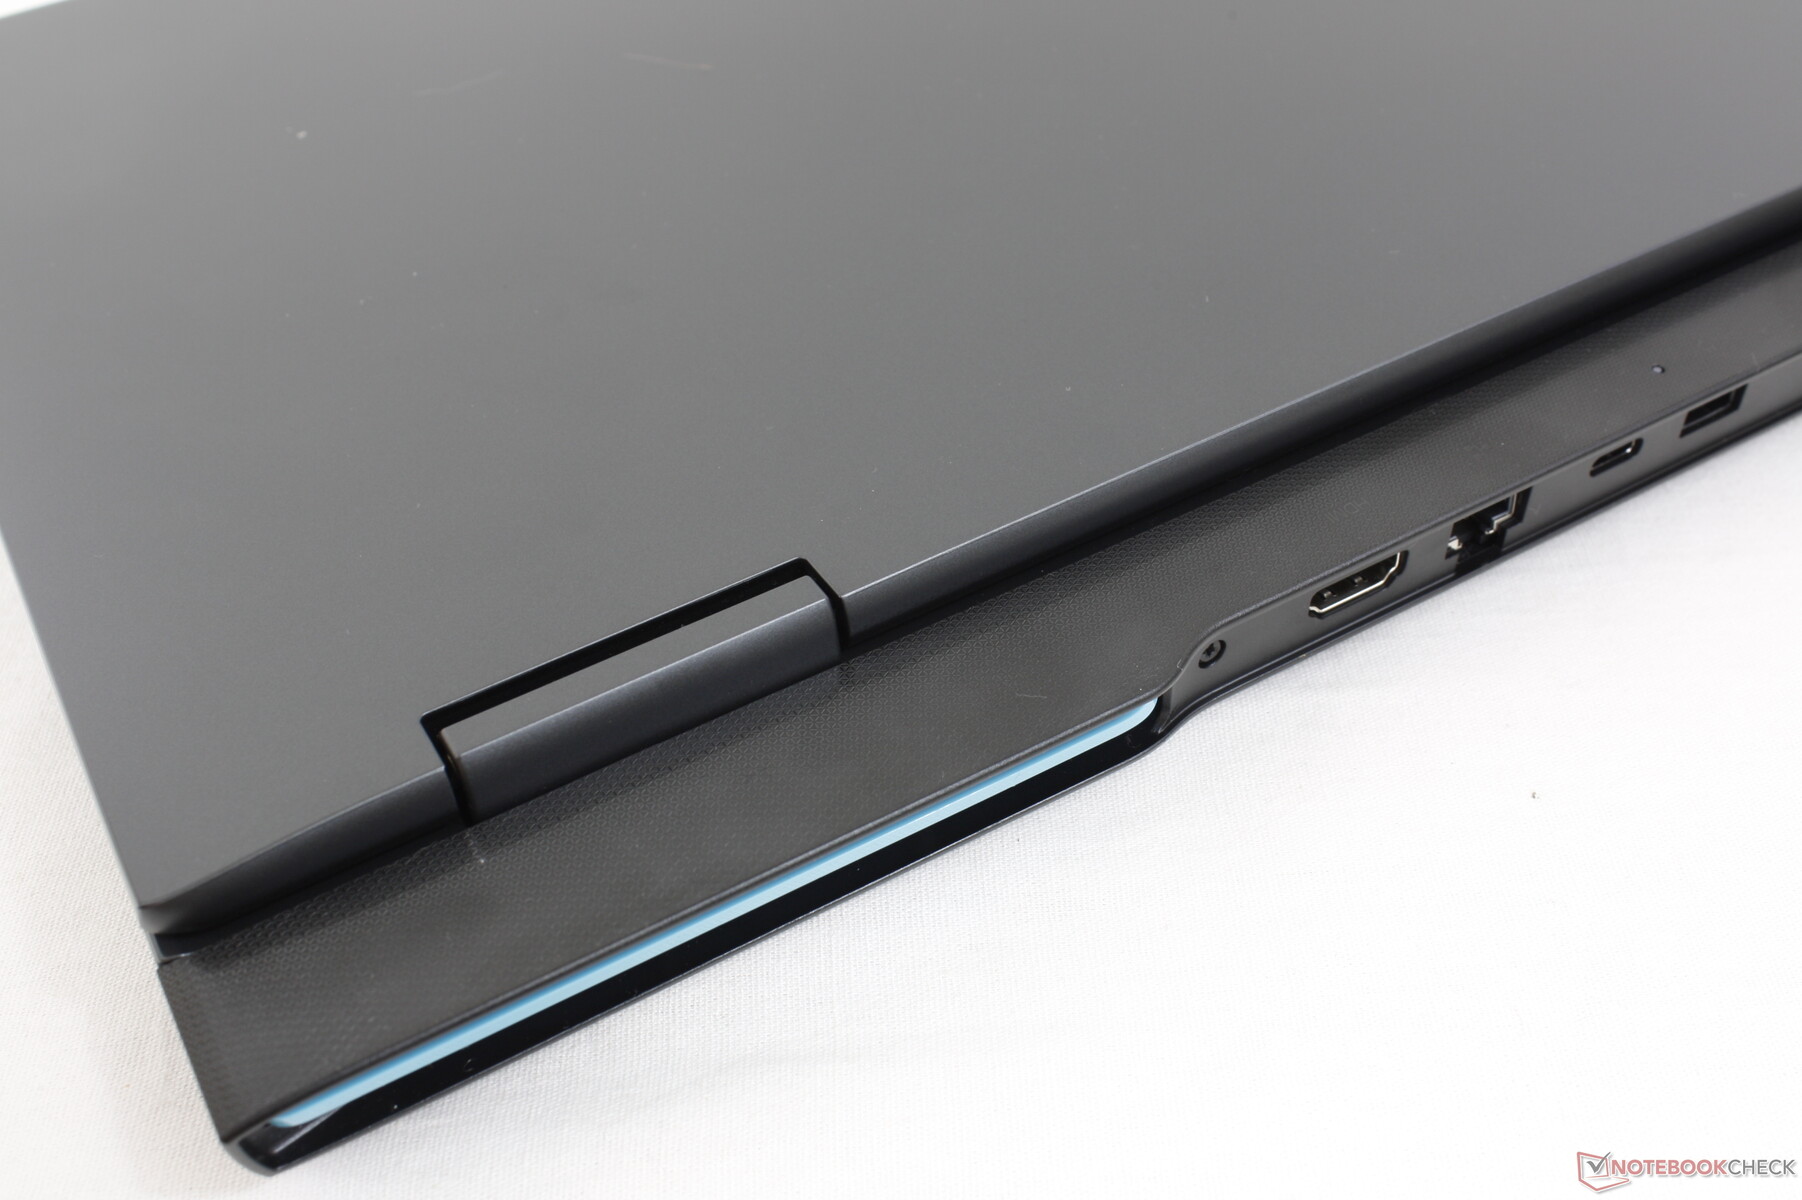
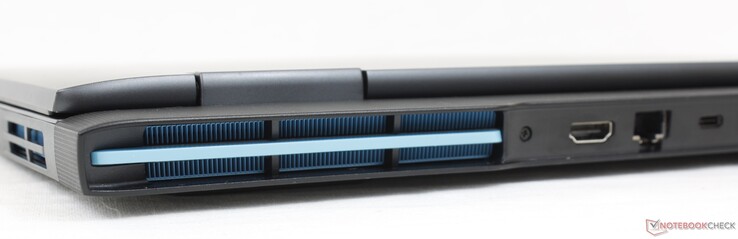
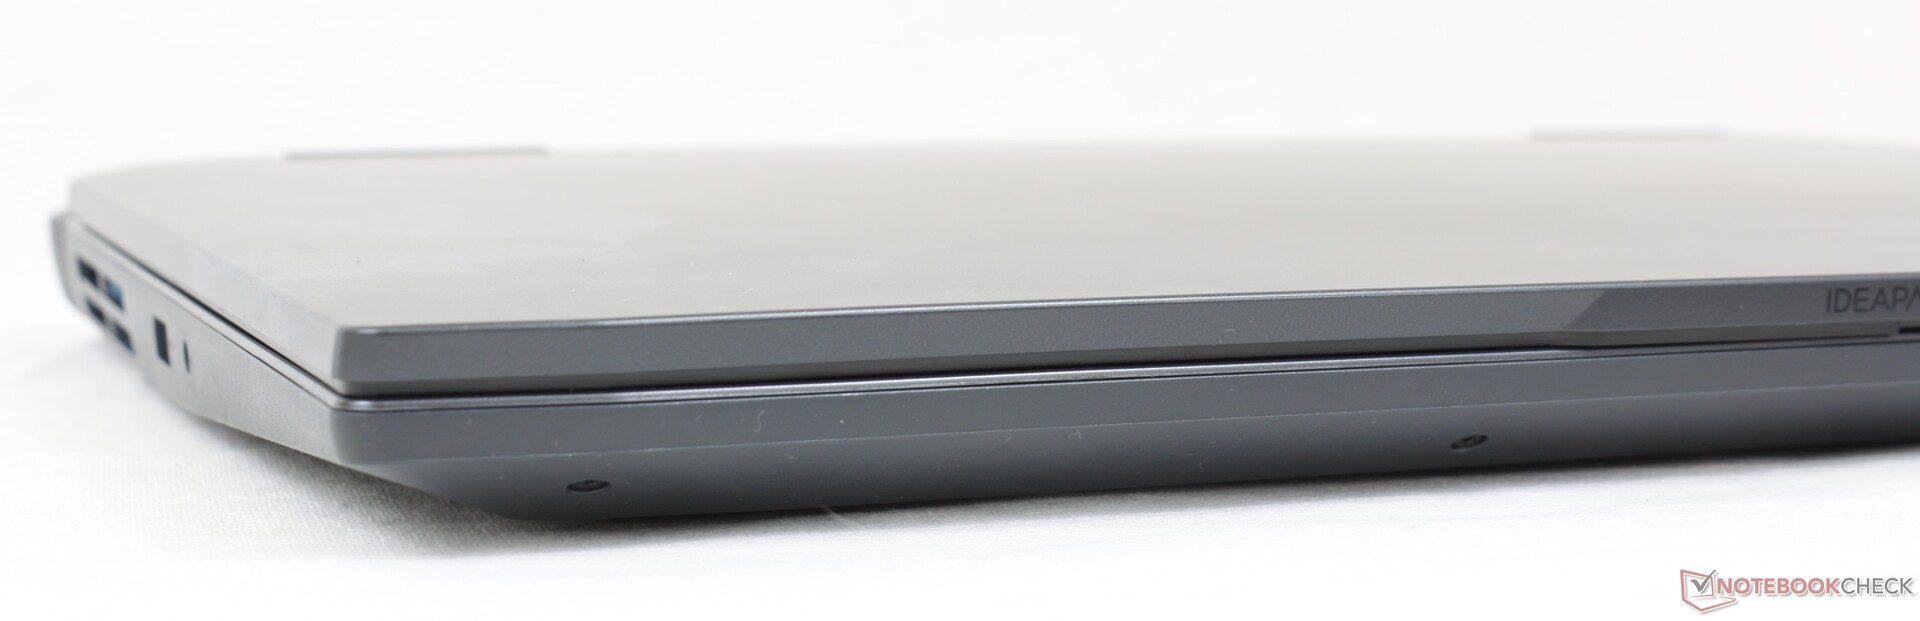
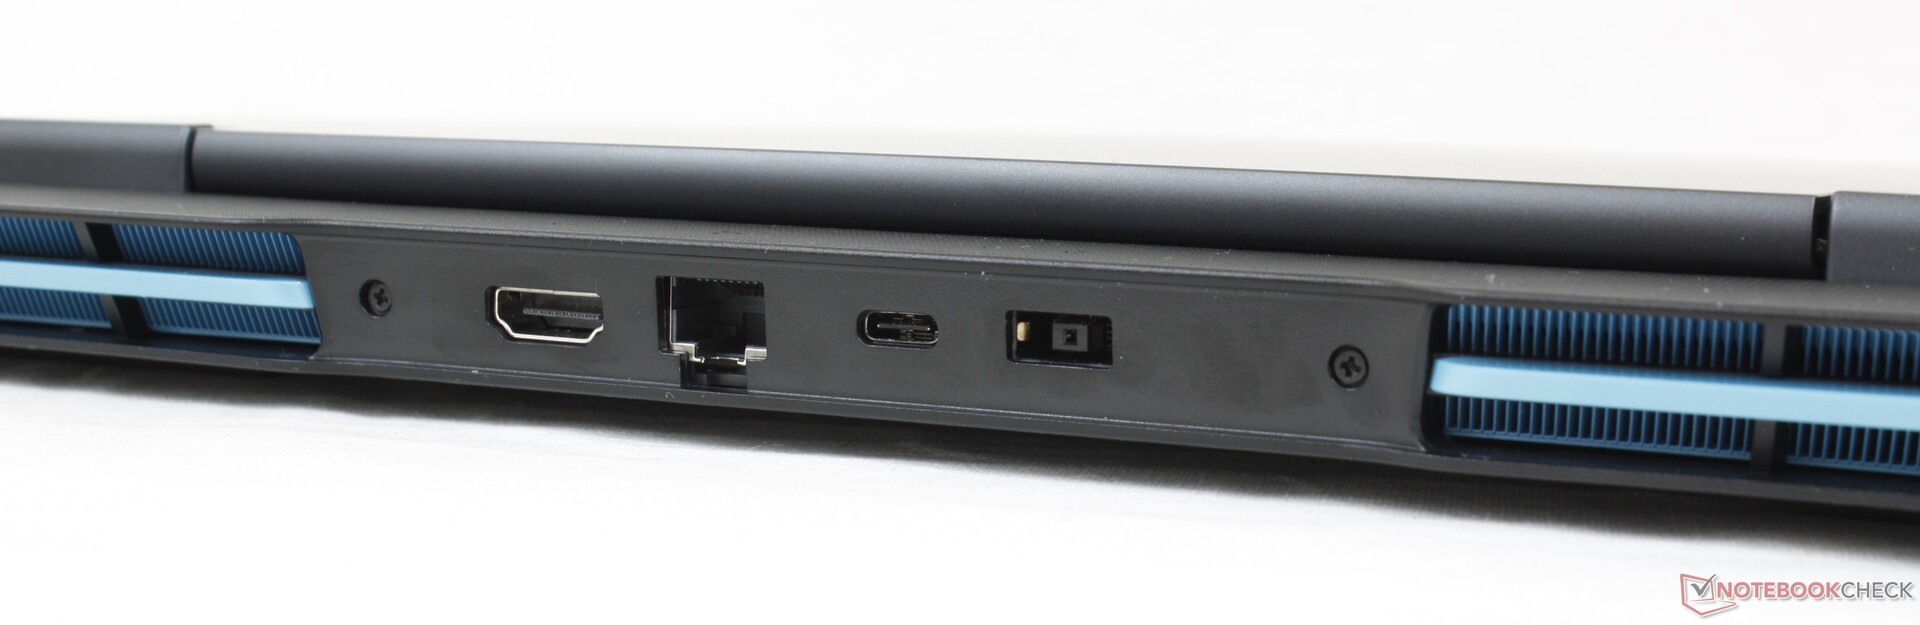
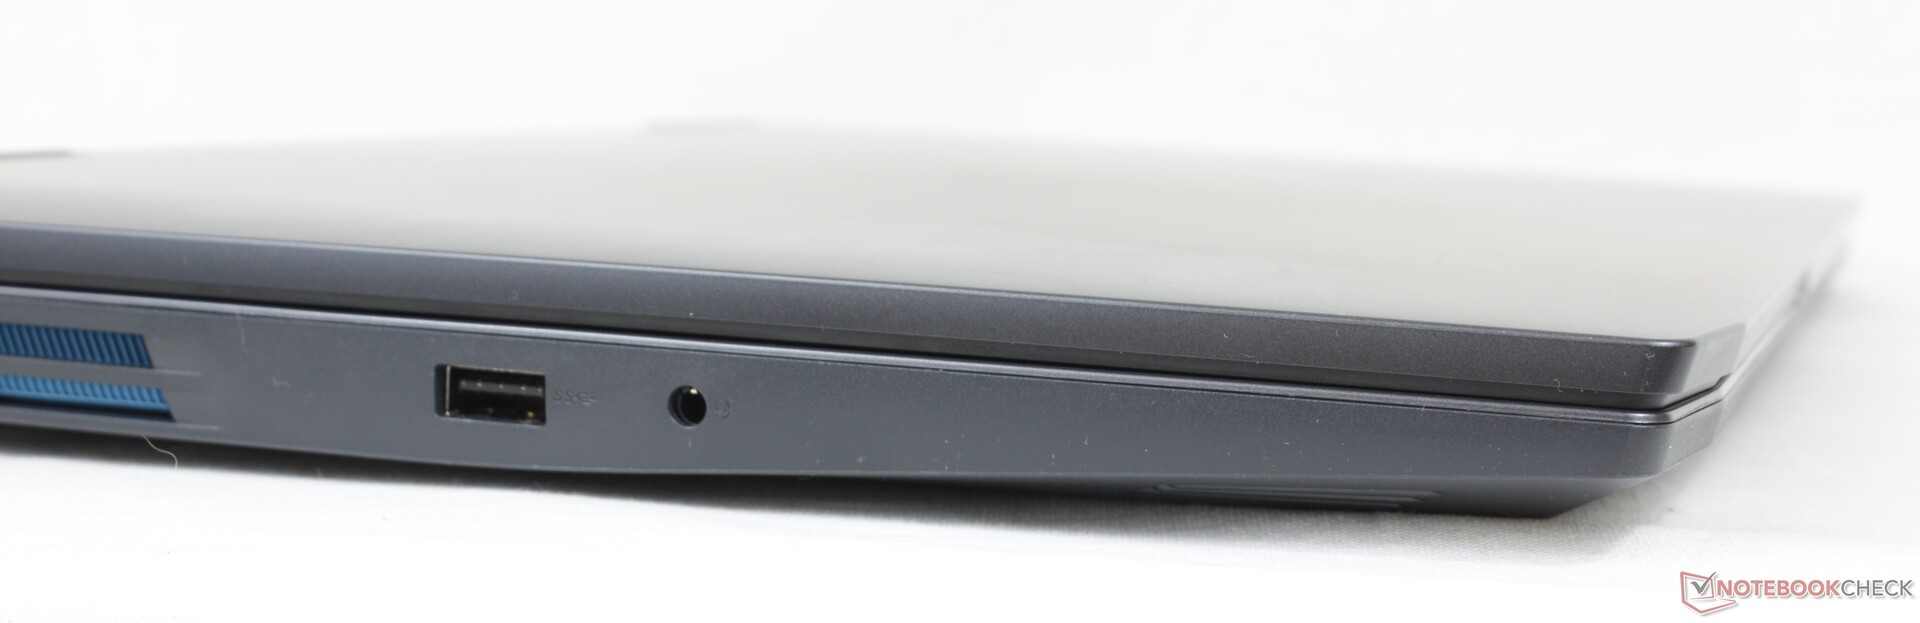
Ausstattung — Kein Thunderbolt
Die Anschlussausstattung ist ordentlich und mit der anderer günstiger Gaming-Laptops vergleichbar. Dem Anschlusslayout stehen wir hingegen mit gemischten Gefühlen gegenüber, da sich die meisten Anschlüsse auf der Rückseite befinden und dadurch schwerer zu erreichen sind. Im Gegensatz zu vielen Intel-Gaming-Laptops unterstützt unser Lenovo-Testgerät kein Thunderbolt.
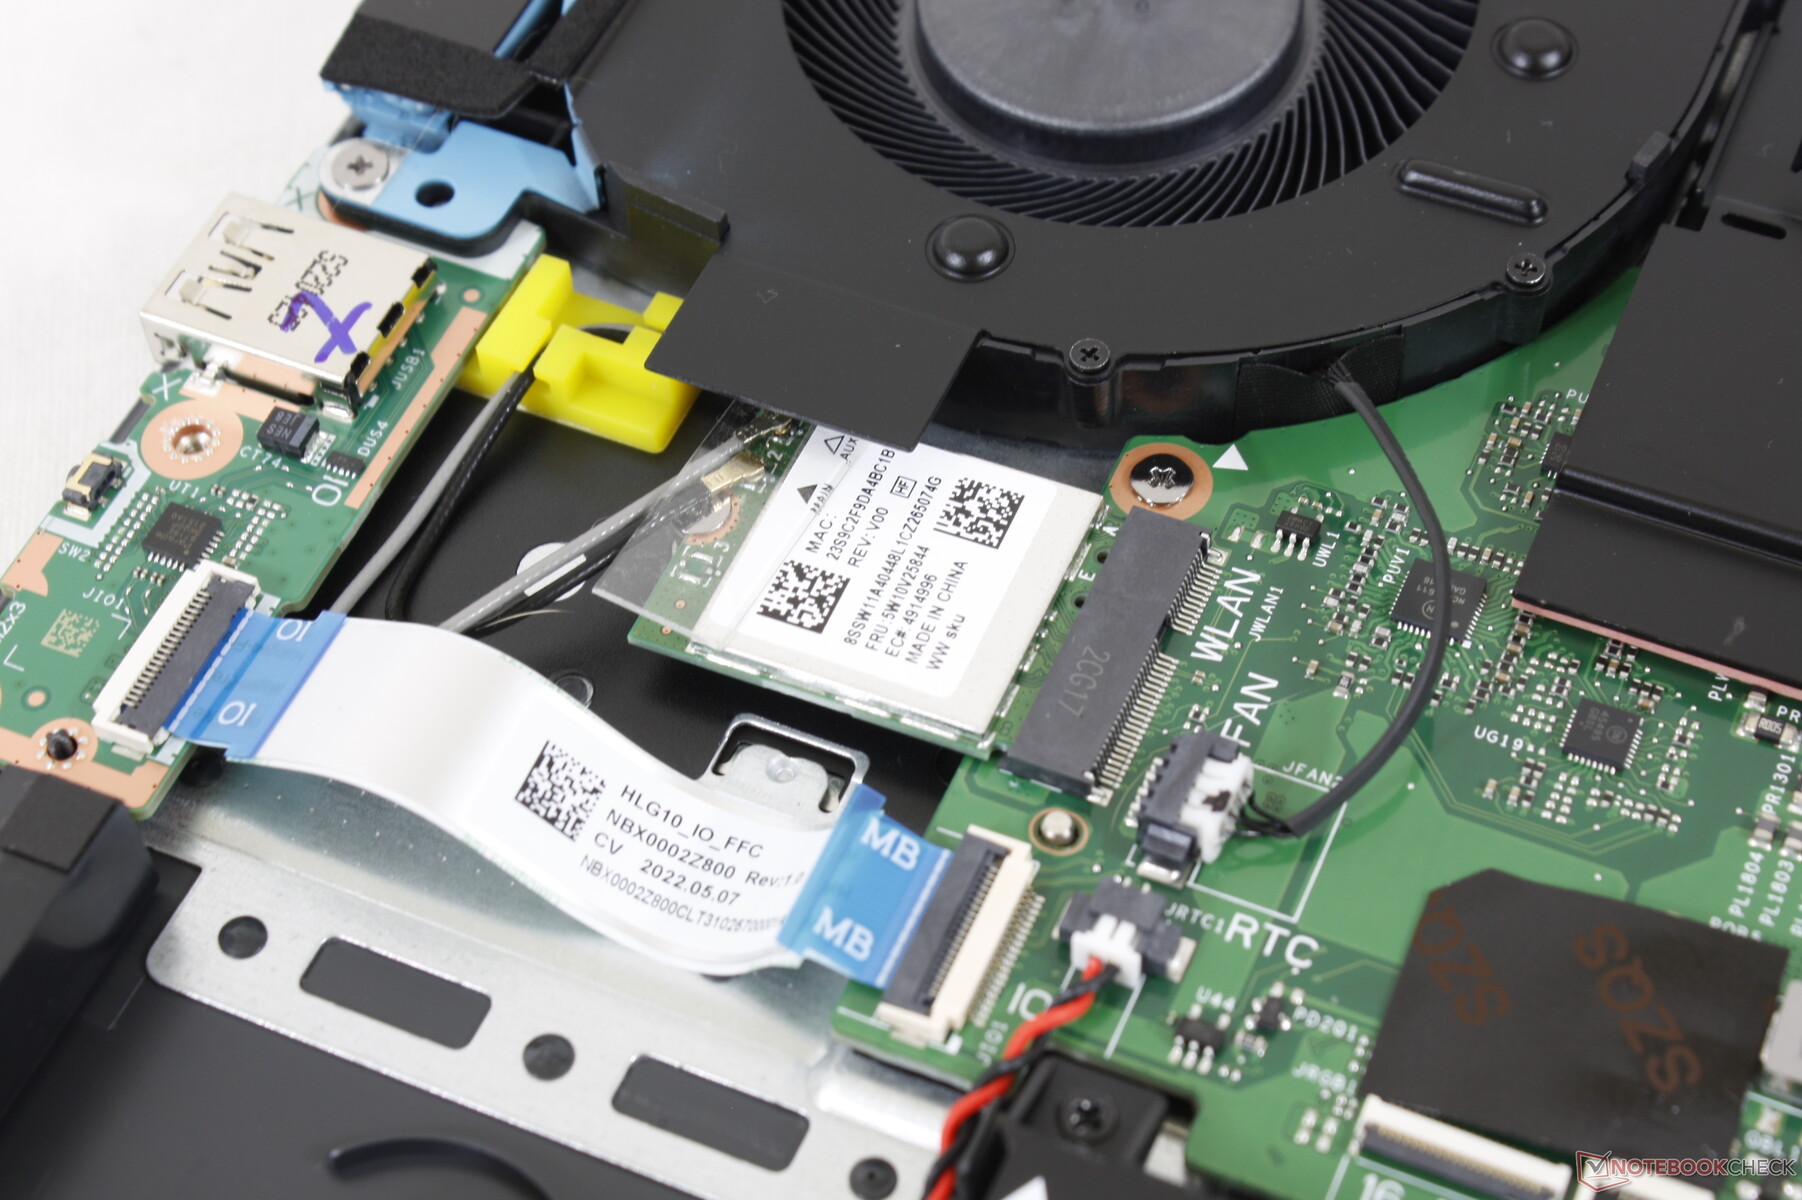
Kommunikation
Unser System ist mit dem Realtek-Modul RTL8852BE - vermutlich aus Kostengründen nicht mit einem Intel-AX-Modul - ausgestattet und unterstützt WLAN 6 und Bluetooth 5.1. Obwohl die Übertragungsraten dadurch langsamer ausfallen, sind sie dennoch konstant und schnell genug für die meisten Anwendungsfälle wie 4K-Videostreaming und Downloads.
| Networking | |
| iperf3 transmit AX12 | |
| Lenovo Legion 5 15ACH6A-82NW0010GE | |
| Lenovo IdeaPad Gaming 3i 15IMH05 | |
| iperf3 receive AX12 | |
| Lenovo Legion 5 15ACH6A-82NW0010GE | |
| Lenovo IdeaPad Gaming 3i 15IMH05 | |
| iperf3 receive AXE11000 | |
| Gigabyte A5 K1 | |
| Dell G15 5510 | |
| Asus TUF Dash F15 FX517ZR | |
| Lenovo IdeaPad Gaming 3 15ARH7 | |
| iperf3 transmit AXE11000 | |
| Gigabyte A5 K1 | |
| Asus TUF Dash F15 FX517ZR | |
| Lenovo IdeaPad Gaming 3 15ARH7 | |
Webcam
Da die verbaute Webcam eine Auflösung von nur 1 MP besitzt, ist die Darstellungsqualität matschig. Eine Webcam-Abdeckung ist zwar vorhanden, IR für Windows-Hello-Unterstützung fehlt jedoch.


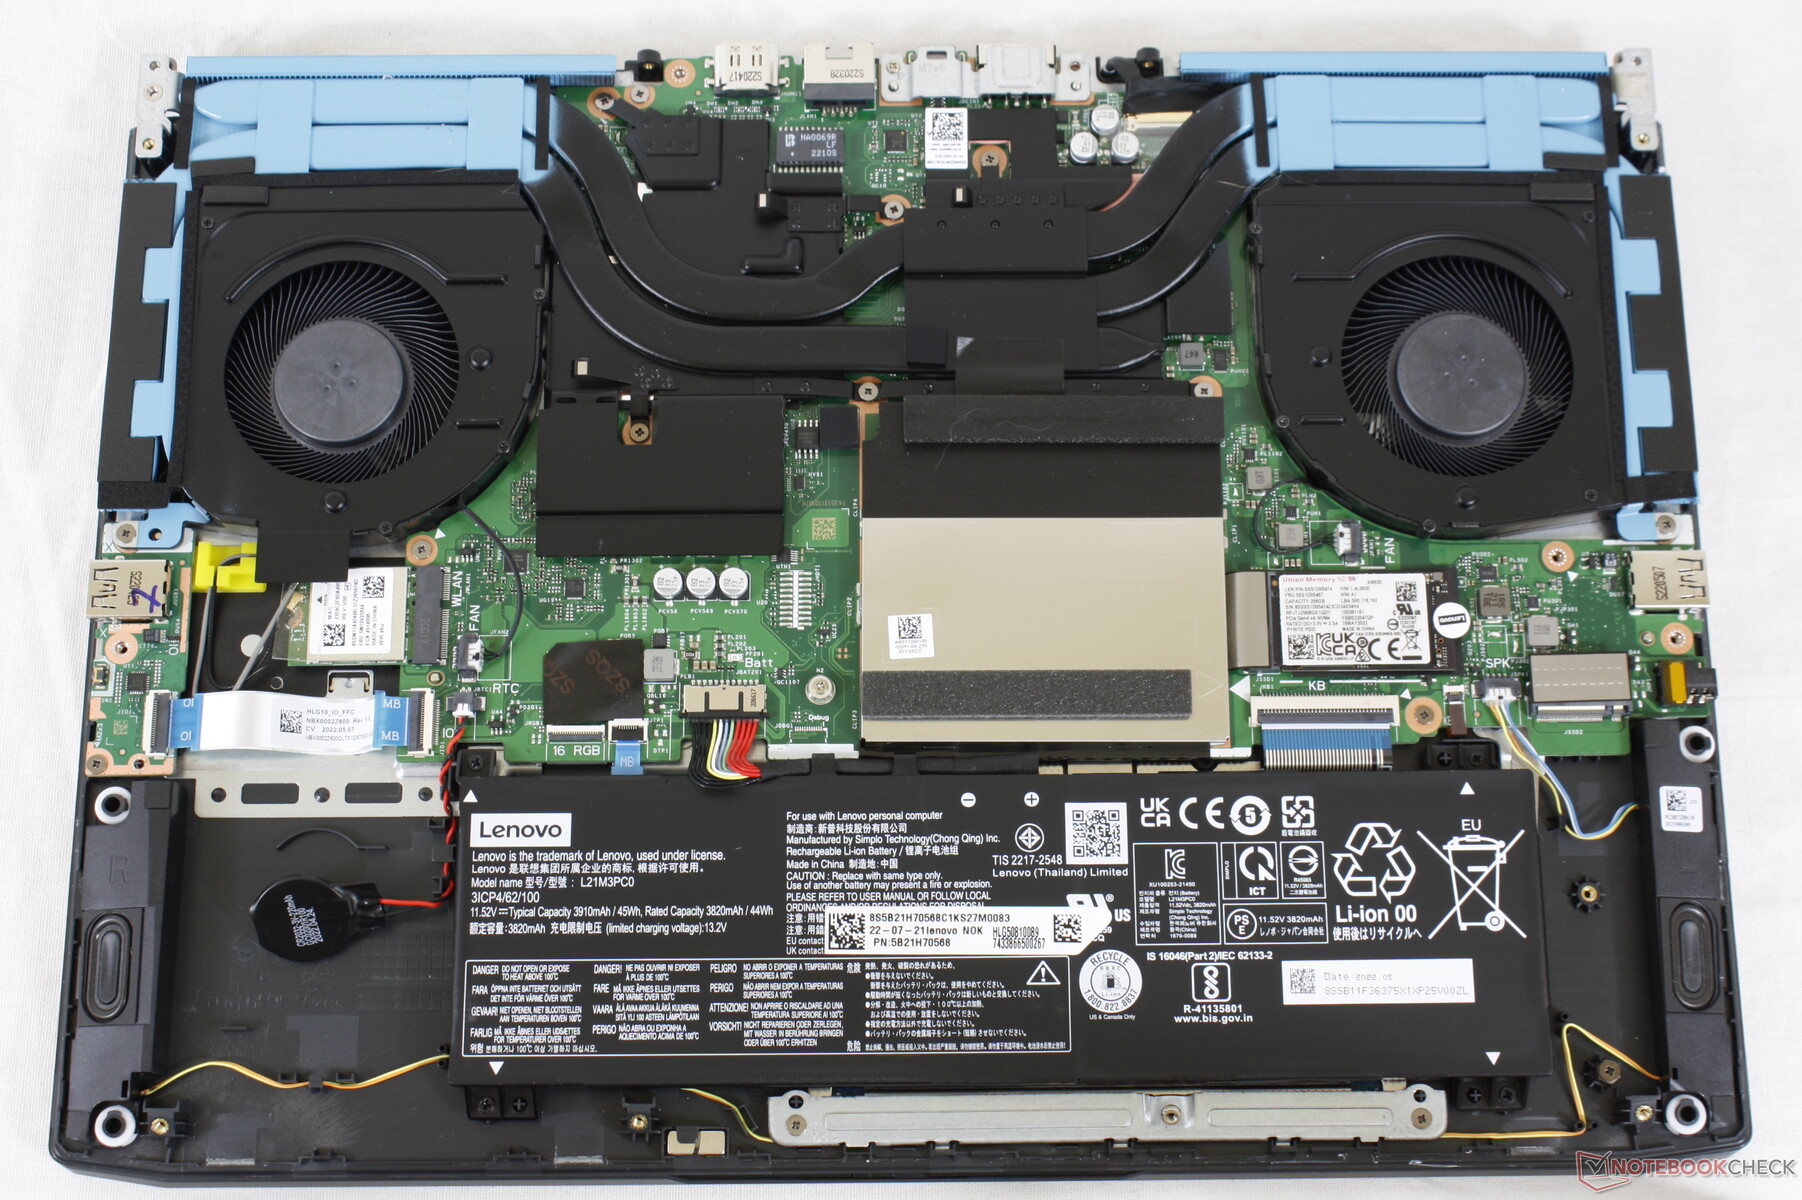
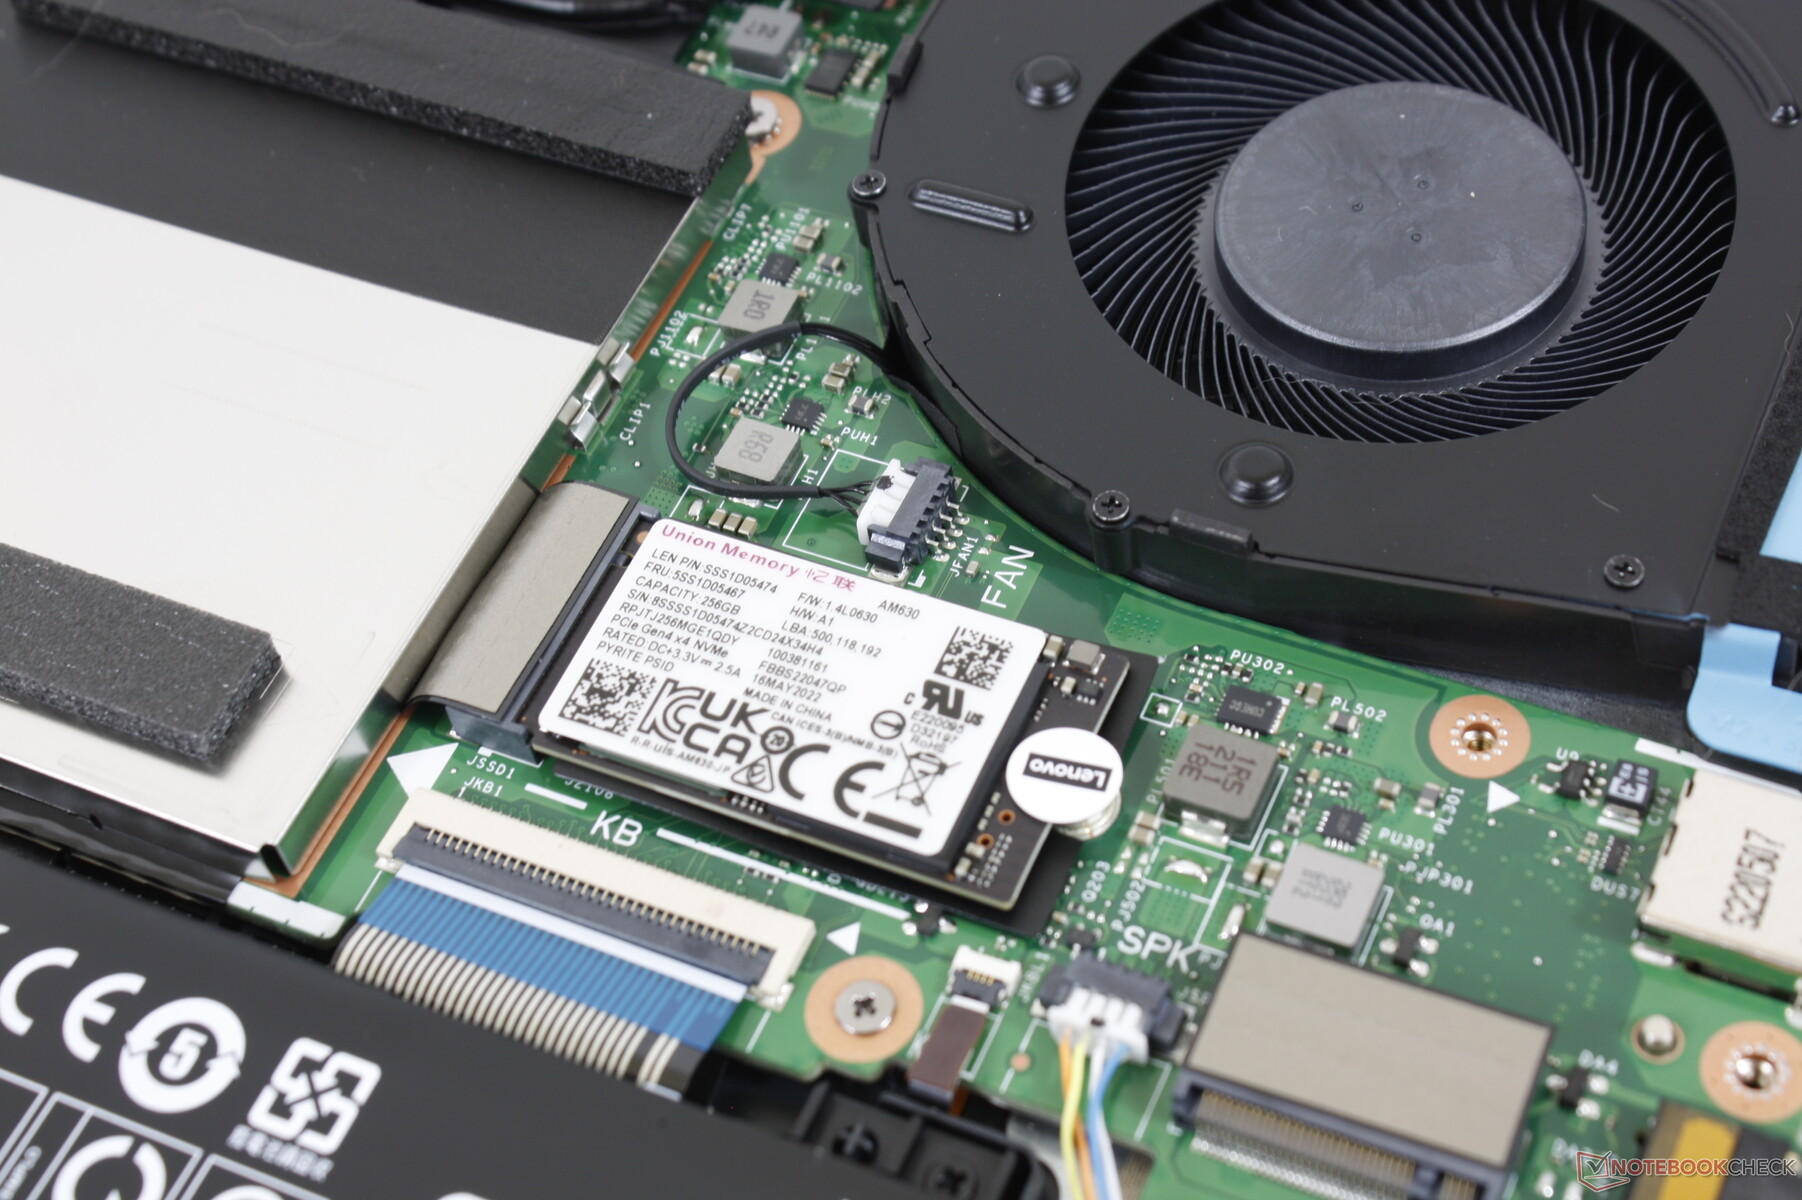
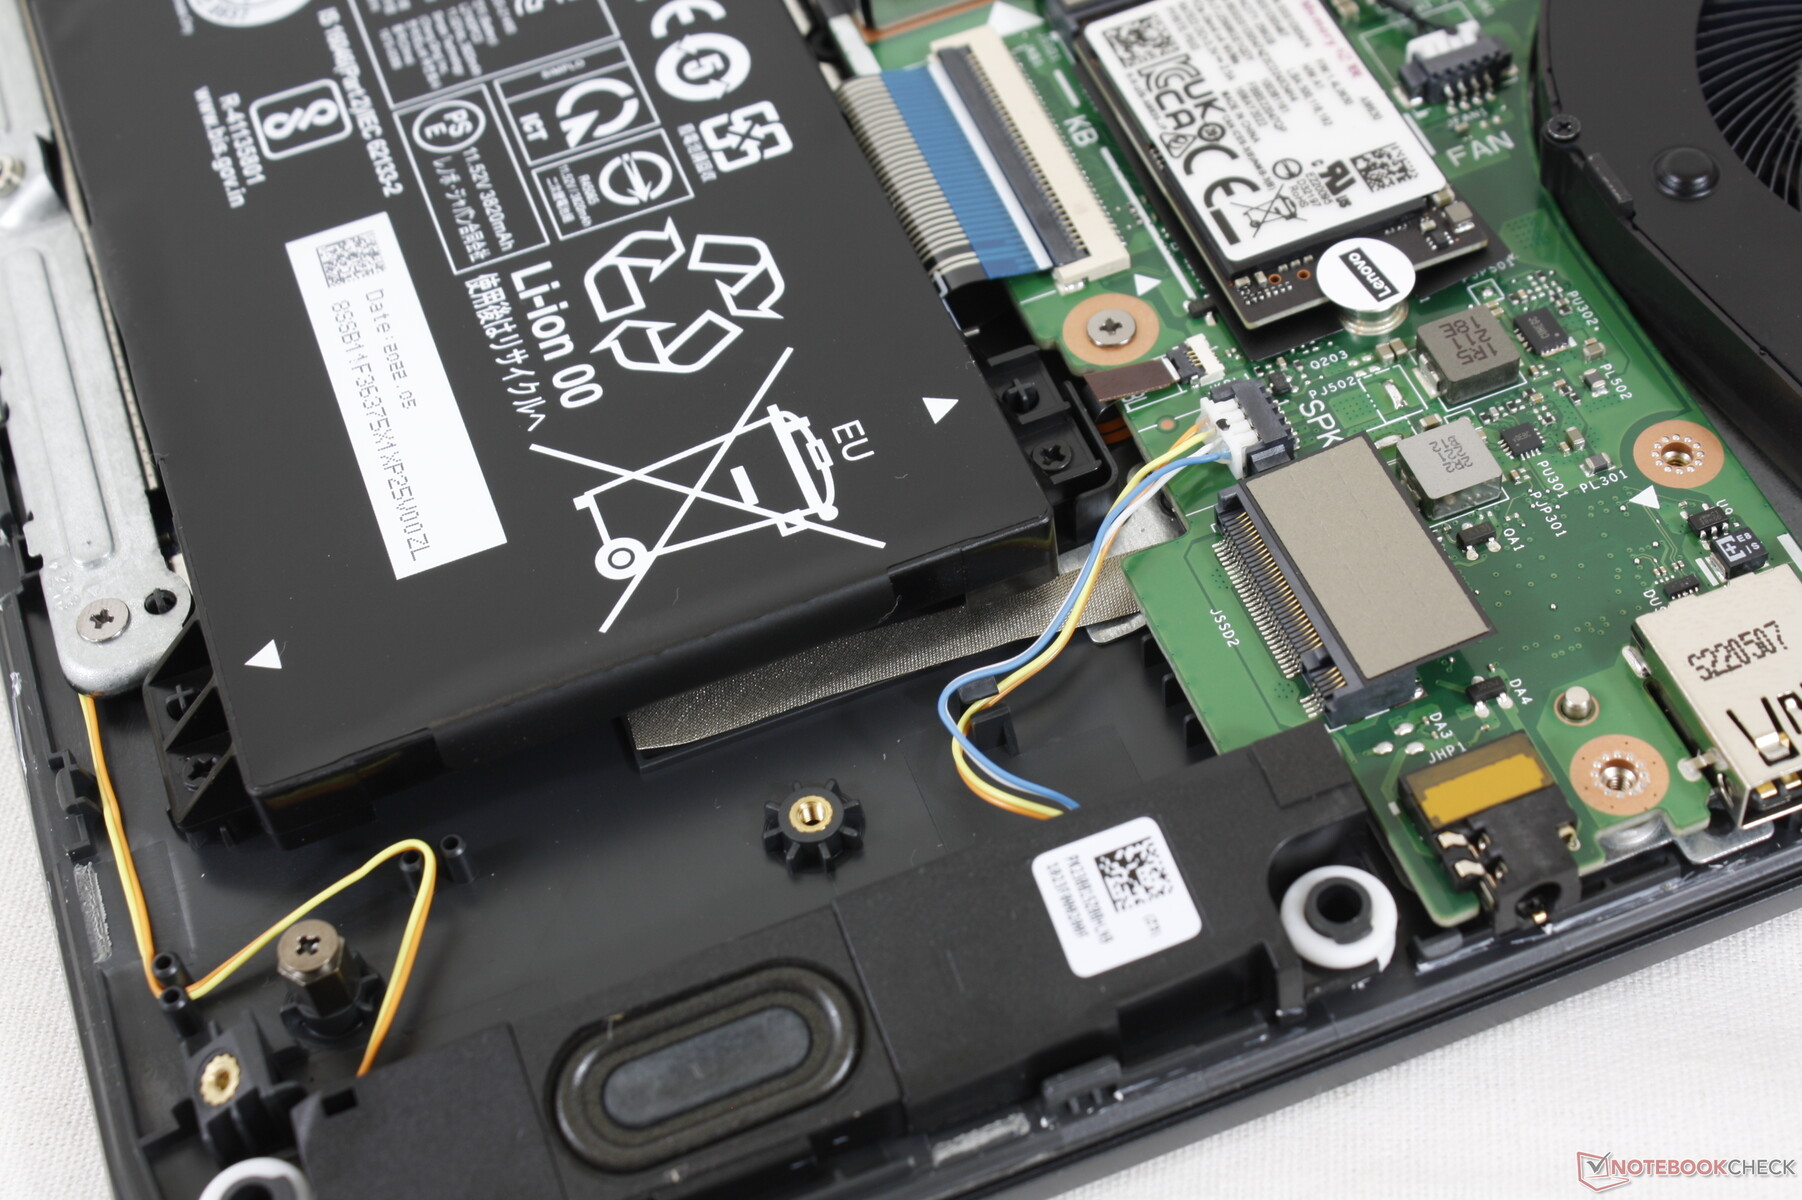
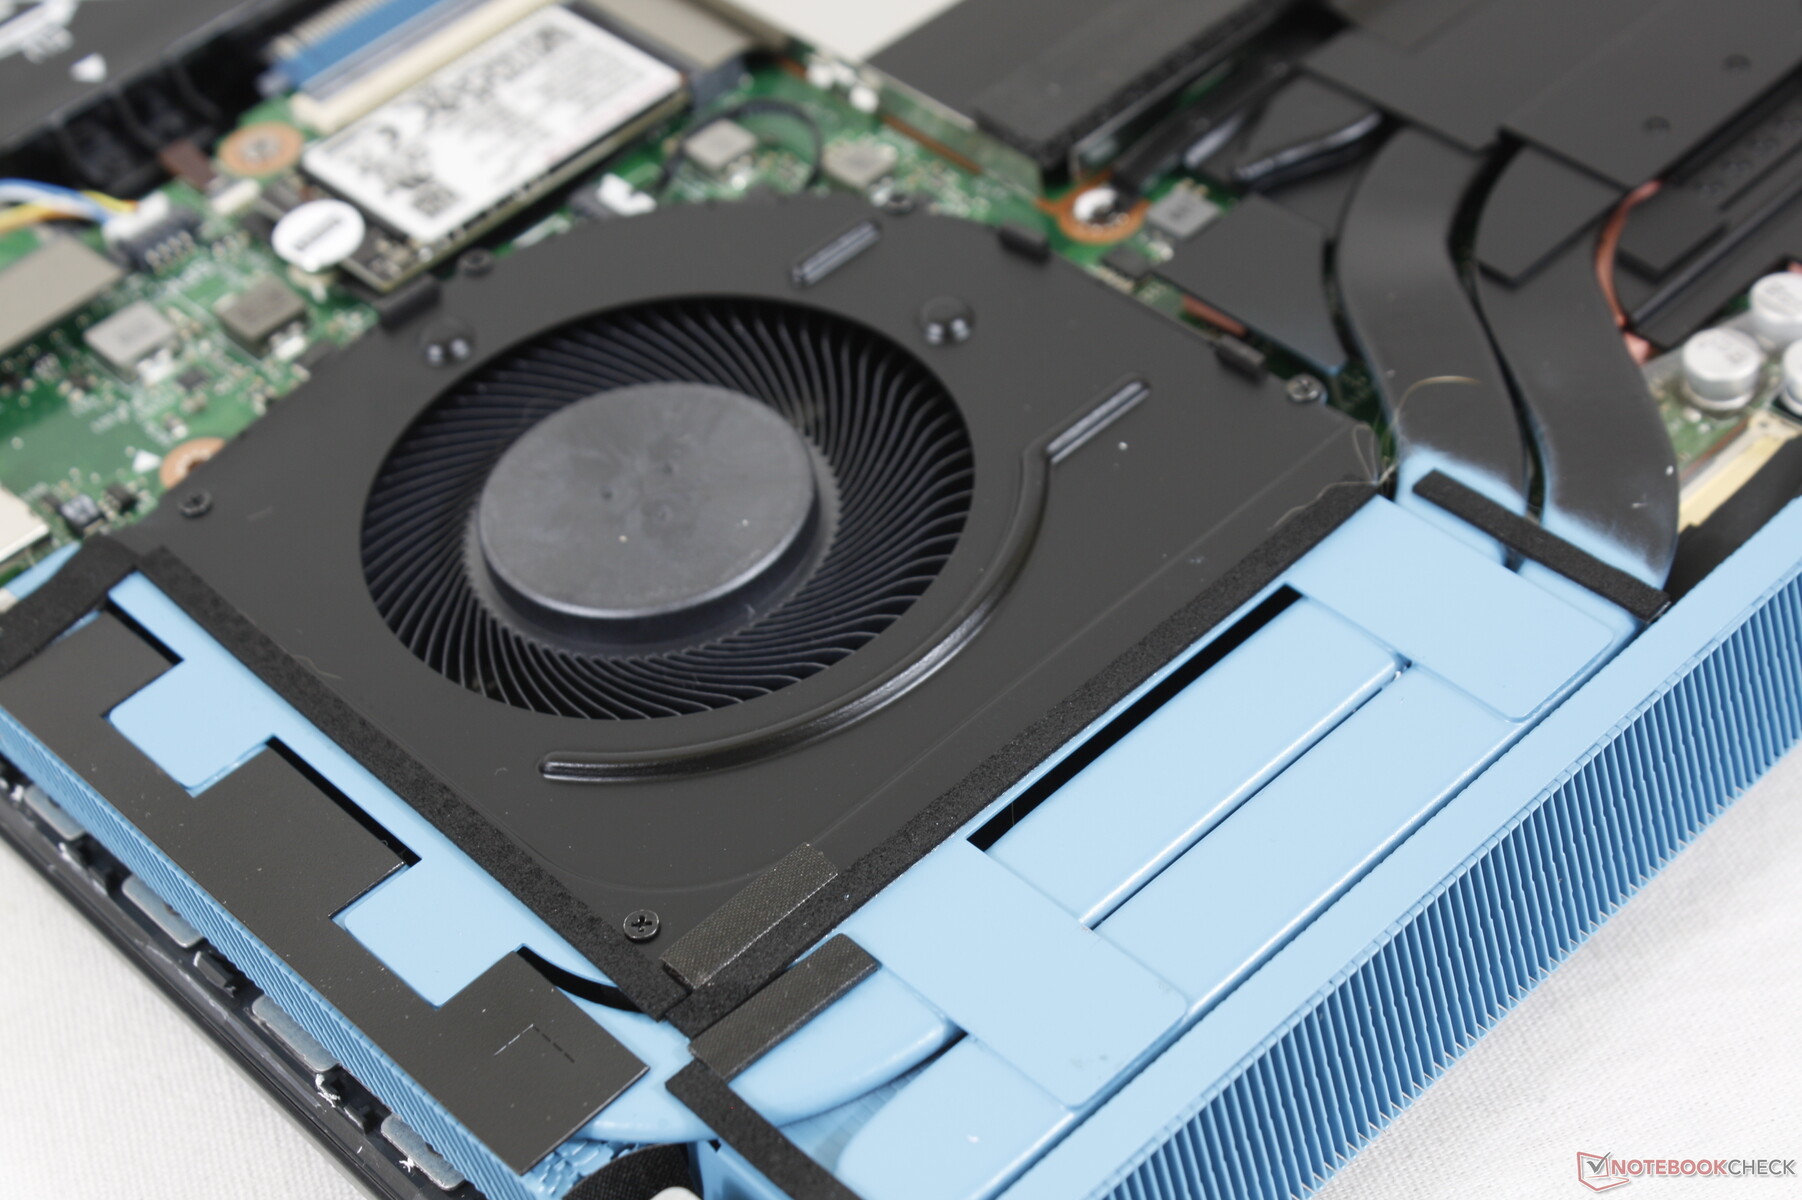
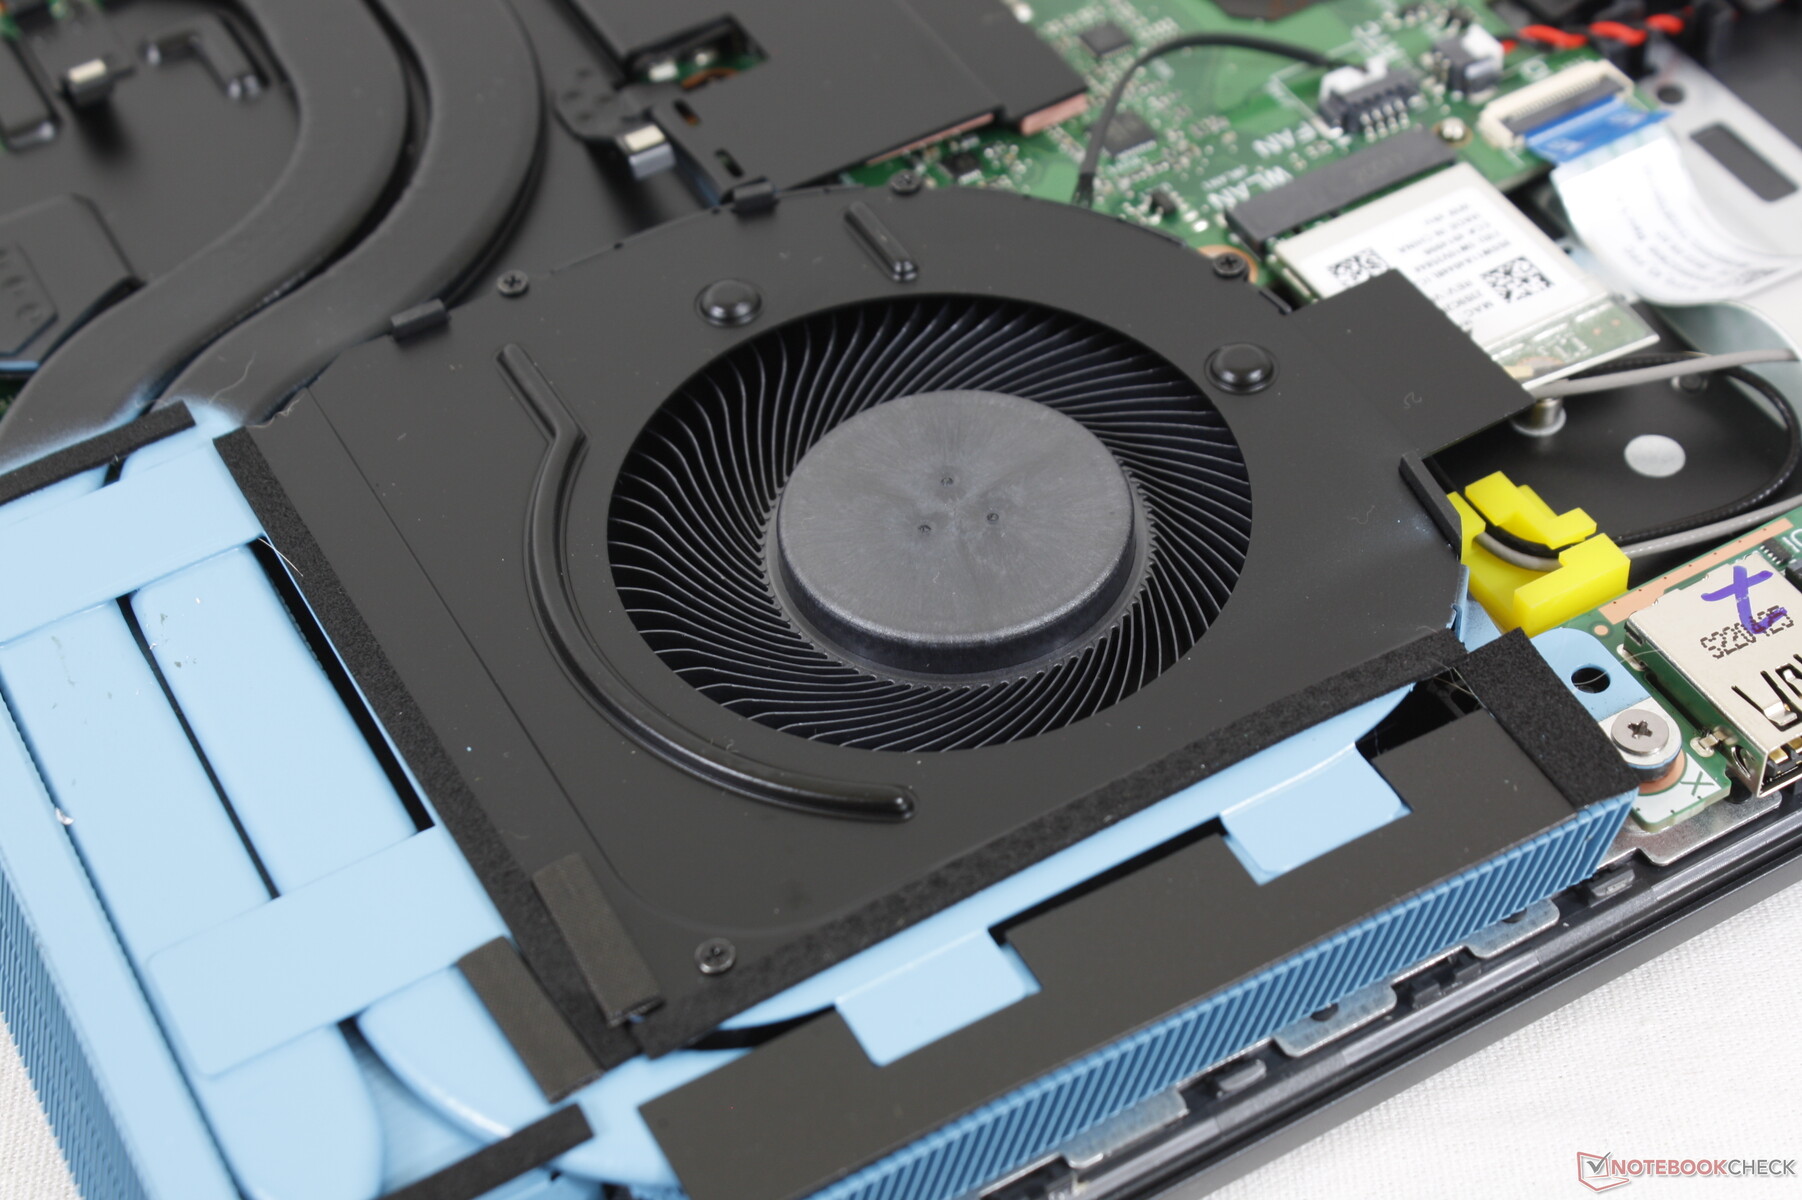
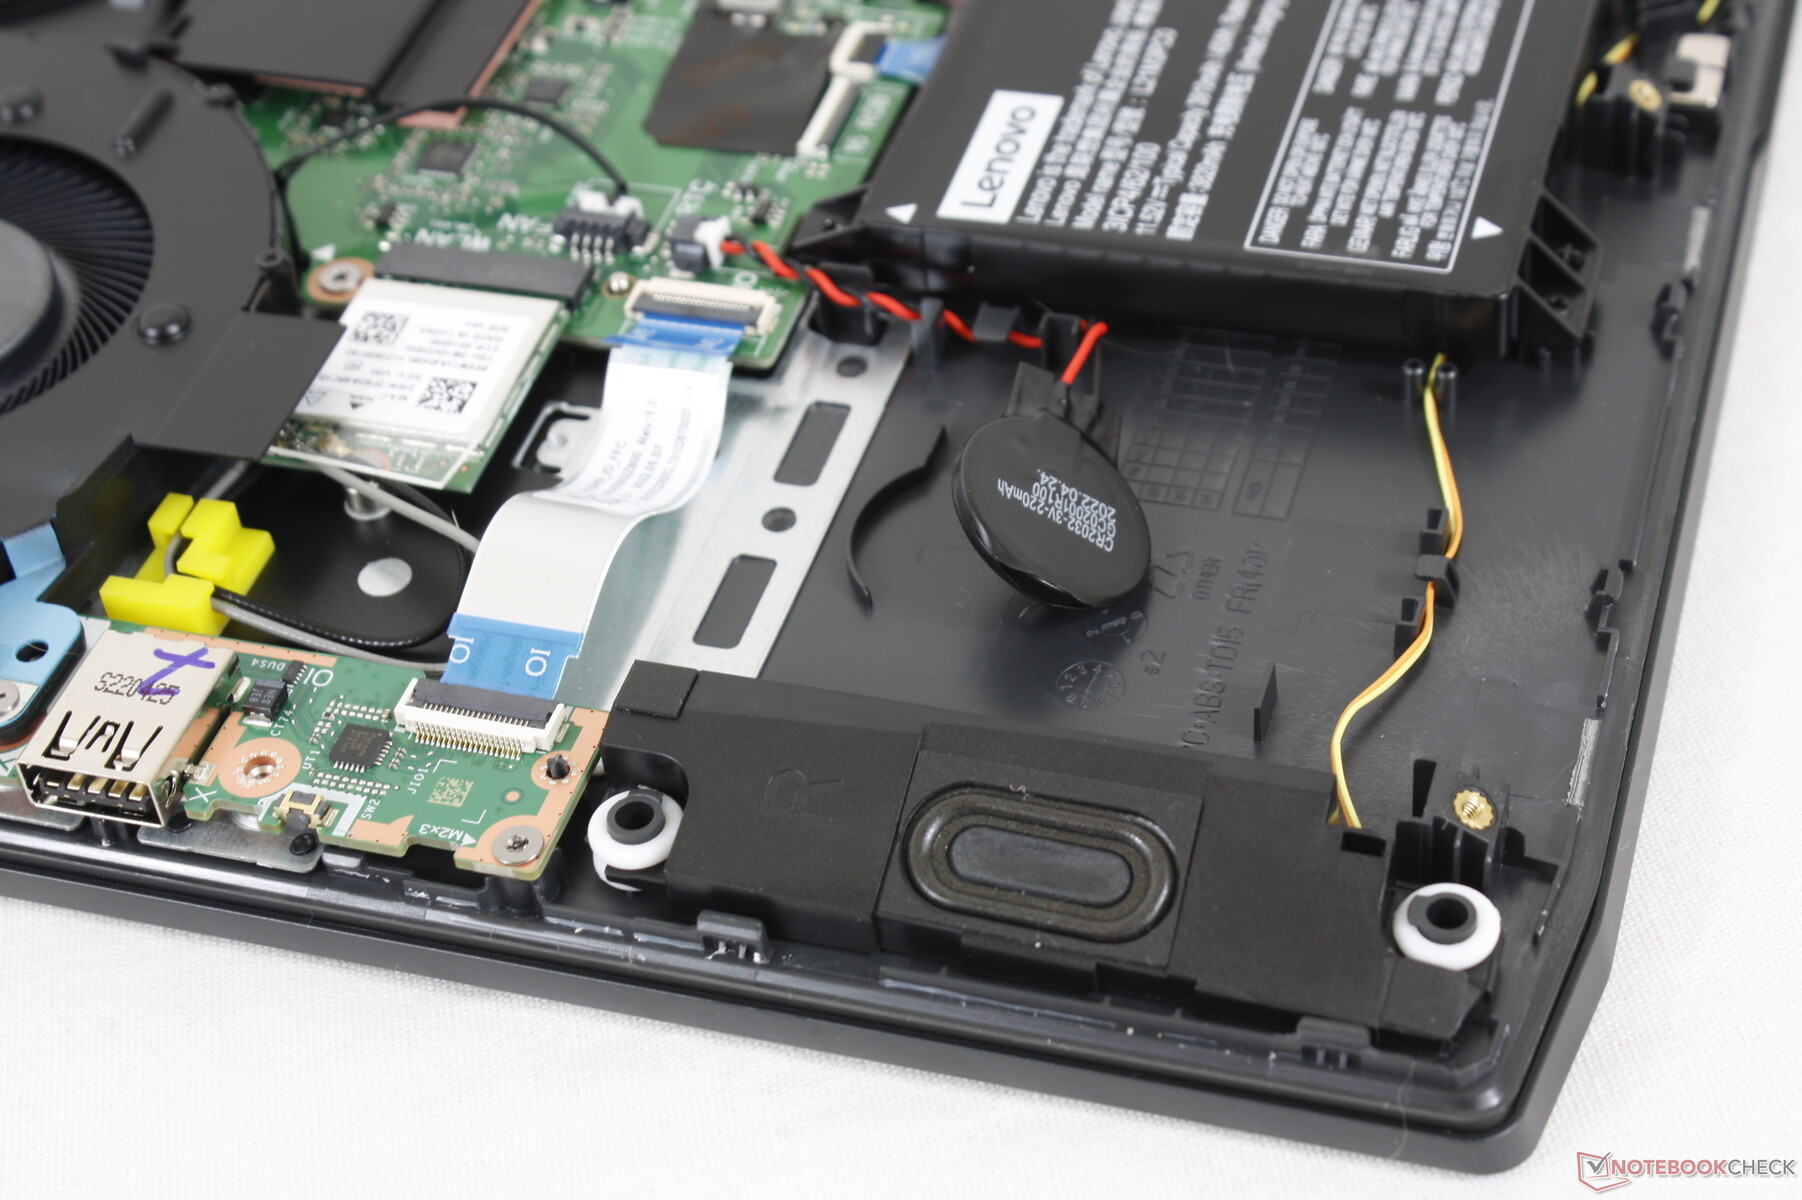
Wartung — Zu schwer zu öffnen
Die Bodenplatte lässt sich nur mit sehr viel Aufwand entfernen. Von den insgesamt 12 Kreuzschrauben sind nur 8 direkt zugänglich. Um zu den restlichen 4 zu gelangen, muss die hintere Schale, die ihrerseits durch 2 weitere Schrauben in der Nähe der hinteren Anschlüsse gesichert ist, zuerst abgenommen werden. Das Entfernen der hinteren Schale ist ein zusätzlicher Schritt, der bei den meisten Gaming-Laptops entfällt. Dass Lenovo gute Wartungsoptionen beim IdeaPad 3 15 vernachlässigt hat ist offensichtlich und in Anbetracht der vielen Aufrüstungsmöglichkeiten wie den beiden SODIMM-Slots und den beiden M.2-Speicherschächten schade.
Garantie und Zubehör
Abgesehen von dem Netzteil und den üblichen Dokumenten befinden sich keine Extras im Lieferumfang. Es gilt die standardmäßige, eingeschränkte einjährige Garantie.
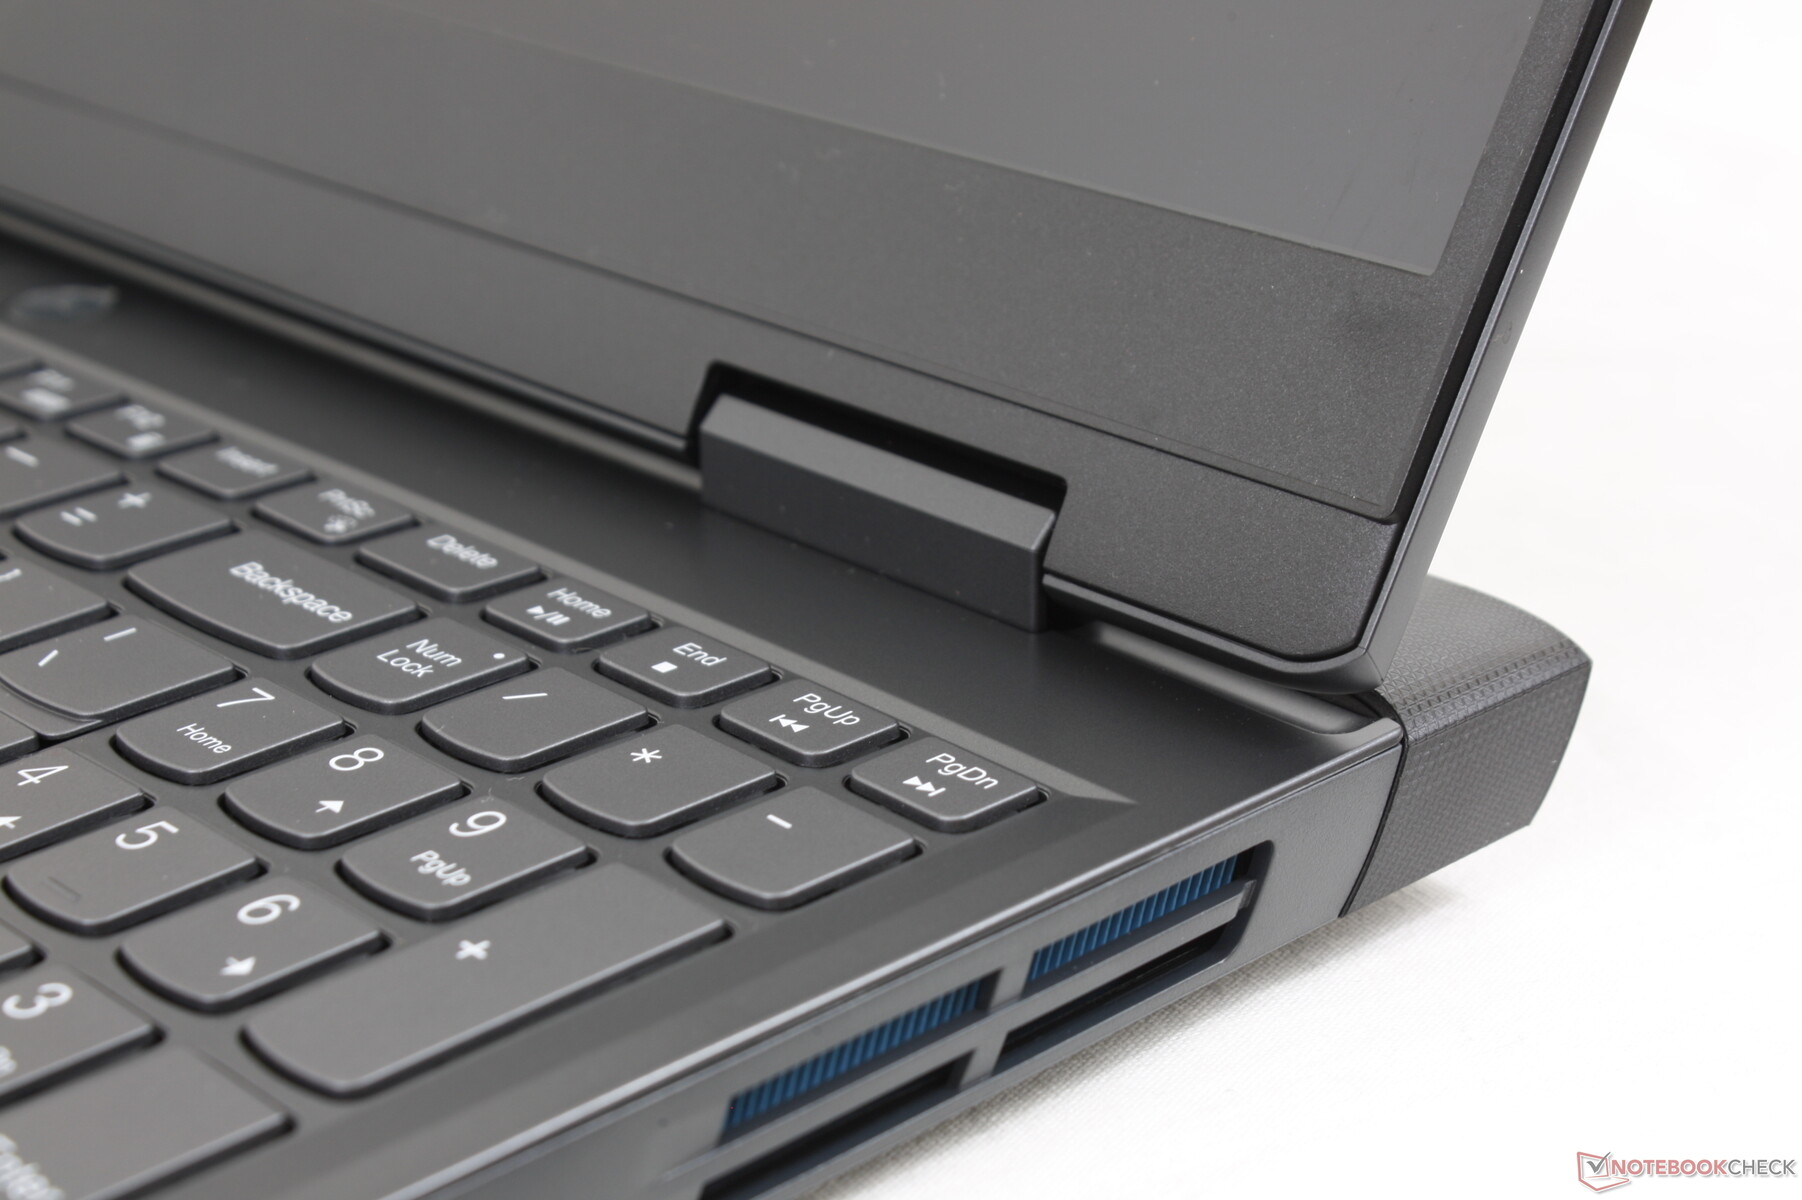
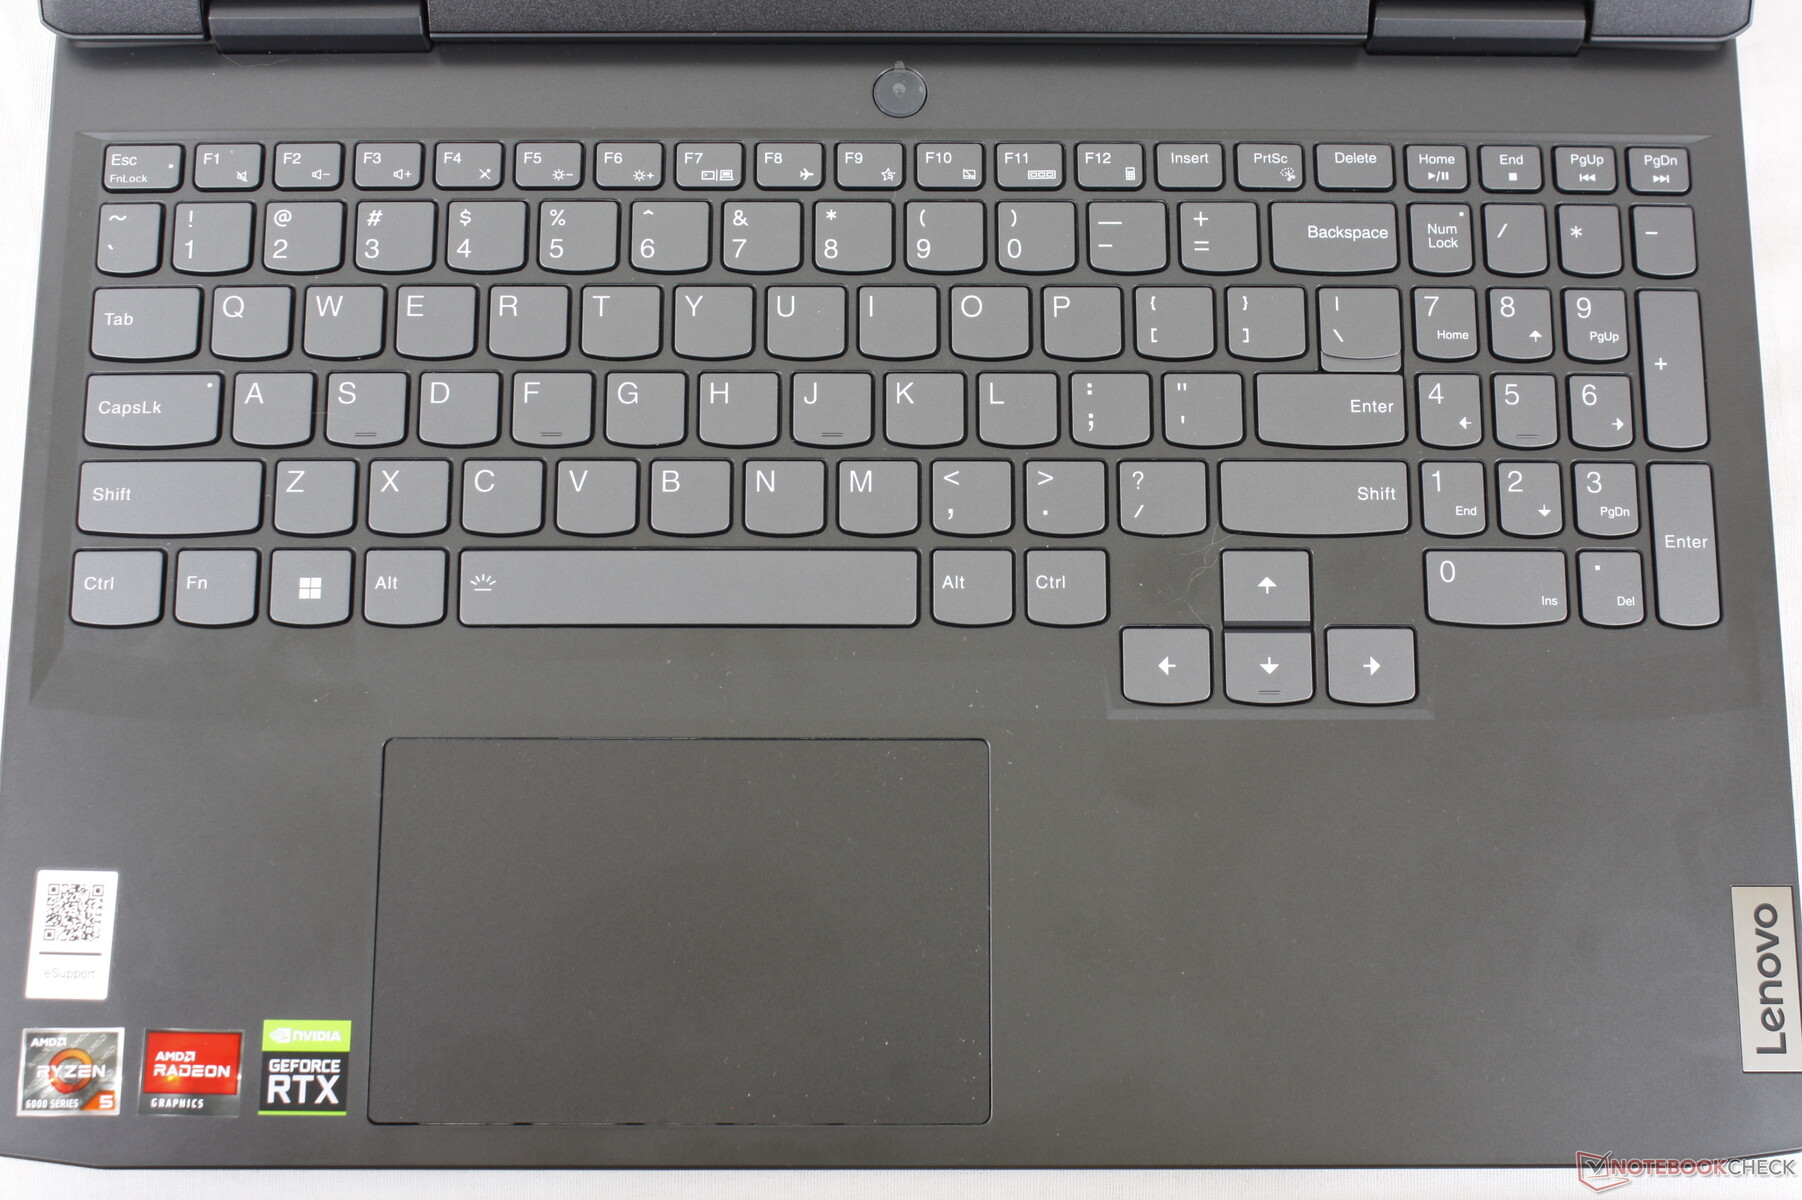
Eingabegeräte — Klassische IdeaPad-Peripherie
Tastatur
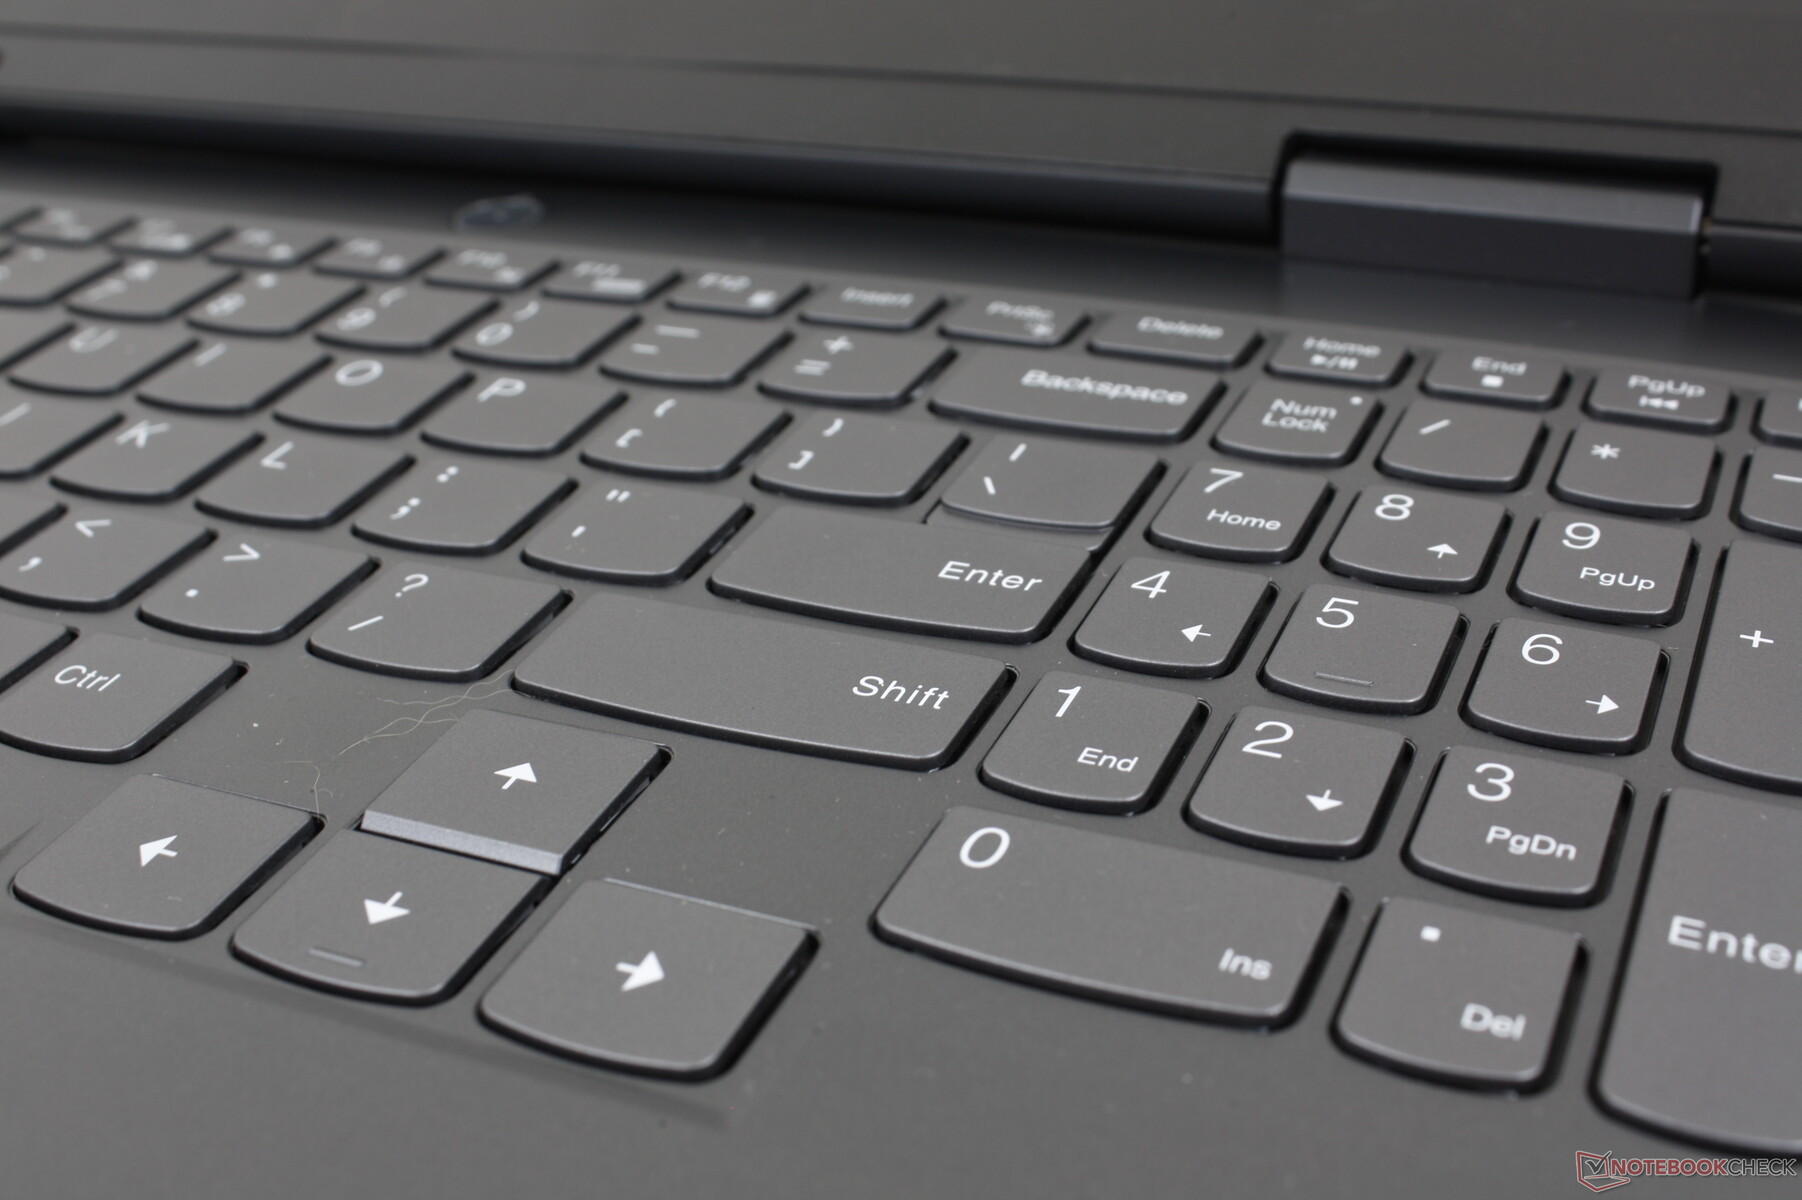
Während die Tastenbeschriftung beim IdeaPad Gaming 3i 2020 hellblau war, ist sie dieses Mal weiß. Davon abgesehen sind alle Eigenschaften einschließlich der Größe und Haptik der Tasten nahezu identisch, was trotz der Änderungen am Gehäuse in einem fast unveränderten Tippgefühl resultiert. Der geringe Tastenwiderstand und der geringe Tastenhub ist typisch für ein günstiges bzw. Mittelklasse-Ultrabook wie das Asus VivoBook und das normale IdeaPad.
Die Tastatur bietet eine zweistufige Hintergrundbeleuchtung, die alle Tastenbeschriftungen einschließlich der kleinen, sekundären Symbole beleuchtet.
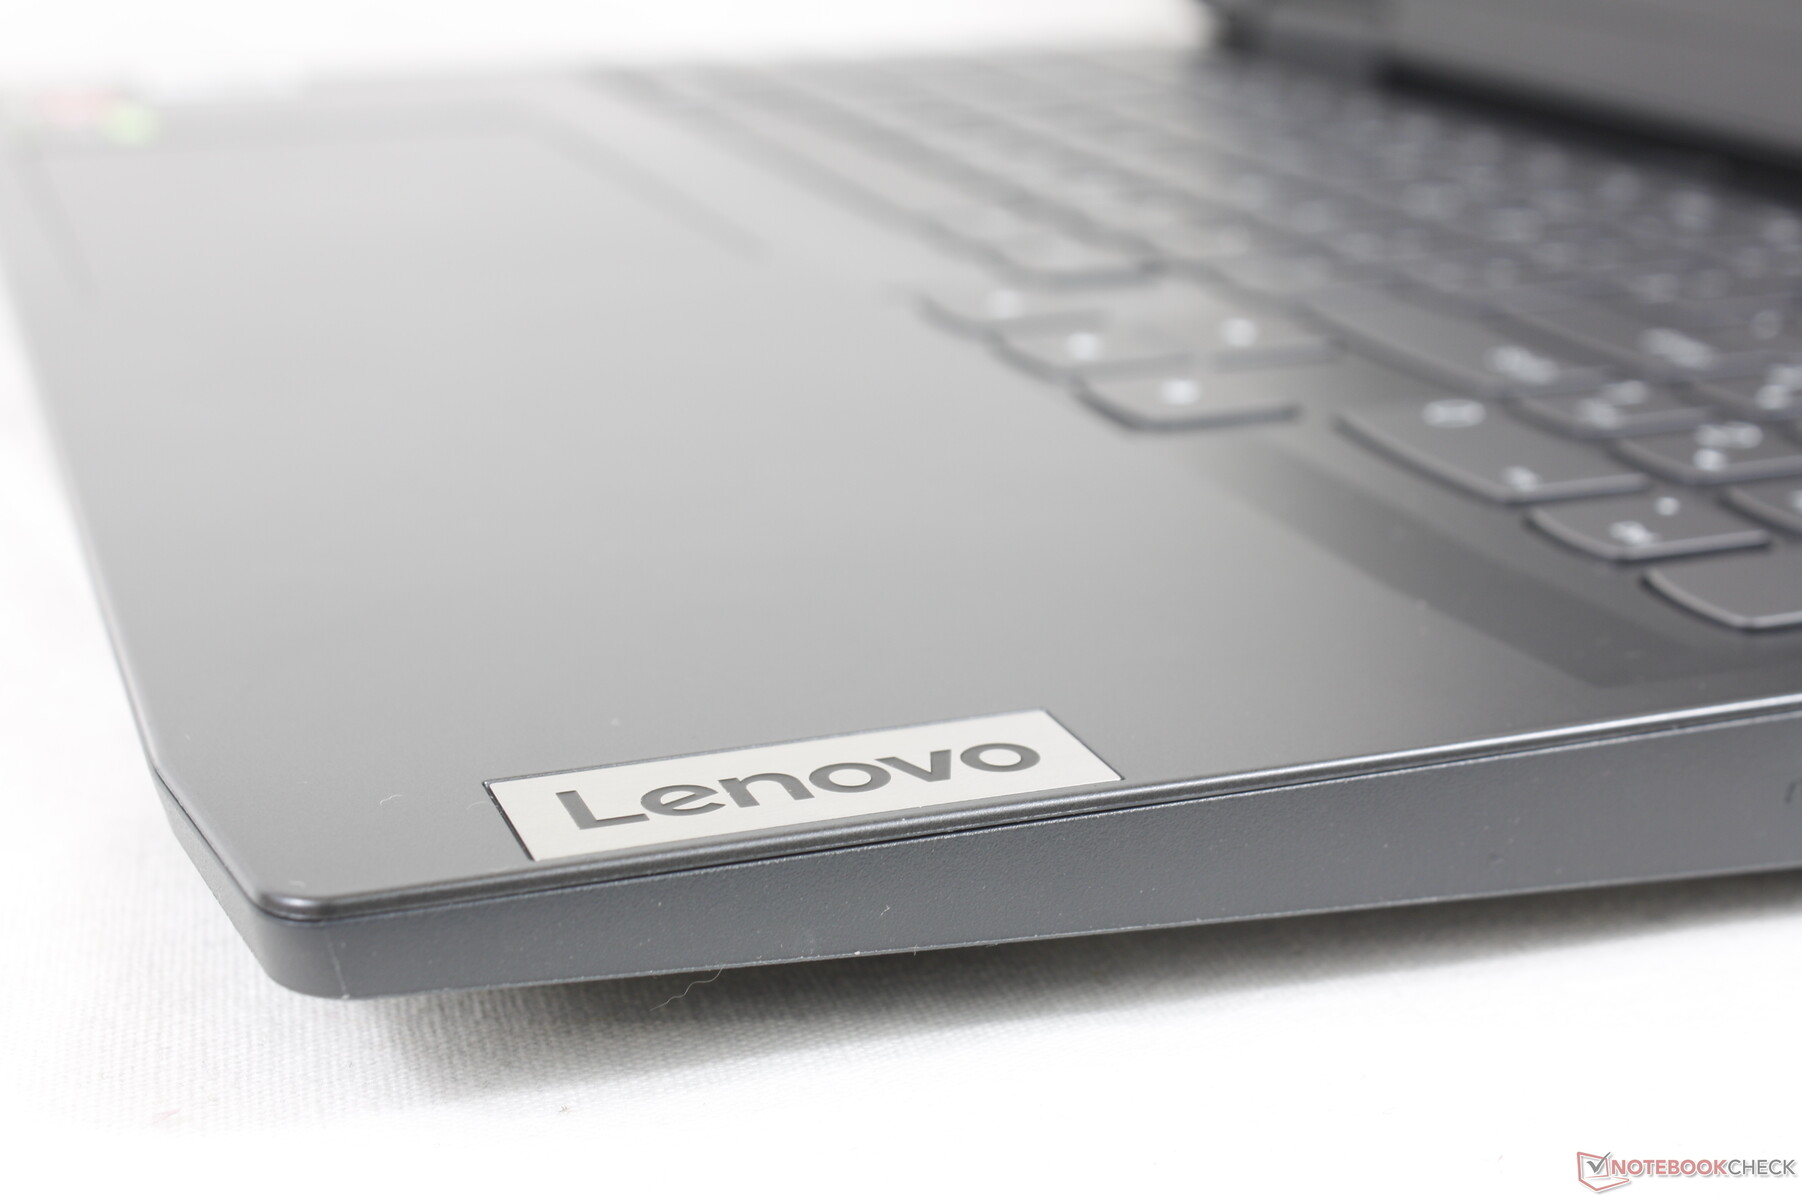
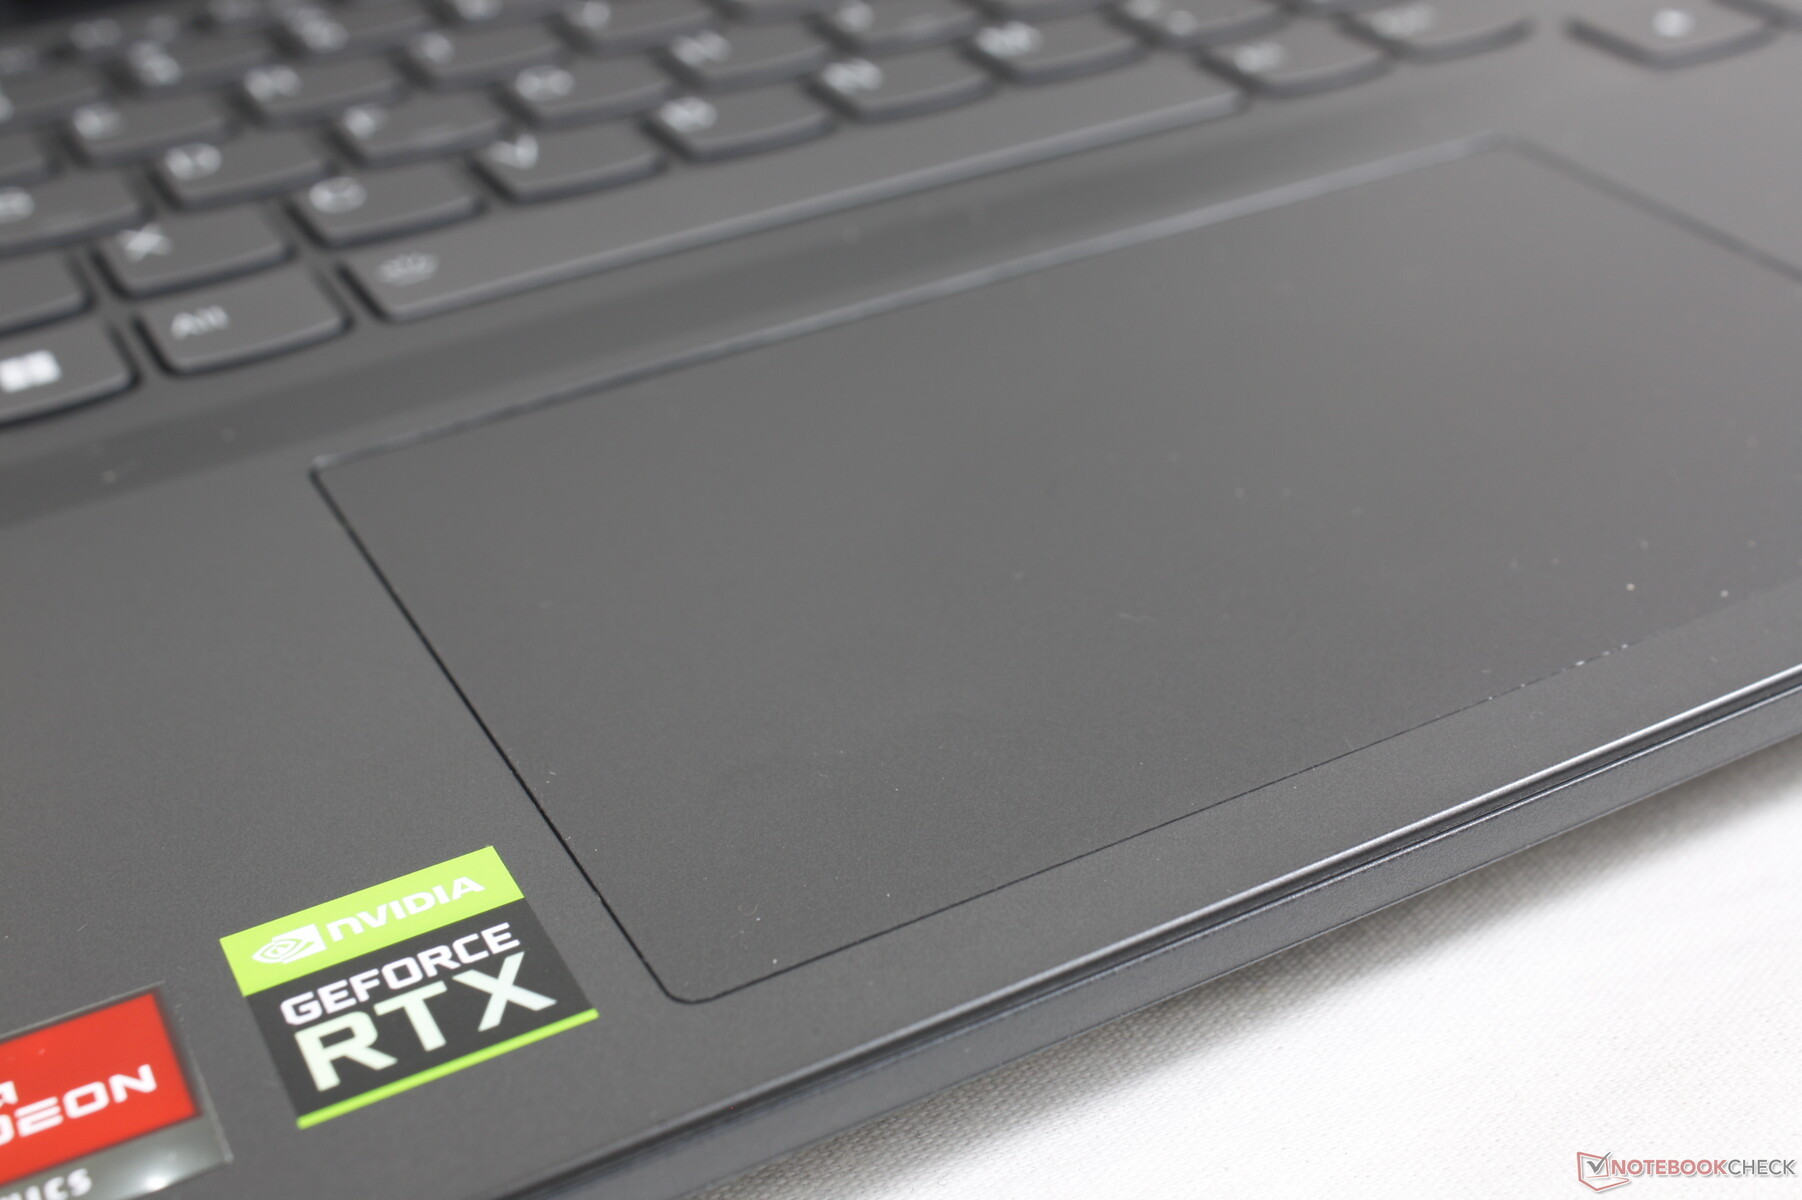
Touchpad
Das ClickPad ist größer als beim MSI Bravo 15 (12,5 x 7,5 cm vs. 10,5 x 6,5 cm). Leider sind die Gleiteigenschaften schlechter, das Tastenfeedback schwammiger und das Benutzererlebnis dadurch insgesamt weniger gut als bei den meisten Laptops. Auch bei Zeigerbewegungen mittlerer Geschwindigkeit haften Finger auf der Oberfläche, während das unpräzise Tastenfeedback in unkomfortablen Klicks resultiert.

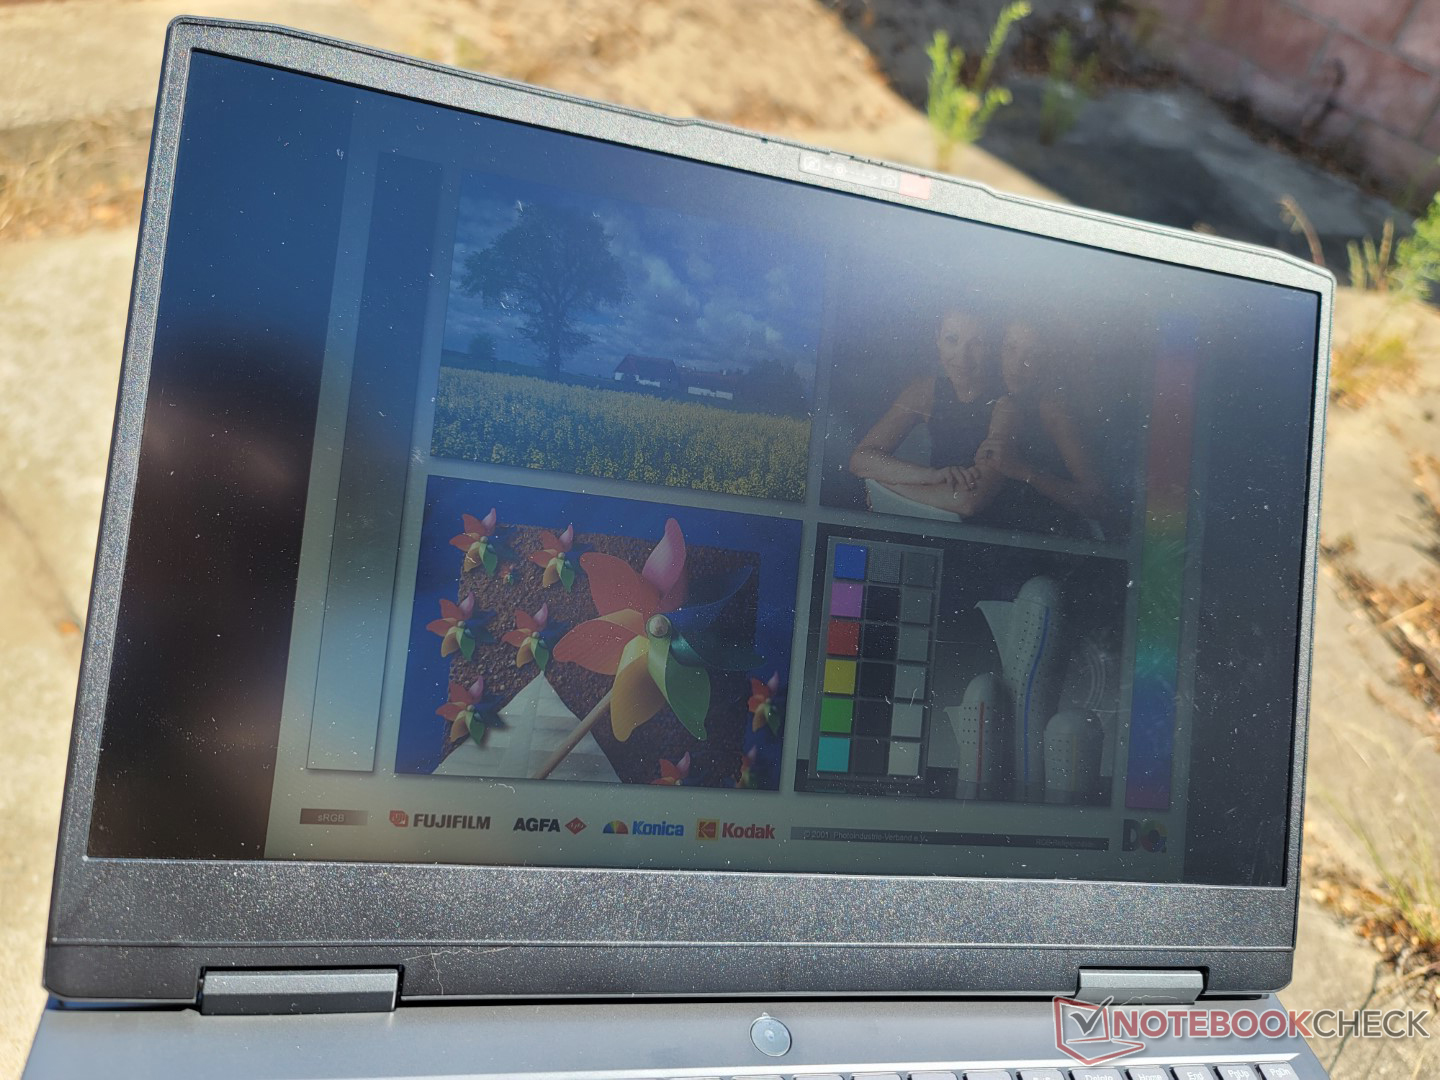
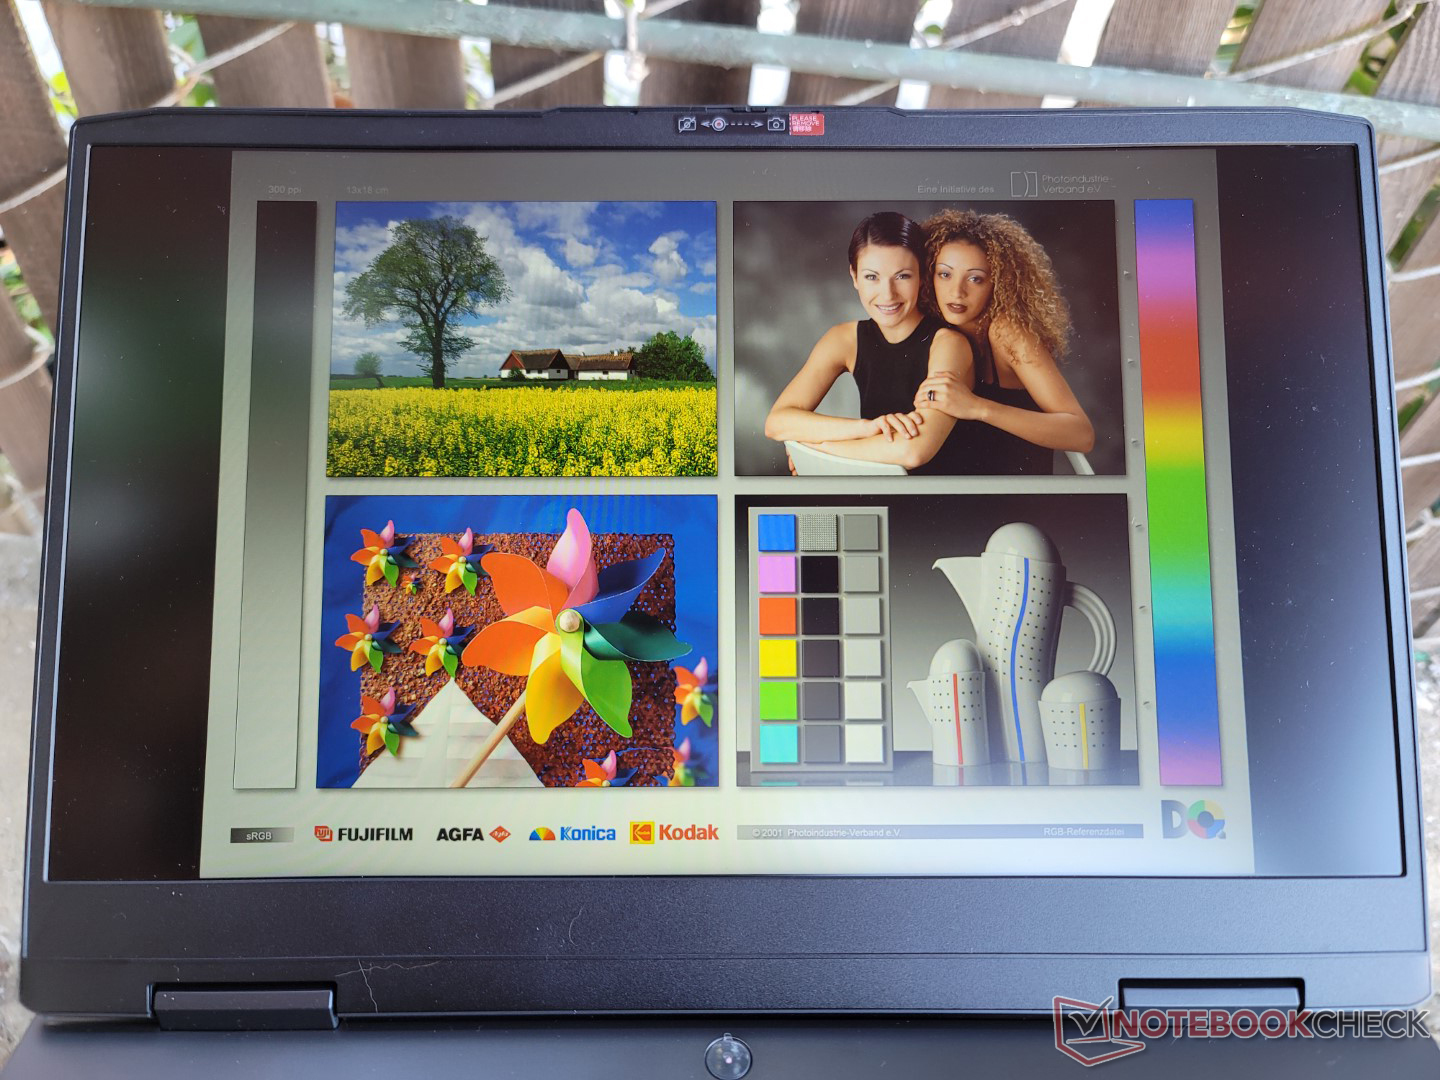
Display — Standardmäßig mit FreeSync und 120 Hz
Zu den positiven Eigenschaften des Displays zählen die native 120-Hz-Bildwiederholfrequenz und die FreeSync-Unterstützung. Mit jeweils 9 bis 10 ms Sekunden können sich auch die Schwarz-zu-Weiß- und Grau-zu-Grau-Reaktionszeiten sehen lassen. Für Gaming-Zwecke ist das Display dank minimalem Ghosting und Screen-Tearing gut geeignet.
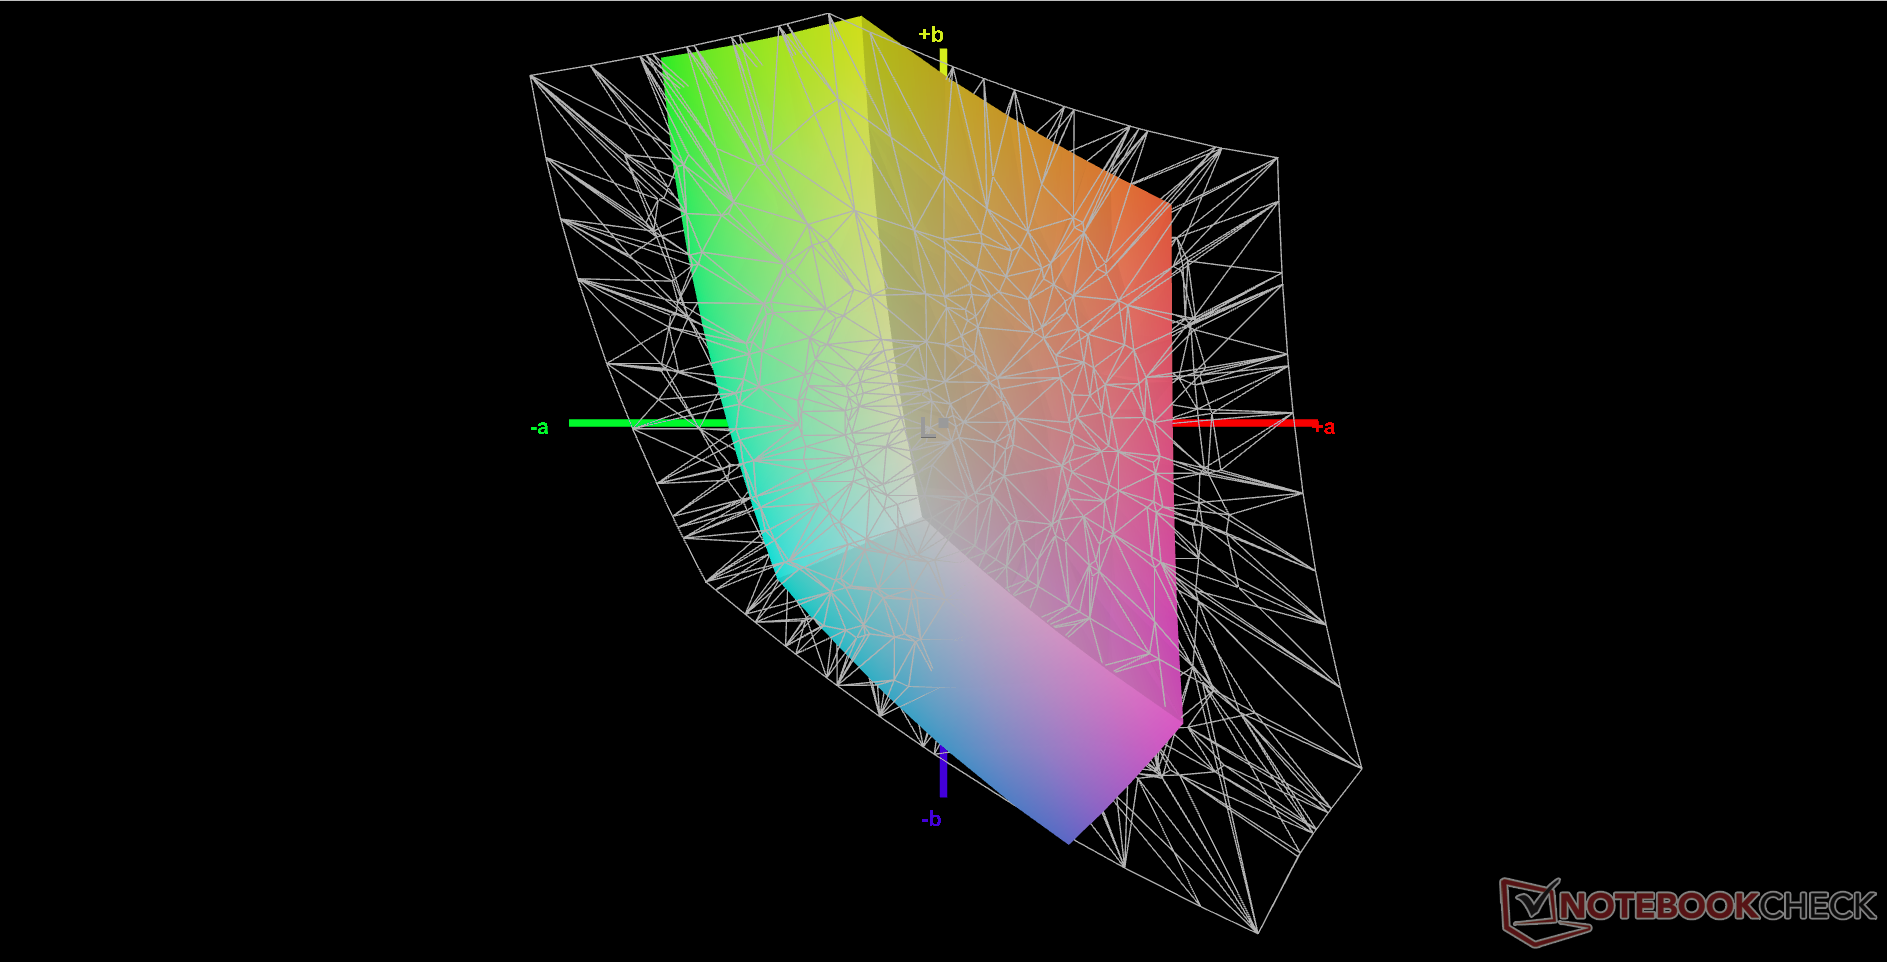
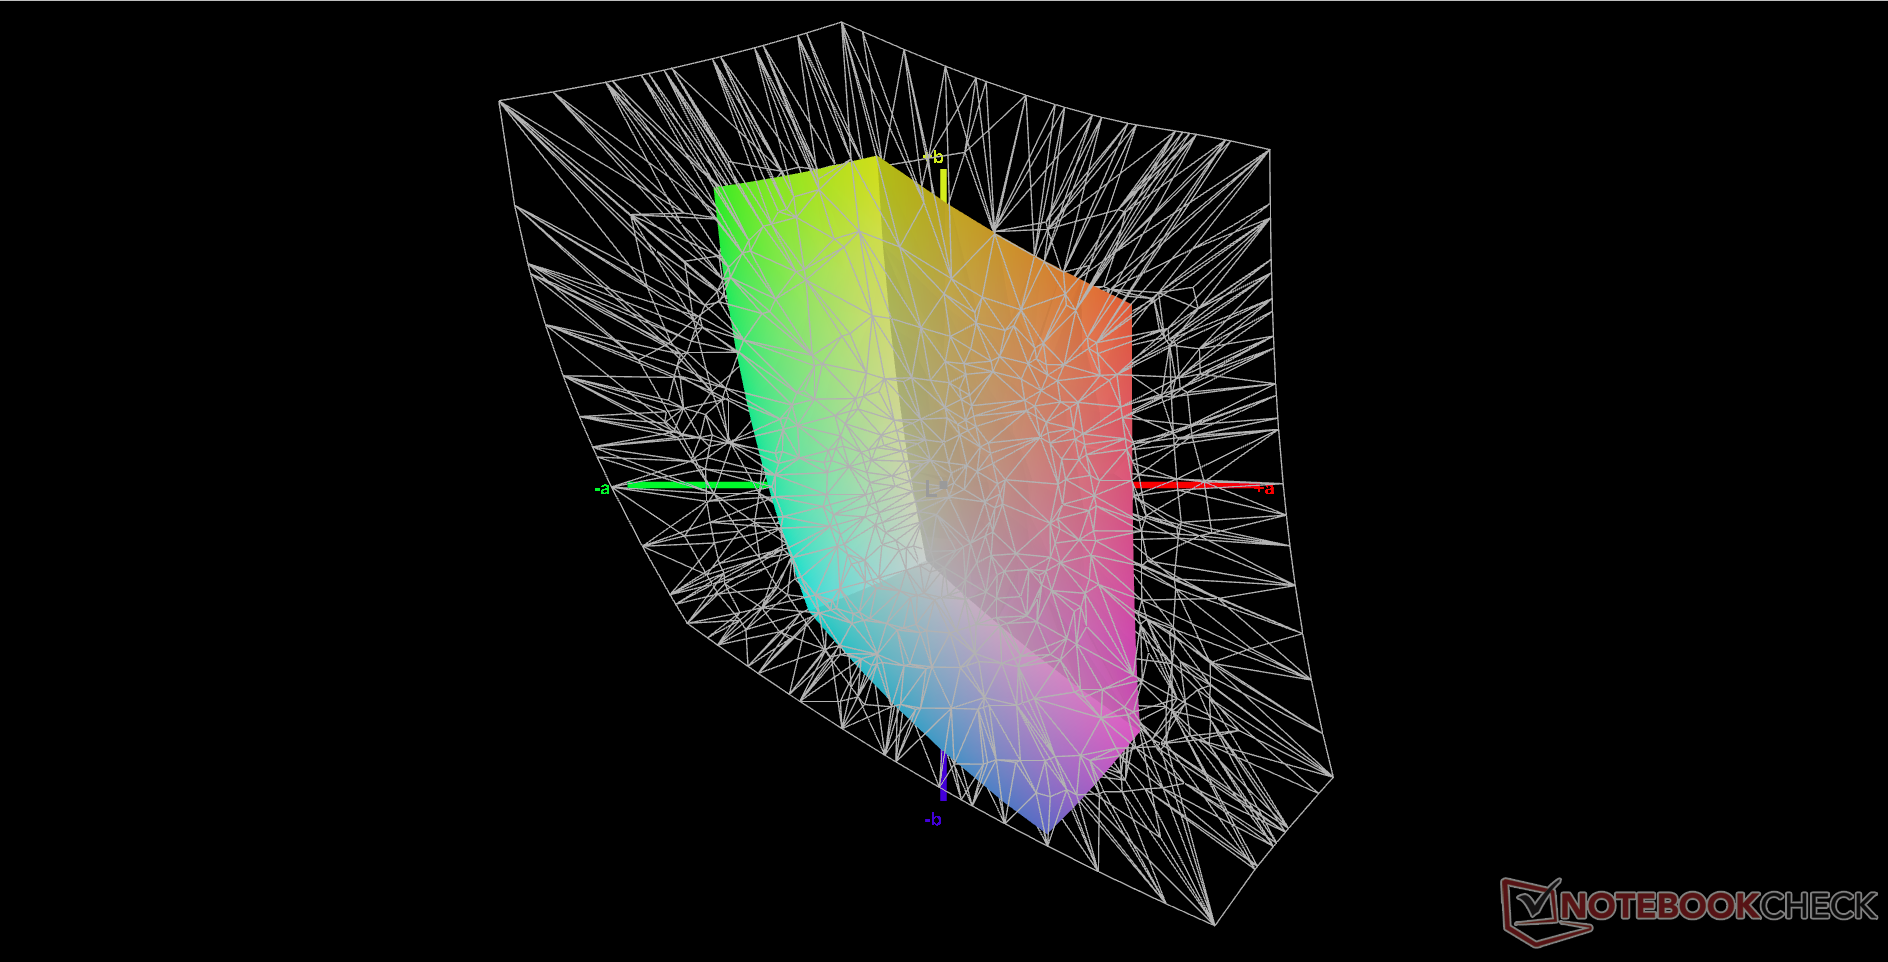
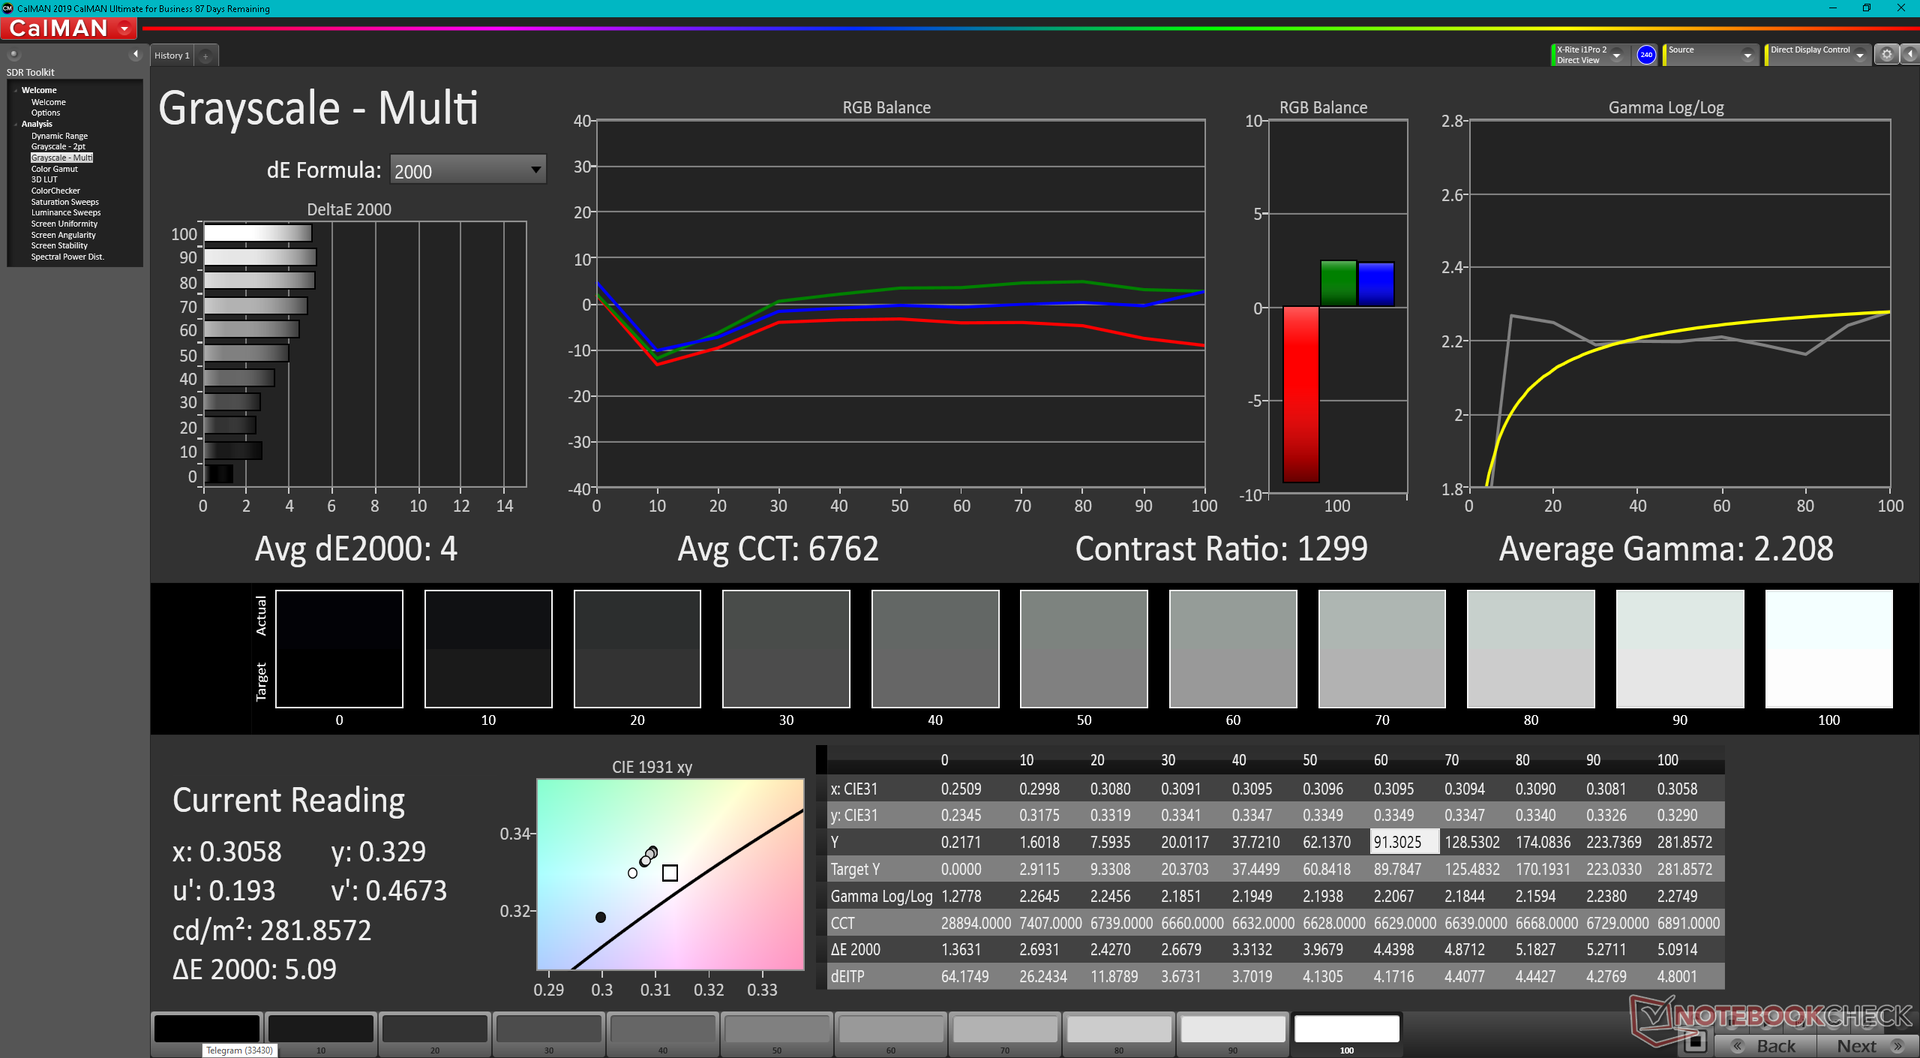
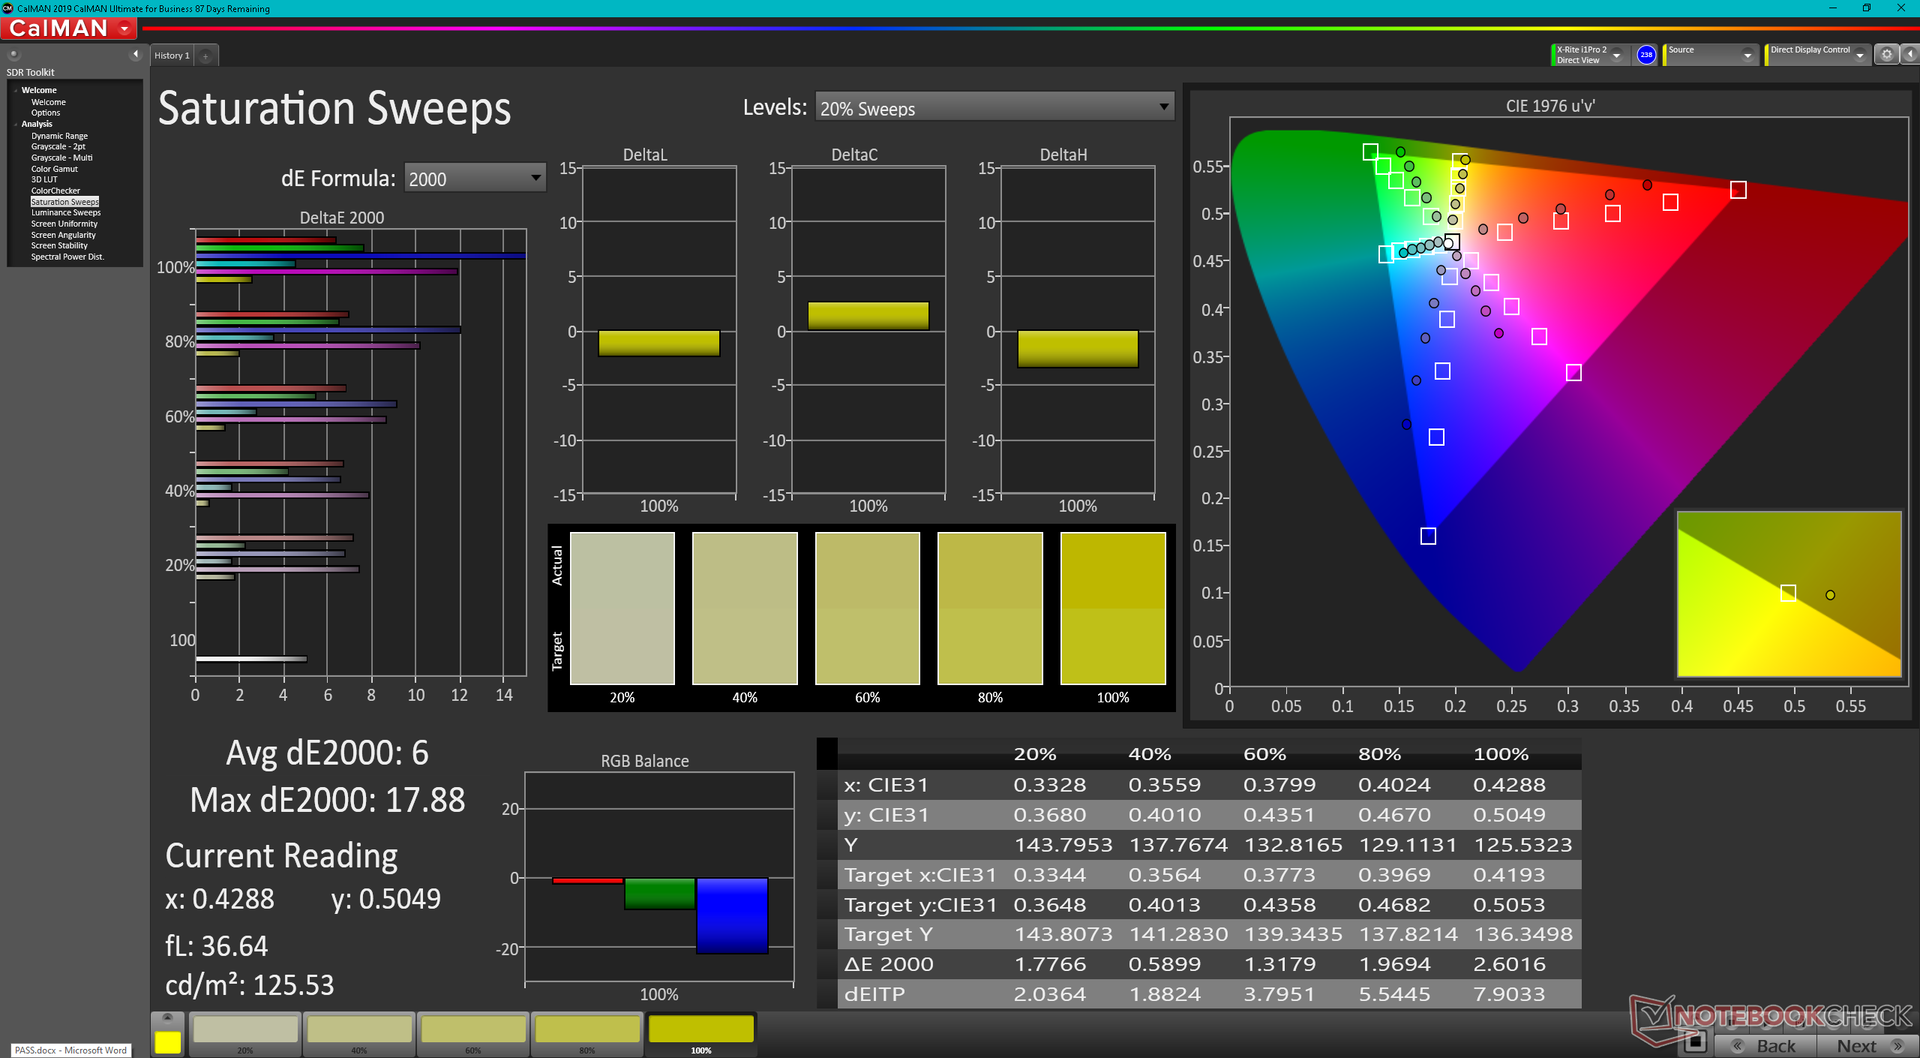
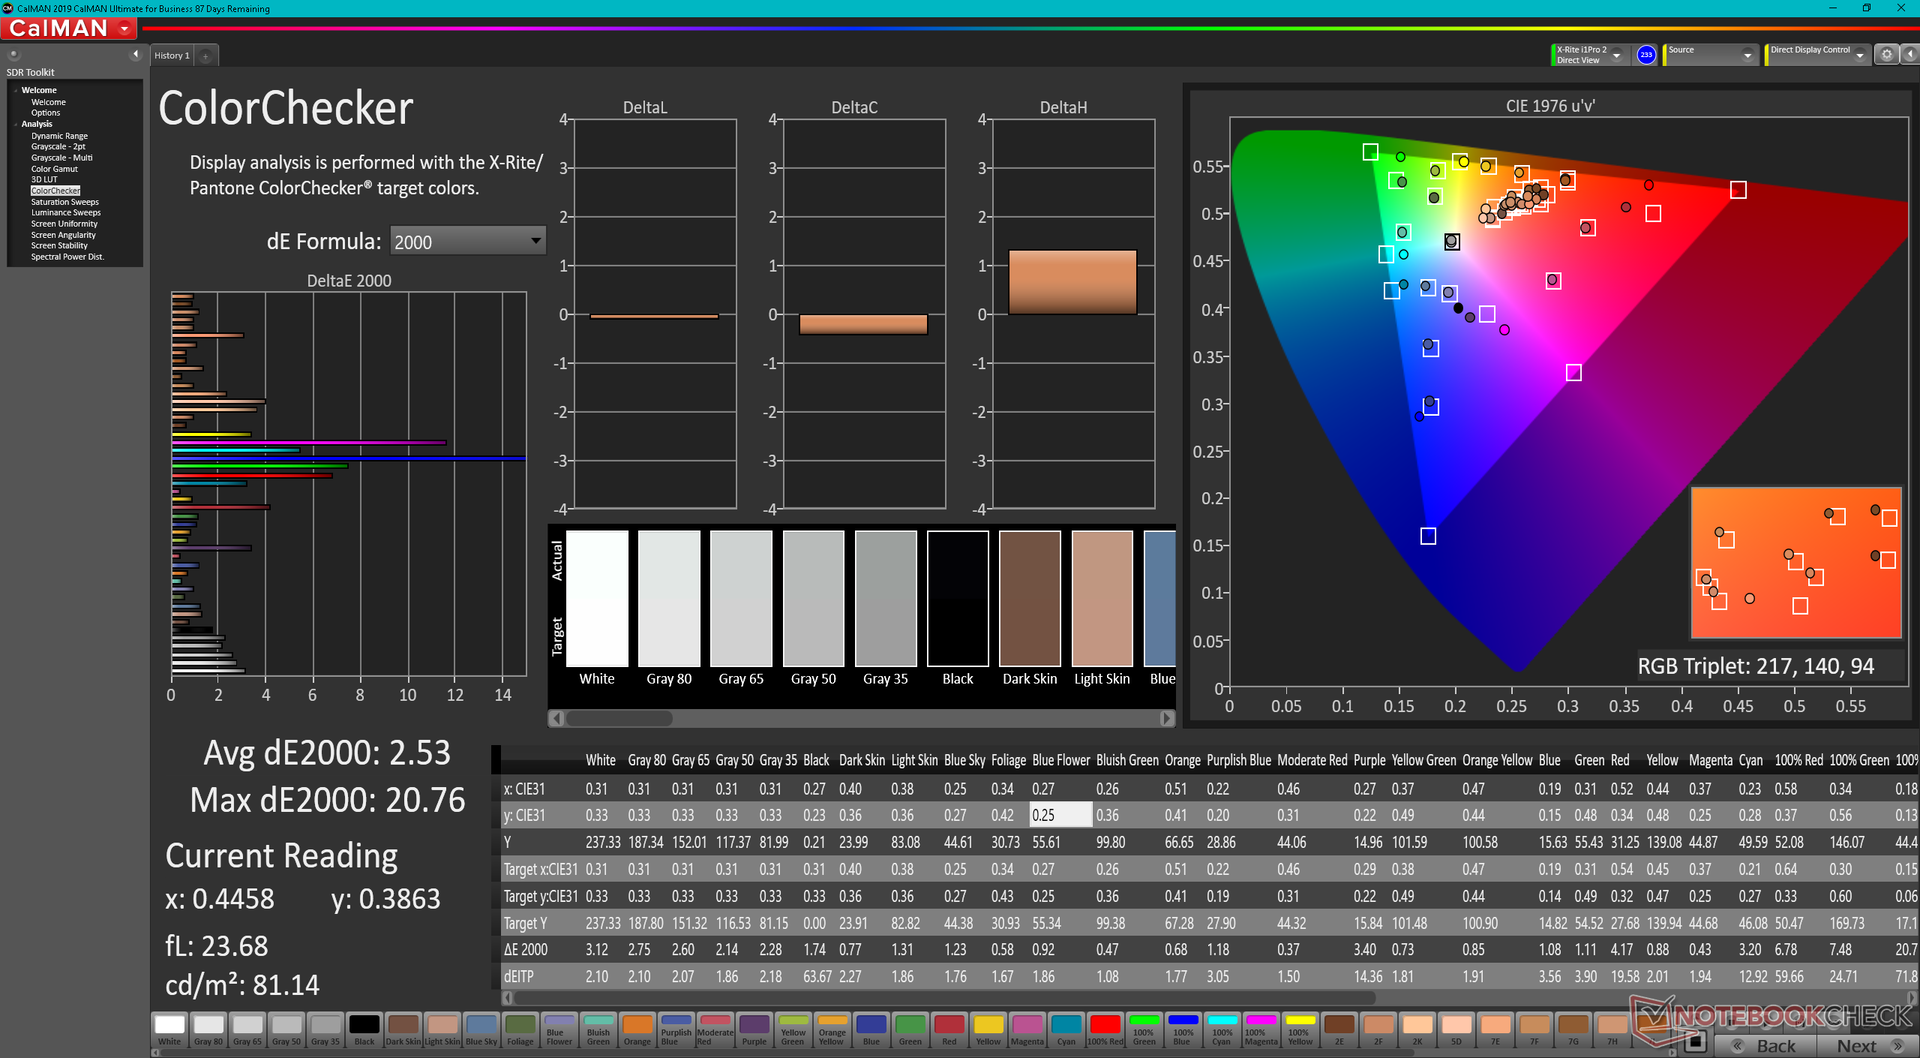
Die größte Schwachstelle des günstigen Displays ist die Farbdarstellung, die mit nur 58 % des sRGB-Farbraums stark eingeschränkt und für die meisten digitalen Künstler ungeeignet ist. Da keine anderen Displayoptionen für dieses IdeaPad verfügbar sind, scheint Lenovo Nutzer mit entsprechenden Bedürfnissen in Bezug auf die Farben und die Helligkeit in Richtung der Legion-Reihe steuern zu wollen.
Obwohl es sich hierbei um das gleiche LEN156FHD-ID-Panel wie beim ThinkBook 15 G4 und dem IdeaPad 5 15ALC05, unterscheiden sich die Charakteristika in manchen Aspekten stark. Das besagte ThinkBook und das IdeaPad 5 unterstützt zum Beispiel weder 120 Hz noch FreeSync.


| |||||||||||||||||||||||||
Ausleuchtung: 86 %
Helligkeit Akku: 287.8 cd/m²
Kontrast: 959:1 (Schwarzwert: 0.3 cd/m²)
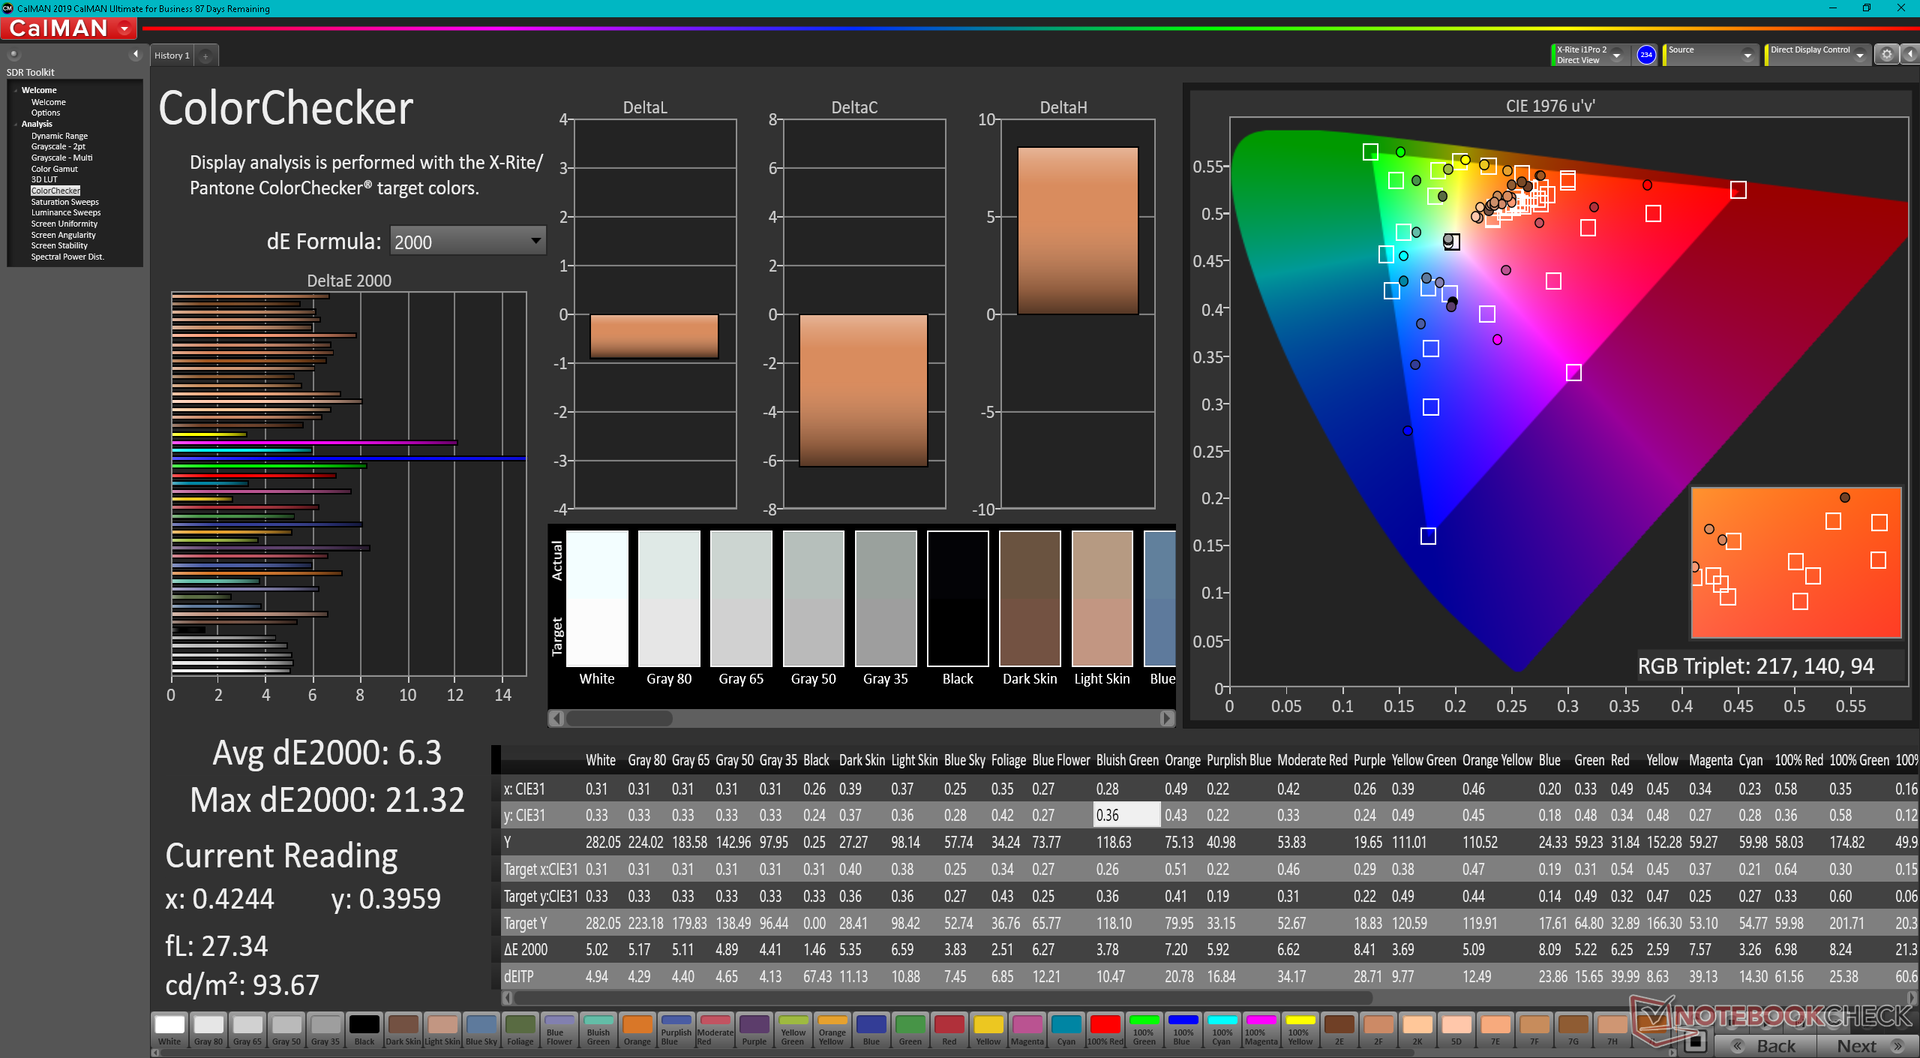
ΔE ColorChecker Calman: 6.3 | ∀{0.5-29.43 Ø4.72}
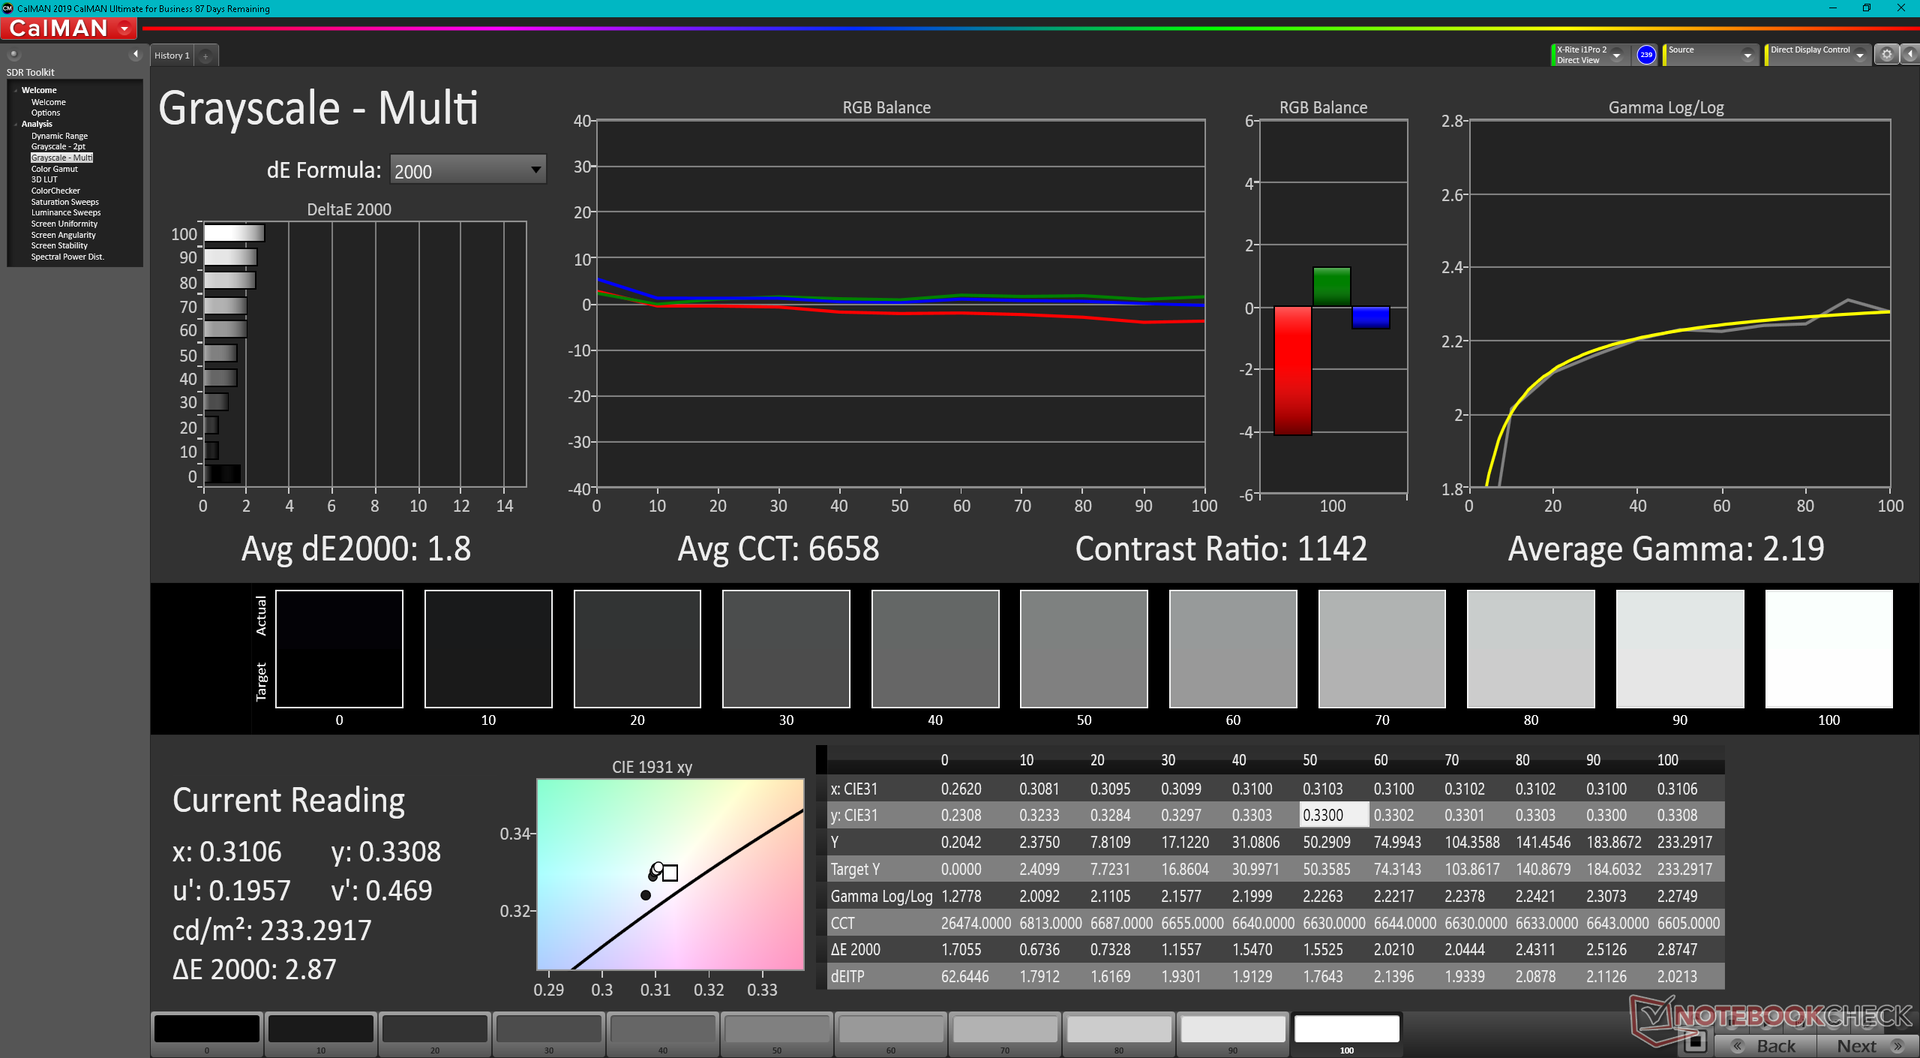
calibrated: 2.53
ΔE Greyscale Calman: 4 | ∀{0.09-98 Ø4.97}
40.7% AdobeRGB 1998 (Argyll 3D)
58% sRGB (Argyll 3D)
39.4% Display P3 (Argyll 3D)
Gamma: 2.21
CCT: 6762 K
| Lenovo IdeaPad Gaming 3 15ARH7 LEN156FHD, IPS, 1920x1080, 15.6" | Lenovo IdeaPad Gaming 3i 15IMH05 BOE CQ NV156FHM-NX1, IPS, 1920x1080, 15.6" | Lenovo Legion 5 15ACH6A-82NW0010GE LGD06A5, IPS, 1920x1080, 15.6" | Gigabyte A5 K1 BOEhydis NV156FHM-N4K (BOE08B3), IPS, 1920x1080, 15.6" | Asus TUF Dash F15 FX517ZR BOE CQ NE156QHM-NY1, IPS, 2560x1440, 15.6" | Dell G15 5510 YMHWH_156HRA (CMN1522), IPS, 1920x1080, 15.6" | |
|---|---|---|---|---|---|---|
| Display | -3% | 76% | 61% | 111% | 6% | |
| Display P3 Coverage (%) | 39.4 | 38.04 -3% | 71.1 80% | 64.4 63% | 98.4 150% | 41.6 6% |
| sRGB Coverage (%) | 58 | 56.6 -2% | 99.1 71% | 92.5 59% | 99.9 72% | 62.2 7% |
| AdobeRGB 1998 Coverage (%) | 40.7 | 39.3 -3% | 72.3 78% | 66.1 62% | 85.9 111% | 43 6% |
| Response Times | -6% | 48% | 39% | 61% | -37% | |
| Response Time Grey 50% / Grey 80% * (ms) | 20.8 ? | 25 ? -20% | 15 ? 28% | 14.5 ? 30% | 5.6 ? 73% | 33.3 ? -60% |
| Response Time Black / White * (ms) | 18.4 ? | 17 ? 8% | 6 ? 67% | 9.5 ? 48% | 9.4 ? 49% | 20.7 ? -13% |
| PWM Frequency (Hz) | ||||||
| Bildschirm | -16% | 24% | 19% | 31% | 12% | |
| Helligkeit Bildmitte (cd/m²) | 287.8 | 305 6% | 371 29% | 295 3% | 286 -1% | 288 0% |
| Brightness (cd/m²) | 268 | 294 10% | 328 22% | 281 5% | 266 -1% | 264 -1% |
| Brightness Distribution (%) | 86 | 70 -19% | 85 -1% | 83 -3% | 87 1% | 88 2% |
| Schwarzwert * (cd/m²) | 0.3 | 0.405 -35% | 0.32 -7% | 0.29 3% | 0.25 17% | 0.24 20% |
| Kontrast (:1) | 959 | 753 -21% | 1159 21% | 1017 6% | 1144 19% | 1200 25% |
| Delta E Colorchecker * | 6.3 | 6.01 5% | 3.25 48% | 4.36 31% | 2.14 66% | 3.67 42% |
| Colorchecker dE 2000 max. * | 21.32 | 21.9 -3% | 6.33 70% | 6.92 68% | 5.22 76% | 18.12 15% |
| Colorchecker dE 2000 calibrated * | 2.53 | 5.12 -102% | 1.11 56% | 1.2 53% | 0.67 74% | 3.22 -27% |
| Delta E Graustufen * | 4 | 3.23 19% | 4.94 -24% | 3.9 2% | 2.8 30% | 2.6 35% |
| Gamma | 2.21 100% | 2.43 91% | 2.45 90% | 2.106 104% | 2.23 99% | 2.187 101% |
| CCT | 6762 96% | 6818 95% | 6064 107% | 7300 89% | 7092 92% | 6971 93% |
| Farbraum (Prozent von AdobeRGB 1998) (%) | 36 | |||||
| Color Space (Percent of sRGB) (%) | 56 | |||||
| Durchschnitt gesamt (Programm / Settings) | -8% /
-11% | 49% /
38% | 40% /
31% | 68% /
53% | -6% /
4% |
* ... kleinere Werte sind besser
Dass das Display nicht ab Werk kalibriert ist, entsprecht unseren Erwartungen, da es sich hierbei um einen günstigen Gaming-Laptop handelt. Mit 4 bzw. 6,3 sind die durchschnittlichen Graustufen- und Farb-DeltaE-Werte dennoch ganz in Ordnung. Obwohl wir die Werte durch eine nachträgliche Kalibrierung auf 1,8 bzw. 2,53 verbessern konnten, bleibt die Darstellung gesättigter Farben aufgrund des oben erwähnten, kleinen Farbspektrums ungenau.

Reaktionszeiten (Response Times) des Displays
| ↔ Reaktionszeiten Schwarz zu Weiß | ||
|---|---|---|
| 18.4 ms ... steigend ↗ und fallend ↘ kombiniert | ↗ 10 ms steigend | 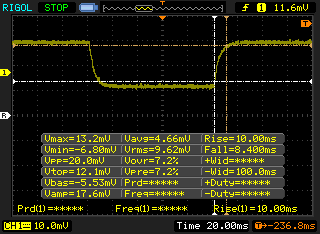 |
| ↘ 8.4 ms fallend | ||
| Die gemessenen Reaktionszeiten sind gut, für anspruchsvolle Spieler könnten der Bildschirm jedoch zu langsam sein. Im Vergleich rangierten die bei uns getesteten Geräte von 0.1 (Minimum) zu 240 (Maximum) ms. » 41 % aller Screens waren schneller als der getestete. Daher sind die gemessenen Reaktionszeiten durchschnittlich (19.8 ms). | ||
| ↔ Reaktionszeiten 50% Grau zu 80% Grau | ||
| 20.8 ms ... steigend ↗ und fallend ↘ kombiniert | ↗ 11.2 ms steigend | 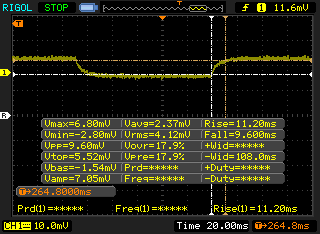 |
| ↘ 9.6 ms fallend | ||
| Die gemessenen Reaktionszeiten sind gut, für anspruchsvolle Spieler könnten der Bildschirm jedoch zu langsam sein. Im Vergleich rangierten die bei uns getesteten Geräte von 0.165 (Minimum) zu 636 (Maximum) ms. » 33 % aller Screens waren schneller als der getestete. Daher sind die gemessenen Reaktionszeiten besser als der Durchschnitt aller vermessenen Geräte (31 ms). | ||
Bildschirm-Flackern / PWM (Pulse-Width Modulation)
| Flackern / PWM nicht festgestellt | 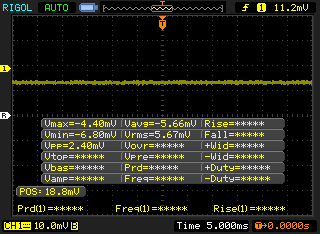 | ||
Im Vergleich: 52 % aller getesteten Geräte nutzten kein PWM um die Helligkeit zu reduzieren. Wenn PWM eingesetzt wurde, dann bei einer Frequenz von durchschnittlich 7763 (Minimum 5, Maximum 343500) Hz. | |||
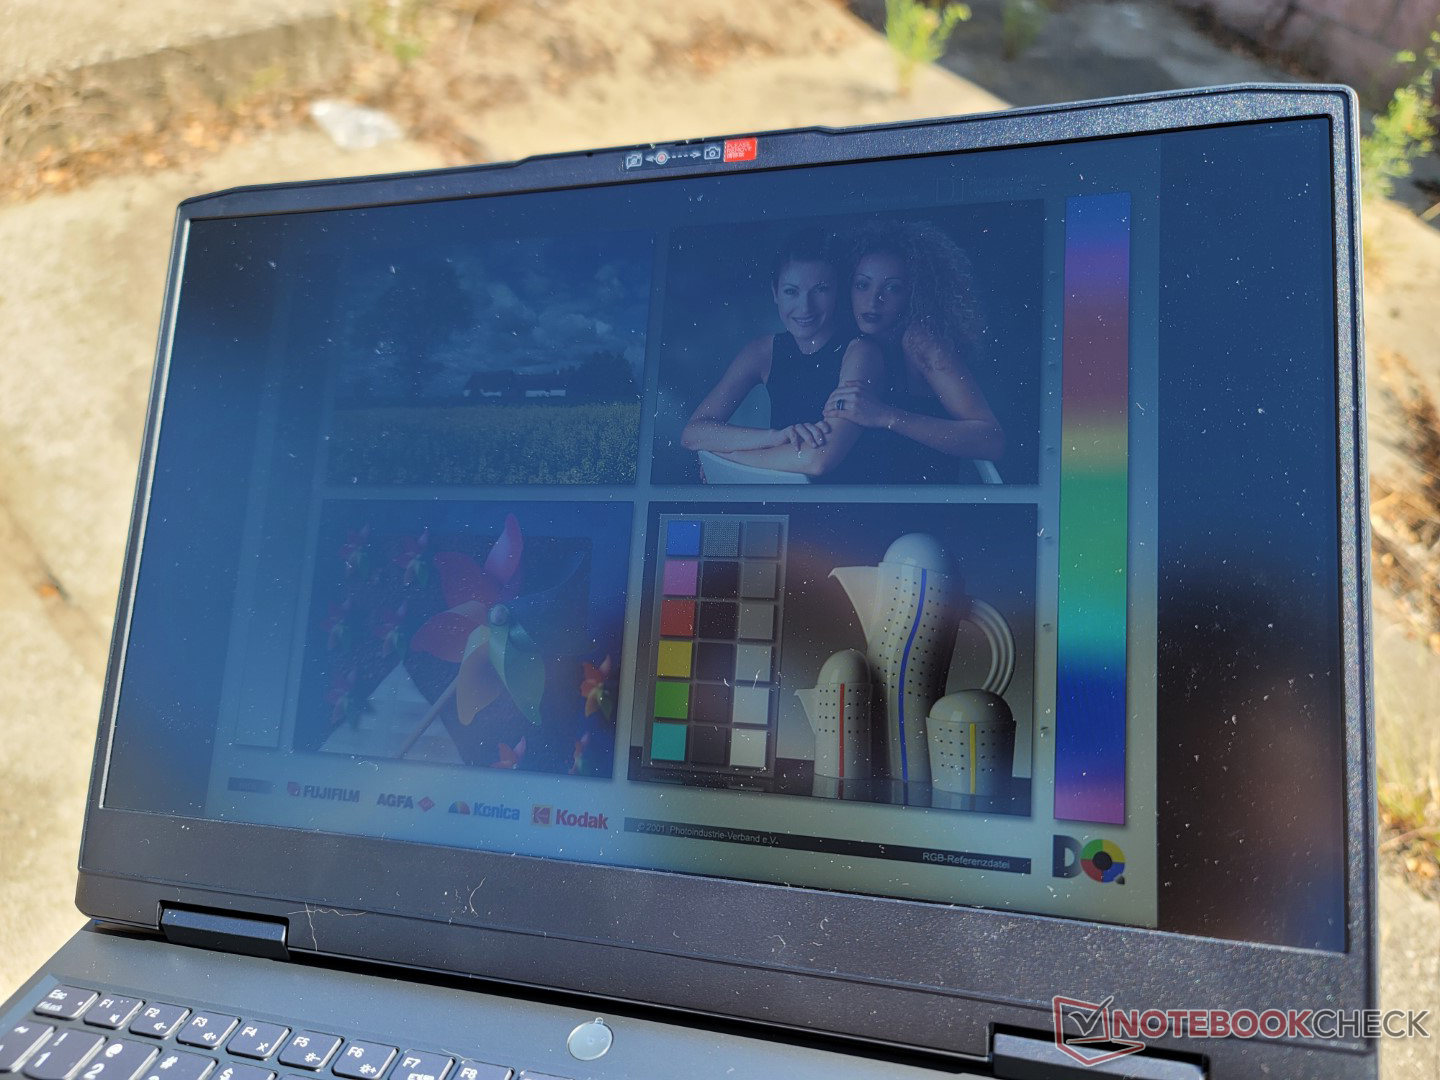
Die Lesbarkeit im Freien ist weder besser noch schlechter als bei anderen günstigen oder hochwertigen Gaming-Laptops, da diese Laptops nicht für eine häufige Nutzung im Freien ausgelegt sind. Um zu verhindern, dass die Farben ausgewaschen wirken, sollte man sich wenn möglich im Schatten aufhalten.

Leistung
Testbedingungen
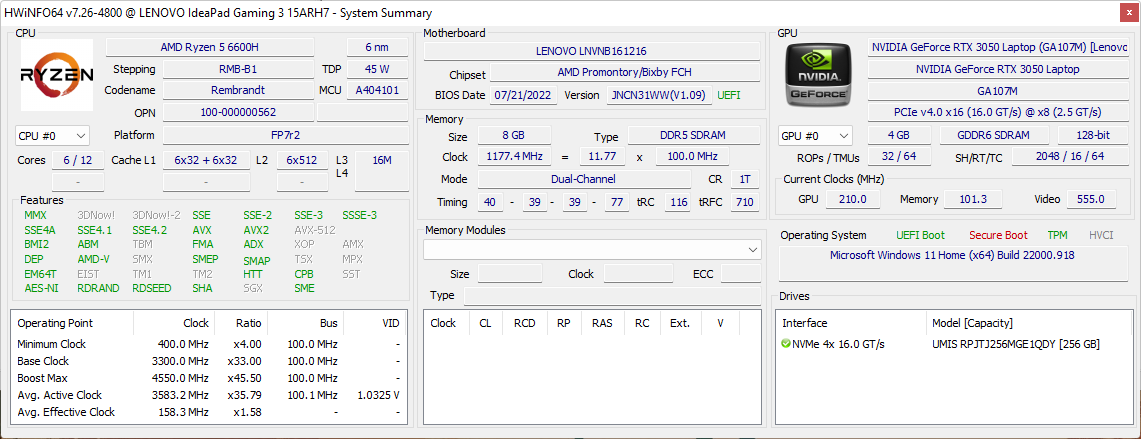
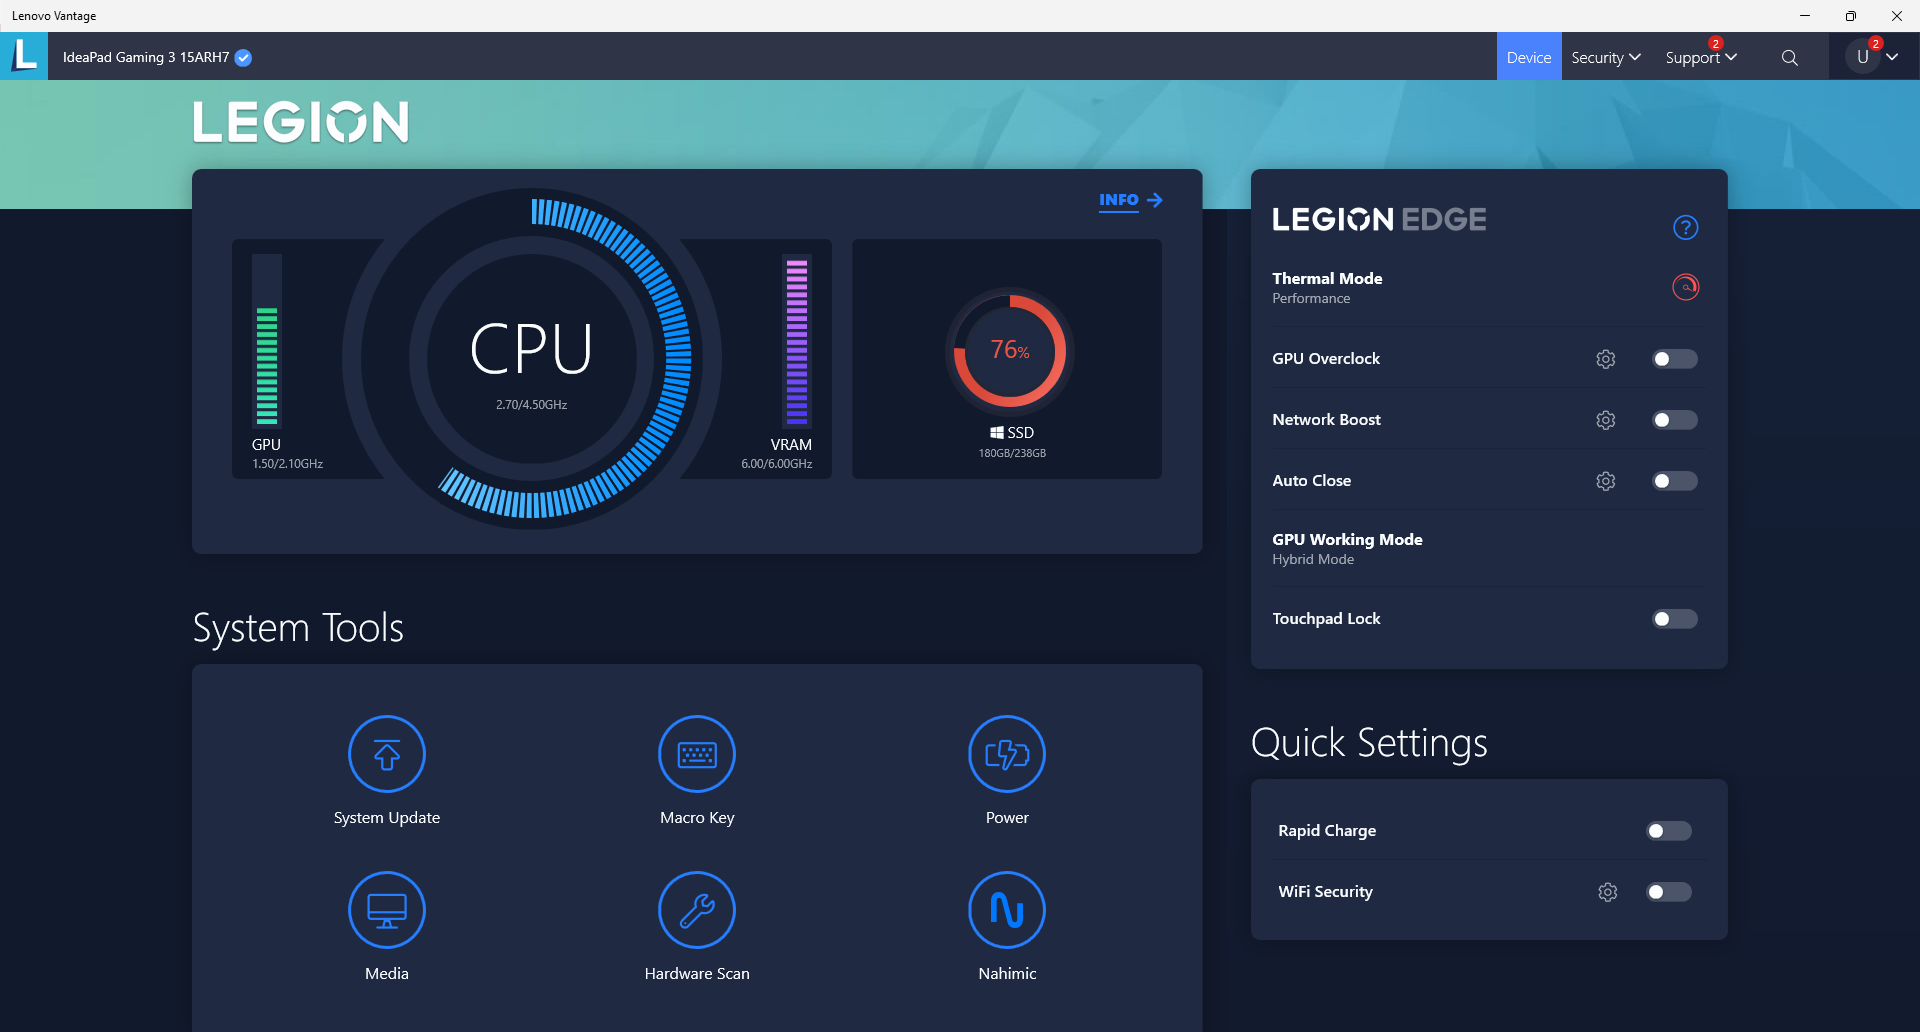
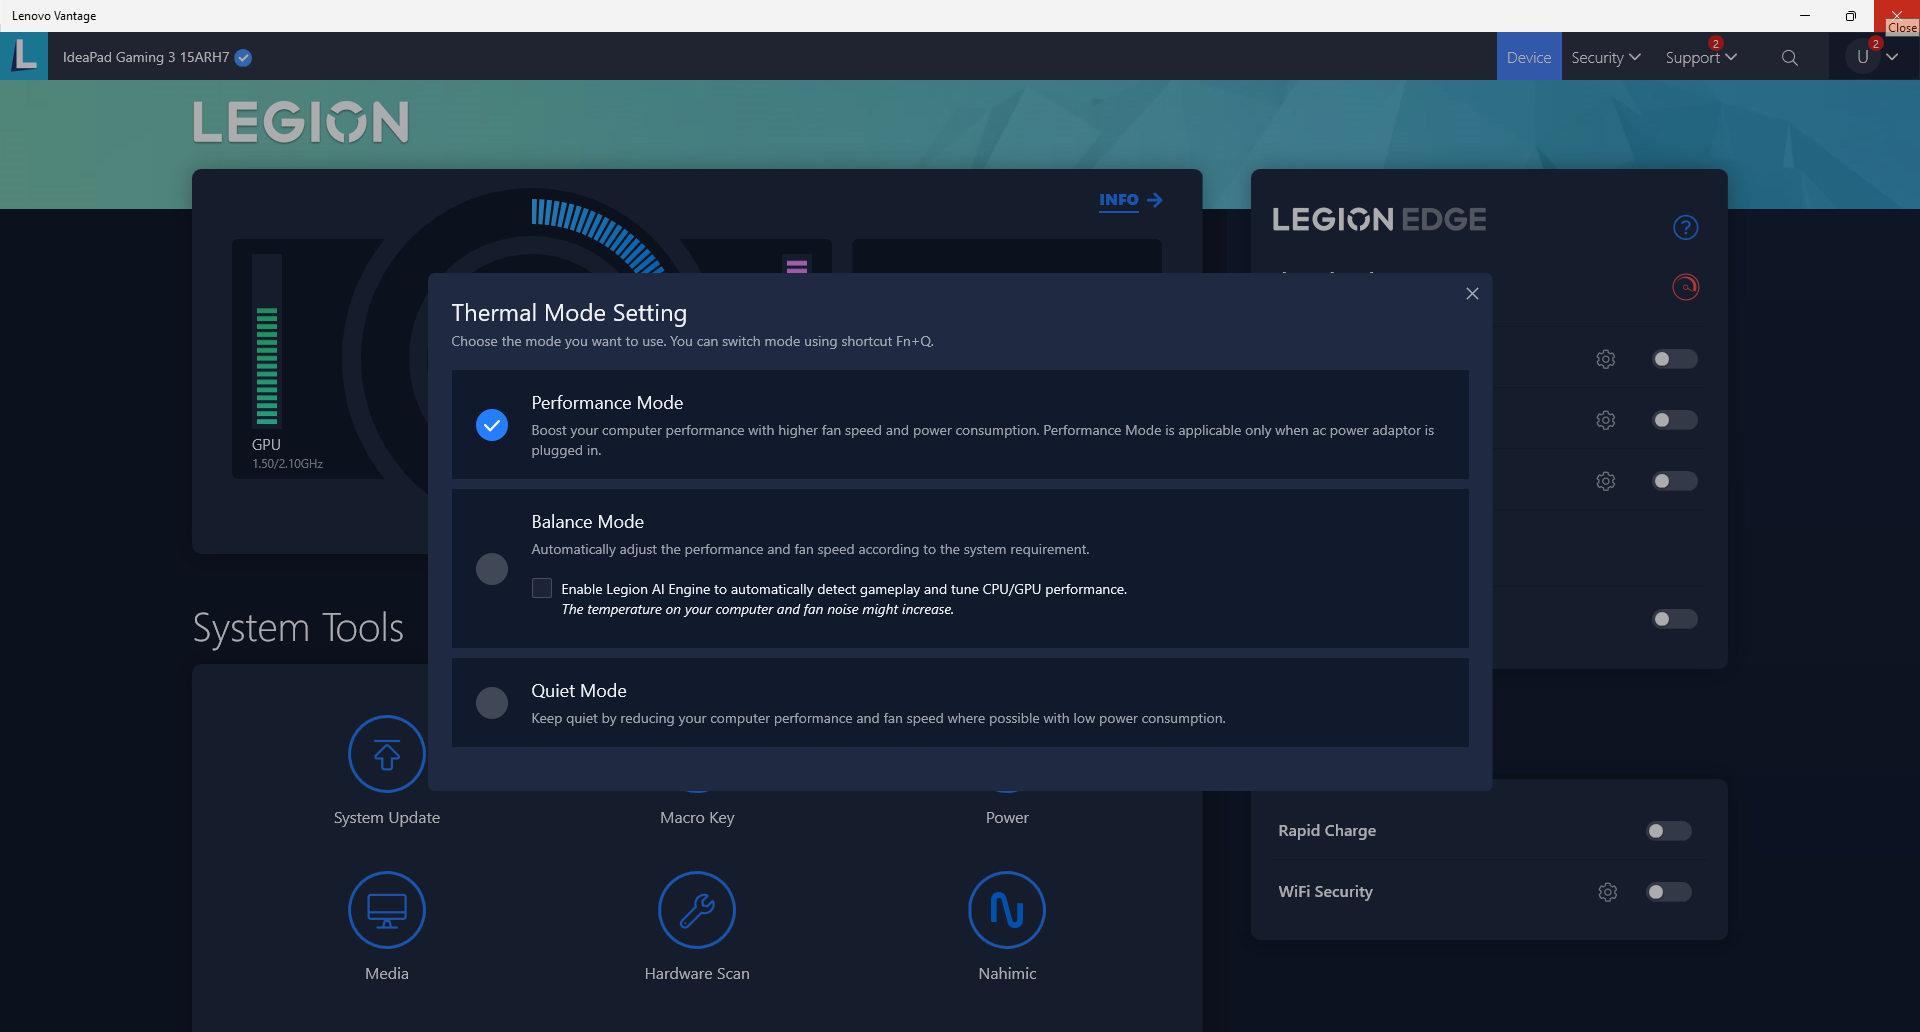
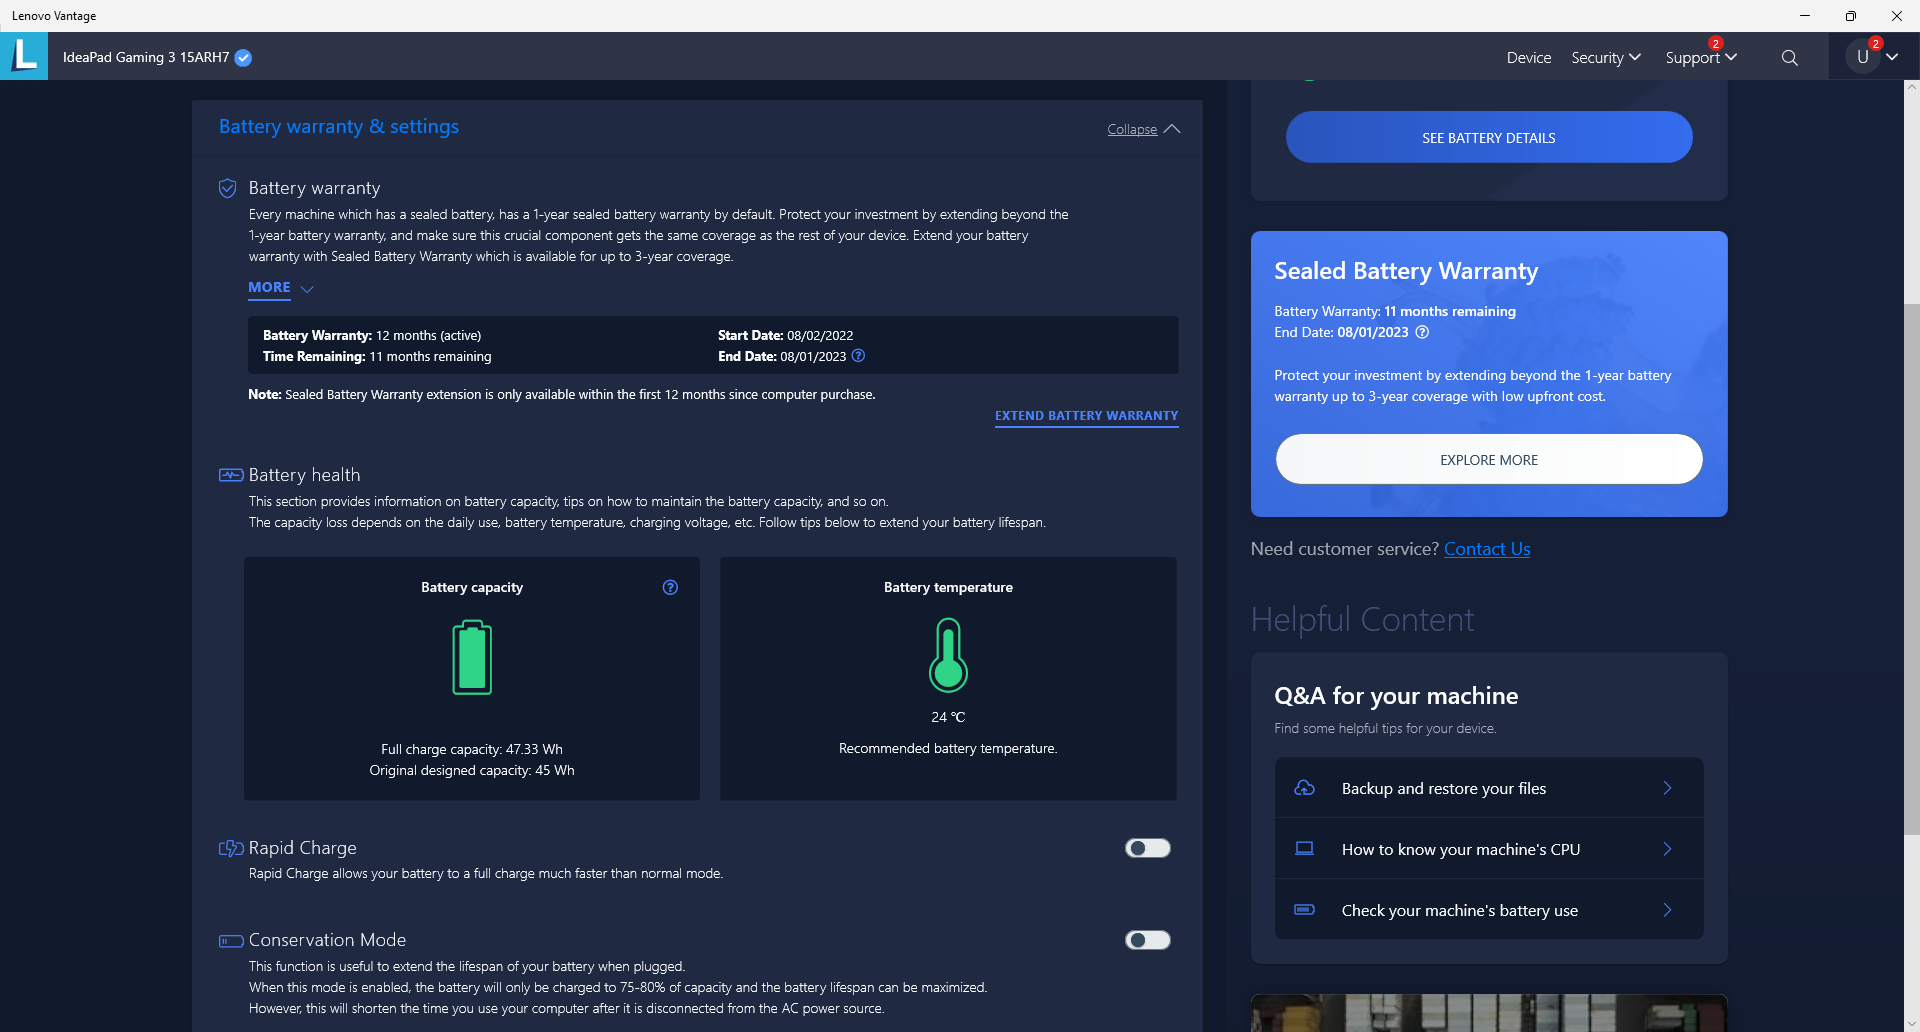
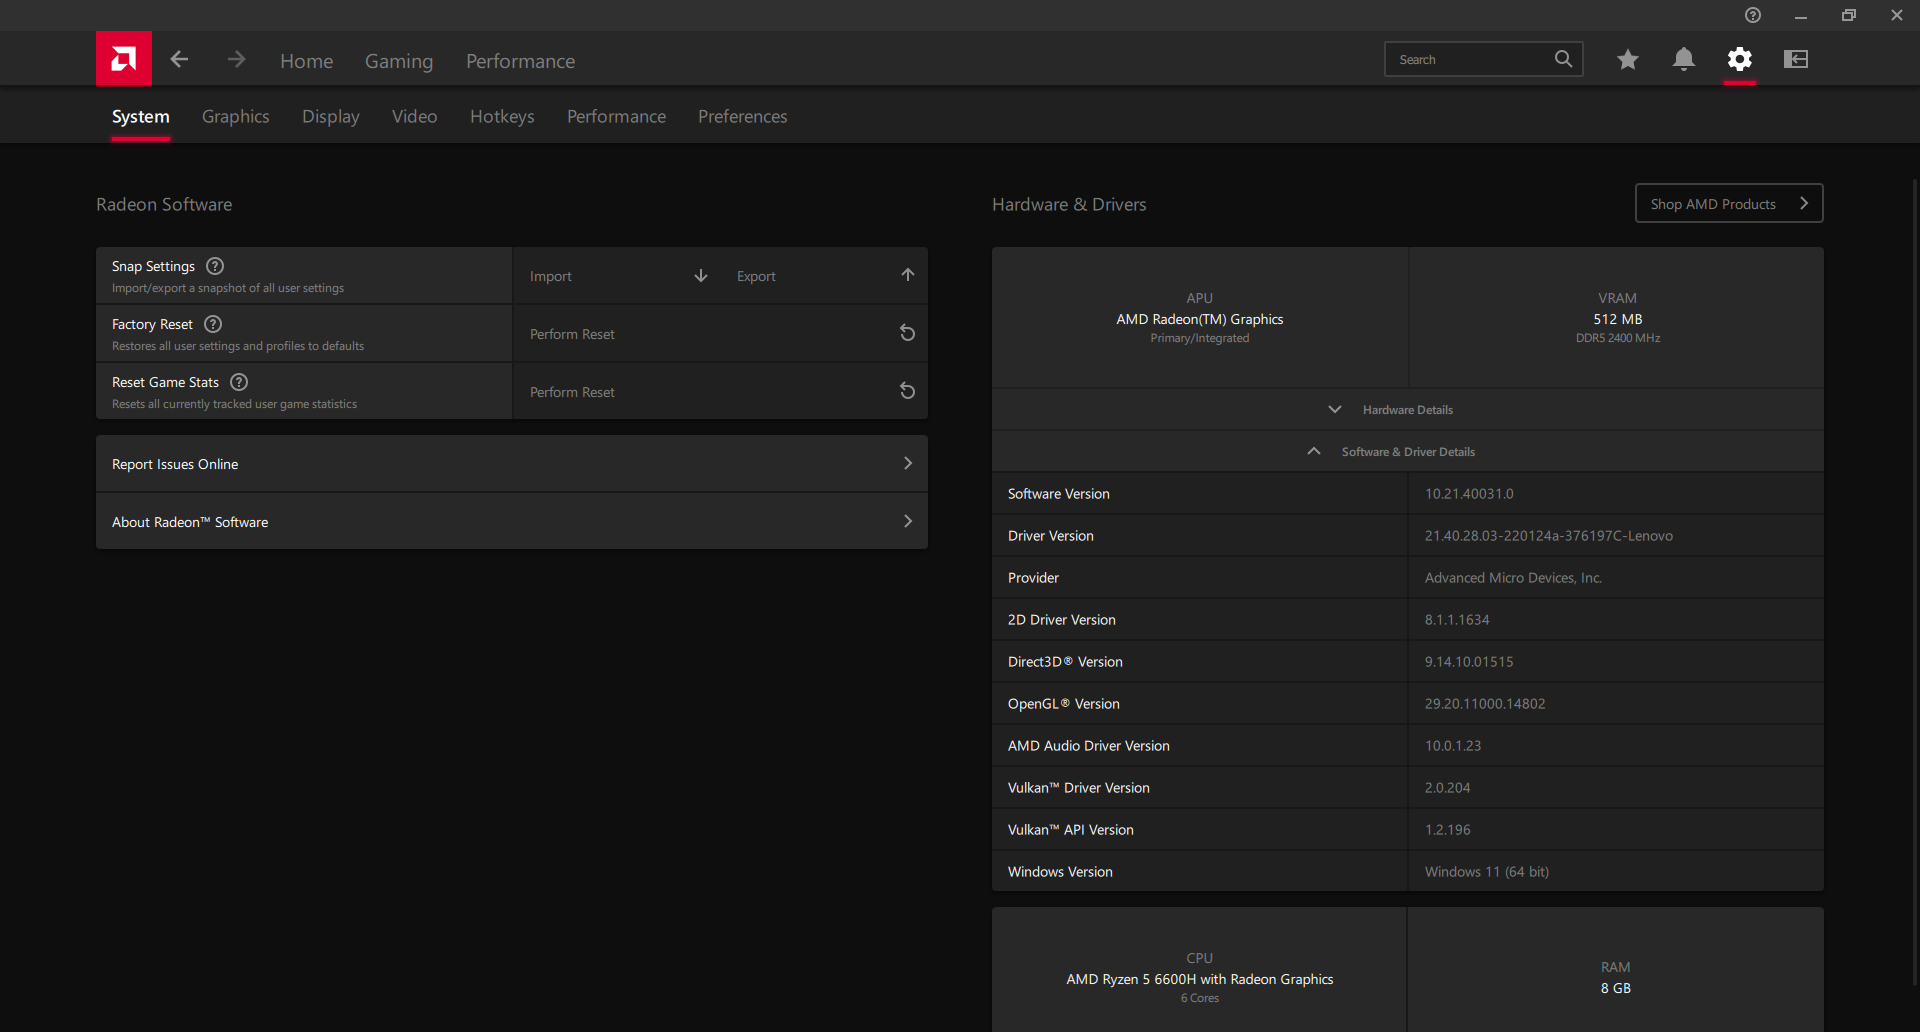
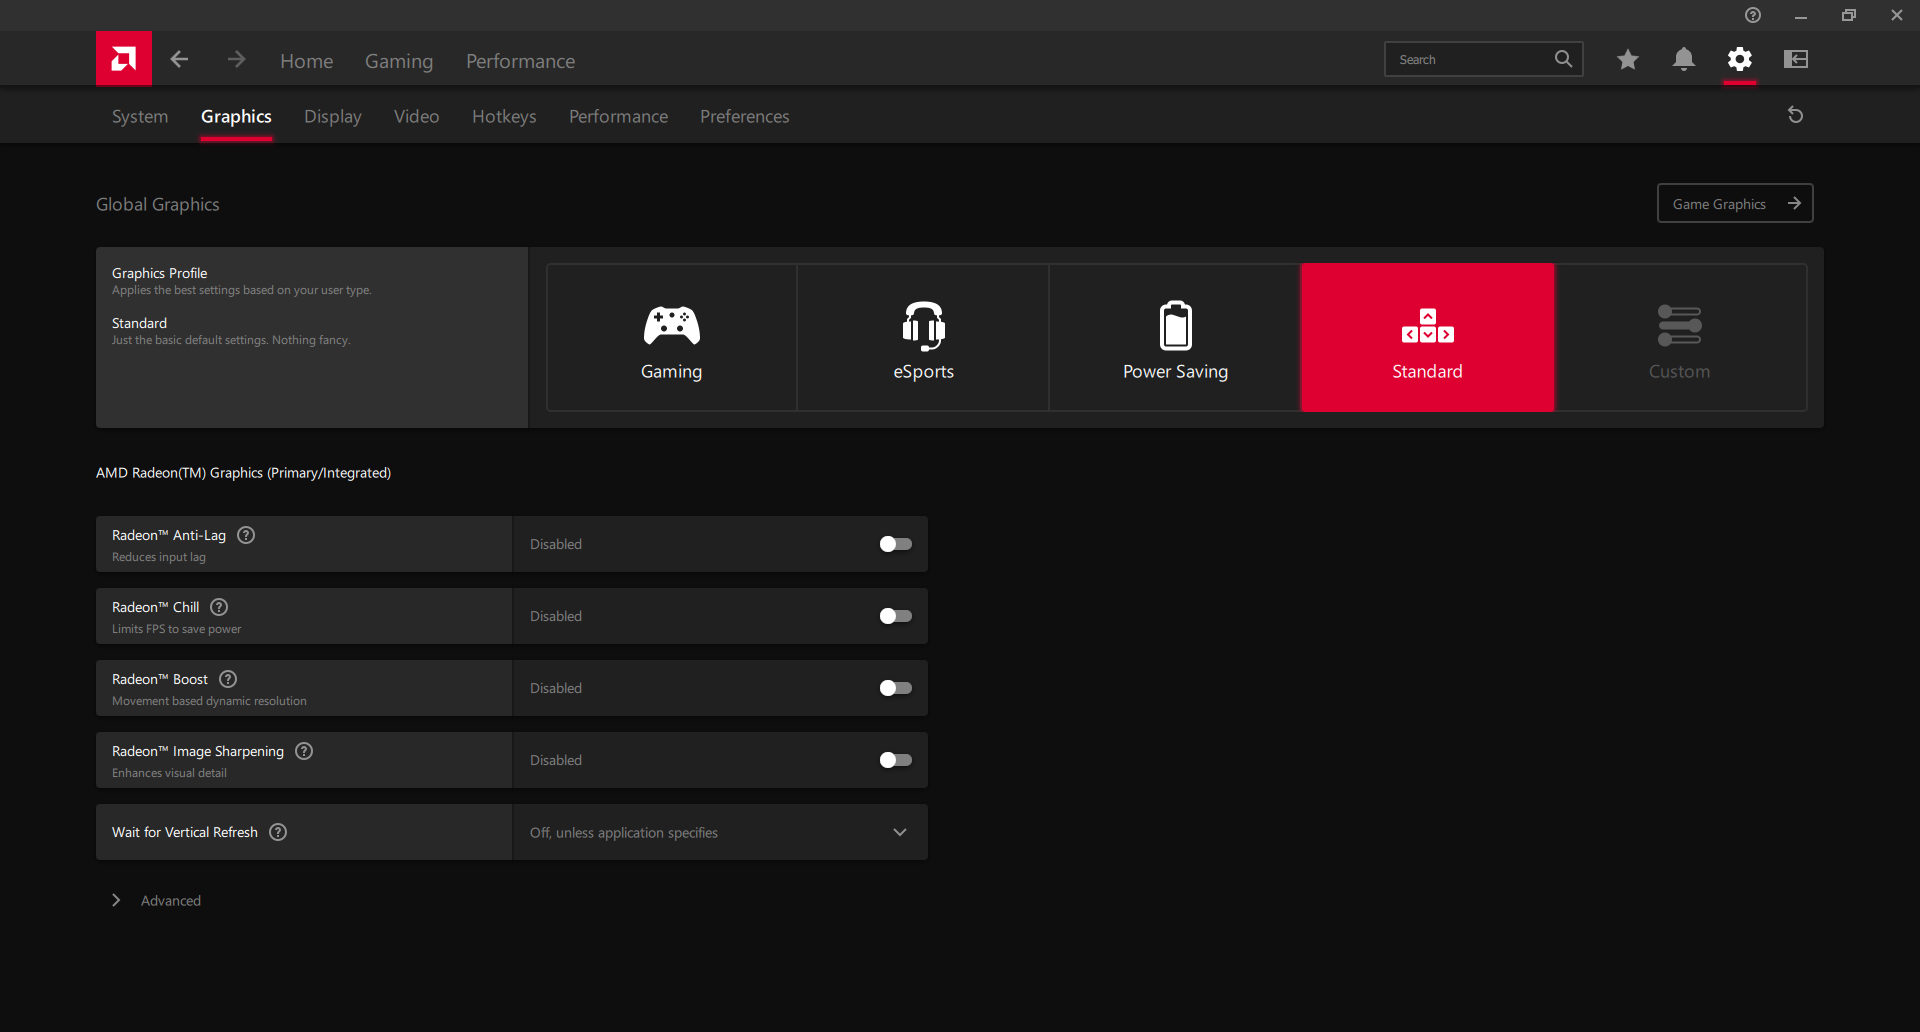
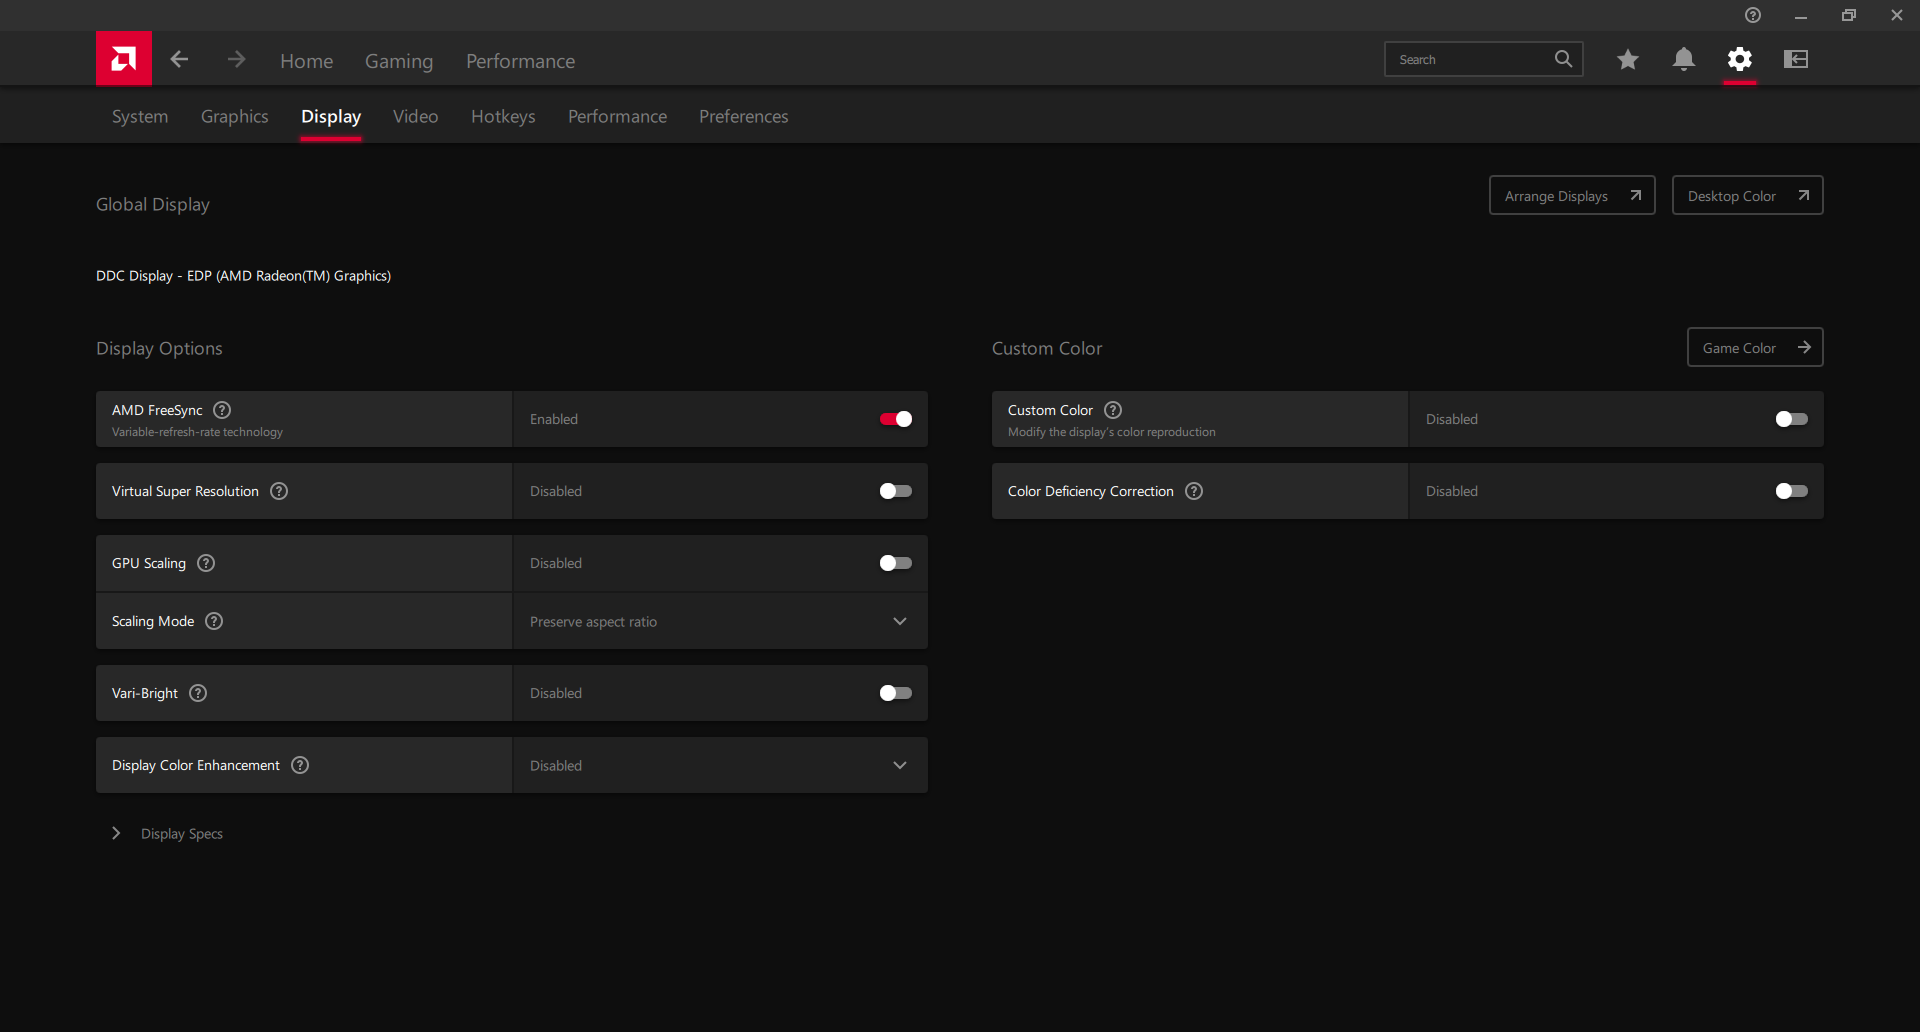
Wir haben in Windows und dem vorinstallierten Lenovo Vantage vor dem Durchführen der folgenden Benchmarks den Hochleistungsmodus ausgewählt. Außerdem haben wir über die Nvidia-Systemsteuerung sichergestellt, dass die Nvidia-GPU aktiv ist und die globalen Grafikeinstellungen in der Radeon-Software auf ihre Standardwerte gesetzt sind. Wir empfehlen Nutzern, sich mit den Vantage- und Radeon-Softwaretools auseinanderzusetzen, da sie die zentrale Anlaufstelle für Lenovo-Updates bzw. Displayeinstellungen sind.
Erwartungsgemäß verfügt der günstige Gaming-Laptop nicht über einen MUX-Schalter.


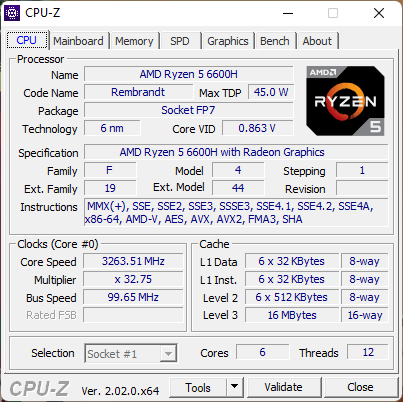
Prozessor — Leistung entspricht Ryzen 5 5600H
Gegenüber der Zen-2-CPU Ryzen 5 4600H war die Zen-3-CPU Ryzen 5 5600H bereits ein nennenswerter Fortschritt. Daher erwarten wir beim Wechsel vom Zen-3-Prozessor Ryzen 5 5600H auf den Zen-3+-Prozessor Ryzen 5 6600H bestenfalls geringe CPU-Leistungssprünge. Tatsächlich sind die Vorteile so gering, dass die Benchmarkergebnisse fast gleich ausfallen. So liegt das Gigabyte A5 K1 mit dem 5600H innerhalb einzelner Prozentpunkte unseres 6600H-Lenovo-Laptops. Daher sind sowohl der Ryzen 7 5800H als auch der Core i7-11800H, die jeweils aus der vorherigen Generation stammen, immer noch bei Weitem die schnelleren Prozessoren.
Weitere Informationen finden Sie auf unserer Seite zum Ryzen 5 6600H.
Dauerleistung: Cinebench R15 Multi
Cinebench R23: Multi Core | Single Core
Cinebench R15: CPU Multi 64Bit | CPU Single 64Bit
Blender: v2.79 BMW27 CPU
7-Zip 18.03: 7z b 4 | 7z b 4 -mmt1
Geekbench 5.5: Multi-Core | Single-Core
HWBOT x265 Benchmark v2.2: 4k Preset
LibreOffice : 20 Documents To PDF
R Benchmark 2.5: Overall mean
| Cinebench R20 / CPU (Multi Core) | |
| Acer Nitro 5 AN515-58-72QR | |
| Asus TUF Dash F15 FX517ZR | |
| Asus ROG Strix G15 G513QY | |
| Eurocom RX315 NH57AF1 | |
| MSI Alpha 15 B5EEK-008 | |
| Gigabyte A5 K1 | |
| Lenovo IdeaPad Gaming 3 15ARH7 | |
| Durchschnittliche AMD Ryzen 5 6600H (3498 - 4141, n=4) | |
| Lenovo Legion C7 15IMH05 82EH0030GE | |
| HP Pavilion Gaming 15-ec1206ng | |
| Dell G15 5510 | |
| Lenovo Ideapad Gaming 3 15IHU-82K1002RGE | |
| Lenovo IdeaPad Gaming 3i 15IMH05 | |
| Cinebench R20 / CPU (Single Core) | |
| Asus TUF Dash F15 FX517ZR | |
| Acer Nitro 5 AN515-58-72QR | |
| Asus ROG Strix G15 G513QY | |
| Eurocom RX315 NH57AF1 | |
| Durchschnittliche AMD Ryzen 5 6600H (564 - 584, n=4) | |
| Lenovo IdeaPad Gaming 3 15ARH7 | |
| MSI Alpha 15 B5EEK-008 | |
| Gigabyte A5 K1 | |
| Lenovo Ideapad Gaming 3 15IHU-82K1002RGE | |
| Lenovo Legion C7 15IMH05 82EH0030GE | |
| Lenovo IdeaPad Gaming 3i 15IMH05 | |
| Dell G15 5510 | |
| HP Pavilion Gaming 15-ec1206ng | |
| Cinebench R23 / Multi Core | |
| Acer Nitro 5 AN515-58-72QR | |
| Asus TUF Dash F15 FX517ZR | |
| Asus ROG Strix G15 G513QY | |
| Eurocom RX315 NH57AF1 | |
| MSI Alpha 15 B5EEK-008 | |
| Lenovo IdeaPad Gaming 3 15ARH7 | |
| Gigabyte A5 K1 | |
| Durchschnittliche AMD Ryzen 5 6600H (8931 - 10717, n=4) | |
| Lenovo Legion C7 15IMH05 82EH0030GE | |
| Dell G15 5510 | |
| Lenovo Ideapad Gaming 3 15IHU-82K1002RGE | |
| Cinebench R23 / Single Core | |
| Acer Nitro 5 AN515-58-72QR | |
| Asus TUF Dash F15 FX517ZR | |
| Eurocom RX315 NH57AF1 | |
| Asus ROG Strix G15 G513QY | |
| Durchschnittliche AMD Ryzen 5 6600H (1451 - 1486, n=4) | |
| Lenovo IdeaPad Gaming 3 15ARH7 | |
| MSI Alpha 15 B5EEK-008 | |
| Gigabyte A5 K1 | |
| Lenovo Ideapad Gaming 3 15IHU-82K1002RGE | |
| Lenovo Legion C7 15IMH05 82EH0030GE | |
| Dell G15 5510 | |
| Cinebench R15 / CPU Multi 64Bit | |
| Acer Nitro 5 AN515-58-72QR | |
| Asus ROG Strix G15 G513QY | |
| Asus TUF Dash F15 FX517ZR | |
| MSI Alpha 15 B5EEK-008 | |
| Eurocom RX315 NH57AF1 | |
| Lenovo Legion C7 15IMH05 82EH0030GE | |
| Gigabyte A5 K1 | |
| Durchschnittliche AMD Ryzen 5 6600H (1454 - 1740, n=4) | |
| Lenovo IdeaPad Gaming 3 15ARH7 | |
| HP Pavilion Gaming 15-ec1206ng | |
| Dell G15 5510 | |
| Lenovo Ideapad Gaming 3 15IHU-82K1002RGE | |
| Lenovo IdeaPad Gaming 3i 15IMH05 | |
| Cinebench R15 / CPU Single 64Bit | |
| Acer Nitro 5 AN515-58-72QR | |
| Asus TUF Dash F15 FX517ZR | |
| Asus ROG Strix G15 G513QY | |
| Durchschnittliche AMD Ryzen 5 6600H (231 - 243, n=4) | |
| Lenovo IdeaPad Gaming 3 15ARH7 | |
| MSI Alpha 15 B5EEK-008 | |
| Eurocom RX315 NH57AF1 | |
| Gigabyte A5 K1 | |
| Lenovo Ideapad Gaming 3 15IHU-82K1002RGE | |
| Lenovo Legion C7 15IMH05 82EH0030GE | |
| Lenovo IdeaPad Gaming 3i 15IMH05 | |
| Dell G15 5510 | |
| HP Pavilion Gaming 15-ec1206ng | |
| Blender / v2.79 BMW27 CPU | |
| Lenovo IdeaPad Gaming 3i 15IMH05 | |
| Lenovo Ideapad Gaming 3 15IHU-82K1002RGE | |
| Dell G15 5510 | |
| HP Pavilion Gaming 15-ec1206ng | |
| Lenovo Legion C7 15IMH05 82EH0030GE | |
| Durchschnittliche AMD Ryzen 5 6600H (291 - 340, n=4) | |
| Lenovo IdeaPad Gaming 3 15ARH7 | |
| Gigabyte A5 K1 | |
| Eurocom RX315 NH57AF1 | |
| MSI Alpha 15 B5EEK-008 | |
| Asus TUF Dash F15 FX517ZR | |
| Asus ROG Strix G15 G513QY | |
| Acer Nitro 5 AN515-58-72QR | |
| 7-Zip 18.03 / 7z b 4 | |
| Asus TUF Dash F15 FX517ZR | |
| Acer Nitro 5 AN515-58-72QR | |
| MSI Alpha 15 B5EEK-008 | |
| Asus ROG Strix G15 G513QY | |
| Gigabyte A5 K1 | |
| Lenovo Legion C7 15IMH05 82EH0030GE | |
| Eurocom RX315 NH57AF1 | |
| Durchschnittliche AMD Ryzen 5 6600H (36080 - 49353, n=4) | |
| Lenovo IdeaPad Gaming 3 15ARH7 | |
| HP Pavilion Gaming 15-ec1206ng | |
| Dell G15 5510 | |
| Lenovo Ideapad Gaming 3 15IHU-82K1002RGE | |
| Lenovo IdeaPad Gaming 3i 15IMH05 | |
| 7-Zip 18.03 / 7z b 4 -mmt1 | |
| Acer Nitro 5 AN515-58-72QR | |
| Asus TUF Dash F15 FX517ZR | |
| Asus ROG Strix G15 G513QY | |
| MSI Alpha 15 B5EEK-008 | |
| Durchschnittliche AMD Ryzen 5 6600H (5150 - 5720, n=4) | |
| Lenovo IdeaPad Gaming 3 15ARH7 | |
| Lenovo Legion C7 15IMH05 82EH0030GE | |
| Eurocom RX315 NH57AF1 | |
| Gigabyte A5 K1 | |
| Lenovo IdeaPad Gaming 3i 15IMH05 | |
| Dell G15 5510 | |
| Lenovo Ideapad Gaming 3 15IHU-82K1002RGE | |
| HP Pavilion Gaming 15-ec1206ng | |
| Geekbench 5.5 / Multi-Core | |
| Asus TUF Dash F15 FX517ZR | |
| Acer Nitro 5 AN515-58-72QR | |
| Eurocom RX315 NH57AF1 | |
| MSI Alpha 15 B5EEK-008 | |
| Lenovo Legion C7 15IMH05 82EH0030GE | |
| Asus ROG Strix G15 G513QY | |
| Durchschnittliche AMD Ryzen 5 6600H (6403 - 8195, n=4) | |
| Gigabyte A5 K1 | |
| Lenovo IdeaPad Gaming 3 15ARH7 | |
| HP Pavilion Gaming 15-ec1206ng | |
| Dell G15 5510 | |
| Lenovo Ideapad Gaming 3 15IHU-82K1002RGE | |
| Lenovo IdeaPad Gaming 3i 15IMH05 | |
| Geekbench 5.5 / Single-Core | |
| Asus TUF Dash F15 FX517ZR | |
| Acer Nitro 5 AN515-58-72QR | |
| Eurocom RX315 NH57AF1 | |
| Asus ROG Strix G15 G513QY | |
| MSI Alpha 15 B5EEK-008 | |
| Durchschnittliche AMD Ryzen 5 6600H (1446 - 1513, n=4) | |
| Lenovo IdeaPad Gaming 3 15ARH7 | |
| Gigabyte A5 K1 | |
| Lenovo Ideapad Gaming 3 15IHU-82K1002RGE | |
| Lenovo Legion C7 15IMH05 82EH0030GE | |
| Lenovo IdeaPad Gaming 3i 15IMH05 | |
| Dell G15 5510 | |
| HP Pavilion Gaming 15-ec1206ng | |
| HWBOT x265 Benchmark v2.2 / 4k Preset | |
| Acer Nitro 5 AN515-58-72QR | |
| Asus TUF Dash F15 FX517ZR | |
| Asus ROG Strix G15 G513QY | |
| MSI Alpha 15 B5EEK-008 | |
| Eurocom RX315 NH57AF1 | |
| Gigabyte A5 K1 | |
| Durchschnittliche AMD Ryzen 5 6600H (11.5 - 14.2, n=4) | |
| Lenovo Legion C7 15IMH05 82EH0030GE | |
| Lenovo IdeaPad Gaming 3 15ARH7 | |
| HP Pavilion Gaming 15-ec1206ng | |
| Dell G15 5510 | |
| Lenovo Ideapad Gaming 3 15IHU-82K1002RGE | |
| Lenovo IdeaPad Gaming 3i 15IMH05 | |
| LibreOffice / 20 Documents To PDF | |
| Gigabyte A5 K1 | |
| HP Pavilion Gaming 15-ec1206ng | |
| Durchschnittliche AMD Ryzen 5 6600H (52.4 - 78.8, n=4) | |
| Dell G15 5510 | |
| Lenovo IdeaPad Gaming 3 15ARH7 | |
| Lenovo Legion C7 15IMH05 82EH0030GE | |
| MSI Alpha 15 B5EEK-008 | |
| Lenovo Ideapad Gaming 3 15IHU-82K1002RGE | |
| Asus ROG Strix G15 G513QY | |
| Lenovo IdeaPad Gaming 3i 15IMH05 | |
| Eurocom RX315 NH57AF1 | |
| Acer Nitro 5 AN515-58-72QR | |
| Asus TUF Dash F15 FX517ZR | |
| R Benchmark 2.5 / Overall mean | |
| Lenovo IdeaPad Gaming 3i 15IMH05 | |
| Dell G15 5510 | |
| Lenovo Ideapad Gaming 3 15IHU-82K1002RGE | |
| HP Pavilion Gaming 15-ec1206ng | |
| Lenovo Legion C7 15IMH05 82EH0030GE | |
| Eurocom RX315 NH57AF1 | |
| Lenovo IdeaPad Gaming 3 15ARH7 | |
| Gigabyte A5 K1 | |
| MSI Alpha 15 B5EEK-008 | |
| Durchschnittliche AMD Ryzen 5 6600H (0.4995 - 0.535, n=4) | |
| Asus ROG Strix G15 G513QY | |
| Asus TUF Dash F15 FX517ZR | |
| Acer Nitro 5 AN515-58-72QR | |
Cinebench R23: Multi Core | Single Core
Cinebench R15: CPU Multi 64Bit | CPU Single 64Bit
Blender: v2.79 BMW27 CPU
7-Zip 18.03: 7z b 4 | 7z b 4 -mmt1
Geekbench 5.5: Multi-Core | Single-Core
HWBOT x265 Benchmark v2.2: 4k Preset
LibreOffice : 20 Documents To PDF
R Benchmark 2.5: Overall mean
* ... kleinere Werte sind besser
AIDA64: FP32 Ray-Trace | FPU Julia | CPU SHA3 | CPU Queen | FPU SinJulia | FPU Mandel | CPU AES | CPU ZLib | FP64 Ray-Trace | CPU PhotoWorxx
| Performance Rating | |
| Asus TUF Dash F15 FX517ZR | |
| Durchschnittliche AMD Ryzen 5 6600H | |
| Lenovo IdeaPad Gaming 3 15ARH7 | |
| Lenovo Legion 5 15ACH6A-82NW0010GE | |
| Gigabyte A5 K1 | |
| Dell G15 5510 | |
| Lenovo IdeaPad Gaming 3i 15IMH05 | |
| AIDA64 / FP32 Ray-Trace | |
| Asus TUF Dash F15 FX517ZR | |
| Lenovo Legion 5 15ACH6A-82NW0010GE | |
| Gigabyte A5 K1 | |
| Lenovo IdeaPad Gaming 3 15ARH7 | |
| Durchschnittliche AMD Ryzen 5 6600H (10645 - 12871, n=4) | |
| Dell G15 5510 | |
| Lenovo IdeaPad Gaming 3i 15IMH05 | |
| AIDA64 / FPU Julia | |
| Lenovo Legion 5 15ACH6A-82NW0010GE | |
| Gigabyte A5 K1 | |
| Lenovo IdeaPad Gaming 3 15ARH7 | |
| Durchschnittliche AMD Ryzen 5 6600H (66739 - 78277, n=4) | |
| Asus TUF Dash F15 FX517ZR | |
| Dell G15 5510 | |
| Lenovo IdeaPad Gaming 3i 15IMH05 | |
| AIDA64 / CPU SHA3 | |
| Asus TUF Dash F15 FX517ZR | |
| Lenovo Legion 5 15ACH6A-82NW0010GE | |
| Lenovo IdeaPad Gaming 3 15ARH7 | |
| Durchschnittliche AMD Ryzen 5 6600H (2231 - 2689, n=4) | |
| Gigabyte A5 K1 | |
| Dell G15 5510 | |
| Lenovo IdeaPad Gaming 3i 15IMH05 | |
| AIDA64 / CPU Queen | |
| Asus TUF Dash F15 FX517ZR | |
| Durchschnittliche AMD Ryzen 5 6600H (77711 - 82119, n=4) | |
| Lenovo IdeaPad Gaming 3 15ARH7 | |
| Gigabyte A5 K1 | |
| Lenovo Legion 5 15ACH6A-82NW0010GE | |
| Dell G15 5510 | |
| Lenovo IdeaPad Gaming 3i 15IMH05 | |
| AIDA64 / FPU SinJulia | |
| Durchschnittliche AMD Ryzen 5 6600H (9184 - 9739, n=4) | |
| Lenovo IdeaPad Gaming 3 15ARH7 | |
| Gigabyte A5 K1 | |
| Lenovo Legion 5 15ACH6A-82NW0010GE | |
| Asus TUF Dash F15 FX517ZR | |
| Dell G15 5510 | |
| Lenovo IdeaPad Gaming 3i 15IMH05 | |
| AIDA64 / FPU Mandel | |
| Lenovo Legion 5 15ACH6A-82NW0010GE | |
| Gigabyte A5 K1 | |
| Lenovo IdeaPad Gaming 3 15ARH7 | |
| Durchschnittliche AMD Ryzen 5 6600H (36591 - 43222, n=4) | |
| Asus TUF Dash F15 FX517ZR | |
| Dell G15 5510 | |
| Lenovo IdeaPad Gaming 3i 15IMH05 | |
| AIDA64 / CPU AES | |
| Lenovo IdeaPad Gaming 3 15ARH7 | |
| Lenovo Legion 5 15ACH6A-82NW0010GE | |
| Durchschnittliche AMD Ryzen 5 6600H (43461 - 104138, n=4) | |
| Asus TUF Dash F15 FX517ZR | |
| Gigabyte A5 K1 | |
| Dell G15 5510 | |
| Lenovo IdeaPad Gaming 3i 15IMH05 | |
| AIDA64 / CPU ZLib | |
| Asus TUF Dash F15 FX517ZR | |
| Lenovo IdeaPad Gaming 3 15ARH7 | |
| Lenovo Legion 5 15ACH6A-82NW0010GE | |
| Gigabyte A5 K1 | |
| Durchschnittliche AMD Ryzen 5 6600H (523 - 660, n=4) | |
| Dell G15 5510 | |
| Lenovo IdeaPad Gaming 3i 15IMH05 | |
| AIDA64 / FP64 Ray-Trace | |
| Asus TUF Dash F15 FX517ZR | |
| Lenovo Legion 5 15ACH6A-82NW0010GE | |
| Gigabyte A5 K1 | |
| Lenovo IdeaPad Gaming 3 15ARH7 | |
| Durchschnittliche AMD Ryzen 5 6600H (5659 - 6911, n=4) | |
| Dell G15 5510 | |
| Lenovo IdeaPad Gaming 3i 15IMH05 | |
| AIDA64 / CPU PhotoWorxx | |
| Asus TUF Dash F15 FX517ZR | |
| Durchschnittliche AMD Ryzen 5 6600H (16218 - 29621, n=4) | |
| Gigabyte A5 K1 | |
| Lenovo IdeaPad Gaming 3i 15IMH05 | |
| Lenovo IdeaPad Gaming 3 15ARH7 | |
| Dell G15 5510 | |
| Lenovo Legion 5 15ACH6A-82NW0010GE | |
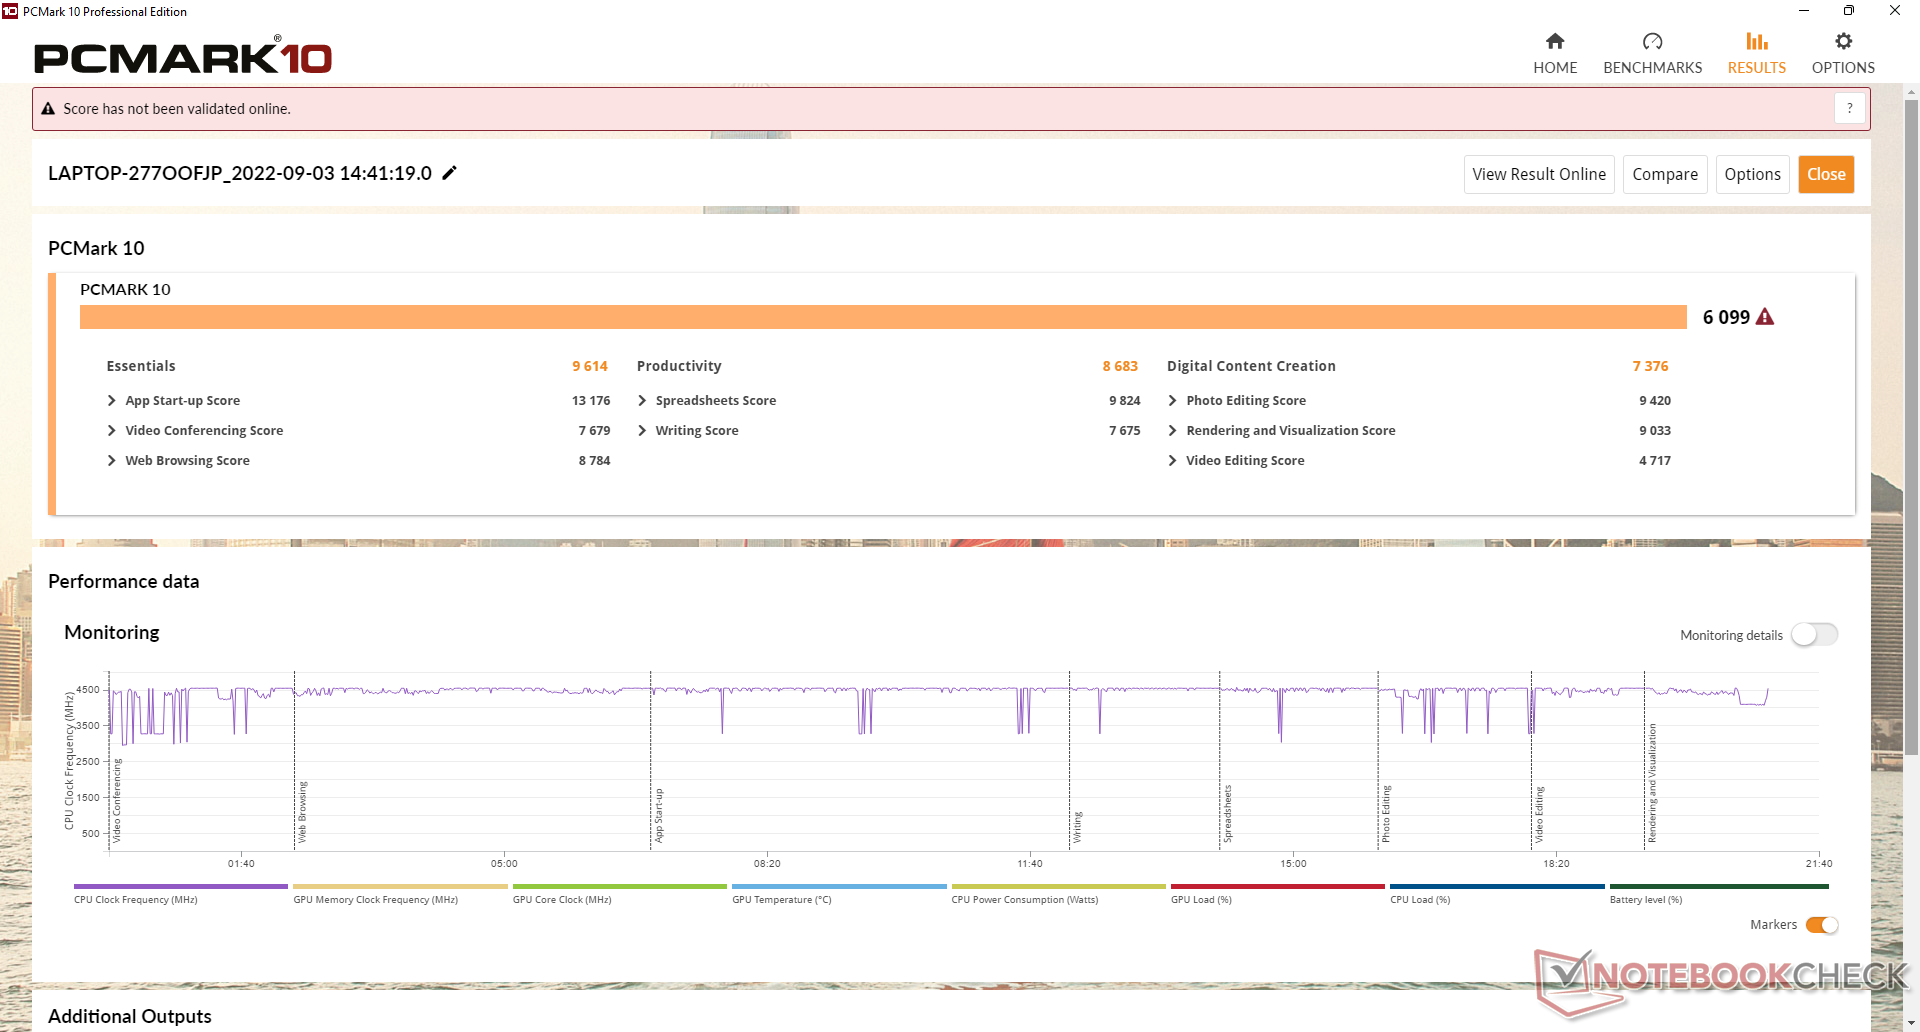
Systemleistung
Die PCMark-Punktzahlen fallen konstant höher als beim älteren IdeaPad Gaming 3i 15IMH05, aber immer noch niedriger als beim Legion 5 15ACH6A mit der schnelleren Radeon RX 6600M aus. Vor allem die Digital-Content-Creation-Punktzahl ist besser als beim IdeaPad Gaming 3i 15IMH05, was auf die Grafikkarte aus der neuen Generation zurückzuführen ist.
CrossMark: Overall | Productivity | Creativity | Responsiveness
| PCMark 10 / Score | |
| Lenovo Legion 5 15ACH6A-82NW0010GE | |
| Asus TUF Dash F15 FX517ZR | |
| Gigabyte A5 K1 | |
| Lenovo IdeaPad Gaming 3 15ARH7 | |
| Durchschnittliche AMD Ryzen 5 6600H, NVIDIA GeForce RTX 3050 4GB Laptop GPU (n=1) | |
| Dell G15 5510 | |
| Lenovo IdeaPad Gaming 3i 15IMH05 | |
| PCMark 10 / Essentials | |
| Lenovo Legion 5 15ACH6A-82NW0010GE | |
| Gigabyte A5 K1 | |
| Asus TUF Dash F15 FX517ZR | |
| Lenovo IdeaPad Gaming 3 15ARH7 | |
| Durchschnittliche AMD Ryzen 5 6600H, NVIDIA GeForce RTX 3050 4GB Laptop GPU (n=1) | |
| Lenovo IdeaPad Gaming 3i 15IMH05 | |
| Dell G15 5510 | |
| PCMark 10 / Productivity | |
| Asus TUF Dash F15 FX517ZR | |
| Lenovo Legion 5 15ACH6A-82NW0010GE | |
| Gigabyte A5 K1 | |
| Lenovo IdeaPad Gaming 3 15ARH7 | |
| Durchschnittliche AMD Ryzen 5 6600H, NVIDIA GeForce RTX 3050 4GB Laptop GPU (n=1) | |
| Lenovo IdeaPad Gaming 3i 15IMH05 | |
| Dell G15 5510 | |
| PCMark 10 / Digital Content Creation | |
| Lenovo Legion 5 15ACH6A-82NW0010GE | |
| Asus TUF Dash F15 FX517ZR | |
| Gigabyte A5 K1 | |
| Lenovo IdeaPad Gaming 3 15ARH7 | |
| Durchschnittliche AMD Ryzen 5 6600H, NVIDIA GeForce RTX 3050 4GB Laptop GPU (n=1) | |
| Dell G15 5510 | |
| Lenovo IdeaPad Gaming 3i 15IMH05 | |
| CrossMark / Overall | |
| Asus TUF Dash F15 FX517ZR | |
| Lenovo IdeaPad Gaming 3 15ARH7 | |
| Durchschnittliche AMD Ryzen 5 6600H, NVIDIA GeForce RTX 3050 4GB Laptop GPU (n=1) | |
| CrossMark / Productivity | |
| Asus TUF Dash F15 FX517ZR | |
| Lenovo IdeaPad Gaming 3 15ARH7 | |
| Durchschnittliche AMD Ryzen 5 6600H, NVIDIA GeForce RTX 3050 4GB Laptop GPU (n=1) | |
| CrossMark / Creativity | |
| Asus TUF Dash F15 FX517ZR | |
| Lenovo IdeaPad Gaming 3 15ARH7 | |
| Durchschnittliche AMD Ryzen 5 6600H, NVIDIA GeForce RTX 3050 4GB Laptop GPU (n=1) | |
| CrossMark / Responsiveness | |
| Asus TUF Dash F15 FX517ZR | |
| Lenovo IdeaPad Gaming 3 15ARH7 | |
| Durchschnittliche AMD Ryzen 5 6600H, NVIDIA GeForce RTX 3050 4GB Laptop GPU (n=1) | |
| PCMark 10 Score | 6099 Punkte | |
Hilfe | ||
| AIDA64 / Memory Copy | |
| Asus TUF Dash F15 FX517ZR | |
| Durchschnittliche AMD Ryzen 5 6600H (28335 - 50886, n=4) | |
| Gigabyte A5 K1 | |
| Lenovo Legion 5 15ACH6A-82NW0010GE | |
| Dell G15 5510 | |
| Lenovo IdeaPad Gaming 3i 15IMH05 | |
| Lenovo IdeaPad Gaming 3 15ARH7 | |
| AIDA64 / Memory Read | |
| Asus TUF Dash F15 FX517ZR | |
| Gigabyte A5 K1 | |
| Durchschnittliche AMD Ryzen 5 6600H (34300 - 51684, n=4) | |
| Lenovo Legion 5 15ACH6A-82NW0010GE | |
| Lenovo IdeaPad Gaming 3i 15IMH05 | |
| Dell G15 5510 | |
| Lenovo IdeaPad Gaming 3 15ARH7 | |
| AIDA64 / Memory Write | |
| Asus TUF Dash F15 FX517ZR | |
| Durchschnittliche AMD Ryzen 5 6600H (31788 - 55160, n=4) | |
| Gigabyte A5 K1 | |
| Dell G15 5510 | |
| Lenovo IdeaPad Gaming 3i 15IMH05 | |
| Lenovo IdeaPad Gaming 3 15ARH7 | |
| Lenovo Legion 5 15ACH6A-82NW0010GE | |
| AIDA64 / Memory Latency | |
| Asus TUF Dash F15 FX517ZR | |
| Durchschnittliche AMD Ryzen 5 6600H (81.7 - 112.7, n=4) | |
| Lenovo Legion 5 15ACH6A-82NW0010GE | |
| Lenovo IdeaPad Gaming 3 15ARH7 | |
| Dell G15 5510 | |
| Gigabyte A5 K1 | |
| Lenovo IdeaPad Gaming 3i 15IMH05 | |
* ... kleinere Werte sind besser
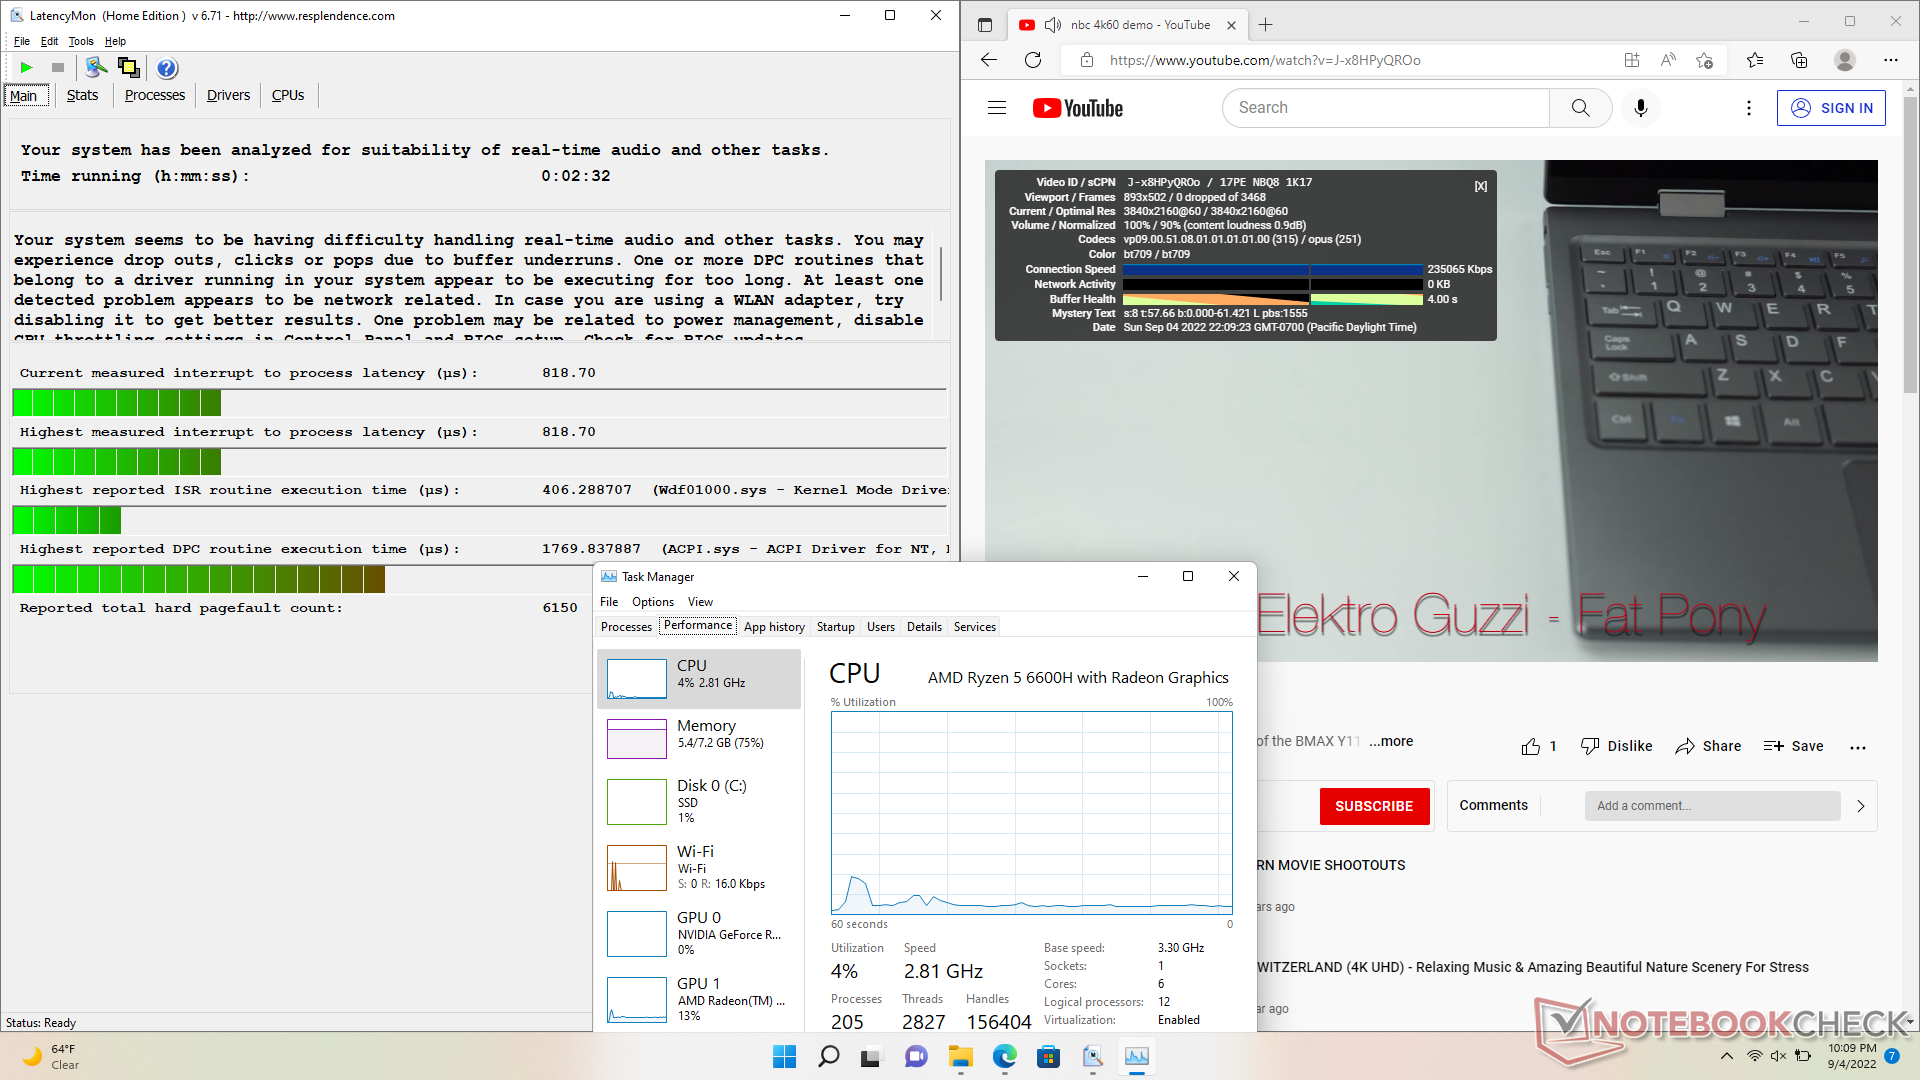
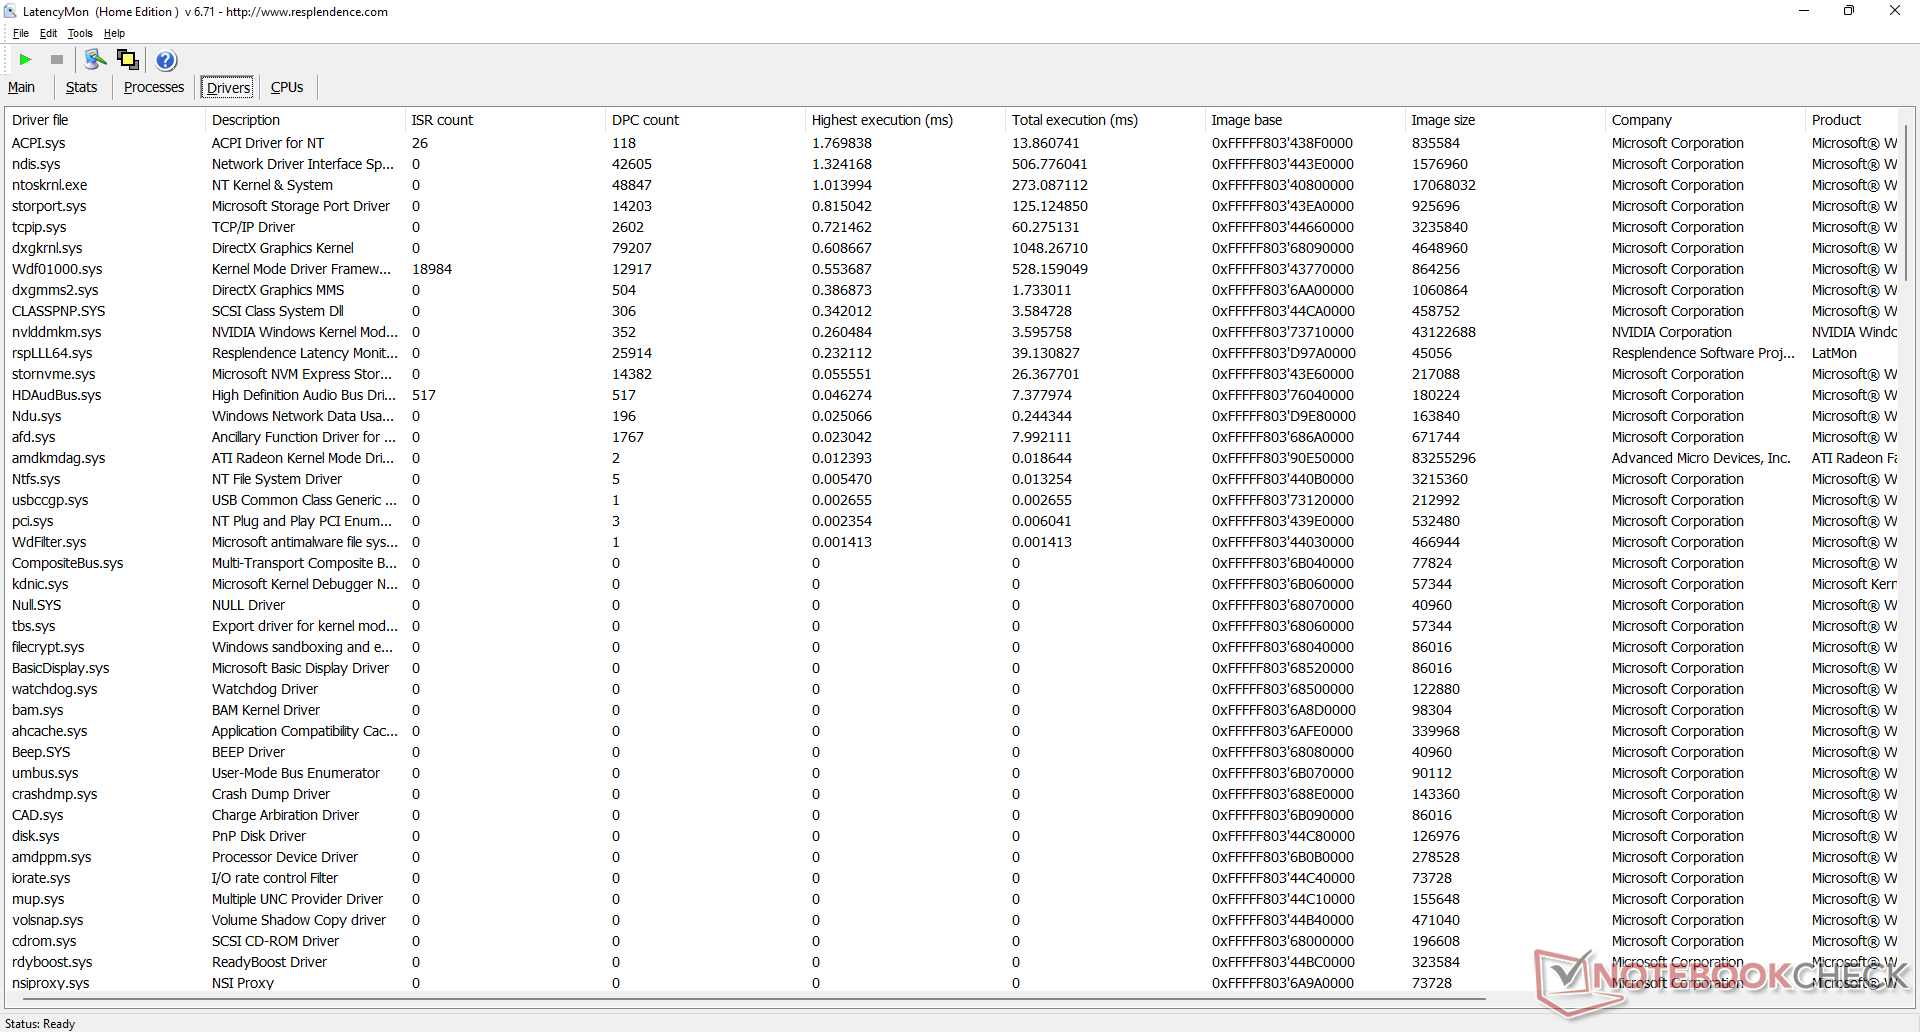
DPC-Latenzen
LatencyMon meldet beim Öffnen unserer Homepage in mehreren Tabs leicht erhöhte DPC-Latenzen. Die 4K-Videowiedergabe mit 60 Fps gelingt flüssig ohne verlorene Frames und mit einer geringeren iGPU-Auslastung als bei der Iris Xe der Intel-Core-U-Reihe (13 % vs. ~40 %).
| DPC Latencies / LatencyMon - interrupt to process latency (max), Web, Youtube, Prime95 | |
| Dell G15 5510 | |
| Gigabyte A5 K1 | |
| Lenovo Legion 5 15ACH6A-82NW0010GE | |
| Lenovo IdeaPad Gaming 3 15ARH7 | |
| Lenovo IdeaPad Gaming 3i 15IMH05 | |
| Asus TUF Dash F15 FX517ZR | |
* ... kleinere Werte sind besser
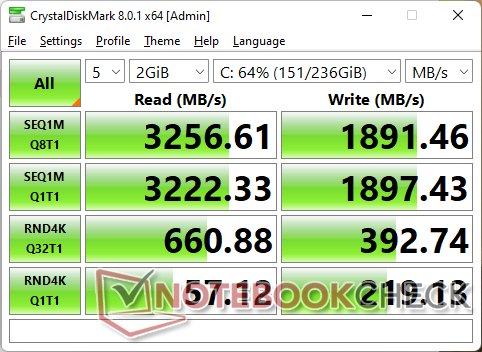
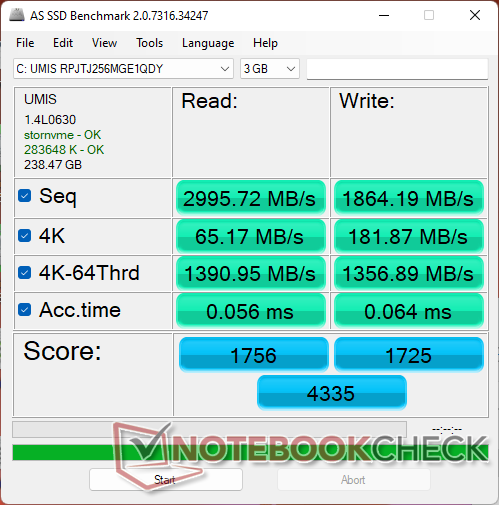
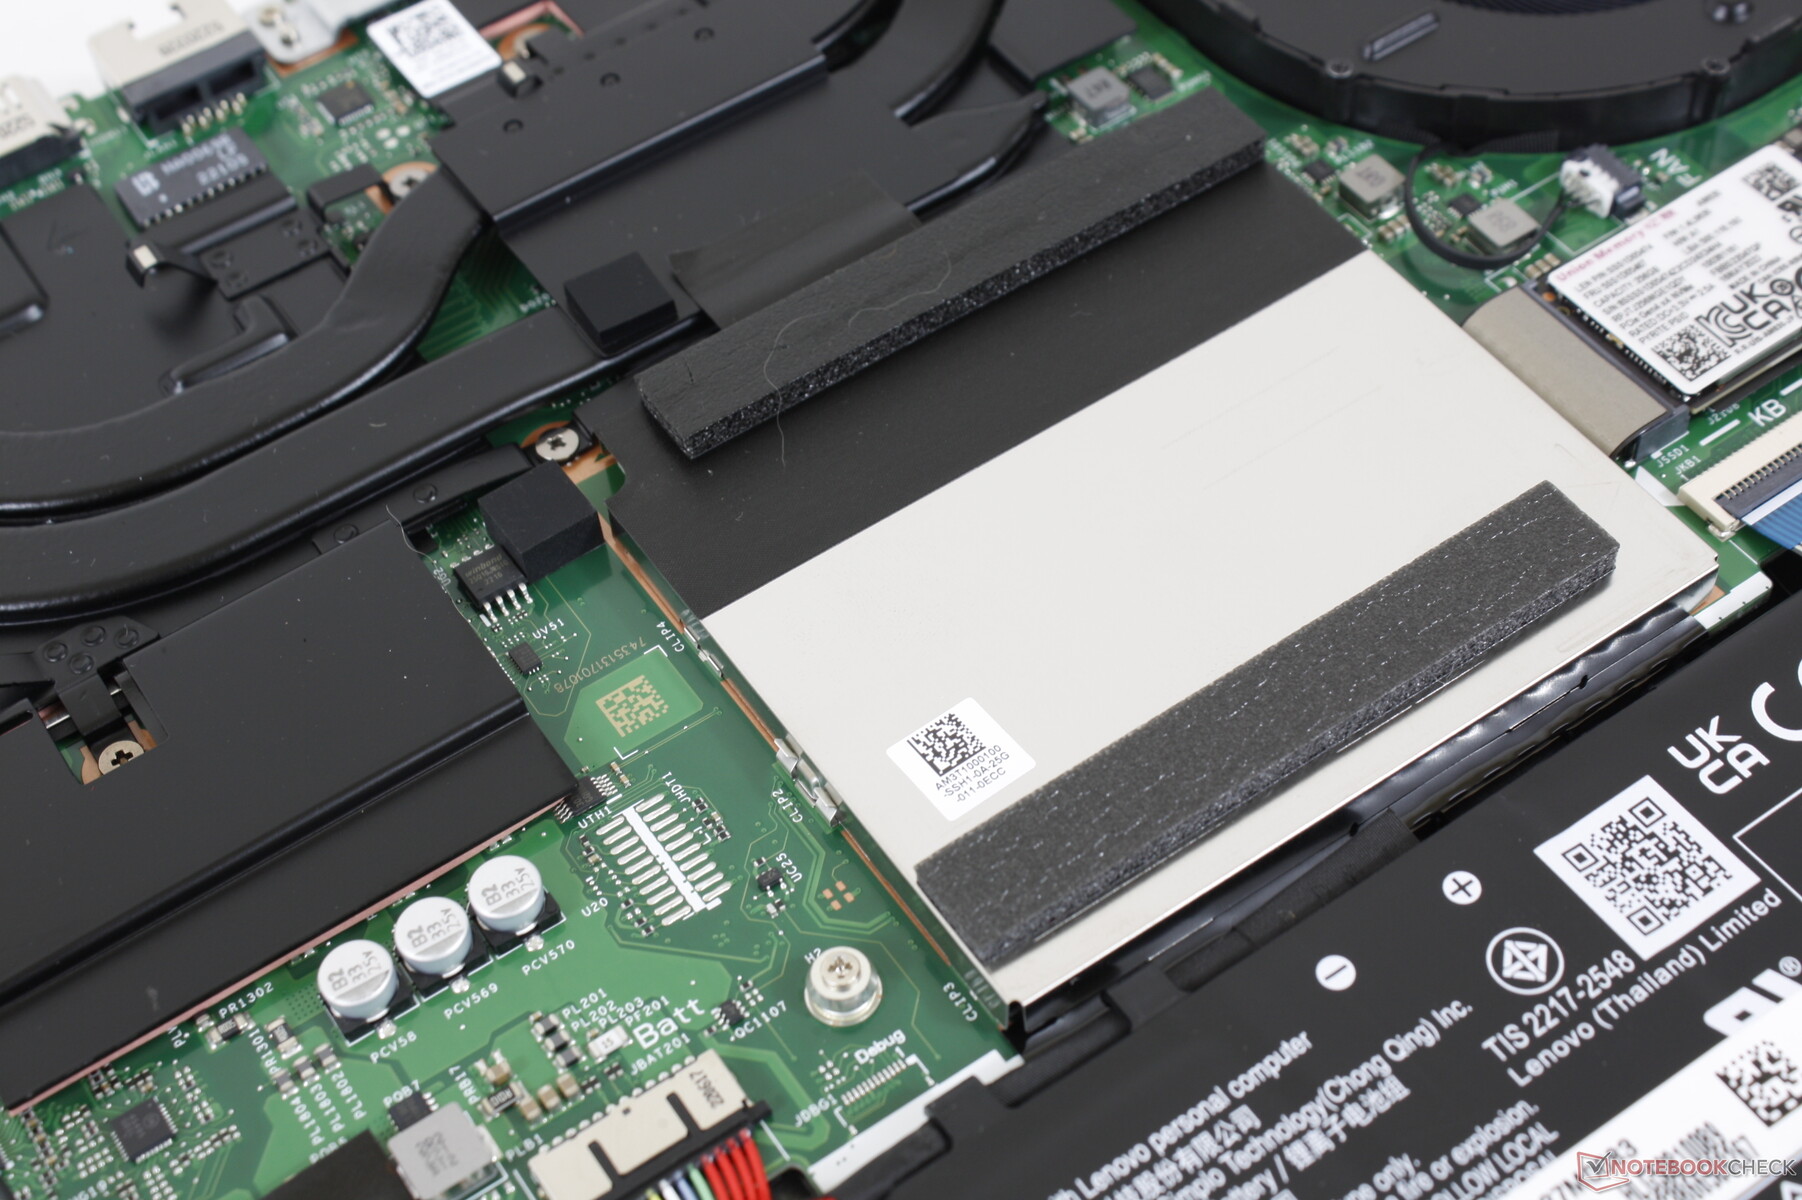
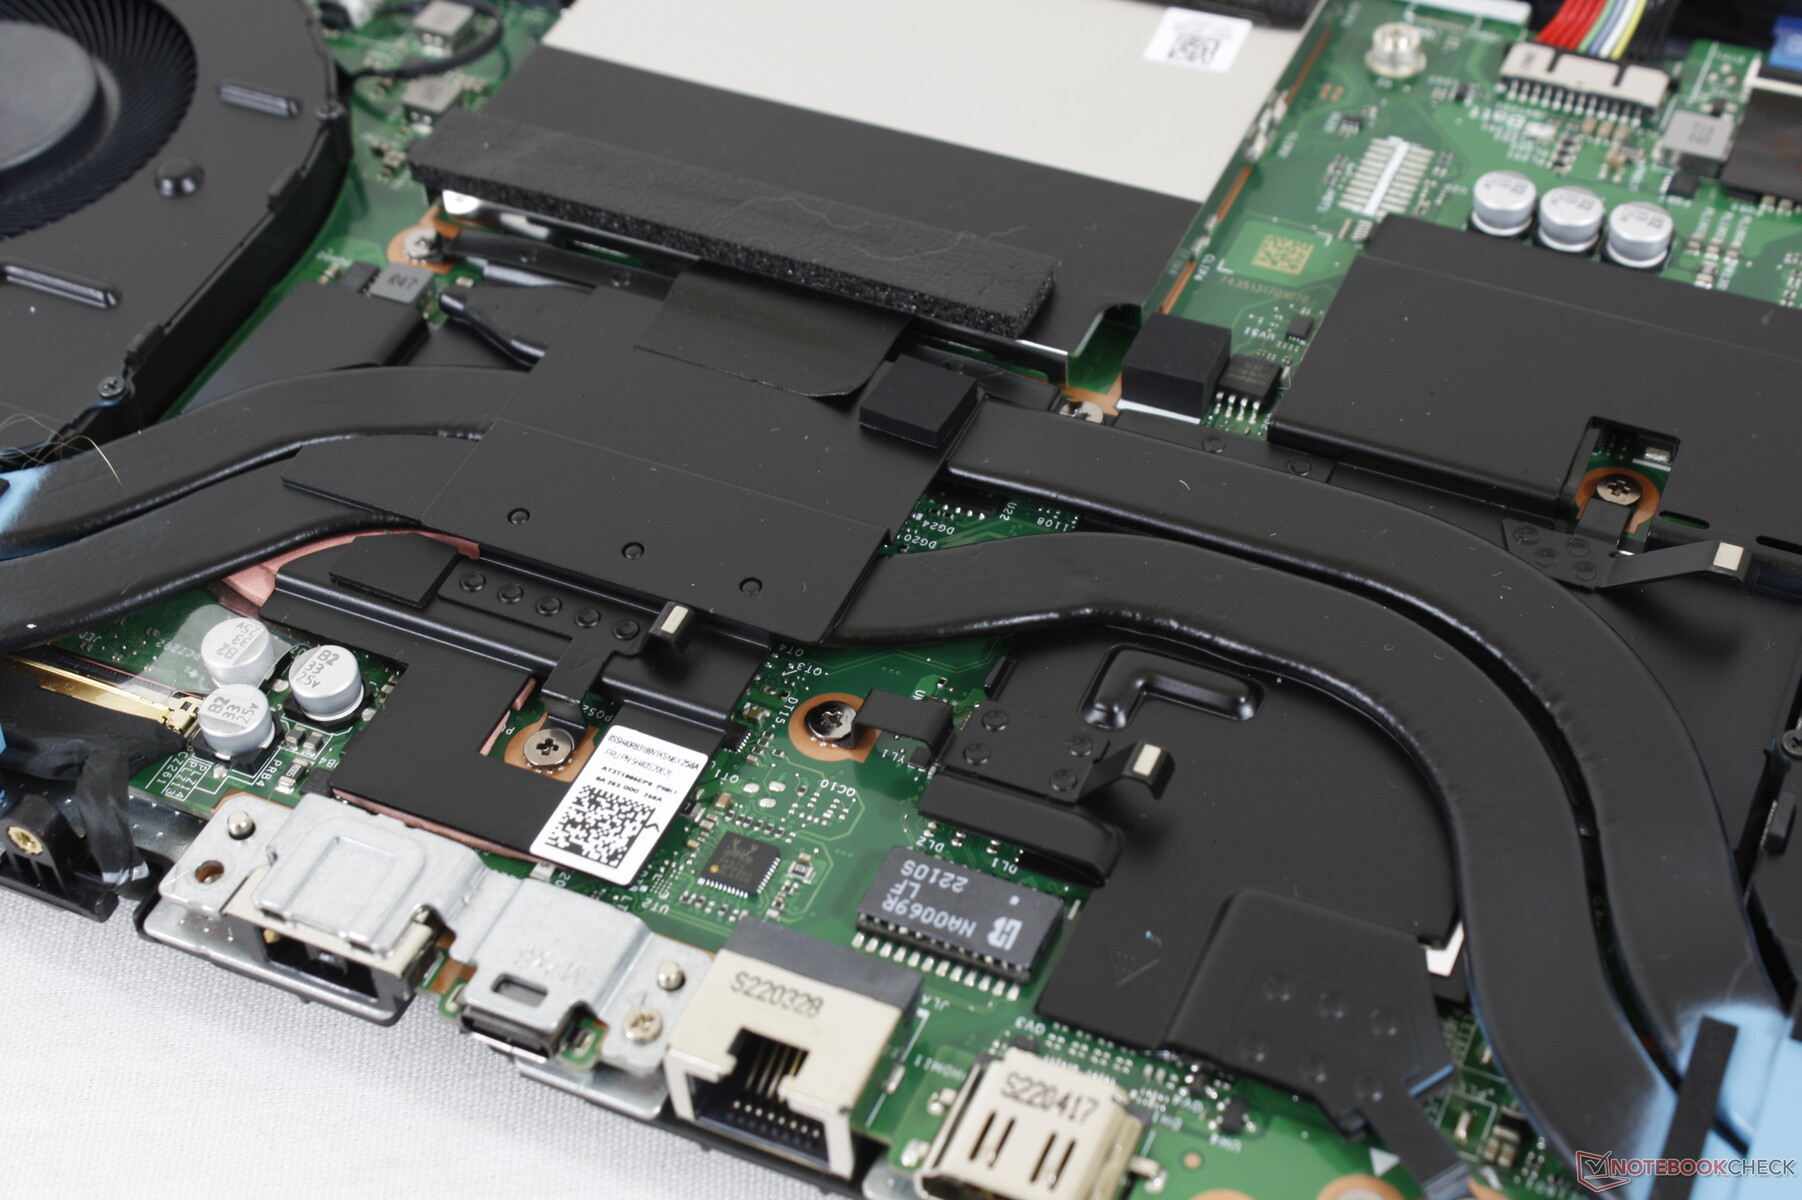
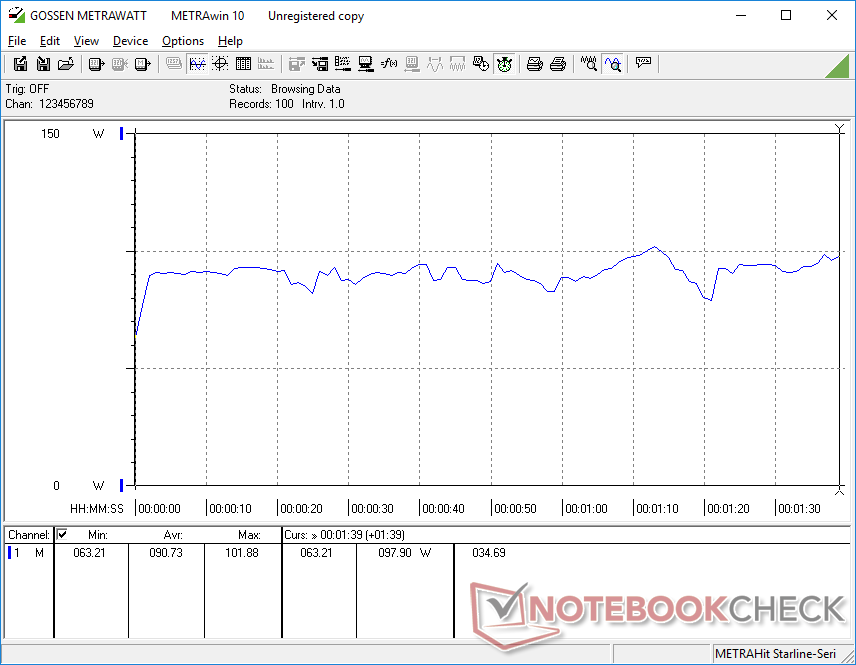
Massenspeicher — Bis zu zwei PCIe4-x4-SSD
Obwohl der Laptop bis zu zwei M.2-PCIe4-x4-NVMe-SSDs unterstützt, ist die 256-GB-PCIe4-x4-SSD Lenovo AM630 in unserem Testgerät relativ zu anderen PCIe4-x4-SSDs recht langsam. Samsungs PM9A1 erreicht beispielsweise bis zu 7.000 MB/s, während unser IdeaPad nur ~3.000 MB/s erreicht. Außerdem fällt die Leistung der SSD in unserem Testgerät während der DiskSpd-Schleife auf den 2.000-MB/s-Bereich, wie das Diagramm unten zeigt. Dass das Laufwerk nicht dazu in der Lage ist, die maximalen Transferraten dauerhaft aufrechtzuerhalten, ist bei einem Gaming-Laptop jedoch kein besonders großes Problem.

| Drive Performance Rating - Percent | |
| Lenovo IdeaPad Gaming 3 15ARH7 | |
| Asus TUF Dash F15 FX517ZR | |
| Gigabyte A5 K1 | |
| Dell G15 5510 | |
| Lenovo Legion 5 15ACH6A-82NW0010GE | |
| Lenovo IdeaPad Gaming 3i 15IMH05 | |
* ... kleinere Werte sind besser
Laufwerksdrosseln: DiskSpd-Leseschleife, Warteschlangentiefe 8
Grafikkarte
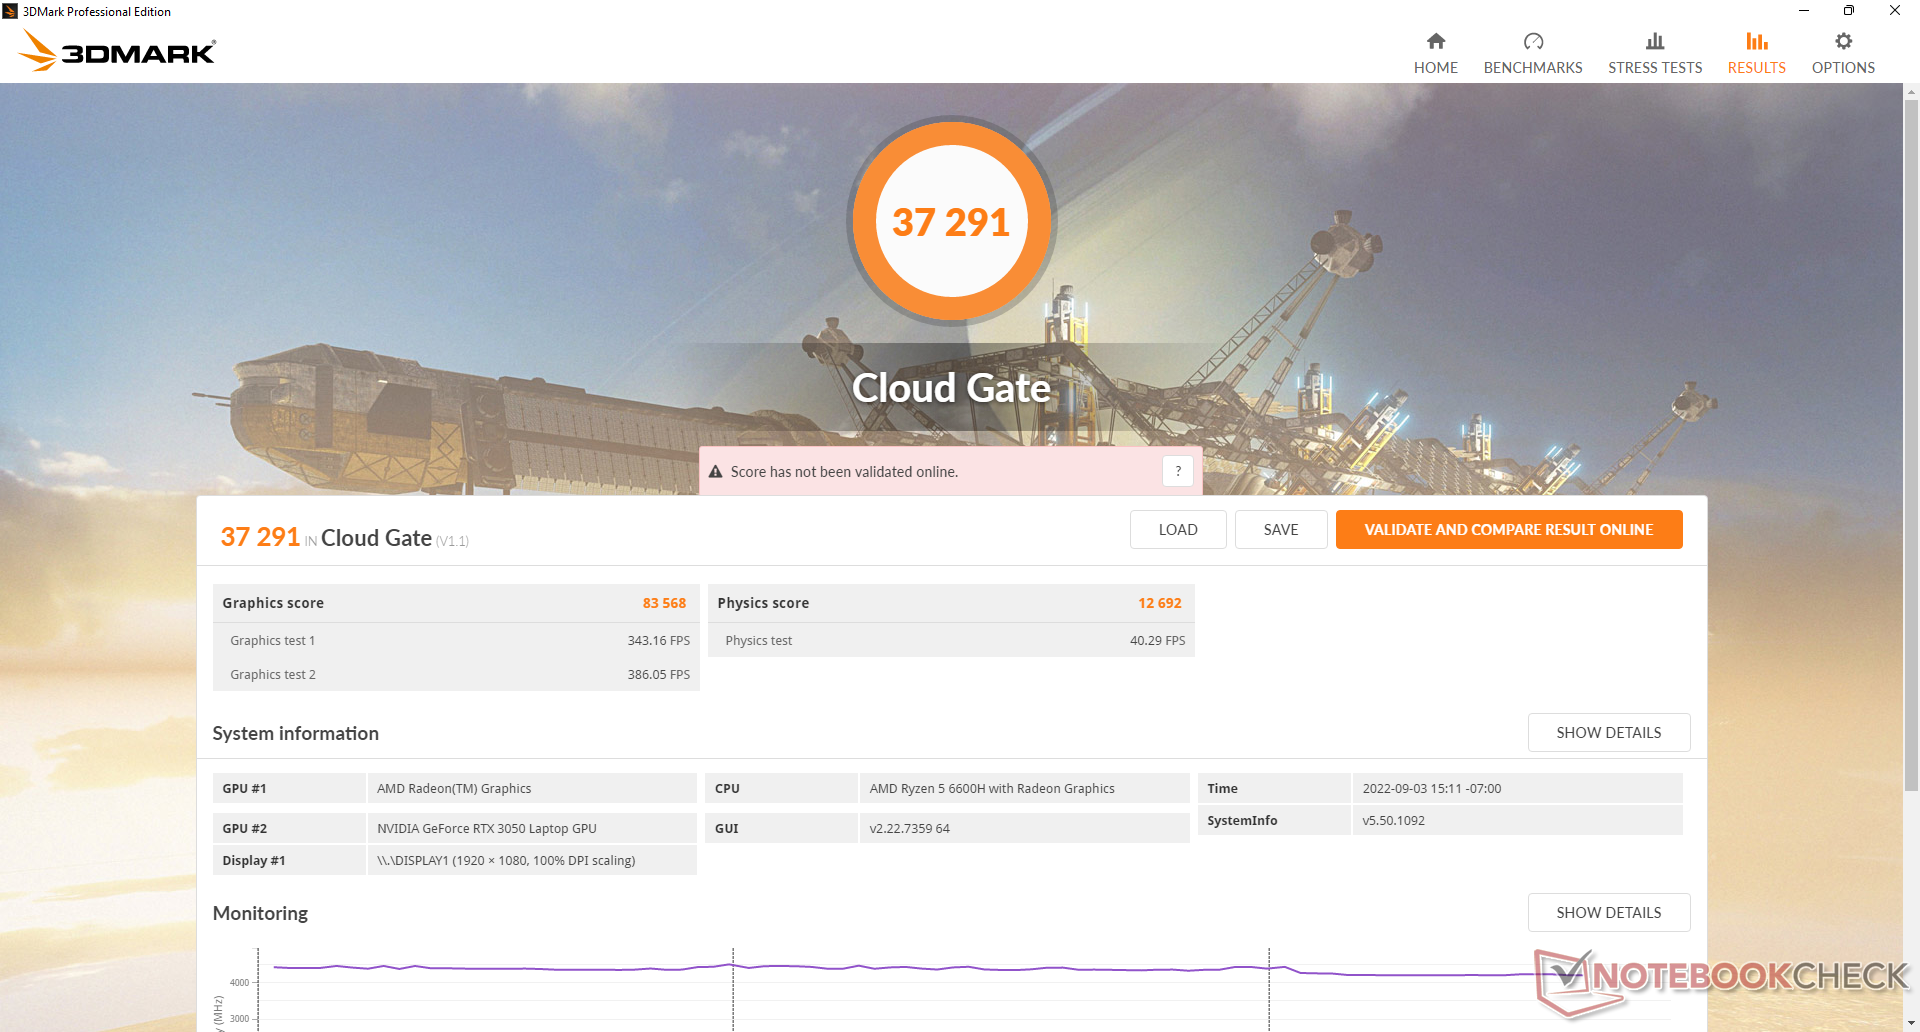
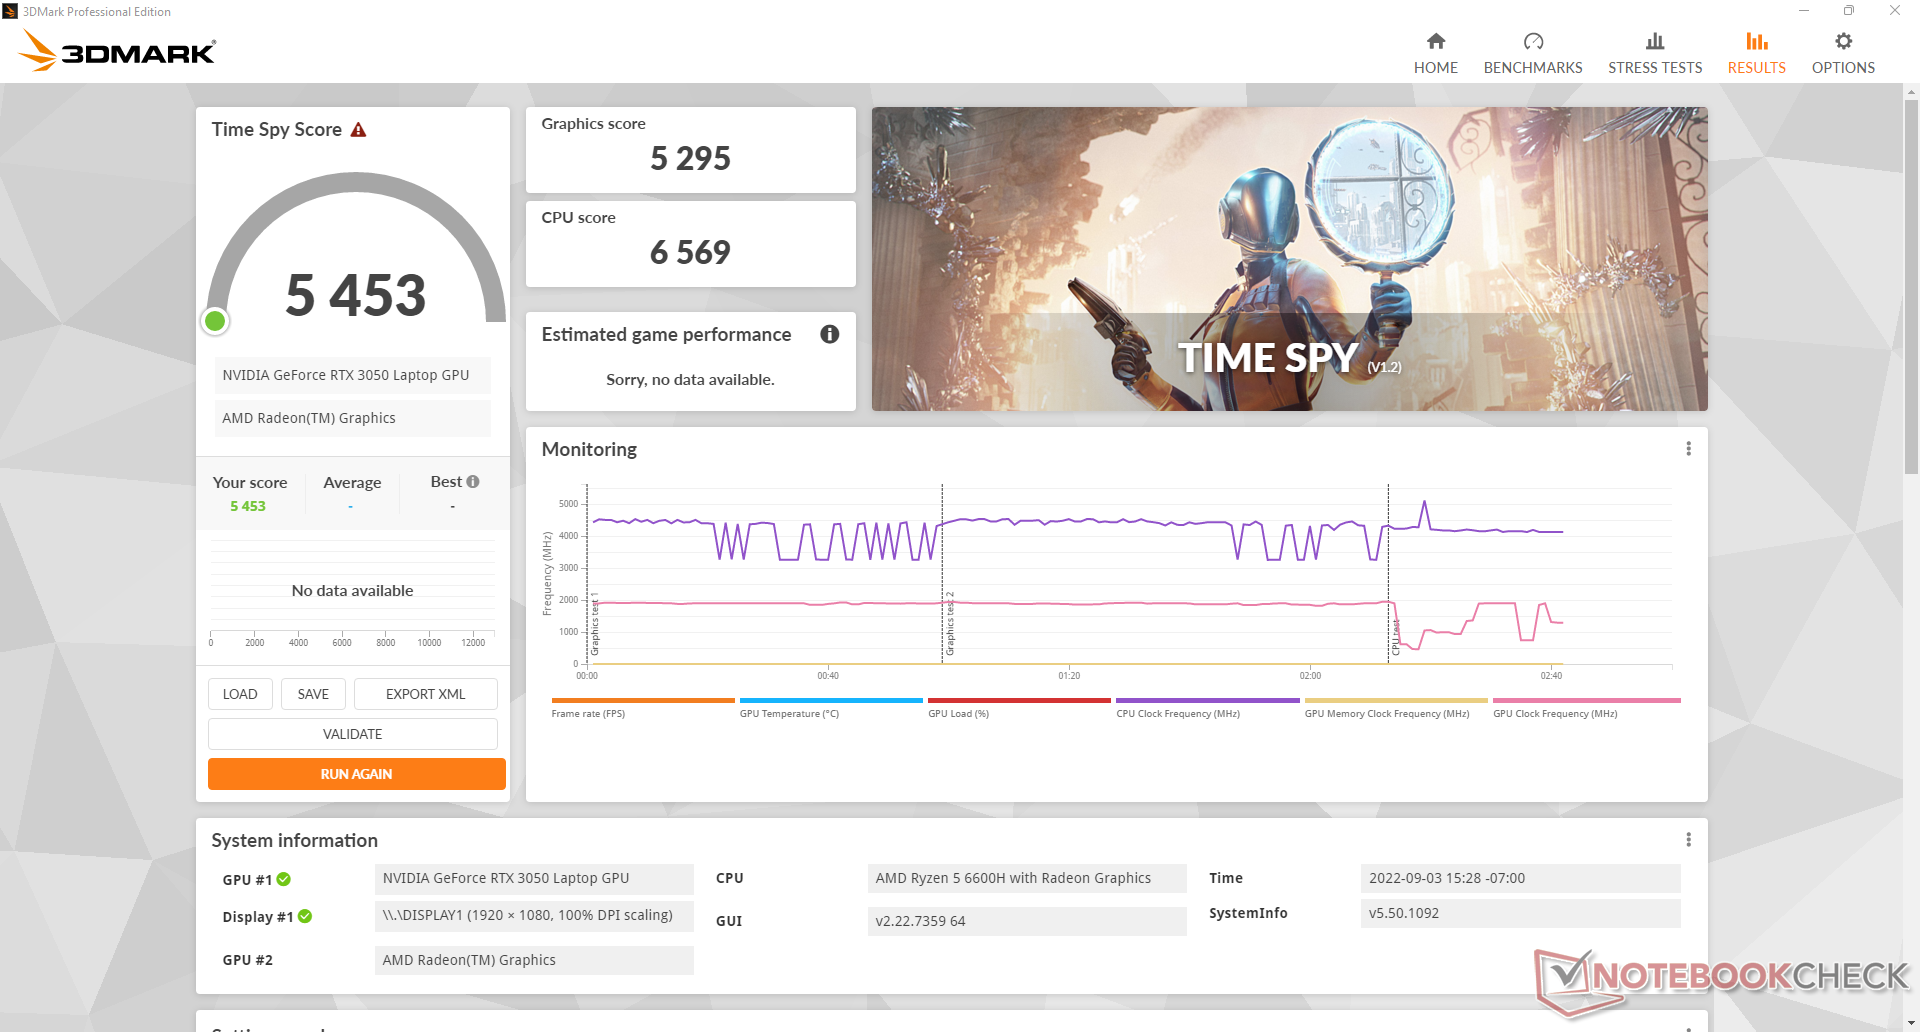
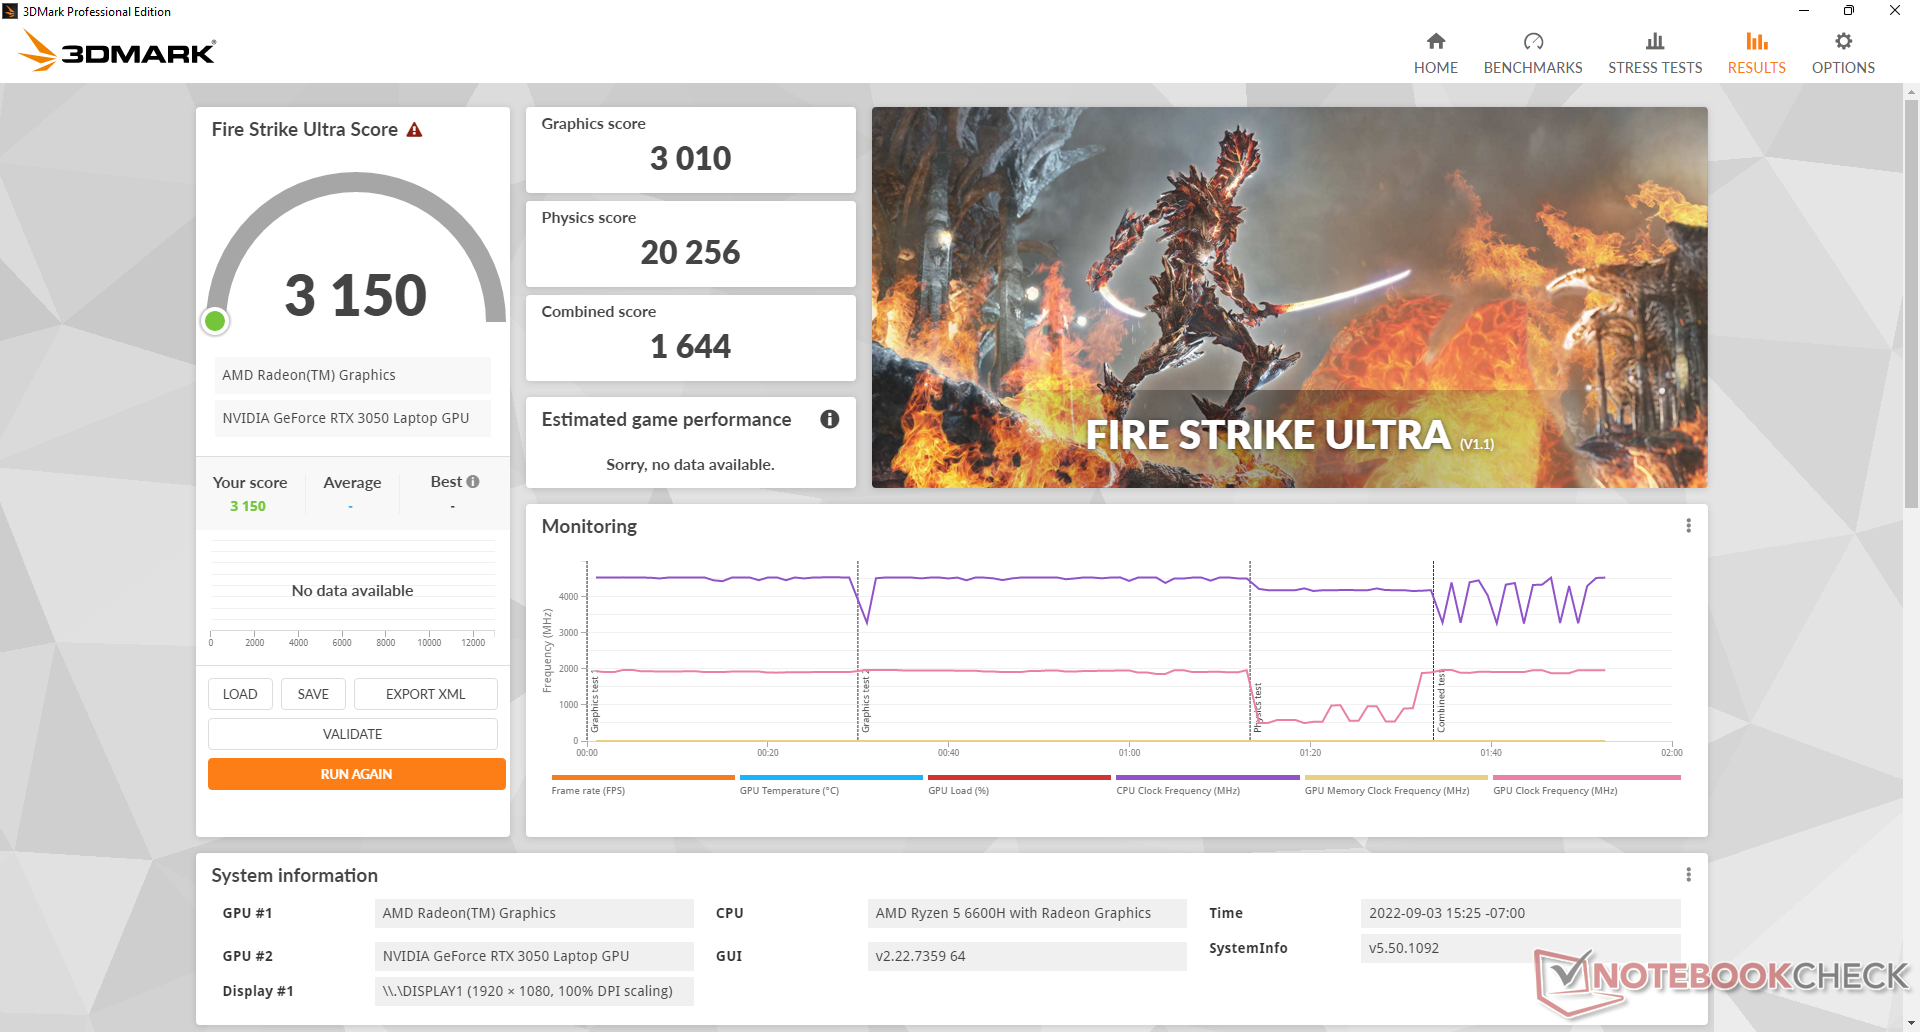
Die Grafikleistung liegt ungefähr 15 % über der eines durchschnittlichen Laptops mit der GeForce RTX 3050 aus unserer Datenbank. Basierend auf unserer Erfahrung mit anderen RTX-3050-Ti-Laptops kann man bei Modellen mit der RTX 3050 Ti mit einer um weitere 10 % erhöhten Grafikleistung rechnen. Eine RTX-3060-Option findet man nur innerhalb der teureren Legion-Reihe.
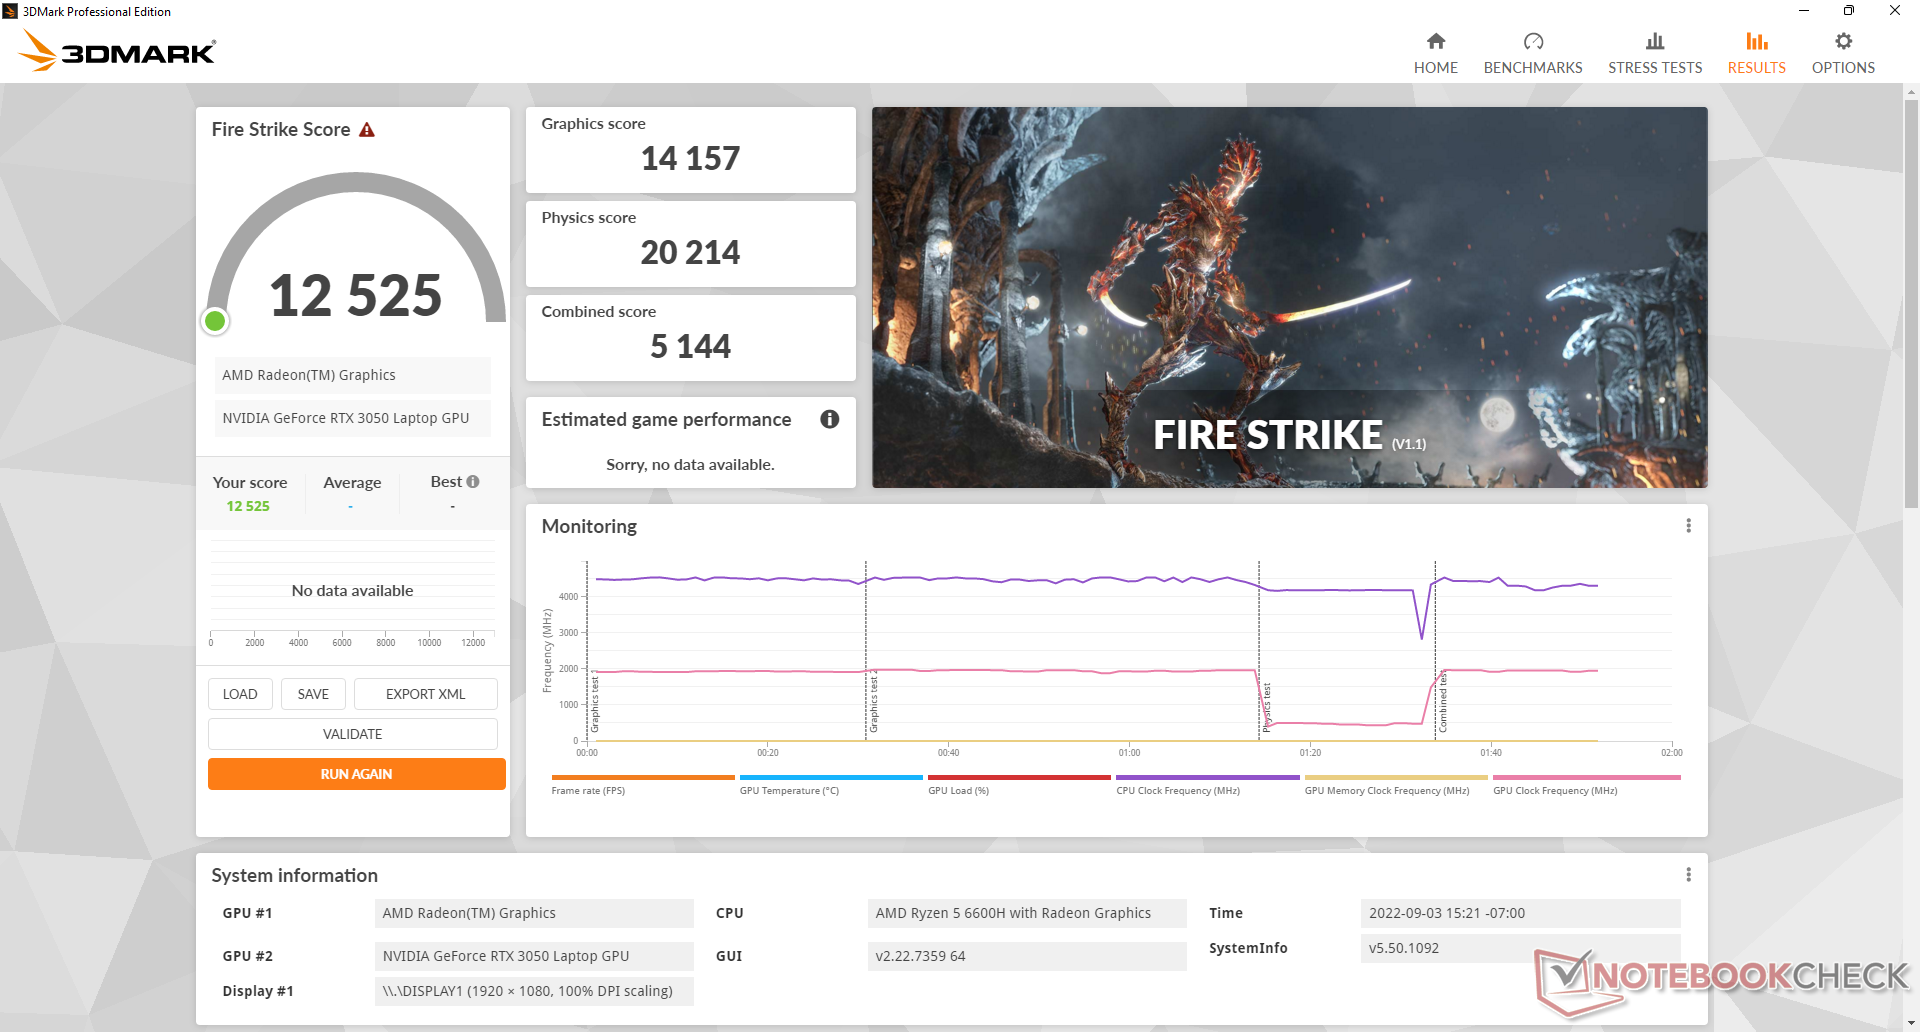
Die Leistung ist im ausbalancierten Leistungsprofil reduziert. In diesem Fall ist die Grafikleistung in einem Fire-Strike-Durchlauf um 8 % reduziert (14.157 vs. 12.978 Punkte), während die CPU-Leistung ungefähr gleich bleibt.
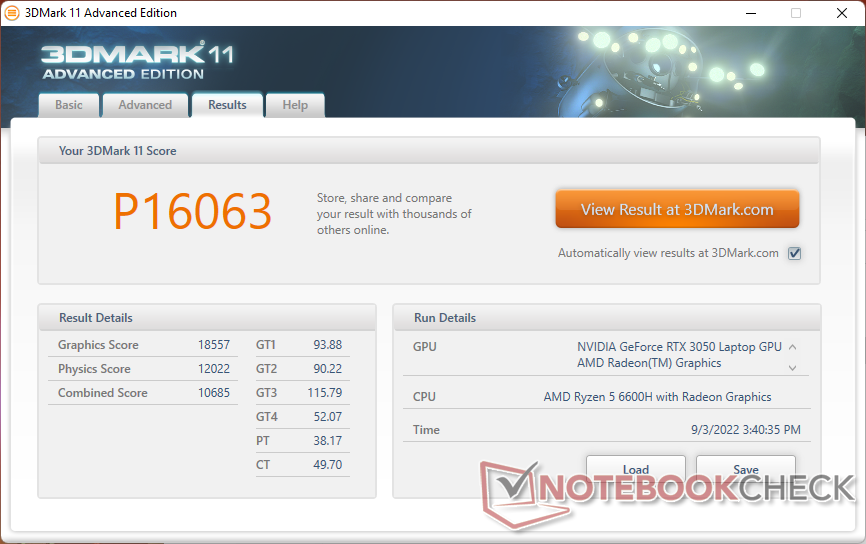

| 3DMark 11 Performance | 16063 Punkte | |
| 3DMark Cloud Gate Standard Score | 37291 Punkte | |
| 3DMark Fire Strike Score | 12525 Punkte | |
| 3DMark Time Spy Score | 5453 Punkte | |
Hilfe | ||
Witcher 3 FPS-Diagramm
| min. | mittel | hoch | max. | |
|---|---|---|---|---|
| GTA V (2015) | 144 | 133.3 | 103.5 | 60.3 |
| The Witcher 3 (2015) | 213.9 | 167.7 | 105.1 | 55.8 |
| Dota 2 Reborn (2015) | 117.2 | 106.4 | 100.6 | 95.2 |
| Final Fantasy XV Benchmark (2018) | 116.4 | 73.6 | 53.5 | |
| X-Plane 11.11 (2018) | 84.4 | 77.1 | 63.6 | |
| Strange Brigade (2018) | 248 | 134.7 | 109.1 | 95.1 |
| Cyberpunk 2077 1.6 (2022) | 72.9 | 62.4 | 45.5 | 36.5 |
Emissionen — Fast 50 dB(A) im Gaming-Betrieb
Geräuschemissionen
Im Leerlauf produzieren die Lüfter im Hochleistungsmodus minimal 23,8 und maximal 27,3 dB(A). Daher raten wir vom Hochleistungsmodus für einfaches Surfen und Videostreaming ab. In den meisten alltäglichen Anwendungsfällen kann man mit einem Geräuschpegel von 31,4 dB(A) und weniger rechnen.
Die Lüfter erzeugen im Gaming-Betrieb im Hochleistungsmodus mit bis zu 49,3 dB(A) ein ähnliches Geräuschniveau wie die meisten anderen Gaming-Laptops einschließlich Lenovos eigenem Legion 5 15. Im ausbalancierten Leistungsprofil fällt das Geräuschniveau auf deutlich niedrigere 43,9 dB(A), das geht jedoch wie oben erwähnt auf Kosten der Grafikleistung. Manche Nutzer nehmen die geringere Leistung jedoch wohl gerne in Kauf, um das Betriebsgeräusch zu begrenzen.
Lautstärkediagramm
| Idle |
| 23.8 / 23.8 / 27.2 dB(A) |
| Last |
| 34.8 / 49.4 dB(A) |
 | ||
30 dB leise 40 dB(A) deutlich hörbar 50 dB(A) störend |
||
min: | ||
| Lenovo IdeaPad Gaming 3 15ARH7 GeForce RTX 3050 4GB Laptop GPU, R5 6600H, Lenovo UMIS AM630 RPJTJ256MGE1QDY | Lenovo IdeaPad Gaming 3i 15IMH05 GeForce GTX 1650 Mobile, i5-10300H, SK hynix BC511 HFM512GDHTNI-87A0B | Lenovo Legion 5 15ACH6A-82NW0010GE Radeon RX 6600M, R5 5600H, Micron 2210 MTFDHBA512QFD | Gigabyte A5 K1 GeForce RTX 3060 Laptop GPU, R5 5600H, ESR512GTLG-E6GBTNB4 | Asus TUF Dash F15 FX517ZR GeForce RTX 3070 Laptop GPU, i7-12650H, Samsung PM991a MZVLQ1T0HBLB | Dell G15 5510 GeForce RTX 3050 4GB Laptop GPU, i5-10500H, SK Hynix BC711 HFM512GD3HX015N | |
|---|---|---|---|---|---|---|
| Geräuschentwicklung | -20% | -16% | -22% | -15% | -10% | |
| aus / Umgebung * (dB) | 23.3 | 30.7 -32% | 25 -7% | 26 -12% | 26 -12% | 26 -12% |
| Idle min * (dB) | 23.8 | 30.7 -29% | 25 -5% | 26 -9% | 26 -9% | 26 -9% |
| Idle avg * (dB) | 23.8 | 30.7 -29% | 25 -5% | 29 -22% | 32 -34% | 27 -13% |
| Idle max * (dB) | 27.2 | 30.7 -13% | 34.5 -27% | 32 -18% | 33 -21% | 33 -21% |
| Last avg * (dB) | 34.8 | 49.7 -43% | 51.1 -47% | 57 -64% | 48 -38% | 45 -29% |
| Witcher 3 ultra * (dB) | 49.3 | 47 5% | 56 -14% | 47 5% | 45 9% | |
| Last max * (dB) | 49.4 | 50.3 -2% | 51.3 -4% | 58 -17% | 49 1% | 47 5% |
* ... kleinere Werte sind besser
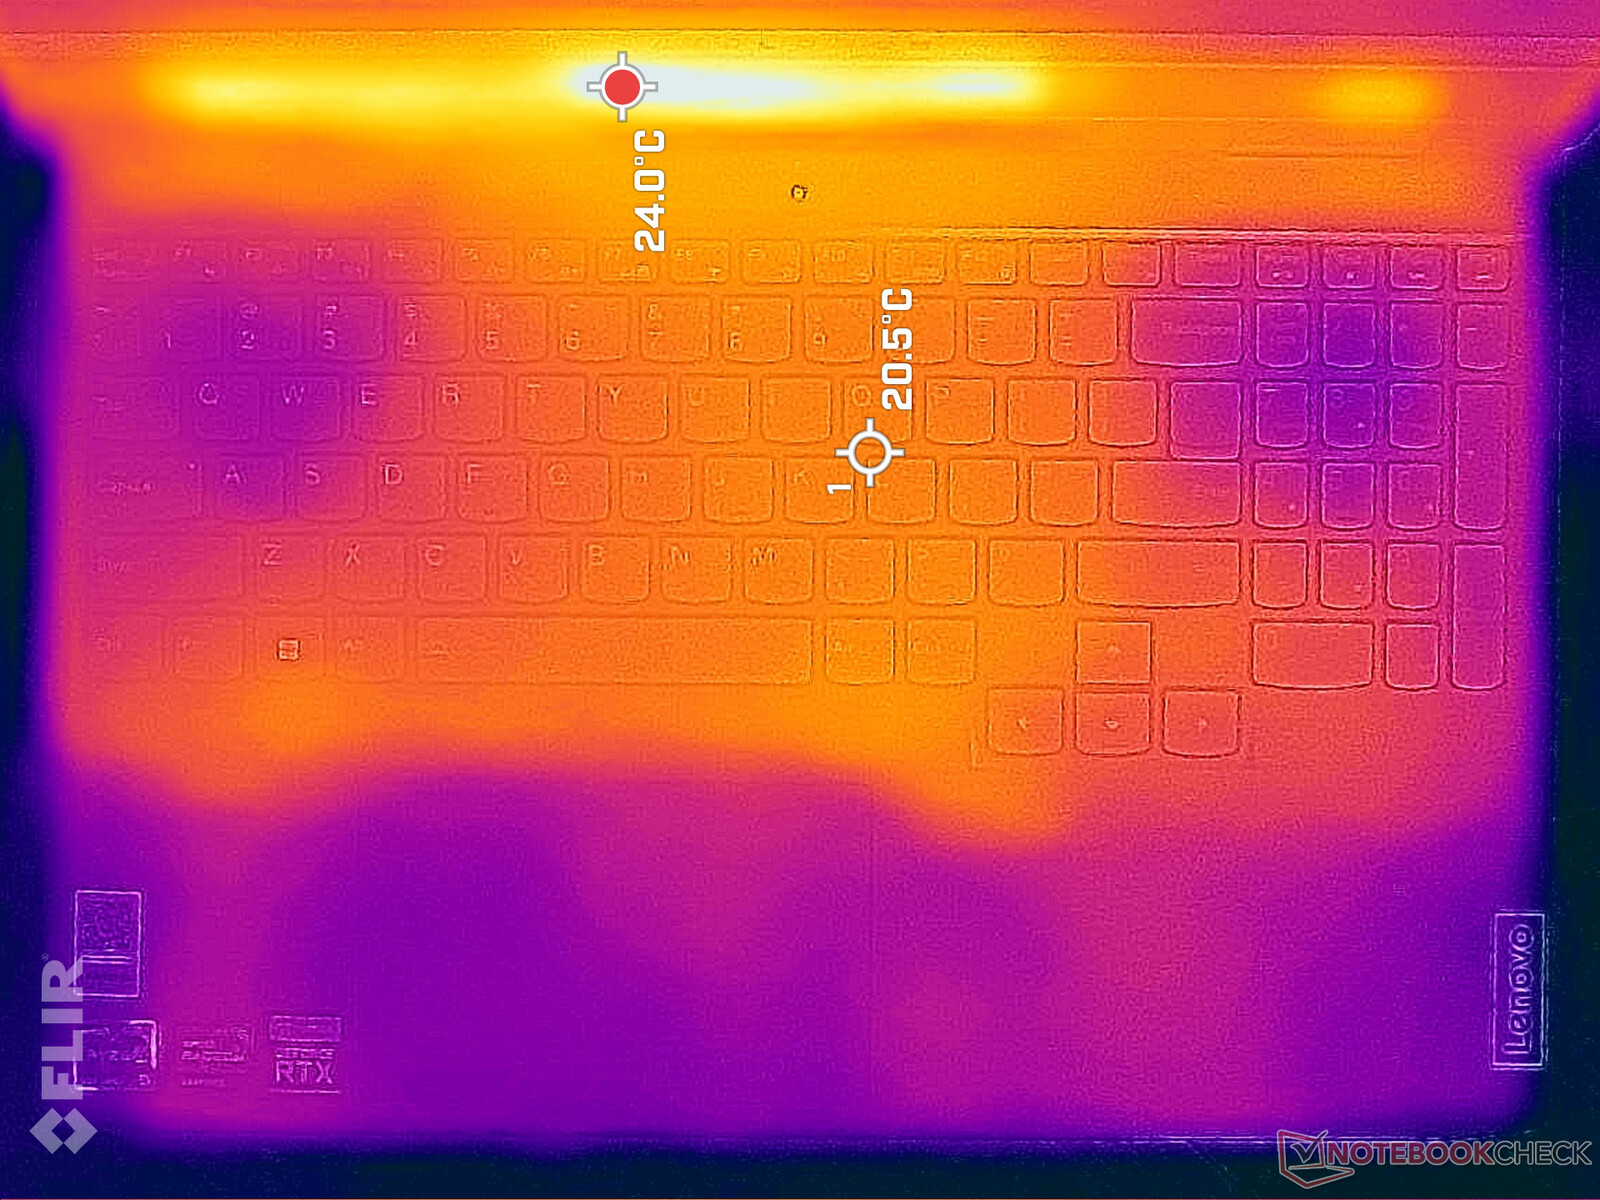
Temperatur
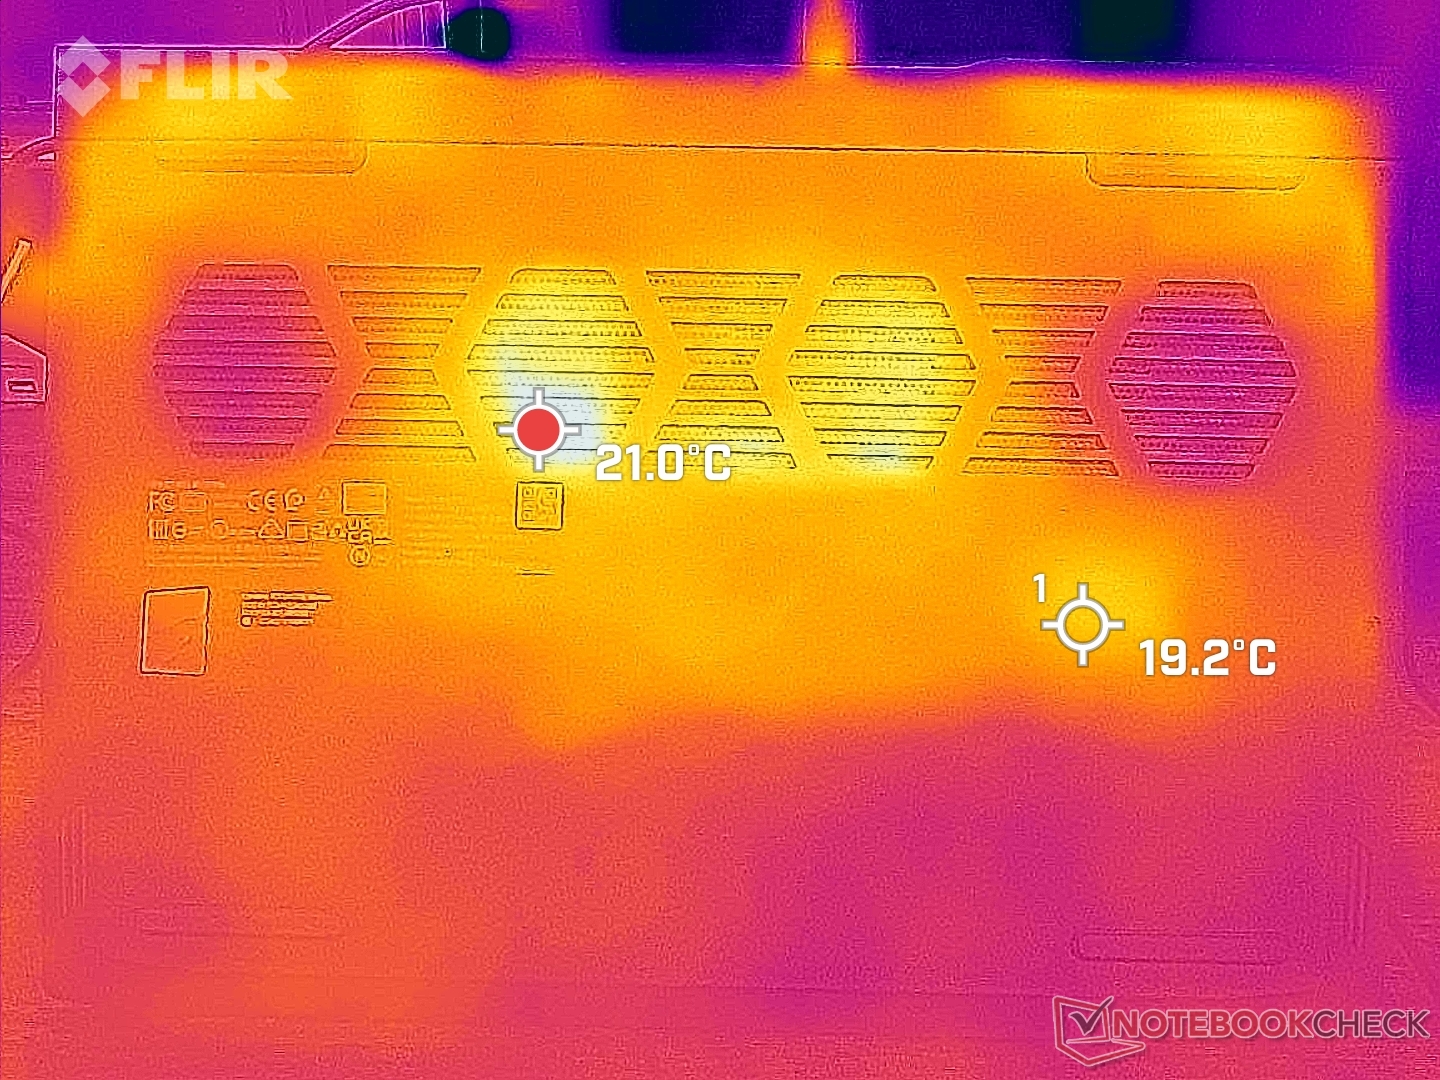
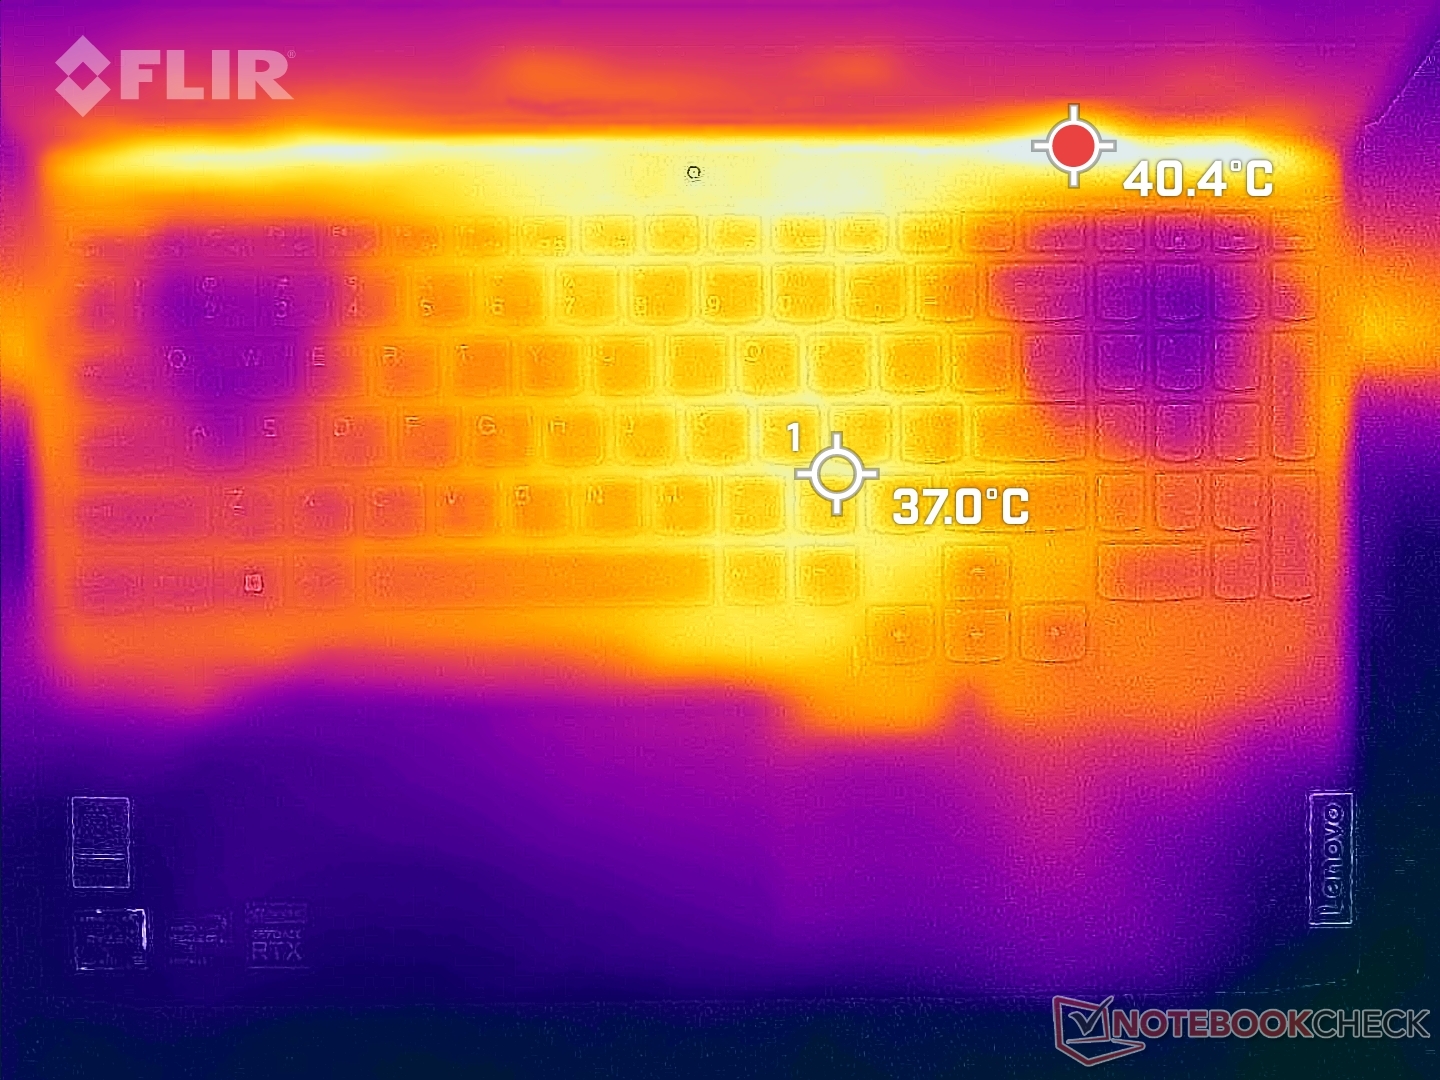
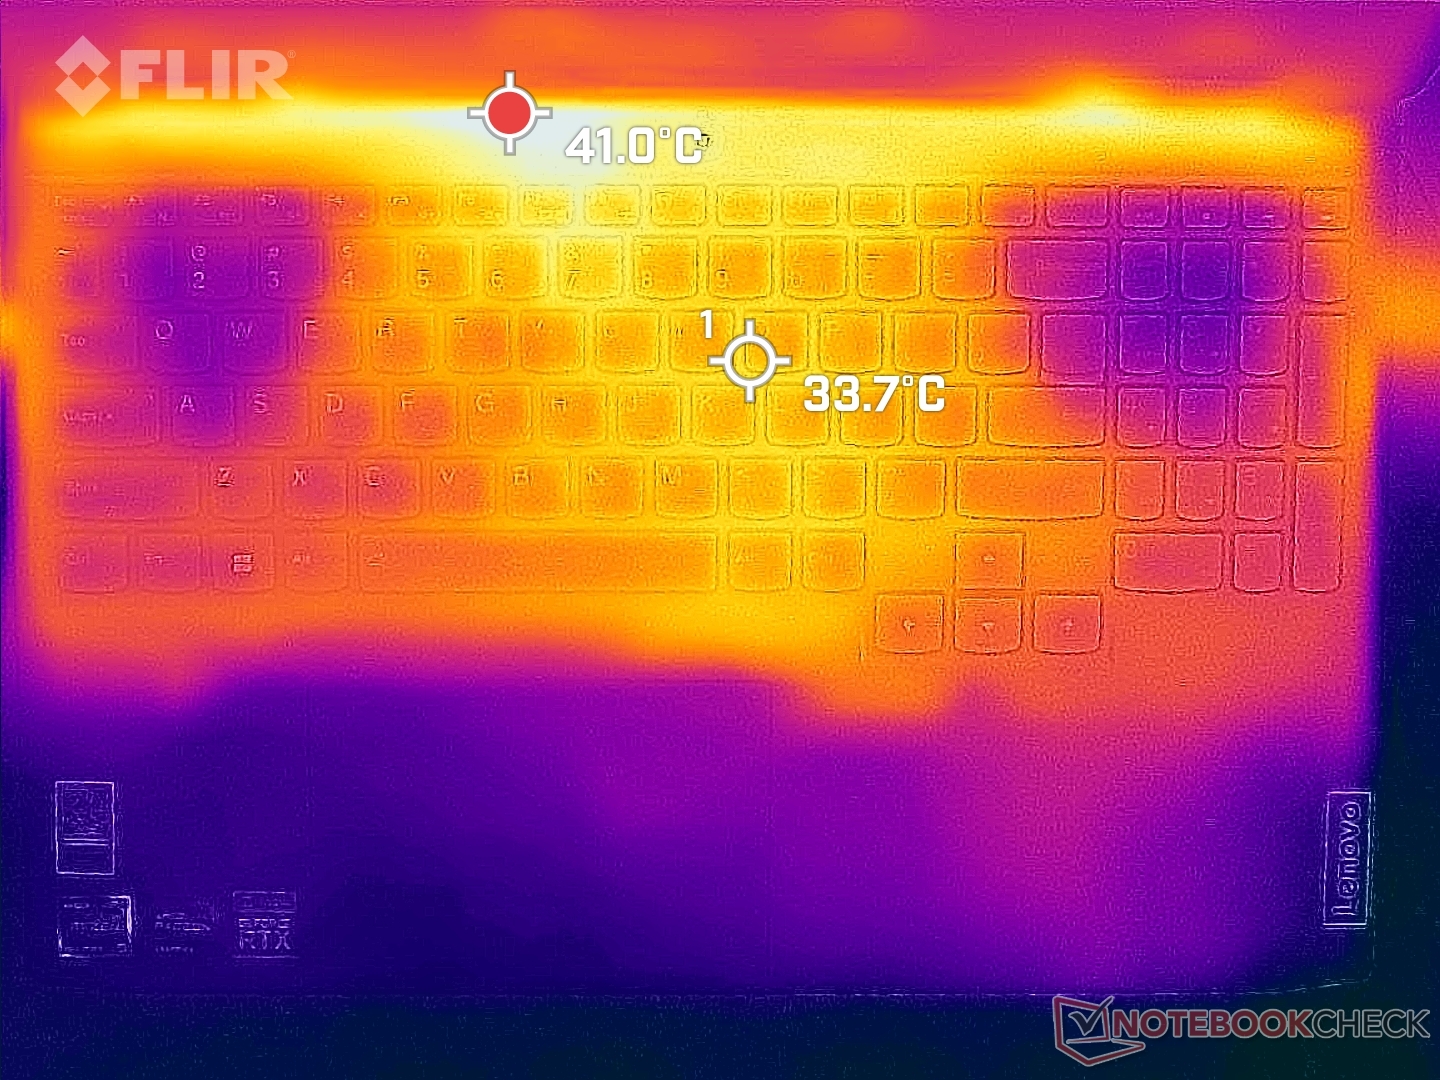
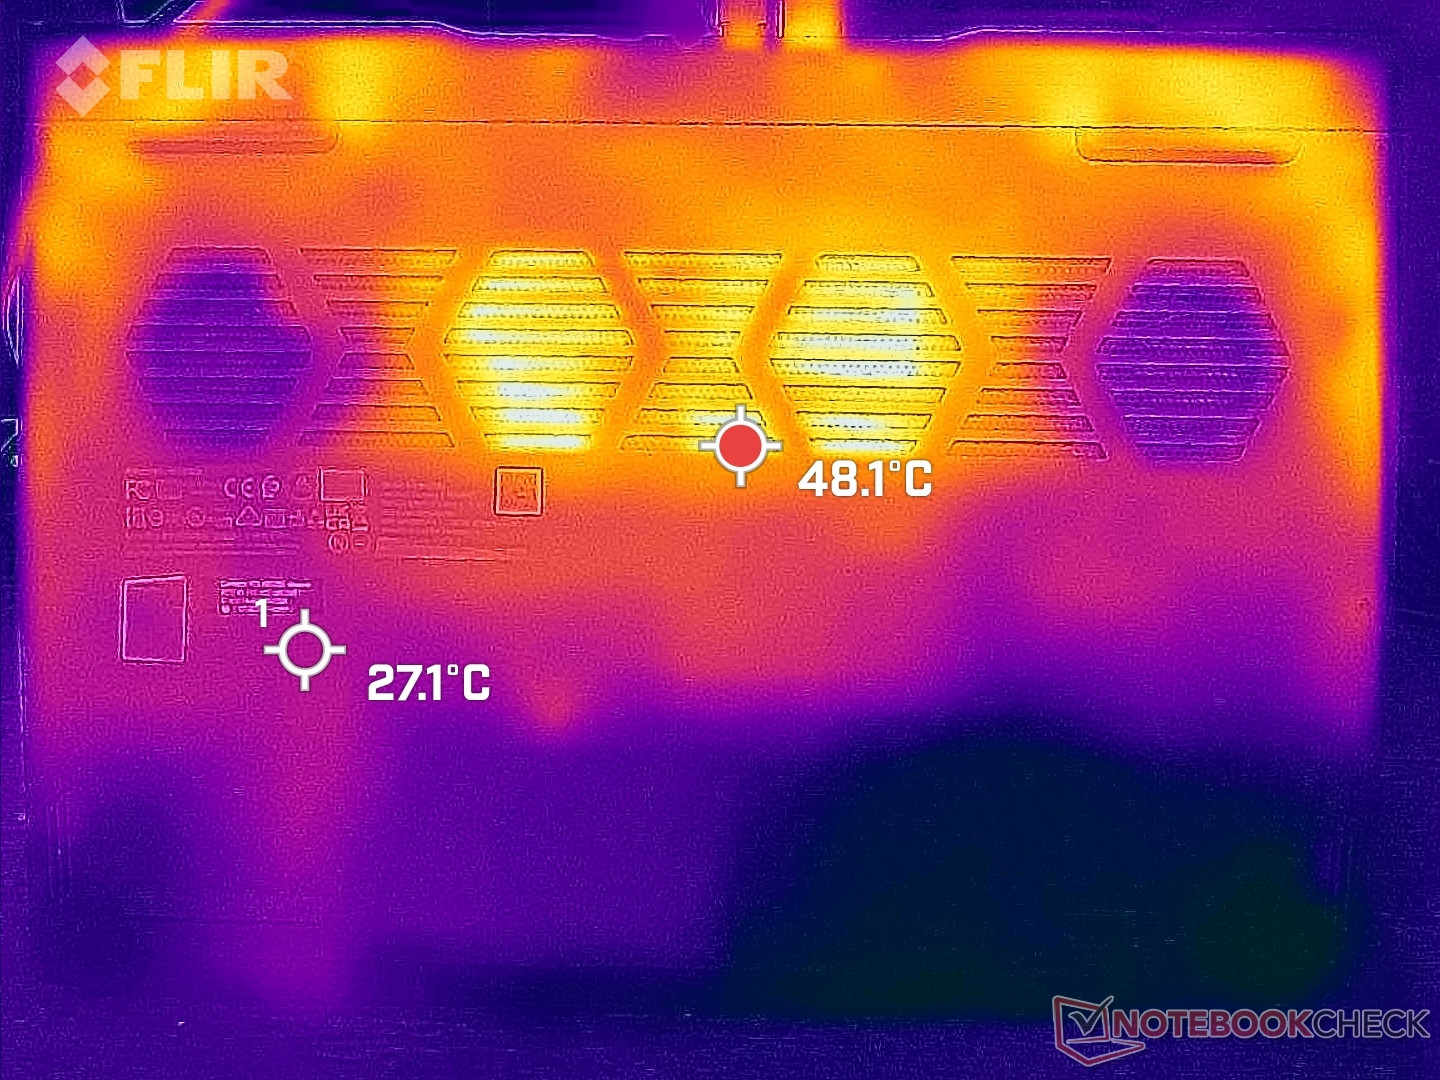
Die Oberflächen werden in der Nähe der Tastaturmitte am wärmsten und bleiben im Bereich der WASD- und Ziffernblocktasten deutlich Kühler, da zwischen diesen Tasten Luft angesaugt wird, wie die Wärmebilder unten zeigen. Dabei handelt es sich um eine Verbesserung gegenüber des älteren IdeaPad Gaming 3i 15IMH05 und Dell G15 5510, bei denen die WASD-Tasten sich stärker erwärmen. Im Gaming-Betrieb erreicht die wärmste Stelle der Tastatur 43 °C und damit trotzdem ein ähnliches Niveau wie bei den zuvor genannten IdeaPad- und Dell-G15-Modellen.
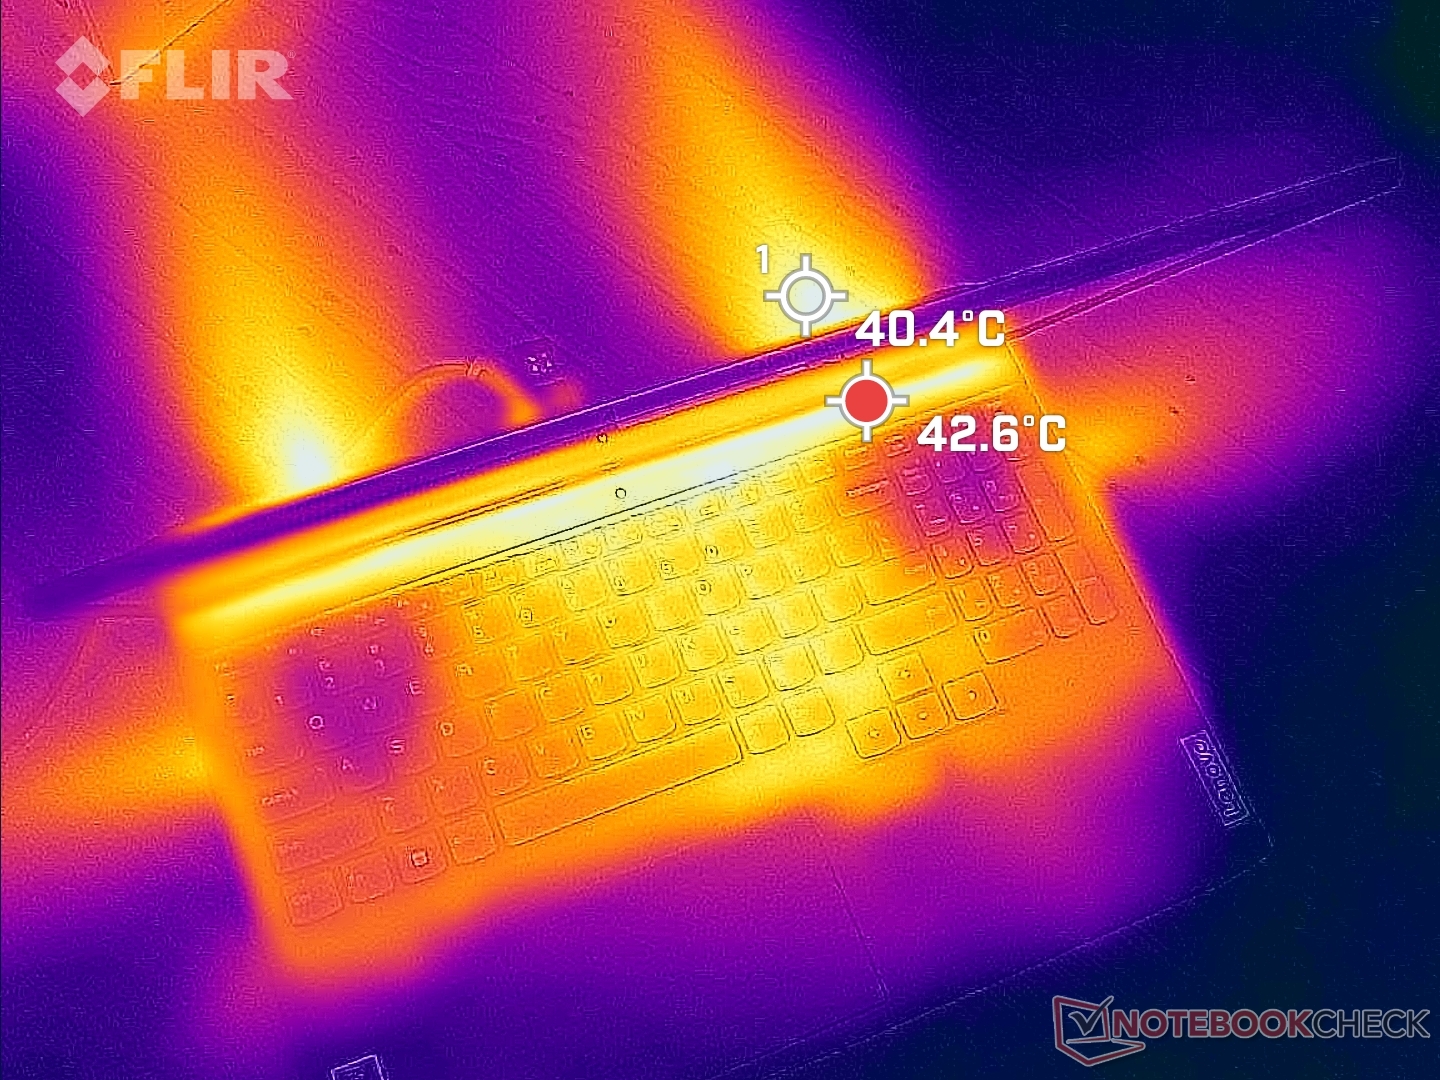
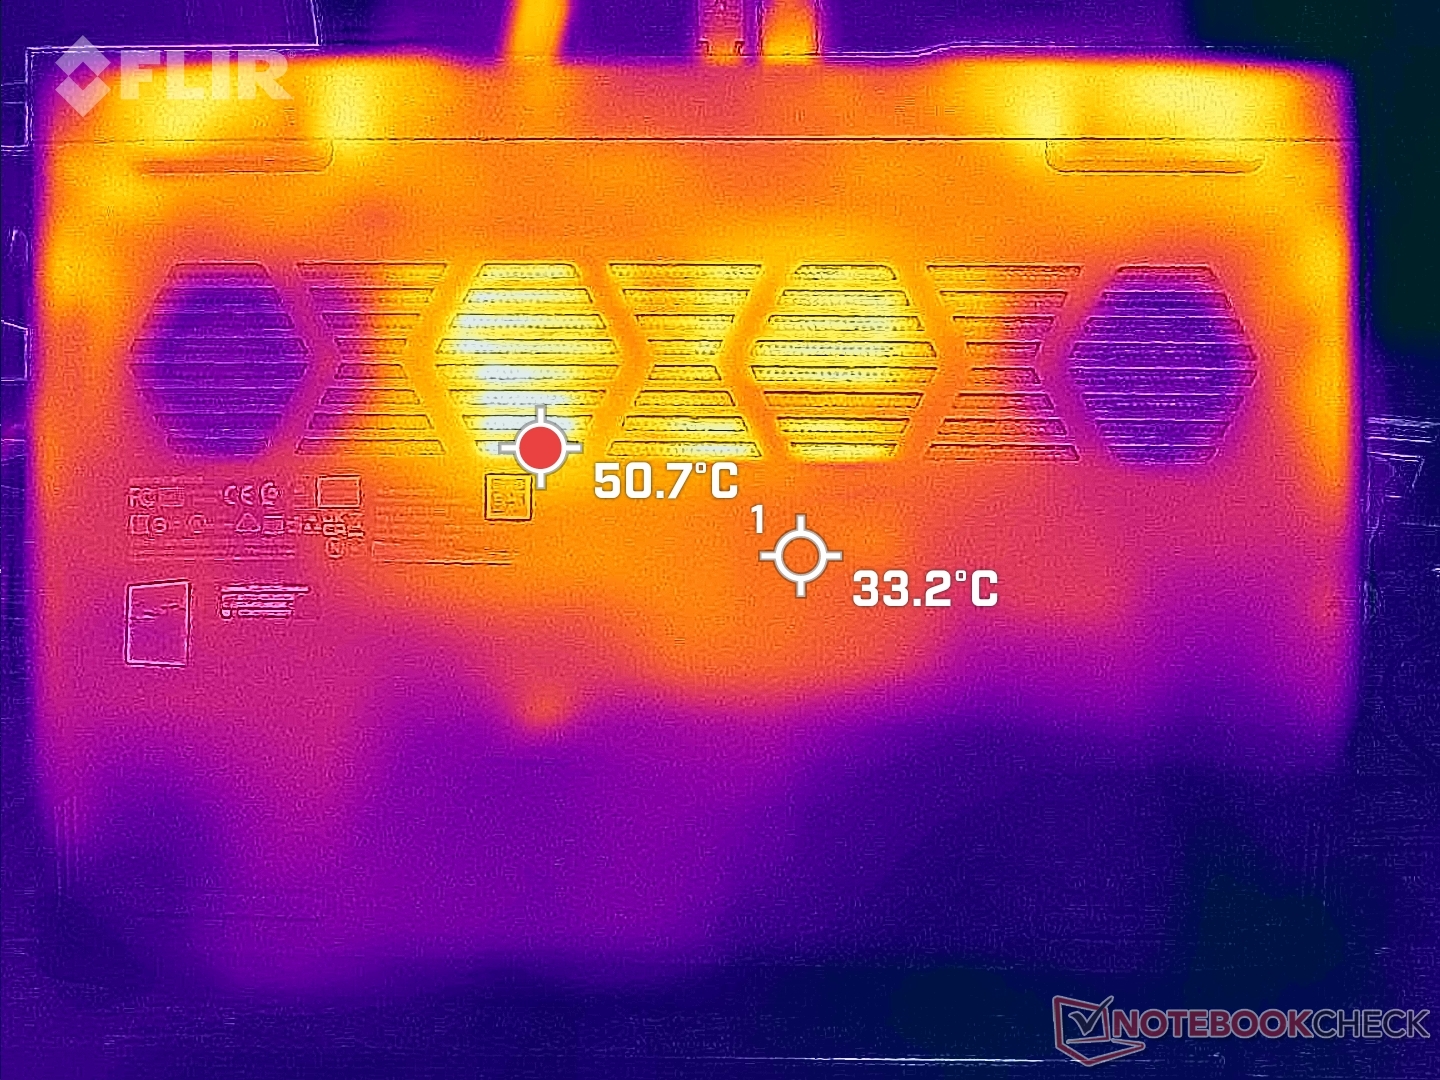
(-) Die maximale Temperatur auf der Oberseite ist 47.6 °C. Im Vergleich liegt der Klassendurchschnitt bei 40.4 °C (von 21.2 bis 68.8 °C für die Klasse Gaming).
(-) Auf der Unterseite messen wir eine maximalen Wert von 46.6 °C (im Vergleich zum Durchschnitt von 43.2 °C).
(+) Ohne Last messen wir eine durchschnittliche Temperatur von 25.7 °C auf der Oberseite. Der Klassendurchschnitt erreicht 33.9 °C.
(±) Beim längeren Spielen von The Witcher 3 erhitzt sich das Gerät durchschnittlich auf 36.4 °C. Der Durchschnitt der Klasse ist derzeit 33.9 °C.
(+) Die Handballen und der Touchpad-Bereich erreichen maximal 34.2 °C und damit die typische Hauttemperatur und fühlen sich daher nicht heiß an.
(-) Die durchschnittliche Handballen-Temperatur anderer getesteter Geräte war 28.8 °C (-5.4 °C).
| Lenovo IdeaPad Gaming 3 15ARH7 AMD Ryzen 5 6600H, NVIDIA GeForce RTX 3050 4GB Laptop GPU | Lenovo IdeaPad Gaming 3i 15IMH05 Intel Core i5-10300H, NVIDIA GeForce GTX 1650 Mobile | Lenovo Legion 5 15ACH6A-82NW0010GE AMD Ryzen 5 5600H, AMD Radeon RX 6600M | Gigabyte A5 K1 AMD Ryzen 5 5600H, NVIDIA GeForce RTX 3060 Laptop GPU | Asus TUF Dash F15 FX517ZR Intel Core i7-12650H, NVIDIA GeForce RTX 3070 Laptop GPU | Dell G15 5510 Intel Core i5-10500H, NVIDIA GeForce RTX 3050 4GB Laptop GPU | |
|---|---|---|---|---|---|---|
| Hitze | 0% | -5% | -11% | -19% | -2% | |
| Last oben max * (°C) | 47.6 | 43 10% | 39.9 16% | 50 -5% | 52 -9% | 52 -9% |
| Last unten max * (°C) | 46.6 | 50.6 -9% | 43.8 6% | 51 -9% | 52 -12% | 49 -5% |
| Idle oben max * (°C) | 27.2 | 27.2 -0% | 34.1 -25% | 30 -10% | 33 -21% | 26 4% |
| Idle unten max * (°C) | 27.2 | 27.5 -1% | 31.7 -17% | 33 -21% | 36 -32% | 26 4% |
* ... kleinere Werte sind besser
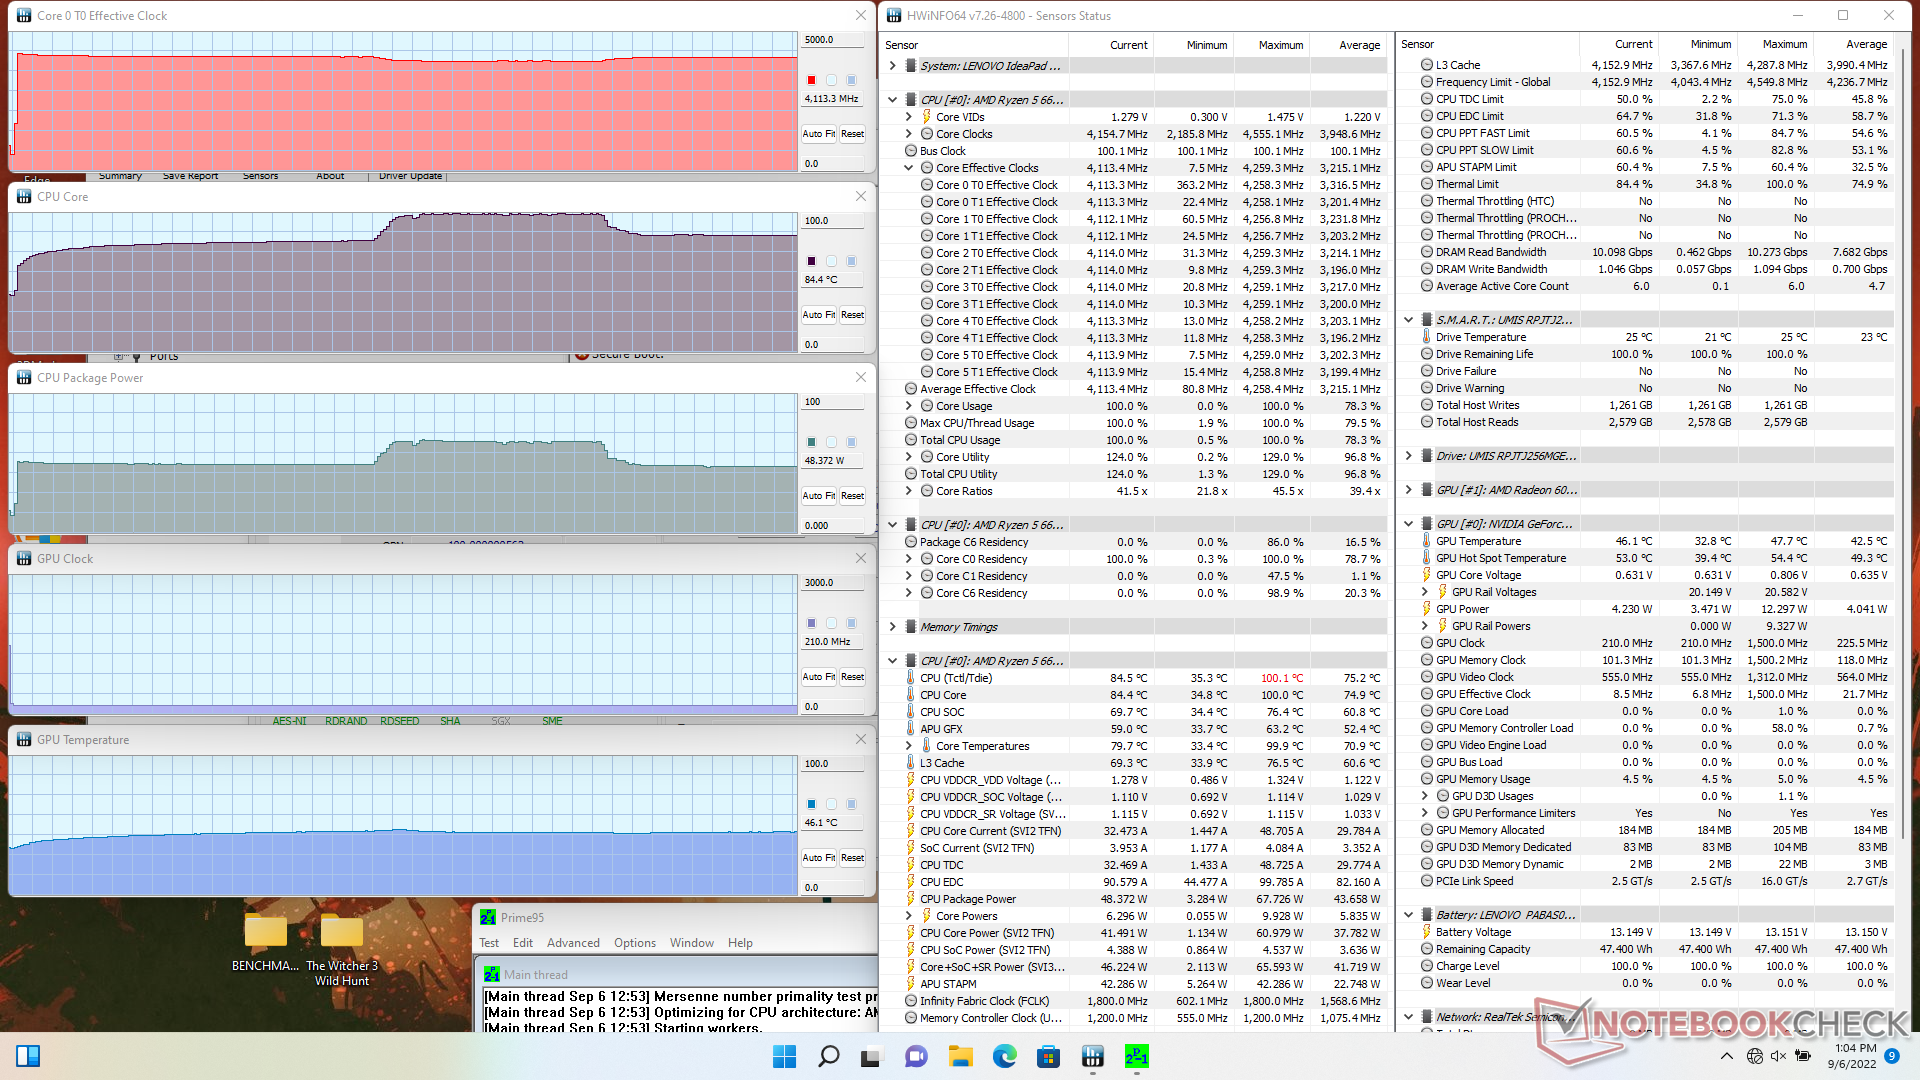
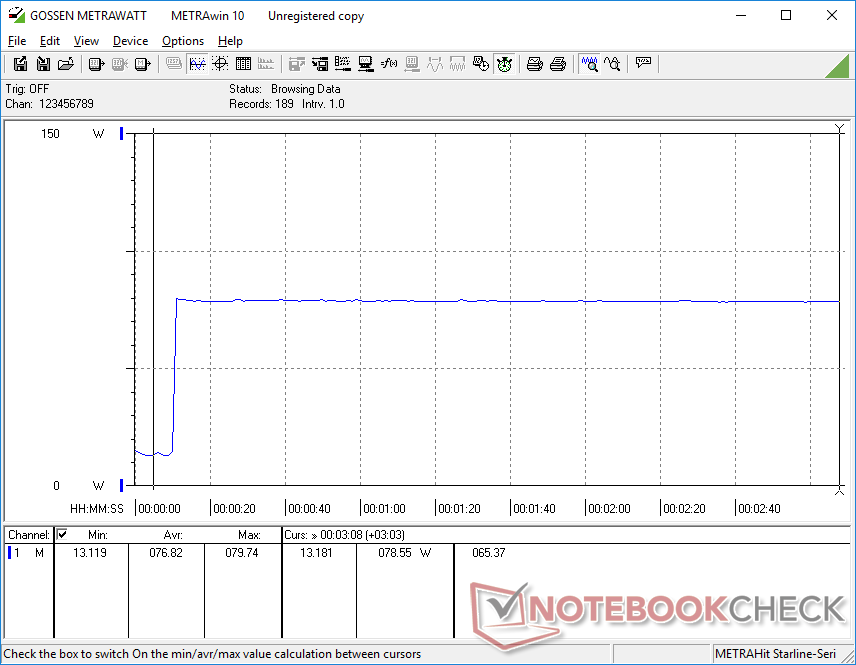
Stresstest
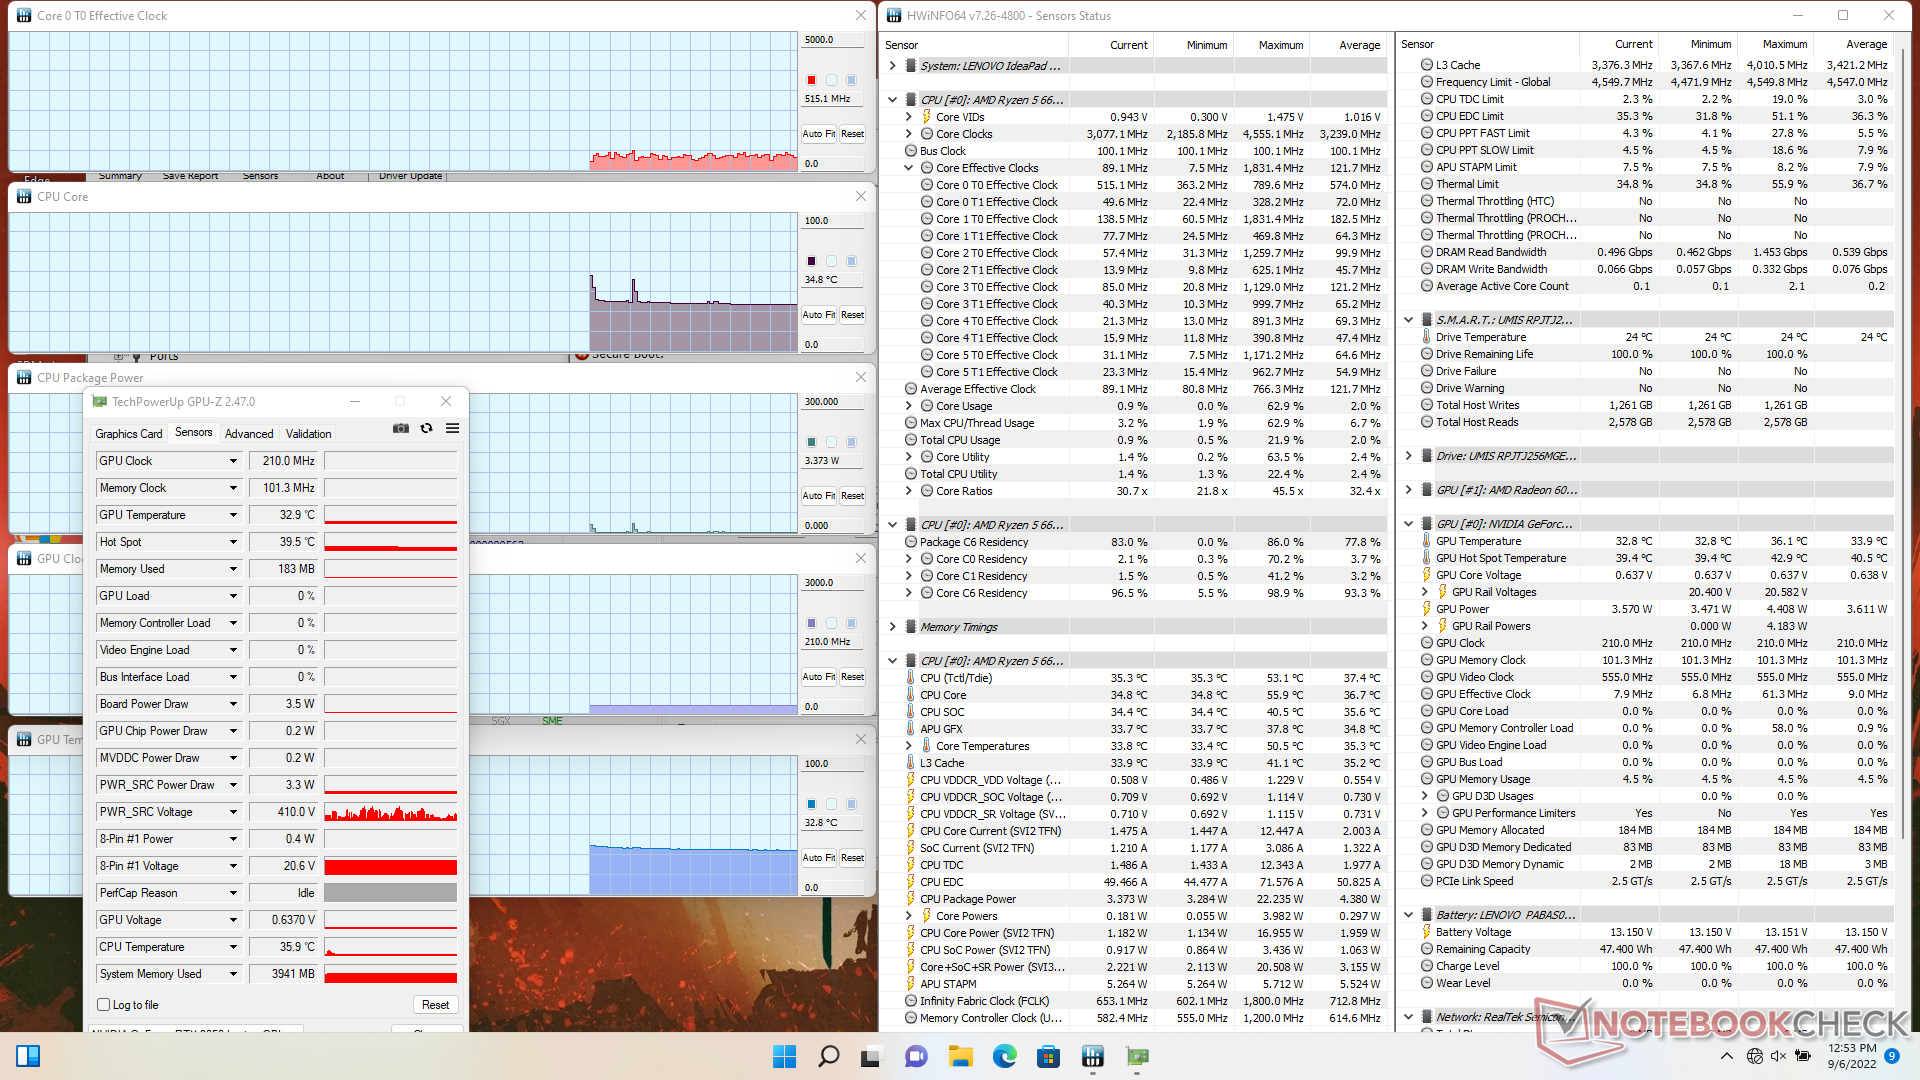
Beim Auslasten der CPU mithilfe von Prime95 springen die Taktfrequenz und Temperatur auf 4,3 GHz bzw. 70 °C bei einem Chipverbrauch von 51 W (Board Power Draw). Eigenartigerweise werden eine Temperatur von 100 °C und ein Chipverbrauch von 67 W erst nach einigen Minuten erreicht und fallen darauf wieder auf 48 W bzw. 84 °C, wie der Screenshot unten zeigt. Auch bei einer langfristigen Auslastung von 100 % drosselt der Prozessor hier nicht, was sich mit unseren Beobachtungen zum Cinebench-R15-xT-Test oben deckt.
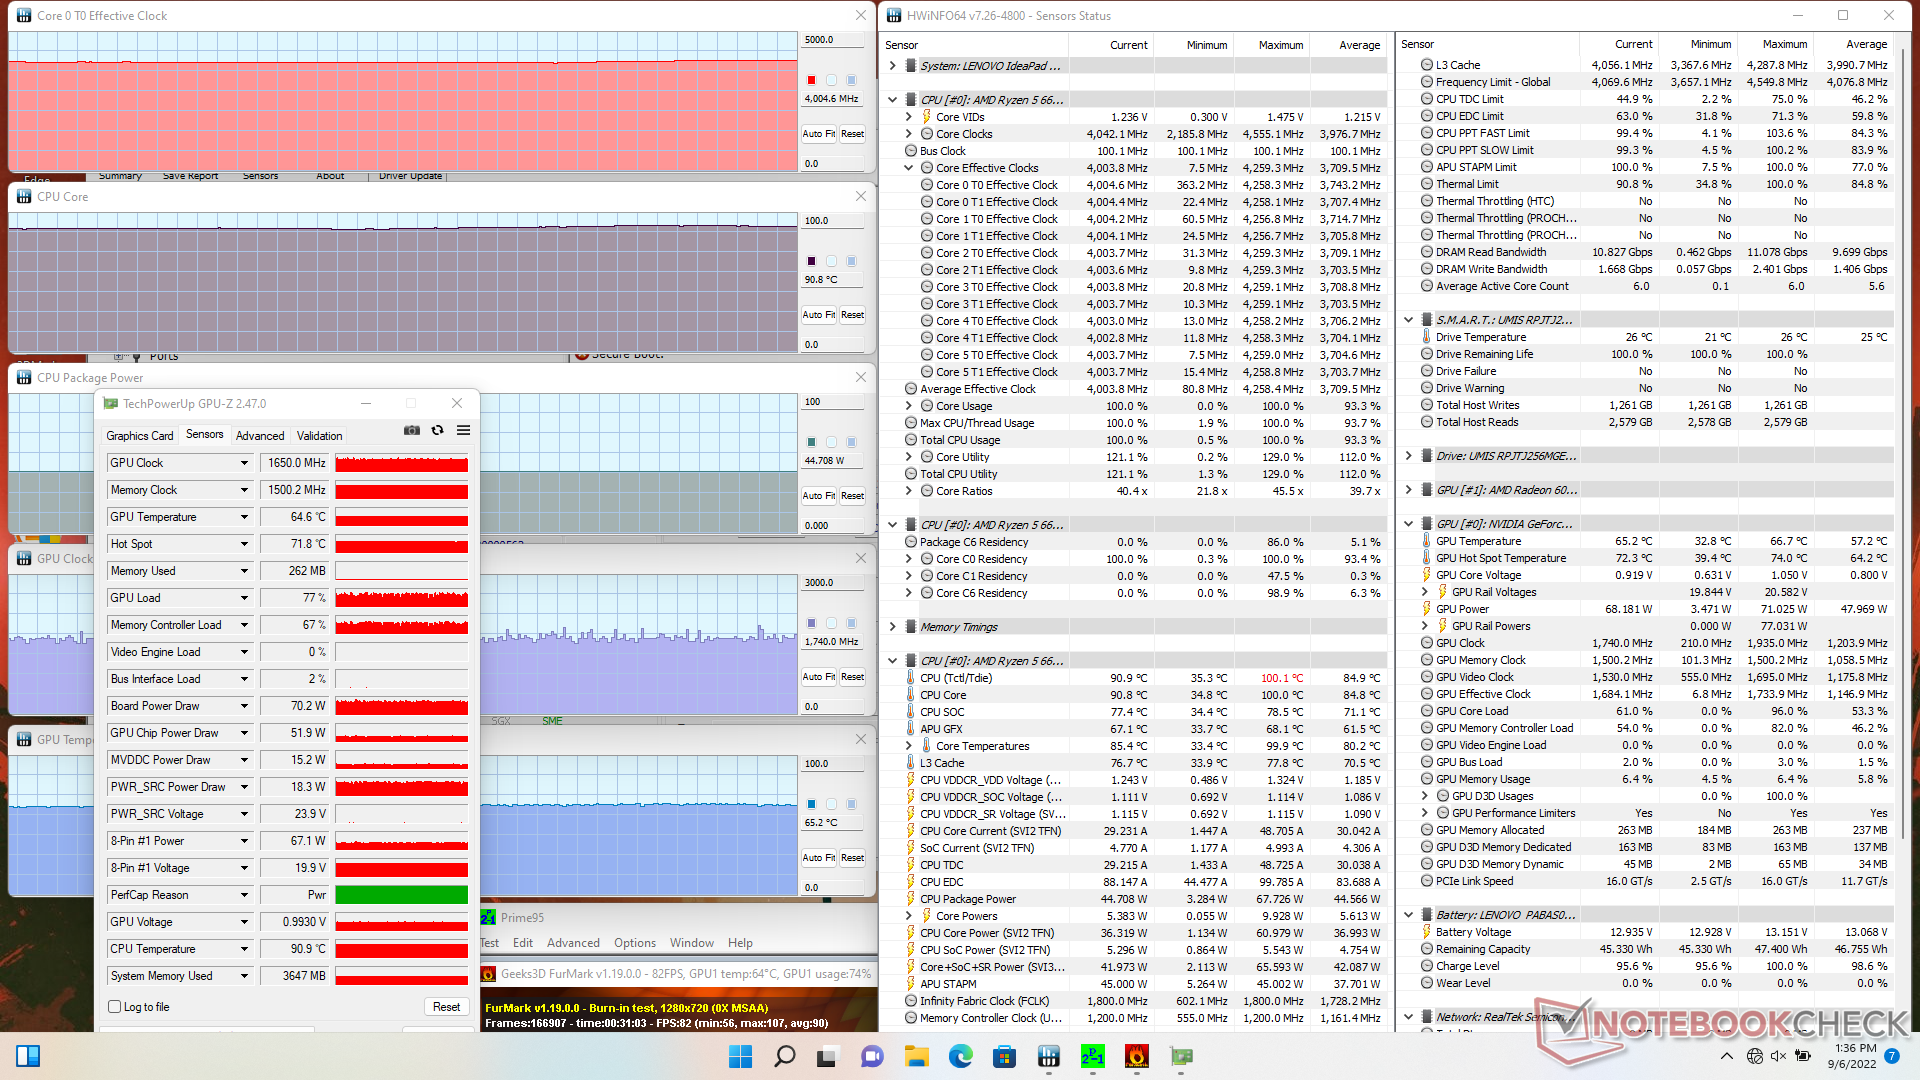
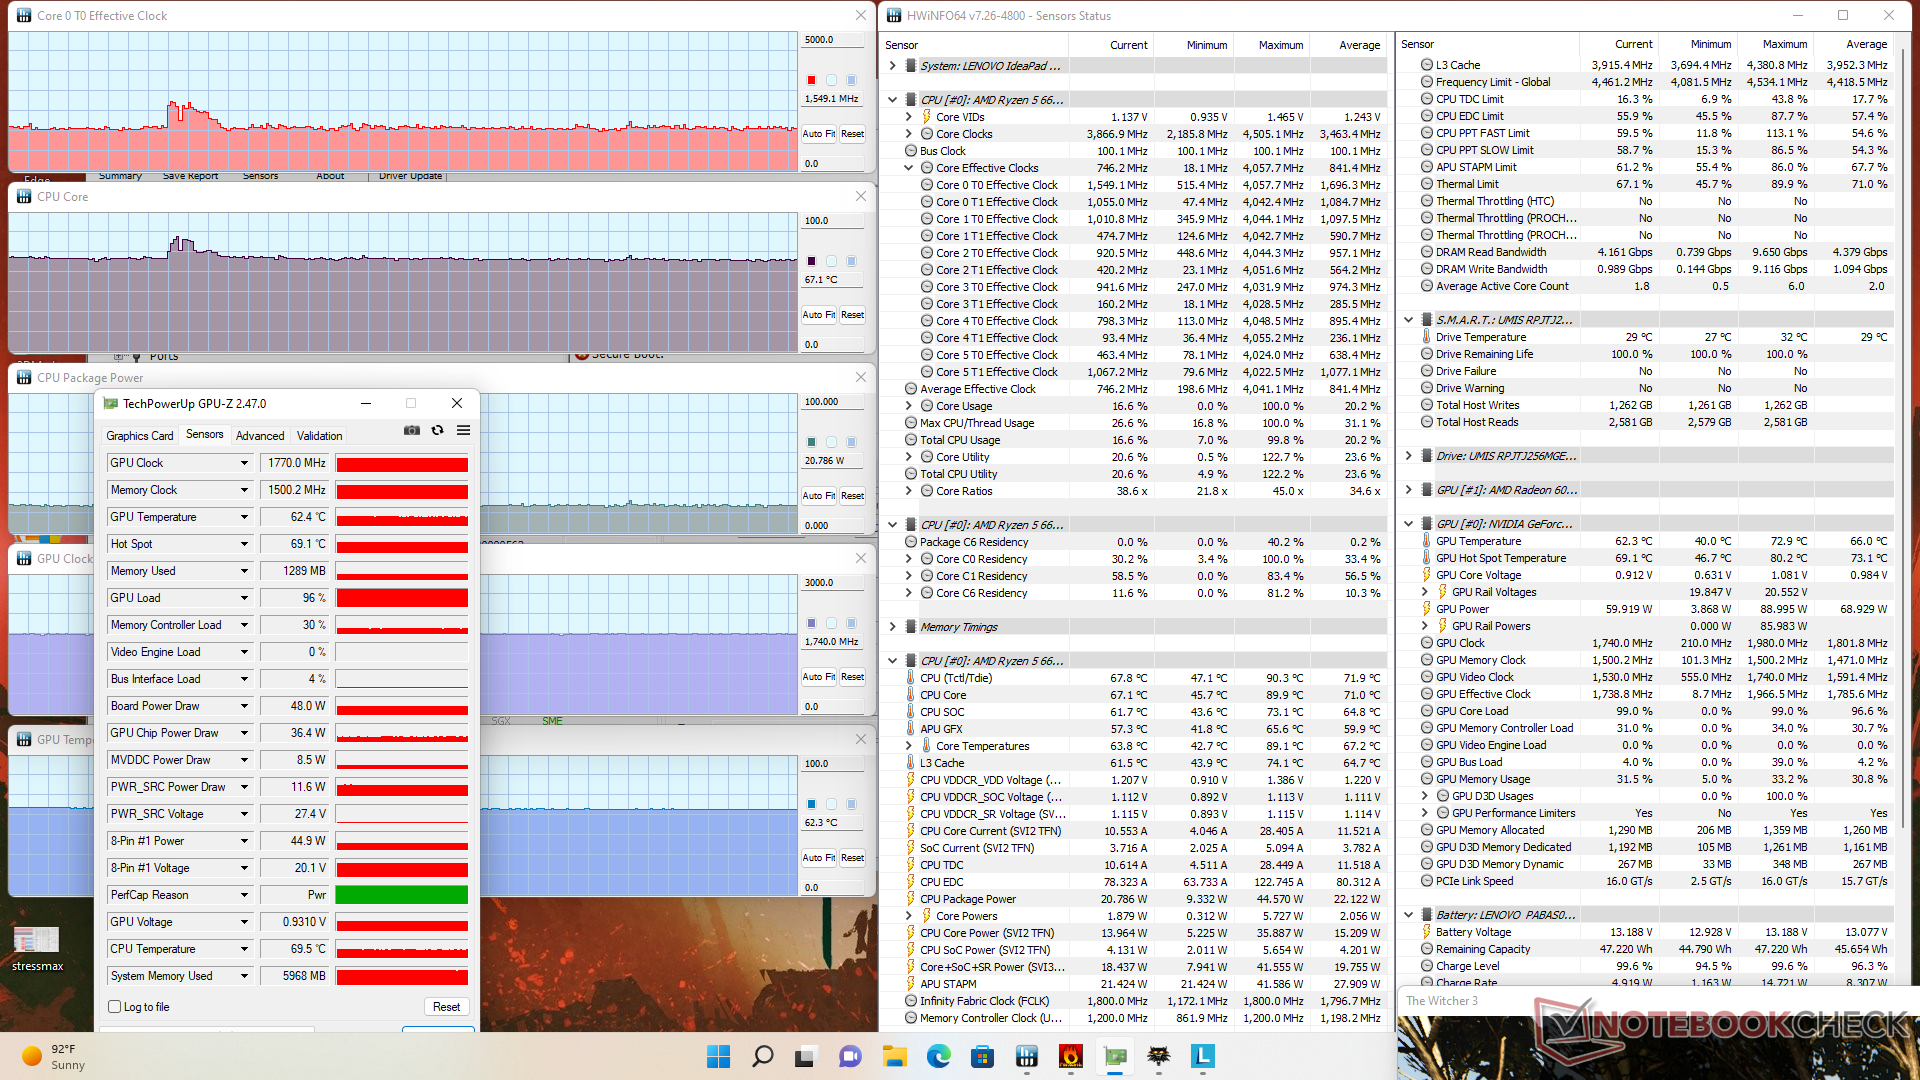
Die GPU-Taktfrequenz, -Temperatur und der Chipverbrauch stabilisieren sich beim Spielen von The Witcher 3 bei 1.920 MHz, 70 °C bzw. 83 W, im ausbalancierten Modus sind es 1.770 MHz, 62 °C bzw. 48 W. Wer die maximale Leistung aus der GPU herauskitzeln möchte, muss die maximale Geräuschkulisse tolerieren, da die niedrigeren Lüftergeräusche des ausbalancierten Modus mit einer reduzierten Leistung einhergehen.
Im Akkumodus ist die GPU-Leistung stärker eingeschränkt als die CPU-Leistung. Ein Fire-Strike-Durchlauf liefert im Akkumodus Physik- und Grafikpunktzahlen von 19.770 bzw. 9.119 Punkten, im Netzbetrieb sind es 20.214 bzw. 14.157 Punkte.
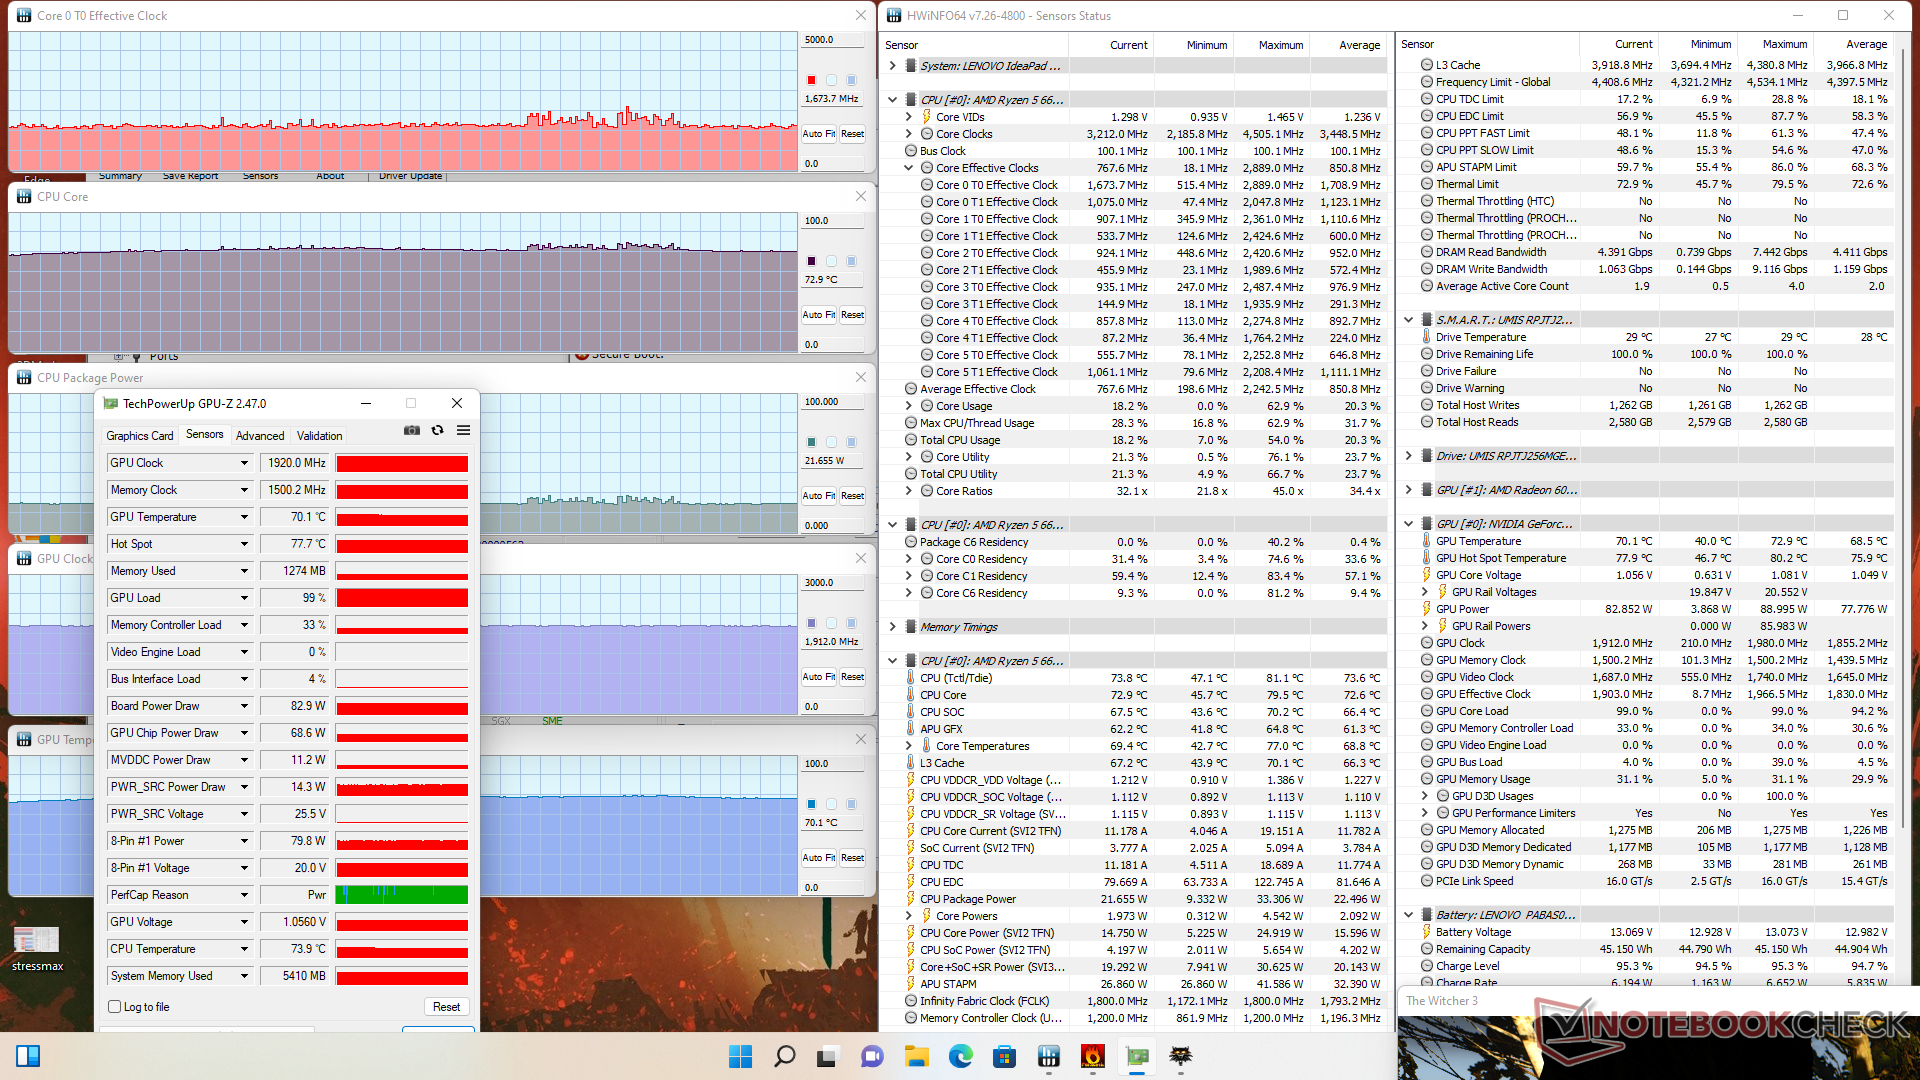
| CPU Clock (GHz) | GPU Clock (MHz) | Average CPU Temperature (°C) | Average GPU Temperature (°C) | |
| Leerlauf | -- | -- | 35 | 33 |
| Prime95-Stress | 4,0 - 4,1 | -- | 85 | 46 |
| Prime95-+FurMark-Stress | 4,0 | 1.650 | 91 | 65 |
| Witcher-3-Stress (Hochleistungsmodus) | 1,7 | 1.920 | 73 | 70 |
| Witcher-3-Stress (ausbalancierter Modus) | 1,6 | 1.770 | 67 | 62 |
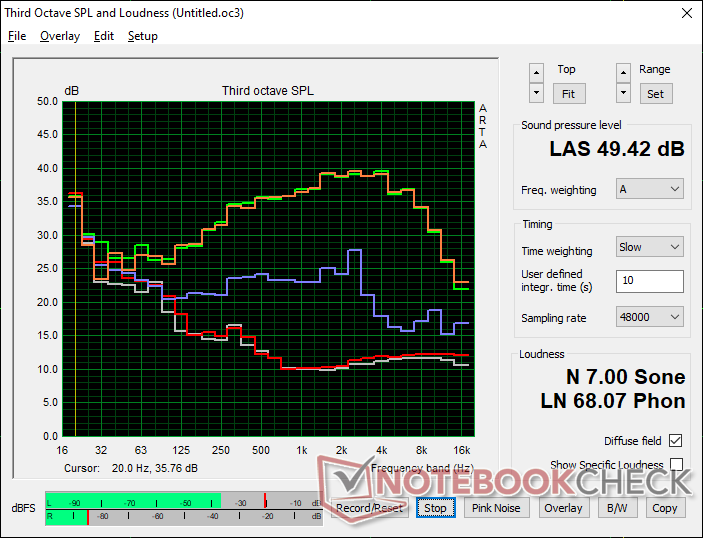
Lautsprecher
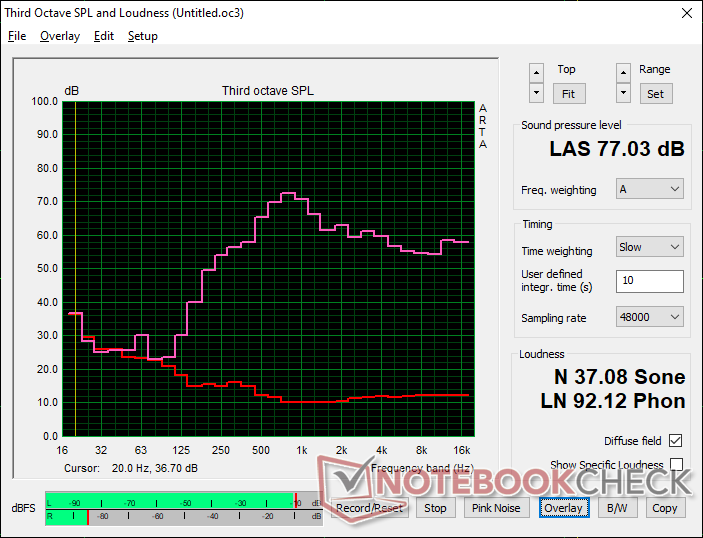
Lenovo IdeaPad Gaming 3 15ARH7 Audio Analyse
(±) | Mittelmäßig laut spielende Lautsprecher (77 dB)
Bass 100 - 315 Hz
(-) | kaum Bass - 15.6% niedriger als der Median
(±) | durchschnittlich lineare Bass-Wiedergabe (12.2% Delta zum Vorgänger)
Mitteltöne 400 - 2000 Hz
(±) | zu hohe Mitten, vom Median 8% abweichend
(±) | Linearität der Mitten ist durchschnittlich (7.7% Delta zum Vorgänger)
Hochtöne 2 - 16 kHz
(+) | ausgeglichene Hochtöne, vom Median nur 2.5% abweichend
(+) | sehr lineare Hochtöne (3.8% Delta zum Vorgänger)
Gesamt im hörbaren Bereich 100 - 16.000 Hz
(±) | hörbarer Bereich ist durchschnittlich linear (18.8% Abstand zum Median)
Im Vergleich zu allen Geräten derselben Klasse
» 62% aller getesteten Geräte dieser Klasse waren besser, 8% vergleichbar, 30% schlechter
» Das beste Gerät hat einen Delta-Wert von 6%, durchschnittlich ist 18%, das schlechteste Gerät hat 132%
Im Vergleich zu allen Geräten im Test
» 43% aller getesteten Geräte waren besser, 8% vergleichbar, 49% schlechter
» Das beste Gerät hat einen Delta-Wert von 4%, durchschnittlich ist 24%, das schlechteste Gerät hat 134%
Apple MacBook Pro 16 2021 M1 Pro Audio Analyse
(+) | Die Lautsprecher können relativ laut spielen (84.7 dB)
Bass 100 - 315 Hz
(+) | guter Bass - nur 3.8% Abweichung vom Median
(+) | lineare Bass-Wiedergabe (5.2% Delta zum Vorgänger)
Mitteltöne 400 - 2000 Hz
(+) | ausgeglichene Mitten, vom Median nur 1.3% abweichend
(+) | lineare Mitten (2.1% Delta zum Vorgänger)
Hochtöne 2 - 16 kHz
(+) | ausgeglichene Hochtöne, vom Median nur 1.9% abweichend
(+) | sehr lineare Hochtöne (2.7% Delta zum Vorgänger)
Gesamt im hörbaren Bereich 100 - 16.000 Hz
(+) | hörbarer Bereich ist sehr linear (4.6% Abstand zum Median
Im Vergleich zu allen Geräten derselben Klasse
» 0% aller getesteten Geräte dieser Klasse waren besser, 0% vergleichbar, 100% schlechter
» Das beste Gerät hat einen Delta-Wert von 5%, durchschnittlich ist 17%, das schlechteste Gerät hat 45%
Im Vergleich zu allen Geräten im Test
» 0% aller getesteten Geräte waren besser, 0% vergleichbar, 100% schlechter
» Das beste Gerät hat einen Delta-Wert von 4%, durchschnittlich ist 24%, das schlechteste Gerät hat 134%
Energieverwaltung — Ähnlich wie beim Vorgänger
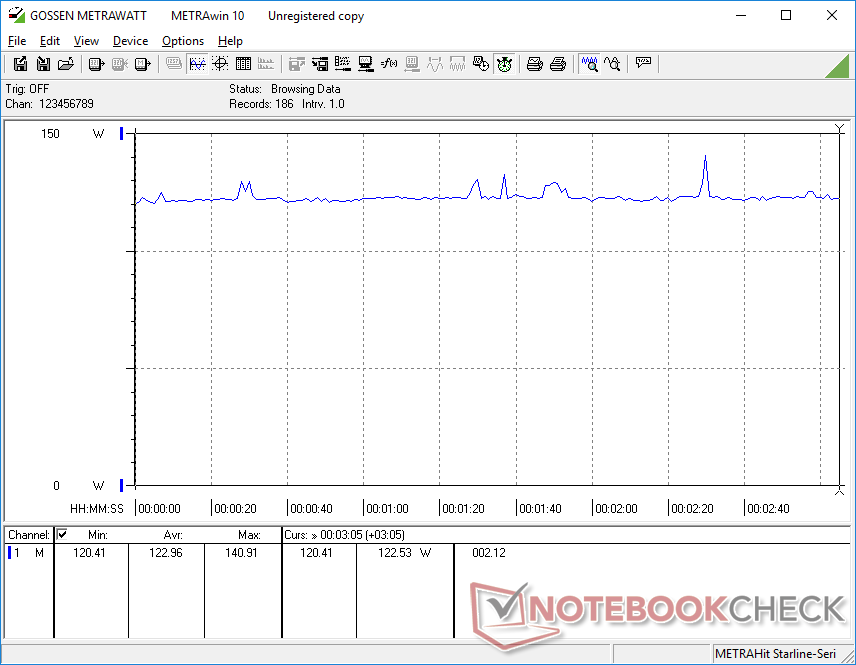
Energieaufnahme
Der Verbrauch liegt im Gaming-Betrieb zwischen 90 und 123 W, bei unserem Dell G5 5510 mit der gleichen GPU und einer Core-i5-10500H-CPU waren es 103 bis 140 W. Der Verbrauch unseres Lenovo-Laptops ist beim Ausführen von Prime95 trotz der um fast 40 % höheren Leistung im Vergleich zum Core i5 insgesamt ebenfalls niedriger und die Leistung-pro-Watt damit höher. Da der 6600H jedoch nicht effizienter arbeitet als der Ryzen 5 5600H, kann sie sich hier erneut nicht von ihrem Vorgänger abgrenzen.
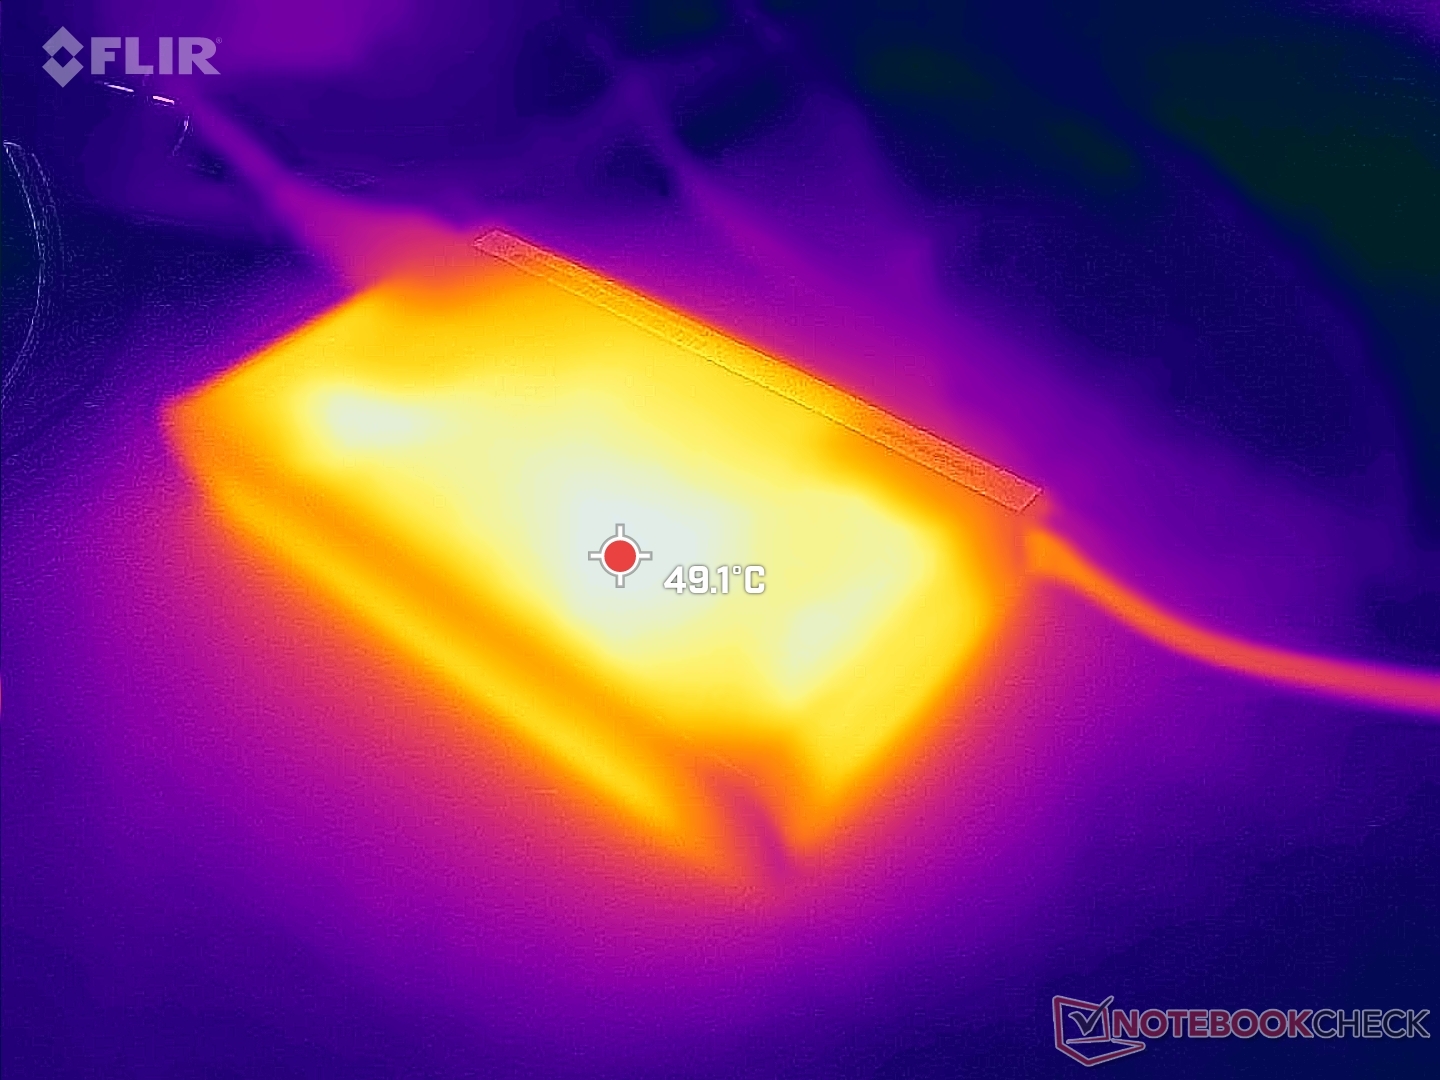
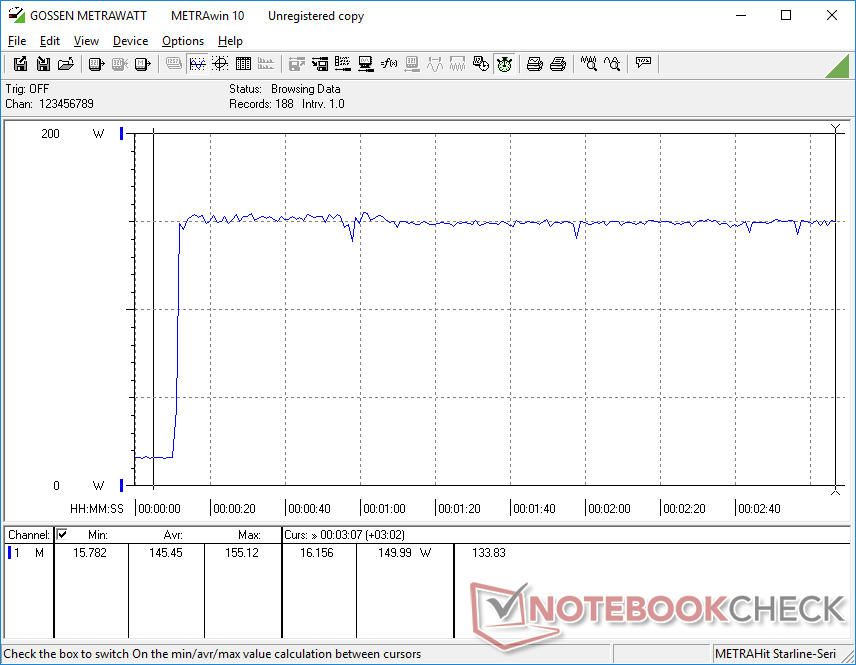
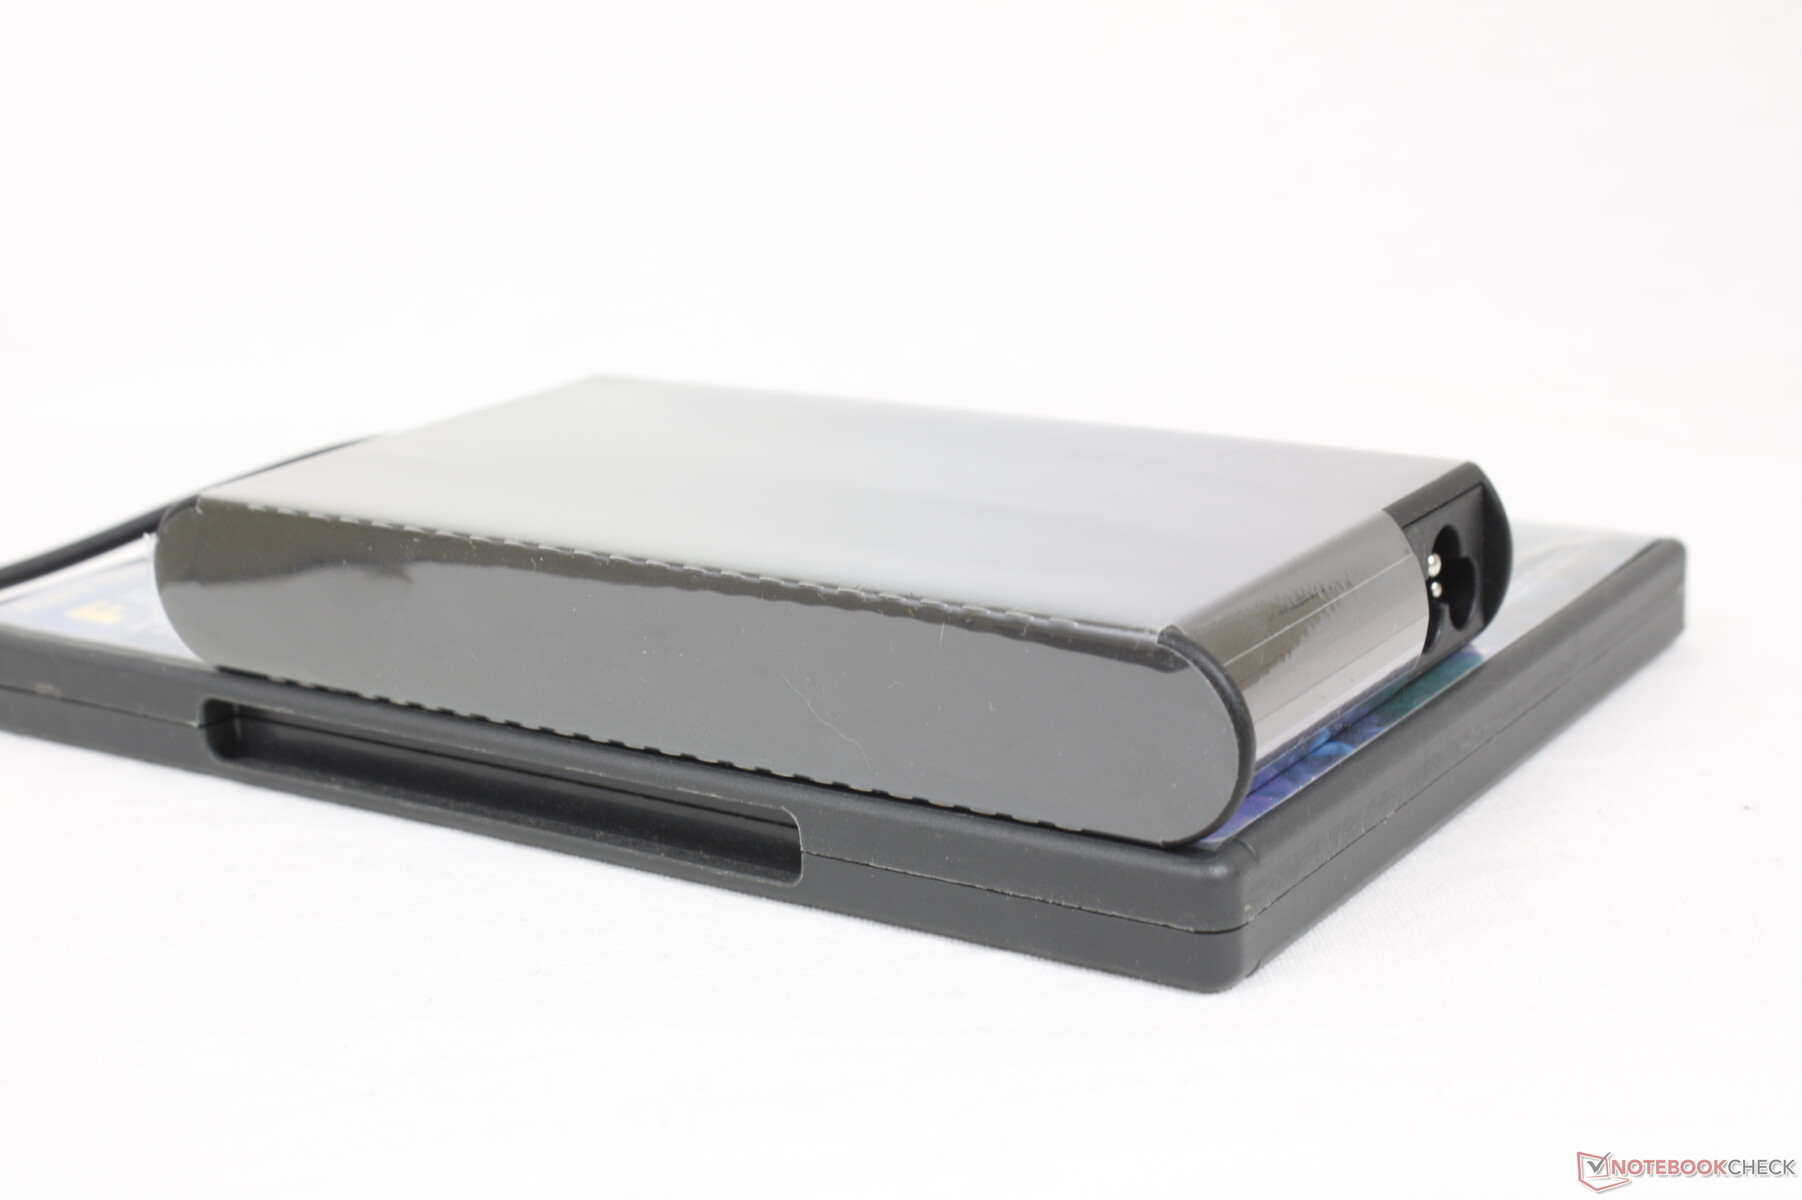
Beim gleichzeitigen Ausführen von Prime95 und FurMark messen wir an dem kleinen bis mittelgroßen (~14,8 x 7,8 x 2,2 cm) 170-W-Netzteil einen maximalen verbrauch von 156 W. Während unseres Stresstests fällt der Akkuladestand innerhalb einer halben Stunde von 100 auf 95 % und steigt am Ende des Stresstests wieder auf 100 %.
| Aus / Standby | |
| Idle | |
| Last |
|
Legende:
min: | |
| Lenovo IdeaPad Gaming 3 15ARH7 R5 6600H, GeForce RTX 3050 4GB Laptop GPU, Lenovo UMIS AM630 RPJTJ256MGE1QDY, IPS, 1920x1080, 15.6" | Lenovo IdeaPad Gaming 3i 15IMH05 i5-10300H, GeForce GTX 1650 Mobile, SK hynix BC511 HFM512GDHTNI-87A0B, IPS, 1920x1080, 15.6" | Lenovo Legion 5 15ACH6A-82NW0010GE R5 5600H, Radeon RX 6600M, Micron 2210 MTFDHBA512QFD, IPS, 1920x1080, 15.6" | Gigabyte A5 K1 R5 5600H, GeForce RTX 3060 Laptop GPU, ESR512GTLG-E6GBTNB4, IPS, 1920x1080, 15.6" | Asus TUF Dash F15 FX517ZR i7-12650H, GeForce RTX 3070 Laptop GPU, Samsung PM991a MZVLQ1T0HBLB, IPS, 2560x1440, 15.6" | Dell G15 5510 i5-10500H, GeForce RTX 3050 4GB Laptop GPU, SK Hynix BC711 HFM512GD3HX015N, IPS, 1920x1080, 15.6" | |
|---|---|---|---|---|---|---|
| Stromverbrauch | 8% | -39% | -34% | -30% | 5% | |
| Idle min * (Watt) | 7.7 | 5.1 34% | 10 -30% | 10 -30% | 10 -30% | 3 61% |
| Idle avg * (Watt) | 9.1 | 8.2 10% | 13.2 -45% | 12 -32% | 14 -54% | 8 12% |
| Idle max * (Watt) | 15.6 | 10.6 32% | 15.6 -0% | 17 -9% | 20 -28% | 13 17% |
| Last avg * (Watt) | 90.7 | 128 -41% | 178 -96% | 113 -25% | 122 -35% | 103 -14% |
| Witcher 3 ultra * (Watt) | 122.9 | 109 11% | 181 -47% | 181.4 -48% | 138.6 -13% | 139.5 -14% |
| Last max * (Watt) | 155.2 | 150 3% | 180 -16% | 245 -58% | 189 -22% | 204 -31% |
* ... kleinere Werte sind besser
Verbrauch Witcher 3 / Stresstest
Verbrauch externet Monitor
Akkulaufzeit
Mit nur 45 Wh ist die Akkukapazität klein, entspricht jedoch dem für günstige Gaming-Laptops üblichen Niveau. Ähnlich wie beim IdeaPad Gaming 3i erreichen wir mit der integrierten GPU im ausbalancierten Leistungsprofil eine praxisnahe WLAN-Laufzeit von 6,5 Stunden.
Den leeren Akku voll aufzuladen dauert mit dem mitgelieferten, proprietären Netzteil ca. 1,5 bis 2 Stunden. Der Laptop kann alternativ auch mit den meisten USB-C-Ladegeräten geladen werden.
Im Energiesparmodus (Lenovo-Modus "Leise") ist die Laufzeit mit der iGPU und minimaler Helligkeit mit nur 2 Stunden und 22 Minuten ungewöhnlich kurz. Um Fehler auszuschließen haben wir den Test wiederholt. Möglicherweise leidet das System unter einem Bug, der bei bestimmten Einstellungen unter bestimmten Bedingungen zu einem erhöhten Stromverbrauch führen.
| Lenovo IdeaPad Gaming 3 15ARH7 R5 6600H, GeForce RTX 3050 4GB Laptop GPU, 45 Wh | Lenovo IdeaPad Gaming 3i 15IMH05 i5-10300H, GeForce GTX 1650 Mobile, 45 Wh | Lenovo Legion 5 15ACH6A-82NW0010GE R5 5600H, Radeon RX 6600M, 80 Wh | Gigabyte A5 K1 R5 5600H, GeForce RTX 3060 Laptop GPU, 48.96 Wh | Asus TUF Dash F15 FX517ZR i7-12650H, GeForce RTX 3070 Laptop GPU, 76 Wh | Dell G15 5510 i5-10500H, GeForce RTX 3050 4GB Laptop GPU, 56 Wh | |
|---|---|---|---|---|---|---|
| Akkulaufzeit | 171% | 199% | 6% | 171% | 125% | |
| Idle (h) | 2.4 | 12.4 417% | 12.8 433% | 10.8 350% | 11.3 371% | |
| WLAN (h) | 6.5 | 6.3 -3% | 9.2 42% | 6.9 6% | 7 8% | 6 -8% |
| Last (h) | 0.9 | 1.8 100% | 2 122% | 2.3 156% | 1 11% | |
| H.264 (h) | 7.3 | 5.8 |
Pro
Contra
Fazit — Der neue Ryzen 5 6600U bietet in Spielen keinen großen Mehrwert
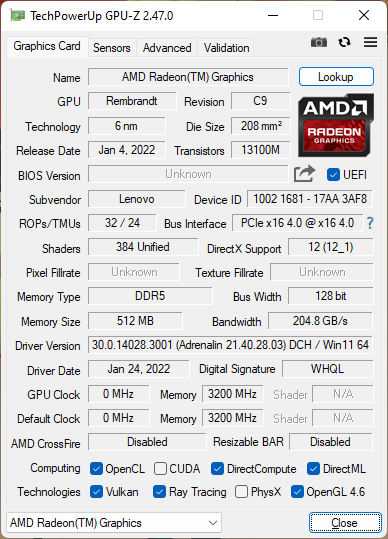
Der größte Unterschied zwischen dem Ryzen 5 5600H und dem Ryzen 5 6600H besteht darin, dass Ersterer mit einer integrierten Radeon-RX-Vega-Grafik und Letzterer mit der deutlich schnelleren iGPU Radeon 660M bestückt ist. Davon abgesehen ist die CPU-Leistung nahezu identisch. Da die meisten Gaming-Laptops jedoch ohnehin mit schnelleren, dedizierten Grafikkarten ausgestattet sind, ist die zusätzliche iGPU-Leistung in den meisten Fällen verschwendet. Um in Spielen ein gutes Leistungsniveau zu erzielen, sollte man die Radeon 660M bzw. 680M überspringen und stattdessen zu einer schnelleren GPU wie der RTX 3060 greifen, auch wenn man sich dafür mit einem AMD Ryzen 5 5600H oder Ryzen 7 5800H zufriedengeben muss.
Die besten Einsatzszenarien für den Ryzen 5 6600H sind daher Laptops und Mini-PCs ohne dedizierte GPU. Dann kommen die Leistung und Effizienz der integrierten Radeon 660M richtig zur Geltung.
Am Lenovo-Laptop gefallen uns viele Dinge einschließlich der großen Pfeiltasten, des niedrigen Basispreises und der Standarddisplayoption mit einem 1080p-IPS-Panel, 120 Hz, FreeSync und guten Reaktionszeiten durchaus gut. Die Farbdarstellung lässt zwar zu wünschen übrig, allerdings ist das ein Kompromiss, den man bei vielen günstigen Gaming-Laptops eingehen muss. Unsere Hauptkritikpunkte sind die aufwendige Wartung und das hohe Gewicht des Laptops. Günstigere Konkurrenten wie das MSI GF63, Acer Nitro 5, HP Pavilion Gaming 15 und das Asus TUF Dash sind leichter und lassen sich mit weniger Aufwand aufrüsten. Dagegen ist es bei unserem IdeaPad Gaming 3 deutlich umständlicher, den RAM oder Speicherplatz zu erhöhen.
Preis und Verfügbarkeit
Das Lenovo IdeaPad Gaming 3 15ARH7 ist in bestimmten Online-Shops verfügbar. Das Modell mit der RTX 3050 und einer etwas größeren 512-GB-SSD kostet bei Computeruniverse derzeit 1.080 Euro.
Lenovo IdeaPad Gaming 3 15ARH7
- 09.09.2022 v7 (old)
Allen Ngo
Preisvergleich

